Attached files
| file | filename |
|---|---|
| EX-23 - EXHIBIT 23 - REGAL BELOIT CORP | exhibit232016123110k.htm |
| EX-32.1 - EXHIBIT 32.1 - REGAL BELOIT CORP | exhibit3212016123110k.htm |
| EX-31.2 - EXHIBIT 31.2 - REGAL BELOIT CORP | exhibit3122016123110k.htm |
| EX-31.1 - EXHIBIT 31.1 - REGAL BELOIT CORP | exhibit3112016123110k.htm |
| EX-21 - EXHIBIT 21 - REGAL BELOIT CORP | exhibit212016123110k.htm |
| EX-12 - EXHIBIT 12 - REGAL BELOIT CORP | exhibit122016123110k.htm |
| EX-10.23 - EXHIBIT 10.23 - REGAL BELOIT CORP | exhibit10232016123110k.htm |
| EX-10.22 - EXHIBIT 10.22 - REGAL BELOIT CORP | exhibit10222016123110k.htm |
UNITED STATES
SECURITIES AND EXCHANGE COMMISSION
Washington, D.C. 20549
FORM 10-K
ANNUAL REPORT PURSUANT TO SECTION 13 OR 15(d)
OF THE SECURITIES EXCHANGE ACT OF 1934
For the fiscal year ended December 31, 2016
Commission File number 1-7283
Regal Beloit Corporation
(Exact Name of Registrant as Specified in Its Charter)
Wisconsin | 39-0875718 |
(State of Incorporation) | (IRS Employer Identification No.) |
200 State Street, Beloit, Wisconsin 53511
(Address of principal executive offices)
(608) 364-8800
(Registrant's telephone number, including area code)
Securities registered pursuant to Section 12(b) of the Act:
Name of Each Exchange on | ||
Title of Each Class | Which Registered | |
Common Stock ($.01 Par Value) | New York Stock Exchange | |
Securities registered pursuant to Section 12 (g) of the Act | None (Title of Class) | |
Indicate by check mark if the registrant is well-known seasoned issuer, as defined in Rule 405 of the Securities Act. Yes ý No
Indicate by check mark if the registrant is not required to file reports pursuant to Section 13 or Section 15(d) of the Act. Yes No ý
Indicate by check mark whether the registrant (1) has filed all reports required to be filed by Section 13 or 15(d) of the Securities Exchange Act of 1934 during the preceding 12 months (or for such shorter period that the registrant was required to file such reports), and (2) has been subject to such filing requirements for the past 90 days. Yes ý No
Indicate by check mark whether the registrant has submitted electronically and posted on its corporate Web site, if any, every Interactive Data File required to be submitted and posted pursuant to Rule 405 of Regulation S-T (§ 232.405 of this chapter) during the preceding 12 months (or for such shorter period that the registrant was required to submit and post such files). Yes ý No
Indicate by check mark if disclosure of delinquent filers pursuant to Item 405 of Regulation S-K is not contained herein, and will not be contained, to the best of registrant's knowledge, in definitive proxy or information statements incorporated by reference in Part III of this Form 10-K or any amendment to this Form 10-K. ¨
Indicate by check mark whether the registrant is a large accelerated filer, an accelerated filer, or a non-accelerated filer, or a smaller reporting company. See definitions of “large accelerated filer,” “accelerated filer,” and “smaller reporting company” in Rule 12b-2 of the Exchange Act. (Check one):
Large accelerated filer ý Accelerated filer Non-accelerated filer Smaller reporting company
(Do not check if a smaller reporting company)
Indicated by check mark whether the registrant is a shell company (as defined in Rule 12b-2 of the Act). Yes No ý
The aggregate market value of the voting stock held by non-affiliates of the registrant as of July 2, 2016 was approximately $2.5 billion.
On February 27, 2017, the registrant had outstanding 44,789,981 shares of common stock, $.01 par value, which is registrant's only class of common stock.
DOCUMENTS INCORPORATED BY REFERENCE
Certain information contained in the Proxy Statement for the Annual Meeting of Shareholders to be held on May 1, 2017 is incorporated by reference into Part III hereof.
1
REGAL BELOIT CORPORATION
ANNUAL REPORT ON FORM 10-K
FOR YEAR ENDED DECEMBER 31, 2016
TABLE OF CONTENTS
Page | ||
PART I | ||
Item 1 | ||
Item 1A | ||
Item 1B | ||
Item 2 | ||
Item 3 | ||
Item 4 | ||
PART II | ||
Item 5 | ||
Item 6 | ||
Item 7 | ||
Item 7A | ||
Item 8 | ||
Item 9 | ||
Item 9A | ||
Item 9B | ||
PART III | ||
Item 10 | ||
Item 11 | ||
Item 12 | ||
Item 13 | ||
Item 14 | ||
PART IV | ||
Item 15 | ||
Item 16 | ||
SIGNATURES | 84 | |
2
CAUTIONARY STATEMENT
Certain statements made in this Annual Report on Form 10-K are “forward-looking statements” intended to qualify for the safe harbor from liability established by the Private Securities Litigation Reform Act of 1995. Forward-looking statements are based on management’s expectations, beliefs, current assumptions, and projections. When used in this Annual Report on Form 10-K, words such as “may,” “will,” “expect,” “intend,” “estimate,” “anticipate,” “believe,” “should,” “project” or “plan” or the negative thereof or similar words are intended to identify forward-looking statements. These forward-looking statements are not guarantees of future performance and are subject to risks, uncertainties, assumptions and other factors, some of which are beyond our control, which could cause actual results to differ materially from those expressed or implied by such forward-looking statements. Those factors include, but are not limited to:
• | uncertainties regarding our ability to execute our restructuring plans within expected costs and timing; |
• | increases in our overall debt levels as a result of the acquisition of the Power Transmission Solutions business of Emerson Electric Co. ("PTS"), or otherwise and our ability to repay principal and interest on our outstanding debt; |
• | actions taken by our competitors and our ability to effectively compete in the increasingly competitive global electric motor, drives and controls, power generation and mechanical motion control industries; |
• | our ability to develop new products based on technological innovation and marketplace acceptance of new and existing products; |
• | fluctuations in commodity prices and raw material costs; |
• | our dependence on significant customers; |
• | issues and costs arising from the integration of acquired companies and businesses including PTS, and the timing and impact of purchase accounting adjustments; |
• | prolonged declines in oil and gas up stream capital spending; |
• | economic changes in global markets where we do business, such as reduced demand for the products we sell, currency exchange rates, inflation rates, interest rates, recession, government policies, including policy changes affecting taxation, trade, immigration and the like, and other external factors that we cannot control; |
• | product liability and other litigation, or claims by end users, government agencies or others that our products or our customers’ applications failed to perform as anticipated, particularly in high volume applications or where such failures are alleged to be the cause of property or casualty claims; |
• | unanticipated liabilities of acquired businesses; |
• | unanticipated costs or expenses we may incur related to product warranty issues; |
• | our dependence on key suppliers and the potential effects of supply disruptions; |
• | infringement of our intellectual property by third parties, challenges to our intellectual property and claims of infringement by us of third party technologies; |
• | effects on earnings of any significant impairment of goodwill or intangible assets; |
• | cyclical downturns affecting the global market for capital goods; and |
• | other risks and uncertainties including but not limited to those described in “Risk Factors” in this Annual Report on Form 10-K and from time to time in our reports filed with US Securities and Exchange Commission. |
All subsequent written and oral forward-looking statements attributable to us or to persons acting on our behalf are expressly qualified in their entirety by the applicable cautionary statements. The forward-looking statements included in this Annual Report on Form 10-K are made only as of their respective dates, and we undertake no obligation to update these statements to reflect subsequent events or circumstances. See also “Risk Factors.”
3
PART I
Unless the context requires otherwise, references in this Annual Report on Form 10-K to “we,” “us,” “our” or the “Company” refer collectively to Regal Beloit Corporation and its subsidiaries.
References in an Item of this Annual Report on Form 10-K to information contained in our Proxy Statement for the Annual Meeting of Shareholders to be held on May 1, 2017 (the "2017 Proxy Statement”), or to information contained in specific sections of the 2017 Proxy Statement, incorporate the information into that Item by reference.
We operate on a 52/53 week fiscal year ending on the Saturday closest to December 31. We refer to the fiscal year ended December 31, 2016 as “fiscal 2016,” the fiscal year ended January 2, 2016 as “fiscal 2015,” and the fiscal year ended January 3, 2015 as “fiscal 2014.”
ITEM 1 - BUSINESS
Our Company
Regal Beloit Corporation is a leading manufacturer of electric motors, electrical motion controls, power generation and power transmission products serving markets throughout the world. Our company is comprised of three operating segments: Commercial and Industrial Systems, Climate Solutions and Power Transmission Solutions. Financial information on our operating segments for fiscal 2016, fiscal 2015 and fiscal 2014 is contained in Note 6 of Notes to the Consolidated Financial Statements.
General
Commercial and Industrial Systems Segment
Our Commercial and Industrial Systems segment designs, manufactures and sells primarily:
• | Fractional, integral and large horsepower AC and DC motors and controls for commercial and industrial ("C&I") applications. These motors are sold directly to original equipment manufacturers ("OEMs") and end-user customers and through our network of direct and independent sales representatives as well as through regional and national distributors. Typical applications include pumps, fans, compressors, conveyors, augers, blowers, and irrigation equipment. Our customers tend to be the leaders in their industries, and their desire for more efficient motor based solutions is providing an increasing opportunity to add more value to their applications with energy efficient motor and integrated electronic control solutions. |
• | Fractional and integral horsepower motors, electronic variable speed controls and blowers used in commercial heating, ventilation, and air conditioning (“HVAC”) products. Our primary customers for these products are manufacturers of commercial HVAC and refrigeration systems as well as national and regional distributors of aftermarket products for the repair of these systems. |
• | Solid state and electro-mechanical starters, contactors, relays, variable frequency drives, and total integrated solutions of these components. The market for these control solutions is driven primarily by applications requiring effective compression, pumping, air moving and conveying systems. Our products are sold primarily to OEM customers and systems integrators, and used in C&I markets such as oil and gas, mining, metals, chemical, water waste, machinery, marine, buildings, cement and glass, pulp and paper. |
• | Precision stator and rotor kits from five to 2,900 horsepower for air conditioning, heat pump and refrigeration compressor applications, which are sold primarily directly to OEM customers. |
• | Hazardous duty motors, including low and medium voltage explosion proof motors as well as ATEX and IEC-Ex certified explosion proof motors. These motors are sold primarily into general industrial applications in potentially hazardous conditions such as oil and gas, paint booths, tunnels, and mining. |
• | Electric generators from five kilowatts through four megawatts, automatic transfer switches, power generation and distribution switch gear, components and system controls. These products and systems are used in applications including health care, cloud and enterprise data centers, oil and gas, marine, agriculture, transportation, government, construction and other applications. The demand for electric power generation systems is driven by the need for electrical power on demand in cases where utility/grid power is lost or stressed or in prime power applications where utility power is unavailable. |
4
Climate Solutions Segment
Our Climate Solutions segment designs, manufactures and sells primarily:
• | Fractional motors, electronic variable speed controls and blowers used in a variety of residential and light commercial air moving applications including HVAC systems and commercial refrigeration. These motors and blowers are vital components of an HVAC system and are used to move air into and away from furnaces, heat pumps, air conditioners, ventilators, fan filter boxes, water heaters and humidifiers. A majority of our HVAC motors replace existing motors, are installed as part of a new HVAC system that replaces an existing HVAC system, or are used in an HVAC system for new home construction. The business enjoys a large installed base of equipment and long-term relationships with its major customers. |
• | Fractional motors and blowers are also used across a wide range of other applications including white goods, water heating equipment, and small pumps and compressors and other small and other small appliances. Demand for these products is driven primarily by consumer and light commercial market segments. |
• | Precision stator and rotor sets from 1.5 to 5 horsepower that are assembled into compressors for air conditioning, heat pump and refrigeration applications. |
• | Capacitors for use in HVAC systems, high intensity lighting and other applications. |
Power Transmission Solutions Segment
Our Power Transmission Solutions segment designs, manufactures and sells primarily:
• | Mounted and unmounted bearings. Unmounted bearings are offered in a variety of types and styles. These include cam followers, radial bearings, and thrust bearings. Mounted bearings include industry specific designs that aim to solve customer problems. They are all available with a variety of options and sizes and include aerospace and specialty bearings, mounted bearings, unmounted bearings, and corrosion resistant bearings. |
• | High quality conveyor products including chains, belts, sprockets, components and guide rails and wear strips. Conveying components assists in these areas: efficiency, noise reduction, wash-down maintenance, lubrication reduction and energy conservation. Our products are highly engineered from industry expert input. |
• | High performance disc, patented diaphragm and gear couplings for applications including turbines, compressors, generators and pumps in many industries including petrochemical, refinery, power generation, gas pipeline and Liquid Natural Gas ("LNG"). We also produce flexible couplings and transmission elements. Products include gear, grid, jaw, elastomer, disc, and universal joints. |
• | Mechanical power transmission drives, components and bearings including: belt drives, bushings, chain and sprockets, drive tighteners and idlers, mechanical CAM clutches, and torque overload devices. Our products serve a wide range of industries and applications, such as the following: aggregate, forestry and wood products, grain and biofuels, power generation, food and beverage, and Heating, Ventilation, Air Conditioning, and Refrigeration ("HVACR"). |
• | Gearboxes for motion control within complex equipment and systems used for a variety of applications. We provide a wide array of gear types, shaft configurations, ratios, housing materials and mounting methods. Right angle worm gear and bevel units can be specified for less than 100 inch lbs. of torque to over 132,000 inch lbs. of torque. Helical gear units are offered from 100 inch lbs. to over 500,000 inch lbs. of torque. Our products include worm gearing, shaft mount reducers, helical concentric and right angle, bevel and miter gearing, center pivot gearing, and open gearing. This gearing reduces the speed and increases the torque from an electric motor or other prime mover to meet the requirements of equipment. |
• | Many of our products are originally sold and installed into OEM equipment within these industries. Our reputation and long history of providing highly reliable products creates an end user specification for replacement through the distribution channel. We also provide application and design assistance based on our deep knowledge of our products and their applications. |
OEMs and end users of a variety of motion control and other industrial applications typically combine the types of motors, controls and power transmission products we offer. We seek to take advantage of this practice and to enhance our product penetration by
5
leveraging cross-marketing and product line combination opportunities between our Commercial and Industrial Systems, Climate Solutions and Power Transmission Solution products. Our growth strategy also includes (i) driving organic sales growth through the introduction of innovative new products, (ii) establishing and maintaining new customers, as well as developing new opportunities with existing customers, (iii) participating in higher growth geographic markets, and (iv) identifying and consummating strategic, value creating acquisitions.
Acquisitions
In 2016, we completed one acquisition in the Climate Solutions segment.
• | On January 18, 2016, we purchased the remaining shares owned by our joint venture partner in its Elco Group B.V. (“Elco”) joint venture, increasing our ownership from 55.0% to 100.0%, for a purchase price of $19.6 million. The purchase price of Elco is reflected as a component of equity. |
In 2015, we completed one acquisition in the Power Transmissions Solutions segment.
• | On January 30, 2015, we acquired the Power Transmissions Solutions ("PTS") business from Emerson Electric Co. ("The PTS Acquisition") for $1,408.9 million. PTS designs, manufactures, and sells and services belt and chain drives, helical and worm gearing, mounted and unmounted bearings, standard and highly engineered, high performance couplings, modular plastic belts and conveying chains and components. |
In 2014, we completed two acquisitions in the Commercial and Industrial Systems segment.
• | On June 30, 2014, we acquired Benshaw Inc., a Pittsburgh, Pennsylvania based manufacturer of custom low and medium voltage drives and soft starters, for $51.0 million. |
• | On February 7, 2014, we acquired Hy-Bon Engineering Company, Inc., a Midland, Texas based manufacturer of vapor recovery solutions for oil and gas applications, for $78.0 million. |
Divestitures
In 2016, we completed two divestitures.
• | On June 1, 2016, we sold the Mastergear Worldwide (“Mastergear”) business to Rotork PLC for a purchase price of $24.6 million, subject to customary finalization. Mastergear was included in our Power Transmission Solutions segment. A gain related to the sale of $11.6 million was recorded as a reduction to operating expenses in the Condensed Consolidated Statements of Income during the nine months ended October 1, 2016. |
• | On July 7, 2016, we sold the assets of our Venezuelan subsidiary, which had been included in our Commercial and Industrial Systems segment, to a private company for $3.0 million, with $1.0 million paid at closing and $2.0 million to be received in 24 monthly installments. In 2015, we had written down our investment and ceased operations of this subsidiary. |
In 2014, we completed one divestiture in the Commercial and Industrial Systems segment.
• | On September 11, 2014, we sold our shares of a joint venture located in Shanghai, China (“Jinling”), which was previously accounted for as a consolidated joint venture. A loss of approximately $1.9 million was recorded in operating expenses in the Condensed Consolidated Statements of Income in fiscal 2014. |
Sales, Marketing and Distribution
We sell our products directly to OEMs, distributors and end-users. We have multiple business units and each unit typically has its own branded product offering and sales organization. These sales organizations consist of varying combinations of our own internal direct sales people as well as exclusive and non-exclusive manufacturers' representative organizations.
We operate large distribution facilities in Plainfield, Indiana; McAllen, Texas; LaVergne, Tennessee; and Florence, Kentucky, which serve as hubs for our North American distribution and logistics operations. Products are shipped from these facilities to our customers utilizing common carriers and our limited fleet of trucks and trailers. We also operate numerous warehouse and distribution facilities in our global markets to service the needs of our customers. In addition, we have many manufacturer representatives' warehouses located in specific geographic areas to serve local customers.
We derive a significant portion of revenue from our OEM customers. In our HVAC business, our reliance on sales to key OEM customers makes our relationship with each of these customers important to our business, and we expect this customer concentration will continue for the foreseeable future in this portion of our business. Despite this relative concentration, we had no customer that accounted for more than 10% of our consolidated net sales in fiscal 2016, fiscal 2015 or fiscal 2014.
6
Many of our motors are incorporated into residential applications that OEMs sell to end users. The number of installations of new and replacement HVAC systems, pool pumps and related components is higher during the spring and summer seasons due to the increased use of air conditioning and swimming pools during warmer months. As a result, our revenues tend to be higher in the second and third quarters.
Competition
Commercial and Industrial Systems Segment
Electric motor manufacturing is a highly competitive global industry in which there is emphasis on quality, reliability, and technological capabilities such as energy efficiency, delivery performance, price and service. We compete with a growing number of domestic and international competitors due in part to the nature of the products we manufacture and the wide variety of applications and customers we serve. Many manufacturers of electric motors operate production facilities in many different countries, producing products for both the domestic and export markets. On balance, the demarcation between domestic US and foreign manufacturers is blurring as competition becomes increasingly global. Electric motor manufacturers from abroad, particularly those located in Europe, Brazil, China, India and elsewhere in Asia, provide increased competition as they expand their market penetration around the world, especially in North America.
Our major competitors in the Commercial and Industrial Systems segment include Welling Holding Limited, Kirloskar Brothers Limited, Crompton Greaves Limited, Lafert, ABB Ltd., Johnson Electric Holdings Limited, Siemens AG, Toshiba Corporation, Cummins, Inc., Panasonic Corporation, Leroy-Somer (a subsidiary of Emerson Electric Company), Tech-top, Weg S.A., Hyundai, and TECO Electric & Machinery Co., Ltd.
Climate Solutions Segment
Our major competitors in the Climate Solutions segment include Broad-Ocean Motor Co., ebm-papst Mulfingen GmbH & Co.KG, Toshiba Corporation, Panasonic Corporation, Bluffton Motor Works and US Motors (a division of Nidec Corporation).
Power Transmission Solutions Segment
The power transmission products market is fragmented. Many competitors in the market offer limited product lines or serve specific applications, industries or geographic markets. Other larger competitors offer broader product lines that serve multiple end uses in multiple geographies. Competition in the power transmission segment is based on several factors including quality, lead times, custom engineering capability, pricing, reliability, and customer and engineering support. Our major competitors in the Power Transmission Solutions segment include Altra Industrial Motion, Inc., Dodge (a subsidiary of ABB Ltd.), Rexnord Corporation, The Timken Company and SEW Eurodrive GmbH & Co.
Engineering, Research and Development
We believe that innovation is critical to our future growth and success and are committed to investing in new products, technologies and processes that deliver real value to our customers. Our research and development expenses consist primarily of costs for (i) salaries and related personnel expenses; (ii) the design and development of new energy efficiency products and enhancements; (iii) quality assurance and testing; and (iv) other related overhead. Our research and development efforts tend to be targeted toward developing new products that would allow us to gain additional market share, whether in new or existing segments.
We believe the key driver of our innovation strategy is the development of products that include energy efficiency, embedded intelligence and variable speed technology solutions. With our emphasis on product development and innovation, our businesses filed 39 Non-Provisional United States patents, two Provisional United States patents and an additional 69 Non-Provisional foreign patents in fiscal 2016.
Each of our business units has its own, as well as shared, product development and design teams that continuously work to enhance our existing products and develop new products for our growing base of customers that require custom and standard solutions. We believe we have state of the art product development and testing laboratories. We believe these capabilities provide a significant competitive advantage in the development of high quality motors, electric generators, controls and mechanical products incorporating leading design characteristics such as low vibration, low noise, improved safety, reliability, sustainability and enhanced energy efficiency.
For fiscal 2016, 2015 and 2014, research and development expenses, which are solely focused on products or processes that are entirely innovative to our Company or to our industry, were $29.5 million, $30.1 million and $32.9 million, respectively. For the
7
same periods, total research and development and other engineering expenses, which include product and process improvements, were $77.3 million, $78.7 million and $85.0 million, respectively.
Manufacturing and Operations
We have developed and acquired global operations in locations such as China, Mexico, Europe, India and Thailand so that we can sell our products in these faster growing markets, follow our multinational customers, take advantage of global talent and complement our flexible, rapid response operations in the United States, Canada and Europe. Our vertically integrated manufacturing operations, including our own aluminum die casting and steel stamping operations, are an important element of our rapid response capabilities. In addition, we have an extensive internal logistics operation and a network of distribution facilities with the capability to modify stock products to quickly meet specific customer requirements in many instances. This gives us the ability to efficiently and promptly deliver a customer's unique product to the desired location.
We manufacture a majority of the products that we sell, but also strategically outsource components and finished goods from an established global network of suppliers. We aggressively pursue global sourcing to reduce our overall costs. We generally maintain a dual sourcing capability in our existing domestic facilities to ensure a reliable supply source for our customers, although we do depend on a limited number of key suppliers for certain materials and components. We regularly invest in machinery and equipment to improve and maintain our facilities. Additionally, we have typically obtained significant amounts of quality capital equipment as part of our acquisitions, often increasing overall capacity and capability. Base materials for our products consist primarily of steel, copper and aluminum. Additionally, significant components of our product costs consist of bearings, electronics, permanent magnets and ferrous and non-ferrous castings.
We use our Regal Business System to drive Performance Excellence. Our Regal Business System provides us with a common language and a common set of business processes, disciplines and Lean Six Sigma tools. It consists of a set of standard reviews throughout the year to assess team progress in serving our customers, shareholders and employees. It is a significant part of our culture and fuels our continuous performance improvements. We believe our people are at the core of everything we do, and their deployment of these tools lead to operational excellence. We have invested in training hundreds of high energy teams, which have generated significant benefits and driven improvements in safety, speed, quality and cost.
Facilities
We have manufacturing, sales and service facilities in the United States, Mexico, China, Europe, India and Australia, as well as a number of other locations throughout the world. Our Commercial and Industrial Systems segment currently includes 95 manufacturing, service, office and distribution facilities of which 37 are principal manufacturing facilities. The Commercial and Industrial Systems segment's present operating facilities contain a total of approximately 7.5 million square feet of space, of which approximately 33% are leased. Our Climate Solutions segment includes 42 manufacturing, service, office and distribution facilities, of which 18 are principal manufacturing facilities. The Climate Solutions segment's present operating facilities contain a total of approximately 3.3 million square feet of space, of which approximately 48% are leased. Our Power Transmission Solutions segment currently includes 31 manufacturing, service, office and distribution facilities of which 17 are principal manufacturing facilities. The Power Transmission Solutions segment's present operating facilities contain a total of approximately 3.2 million square feet of space, of which approximately 13% are leased. Our principal executive offices are located in Beloit, Wisconsin in an approximately 50,000 square foot owned office building. We believe our equipment and facilities are well maintained and adequate for our present needs.
Backlog
Our business units have historically shipped the majority of their products in the month the order is received. As of December 31, 2016, our backlog was $355.8 million, as compared to $372.7 million on January 2, 2016. We believe that virtually all of our backlog will be shipped in 2017.
Patents, Trademarks and Licenses
We own a number of United States patents and foreign patents relating to our businesses. While we believe that our patents provide certain competitive advantages, we do not consider any one patent or group of patents essential to our business as a whole. We also use various registered and unregistered trademarks, and we believe these trademarks are significant in the marketing of most of our products. However, we believe the successful manufacture and sale of our products generally depends more upon our technological, manufacturing and marketing skills.
8
Employees
At the end of fiscal 2016, we employed approximately 23,000 employees worldwide. Of those employees, approximately 9,800 were located in Mexico; approximately 5,300 in the United States; approximately 3,900 in China; approximately 1,400 in India; and approximately 2,600 in the rest of the world. We consider our employee relations to be very good.
Executive Officers
The names, ages, and positions of our executive officers as of February 28, 2017 are listed below along with their business experience during the past five years. Officers are elected annually by the Board of Directors. There are no family relationships among these officers, nor any arrangements of understanding between any officer and any other persons pursuant to which the officer was elected.
9
Executive Officer | Age | Position | Business Experience and Principal Occupation | |||
Mark J. Gliebe | 56 | Chairman and Chief Executive Officer | Elected Chairman of the Board on December 31, 2011. Elected President and Chief Executive Officer in May 2011. Previously elected President and Chief Operating Officer in December 2005. Joined the Company in January 2005 as Vice President and President - Electric Motors Group, following the acquisition of the HVAC motors and capacitors businesses from GE. Previously employed by GE as the General Manager of GE Motors & Controls in the GE Consumer & Industrial business unit from June 2000 to December 2004. | |||
Jonathan J. Schlemmer | 51 | Chief Operating Officer | Elected Chief Operating Officer in May 2011. Prior thereto served as the Company's Senior Vice President - Asia Pacific from January 2010 to May 2011. Prior thereto, served as the Company's Vice President - Technology from 2005 to January 2010. Before joining the Company, Mr. Schlemmer worked for GE in its electric motors business in a variety of roles including quality, Six Sigma and engineering. | |||
Charles A. Hinrichs | 63 | Vice President and Chief Financial Officer | Joined the Company and was elected Vice President, Chief Financial Officer in September 2010. Prior to joining the Company, Mr. Hinrichs was Senior Vice President and Chief Financial Officer at Smurfit-Stone Container Corporation, where he worked from 1995 to 2009. | |||
Thomas E. Valentyn | 57 | Vice President, General Counsel and Secretary | Joined the Company in December, 2013, as Associate General Counsel and was elected Vice President, General Counsel and Secretary in May 2016. Prior to joining the Company, Mr. Valentyn was General Counsel with Twin Disc, Inc. from 2007 to 2013. From 2000 to 2007 he served as Vice President and General Counsel with Norlight Telecommunications; prior thereto he served as in-house counsel with Johnson Controls from 1991-2000. | |||
Terry R. Colvin | 61 | Vice President Corporate Human Resources | Joined the Company in September 2006 and was elected Vice President Corporate Human Resources in January 2007. Prior to joining the Company, Mr. Colvin was an employee of Sigma-Aldrich Corporation for over seventeen years. He served in several human resources positions for Sigma-Aldrich, most recently as Vice President of Human Resources from 1995 to 2003. | |||
John M. Avampato | 56 | Vice President and Chief Information Officer | Joined the Company in 2006 as Vice President Information Technology. Appointed Vice President and Chief Information Officer in January 2008. In April 2010, Mr. Avampato was elected as an officer of the Company. Prior to joining the Company, Mr. Avampato was employed with Newell Rubbermaid from 1984 to 2006 where he was Vice President, Chief Information Officer from 1999 to 2006. | |||
10
Website Disclosure
Our Internet address is www.regalbeloit.com. We make available free of charge (other than an investor's own Internet access charges) through our Internet website our Annual Report on Form 10-K, Quarterly Reports on Form 10-Q and Current Reports on Form 8-K, and amendments to those reports, as soon as reasonably practicable after we electronically file such material with, or furnish such material to, the Securities and Exchange Commission. In addition, we have adopted a Code of Business Conduct and Ethics that applies to our officers, directors and employees which satisfies the requirements of the New York Stock Exchange regarding a “code of business conduct.” We have also adopted Corporate Governance Guidelines addressing the subjects required by the New York Stock Exchange. We make copies of the foregoing, as well as the charters of our Board committees, available free of charge on our website. We intend to satisfy the disclosure requirements under Item 5.05 of Form 8-K regarding amendments to, or waivers from, our Code of Business Conduct and Ethics by posting such information on our web site at the address stated above. We are not including the information contained on or available through our website as a part of, or incorporating such information by reference into, this Annual Report on Form 10-K.
11
ITEM 1A - | RISK FACTORS |
You should carefully consider each of the risks described below, together with all of the other information contained in this Annual Report on Form 10-K, before making an investment decision with respect to our securities. If any of the following risks develop into actual events, our business, financial condition, results of operations, or cash flow could be materially and adversely affected and you may lose all or part of your investment.
We expect to incur costs and charges as a result of restructuring activities such as facilities and operations consolidations and workforce reductions that we expect will reduce on-going costs, and those restructuring activities also may be disruptive to our business and may not result in anticipated cost savings.
We have been consolidating facilities and operations in an effort to make our business more efficient and expect to continue to review our overall manufacturing footprint. We have incurred, and expect in the future to incur, additional costs and restructuring charges in connection with such consolidations, workforce reductions and other cost reduction measures that have adversely affected and, to the extent incurred in the future would adversely affect, our future earnings and cash flows. Furthermore, such actions may be disruptive to our business. This may result in production inefficiencies, product quality issues, late product deliveries or lost orders as we begin production at consolidated facilities, which would adversely impact our sales levels, operating results and operating margins. In addition, we may not realize the cost savings that we expect to realize as a result of such actions.
As a result of the increase in our debt levels and debt service obligations in connection with our acquisition of the Power Transmission Solutions business, we may have less cash flow available for our business operations, we could become increasingly vulnerable to general adverse economic and industry conditions and interest rate trends, and our ability to obtain future financing may be limited.
At the beginning of fiscal 2015, we significantly increased our overall debt levels in connection with financing the acquisition of PTS. As of December 31, 2016, we had $1.4 billion in aggregate debt outstanding under our various financing arrangements, $284.5 million in cash and cash equivalents and $449.9 million in available borrowings under our current revolving credit facility. Our ability to make required payments of principal and interest on our increased debt levels will depend on our future performance, which, to a certain extent, is subject to general economic, financial, competitive and other factors that are beyond our control. We cannot assure you that our business will generate sufficient cash flow from operations or that future borrowings will be available under our current credit facilities in an amount sufficient to enable us to service our indebtedness or to fund our other liquidity needs. In addition, our credit facilities contain financial and restrictive covenants that could limit our ability to, among other things, borrow additional funds or take advantage of business opportunities. Our failure to comply with such covenants could result in an event of default that, if not cured or waived, could result in the acceleration of all our indebtedness or otherwise have a material adverse effect on our business, financial condition, results of operations and debt service capability. See “Management’s Discussion and Analysis of Financial Condition and Results of Operations-Liquidity and Capital Resources.” Our increased indebtedness may have important consequences. For example, it could:
• | make it more challenging for us to obtain additional financing to fund our business strategy and acquisitions, debt service requirements, capital expenditures and working capital; |
• | increase our vulnerability to interest rate changes and general adverse economic and industry conditions; |
• | require us to dedicate a substantial portion of our cash flow from operations to service our indebtedness, thereby reducing the availability of our cash flow to finance acquisitions and to fund working capital, capital expenditures, manufacturing capacity expansion, business integration, research and development efforts and other general corporate activities; |
• | limit our flexibility in planning for, or reacting to, changes in our business and our markets; and |
• | place us at a competitive disadvantage relative to our competitors that have less debt. |
In addition, our credit facilities require us to maintain specified financial ratios and satisfy certain financial condition tests, which may require that we take action to reduce our debt or to act in a manner contrary to our business strategies. If an event of default under our credit facility or senior notes were to occur then, the lenders could elect to declare all amounts outstanding under the applicable agreement, together with accrued interest, to be immediately due and payable.
We operate in the highly competitive global electric motor, drives and controls, power generation and power transmission industries.
The global electric motors, drives and controls, power generation and power transmission industries are highly competitive. We encounter a wide variety of domestic and international competitors due in part to the nature of the products we manufacture and the wide variety of applications and customers we serve. In order to compete effectively, we must retain relationships with major customers and establish relationships with new customers, including those in developing countries. Moreover, in certain
12
applications, customers exercise significant power over business terms. It may be difficult in the short-term for us to obtain new sales to replace any decline in the sale of existing products that may be lost to competitors. Our failure to compete effectively may reduce our revenues, profitability and cash flow, and pricing pressures resulting from competition may adversely impact our profitability.
We have also witnessed a trend with certain customers who are attempting to reduce the number of vendors from which they purchase product in order to reduce their costs and diversify their risk. As a result, we may lose market share to our competitors in some of the markets in which we compete.
In addition, some of our competitors are larger and have greater financial and other resources than we do. There can be no assurance that our products will be able to compete successfully with the products of these other companies.
Our ability to establish, grow and maintain customer relationships depends in part on our ability to develop new products and product enhancements based on technological innovation.
The electric motor and power transmission industries in recent years have seen significant evolution and innovation, particularly with respect to increasing energy efficiency and control enhancements. Our ability to effectively compete in these industries depends in part on our ability to continue to develop new technologies and innovative products and product enhancements. Further, many large customers in these industries generally desire to purchase from companies that can offer a broad product range, which means we must continue to develop our expertise in order to design, manufacture and sell these products successfully. This requires that we make significant investments in engineering, manufacturing, customer service, and support, research and development and intellectual property protection, and there can be no assurance that in the future we will have sufficient resources to continue to make such investments. If we are unable to meet the needs of our customers for innovative products or product variety, or if our products become technologically obsolete over time due to the development by our competitors of technological breakthroughs or otherwise, our revenues and results of operations may be adversely affected. In addition, we may incur significant costs and devote significant resources to the development of products that ultimately are not accepted in the marketplace, do not provide anticipated enhancements, or do not lead to significant revenue, which may adversely impact our results of operations.
Our dependence on, and the price of, raw materials may adversely affect our gross margins.
Many of the products we produce contain key materials such as steel, copper, aluminum and rare earth metals. Market prices for those materials can be volatile due to changes in supply and demand, manufacturing and other costs, regulations and tariffs, economic conditions and other circumstances. We may not be able to offset any increase in commodity costs through pricing actions, productivity enhancements or other means, and increasing commodity costs may have an adverse impact on our gross margins, which could adversely affect our results of operations and financial condition.
In our Climate Solutions segment and Commercial and Industrial Systems segment, we depend on revenues from several significant customers, and any loss, cancellation or reduction of, or delay in, purchases by these customers may have a material adverse effect on our business.
We derive a significant portion of the revenues of our motor businesses from several key OEM customers. Our success will depend on our continued ability to develop and manage relationships with these customers. We expect this customer concentration will continue for the foreseeable future. Our reliance on sales from customers makes our relationship with each of these customers important to our business. We cannot assure you that we will be able to retain these key customers. Some of our customers may in the future shift some or all of their purchases of products from us to our competitors or to other sources. The loss of one or more of our large customers, any reduction or delay in sales to these customers, our inability to develop relationships successfully with additional customers, or future price concessions that we may make could have a material adverse effect on our results of operations and financial condition.
We manufacture a significant portion of our products outside the United States, and political, societal or economic instability may present additional risks to our business.
Approximately 17,700 of our approximate 23,000 total employees and 63 of our principal manufacturing and warehouse facilities are located outside the United States. International operations generally are subject to various risks, including political, societal and economic instability, local labor market conditions, breakdowns in trade relations, the imposition of tariffs and other trade restrictions, lack of reliable legal systems, ownership restrictions, the impact of government regulations, the effects of income and withholding taxes, governmental expropriation or nationalization, and differences in business practices. We may incur increased costs and experience delays or disruptions in product deliveries and payments in connection with international manufacturing and sales that could cause loss of revenue. Unfavorable changes in the political, regulatory and business climates in countries where
13
we have operations could have a material adverse effect on our financial condition, results of operations and cash flows.
We may encounter difficulties in integrating the operations of acquired businesses such as PTS, which may have a material adverse impact on our future growth and operating performance.
Over the past several years, as part of our strategic growth plans, we have typically acquired multiple businesses in any given year. Some of those acquisitions have been significant to our overall growth, such as the acquisition of PTS in fiscal 2015. The full realization of the expected benefits and synergies of PTS and other acquisitions will require integration over time of certain aspects of the manufacturing, engineering, administrative, sales and marketing and distribution functions of the acquired businesses, as well as some integration of information systems platforms and processes. Complete and successful integration of PTS and other acquired businesses, and realization of expected synergies, can be a long and difficult process and may require substantial attention from our management team and involve substantial expenditures and include additional operational expenses. Even if we are able to successfully integrate the operations of acquired businesses, we may not be able to realize the expected benefits and synergies of the acquisition, either in the amount of time or within the expected time frame, or at all, and the costs of achieving these benefits may be higher than, and the timing may differ from, what we initially expect. Our ability to realize anticipated benefits and synergies from the acquisitions may be affected by a number of factors, including:
• | the use of more cash or other financial resources, and additional management time, attention and distraction, on integration and implementation activities than we expect, including restructuring and other exit costs; |
• | increases in other expenses related to an acquisition, which may offset any potential cost savings and other synergies from the acquisition; |
• | our ability to realize anticipated levels of sales in emerging markets like China and India; |
• | our ability to avoid labor disruptions or disputes in connection with any integration; |
• | the timing and impact of purchase accounting adjustments; |
• | difficulties in employee or management integration; and |
• | unanticipated liabilities associated with acquired businesses. |
Any potential cost-saving opportunities may take at least several quarters following an acquisition to implement, and any results of these actions may not be realized for at least several quarters following implementation. We cannot assure you that we will be able to successfully integrate the operations of our acquired businesses, that we will be able to realize any anticipated benefits and synergies from acquisitions or that we will be able to operate acquired businesses as profitably as anticipated.
A small portion of our total sales comes directly from customers in the oil and gas industry. A significant or prolonged decline in oil and gas prices could result in lower capital expenditures by those customers, which could have a material adverse effect on our results of operations and financial condition.
A small portion of our total sales is dependent directly upon the level of capital expenditures by customers in the oil and gas industry. A significant or prolonged drop in the prevailing market price of oil or gas, such as the drop in oil prices experienced in 2015-2016, may result in some of those customers delaying, canceling or modifying projects, or may result in nonpayment of, amounts that are owed to us. These effects could have a material adverse effect on our results of operations and financial condition.
We sell certain products for high volume applications, and any failure of those products to perform as anticipated could result in significant liability and expenses that may adversely affect our business and results of operations.
We manufacture and sell a number of products for high volume applications, including electric motors used in pools and spas, residential and commercial heating, ventilation and air conditioning and refrigeration equipment. Any failure of those products to perform as anticipated could result in significant product liability, product recall or rework, or other costs. The costs of product recalls and reworks are not generally covered by insurance. If we were to experience a product recall or rework in connection with products of high volume applications, our financial condition or results of operations could be materially adversely affected.
One of our subsidiaries that we acquired in 2007 is subject to numerous claims filed in various jurisdictions relating to certain sub-fractional motors that were primarily manufactured through 2004 and that were included as components of residential and commercial ventilation units manufactured and sold in high volumes by a third party. These ventilation units are subject to regulation by government agencies such as the U.S. Consumer Product Safety Commission (“CPSC”). The claims generally allege that the ventilation units were the cause of fires. Based on the current facts, we cannot assure you that these claims, individually or in the aggregate, will not have a material adverse effect on our subsidiary's results of operations, financial condition or cash flows. We cannot reasonably predict the outcome of these claims, the nature or extent of any CPSC or other remedial actions, if any, that our
14
subsidiary or we on their behalf may need to undertake with respect to motors that remain in the field, or the costs that may be incurred, some of which could be significant.
We are subject to litigation, including product liability and warranty claims that may adversely affect our financial condition and results of operations.
We are, from time to time, a party to litigation that arises in the normal course of our business operations, including product warranty and liability claims, contract disputes and environmental, asbestos, employment and other litigation matters. We face an inherent business risk of exposure to product liability and warranty claims in the event that the use of our products is alleged to have resulted in injury or other damage. While we currently maintain general liability and product liability insurance coverage in amounts that we believe are adequate, we cannot assure you that we will be able to maintain this insurance on acceptable terms or that this insurance will provide sufficient coverage against potential liabilities that may arise. Any product liability claim may also include the imposition of punitive damages, the award of which, pursuant to certain state laws, may not be covered by insurance. Any claims brought against us, with or without merit, may have an adverse effect on our business and results of operations as a result of potential adverse outcomes, the expenses associated with defending such claims, the diversion of our management's resources and time and the potential adverse effect to our business reputation.
We depend on certain key suppliers, and any loss of those suppliers or their failure to meet commitments may adversely affect our business and results of operations.
We are dependent on a single or limited number of suppliers for some materials or components required in the manufacture of our products. If any of those suppliers fail to meet their commitments to us in terms of delivery or quality, we may experience supply shortages that could result in our inability to meet our customers' requirements, or could otherwise experience an interruption in our operations that could negatively impact our business and results of operations.
Infringement of our intellectual property by third parties may harm our competitive position, and we may incur significant costs associated with the protection and preservation of our intellectual property.
We own or otherwise have rights in a number of patents and trademarks relating to the products we manufacture, which have been obtained over a period of years, and we continue to actively pursue patents in connection with new product development and to acquire additional patents and trademarks through the acquisitions of other businesses. These patents and trademarks have been of value in the growth of our business and may continue to be of value in the future. Our inability to protect this intellectual property generally, or the illegal breach of some or a large group of our intellectual property rights, would have an adverse effect on our business. In addition, there can be no assurance that our intellectual property will not be challenged, invalidated, circumvented or designed-around, particularly in countries where intellectual property rights are not highly developed or protected. We have incurred in the past and may incur in the future significant costs associated with defending challenges to our intellectual property or enforcing our intellectual property rights, which could adversely impact our cash flow and results of operations.
Third parties may claim that we are infringing their intellectual property rights and we could incur significant costs and expenses or be prevented from selling certain products.
We may be subject to claims from third parties that our products or technologies infringe on their intellectual property rights or that we have misappropriated intellectual property rights. If we are involved in a dispute or litigation relating to infringement of third party intellectual property rights, we could incur significant costs in defending against those claims. Our intellectual property portfolio may not be useful in asserting a counterclaim, or negotiating a license, in response to a claim of infringement or misappropriation. In addition, as a result of such claims of infringement or misappropriation, we could lose our rights to technology that are important to our business, or be required to pay damages or license fees with respect to the infringed rights or be required to redesign our products at substantial cost, any of which could adversely impact our cash flows and results of operations.
We may suffer losses as a result of foreign currency fluctuations.
The net assets, net earnings and cash flows from our foreign subsidiaries are based on the US dollar equivalent of such amounts measured in the applicable functional currency. These foreign operations have the potential to impact our financial position due to fluctuations in the local currency arising from the process of re-measuring the local functional currency in the US dollar. Any increase in the value of the US dollar in relation to the value of the local currency, whether by means of market conditions or governmental actions such as currency devaluations, will adversely affect our revenues from our foreign operations when translated into US dollars. Similarly, any decrease in the value of the US dollar in relation to the value of the local currency will increase our operating costs in foreign operations, to the extent such costs are payable in foreign currency, when translated into US dollars.
15
Businesses that we have acquired, such as PTS, or that we may acquire in the future may have liabilities which are not known to us.
We have assumed liabilities of other acquired businesses including PTS, and may assume liabilities of businesses that we acquire in the future. There may be liabilities or risks that we fail, or are unable, to discover, or that we underestimate, in the course of performing our due diligence investigations of acquired businesses. Additionally, businesses that we have acquired or may acquire in the future may have made previous acquisitions, and we will be subject to certain liabilities and risks relating to these prior acquisitions as well. We cannot assure you that our rights to indemnification contained in definitive acquisition agreements that we have entered or may enter into will be sufficient in amount, scope or duration to fully offset the possible liabilities associated with the business or property acquired. Any such liabilities, individually or in the aggregate, could have a material adverse effect on our business, financial condition or results of operations. As we begin to operate acquired businesses, we may learn additional information about them that adversely affects us, such as unknown or contingent liabilities, issues relating to compliance with applicable laws or issues related to ongoing customer relationships or order demand.
Goodwill and indefinite-lived trade name intangibles comprise a significant portion of our total assets, and if we determine that goodwill and indefinite-lived trade name intangibles have become impaired in the future, our results of operations and financial condition in such years may be materially and adversely affected.
Goodwill represents the excess of cost over the fair market value of net assets acquired in business combinations. Indefinite-lived trade name intangibles represent long-standing brands acquired in business combinations and assumed to have indefinite lives. We review goodwill and indefinite-lived trade name intangibles at least annually for impairment and any excess in carrying value over the estimated fair value is charged to the results of operations. Our estimates of fair value are based on assumptions about the future operating cash flows, growth rates, discount rates applied to these cash flows and current market estimates of value. A reduction in net income resulting from the write down or impairment of goodwill or indefinite-lived trade name intangibles would affect financial results and could have a material and adverse impact upon the market price of our common stock. If we are required to record a significant charge to earnings in our consolidated financial statements because an impairment of goodwill or indefinite-lived trade name intangibles is determined, our results of operations and financial condition could be materially and adversely affected.
Commodity, currency and interest rate hedging activities may adversely impact our financial performance as a result of changes in global commodity prices, interest rates and currency rates.
We use derivative financial instruments in order to reduce the substantial effects of currency and commodity fluctuations and interest rate exposure on our cash flow and financial condition. These instruments may include foreign currency and commodity forward contracts, currency swap agreements and currency option contracts, as well as interest rate swap agreements. We have entered into, and expect to continue to enter into, such hedging arrangements. While limiting to some degree our risk fluctuations in currency exchange, commodity price and interest rates by utilizing such hedging instruments, we potentially forgo benefits that might result from other fluctuations in currency exchange, commodity and interest rates. We also are exposed to the risk that counterparties to hedging contracts will default on their obligations. We manage exposure to counterparty credit risk by limiting our counterparties to major international banks and financial institutions meeting established credit guidelines. However, any default by such counterparties might have an adverse effect on us.
We may incur costs or suffer reputational damage due to improper conduct of our employees, agents or business partners.
We are subject to a variety of domestic and foreign laws, rules and regulations relating to improper payments to government officials, bribery, anti-kickback and false claims rules, competition, export and import compliance, money laundering and data privacy. If our employees, agents or business partners engage in activities in violation of these laws, rules or regulations, we may be subject to civil or criminal fines or penalties or other sanctions, may incur costs associated with government investigations, or may suffer damage to our reputation.
Sales of products incorporated into HVAC systems and other residential applications are seasonal and affected by the weather; mild or cooler weather could have an adverse effect on our operating performance.
Many of our motors are incorporated into HVAC systems and other residential applications that OEMs sell to end users. The number of installations of new and replacement HVAC systems or components and other residential applications is higher during the spring and summer seasons due to the increased use of air conditioning during warmer months. Mild or cooler weather conditions
16
during the spring and summer season often result in end users deferring the purchase of new or replacement HVAC systems or components. As a result, prolonged periods of mild or cooler weather conditions in the spring or summer season in broad geographical areas could have a negative impact on the demand for our HVAC motors and, therefore, could have an adverse effect on our operating performance. In addition, due to variations in weather conditions from year to year, our operating performance in any single year may not be indicative of our performance in any future year.
We may be adversely impacted by an inability to identify and complete acquisitions.
A substantial portion of our growth has come through acquisitions, and an important part of our growth strategy is based upon our ability to execute future acquisitions. We may not be able to identify and successfully negotiate suitable acquisitions, obtain financing for future acquisitions on satisfactory terms or otherwise complete acquisitions in the future. If we are unable to successfully complete acquisitions, our ability to grow our company may be limited.
Our success is highly dependent on qualified and sufficient staffing. Our failure to attract or retain qualified personnel could lead to a loss of revenue or profitability.
Our success depends, in part, on the efforts and abilities of our senior management team and key employees. Their skills, experience and industry contacts significantly benefit our operations and administration. The failure to attract or retain members of our senior management team and key employees could have a negative effect on our operating results.
Our operations are highly dependent on information technology infrastructure and failures could significantly affect our business.
We depend heavily on our information technology infrastructure in order to achieve our business objectives. If we experience a problem that impairs this infrastructure, such as a computer virus, a problem with the functioning of an important IT application, or an intentional disruption of our IT systems by a third party, the resulting disruptions could impede our ability to record or process orders, manufacture and ship in a timely manner, or otherwise carry on our business in the ordinary course. Any such events could cause us to lose customers or revenue and could require us to incur significant expense to eliminate these problems and address related security concerns.
We are in the process of implementing a global Enterprise Resource Planning (“ERP”) system that will redesign and deploy a common information system over a period of several years. The process of implementation can be costly and can divert the attention of management from the day-to-day operations of the business. As we implement the ERP system, the new system may not perform as expected. This could have an adverse effect on our business.
Worldwide economic conditions may adversely affect our industry, business and results of operations.
General economic conditions and conditions in the global financial markets can affect our results of operations. Deterioration in the global economy could lead to higher unemployment, lower consumer spending and reduced investment by businesses, and could lead our customers to slow spending on our products or make it difficult for our customers, our vendors and us to accurately forecast and plan future business activities. Worsening economic conditions could also affect the financial viability of our suppliers, some of which we may consider key suppliers. If the commercial and industrial, residential HVAC, power generation and power transmission markets significantly deteriorate, our business, financial condition and results of operations will likely be materially and adversely affected. Additionally, our stock price could decrease if investors have concerns that our business, financial condition and results of operations will be negatively impacted by a worldwide economic downturn.
We may be adversely affected by environmental, health and safety laws and regulations.
We are subject to various laws and regulations relating to the protection of the environment and human health and safety and have incurred and will continue to incur capital and other expenditures to comply with these regulations. Failure to comply with any environmental regulations, including more stringent environmental laws that may be imposed in the future, could subject us to future liabilities, fines or penalties or the suspension of production.
17
Our operations can be negatively impacted by natural disasters, terrorism, acts of war, international conflict, political and governmental actions which could harm our business.
Natural disasters, acts or threats of war or terrorism, international conflicts, and the actions taken by the United States and other governments in response to such events could cause damage or disrupt our business operations, our suppliers, or our customers, and could create political or economic instability, any of which could have an adverse effect on our business. Although it is not possible to predict such events or their consequences, these events could decrease demand for our products, could make it difficult or impossible for us to deliver products, or could disrupt our supply chain. We may also be negatively impacted by actions by the United States or foreign governments which could disrupt manufacturing and commercial operations, including policy changes affecting taxation, trade, immigration, currency devaluation, tariffs and the like.
We are subject to changes in legislative, regulatory and legal developments involving income and other taxes.
We are subject to US federal, state, and international income, payroll, property, sales and use, fuel, and other types of taxes. Changes in tax rates, enactment of new tax laws, revisions of tax regulations, and claims or litigation with taxing authorities could result in substantially higher taxes and, therefore, could have a significant adverse effect on our results or operations, financial conditions and liquidity. Currently, a significant amount of our revenue is generated from customers located outside of the United States, and an increasingly greater portion of our assets and employees are located outside of the United States. US income tax and foreign withholding taxes have not been provided on undistributed earnings for certain non-US subsidiaries, because such earnings are intended to be indefinitely reinvested in the operations of those subsidiaries.
Future legislation may substantially reduce (or have the effect of substantially reducing) our ability to defer US taxes on profit permanently reinvested outside the United States. Additionally, they could have a negative impact on our ability to compete in the global marketplace.
We are subject to tax laws and regulations in many jurisdictions and the inability to successfully defend claims from taxing authorities related to our current and/or acquired businesses could adversely affect our operating results and financial position.
We conduct business in many countries, which requires us to interpret the income tax laws and rulings in each of those taxing jurisdictions. Due to the subjectivity of tax laws between those jurisdictions as well as the subjectivity of factual interpretations, our estimates of income tax liabilities may differ from actual payments or assessments. Claims from taxing authorities related to these differences could have an adverse impact on our operating results and financial position.
Our stock may be subject to significant fluctuations and volatility.
The market price of shares of our common stock may be volatile. Among the factors that could affect our common stock price are those discussed above under “Risk Factors” as well as:
• | domestic and international economic and political factors unrelated to our performance; |
• | quarterly fluctuation in our operating income and earnings per share results; |
• | decline in demand for our products; |
• | significant strategic actions by our competitors, including new product introductions or technological advances; |
• | fluctuations in interest rates; |
• | cost increases in energy, raw materials, intermediate components or materials, or labor; and |
• | changes in revenue or earnings estimates or publication of research reports by analysts. |
In addition, stock markets may experience extreme volatility that may be unrelated to the operating performance of particular companies. These broad market fluctuations may adversely affect the trading price of our common stock.
ITEM 1B - UNRESOLVED STAFF COMMENTS
None.
18
ITEM 2 - Properties
Our principal executive offices are located in Beloit, Wisconsin in an owned office building with approximately 50,000 square feet. We have manufacturing, sales and service facilities throughout the United States and in Mexico, China, India and Europe.
Our Commercial and Industrial Systems segment currently includes 95 facilities, of which 37 are principal manufacturing facilities and 13 are principal warehouse facilities. The Commercial and Industrial Systems segment's present operating facilities contain a total of approximately 7.5 million square feet of space, of which approximately 33% are leased.
The following represents our principal manufacturing and warehouse facilities in the Commercial and Industrial Systems segment (square footage in millions):
Square Footage | ||||||||
Location | Facilities | Total | Owned | Leased | ||||
US | 13 | 2.0 | 1.2 | 0.8 | ||||
Mexico | 11 | 1.2 | 0.7 | 0.5 | ||||
China | 8 | 1.8 | 1.7 | 0.1 | ||||
India | 2 | 0.5 | 0.5 | — | ||||
Europe | 2 | 0.2 | 0.2 | — | ||||
Other | 19 | 0.9 | 0.3 | 0.6 | ||||
55 | 6.6 | 4.6 | 2.0 | |||||
Our Climate Solutions segment currently includes 42 facilities, of which 18 are principal manufacturing facilities and 8 are principal warehouse facilities. The Climate Solutions segment's present operating facilities contain a total of approximately 3.3 million square feet of space, of which approximately 48% are leased.
The following represents our principal manufacturing and warehouse facilities in the Climate Solutions segment (square footage in millions):
Square Footage | ||||||||
Location | Facilities | Total | Owned | Leased | ||||
US | 12 | 1.4 | 0.9 | 0.5 | ||||
Mexico | 8 | 0.9 | 0.5 | 0.4 | ||||
China | 1 | 0.2 | — | 0.2 | ||||
India | 1 | 0.2 | 0.2 | — | ||||
Europe | 2 | 0.2 | — | 0.2 | ||||
Other | 2 | 0.1 | — | 0.1 | ||||
26 | 3.0 | 1.6 | 1.4 | |||||
Our Power Transmission Solutions segment currently includes 31 facilities, of which 17 are principal manufacturing facilities and 1 is a principal warehouse facility. The Power Transmission Solutions segment's present operating facilities contain a total of approximately 3.2 million square feet of space, of which approximately 13% are leased.
The following represents our principal manufacturing and warehouse facilities in the Power Transmission Solutions segment (square footage in millions):
19
Square Footage | ||||||||
Location | Facilities | Total | Owned | Leased | ||||
US | 11 | 1.7 | 1.5 | 0.2 | ||||
Mexico | 2 | 0.3 | 0.3 | — | ||||
China | 1 | 0.1 | — | 0.1 | ||||
Europe | 3 | 0.3 | 0.3 | — | ||||
Other | 1 | 0.1 | 0.1 | — | ||||
18 | 2.5 | 2.2 | 0.3 | |||||
ITEM 3 - Legal Proceedings
One of our subsidiaries that we acquired in 2007 is subject to numerous claims filed in various jurisdictions relating to certain sub-fractional motors that were primarily manufactured through 2004 and that were included as components of residential and commercial ventilation units manufactured and sold in high volumes by a third party. These claims generally allege that the ventilation units were the cause of fires. Based on the current facts, we cannot assure you that these claims, individually or in the aggregate, will not have a material adverse effect on our subsidiary’s results of operations, financial condition or cash flows. We cannot reasonably predict the outcome of these claims, the nature or extent of remedial actions, if any, our subsidiary or we on their behalf may need to undertake with respect to motors that remain in the field, or the costs that may be incurred, some of which could be significant.
We are, from time to time, party to other litigation that arises in the normal course of our business operations, including product warranty and liability claims, contract disputes and environmental, asbestos, intellectual property, employment and other litigation matters. Our products are used in a variety of industrial, commercial and residential applications that subject us to claims that the use of our products is alleged to have resulted in injury or other damage. We accrue for anticipated costs in pursuing or defending against such lawsuits in amounts that we believe are adequate, and we do not believe that the outcome of any such lawsuit will have a material effect on our results of operations, financial position or cash flows.
ITEM 4 - Mine Safety Disclosures
Not applicable.
20
PART II
ITEM 5 - | Market for the Registrant's Common Equity, Related Shareholder Matters and Issuer Purchases of Equity Securities |
General
Our common stock, $.01 par value per share, is traded on the New York Stock Exchange under the symbol “RBC.” The following table sets forth the range of high and low closing sales prices for our common stock for the period from January 4, 2015 through December 31, 2016.
2016 Price Range | 2015 Price Range | |||||||||||||||||||||||
Dividends | Dividends | |||||||||||||||||||||||
Quarter | High | Low | Declared | High | Low | Declared | ||||||||||||||||||
1st | $ | 63.39 | $ | 49.38 | $ | 0.23 | $ | 80.20 | $ | 68.75 | $ | 0.22 | ||||||||||||
2nd | 67.91 | 51.81 | 0.24 | 80.95 | 71.82 | 0.23 | ||||||||||||||||||
3rd | 64.18 | 54.51 | 0.24 | 72.74 | 55.46 | 0.23 | ||||||||||||||||||
4th | 75.10 | 56.90 | 0.24 | 65.24 | 56.78 | 0.23 | ||||||||||||||||||
We have paid 226 consecutive quarterly dividends through January 2017. The number of registered holders of common stock as of February 17, 2017 was 396.
The following table contains detail related to the repurchase of our common stock based on the date of trade during the quarter ended December 31, 2016.
Maximum | ||||||||||
Total | Number of | |||||||||
Number of | Average | Shares that May be | ||||||||
Shares | Price Paid | Purchased Under the | ||||||||
2016 Fiscal Month | Purchased | per Share | Plans or Programs | |||||||
October 2 to November 5 | — | $ | — | 2,320,000 | ||||||
November 6 to December 3 | — | — | 2,320,000 | |||||||
December 4 to December 31 | — | — | 2,320,000 | |||||||
Total | — | |||||||||
There were no shares purchased as a part of a publicly announced plan or program.
Under our equity incentive plans, participants may satisfy the statutory minimum or a portion of the federal, state and local withholding tax obligations arising in connection with plan awards by electing to (a) have the Company withhold shares of common stock otherwise issuable under the award, (b) tender back shares received in connection with such award or (c) deliver other previously owned shares of common stock, in each case having a value equal to the amount to be withheld.
The Board of Directors has approved a repurchase program for up to 3.0 million shares of our common stock, which repurchase authority has no expiration date. Management is authorized to effect purchases from time to time in the open market or through privately negotiated transactions. From time to time, we may enter into a Rule10b5-1 trading plan for the purpose of repurchasing shares under this authorization. Pursuant to this authorization, there were no shares acquired in fiscal 2016 and 180,000 shares acquired in fiscal 2015. There are approximately 2.3 million shares of our common stock available for repurchase under this authorization.
Item 12 of this Annual Report on Form 10-K contains certain information relating to our equity compensation plans.
Stock Performance
The following information in this Item 5 of this Annual Report on Form 10-K is not deemed to be “soliciting material” or to be “filed” with the SEC or subject to Regulation 14A or 14C under the Securities Exchange Act of 1934 (the “Exchange Act”) or to the liabilities of Section 18 of the Exchange Act, and will not be deemed to be incorporated by reference into any filing under the Securities Act of 1933 or the Exchange Act.
21
The following graph compares the hypothetical total shareholder return (including reinvestment of dividends) on an investment in (1) our common stock, (2) the Standard & Poor's Mid Cap 400 Index, and (3) the Standard & Poor's 400 Electrical Components and Equipment Index, for the period January 1, 2012 through December 31, 2016. In each case, the graph assumes the investment of $100.00 on January 1, 2012.
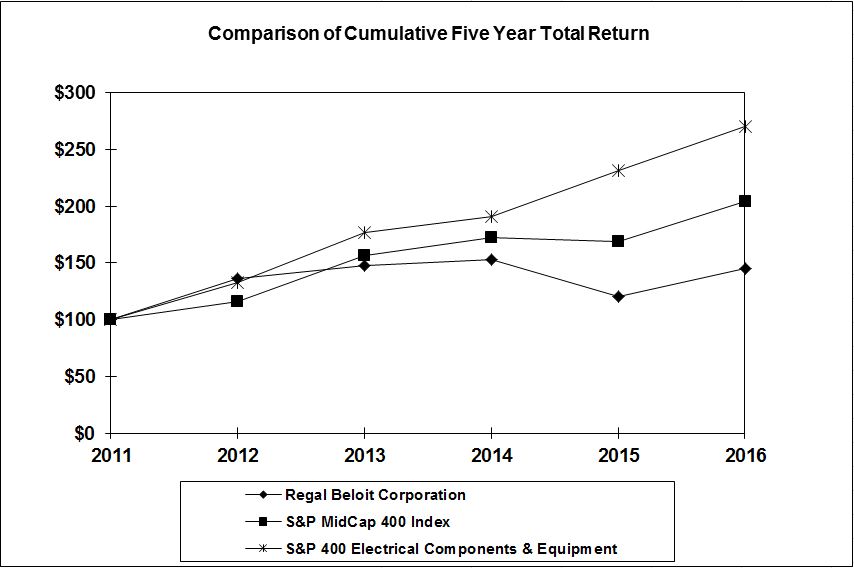
INDEXED RETURNS | ||||||||||||||||||||
Years Ended | ||||||||||||||||||||
Company / Index | 2012 | 2013 | 2014 | 2015 | 2016 | |||||||||||||||
Regal Beloit Corporation | $ | 136.35 | $ | 147.70 | $ | 153.01 | $ | 120.47 | $ | 144.81 | ||||||||||
S&P MidCap 400 Index | 116.02 | 156.63 | 172.65 | 169.02 | 204.07 | |||||||||||||||
S&P 400 Electrical Components & Equipment | 132.80 | 176.70 | 191.16 | 231.20 | 270.36 | |||||||||||||||
ITEM 6 - Selected Financial Data
The selected statements of income data for fiscal 2016, 2015 and 2014, and the selected balance sheet data at December 31, 2016 and January 2, 2016 are derived from, and are qualified by reference to, the audited consolidated financial statements included elsewhere in this Annual Report on Form 10-K. The selected statement of income data for fiscal 2013 and 2012 are derived from audited consolidated financial statements not included herein. The selected balance sheet data at January 3, 2015, December 28, 2013, and December 29, 2012 are derived from audited consolidated financial statements not included herein.
22
Fiscal | Fiscal | Fiscal | Fiscal | Fiscal | ||||||||||||||||
2016 | 2015 | 2014 | 2013 | 2012 | ||||||||||||||||
(In Millions, Except Per Share Data) | ||||||||||||||||||||
Net Sales | $ | 3,224.5 | $ | 3,509.7 | $ | 3,257.1 | $ | 3,095.7 | $ | 3,166.9 | ||||||||||
Cost of Sales | 2,359.3 | 2,576.5 | 2,459.8 | 2,312.5 | 2,395.9 | |||||||||||||||
Gross Profit | 865.2 | 933.2 | 797.3 | 783.2 | 771.0 | |||||||||||||||
Operating Expenses | 544.6 | 600.5 | 516.3 | 494.2 | 458.2 | |||||||||||||||
Goodwill Impairment | — | 79.9 | 119.5 | 76.3 | — | |||||||||||||||
Asset Impairments and Other, Net | — | — | 40.0 | 4.7 | — | |||||||||||||||
Total Operating Expenses | 544.6 | 680.4 | 675.8 | 575.2 | 458.2 | |||||||||||||||
Income from Operations | 320.6 | 252.8 | 121.5 | 208.0 | 312.8 | |||||||||||||||
Net Income | 209.3 | 148.5 | 36.1 | 126.0 | 200.3 | |||||||||||||||
Net Income Attributable to Regal Beloit Corporation | 203.4 | 143.3 | 31.0 | 120.0 | 195.6 | |||||||||||||||
Total Assets | 4,358.5 | 4,591.7 | 3,357.2 | 3,611.3 | 3,526.5 | |||||||||||||||
Total Debt | 1,411.5 | 1,721.9 | 632.5 | 765.5 | 815.7 | |||||||||||||||
Long-term Debt | 1,310.9 | 1,715.6 | 624.7 | 607.7 | 752.5 | |||||||||||||||
Regal Beloit Shareholders' Equity | 2,038.8 | 1,937.3 | 1,934.4 | 2,056.2 | 1,953.4 | |||||||||||||||
Per Share Data: | ||||||||||||||||||||
Earnings - Basic | $ | 4.55 | $ | 3.21 | $ | 0.69 | $ | 2.66 | $ | 4.68 | ||||||||||
Earnings - Assuming Dilution | 4.52 | 3.18 | 0.69 | 2.64 | 4.64 | |||||||||||||||
Cash Dividends Declared | 0.95 | 0.91 | 0.86 | 0.79 | 0.75 | |||||||||||||||
Shareholders' Equity | 46.46 | 44.32 | 44.02 | 46.72 | 46.73 | |||||||||||||||
Weighted Average Shares Outstanding: | ||||||||||||||||||||
Basic | 44.7 | 44.7 | 45.0 | 45.0 | 41.8 | |||||||||||||||
Assuming Dilution | 45.0 | 45.1 | 45.3 | 45.4 | 42.1 | |||||||||||||||
We have completed various acquisitions that affect the comparability of the selected financial data shown above. The results of operations for acquisitions are included in our consolidated financial results for the period subsequent to their acquisition date. Significant acquisitions include the acquisition of the Power Transmission Solutions business from Emerson Electric Co. (January 2015).
For fiscal 2016, there were no impairment charges or significant acquisitions.
In the fourth quarter of fiscal 2015, non-cash impairment charges of $79.9 million for goodwill were recorded in the Commercial and Industrial Systems segment, reducing Income from Operations by $79.9 million and Net Income Attributable to Regal Beloit Corporation by $58.1 million.
In the fourth quarter of fiscal 2014, non-cash impairment charges of $118.5 million for goodwill and $40.0 million of asset impairment and other, net, and in the second quarter of 2014 non-cash impairment charges of $1.0 million of goodwill, reduced Income from Operations by $159.5 million and Net Income Attributable to Regal Beloit Corporation by $147.3 million. The impairment charges were recorded in certain reporting units in all three of our reportable segments.
In the fourth quarter of fiscal 2013, a non-cash impairment charges of $76.3 million of goodwill and $4.7 million of asset impairment and other, net, related to certain reporting units in our Commercial and Industrial Systems and Power Transmission Solutions segments, reduced Income from Operations by $81.0 million and Net Income Attributable to Regal Beloit Corporation by $74.7 million.
23
ITEM 7 - MANAGEMENT'S DISCUSSION AND ANALYSIS OF FINANCIAL CONDITION AND RESULTS OF OPERATIONS
We operate on a 52/53 week fiscal year ending on the Saturday closest to December 31. We refer to the fiscal year ended December 31, 2016 as “fiscal 2016," the fiscal year ended January 2, 2016 as “fiscal 2015,” the fiscal year ended January 3, 2015 as “fiscal 2014.” Fiscal 2016 had 52 weeks, fiscal 2015 had 52 weeks and fiscal 2014 had 53 weeks.
Overview
General
Regal Beloit Corporation (NYSE: RBC) (“we,” “us,” “our” or the “Company”), based in Beloit, Wisconsin (USA), is a leading manufacturer of electric motors, electrical motion controls, power generation and power transmission products serving markets throughout the world. As of the end of fiscal 2016, the Company, including its subsidiaries, employs approximately 23,000 people in its manufacturing, sales, and service facilities and corporate offices throughout the United States, Canada, Mexico, Europe and Asia. In 2016, we reported annual net sales of $3.2 billion compared to $3.5 billion in 2015.
Our company is comprised of three operating segments: Commercial and Industrial Systems, Climate Solutions and Power Transmission Solutions.
A description of the three operating segments is as follows:
• | Commercial and Industrial Systems produces medium and large motors, commercial and industrial equipment, generator and custom drives and systems. These products serve markets including commercial HVAC, pool and spa, standby and critical power and oil and gas systems. |
• | Climate Solutions produces small motors, controls and air moving solutions serving markets including residential and light commercial HVAC, water heaters and commercial refrigeration. |
• | Power Transmission Solutions manufactures, sells and services belt and chain drives, helical and worm gearing, mounted and unmounted bearings, couplings, modular plastic belts, conveying chains and components, hydraulic pump drives, large open gearing and specialty mechanical products serving markets including beverage, bulk handling, metals, special machinery, energy, aerospace and general industrial. |
On January 30, 2015, we closed the acquisition of the Power Transmission Solutions (“PTS”) business from Emerson Electric Co. The purchase price for the PTS Acquisition was $1.4 billion in cash and the assumption of $43.0 million of liabilities. PTS has over 3,200 employees around the world, and effective on the closing date became part of the Power Transmission Solutions segment.
Components of Profit and Loss
Net Sales. We sell our products to a variety of manufacturers, distributors and end users. Our customers consist of a large cross-section of businesses, ranging from Fortune 100 companies to small businesses. A number of our products are sold to original equipment manufacturers, who incorporate our products, such as electric motors, into products they manufacture, and many of our products are built to the requirements of our customers. The majority of our sales derive from direct sales, but a significant portion derives from sales made by manufacturer’s representatives, who are paid exclusively on commission. Our product sales are made via purchase order, long-term contract, and, in some instances, one-time purchases. Many of our products have broad customer bases, with the levels of concentration of revenues varying from division to division.
Our level of net sales for any given period is dependent upon a number of factors, including (i) the demand for our products; (ii) the strength of the economy generally and the end markets in which we compete; (iii) our customers’ perceptions of our product quality at any given time; (iv) our ability to timely meet customer demands; (v) the selling price of our products; and (vi) the weather. As a result, our total revenue has tended to experience quarterly variations and our total revenue for any particular quarter may not be indicative of future results.
We use the term “organic sales" to refer to sales from existing operations excluding (i) sales from acquired businesses recorded prior to the first anniversary of the acquisition less the amount of sales attributable to any divested businesses (“acquisition sales”), and (ii) the impact of foreign currency translation. The impact of foreign currency translation is determined by translating the respective period’s sales (excluding acquisition sales) using the same currency exchange rates that were in effect during the prior year periods. We use the term “organic sales growth” to refer to the increase in our sales between periods that is attributable to organic sales. We use the term “acquisition growth” to refer to the increase in our sales between periods that is attributable to acquisition sales.
24
Gross Profit. Our gross profit is impacted by our levels of net sales and cost of sales. Our cost of sales consists of costs for, among other things (i) raw materials, including copper, steel and aluminum; (ii) components such as castings, bars, tools, bearings and electronics; (iii) wages and related personnel expenses for fabrication, assembly and logistics personnel; (iv) manufacturing facilities, including depreciation on our manufacturing facilities and equipment, taxes, insurance and utilities; and (v) shipping. The majority of our cost of sales consists of raw materials and components. The price we pay for commodities and components can be subject to commodity price fluctuations. We attempt to mitigate this through fixed-price agreements with suppliers and our hedging strategies. We are currently reducing the number of our suppliers we use in order to leverage the better prices and terms that can be obtained with higher volume orders. A large amount of our suppliers are in North America. As we expand production and our geographic footprint, we expect it may be advantageous to increase our use of foreign suppliers. When we experience commodity price increases, we have tended to announce price increases to our customers who purchase via purchase order, with such increases generally taking effect a period of time after the public announcements. For those sales we make under long-term contracts, we tend to include material price formulas that specify quarterly or semi-annual price adjustments based on a variety of factors, including commodity prices.
Outside of general economic cyclicality, our different business units experience different levels of variation in gross margin from quarter to quarter based on factors specific to each division. For example, a portion of our Climate Solutions segment manufactures products that are used in air conditioning applications. As a result, our sales for that business tend to be lower in the first and fourth quarters and higher in the second and third quarters. In contrast, our Commercial and Industrial Systems segment and our Power Transmission Solutions segment have a broad customer base and a variety of applications, thereby helping to mitigate large quarter-to-quarter fluctuations outside of general economic conditions.
Operating Expenses. Our operating expenses consist primarily of (i) general and administrative expenses; (ii) sales and marketing expenses; (iii) general engineering and research and development expenses; and (iv) handling costs incurred in conjunction with distribution activities. Personnel related costs are our largest operating expense.
Our general and administrative expenses consist primarily of costs for (i) salaries, benefits and other personnel expenses related to our executive, finance, human resource, information technology, legal and operations functions; (ii) occupancy expenses; (iii) technology related costs; (iv) depreciation and amortization; and (v) corporate-related travel. The majority of our general and administrative costs are for salaries and related personnel expenses. These costs can vary by division given the location of our different manufacturing operations.
Our sales and marketing expenses consist primarily of costs for (i) salaries, benefits and other personnel expenses related to our sales and marketing function; (ii) internal and external sales commissions and bonuses; (iii) travel, lodging and other out-of-pocket expenses associated with our selling efforts; and (iv) other related overhead.
Our general engineering and research and development expenses consist primarily of costs for (i) salaries, benefits and other personnel expenses; (ii) the design and development of new energy efficiency products and enhancements; (iii) quality assurance and testing; and (iv) other related overhead. Our research and development efforts tend to be targeted toward developing new products that would allow us to maintain or gain additional market share, whether in new or existing applications. While these costs make up an insignificant portion of our operating expenses in the Power Transmission Solutions segment, they are more substantial in our Commercial and Industrial Systems and Climate Solutions segments. In particular, a large driver of our research and development efforts in these two segments is energy efficiency, which generally means using less electrical power to produce more mechanical power.
Goodwill & Other Asset Impairments. We did not record any goodwill or other asset impairments in fiscal 2016; however, we recorded non-cash charges in Operating Expenses related to goodwill impairments in fiscal 2015 (“2015 Impairment”), and goodwill and other asset impairments in fiscal 2014 (“2014 Impairment”) as detailed below (in millions). See also Note 3 of Notes to the Consolidated Financial Statements.
Operating Profit. Our operating profit consists of the segment gross profit less the segment operating expenses. In addition, there are shared operating costs that cover corporate, engineering and IT expenses that are consistently allocated to the operating segments and are included in the segment operating expenses. Operating profit is a key metric used to measure year over year improvement of the segments.
25
Commercial and Industrial Systems | Climate Solutions | Power Transmission Solutions | Total | ||||||||||||
Impairments during 2015: | |||||||||||||||
Goodwill and Asset Impairments | $ | 79.9 | $ | — | $ | — | $ | 79.9 | |||||||
Impairments during 2014: | |||||||||||||||
Goodwill Impairments | 100.7 | 7.7 | 11.1 | 119.5 | |||||||||||
Impairment of Intangible Assets | — | 7.8 | 11.1 | 18.9 | |||||||||||
Impairment of Other Long-Lived Assets | — | 6.0 | 15.1 | 21.1 | |||||||||||
Goodwill and Asset Impairments | $ | 100.7 | $ | 21.5 | $ | 37.3 | $ | 159.5 | |||||||
Outlook
Our outlook for 2017 assumes that the weak demand from many of our end markets experienced during fiscal 2015 and 2016 will abate in fiscal 2017, providing the opportunity for slight growth in net sales and earnings.
26
Results of Operations
The following table sets forth selected information for the years indicated:
2016 | 2015 | 2014 | |||||||||
(Dollars in Millions) | |||||||||||
Net Sales: | |||||||||||
Commercial and Industrial Systems | $ | 1,530.9 | $ | 1,694.9 | $ | 1,856.1 | |||||
Climate Solutions | 960.0 | 1,041.2 | 1,134.8 | ||||||||
Power Transmission Solutions | 733.6 | 773.6 | 266.2 | ||||||||
Consolidated | $ | 3,224.5 | $ | 3,509.7 | $ | 3,257.1 | |||||
Gross Profit as a Percent of Net Sales: | |||||||||||
Commercial and Industrial Systems | 24.8 | % | 26.0 | % | 25.2 | % | |||||
Climate Solutions | 25.5 | % | 25.2 | % | 22.8 | % | |||||
Power Transmission Solutions | 32.8 | % | 29.7 | % | 26.4 | % | |||||
Consolidated | 26.8 | % | 26.6 | % | 24.5 | % | |||||
Operating Expenses as a Percent of Net Sales: | |||||||||||
Commercial and Industrial Systems | 18.0 | % | 22.8 | % | 23.4 | % | |||||
Climate Solutions | 12.0 | % | 11.1 | % | 14.0 | % | |||||
Power Transmission Solutions | 21.0 | % | 23.0 | % | 30.8 | % | |||||
Consolidated | 16.9 | % | 19.4 | % | 20.7 | % | |||||
Income from Operations as a Percent of Net Sales: | |||||||||||
Commercial and Industrial Systems | 6.8 | % | 3.2 | % | 1.8 | % | |||||
Climate Solutions | 13.5 | % | 14.1 | % | 8.8 | % | |||||
Power Transmission Solutions | 11.9 | % | 6.8 | % | (4.4 | )% | |||||
Consolidated | 9.9 | % | 7.2 | % | 3.7 | % | |||||
Income from Operations | $ | 320.6 | $ | 252.8 | $ | 121.5 | |||||
Interest Expense | 58.7 | 60.2 | 39.1 | ||||||||
Interest Income | 4.5 | 4.3 | 7.9 | ||||||||
Income before Taxes | 266.4 | 196.9 | 90.3 | ||||||||
Provision for Income Taxes | 57.1 | 48.4 | 54.2 | ||||||||
Net Income | 209.3 | 148.5 | 36.1 | ||||||||
Net Income Attributable to Noncontrolling Interests | 5.9 | 5.2 | 5.1 | ||||||||
Net Income Attributable to Regal Beloit Corporation | $ | 203.4 | $ | 143.3 | $ | 31.0 | |||||
Fiscal Year Ended 2016 Compared to Fiscal Year Ended 2015
Net sales for fiscal 2016 were $3.2 billion, an 8.1% decrease compared to fiscal 2015 net sales of $3.5 billion. The decrease consisted of an organic sales decline of 7.9%, and a negative foreign currency translation impact of 0.9% that was partially offset with acquisition growth, net of dispositions of 0.7%. Gross profit decreased $68.0 million or 7.3% as compared to the prior year. The decrease was largely driven by lower sales volume, and a $14.5 million last-in, first-out ("LIFO") expense which was partially offset by the benefits of the Simplification and cost control initiatives which helped to improve gross profit as a percentage of sales by 20 basis points in 2016 as compared to 2015. The prior year included non-recurring expenses related to the recognition of the inventory step up in cost of goods sold of $20.7 million due to purchase accounting adjustments associated with the acquired PTS business, $4.9 million in duty refunds related to the Generalized System of Preferences ("GSP"), a tariff system, which expired in July 2013 and was retroactively renewed in July 2015, and a LIFO benefit of $18.8 million. Total operating expenses were $544.6 million which was a $135.8 million decrease from 2015 due primarily to the $11.6 million gain on the sale of the Mastergear
27
business in 2016. In addition, 2015 included goodwill impairments of $79.9 million, $9.1 million of acquisition related transaction costs, $12.8 million impact of the Venezuelan asset write down, and a $3.4 million benefit from the sale of real estate. Additional decreases were due to reduced salaries, commissions, and travel expenses associated with lower sales volume, along with cost controls.
Net sales for the Commercial and Industrial Systems segment for fiscal 2016 were $1.5 billion, a 9.6% decrease compared to fiscal 2015 net sales of $1.7 billion. The decrease consisted of 8.3% negative organic growth and 1.3% unfavorable foreign currency translation. Organic sales declines were primarily driven by decreased volume in the oil and gas end markets and weaker demand in the North American and Asian industrial markets. Gross profit decreased $61.9 million or 14.0% primarily due to the impact of weaker demand in the industrial markets, and $8.4 million of LIFO expense, that was partially offset by benefits from the Simplification and cost control initiatives. Gross profit in 2015 was impacted by an $8.0 million LIFO benefit and a $0.9 million duty refund associated with the GSP tariff rebate noted above. Gross profit as a percentage of sales in 2016 decreased 120 basis points from the prior year primarily due to the favorable non-recurring items that impacted 2015. Operating expenses for 2016 decreased $111.4 million or 28.8% from 2015 primarily due to reduced salaries, commissions, and travel expenses associated with lower sales volumes, along with cost controls. Operating expenses in 2015 included a $79.9 million goodwill impairment and the $12.8 million impact of the Venezuelan asset write down, both of which did not reoccur in 2016.
Net sales for the Climate Solutions segment for fiscal 2016 were $960.0 million, a 7.8% decrease compared to fiscal 2015 net sales of $1.0 billion. The decrease consisted of an organic sales decline of 7.1%, and a negative foreign currency translation impact of 0.7%. Organic sales declines were primarily driven by a downturn in the Middle East HVAC market and the effect of contractual two-way material price formulas that was partially offset by stronger demand in the last half of the year for North American residential HVAC products. Gross profit decreased $17.1 million primarily due to lower volume and a $6.3 million LIFO expense, partially offset by benefits from the Simplification and cost control initiatives and stronger North American residential HVAC demand in the last six months of 2016. Gross profit in 2015 benefited from a $9.8 million LIFO benefit and a $3.8 million duty refund associated with the GSP tariff rebate noted above. Gross profit as a percentage of sales in 2016 increased 30 basis points as compared to 2015. Operating expenses for 2016 decreased $0.4 million as compared to the prior year with 2015 including a $3.4 million benefit from the sale of real estate.
Net sales for the Power Transmission Solutions segment for fiscal 2016 were $733.6 million, a 5.1% decrease compared to fiscal 2015 net sales of $773.6 million. The decrease consisted of an organic sales decline of 8.1% and a negative foreign currency translation impact of 0.2%. Acquisitions net of divestitures benefited 2016 sales by 3.2% as compared to 2015. Organic sales declines were primarily driven by lower demand from the industrial distribution channel, and weak oil and gas, metals and agricultural end markets. Gross profit for 2016 increased $11.0 million primarily due to the inventory step up in cost of goods sold of $20.7 million related to the acquired PTS business included in the prior year, and $1.0 million of LIFO benefit in 2015. LIFO for 2016 was a slight benefit of $0.2 million. Gross profit as a percent of sales increased 310 basis points as compared to the prior year. Operating expenses for 2016 decreased $24.0 million due primarily to the $9.1 million of acquisition fees incurred in 2015 and the $11.6 million gain on the sale of the Mastergear business in 2016 as compared to 2015. In addition, current year operating expenses included one month of incremental operating expenses associated with the acquired PTS business.
The effective tax rate for fiscal 2016 was 21.4% compared to 24.6% for fiscal 2015. The decrease in the effective tax rate was due primarily to the fiscal 2015 non-deductible goodwill impairment. The lower effective tax rate in fiscal 2016 as compared to the 35% statutory US federal income tax rate is driven by the mix of earnings and lower foreign tax rates.
Fiscal Year Ended 2015 Compared to Fiscal Year Ended 2014
Net sales for fiscal 2015 were $3.5 billion, a 7.8% increase compared to fiscal 2014 net sales of $3.3 billion. The increase consisted of 16.6% acquisition growth, net of dispositions, partially offset by an organic decrease of 6.0% which includes the impact of three fewer shipping days in the fiscal 2015 as compared to the fiscal 2014, and a negative foreign currency translation impact of 2.8%. Gross profit increased $135.9 million or 17.0% primarily due to the recently acquired PTS business as well as the execution of a number of our Simplification initiatives. In addition, gross profit benefited from $4.9 million in tariff refunds related to the GSP, of which $3.8 million is attributable to the 2013 and 2014 fiscal years, and $1.1 million is attributable to first and second quarters of the 2015 fiscal year. Gross profit also included the recognition of the inventory step up in cost of goods sold of $20.7 million due to purchase accounting adjustments related to the PTS acquisition and restructuring expenses of $7.7 million. Operating expenses increased $4.6 million or 0.7% primarily due to incremental operating expenses associated with the recently acquired PTS business. Operating expenses included the unfavorable impact of goodwill impairment charges of $79.9 million, the impact of the Venezuelan asset write down of $12.8 million, acquisition related transaction costs of $9.1 million, and restructuring expenses of $1.2 million. These unfavorable impacts were partially offset by a gain on sale of real estate of $3.4 million, benefits of the Simplification initiatives and tighter cost controls compared to the prior year.
28
Net sales for the Commercial and Industrial Systems segment for fiscal 2015 were $1.7 billion, an 8.7% decrease compared to fiscal 2014 net sales of $1.9 billion. The decrease consisted of 6.3% negative organic growth and 3.9% unfavorable foreign currency translation partially offset by 1.5% acquisition growth. Organic sales declines were primarily driven by decreased volume in the oil and gas end markets and weaker demand in Asia. Gross profit decreased $27.1 million or 5.8% primarily due to lower sales, product mix and the impact of lower production on the absorption of costs, largely offset by Simplification initiatives and a benefit of $0.9 million in duty refunds related to the GSP tariff rebate. Gross profit also included restructuring expenses of $6.0 million. Operating expenses decreased $47.5 million or 10.9%. Operating expenses included the unfavorable impact of goodwill impairment charges of $79.9 million, the impact of the Venezuelan asset write down of $12.8 million, and restructuring expenses of $0.8 million. These unfavorable impacts were partially offset by the benefits of the Simplification initiatives, tighter cost controls, lower compensation expense and amortization expense compared to the same period in the prior year.
Net sales for the Climate Solutions segment for fiscal 2015 were $1.0 billion, an 8.2% decrease compared to fiscal 2014 net sales of $1.1 billion. The decrease consisted of 6.7% negative organic growth and 1.6% unfavorable foreign currency translation. Organic sales declines were primarily driven by the impact of the SEER 13 pre-build and the impact of lower commodity costs on our two-way material price contracts. Gross profit increased $3.4 million or 1.3% primarily due to benefits from the Simplification initiative, a benefit of $3.8 million in duty refunds related to the GSP tariff rebate, and higher production costs and operating inefficiencies experienced in 2014, partially offset by restructuring expenses of $1.3 million. Operating expenses decreased $43.6 million or 27.4% primarily due to benefits of the Simplification initiative, tighter cost controls, lower compensation expense, lower amortization expense, and no impairment charges compared to the same period in the prior year. Operating expenses included the unfavorable impact of restructuring expenses of $0.2 million offset by the favorable impact of a gain on the sale of real estate of $3.4 million.
Net sales for the Power Transmission Solutions segment for fiscal 2015 were $773.6 million, a 190.6% increase compared to fiscal 2014 net sales of $266.2 million. The increase was driven by acquisition growth of 192.6%, partially offset by 1.1% negative organic growth and 1.0% unfavorable foreign currency translation. Gross profit increased $159.6 million or 227.0% primarily due to the PTS Acquisition partially offset by the recognition of the inventory step up in cost of goods sold of $20.7 million due to purchase accounting adjustments related to the PTS acquisition, and restructuring expenses of $0.4 million. Operating expenses increased $95.7 million or 116.7% driven primarily by incremental operating expenses associated with the PTS acquisition, as well as $9.1 million of acquisition related transaction costs and $0.2 million of restructuring expenses partially offset by prior year impairment charges that did not recur in fiscal 2015.
The increase in interest expense was due primarily to a higher level of borrowings to finance acquisitions in fiscal 2015. The decrease in interest income was due primarily to a decrease in invested cash.
The effective tax rate for fiscal 2015 was 24.6% compared to 60.0% for fiscal 2014. The decrease in the effective tax rate was due primarily to the fiscal 2014 non-deductible goodwill impairment. The lower effective tax rate in fiscal 2015 as compared to the 35% statutory US federal income tax rate is driven by the mix of earnings and lower foreign tax rates.
Liquidity and Capital Resources
General
Our principal source of liquidity is cash flow provided by operating activities. In addition to operating income, other significant factors affecting our operating cash flow include working capital levels, capital expenditures, dividends, share repurchases, acquisitions, and divestitures, availability of debt financing, and the ability to attract long-term capital at acceptable terms.
Cash flow provided by operating activities was $439.6 million for fiscal 2016, a $58.5 million increase from fiscal 2015. The increase was primarily the result of the lower investment in net working capital driven by the planned reduction in inventory during fiscal 2016.
Cash flow provided by operating activities was $381.1 million for fiscal 2015, a $82.9 million increase from fiscal 2014. The increase was primarily the result of the lower investment in net working capital and increased net income from PTS in fiscal 2015 as compared to fiscal 2014.
Cash flow used in investing activities was $19.6 million for fiscal 2016, compared to $1.5 billion used in fiscal 2015. The change was driven by the purchase of PTS for $1.4 billion, net of cash acquired, in fiscal 2015 versus the $24.6 million received for the sale of our Mastergear business in 2016. The proceeds from the sale of Mastergear were used to reduce debt obligations. Capital expenditures were $65.2 million in fiscal 2016 compared to $92.2 million in fiscal 2015.
29
Cash flow used in investing activities was $1.5 billion for fiscal 2015, compared to $204.9 million used in fiscal 2014. The $1.3 billion increase was primarily due to the higher investment in acquisitions. Business acquisitions were $1.4 billion in fiscal 2015 compared to $128.2 million in fiscal 2014. Capital expenditures were $92.2 million in fiscal 2015 compared to $83.6 million in fiscal 2014.
Our commitments for property, plant and equipment as of December 31, 2016 were approximately $6.6 million. In fiscal 2017, we anticipate capital spending to be approximately $75.0 million. We believe that our present manufacturing facilities will be sufficient to provide adequate capacity for our operations in fiscal 2017. We anticipate funding fiscal 2017 capital spending with operating cash flows.
Cash flow used in financing activities was $376.8 million for fiscal 2016, compared to cash flow provided by financing activities of $1.0 billion for fiscal 2015. A $1,250.0 million term loan was taken out to finance the acquisition of PTS in fiscal 2015 versus net repayments of $315.3 million in fiscal 2016. We paid $42.1 million in dividends to shareholders in fiscal 2016 compared to $40.2 million in fiscal 2015.
Cash flow provided by financing activities was $1.0 billion for fiscal 2015, compared to cash flow used in financing activities of $218.0 million for fiscal 2014. Fiscal 2015 financing cash inflows was driven by long term debt borrowings of $1.3 billion offset by debt repayments of $132.3 million. We paid $40.2 million in dividends to shareholders in fiscal 2015, compared to $37.8 million in fiscal 2014.
Our working capital was $830.4 million and $1.0 billion at December 31, 2016 and January 2, 2016, respectively. At December 31, 2016, our current ratio (which is the ratio of our current assets to current liabilities) was 2.2:1 compared to 2.7:1 at January 2, 2016. Our current ratio decreased primarily due to a decrease in inventory of $114.2 million and $100.0 million of private placement debt moving from a long-term classification to a current classification at December 31, 2016 compared to January 2, 2016. The cash generated by our trade working capital accounts was used to supplement our debt reductions in fiscal 2016. The Company intends to use operating cash flow to meet its current debt repayment obligations.
The following table presents selected financial information and statistics as of December 31, 2016 and January 2, 2016 (in millions):
December 31 | January 2 | ||||||||
2016 | 2016 | ||||||||
Cash and Cash Equivalents | $ | 284.5 | $ | 252.9 | |||||
Trade Receivables, Net | 462.2 | 462.0 | |||||||
Inventories | 660.8 | 775.0 | |||||||
Working Capital | 830.4 | 1,022.4 | |||||||
Current Ratio | 2.2:1 | 2.7:1 | |||||||
At December 31, 2016, our cash and cash equivalents totaled $284.5 million. At December 31, 2016, $280.2 million of our cash was held by foreign subsidiaries and could be used in our domestic operations if necessary, but would be subject to repatriation taxes. There are no current trends, demands or uncertainties that we believe are reasonably likely to require repatriation or to have a material impact on our ability to fund US operations.
Substantially all of our expenses are paid in cash, often with payment term provisions that include early payment discounts and time elements. We believe that our ability to generate positive cash flow coupled with our available revolving credit balance will be sufficient to fund our operations for the foreseeable future. We focus on optimizing our investment in working capital through improved and enforced payment terms, maintaining an optimal level of inventory and operational efficiencies. Additionally, we believe that our capital expenditures for maintenance of equipment and facilities will be consistent with prior levels and not present a funding challenge.
We will, from time to time, maintain excess cash balances which may be used to (i) fund operations, (ii) repay outstanding debt, (iii) fund acquisitions, (iv) pay dividends, (v) make investments in new product development programs, (vi) repurchase our common stock, or (vii) fund other corporate objectives.
Pension Liabilities and Other Post Retirement Benefits
Pension and other post retirement benefits of $106.5 million at December 31, 2016 was consistent with the prior year amount of $105.9 million at January 2, 2016.
30
Credit Agreement
In connection with the PTS Acquisition, on January 30, 2015, we entered into a new Credit Agreement (the “Credit Agreement”) with JPMorgan Chase Bank, N.A., as Administrative Agent and the lenders named therein, providing for a (i) 5-year unsecured term loan facility in the principal amount of $1.25 billion (the “Term Facility”) and (ii) a 5-year unsecured multicurrency revolving facility in the principal amount of $500.0 million (the “Multicurrency Revolving Facility”), including a $100 million letter of credit sub facility available for general corporate purposes. The Credit Agreement replaced the Prior Credit Agreement, and the Multicurrency Revolving Facility replaced the Prior Revolving Facility (further discussed below).
The Term Facility was drawn in full on January 30, 2015 in connection with the closing of the PTS Acquisition. The loan under the Term Facility requires quarterly amortization at a rate starting at 5.0% per annum, increasing to 7.5% per annum after two years and further increasing to 10.0% per annum for the last two years of the Term Facility, unless previously prepaid. At December 31, 2016 we had borrowings under the Multicurrency Revolving Facility in the amount of $18.0 million, $32.1 million of standby letters of credit issued under the facility, and $449.9 million of available borrowing capacity. The Multicurrency Revolving Facility and the Term Facility balance of $798.1 million are included in Long-Term Debt on the Consolidated Balance Sheet as of December 31, 2016.
Borrowings under the Credit Agreement bear interest at floating rates based upon indices determined by the currency of the borrowing, plus an applicable margin determined by reference to our consolidated funded debt to consolidated EBITDA ratio or at an alternative base rate. The average daily balance in borrowings under the Multicurrency Revolving Facility was $21.0 million and the weighted average interest rate on the Multicurrency Revolving Facility was 2.2% for the year ended December 31, 2016. The weighted average interest rate on the Term Facility was 2.3% for the year ended December 31, 2016. The average daily balance in borrowings under the Multicurrency Revolving Facility was $48.2 million and the weighted average interest rate on the Multicurrency Revolving Facility was 1.9% for the year ended January 2, 2016. The weighted average interest rate on the Term Facility was 1.8% for the year ended January 2, 2016.We pay a non-use fee on the aggregate unused amount of the Multicurrency Revolving Facility at a rate determined by reference to its consolidated funded debt to consolidated EBITDA ratio.
The Credit Agreement requires that we prepay the loans under the Term Facility with 100% of the net cash proceeds received from specified asset sales and borrowed money indebtedness, subject to certain exceptions.
Senior Notes
At December 31, 2016, we had $600.0 million of unsecured senior notes (the “Notes”) outstanding. The Notes consist of (i) $500.0 million in senior notes (the “2011 Notes”) in a private placement which were issued in seven tranches with maturities from seven to twelve years and carry fixed interest rates and (ii) $100.0 million in senior notes (the “2007 Notes”) issued in 2007 with a floating interest rate based on a margin over the London Inter-Bank Offered Rate (“LIBOR”).
Details on the Notes at December 31, 2016 were (in millions):
Principal | Interest Rate | Maturity | ||||||
Floating Rate Series 2007A | 100.0 | Floating (1) | August 23, 2017 | |||||
Fixed Rate Series 2011A | 100.0 | 4.1% | July 14, 2018 | |||||
Fixed Rate Series 2011A | 230.0 | 4.8 to 5.0% | July 14, 2021 | |||||
Fixed Rate Series 2011A | 170.0 | 4.9 to 5.1% | July 14, 2023 | |||||
$ | 600.0 | |||||||
(1) Interest rates vary as LIBOR varies. The interest rate was 1.6% and 1.1% at December 31, 2016 and January 2, 2016 respectively. | |||||
We have an interest rate swap agreement to manage fluctuations in cash flows resulting from interest rate risk (see also Note 13 of Notes to the Consolidated Financial Statements).
Compliance with Financial Covenants
The Credit Agreement and the Notes require us to meet specified financial ratios and to satisfy certain financial condition tests. We were in compliance with all financial covenants contained in the Notes and the Credit Agreement as of December 31, 2016.
Prior Credit Agreement and Prior Revolving Facility
On June 30, 2011, we entered into a revolving credit agreement (the “Prior Credit Agreement”) that provided for an aggregate amount of availability under a revolving credit facility of $500.0 million, including a $100.0 million letter of credit sub facility
31
(the “Prior Revolving Facility”). The Prior Credit Agreement and Prior Revolving Facility were replaced with the new Credit Agreement (discussed above).
The Prior Revolving Facility permitted borrowing at interest rates based upon a margin above LIBOR. At January 3, 2015, we had $17.0 million outstanding on the Prior Revolving Facility. The balance on the Prior Revolving Facility was fully paid on January 27, 2015.
Other Notes Payable
At December 31, 2016, other notes payable $5.1 million were outstanding with a weighted average interest rate of 5.6%. At January 2, 2016, other notes payable of $15.5 million were outstanding with a weighted average rate of 2.5%.
Based on rates for instruments with comparable maturities and credit quality, which are classified as Level 2 inputs (see also Note 14 of Notes to the Consolidated Financial Statements), the approximate fair value of our total debt was $1,433.4 million and $1,758.2 million as of December 31, 2016 and January 2, 2016, respectively.
Litigation
One of our subsidiaries that we acquired in 2007 is subject to numerous claims filed in various jurisdictions relating to certain sub-fractional motors that were primarily manufactured through 2004 and that were included as components of residential and commercial ventilation units manufactured and sold in high volumes by a third party. These claims generally allege that the ventilation units were the cause of fires. Based on the current facts, we cannot assure you that these claims, individually or in the aggregate, will not have a material adverse effect on our subsidiary's results of operations, financial condition or cash flows. We cannot reasonably predict the outcome of these claims, the nature or extent of remedial actions, if any, our subsidiary, or we on their behalf, may need to undertake with respect to motors that remain in the field, or the costs that may be incurred, some of which could be significant.
We are, from time to time, party to other litigation that arises in the normal course of our business operations, including product warranty and liability claims, contract disputes and environmental, asbestos, intellectual property, employment and other litigation matters. Our products are used in a variety of industrial, commercial and residential applications that subject us to claims that the use of our products is alleged to have resulted in injury or other damage. We accrue for anticipated costs in pursuing or defending against such lawsuits in amounts that we believe are adequate, and we do not believe that the outcome of any such lawsuit will have a material effect on our results of operations, financial position or cash flows.
Off-Balance Sheet Arrangements, Contractual Obligations and Commercial Commitments
The following is a summary of our contractual obligations and payments due by period as of December 31, 2016 (in millions):
Payments Due by Period (1) | Debt Including Estimated Interest Payments (2) | Operating Leases | Pension Obligations | Purchase and Other Obligations | Total Contractual Obligations | ||||||||||||||||
Less than one year | $ | 143.9 | $ | 19.4 | $ | 4.4 | $ | 285.7 | $ | 453.4 | |||||||||||
1 - 3 years | 197.5 | 16.7 | 7.5 | — | 221.7 | ||||||||||||||||
3 - 5 years | 1,062.3 | 7.1 | 7.8 | — | 1,077.2 | ||||||||||||||||
More than 5 years | 186.5 | 4.8 | 16.9 | — | 208.2 | ||||||||||||||||
Total | $ | 1,590.2 | $ | 48.0 | $ | 36.6 | $ | 285.7 | $ | 1,960.5 | |||||||||||
(1) The timing and future spot prices affect the settlement values of our hedge obligations related to commodities, currency and interest rate swap agreements. Accordingly, these obligations are not included above in the table of contractual obligations (See also Item 7A and Note 13 of Notes to the Consolidated Financial Statements). The timing of settlement of our tax contingent liabilities cannot be reasonably determined and they are not included above in the table of contractual obligations. Future pension obligation payments after 2016 are subject to revaluation based on changes in the benefit population and/or changes in the value of pension assets based on market conditions that are not determinable as of December 31, 2016.
(2) Variable rate debt based on December 31, 2016 rates. See also Note 7 of Notes to the Consolidated Financial Statements.
32
We utilize blanket purchase orders (“blankets”) to communicate expected annual requirements to many of our suppliers. Requirements under blankets generally do not become “firm” until a varying number of weeks before our scheduled production. The purchase obligations shown in the above table represent the value we consider “firm.”
At December 31, 2016, we had outstanding standby letters of credit totaling approximately $32.1 million. We had no other material commercial commitments.
We did not have any material variable interest entities as of December 31, 2016 or January 2, 2016. Other than disclosed in the table above and the previous paragraph, we had no other material off-balance sheet arrangements.
Critical Accounting Policies
The preparation of our consolidated financial statements in accordance with accounting principles generally accepted in the United States requires us to make estimates and assumptions affecting the reported amounts of assets and liabilities at the date of the consolidated financial statements and revenues and expenses during the periods reported. Actual results could differ from those estimates. We believe the following critical accounting policies could have the most significant effect on our reported results.
Purchase Accounting and Business Combinations
Assets acquired and the liabilities assumed as part of a business combination are recognized separately from goodwill at their acquisition date fair values. Goodwill as of the acquisition date is measured as the excess of consideration transferred over the net of the acquisition date fair values of the assets acquired and the liabilities assumed. We, with the assistance of outside specialists as necessary, use estimates and assumptions to accurately value assets acquired and liabilities assumed at the acquisition date as well as contingent consideration, where applicable. We may refine these estimates during the measurement period which may be up to one year from the acquisition date. As a result, during the measurement period, we record adjustments to the assets acquired and liabilities assumed with the corresponding offset to goodwill. Upon the conclusion of the measurement period or final determination of the values of assets acquired or liabilities assumed, whichever comes first, any subsequent adjustments are recorded to our Consolidated Statements of Income.
Goodwill
We evaluate the carrying amount of goodwill annually, or more frequently if events or circumstances indicate that an asset might be impaired. When applying the accounting guidance, we use estimates to determine when it might be necessary to take an impairment charge. Factors that could trigger an impairment review include significant underperformance relative to historical or forecasted operating results, a significant decrease in the market value of an asset or significant negative industry or economic trends. For goodwill, we may perform a qualitative test to determine whether it is more-likely-than-not that the fair value of a reporting unit is less than its carrying amount as a basis for determining whether it is necessary to perform the quantitative goodwill impairment test. Based on prior goodwill impairment testing, we determined the performance of the quantitative impairment test was required for certain reporting units in 2016. We perform our required annual goodwill impairment test as of the end of the October fiscal month.
We use a weighting of the market approach and the income approach (discounted cash flow method) in testing goodwill for impairment. In the market approach, we apply performance multiples from comparable public companies, adjusted for relative risk, profitability, and growth considerations, to the reporting units to estimate fair value. The key assumptions used in the discounted cash flow method used to estimate fair value include discount rates, revenue and operating income projections and terminal value rates because such assumptions are the most sensitive and susceptible to change as they require significant management judgment. Discount rates are determined by using market and industry data as well as Company-specific risk factors for each reporting unit. The discount rate utilized for each reporting unit is indicative of the return an investor would expect to receive for investing in such a business. Terminal value rate determination follows common methodology of capturing the present value of perpetual cash flow estimates beyond the last projected period assuming a constant discount rate and long-term growth rates.
The calculated fair values for our 2016 impairment testing exceeded the carrying values of the reporting units for all of our reporting units. Throughout 2016, our PTS reporting unit, which is a combination of the acquired PTS business from Emerson Electric and our legacy PTS business, was impacted by declines in the oil and gas, distribution, and agricultural end-markets. The PTS reporting unit has goodwill of $570.8 million as of December 31, 2016. Our impairment test indicated the reporting unit’s implied fair value exceeded its book value by approximately 2%. Except for the reporting unit described above, there were no reporting units that had an estimated fair value less than 10% over carrying value. Some of the key considerations used in our impairment testing included (i) market pricing of guideline publicly traded companies (ii) cost of capital, including the risk-free interest rate, and (iii) recent historical and projected performance of the subject reporting unit. There is inherent uncertainty included in the assumptions used in goodwill impairment testing. A change to any of the assumptions could lead to a future impairment.
The calculated fair values for our 2015 impairment testing exceeded the carrying values of the reporting units for a majority of our reporting units. Our three largest reporting units comprise approximately 80.4% of consolidated goodwill and had a combined estimated fair value 37.4% higher than carrying value. There were certain reporting units (representing 8.2% of goodwill before
33
impairment) where the calculated fair values were less than the carrying values. The Commercial and Industrial Systems segment includes reporting units that have significant exposure to the volatility in the oil and gas industry. Crude oil prices remained depressed throughout 2015 with pronounced declines in the fourth quarter of 2015 and into 2016. Expected cash flows were also negatively impacted by lower gas and oil prices as lower prices decreased the capital spending of customers these reporting units serve. Weak economic conditions in China have contributed to the reduced expected cash flows for one of our reporting units in this region. An implied goodwill amount was calculated as a required second step in the testing, using the estimated fair value of all assets and liabilities of the reporting unit as if the unit had been acquired in a business combination. The resulting implied fair value of goodwill is a Level 3 asset measured at fair value on a non-recurring basis (see also Note 14 of the Notes to the Consolidated Financial Statements for fair value definitions). The total goodwill impairment charge related to these reporting units was $79.9 million and was recorded in Goodwill Impairment within the Consolidated Statements of Income. Except for the reporting units described above, there were no reporting units that had an estimated fair value less than 10% over carrying value.
We aggregate our business units by segment for reporting purposes and the majority of our goodwill is within our Power Transmissions Solutions segment (see also Note 5 of Notes to the Consolidated Financial Statements).
Long-Lived Assets
We evaluate the recoverability of the carrying amount of long-lived assets whenever events or changes in circumstance indicate that the carrying amount of an asset may not be fully recoverable through future cash flows. When applying the accounting guidance, we use estimates to determine when an impairment is necessary. Factors that could trigger an impairment review include a significant decrease in the market value of an asset or significant negative or economic trends (see also Note 5 of Notes to the Consolidated Financial Statements). For long-lived assets, the Company uses an estimate of the related undiscounted cash flows over the remaining life of the primary asset to estimate recoverability.
Indefinite-Lived Assets
Indefinite-lived intangible assets consist of the trade names associated with the acquired PTS business. They were evaluated for impairment as of November 5, 2016 using a relief from royalty method to determine whether their fair values exceed their respective carrying amounts. The Company determined the fair value of these assets using a royalty relief methodology similar to that employed when the associated assets were acquired, but using updated estimates of future sales, cash flows and profitability. For 2015 and 2016, the fair value of indefinite lived intangible assets exceeded their respective carrying value; however, in 2016, the fair value only exceeded the carrying value by approximately 2%. Some of the key considerations used in our impairment testing included (i) cost of capital, including the risk-free interest rate, (ii) royalty rate, and (iii) recent historical and projected performance of the subject reporting unit. There is inherent uncertainty included in the assumptions used in indefinite-lived intangible asset testing. A change to any of the assumptions could lead to a future impairment.
Retirement and Post Retirement Plans
Most of our domestic employees are participants in defined contribution plans and/or defined benefit pension plans. The defined benefit pension plans covering a majority of our domestic employees have been closed to new employees and frozen for existing employees. Certain employees are covered by a post retirement health care plan. Most of our foreign employees are covered by government sponsored plans in the countries in which they are employed. Our obligations under our defined benefit pension plans are determined with the assistance of actuarial firms. The actuaries make certain assumptions regarding such factors as withdrawal rates and mortality rates. The actuaries also provide information and recommendations from which management makes further assumptions on such factors as the long-term expected rate of return on plan assets, the discount rate on benefit obligations and where applicable, the rate of annual compensation increases.
Based upon the assumptions made, the investments made by the plans, overall conditions and movement in financial markets, particularly the stock market and how actual withdrawal rates, life-spans of benefit recipients and other factors differ from assumptions, annual expenses and recorded assets or liabilities of these defined benefit pension plans may change significantly from year to year.
We changed the method used to estimate the service and interest cost components of the net periodic pension and other post retirement benefit costs beginning in 2016. The new method uses the spot yield curve approach to estimate the service and interest costs by applying the specific spot rates along the yield curve used to determine the benefit obligations to relevant projected cash outflows. The current methodology for selecting the discount rate was to match the plan's cash flows to that of a theoretical bond portfolio yield curve used to measure the benefit obligation at the beginning of the period. The change will not affect the measurement of the total benefit obligations as the change in service and interest costs is offset in the actuarial gains and losses recorded in other comprehensive income. We are changing to the method to provide a more precise measure of interest and service costs by improving the correlation between the projected benefit cash flows and the discrete spot yield curve rates. The Company has accounted for
34
this change as a change in estimate prospectively and resulted in a $2.9 million reduction in expense for fiscal 2016 as compared to the previous method.
Further discussion of our accounting policies is contained in Note 3 of Notes to the Consolidated Financial Statements.
ITEM 7A - Quantitative and Qualitative Disclosures About Market Risk
We are exposed to market risk relating to our operations due to changes in interest rates, foreign currency exchange rates and commodity prices of purchased raw materials. We manage the exposure to these risks through a combination of normal operating and financing activities and derivative financial instruments such as interest rate swaps, commodity cash flow hedges and foreign currency forward exchange contracts. All hedging transactions are authorized and executed pursuant to clearly defined policies and procedures, which strictly prohibit the use of financial instruments for speculative purposes.
All qualified hedges are recorded on the balance sheet at fair value and are accounted for as cash flow hedges, with changes in fair value recorded in accumulated other comprehensive income (loss) (“AOCI”) in each accounting period. An ineffective portion of the hedges change in fair value, if any, is recorded in earnings in the period of change.
Interest Rate Risk
We are exposed to interest rate risk on certain of our short-term and long-term debt obligations used to finance our operations and acquisitions. At December 31, 2016, excluding the impact of interest rate swaps, we had $504.7 million of fixed rate debt and $916.5 million of variable rate debt. At January 2, 2016, excluding the impact of interest rate swaps, we had $505.6 million of fixed rate debt and $1,231.0 million of variable rate debt. We utilize interest rate swaps to manage fluctuations in cash flows resulting from exposure to interest rate risk on forecasted variable rate interest payments.
We have LIBOR-based floating rate borrowings, which expose us to variability in interest payments due to changes in interest rates. A hypothetical 10% change in our weighted average borrowing rate on outstanding variable rate debt at December 31, 2016 would result in a $1.1 million change in after-tax annualized earnings. We have entered into a pay fixed/receive LIBOR-based floating interest rate swap to manage fluctuations in cash flows resulting from interest rate risk. This interest rate swap has been designated as a cash flow hedge against forecasted LIBOR-based interest payments.
Details regarding the instruments, as of December 31, 2016, are as follows (in millions):
Notional | Rate | Rate | Fair Value | |||||||||
Instrument | Amount | Maturity | Paid | Received | (Loss) | |||||||
Swap | $100.0 | August 23, 2017 | 5.4% | LIBOR (3 month) | $ | (3.3 | ) | |||||
As of December 31, 2016, the interest rate swap liability of $(3.3) million was included in Hedging Obligations (current). As of January 2, 2016, the interest rate swap liability of $(7.8) million was included in Hedging Obligations. The unrealized loss on the effective portion of the contract net of tax of $(2.1) million and $(4.9) million as of December 31, 2016 and January 2, 2016, respectively, was recorded in AOCI.
Foreign Currency Risk
We are exposed to foreign currency risks that arise from normal business operations. These risks include the translation of local currency balances of foreign subsidiaries, intercompany loans with foreign subsidiaries and transactions denominated in foreign currencies. Our objective is to minimize our exposure to these risks through a combination of normal operating activities and the utilization of foreign currency exchange contracts to manage our exposure on the forecasted transactions denominated in currencies other than the applicable functional currency. Contracts are executed with credit worthy banks and are denominated in currencies of major industrial countries. We do not hedge our exposure to the translation of reported results of foreign subsidiaries from local currency to United States dollars.
As of December 31, 2016, derivative currency assets (liabilities) of $2.8 million, $0.4 million, $(45.7) million and $(17.6) million, are recorded in Prepaid Expenses and Other Current Assets, Other Noncurrent Assets, Hedging Obligations (current), and Hedging Obligations (noncurrent), respectively. As of January 2, 2016, derivative currency assets (liabilities) of $1.2 million, $1.0 million, $(30.8) million and $(19.8) million, are recorded in Prepaid Expenses and Other Current Assets, Other Noncurrent Assets, Hedging Obligations (current), and Hedging Obligations (noncurrent), respectively. The unrealized losses on the effective portion of the contracts of $(34.4) million net of tax, and $(29.8) million net of tax, as of December 31, 2016 and January 2, 2016, was recorded in AOCI. At December 31, 2016, we had $(8.0) million, net of tax, of currency losses on closed hedge instruments in AOCI that will be realized in earnings when the hedged items impact earnings.
The following table quantifies the outstanding currency forward and the corresponding impact on the value of these instruments assuming a hypothetical 10% appreciation/depreciation of their counter currency on December 31, 2016 (dollars in millions):
35
Foreign Exchange Gain (Loss) From: | ||||||||||||||||
Notional | Fair | 10% Appreciation of | 10% Depreciation of | |||||||||||||
Currency | Amount | Value | Counter Currency | Counter Currency | ||||||||||||
Mexican Peso | $ | 230.1 | $ | (48.0 | ) | $ | 23.0 | $ | (23.0 | ) | ||||||
Chinese Renminbi | 275.5 | (14.0 | ) | 27.6 | (27.6 | ) | ||||||||||
Indian Rupee | 43.6 | 1.0 | 4.4 | (4.4 | ) | |||||||||||
Euro | 69.0 | (0.7 | ) | 6.9 | (6.9 | ) | ||||||||||
Canadian Dollar | 41.8 | 1.2 | 4.2 | (4.2 | ) | |||||||||||
Australian Dollar | 12.1 | — | 1.2 | (1.2 | ) | |||||||||||
Thai Baht | 4.9 | — | 0.5 | (0.5 | ) | |||||||||||
Japanese Yen | 2.8 | 0.4 | 0.3 | (0.3 | ) | |||||||||||
Great Britain Pound | 4.3 | — | 0.4 | (0.4 | ) | |||||||||||
Gains and losses indicated in the sensitivity analysis would be offset by gains and losses on the underlying receivables and payables.
Commodity Price Risk
We periodically enter into commodity hedging transactions to reduce the impact of changing prices for certain commodities such as copper and aluminum based upon forecasted purchases of such commodities. Qualified hedge transactions are designated as cash flow hedges and the contract terms of commodity hedge instruments generally mirror those of the hedged item, providing a high degree of risk reduction and correlation.
Derivative commodity assets of $7.3 million are recorded in Prepaid Expenses at December 31, 2016. Derivative commodity assets (liabilities) of $5.2 million and $(13.9) million are recorded in Prepaid Expenses and Hedging Obligations (current) respectively, at January 2, 2016. The unrealized gain (loss) on the effective portion of the contracts of $2.9 million net of tax and $(5.4) million net of tax, as of December 31, 2016 and January 2, 2016, respectively, was recorded in AOCI. At December 31, 2016, we had an additional $0.5 million, net of tax, of derivative commodity gains on closed hedge instruments in AOCI that will be realized in earnings when the hedged items impact earnings.
The following table quantifies the outstanding commodity contracts intended to hedge raw material commodity prices and the corresponding impact on the value of these instruments assuming a hypothetical 10% appreciation/depreciation of their prices on December 31, 2016 (dollars in millions):
Gain (Loss) From: | ||||||||||||||||
Notional | Fair | 10% Appreciation of | 10% Depreciation of | |||||||||||||
Commodity | Amount | Value | Commodity Prices | Commodity Prices | ||||||||||||
Copper | $ | 50.7 | $ | 7.1 | $ | 5.1 | $ | (5.1 | ) | |||||||
Aluminum | 4.9 | 0.2 | 0.5 | (0.5 | ) | |||||||||||
Gains and losses indicated in the sensitivity analysis would be offset by the actual prices of the commodities.
The net AOCI balance related to hedging activities of $(41.1) million loss at December 31, 2016 includes $(24.1) million of net current deferred losses expected to be realized in the next twelve months.
Counterparty Risk
We are exposed to credit losses in the event of non-performance by the counterparties to various financial agreements, including our interest rate swap agreements, foreign currency exchange contracts and commodity hedging transactions. We manage exposure to counterparty credit risk by limiting our counterparties to major international banks and financial institutions meeting established credit guidelines and continually monitoring their compliance with the credit guidelines. We do not obtain collateral or other security to support financial instruments subject to credit risk. We do not anticipate non-performance by our counterparties, but cannot provide assurances.
36
ITEM 8 - Financial Statements and Supplementary Data
Quarterly Financial Information
(Unaudited)
(Amounts in Millions, Except per Share Data)
1st Quarter | 2nd Quarter | 3rd Quarter | 4th Quarter | ||||||||||||||||||||||||||||
2016 | 2015 | 2016 | 2015 | 2016 | 2015 | 2016 | 2015 | ||||||||||||||||||||||||
Net Sales | $ | 818.2 | $ | 911.7 | $ | 838.6 | $ | 942.2 | $ | 809.6 | $ | 882.3 | $ | 758.1 | $ | 773.5 | |||||||||||||||
Gross Profit | 217.4 | 220.9 | 222.9 | 251.4 | 231.7 | 241.1 | 193.2 | 219.8 | |||||||||||||||||||||||
Income (Loss) from Operations (1) | 69.3 | 63.6 | 91.4 | 103.2 | 89.8 | 100.1 | 70.1 | (14.1 | ) | ||||||||||||||||||||||
Net Income (Loss) (1) | 42.7 | 37.9 | 58.4 | 64.9 | 61.1 | 64.3 | 47.1 | (18.6 | ) | ||||||||||||||||||||||
Net Income (Loss) Attributable to Regal Beloit Corporation (1) | 41.6 | 36.4 | 56.6 | 62.8 | 59.6 | 63.4 | 45.6 | (19.3 | ) | ||||||||||||||||||||||
Earnings (Loss) Per Share Attributable to Regal Beloit Corporation (2). | |||||||||||||||||||||||||||||||
Basic | 0.93 | 0.81 | 1.27 | 1.40 | 1.33 | 1.42 | 1.02 | (0.43 | ) | ||||||||||||||||||||||
Assuming Dilution | 0.93 | 0.81 | 1.26 | 1.39 | 1.32 | 1.41 | 1.01 | (0.43 | ) | ||||||||||||||||||||||
Weighted Average Number of Shares Outstanding | |||||||||||||||||||||||||||||||
Basic | 44.7 | 44.7 | 44.7 | 44.8 | 44.8 | 44.8 | 44.8 | 44.7 | |||||||||||||||||||||||
Assuming Dilution | 45.0 | 45.1 | 45.0 | 45.2 | 45.0 | 45.1 | 45.1 | 44.7 | |||||||||||||||||||||||
Net Sales | |||||||||||||||||||||||||||||||
Commercial and Industrial Systems | $ | 377.6 | $ | 456.4 | $ | 394.7 | $ | 441.0 | $ | 389.4 | $ | 426.8 | $ | 369.2 | $ | 370.7 | |||||||||||||||
Climate Solutions | 239.8 | 280.4 | 254.5 | 286.1 | 250.5 | 264.4 | 215.2 | 210.3 | |||||||||||||||||||||||
Power Transmission Solutions | 200.8 | 174.9 | 189.4 | 215.1 | 169.7 | 191.1 | 173.7 | 192.5 | |||||||||||||||||||||||
Income (Loss) from Operations (1) | |||||||||||||||||||||||||||||||
Commercial and Industrial Systems | 21.7 | 33.3 | 25.1 | 41.5 | 36.2 | 38.8 | 20.5 | (59.7 | ) | ||||||||||||||||||||||
Climate Solutions | 24.6 | 33.4 | 36.1 | 43.7 | 42.2 | 40.7 | 27.0 | 28.9 | |||||||||||||||||||||||
Power Transmission Solutions | 23.0 | (3.1 | ) | 30.2 | 18.0 | 11.4 | 20.6 | 22.6 | 16.7 | ||||||||||||||||||||||
(1) Included in the fourth quarter 2015 results was a goodwill impairment of $79.9 million ($58.1 million after tax) included in the Commercial and Industrial Systems segment. | |||||||||||||||||||||||||||||||
(2) Due to the weighting of both earnings and the weighted average number of shares outstanding, the sum of the quarterly earnings per share may not equal the annual earnings per share. | |||||||||||||||||||||||||||||||
37
Management's Annual Report on Internal Control Over Financial Reporting
The management of Regal Beloit Corporation (the “Company”) is responsible for the accuracy and internal consistency of the preparation of the consolidated financial statements and footnotes contained in this annual report.
The Company's management is also responsible for establishing and maintaining adequate internal control over financial reporting. The Company operates under a system of internal accounting controls designed to provide reasonable assurance regarding the reliability of financial reporting and the preparation of published financial statements in accordance with generally accepted accounting principles. The internal accounting control system is evaluated for effectiveness by management and is tested, monitored and revised as necessary. All internal control systems, no matter how well designed, have inherent limitations. Therefore, even those systems determined to be effective can provide only reasonable assurance with respect to financial statement preparation and presentation.
The Company's management assessed the effectiveness of the Company's internal control over financial reporting as of December 31, 2016. In making its assessment, the Company's management used the criteria set forth by the Committee of Sponsoring Organizations of the Treadway Commission (COSO) in Internal Control-Integrated Framework (2013). Based on the results of its evaluation, the Company's management concluded that, as of December 31, 2016, the Company's internal control over financial reporting is effective at the reasonable assurance level based on those criteria.
Our internal control over financial reporting as of December 31, 2016 has been audited by Deloitte & Touche LLP, an independent registered public accounting firm, as stated in their report which is included herein.
March 1, 2017
38
REPORT OF INDEPENDENT REGISTERED PUBLIC ACCOUNTING FIRM
To the Board of Directors and Shareholders of Regal Beloit Corporation
Beloit, Wisconsin
We have audited the accompanying consolidated balance sheets of Regal Beloit Corporation and subsidiaries (the "Company") as of December 31, 2016 and January 2, 2016, and the related consolidated statements of income, comprehensive income, equity, and cash flows for each of the three years in the period ended December 31, 2016. Our audits also included the financial statement schedule listed in the Index at Item 15. We also have audited the Company's internal control over financial reporting as of December 31, 2016, based on the criteria established in Internal Control - Integrated Framework (2013) issued by the Committee of Sponsoring Organizations of the Treadway Commission. The Company's management is responsible for these financial statements and financial statement schedule, for maintaining effective internal control over financial reporting, and for its assessment of the effectiveness of internal control over financial reporting, included in the accompanying Management’s Annual Report on Internal Control Over Financial Reporting. Our responsibility is to express an opinion on these financial statements and financial statement schedule and an opinion on the Company's internal control over financial reporting based on our audits.
We conducted our audits in accordance with the standards of the Public Company Accounting Oversight Board (United States). Those standards require that we plan and perform the audit to obtain reasonable assurance about whether the financial statements are free of material misstatement and whether effective internal control over financial reporting was maintained in all material respects. Our audits of the financial statements included examining, on a test basis, evidence supporting the amounts and disclosures in the financial statements, assessing the accounting principles used and significant estimates made by management, and evaluating the overall financial statement presentation. Our audit of internal control over financial reporting included obtaining an understanding of internal control over financial reporting, assessing the risk that a material weakness exists, and testing and evaluating the design and operating effectiveness of internal control based on the assessed risk. Our audits also included performing such other procedures as we considered necessary in the circumstances. We believe that our audits provide a reasonable basis for our opinions.
A company's internal control over financial reporting is a process designed by, or under the supervision of, the company's principal executive and principal financial officers, or persons performing similar functions, and effected by the company's board of directors, management, and other personnel to provide reasonable assurance regarding the reliability of financial reporting and the preparation of financial statements for external purposes in accordance with generally accepted accounting principles. A company's internal control over financial reporting includes those policies and procedures that (1) pertain to the maintenance of records that, in reasonable detail, accurately and fairly reflect the transactions and dispositions of the assets of the company; (2) provide reasonable assurance that transactions are recorded as necessary to permit preparation of financial statements in accordance with generally accepted accounting principles and that receipts and expenditures of the company are being made only in accordance with authorizations of management and directors of the company; and (3) provide reasonable assurance regarding prevention or timely detection of unauthorized acquisition, use, or disposition of the company's assets that could have a material effect on the financial statements.
Because of the inherent limitations of internal control over financial reporting, including the possibility of collusion or improper management override of controls, material misstatements due to error or fraud may not be prevented or detected on a timely basis. Also, projections of any evaluation of the effectiveness of the internal control over financial reporting to future periods are subject to the risk that the controls may become inadequate because of changes in conditions, or that the degree of compliance with the policies or procedures may deteriorate.
In our opinion, the consolidated financial statements referred to above present fairly, in all material respects, the financial position of Regal Beloit Corporation and subsidiaries as of December 31, 2016 and January 2, 2016, and the results of their operations and their cash flows for each of the three years in the period ended December 31, 2016, in conformity with accounting principles generally accepted in the United States of America. Also, in our opinion, such financial statement schedule, when considered in relation to the basic consolidated financial statements taken as a whole, presents fairly, in all material respects, the information set forth therein. Also, in our opinion, the Company maintained, in all material respects, effective internal control over financial reporting as of December 31, 2016 based on the criteria established in Internal Control - Integrated Framework (2013) issued by the Committee of Sponsoring Organizations of the Treadway Commission.
/s/ Deloitte & Touche LLP
Milwaukee, Wisconsin
March 1, 2017
39
REGAL BELOIT CORPORATION
CONSOLIDATED STATEMENTS OF INCOME
(Amounts in Millions, Except Per Share Data)
For the Year Ended | |||||||||||||
December 31, 2016 | January 2, 2016 | January 3, 2015 | |||||||||||
Net Sales | $ | 3,224.5 | $ | 3,509.7 | $ | 3,257.1 | |||||||
Cost of Sales | 2,359.3 | 2,576.5 | 2,459.8 | ||||||||||
Gross Profit | 865.2 | 933.2 | 797.3 | ||||||||||
Operating Expenses | 544.6 | 600.5 | 516.3 | ||||||||||
Goodwill Impairment | — | 79.9 | 119.5 | ||||||||||
Asset Impairments | — | — | 40.0 | ||||||||||
Total Operating Expenses | 544.6 | 680.4 | 675.8 | ||||||||||
Income from Operations | 320.6 | 252.8 | 121.5 | ||||||||||
Interest Expense | 58.7 | 60.2 | 39.1 | ||||||||||
Interest Income | 4.5 | 4.3 | 7.9 | ||||||||||
Income before Taxes | 266.4 | 196.9 | 90.3 | ||||||||||
Provision for Income Taxes | 57.1 | 48.4 | 54.2 | ||||||||||
Net Income | 209.3 | 148.5 | 36.1 | ||||||||||
Less: Net Income Attributable to Noncontrolling Interests | 5.9 | 5.2 | 5.1 | ||||||||||
Net Income Attributable to Regal Beloit Corporation | $ | 203.4 | $ | 143.3 | $ | 31.0 | |||||||
Earnings Per Share Attributable to Regal Beloit Corporation: | |||||||||||||
Basic | $ | 4.55 | $ | 3.21 | $ | 0.69 | |||||||
Assuming Dilution | $ | 4.52 | $ | 3.18 | $ | 0.69 | |||||||
Weighted Average Number of Shares Outstanding: | |||||||||||||
Basic | 44.7 | 44.7 | 45.0 | ||||||||||
Assuming Dilution | 45.0 | 45.1 | 45.3 | ||||||||||
See accompanying Notes to the Consolidated Financial Statements.
40
REGAL BELOIT CORPORATION
CONSOLIDATED STATEMENTS OF COMPREHENSIVE INCOME
(Dollars in Millions)
For the Year Ended | |||||||||||||||||||||||
December 31, 2016 | January 2, 2016 | January 3, 2015 | |||||||||||||||||||||
Net Income | $ | 209.3 | $ | 148.5 | $ | 36.1 | |||||||||||||||||
Other Comprehensive Income (Loss) Net of Tax: | |||||||||||||||||||||||
Translation: | |||||||||||||||||||||||
Foreign Currency Translation Adjustments | (68.2 | ) | (94.5 | ) | (55.5 | ) | |||||||||||||||||
Reclassification of Foreign Currency Translation Adjustments Included in Net Income, Net of Immaterial Tax Effects | — | — | (1.0 | ) | |||||||||||||||||||
Hedging Activities: | |||||||||||||||||||||||
Decrease in Fair Value of Hedging Activities, Net of Tax Effects of $(15.2) Million in 2016, $(26.6) Million in 2015 and $(16.9) Million in 2014 | $ | (24.8 | ) | $ | (43.3 | ) | $ | (27.6 | ) | ||||||||||||||
Reclassification of Losses Included in Net Income, Net of Tax Effects of $19.1 Million in 2016, $16.5 Million in 2015, and $3.7 Million in 2014 | 31.2 | 6.4 | 26.8 | (16.5 | ) | 6.1 | (21.5 | ) | |||||||||||||||
Pension and Post Retirement Plans: | |||||||||||||||||||||||
Decrease (Increase) in Prior Service Cost and Unrecognized Gain (Loss), Net of Tax Effects of $(1.5) Million in 2016, $1.8 Million in 2015 and $(10.2) Million in 2014 | (2.8 | ) | 1.2 | (17.6 | ) | ||||||||||||||||||
Amortization of Prior Service Cost and Unrecognized Loss Included in Net Periodic Pension Cost, Net of Tax Effects of $1.2 Million in 2016, $1.6 Million in 2015 and $1.1 Million in 2014 | 2.2 | (0.6 | ) | 2.9 | 4.1 | 1.4 | (16.2 | ) | |||||||||||||||
Other Comprehensive Income (Loss) | (62.4 | ) | (106.9 | ) | (94.2 | ) | |||||||||||||||||
Comprehensive Income (Loss) | 146.9 | 41.6 | (58.1 | ) | |||||||||||||||||||
Less: Comprehensive Income Attributable to Noncontrolling Interest | 3.9 | 2.3 | 2.1 | ||||||||||||||||||||
Comprehensive Income (Loss)Attributable to Regal Beloit Corporation | $ | 143.0 | $ | 39.3 | $ | (60.2 | ) | ||||||||||||||||
See accompanying Notes to the Consolidated Financial Statements.
41
REGAL BELOIT CORPORATION
CONSOLIDATED BALANCE SHEETS
(Dollars in Millions, Except Per Share Data)
December 31, 2016 | January 2, 2016 | |||||||
ASSETS | ||||||||
Current Assets: | ||||||||
Cash and Cash Equivalents | $ | 284.5 | $ | 252.9 | ||||
Trade Receivables, Less Allowances of $11.5 Million in 2016 and $11.3 Million in 2015 | 462.2 | 462.0 | ||||||
Inventories | 660.8 | 775.0 | ||||||
Prepaid Expenses and Other Current Assets | 124.5 | 145.3 | ||||||
Total Current Assets | 1,532.0 | 1,635.2 | ||||||
Net Property, Plant and Equipment | 627.5 | 678.5 | ||||||
Goodwill | 1,453.2 | 1,465.6 | ||||||
Intangible Assets, Net of Amortization | 711.7 | 777.8 | ||||||
Deferred Income Tax Benefits | 22.4 | 18.6 | ||||||
Other Noncurrent Assets | 11.7 | 16.0 | ||||||
Total Assets | $ | 4,358.5 | $ | 4,591.7 | ||||
LIABILITIES AND EQUITY | ||||||||
Current Liabilities: | ||||||||
Accounts Payable | $ | 334.2 | $ | 336.2 | ||||
Dividends Payable | 10.7 | 10.3 | ||||||
Hedging Obligations | 49.0 | 44.7 | ||||||
Accrued Compensation and Employee Benefits | 70.1 | 80.6 | ||||||
Other Accrued Expenses | 137.0 | 134.7 | ||||||
Current Maturities of Long-Term Debt | 100.6 | 6.3 | ||||||
Total Current Liabilities | 701.6 | 612.8 | ||||||
Long-Term Debt | 1,310.9 | 1,715.6 | ||||||
Deferred Income Taxes | 97.7 | 100.9 | ||||||
Hedging Obligations | 17.6 | 27.6 | ||||||
Pension and Other Post Retirement Benefits | 106.5 | 105.9 | ||||||
Other Noncurrent Liabilities | 46.0 | 46.1 | ||||||
Contingencies and Commitments (see Note 11) | ||||||||
Equity: | ||||||||
Regal Beloit Corporation Shareholders' Equity: | ||||||||
Common Stock, $.01 Par Value, 100.0 Million Shares Authorized, 44.8 Million and 44.7 Million Shares Issued and Outstanding at 2016 and 2015, Respectively | 0.4 | 0.4 | ||||||
Additional Paid-In Capital | 904.5 | 900.8 | ||||||
Retained Earnings | 1,452.0 | 1,291.1 | ||||||
Accumulated Other Comprehensive Loss | (318.1 | ) | (255.0 | ) | ||||
Total Regal Beloit Corporation Shareholders' Equity | 2,038.8 | 1,937.3 | ||||||
Noncontrolling Interests | 39.4 | 45.5 | ||||||
Total Equity | 2,078.2 | 1,982.8 | ||||||
Total Liabilities and Equity | $ | 4,358.5 | $ | 4,591.7 | ||||
See accompanying Notes to the Consolidated Financial Statements.
42
REGAL BELOIT CORPORATION
CONSOLIDATED STATEMENTS OF EQUITY
(Dollars in Millions, Except Per Share Data)
Common Stock $.01 Par Value | Additional Paid-In Capital | Retained Earnings | Accumulated Other Comprehensive Income (Loss) | Noncontrolling Interests | Total Equity | ||||||||||||||||||
Balance as of December 28, 2013 | $ | 0.5 | $ | 916.1 | $ | 1,199.4 | $ | (59.8 | ) | $ | 46.2 | $ | 2,102.4 | ||||||||||
Net Income | — | — | 31.0 | — | 5.1 | 36.1 | |||||||||||||||||
Other Comprehensive Income (Loss) | (91.2 | ) | (3.0 | ) | (94.2 | ) | |||||||||||||||||
Dividends Declared ($0.86 Per Share) | — | — | (38.6 | ) | — | — | (38.6 | ) | |||||||||||||||
Stock Options Exercised, Including Income Tax Benefit and Share Cancellations | — | 0.1 | — | — | — | 0.1 | |||||||||||||||||
Share-Based Compensation | — | 11.9 | — | — | — | 11.9 | |||||||||||||||||
Stock Repurchase | (0.1 | ) | (32.0 | ) | (2.9 | ) | — | — | (35.0 | ) | |||||||||||||
Sale of Joint Venture | — | — | — | — | (3.1 | ) | (3.1 | ) | |||||||||||||||
Dividends Declared to Noncontrolling Interests | — | — | — | — | (0.3 | ) | (0.3 | ) | |||||||||||||||
Balance as of January 3, 2015 | $ | 0.4 | $ | 896.1 | $ | 1,188.9 | $ | (151.0 | ) | $ | 44.9 | $ | 1,979.3 | ||||||||||
Net Income | — | — | 143.3 | — | 5.2 | 148.5 | |||||||||||||||||
Other Comprehensive Income (Loss) | — | — | — | (104.0 | ) | (2.9 | ) | (106.9 | ) | ||||||||||||||
Dividends Declared ($0.91 Per Share) | — | — | (40.7 | ) | — | — | (40.7 | ) | |||||||||||||||
Stock Options Exercised, Including Income Tax Benefit and Share Cancellations | — | 2.4 | — | — | — | 2.4 | |||||||||||||||||
Share-Based Compensation | — | 13.9 | — | — | — | 13.9 | |||||||||||||||||
Stock Repurchase | — | (11.6 | ) | (0.4 | ) | (12.0 | ) | ||||||||||||||||
Purchase of Subsidiary Shares from Noncontrolling Interest | — | — | — | — | (1.4 | ) | (1.4 | ) | |||||||||||||||
Dividends Declared to Noncontrolling Interests | — | — | — | — | (0.3 | ) | (0.3 | ) | |||||||||||||||
Balance as of January 2, 2016 | $ | 0.4 | $ | 900.8 | $ | 1,291.1 | $ | (255.0 | ) | $ | 45.5 | $ | 1,982.8 | ||||||||||
Net Income | — | — | 203.4 | — | 5.9 | 209.3 | |||||||||||||||||
Other Comprehensive Income (Loss) | — | — | — | (60.4 | ) | (2.0 | ) | (62.4 | ) | ||||||||||||||
Dividends Declared ($0.95 Per Share) | — | — | (42.5 | ) | — | — | (42.5 | ) | |||||||||||||||
Stock Options Exercised, Including Income Tax Benefit and Share Cancellations | — | (2.4 | ) | — | — | — | (2.4 | ) | |||||||||||||||
Share-Based Compensation | — | 13.3 | — | — | — | 13.3 | |||||||||||||||||
Purchase of Subsidiary Shares from Noncontrolling Interest | — | (7.2 | ) | — | (2.7 | ) | (9.7 | ) | (19.6 | ) | |||||||||||||
Dividends Declared to Non-Controlling Interests | — | — | — | — | (0.3 | ) | (0.3 | ) | |||||||||||||||
Balance as of December 31, 2016 | $ | 0.4 | $ | 904.5 | $ | 1,452.0 | $ | (318.1 | ) | $ | 39.4 | $ | 2,078.2 | ||||||||||
See accompanying Notes to the Consolidated Financial Statements.
43
REGAL BELOIT CORPORATION
CONSOLIDATED STATEMENTS OF CASH FLOWS
(Dollars in Millions)
For the Year Ended | ||||||||||||
December 31, 2016 | January 2, 2016 | January 3, 2015 | ||||||||||
CASH FLOWS FROM OPERATING ACTIVITIES: | ||||||||||||
Net Income | $ | 209.3 | $ | 148.5 | $ | 36.1 | ||||||
Adjustments to Reconcile Net Income to Net Cash Provided by Operating Activities (Net of Acquisitions and Divestitures): | ||||||||||||
Depreciation | 93.4 | 95.5 | 92.0 | |||||||||
Amortization | 62.0 | 63.9 | 46.7 | |||||||||
Goodwill Impairment | — | 79.9 | 119.5 | |||||||||
Asset Impairments | — | — | 40.0 | |||||||||
Share-Based Compensation Expense | 13.3 | 13.9 | 11.9 | |||||||||
Benefit from Deferred Income Taxes | (1.6 | ) | (10.4 | ) | (26.4 | ) | ||||||
Excess Tax Benefits from Share-Based Compensation | — | (1.3 | ) | (1.3 | ) | |||||||
Loss on Venezuela Currency Devaluation | — | 1.5 | 10.4 | |||||||||
Loss (Gain) on Disposition of Assets | 1.1 | 2.4 | (12.1 | ) | ||||||||
Loss on Sale of Consolidated Joint Venture | — | — | 1.9 | |||||||||
Provision for Losses on Receivables | 1.6 | 12.2 | 19.5 | |||||||||
Gain on Sale of Business | (11.6 | ) | — | — | ||||||||
Change in Operating Assets and Liabilities, Net of Acquisitions and Divestitures | ||||||||||||
Receivables | (10.4 | ) | 28.6 | (3.4 | ) | |||||||
Inventories | 100.4 | 11.1 | (55.4 | ) | ||||||||
Accounts Payable | 7.6 | (22.3 | ) | 6.9 | ||||||||
Current Liabilities and Other | (25.5 | ) | (42.4 | ) | 11.9 | |||||||
Net Cash Provided by Operating Activities | 439.6 | 381.1 | 298.2 | |||||||||
CASH FLOWS FROM INVESTING ACTIVITIES: | ||||||||||||
Additions to Property, Plant and Equipment | (65.2 | ) | (92.2 | ) | (83.6 | ) | ||||||
Purchases of Investment Securities | (53.7 | ) | (55.4 | ) | (46.7 | ) | ||||||
Sales of Investment Securities | 72.6 | 45.6 | 44.8 | |||||||||
Business Acquisitions, Net of Cash Acquired | — | (1,401.4 | ) | (128.2 | ) | |||||||
Additions of Equipment for Operating Leases | — | — | (4.6 | ) | ||||||||
Proceeds from Disposal of Business | 24.6 | — | — | |||||||||
Proceeds from Sale of Consolidated Joint Venture | — | — | 0.9 | |||||||||
Proceeds from Sale of Assets | 2.1 | 15.8 | 12.5 | |||||||||
Net Cash Used in Investing Activities | (19.6 | ) | (1,487.6 | ) | (204.9 | ) | ||||||
CASH FLOWS FROM FINANCING ACTIVITIES: | ||||||||||||
Borrowings Under Revolving Credit Facility | 583.7 | 512.0 | 296.2 | |||||||||
Repayments Under Revolving Credit Facility | (568.7 | ) | (526.0 | ) | (279.2 | ) | ||||||
Proceeds from Short-Term Borrowings | 23.8 | 126.1 | 62.1 | |||||||||
Repayments of Short-Term Borrowings | (30.5 | ) | (126.7 | ) | (61.9 | ) | ||||||
Proceeds from Long-Term Debt | 0.2 | 1,250.0 | — | |||||||||
Repayments of Long-Term Debt | (323.8 | ) | (132.3 | ) | (150.4 | ) | ||||||
Dividends Paid to Shareholders | (42.1 | ) | (40.2 | ) | (37.8 | ) | ||||||
Proceeds from the Exercise of Stock Options | 0.5 | 4.1 | 0.9 | |||||||||
Excess Tax Benefits from Share-Based Compensation | — | 1.3 | 1.3 | |||||||||
Payments of Deferred Purchase Price | — | — | (5.3 | ) | ||||||||
Purchase of Subsidiary Shares from Noncontrolling Interest | (19.6 | ) | (1.4 | ) | — | |||||||
Financing Fees Paid | — | (18.0 | ) | — | ||||||||
Repurchase of Common Stock | — | (12.0 | ) | (35.0 | ) | |||||||
Payments of Contingent Consideration | — | — | (8.6 | ) | ||||||||
Distribution to Noncontrolling Interests | (0.3 | ) | (0.3 | ) | (0.3 | ) | ||||||
Net Cash Provided by (Used in) Financing Activities | (376.8 | ) | 1,036.6 | (218.0 | ) | |||||||
EFFECT OF EXCHANGE RATES ON CASH and CASH EQUIVALENTS | (11.6 | ) | (11.3 | ) | (7.2 | ) | ||||||
Net (Decrease) Increase in Cash and Cash Equivalents | 31.6 | (81.2 | ) | (131.9 | ) | |||||||
Cash and Cash Equivalents at Beginning of Period | 252.9 | 334.1 | 466.0 | |||||||||
Cash and Cash Equivalents at End of Period | $ | 284.5 | $ | 252.9 | $ | 334.1 | ||||||
SUPPLEMENTAL DISCLOSURES OF CASH FLOW INFORMATION: | ||||||||||||
Cash Paid During the Year for: | ||||||||||||
Interest | $ | 53.7 | $ | 54.6 | $ | 39.9 | ||||||
Income Taxes | 66.9 | 70.1 | 58.2 | |||||||||
See accompanying Notes to the Consolidated Financial Statements.
44
Notes to the Consolidated Financial Statements
(1) Nature of Operations
Regal Beloit Corporation (the “Company”) is a United States based multi-national corporation. The Company reports in three operating segments, the Commercial and Industrial Systems segment, with its principal lines of business in medium and large electric motors, power generation products, high-performance drives and controls and capacitors; the Climate Solutions segment, with its principal lines of business in small motors, controls and air moving products; and the Power Transmission Solutions segment, with its principal lines of business in power transmission gearing, hydraulic pump drives, large open gearing and specialty mechanical products which control motion and torque.
(2) Basis of Presentation
The Company operates on a 52/53 week fiscal year ending on the Saturday closest to December 31. The fiscal year ended December 31, 2016 was 52 weeks, the fiscal year ended January 2, 2016 was 52 weeks and the fiscal year ended January 3, 2015 was 53 weeks.
(3) Accounting Policies
Principles of Consolidation
The consolidated financial statements include the accounts of the Company and its wholly owned and majority-owned subsidiaries. In addition, the Company has joint ventures that are consolidated in accordance with consolidation accounting guidance. All intercompany accounts and transactions are eliminated.
Accounting for Highly Inflationary Economies
The Company had a subsidiary in Venezuela using accounting for highly inflationary economies. Currency restrictions enacted by the Venezuelan government impacted the ability of the Company's subsidiary to obtain US dollars in exchange for Venezuelan bolivars fuertes ("Bolivars") at the official foreign exchange rate. In 2014, the Venezuelan government announced the expansion of its auction-based foreign exchange system (SICAD1). The Venezuelan government also introduced an additional auction-based foreign exchange system (SICAD2) which permitted all companies incorporated or domiciled in Venezuela to bid for US dollars. Effective January 3, 2015, the Company concluded that it was appropriate to apply the SICAD2 exchange rate of 51.0 Bolivars per US dollar as the Company believed that this rate best represented the economics of the business activity in Venezuela at that time. As a result, the Company recorded a $10.4 million pretax devaluation charge in the fourth quarter of 2014.
During the first quarter of 2015, the Venezuelan government announced changes to its exchange rate system that included the launch of a new, market-based system known as the SIMADI. The Company adopted the SIMADI rate after its introduction. The SIMADI exchange rate was approximately 193 Venezuelan Bolivars to the US dollar as of April 4, 2015. The adoption of the SIMADI resulted in a $1.5 million pretax devaluation charge included in Operating Expenses during the first quarter 2015.
In late 2015, the Company decided to cease doing business in Venezuela due to the inability of collecting payments on its receivables from certain customers in Venezuela, the difficulties in obtaining local currency and the increased economic uncertainty in that country. In the fourth quarter of fiscal 2015, in connection with the decision to cease doing business in Venezuela, the Company wrote off net assets of $12.8 million.
Use of Estimates
The consolidated financial statements have been prepared in accordance with accounting principles generally accepted in the United States (“US GAAP”), which require the Company to make estimates and assumptions that affect the reported amounts of assets and liabilities at the date of the consolidated financial statements and revenues and expenses during the periods reported. Actual results could differ from those estimates. The Company uses estimates in accounting for, among other items, allowance for doubtful accounts; excess and obsolete inventory; share-based compensation; acquisitions; product warranty obligations; pension and post retirement assets and liabilities; derivative fair values; goodwill and other asset impairments; health care reserves; rebates and incentives; litigation claims and contingencies, including environmental matters; and income taxes. The Company accounts for changes to estimates and assumptions when warranted by factually based experience.
Acquisitions
The Company recognizes assets acquired, liabilities assumed, contractual contingencies and contingent consideration at their fair value on the acquisition date. The operating results of the acquired companies are included in the Company’s consolidated financial
45
statements from the date of acquisition.
Acquisition-related costs are expensed as incurred, restructuring costs are recognized as post-acquisition expense and changes in deferred tax asset valuation allowances and income tax uncertainties after the measurement period are recorded in Provision for Income Taxes.
Revenue Recognition
The Company generally recognizes revenue upon transfer of title, which generally occurs upon shipment of the product to the customer. The pricing of products sold is generally supported by customer purchase orders, and accounts receivable collection is reasonably assured at the time of shipment. Estimated discounts and rebates are recorded as a reduction of gross sales in the same period revenue is recognized. Product returns and credits are estimated and recorded at the time of shipment based upon historical experience. Shipping and handling costs are recorded as revenue when billed to the customers. The costs incurred from shipping are recorded in Cost of Sales and handling costs incurred in connection with selling and distribution activities are recorded in Operating Expenses.
The Company has certain operating leases in the oil and gas industry where revenue is recognized over the term of the lease. The lease revenue is not material for all fiscal periods presented. The related net leased assets were not material at December 31, 2016 or January 2, 2016 and were included in Other Noncurrent Assets.
The Company derives a significant portion of its revenues from several original equipment manufacturing customers. Despite this relative concentration, there were no customers that accounted for more than 10% of consolidated net sales in fiscal 2016, fiscal 2015 or fiscal 2014.
Research and Development
The Company performs research and development activities relating to new product development and the improvement of current products. The Company's research and development expenses consist primarily of costs for: (i) salaries and related personnel expenses; (ii) the design and development of new energy efficient products and enhancements; (iii) quality assurance and testing; and (iv) other related overhead. The Company's research and development efforts tend to be targeted toward developing new products that would allow it to gain additional market share, whether in new or existing segments. While these costs make up an insignificant portion of operating expenses in the Power Transmission Solutions segment, they are more substantial in the Climate Solutions and Commercial and Industrial Systems segments. In particular, a large driver of research and development efforts in the Climate Solutions and Commercial and Industrial Systems segments is energy efficiency.
Research and development costs are expensed as incurred. For fiscal 2016, 2015 and 2014, research and development costs were $29.5 million, $30.1 million and $32.9 million, respectively. Research and development costs are recorded in Operating Expenses.
Cash and Cash Equivalents
Cash equivalents consist of highly liquid investments which are readily convertible to cash, present insignificant risk of changes in value due to interest rate fluctuations and have original or purchased maturities of three months or less.
Concentration of Credit Risk
Financial instruments that potentially subject the Company to significant concentrations of credit risk consist principally of cash equivalents. The Company has material deposits with global financial institutions. The Company performs periodic evaluations of the relative credit standing of its financial institutions and monitors the amount of exposure.
Concentration of credit risk with respect to trade accounts receivable is limited due to the large number of customers and their dispersion across many geographic areas. The Company monitors credit risk associated with its trade receivables.
Investments
Investments include term deposits which have original maturities of greater than three months and remaining maturities of less than one year. The fair value of term deposits approximates their carrying value. These investments are included in Prepaid Expenses and Other Current Assets on the Company's Consolidated Balance Sheets.
Trade Receivables
Trade receivables are stated at estimated net realizable value. Trade receivables are comprised of balances due from customers, net of estimated allowances. In estimating losses inherent in trade receivables the Company uses historical loss experiences and applies them to a related aging analysis. Determination of the proper level of allowances requires management to exercise significant judgment about the timing, frequency and severity of losses. The allowances for doubtful accounts take into consideration numerous quantitative and qualitative factors, including historical loss experience, collection experience, delinquency trends and economic conditions.
In circumstances where the Company is aware of a specific customer's inability to meet its obligation, a specific reserve is recorded
46
against amounts receivable to reduce the net recognized receivable to the amount reasonably expected to be collected. Additions to the allowances for doubtful accounts are maintained through adjustments to the provision for doubtful accounts, which are charged to Operating Expenses in the current period; amounts determined to be uncollectable are charged directly against the allowances, while amounts recovered on previously charged-off accounts benefit current period earnings.
Inventories
The major classes of inventory at year end are as follows:
December 31, 2016 | January 2, 2016 | ||||
Raw Material and Work in Process | 45 | % | 45 | % | |
Finished Goods and Purchased Parts | 55 | % | 55 | % | |
Inventories are stated at cost, which is not in excess of market. Cost for approximately 55% of the Company's inventory at December 31, 2016 and 42% at January 2, 2016 was determined using the last-in, first-out ("LIFO") method. If all inventories were valued on the first-in, first-out ("FIFO") method, they would have increased by $43.7 million and $28.0 million as of December 31, 2016 and January 2, 2016, respectively. Material, labor and factory overhead costs are included in the inventories.
The Company reviews inventories for excess and obsolete products or components. Based on an analysis of historical usage and management's evaluation of estimated future demand, market conditions and alternative uses for possible excess or obsolete parts, the Company records an excess and obsolete reserve.
As of the beginning of its fiscal year 2016, the Company changed its inventory valuation method for the US inventory of the recently acquired Power Transmission Solutions (“PTS”) business to the LIFO method from the FIFO method. This change affected approximately 9% of the Company’s inventory. The Company believed this change in accounting principle was preferable under the circumstances because LIFO would better match current costs with current revenues since the cost of raw materials has been volatile in recent years, resulting in greater consistency in inventory costing across the organization since LIFO is the method used for the majority of the Company's other US inventory, and better aligns with how management assesses the performance of the business. Because this change in accounting principle was immaterial in all annual or interim prior periods, it was not applied retrospectively. The change did not have a material impact on the consolidated financial statements for the year ended December 31, 2016.
Also, as of the beginning of its fiscal year 2016, the Company changed its method of calculating LIFO inventories, which represented approximately 51% of the Company’s inventory. The Company reduced the number of LIFO inventory pools to three to align with the Company’s segments. Previously, the Company had 10 LIFO inventory pools, some of which crossed segments. The Company believed this change in accounting principle was preferable under the circumstances because fewer pools will simplify the LIFO calculations, combine inventory items with similarities within a segment, and better align with how management assesses the performance of the businesses. The Company determined that it had the data needed to apply this change in accounting principle prospectively as of the beginning of its fiscal year 2014, but that full retrospective application is impracticable because the data is not available to determine the cumulative effect of the change. Because the effect of applying the change prospectively as of the beginning of fiscal 2014 is immaterial in any annual or interim period in fiscal years 2014 or 2015, the Company applied this change in accounting principle prospectively from the first day of fiscal year 2016. The change did not have a material impact on the consolidated financial statements for the year ended December 31, 2016.
Property, Plant and Equipment
Property, Plant and Equipment are stated at cost. Depreciation of plant and equipment is provided principally on a straight-line basis over the estimated useful lives (3 to 50 years) of the depreciable assets. Accelerated methods are used for income tax purposes.
Expenditures for repairs and maintenance are charged to expense when incurred. Expenditures which extend the useful lives of existing equipment are capitalized and depreciated.
Upon retirement or disposition of property and equipment, the cost and related accumulated depreciation are removed from the accounts and any resulting gain or loss is recognized. Leasehold improvements are capitalized and amortized over the lesser of the life of the lease or the estimated useful life of the asset.
47
Property, plant and equipment by major classification was as follows (in millions):
Useful Life (In Years) | December 31, 2016 | January 2, 2016 | |||||||
Land and Improvements | $ | 76.7 | $ | 80.7 | |||||
Buildings and Improvements | 3-50 | 280.4 | 276.9 | ||||||
Machinery and Equipment | 3-15 | 929.9 | 926.7 | ||||||
Property, Plant and Equipment | 1,287.0 | 1,284.3 | |||||||
Less: Accumulated Depreciation | (659.5 | ) | (605.8 | ) | |||||
Net Property, Plant and Equipment | $ | 627.5 | $ | 678.5 | |||||
Commitments for property, plant and equipment purchases were $6.6 million at December 31, 2016.
Goodwill
The Company evaluates the carrying amount of goodwill annually or more frequently if events or circumstances indicate that the goodwill might be impaired. Factors that could trigger an impairment review include significant underperformance relative to historical or forecasted operating results, a significant decrease in the market value of an asset or significant negative industry or economic trends. For goodwill, the Company may perform a qualitative test to determine whether it is more-likely-than-not that the fair value of a reporting unit is less than its carrying amount as a basis for determining whether it is necessary to perform the quantitative goodwill impairment test. Based on prior goodwill impairment testing, the Company determined the performance of the quantitative impairment test was required for certain reporting units in 2016. The Company performs the required annual goodwill impairment test as of the end of the October fiscal month.
The Company uses a weighting of the market approach and the income approach (discounted cash flow method) in testing goodwill for impairment. In the market approach, the Company applies performance multiples from comparable public companies, adjusted for relative risk, profitability, and growth considerations, to the reporting units to estimate fair value. The key assumptions used in the discounted cash flow method used to estimate fair value include discount rates, revenue and operating income projections and terminal value rates because such assumptions are the most sensitive and susceptible to change as they require significant management judgment. Discount rates are determined by using market and industry data as well as Company-specific risk factors for each reporting unit. The discount rate utilized for each reporting unit is indicative of the return an investor would expect to receive for investing in such a business. Terminal value rate determination follows common methodology of capturing the present value of perpetual cash flow estimates beyond the last projected period assuming a constant discount rate and long-term growth rates.
The calculated fair values for the Company's 2016 impairment testing exceeded the carrying values of the reporting units for all of the Company's reporting units. The excess exceeded 10% of the carrying value for all reporting units except PTS. Throughout 2016, the Company's PTS reporting unit, which is a combination of the acquired PTS business from Emerson Electric and the Company's legacy PTS business, was impacted by declines in the oil and gas, distribution, and agricultural end-markets. The PTS reporting unit has goodwill of $570.8 million as of December 31, 2016. The Company's impairment test indicated the reporting unit’s implied fair value exceeded its book value by approximately 2%. Some of the key considerations used in the Company's impairment testing included (i) market pricing of guideline publicly traded companies (ii) cost of capital, including the risk-free interest rate, and (iii) recent historical and projected performance of the subject reporting unit. There is inherent uncertainty included in the assumptions used in goodwill impairment testing. A change to any of the assumptions could lead to a future impairment.
The calculated fair values for the Company's reporting units exceeded the carrying values for a majority of the Company's reporting units in 2015. There were certain reporting units where the calculated fair values were less than the carrying values. The Commercial and Industrial Systems segment includes reporting units that have significant exposure to the volatility in the oil and gas industry. Crude oil prices remained depressed throughout 2015 with pronounced declines in the fourth quarter of 2015 and into 2016. Expected cash flows were also negatively impacted by lower gas and oil prices as lower prices decreased the capital spending of customers these reporting units serve. Weak economic conditions in China have contributed to the reduced expected cash flows for one of the reporting units in this region. An implied goodwill amount was calculated as a required second step in the testing, using the estimated fair value of all assets and liabilities of the reporting unit as if the unit had been acquired in a business combination. The resulting implied fair value of goodwill is a Level 3 asset measured at fair value on a non-recurring basis (see also Note 14 of the Notes to the Consolidated Financial Statements for fair value definitions). The total goodwill impairment charge related to these reporting units was $79.9 million and was recorded in Goodwill Impairment within the Consolidated Statements of Income.
48
The calculated fair values for the Company's reporting units exceeded the carrying values for a majority of the Company's reporting units in 2014. There were certain reporting units where the calculated fair values were less than the carrying values. The Commercial and Industrial Systems segment and the Power Transmission Solutions segment include reporting units that have significant exposure to the volatility in the oil and gas industry. Crude oil prices saw a sharp decline in the latter part of 2014. Expected cash flows were also negatively impacted by lower gas and oil prices as lower prices decreased the capital spending of customers these reporting units serve. Weak economic conditions in regions such as Australia and New Zealand as well as currency devaluations in Venezuela have contributed to the reduced expected cash flows for our reporting units in these regions. In the Climate Solutions segment, unfavorable customer dynamics impacted one reporting unit's expected cash flows. An implied goodwill amount was then calculated as a required second step in the testing, using the estimated fair value of all assets and liabilities of the reporting unit as if the unit had been acquired in a business combination. The resulting implied fair value of goodwill is a Level 3 asset measured at fair value on a non-recurring basis (see also Note 14 of the Notes to the Consolidated Financial Statements for fair value definitions). Additionally, the Company’s reporting unit related to technology that had been deemed substantially impaired during the fourth quarter of 2013 was deemed fully impaired during 2014 as a result of the closing of the facility. This resulted in a $1.0 million impairment charge to goodwill. The total goodwill impairment charge related to these reporting units was $119.5 million and was recorded in Goodwill Impairment within the Consolidated Statements of Income.
Intangible Assets
Intangible assets with finite lives are amortized over their estimated useful lives using the straight line method.
The Company evaluates amortizing intangibles whenever events or circumstances have occurred that may indicate that carrying values may not be recoverable. If an indicator is present, the Company evaluates carrying values as compared to undiscounted estimated future cash flows. If such estimated future cash flows are less than carrying value, an impairment would be recognized. See also "Long-Lived Assets" in this footnote for the results and additional details of the impairment of certain long-lived assets and related charges in fiscal 2014.
Indefinite-lived intangible assets are not amortized. The Company evaluates the carrying amount of indefinite-lived intangible assets annually or more frequently if events or circumstances indicate that the assets might be impaired. The Company performs the required annual impairment test as of the end of the October fiscal month.
Indefinite-lived intangible assets consist of trade names associated with the acquired Power Transmission Solutions business. They were evaluated for impairment using a relief from royalty method to determine whether their fair values exceed their respective carrying amounts. The Company determined the fair value of these assets using a royalty relief methodology similar to that employed when the associated assets were acquired, but using updated estimates of future sales, cash flows and profitability. For 2015 and 2016, the fair value of indefinite lived intangible assets exceeded their respective carrying value however in 2016, the fair value only exceeded the carrying value by approximately 2%. Some of the key considerations used in our impairment testing included (i) cost of capital, including the risk-free interest rate, (ii) royalty rate and (iii) recent historical and projected performance of the subject reporting unit. There is inherent uncertainty included in the assumptions used in indefinite-lived intangible asset testing. A change to any of the assumptions could lead to a future impairment.
Long-Lived Assets
The Company evaluates the recoverability of the carrying amount of property, plant and equipment and amortizing intangible assets (collectively, "long-lived assets") whenever events or changes in circumstance indicate that the carrying amount of an asset may not be fully recoverable through future cash flows. Factors that could trigger an impairment review include a significant decrease in the market value of an asset or significant negative or economic trends. For long-lived assets, the Company uses an estimate of the related undiscounted cash flows over the remaining life of the primary asset to estimate recoverability of the asset group. If the asset is not recoverable, the asset is written down to fair value. The Company concluded it did not have any impairments of long-lived assets in 2016.
During 2015, due primarily to the continued decline in crude oil prices that was more pronounced in the fourth quarter of 2015 as well as weak economic conditions in China, an undiscounted cash flow test of long-lived assets for certain asset groups was performed. The undiscounted cash flows of each asset group tested exceeded its respective carrying value. As a result, no impairment was indicated.
During 2014, due primarily to unfavorable customer dynamics and the effects of the sharp decline in the price of oil, the carrying amounts of intangible and other long-lived assets for two reporting units within the Climate Solutions and Power Transmission Solutions segments were deemed to be not fully recoverable. Fair value was determined using the discounted cash flows from the Company's internal cash flow projections and a discount rate indicative of the return an investor would expect to receive for
49
investing in the asset which are Level 3 measurements. As a result, intangible and other long-lived asset impairments of $26.2 million were also recognized related to hydraulic fracturing equipment used in the oil and gas end markets. Technology and other long-lived asset impairments were recognized related to products used in hermetic climate applications of $13.8 million. Such impairments were recognized in Asset Impairments.
The details were as follows (in millions):
Commercial & Industrial Systems | Climate Solutions | Power Transmission Solutions | Total | ||||||||||||
Impairments during 2014: | |||||||||||||||
Impairment of Intangible Assets | $ | — | $ | 7.8 | $ | 11.1 | $ | 18.9 | |||||||
Impairment of Property, Plant and Equipment | — | 6.0 | 15.1 | 21.1 | |||||||||||
Asset Impairments | $ | — | $ | 13.8 | $ | 26.2 | $ | 40.0 | |||||||
Earnings Per Share
Diluted earnings per share is computed based upon earnings applicable to common shares divided by the weighted-average number of common shares outstanding during the period adjusted for the effect of other dilutive securities. Options for common shares where the exercise price was above the market price have been excluded from the calculation of the effect of dilutive securities shown below; the amount of these shares were 1.3 million in 2016, 0.7 million in 2015 and 0.3 million in 2014. The following table reconciles the basic and diluted shares used in earnings per share calculations for the years ended (in millions):
2016 | 2015 | 2014 | ||||||
Denominator for Basic Earnings Per Share | 44.7 | 44.7 | 45.0 | |||||
Effect of Dilutive Securities | 0.3 | 0.4 | 0.3 | |||||
Denominator for Diluted Earnings Per Share | 45.0 | 45.1 | 45.3 | |||||
Retirement and Post Retirement Plans
The Company's domestic employees are covered by defined contribution plans and approximately half of the Company's domestic employees are covered by defined benefit pension plans. The majority of the defined benefit pension plans covering the Company's domestic employees have been closed to new employees and frozen for existing employees. Certain employees are covered by a post retirement health care plan. Most of the Company's foreign employees are covered by government sponsored plans in the countries in which they are employed. The Company's obligations under its defined benefit pension and other post retirement plans are determined with the assistance of actuarial firms. The actuaries, under management's direction, make certain assumptions regarding such factors as withdrawal rates and mortality rates. The actuaries also provide information and recommendations from which management makes further assumptions on such factors as the long-term expected rate of return on plan assets, the discount rate on benefit obligations and where applicable, the rate of annual compensation increases and health care cost trend rates.
Based upon the assumptions made, the investments made by the plans, overall conditions and movement in financial markets, life-spans of benefit recipients and other factors, annual expenses and recorded assets or liabilities of these defined benefit plans may change significantly from year to year.
Beginning in 2016, the Company changed the method used to estimate the service and interest cost components of the net periodic pension and other post retirement benefit costs. The new method uses the spot yield curve approach to estimate the service and interest costs by applying the specific spot rates along the yield curve used to determine the benefit obligations to relevant projected cash outflows. The change will not affect the measurement of the total benefit obligations as the change in service and interest costs is offset in the actuarial gains and losses recorded in other comprehensive income. The methodology of selecting a discount rate that matches each plan's cash flows to that of a theoretical bond portfolio yield curve will continue to be used to value the benefit obligation at the end of each year. The Company changed to the new method to provide a more precise measure of interest and service costs by improving the correlation between the projected benefit cash flows and the discrete spot yield curve rates. The Company has accounted for this change as a change in estimate prospectively and it resulted in a $2.9 million reduction in expense for fiscal 2016 as compared to the previous method.
Derivative Financial Instruments
Derivative instruments are recorded on the Consolidated Balance Sheets at fair value. Any fair value changes are recorded in Net Income or Accumulated Other Comprehensive Loss ("AOCI") as determined under accounting guidance that establishes criteria for designation and effectiveness of the hedging relationships.
50
The Company uses derivative instruments to manage its exposure to fluctuations in certain raw material commodity pricing, fluctuations in the cost of forecasted foreign currency transactions, and variability in interest rate exposure on floating rate borrowings. The majority of derivative instruments have been designated as cash flow hedges (see also Note 13 of Notes to the Consolidated Financial Statements).
Income Taxes
The Company operates in numerous taxing jurisdictions and is subject to regular examinations by various US federal, state and foreign jurisdictions for various tax periods. The Company's income tax positions are based on research and interpretations of the income tax laws and rulings in each of the jurisdictions in which it does business. Due to the subjectivity of interpretations of laws and rulings in each jurisdiction, the differences and interplay in tax laws between those jurisdictions as well as the inherent uncertainty in estimating the final resolution of complex tax audit matters, estimates of income tax liabilities may differ from actual payments or assessments.
Foreign Currency Translation
For those operations using a functional currency other than the US dollar, assets and liabilities are translated into US dollars at year-end exchange rates, and revenues and expenses are translated at weighted-average exchange rates. The resulting translation adjustments are recorded as a separate component of Shareholders' Equity. Pursuant to accounting rules guiding highly inflationary currency, the Company did not translate its prior Venezuelan subsidiary's financial statements as its functional currency was the US dollar.
Product Warranty Reserves
The Company maintains reserves for product warranty to cover the stated warranty periods for its products. Such reserves are established based on an evaluation of historical warranty experience and specific significant warranty matters when they become known and can reasonably be estimated.
Accumulated Other Comprehensive Loss
Foreign currency translation adjustments, unrealized gains and losses on derivative instruments designated as hedges and pension and post retirement liability adjustments are included in Shareholders' Equity under AOCI.
The components of the ending balances of AOCI are as follows (in millions):
2016 | 2015 | ||||||
Foreign Currency Translation Adjustments | $ | (241.0 | ) | $ | (172.1 | ) | |
Hedging Activities, Net of Tax of $(25.2) in 2016 and $(29.1) in 2015 | (41.1 | ) | (47.5 | ) | |||
Pension and Post Retirement Benefits, Net of Tax of $(20.1) in 2016 and $(19.8) in 2015 | (36.0 | ) | (35.4 | ) | |||
Total | $ | (318.1 | ) | $ | (255.0 | ) | |
Legal Claims and Contingent Liabilities
The Company is subject to various legal proceedings, claims and regulatory matters, the outcomes of which are subject to significant uncertainty and will only be resolved when one or more future events occur or fail to occur. Management conducts regular reviews, including updates from legal counsel, to assess the need for accounting recognition or disclosure of these contingencies. The Company records expenses and liabilities when the Company believes that an obligation of the Company or a subsidiary on a specific matter is probable and there is a basis to reasonably estimate the value of the obligation, and such assessment inherently involves an exercise in judgment. This methodology is used for legal claims that are filed against the Company or a subsidiary from time to time. The uncertainty that is associated with such matters frequently requires adjustments to the liabilities previously recorded.
Fair Values of Financial Instruments
The fair values of cash equivalents, term deposits, trade receivables and accounts payable approximate their carrying values due to the short period of time to maturity. The fair value of debt is estimated using discounted cash flows based on rates for instruments with comparable maturities and credit ratings as further described in Note 7 of Notes to the Consolidated Financial Statements. The fair value of pension assets and derivative instruments is determined based on the methods disclosed in Notes 8 and 14 of Notes to the Consolidated Financial Statements.
Recent Accounting Pronouncements
In January 2017, the Financial Accounting Standards Board ("FASB") issued Accounting Standards Update ("ASU") 2017-04, Intangibles- Goodwill and Other: Simplifying the Accounting for Goodwill Impairment, which removes Step 2 from the goodwill impairment test. Under the new guidance, the amount of goodwill impairment will be determined by the amount the carrying value
51
of the reporting unit exceeds its fair value. The Company adopted this ASU on January 1, 2017, and it will only be applicable to the extent that the Company determines its goodwill is impaired.
In October 2016, the FASB issued ASU No. 2016-16, Income Taxes - Intra-Entity Transfers of Assets Other Than Inventory, which removes the prohibition in Accounting Standards Codification ("ASC") 740 against the immediate recognition of the current and deferred income tax effects of intra-entity transfers of assets other than inventory. Under the ASU, the selling (transferring) entity is required to recognize a current tax expense or benefit upon transfer of the asset. Similarly, the purchasing (receiving) entity is required to recognize a deferred tax asset or deferred tax liability, as well as the related deferred tax benefit or expense, upon receipt of the asset. The ASU is effective for annual periods beginning after December 15, 2017, and interim periods within those annual periods. Early adoption is permitted as of the beginning of a fiscal year for which neither the annual or interim (if applicable) financial statements have been issued. The standard requires application using a modified retrospective transition method. The adoption of this standard is not expected to have a material impact on the Company's consolidated financial statements.
In August 2016, the FASB issued ASU No. 2016-15, Statement of Cash Flows: Classification of Certain Cash Receipts and Cash Payments (a consensus of the Emerging Issues Task Force). The new standard is intended to reduce diversity in practice in how certain transactions are classified in the statement of cash flows. The standard is effective for financial statements issued for fiscal years beginning after December 15, 2017, and interim periods within those fiscal years. Early adoption is permitted, provided that all of the amendments are adopted in the same period. The guidance requires application using a retrospective transition method. The Company is currently assessing the impact that this standard will have on its consolidated financial statements.
In March 2016 the FASB issued Accounting ASU No. 2016-09, Compensation—Stock Compensation: Improvements to Employee Share-Based Payment Accounting. The ASU includes multiple provisions intended to simplify various aspects of the accounting for share-based payments. There are challenges for companies with significant share-based payment activities and there are various transition methods. The Company is required to adopt the new requirements in the first quarter of fiscal 2017. The adoption of this standard is not expected to have a material impact on the Company's consolidated financial statements.
In February 2016, the FASB issued ASU 2016-02, Leases. The core principle of ASU 2016-02 is that an entity should recognize on its balance sheet assets and liabilities arising from a lease. In accordance with that principle, ASU 2016-02 requires that a lessee recognize a liability to make lease payments (the lease liability) and a right-of-use asset representing its right to use the underlying leased asset for the lease term. The recognition, measurement, and presentation of expenses and cash flows arising from a lease by a lessee will depend on the lease classification as a finance or operating lease. This new accounting guidance is effective for fiscal years beginning after December 15, 2018 under a modified retrospective approach and early adoption is permitted. The Company has identified a six step process to successfully implement the new Lease standard - Form a task force to become experts and take the lead on understanding and implementing the new Lease standard; Update lease inventories; Decide on transition method; Review legal agreements and debt covenants; Consider IT needs; Discuss with stakeholders. The Company is currently evaluating the impact the adoption of ASU 2016-02 will have on its consolidated financial statements and has commenced the first step of identifying a task force to take the lead in implementing the new Lease standard. See also Note 11 of Notes to the Consolidated Financial Statements for our lease commitments.
In May 2014, the FASB issued ASU 2014-09, Revenue from Contracts with Customers, a comprehensive new revenue recognition standard that supersedes the revenue recognition requirements in ASC 605, revenue recognition. This update requires the Company to recognize revenue at amounts that reflect the consideration to which the Company expects to be entitled in exchange for those goods or services at the time of transfer. ASU No. 2014-09 (and related updates) will become effective for the Company at the beginning of its 2018 fiscal year. The standard allows the option of using either a full retrospective or a modified retrospective approach for the adoption of the standard. The Company has not yet selected which approach to apply. The Company has identified a four step process to successfully implement the new Revenue standard - data gathering, assessment, solution development, and solution implementation. The Company has completed step one, data gathering, and is currently in the process of the assessment phase. The Company is in the process of evaluating and quantifying the materiality of the standard’s impact on its consolidated financial statements.
In May 2016, the FASB issued ASU No. 2016-12, Revenue from Contracts with Customers (Topic 606) - Narrow-Scope Improvements and Practical Expedients, which clarifies the guidance in Topic 606 on assessing collectibility, presentation of sales taxes, noncash consideration, and completed contracts and contract modifications at transition. The amendments in ASU No. 2016-12 do not change the core principles of the guidance in Topic 606.
In April 2016, the FASB issued ASU No. 2016-10, Revenue from Contracts with Customers (Topic 606) - Identifying Performance Obligations and Licensing, which clarifies the identification of performance obligations and the licensing implementation guidance in Topic 606. The amendments in ASU No. 2016-10 do not change the core principles of the guidance in Topic 606.
52
In March 2016, the FASB issued ASU No. 2016-08, Revenue from Contracts with Customers (Topic 606) - Principal versus Agent Considerations (Reporting Revenue Gross versus Net), which amends the principal-versus-agent implementation guidance in ASU No. 2014-09 (Topic 606). ASU No. 2016-08 clarifies the principal-versus-agent guidance in Topic 606 and requires an entity to determine whether the nature of its promise to provide goods or services to a customer is performed in a principal or agent capacity and to recognize revenue in a gross or net manner based on its principal/agent designation.
In May 2015, the FASB issued ASU 2015-07, Disclosures for Investment in Certain Entities That Calculate Net Asset Value per Share ("NAV") (or its Equivalent). This ASU removes from the fair value hierarchy investments for which the practical expedient is used to measure fair value at NAV. Instead, an entity is required to include those investments as a reconciling line item so that the total fair value amount of investments in the disclosure is consistent with the amount on the balance sheet. Further, entities must provide the disclosure only for investments for which they elect to use the NAV practical expedient to determine fair value. The ASU should be applied retrospectively to all periods presented. The Company adopted this standard in 2016 and this standard did not have a material impact on the Company's consolidated financial statements but did impact the disclosures in Note 8 of Notes to the Consolidated Financial Statements.
(4) Acquisitions and Divestitures
The results of operations for acquired businesses are included in the Consolidated Financial Statements from the dates of acquisition. Acquisition-related expenses were $9.1 million during 2015 and $5.8 million during 2014. There were no acquisition-related expenses in 2016.
2016 Acquisitions
Elco
On January 18, 2016, the Company purchased the remaining shares owned by the joint venture partner in its Elco Group B.V. (“Elco”) joint venture, increasing the Company’s ownership from 55.0% to 100.0%, for a purchase price of $19.6 million. The purchase price of Elco is reflected as a component of equity.
2015 Acquisitions
PTS
On January 30, 2015, the Company acquired the Power Transmission Solutions business of Emerson Electric Co. ("PTS") for $1,408.9 million in cash through a combination of stock and asset purchases. PTS is a global leader in highly engineered power transmission products and solutions. The business manufactures, sells and services bearings, couplings, gearing, drive components and conveyor systems. PTS is included in the Power Transmission Solutions segment. The Company acquired PTS because management believes it diversifies the Company's end market exposure, provides complementary products, expands and balances the Company's product portfolio, and enhances its margin profile.
On January 30, 2015, the Company entered into a Credit Agreement for a 5-year unsecured term loan facility in the principal amount of $1.25 billion, which was drawn in full by the Company on January 30, 2015, in connection with the closing of the acquisition of PTS (see also Note 7 of Notes to the Consolidated Financial Statements).
The acquisition of PTS was accounted for as a purchase in accordance with FASB ASC Topic 805, Business Combinations. Assets acquired and liabilities assumed were recorded at their fair values as of the acquisition date. The fair values of identifiable intangible assets, which were primarily customer relationships, trade names, and technology, were based on valuations using the income approach. The excess of the purchase price over the estimated fair values of tangible assets, identifiable intangible assets and assumed liabilities was recorded as goodwill. The goodwill is attributable to expected synergies and expected growth opportunities. The Company estimates approximately 65% of goodwill will be deductible for United States income tax purposes.
The purchase price allocation for PTS was as follows (in millions):
53
As of January 30, 2015 | |||
Current Assets | $ | 22.5 | |
Trade Receivables | 67.2 | ||
Inventories | 108.8 | ||
Property, Plant and Equipment | 184.4 | ||
Intangible Assets | 648.2 | ||
Goodwill | 564.3 | ||
Total Assets Acquired | 1,595.4 | ||
Accounts Payable | 57.2 | ||
Current Liabilities Assumed | 32.3 | ||
Long-Term Liabilities Assumed | 97.0 | ||
Net Assets Acquired | $ | 1,408.9 | |
The valuation of the net assets acquired of $1,408.9 million was classified as Level 3 in the valuation hierarchy (See Note 14 of the Notes to the Consolidated Financial Statements for the definition of Level 3 inputs). The Company valued property, plant and equipment using both a market approach and a cost approach depending on the asset. Intangible assets were valued using the present value of projected future cash flows and significant assumptions included royalty rates, discount rates, customer attrition and obsolescence factors.
The components of Intangible Assets included as part of the PTS acquisition was as follows (in millions):
Weighted Average Amortization Period (Years) | Gross Value | |||||
Amortizable Intangible Assets | ||||||
Customer Relationships | 17.0 | $ | 462.8 | |||
Technology | 14.5 | 63.5 | ||||
Intangible Assets Subject to Amortization | 16.7 | 526.3 | ||||
Non-Amortizable Intangible Assets | ||||||
Trade Names | - | 121.9 | ||||
Intangible Assets | $ | 648.2 | ||||
Net sales from PTS were $512.9 million for the year ended January 2, 2016. Operating income from PTS was $14.5 million for the year ended January 2, 2016. Purchase accounting inventory adjustments and transaction costs of $29.8 million were included in the PTS operating income for the year ended January 2, 2016.
2014 Acquisitions
Benshaw
On June 30, 2014, the Company acquired all of the stock of Benshaw. Inc. ("Benshaw") for $51.0 million in cash. The Company financed the transaction with existing cash. Benshaw is a manufacturer of custom low and medium voltage variable frequency drives and soft starters. It is reported in the Commercial and Industrial Systems segment. The Company acquired Benshaw because management determined it was a strategic fit for the Commercial and Industrial Systems segment.
The acquisition of Benshaw was accounted for as a purchase in accordance with FASB ASC Topic 805, Business Combinations. Assets acquired and liabilities assumed were recorded at their fair values as of the acquisition date. The fair values of identifiable intangible assets, which were primarily customer relationships and technology, were based on valuations using the income approach. The excess of the purchase price over the estimated fair values of tangible assets, identifiable intangible assets and assumed liabilities was recorded as goodwill. The goodwill is attributable to expected synergies and expected growth opportunities. The Company expects goodwill will be deductible for US income tax purposes.
54
The purchase price allocation for Benshaw was as follows (in millions):
As of June 30, 2014 | |||
Current Assets | $ | 0.5 | |
Trade Receivables | 10.4 | ||
Inventories | 22.4 | ||
Property, Plant and Equipment | 4.5 | ||
Intangible Assets, Subject to Amortization | 14.6 | ||
Goodwill | 4.7 | ||
Total Assets Acquired | 57.1 | ||
Accounts Payable | 3.7 | ||
Current Liabilities Assumed | 2.2 | ||
Long-Term Liabilities Assumed | 0.2 | ||
Net Assets Acquired | $ | 51.0 | |
Hy-Bon
On February 7, 2014, the Company acquired the stock of Hy-Bon Engineering Company, Inc. ("Hy-Bon") for $78.0 million in cash. The Company financed the transaction with existing cash. Hy-Bon is a leader in vapor recovery solutions for oil and gas applications. It is reported in the Commercial and Industrial Systems segment. The Company acquired Hy-Bon because management determined it was a strategic fit for the Commercial and Industrial Systems segment.
The acquisition of Hy-Bon was accounted for as a purchase in accordance with the FASB ASC Topic 805, Business Combinations. Assets acquired and liabilities assumed were recorded at their fair values as of the acquisition date. The fair values of identifiable intangible assets, which were primarily customer relationships, were based on valuations using the income approach. The excess of the purchase price over the estimated fair values of tangible assets, identifiable intangible assets and assumed liabilities was recorded as goodwill. The goodwill is attributable to expected synergies and other growth opportunities. The Company does not expect goodwill will be deductible for US income tax purposes.
The purchase price allocation for Hy-Bon was as follows (in millions):
As of February 7, 2014 | |||
Current Assets | $ | 1.7 | |
Trade Receivables | 11.5 | ||
Inventories | 14.3 | ||
Property, Plant and Equipment | 8.1 | ||
Intangible Assets, Subject to Amortization | 13.4 | ||
Goodwill | 40.6 | ||
Other Assets | 0.1 | ||
Total Assets Acquired | 89.7 | ||
Accounts Payable | 5.5 | ||
Current Liabilities Assumed | 5.1 | ||
Long-Term Liabilities Assumed | 1.1 | ||
Net Assets Acquired | $ | 78.0 | |
Unaudited Pro Forma Consolidated Financial Information
The following unaudited pro forma financial information presents the financial results for the fiscal years 2015 and 2014 as if the acquisition of PTS had occurred on December 29, 2013. As a practical expedient, the Company has used the audited stand-alone financial statements of PTS for the year ended September 30, 2014 to estimate pro-forma results for the year ended January 3, 2015. The pro forma financial information includes, where applicable, adjustments for: (i) the estimated amortization of acquired
55
intangible assets, (ii) estimated additional interest expense on acquisition related borrowings, and (iii) the income tax effect on the pro forma adjustments using an estimated effective tax rate. The pro forma financial information excludes, where applicable, adjustments for: (i) the estimated impact of inventory purchase accounting adjustments and (ii) the estimated closing costs on the acquisition and (iii) any estimated cost synergies or other effects of the integration of the acquisition. The pro forma financial information is presented for illustrative purposes only and is not necessarily indicative of the operating results that would have been achieved had the acquisition been completed as of the date indicated or the results that may be obtained in the future (in millions, except per share amounts):
Fiscal 2015 | Fiscal 2014 | |||||||
Pro Forma Net Sales | $ | 3,558.3 | $ | 3,864.4 | ||||
Pro Forma Net Income Attributable to the Company | 174.8 | 63.1 | ||||||
Basic Earnings Per Share as Reported | $ | 3.21 | $ | 0.69 | ||||
Pro Forma Basic Earnings Per Share | 3.91 | 1.40 | ||||||
Diluted Earnings Per Share as Reported | $ | 3.18 | $ | 0.69 | ||||
Pro Forma Diluted Earnings Per Share | 3.88 | 1.39 | ||||||
The following unaudited pro forma financial information presents the financial results for the fiscal year 2014 as if the acquisitions of Benshaw and Hy-Bon, had occurred on December 29, 2013. The pro forma financial information includes, where applicable, adjustments for: (i) the estimated amortization of acquired intangible assets, (ii) estimated additional interest expense on acquisition related borrowings, and (iii) the income tax effect on the pro forma adjustments using an estimated effective tax rate. The pro forma financial information excludes, where applicable, adjustments for: (i) the estimated impact of inventory purchase accounting adjustments, (ii) the estimated closing costs on the acquisition and (iii) any estimated cost synergies or other effects of the integration of the acquisition. The pro forma financial information is presented for illustrative purposes only and is not necessarily indicative of the operating results that would have been achieved had the acquisitions been completed as of the date indicated or the results that may be obtained in the future (in millions, except per share amounts):
Fiscal 2014 | |||||
Pro Forma Net Sales | $ | 3,291.2 | |||
Pro Forma Net Income Attributable to the Company | 28.8 | ||||
Basic Earnings Per Share as Reported | $ | 0.69 | |||
Pro Forma Basic Earnings Per Share | 0.64 | ||||
Diluted Earnings Per Share as Reported | $ | 0.69 | |||
Pro Forma Diluted Earnings Per Share | 0.64 | ||||
2016 Divestitures
Mastergear Worldwide
On June 1, 2016, the Company sold its Mastergear Worldwide ("Mastergear") business to Rotork PLC for a purchase price of $24.6 million, subject to customary finalization. Mastergear was included in the Company's Power Transmission Solutions segment. A gain related to the sale of $11.6 million was recorded as a reduction to Operating Expenses in the Condensed Consolidated Statements of Income during fiscal 2016.
Venezuelan Subsidiary
56
On July 7, 2016, the Company sold the assets of its Venezuelan subsidiary, which had been included in the Company's Commercial and Industrial Systems segment, to a private company for $3.0 million. Of this amount, $1.0 million was received on the transaction closing date and $2.0 million is to be received in 24 monthly installments. The Company may receive additional amounts in the future related to certain accounts receivable of this business. The gains will be recognized as the cash is received. The Company wrote down its investment and ceased operations of this subsidiary in 2015.
2014 Divestitures
Jinling
The Company sold its shares of a joint venture located in Shanghai, China ("Jinling") on September 11, 2014 which was previously accounted for as a consolidated joint venture and was reported in the Commercial and Industrial Systems segment. A loss of approximately $1.9 million was recorded in Operating Expenses in the Consolidated Statements of Income in fiscal 2014.
(5) Goodwill and Intangible Assets
Goodwill
The excess of purchase price over estimated fair value is assigned to goodwill. See Note 3 of Notes to the Consolidated Financial Statements, "Goodwill" and "Long-Lived Assets" for additional details.
The following table presents changes to goodwill during the periods indicated (in millions):
Total | Commercial and Industrial Systems | Climate Solutions | Power Transmission Solutions | ||||||||||||
Balance as of January 3, 2015 | $ | 1,004.0 | $ | 645.4 | $ | 344.6 | $ | 14.0 | |||||||
Acquisitions and Valuation Adjustments | 559.4 | (5.2 | ) | — | 564.6 | ||||||||||
Less: Impairment Charges | 79.9 | 79.9 | — | — | |||||||||||
Translation Adjustments | (17.9 | ) | (12.6 | ) | (1.8 | ) | (3.5 | ) | |||||||
Balance as of January 2, 2016 | $ | 1,465.6 | $ | 547.7 | $ | 342.8 | $ | 575.1 | |||||||
Acquisitions and Valuation Adjustments | (0.3 | ) | — | — | (0.3 | ) | |||||||||
Translation Adjustments | (12.1 | ) | (7.1 | ) | (1.0 | ) | (4.0 | ) | |||||||
Balance as of December 31, 2016 | $ | 1,453.2 | $ | 540.6 | $ | 341.8 | $ | 570.8 | |||||||
Cumulative Goodwill Impairment Charges | $ | 275.7 | $ | 244.8 | $ | 7.7 | $ | 23.2 | |||||||
57
Intangible Assets
Gross intangible assets consist of the following (in millions):
Weighted Average Amortization Period (Years) | January 2, 2016 | Acquisitions | Translation Adjustments | December 31, 2016 | |||||||||||||
Customer Relationships | 15 | $ | 709.0 | $ | — | $ | (5.4 | ) | $ | 703.6 | |||||||
Technology | 11 | 191.1 | — | (1.4 | ) | 189.7 | |||||||||||
Trademarks | 12 | 32.1 | — | (0.3 | ) | 31.8 | |||||||||||
Patent and Engineering Drawings | 5 | 16.6 | — | — | 16.6 | ||||||||||||
Non-compete Agreements | 5 | 8.5 | — | (0.2 | ) | 8.3 | |||||||||||
957.3 | — | (7.3 | ) | 950.0 | |||||||||||||
Non-amortizable Trade Names | 121.3 | — | (0.5 | ) | 120.8 | ||||||||||||
Total Gross Intangibles | $ | 1,078.6 | $ | — | $ | (7.8 | ) | $ | 1,070.8 | ||||||||
Accumulated amortization on intangible assets consists of the following:
January 2, 2016 | Amortization | Translation Adjustments | December 31, 2016 | |||||||||||||
Customer Relationships | $ | 161.4 | $ | 42.6 | $ | (2.4 | ) | $ | 201.6 | |||||||
Technology | 92.9 | 17.4 | (0.8 | ) | 109.5 | |||||||||||
Trademarks | 21.8 | 1.9 | (0.4 | ) | 23.3 | |||||||||||
Patent and Engineering Drawings | 16.6 | — | — | 16.6 | ||||||||||||
Non-compete Agreements | 8.1 | 0.1 | (0.1 | ) | 8.1 | |||||||||||
Total Accumulated Amortization | $ | 300.8 | $ | 62.0 | $ | (3.7 | ) | $ | 359.1 | |||||||
Intangible Assets, Net of Amortization | $ | 777.8 | $ | 711.7 | ||||||||||||
While the Company believes its customer relationships are long-term in nature, the Company's contractual customer relationships are generally short-term. Useful lives are established at acquisition based on historical attrition rates.
Amortization expense was $62.0 million in fiscal 2016, $63.9 million in fiscal 2015 and $46.7 million in fiscal 2014.
The following table presents estimated future amortization expense (in millions):
Estimated Amortization | |||||||||||
Year | |||||||||||
2017 | $ | 55.0 | |||||||||
2018 | 53.0 | ||||||||||
2019 | 52.6 | ||||||||||
2020 | 49.5 | ||||||||||
2021 | 41.9 | ||||||||||
58
(6) Segment Information
The following sets forth certain financial information attributable to the Company's operating segments for fiscal 2016, fiscal 2015 and fiscal 2014, respectively (in millions):
Commercial and Industrial Systems | Climate Solutions | Power Transmission Solutions | Eliminations | Total | ||||||||||||||||
Fiscal 2016 | ||||||||||||||||||||
External Sales | $ | 1,530.9 | $ | 960.0 | $ | 733.6 | $ | — | $ | 3,224.5 | ||||||||||
Intersegment Sales | 49.2 | 24.1 | 4.3 | (77.6 | ) | — | ||||||||||||||
Total Sales | 1,580.1 | 984.1 | 737.9 | (77.6 | ) | 3,224.5 | ||||||||||||||
Gross Profit | 379.2 | 245.1 | 240.9 | — | 865.2 | |||||||||||||||
Operating Expenses | 275.7 | 115.2 | 153.7 | — | 544.6 | |||||||||||||||
Income from Operations | 103.5 | 129.9 | 87.2 | — | 320.6 | |||||||||||||||
Depreciation and Amortization | 74.7 | 24.4 | 56.3 | — | 155.4 | |||||||||||||||
Capital Expenditures | 36.6 | 15.0 | 13.6 | — | 65.2 | |||||||||||||||
Identifiable Assets | 1,872.7 | 881.8 | 1,604.0 | — | 4,358.5 | |||||||||||||||
Fiscal 2015 | ||||||||||||||||||||
External Sales | $ | 1,694.9 | $ | 1,041.2 | $ | 773.6 | $ | — | $ | 3,509.7 | ||||||||||
Intersegment Sales | 71.2 | 24.1 | 4.0 | (99.3 | ) | — | ||||||||||||||
Total Sales | 1,766.1 | 1,065.3 | 777.6 | (99.3 | ) | 3,509.7 | ||||||||||||||
Gross Profit | 441.1 | 262.2 | 229.9 | — | 933.2 | |||||||||||||||
Operating Expenses | 307.2 | 115.6 | 177.7 | — | 600.5 | |||||||||||||||
Goodwill impairment | 79.9 | — | — | — | 79.9 | |||||||||||||||
Income from Operations | 54.0 | 146.6 | 52.2 | — | 252.8 | |||||||||||||||
Depreciation and Amortization | 77.5 | 28.6 | 53.3 | — | 159.4 | |||||||||||||||
Capital Expenditures | 52.3 | 18.5 | 21.4 | — | 92.2 | |||||||||||||||
Identifiable Assets | 1,959.5 | 937.2 | 1,695.0 | — | 4,591.7 | |||||||||||||||
Fiscal 2014 | ||||||||||||||||||||
External Sales | $ | 1,856.1 | $ | 1,134.8 | $ | 266.2 | $ | — | $ | 3,257.1 | ||||||||||
Intersegment Sales | 78.2 | 19.2 | 5.1 | (102.5 | ) | — | ||||||||||||||
Total Sales | 1,934.3 | 1,154.0 | 271.3 | (102.5 | ) | 3,257.1 | ||||||||||||||
Gross Profit | 468.2 | 258.8 | 70.3 | — | 797.3 | |||||||||||||||
Operating Expenses | 333.9 | 137.7 | 44.7 | — | 516.3 | |||||||||||||||
Goodwill Impairment | 100.7 | 7.7 | 11.1 | — | 119.5 | |||||||||||||||
Asset Impairments | — | 13.8 | 26.2 | — | 40.0 | |||||||||||||||
Income (Loss) from Operations | 33.6 | 99.6 | (11.7 | ) | — | 121.5 | ||||||||||||||
Depreciation and Amortization | 81.5 | 45.0 | 12.2 | — | 138.7 | |||||||||||||||
Capital Expenditures | 59.6 | 16.8 | 7.2 | — | 83.6 | |||||||||||||||
Identifiable Assets | 2,371.7 | 842.6 | 142.9 | — | 3,357.2 | |||||||||||||||
The Commercial and Industrial Systems segment produces medium and large electric motors, power generation products, high-performance drives and controls, and starters. Applications include general commercial and industrial equipment, commercial HVAC, power generation, and oil and gas.
The Climate Solutions segment produces small motors, controls and air moving solutions. Applications include residential and light commercial HVAC, commercial refrigeration and water heaters.
The Power Transmission Solutions segment produces power transmission gearing, hydraulic pump drives, large open gearing and specialty mechanical products. Applications include material handling, industrial equipment, energy and off-road equipment.
The Company evaluates performance based on the segment's income from operations. Corporate costs have been allocated to each
59
segment based on the net sales of each segment. The reported external net sales of each segment are from external customers.
The following sets forth net sales by country in which the Company operates for fiscal 2016, fiscal 2015 and fiscal 2014, respectively (in millions):
Net Sales | ||||||||||||||
2016 | 2015 | 2014 | ||||||||||||
United States | $ | 2,212.6 | $ | 2,374.3 | $ | 2,359.3 | ||||||||
Rest of the World | 1,011.9 | 1,135.4 | 897.8 | |||||||||||
$ | 3,224.5 | $ | 3,509.7 | $ | 3,257.1 | |||||||||
US net sales for 2016, 2015 and 2014 represented 68.6%, 67.6% and 72.4% of total net sales, respectively. No individual foreign country represented a material portion of total net sales for any of the years presented.
The following sets forth long-lived assets (net property, plant and equipment) by country in which the Company operates for fiscal 2016 and fiscal 2015, respectively (in millions):
Long-lived Assets | |||||||
2016 | 2015 | ||||||
United States | $ | 290.3 | $ | 339.8 | |||
Mexico | 120.2 | 114.6 | |||||
China | 99.6 | 107.9 | |||||
Rest of the World | 117.4 | 116.2 | |||||
$ | 627.5 | $ | 678.5 | ||||
No other individual foreign country represented a material portion of long-lived assets for any of the years presented.
(7) Debt and Bank Credit Facilities
The Company's indebtedness as of December 31, 2016 and January 2, 2016 was as follows (in millions):
December 31, 2016 | January 2, 2016 | |||||||
Term Facility | $ | 798.1 | $ | 1,118.1 | ||||
Senior Notes | 600.0 | 600.0 | ||||||
Multicurrency Revolving Facility | 18.0 | 3.0 | ||||||
Other | 5.1 | 15.5 | ||||||
Less: Debt Issuance Costs | (9.7 | ) | (14.7 | ) | ||||
1,411.5 | 1,721.9 | |||||||
Less: Current Maturities | 100.6 | 6.3 | ||||||
Non-Current Portion | $ | 1,310.9 | $ | 1,715.6 | ||||
Credit Agreement
In connection with the PTS Acquisition, on January 30, 2015, the Company entered into a Credit Agreement (the “Credit Agreement”) with JPMorgan Chase Bank, N.A., as Administrative Agent and the lenders named therein, providing for a (i) 5-year unsecured term loan facility in the principal amount of $1.25 billion (the “Term Facility”) and (ii) a 5-year unsecured multicurrency revolving facility in the principal amount of $500.0 million (the “Multicurrency Revolving Facility”), including a $100.0 million letter of credit sub facility, available for general corporate purposes. The Credit Agreement replaced the Prior Credit Agreement, and the Multicurrency Revolving Facility replaced the Prior Revolving Facility (further discussed below).
The Term Facility was drawn in full on January 30, 2015 in connection with the closing of the PTS Acquisition. The loan under the Term Facility requires quarterly amortization at a rate starting at 5.0% per annum, increasing to 7.5% per annum after two
60
years and further increasing to 10.0% per annum for the last two years of the Term Facility, unless previously prepaid. At December 31, 2016 the Company had borrowings under the Multicurrency Revolving Facility in the amount of $18.0 million, $32.1 million of standby letters of credit issued under the facility, and $449.9 million of available borrowing capacity.
Borrowings under the Credit Agreement bear interest at floating rates based upon indices determined by the currency of the borrowing, plus an applicable margin determined by reference to the Company's consolidated funded debt to consolidated EBITDA ratio or at an alternative base rate. The average daily balance in borrowings under the Multicurrency Revolving Facility was $21.0 million and the weighted average interest rate on the Multicurrency Revolving Facility was 2.2% for the year ended December 31, 2016. The weighted average interest rate on the Term Facility was 2.3% for the year ended December 31, 2016. The average daily balance in borrowings under the Multicurrency Revolving Facility was $48.2 million and the weighted average interest rate on the Multicurrency Revolving Facility was 1.9% for the year ended January 2, 2016. The weighted average interest rate on the Term Facility was 1.8% for the year ended January 2, 2016. The Company pays a non-use fee on the aggregate unused amount of the Multicurrency Revolving Facility at a rate determined by reference to its consolidated funded debt to consolidated EBITDA ratio.
The Credit Agreement requires the Company prepay the loans under the Term Facility with 100% of the net cash proceeds received from specified asset sales and borrowed money indebtedness, subject to certain exceptions.
Senior Notes
At December 31, 2016, the Company had $600.0 million of unsecured senior notes (the “Notes”) outstanding. The Notes consist of (i) $500.0 million in senior notes (the “2011 Notes”) in a private placement which were issued in seven tranches with maturities from seven to twelve years and carry fixed interest rates and (ii) $100.0 million in senior notes (the “2007 Notes”) issued in 2007 with a floating interest rate based on a margin over the London Inter-Bank Offered Rate (“LIBOR”).
Details on the Notes at December 31, 2016 were (in millions):
Principal | Interest Rate | Maturity | ||||||
Floating Rate Series 2007A | 100.0 | Floating (1) | August 23, 2017 | |||||
Fixed Rate Series 2011A | 100.0 | 4.1% | July 14, 2018 | |||||
Fixed Rate Series 2011A | 230.0 | 4.8 to 5.0% | July 14, 2021 | |||||
Fixed Rate Series 2011A | 170.0 | 4.9 to 5.1% | July 14, 2023 | |||||
$ | 600.0 | |||||||
(1) Interest rates vary as LIBOR varies. The interest rate was 1.6% and 1.1% at December 31, 2016 and January 2, 2016 respectively. | |||||
The Company has an interest rate swap agreement to manage fluctuations in cash flows resulting from interest rate risk (see also Note 13 of Notes to the Consolidated Financial Statements).
Compliance with Financial Covenants
The Credit Agreement and the Notes require the Company to meet specified financial ratios and to satisfy certain financial condition tests. The Company was in compliance with all financial covenants contained in the Notes and the Credit Agreement as of December 31, 2016.
Prior Credit Agreement and Prior Revolving Facility
On June 30, 2011, the Company entered into a 5-year unsecured revolving credit agreement (the “Prior Credit Agreement”) that provided for an aggregate amount of availability under a revolving credit facility of $500.0 million, including a $100.0 million letter of credit sub facility (the “Prior Revolving Facility”). The Prior Credit Agreement and Prior Revolving Facility were replaced with the Credit Agreement (discussed above).
The Prior Revolving Facility permitted borrowing at interest rates based upon a margin above LIBOR. The average balance in borrowings under the Prior Revolving Facility was $20.3 million and the average interest rate was 1.4% in fiscal 2014. At January 3, 2015, the Company had $17.0 million outstanding on the Prior Revolving Facility. The balance on the Prior Revolving Facility was fully paid on January 27, 2015.
Other Notes Payable
At December 31, 2016, other notes payable of $5.1 million were outstanding with a weighted average interest rate of 5.6%. At January 2, 2016, other notes payable of $15.5 million were outstanding with a weighted average rate of 2.5%.
61
Other Disclosures
Based on rates for instruments with comparable maturities and credit quality, which are classified as Level 2 inputs (see also Note 14 of Notes to the Consolidated Financial Statements), the approximate fair value of the Company's total debt was $1,433.4 million and $1,758.2 million as of December 31, 2016 and January 2, 2016, respectively.
Maturities of long-term debt, excluding debt issuance costs, are as follows (in millions):
Year | Amount of Maturity | |||||||
2017 | $ | 100.6 | ||||||
2018 | 118.3 | |||||||
2019 | 17.2 | |||||||
2020 | 781.6 | |||||||
2021 | 230.3 | |||||||
Thereafter | 173.2 | |||||||
Total | $ | 1,421.2 | ||||||
(8) Retirement and Post Retirement Health Care Plans
Retirement Plans
The Company's domestic employees are participants in defined benefit pension plans and/or defined contribution plans. The majority of the Company's defined benefit pension plans covering the Company's domestic employees have been closed to new employees and frozen for existing employees. Most foreign employees are covered by government sponsored plans in the countries in which they are employed. The defined contribution plans provide for Company contributions based, depending on the plan, upon one or more of participant contributions, service and profits. Company contributions to domestic defined contribution plans totaled $8.7 million, $9.9 million, and $8.8 million in 2016, 2015 and 2014, respectively. Company contributions to non-US defined contribution plans were $10.4 million, $9.2 million and $12.6 million in 2016, 2015, and 2014, respectively.
Beginning in 2016, the Company changed the method used to estimate the service and interest cost components of the net periodic pension and other post retirement benefit costs. The new method uses the spot yield curve approach to estimate the service and interest costs by applying the specific spot rates along the yield curve used to determine the benefit obligations to relevant projected cash outflows. The change will not affect the measurement of the total benefit obligations as the change in service and interest costs is offset in the actuarial gains and losses recorded in other comprehensive income. The methodology of selecting a discount rate that matches each plan's cash flows to that of a theoretical bond portfolio yield curve will continue to be used to value the benefit obligation at the end of each year. The Company changed to the new method to provide a more precise measure of interest and service costs by improving the correlation between the projected benefit cash flows and the discrete spot yield curve rates. The Company has accounted for this change as a change in estimate prospectively and it resulted in a $2.9 million reduction in expense for fiscal 2016 as compared to the previous method.
Benefits provided under defined benefit pension plans are based, depending on the plan, on employees' average earnings and years of credited service, or a benefit multiplier times years of service. Funding of these qualified defined benefit pension plans is in accordance with federal laws and regulations. The actuarial valuation measurement date for pension plans is as of December 31, 2016.
The Company's target allocation, target return and actual weighted-average asset allocation by asset category are as follows:
Target | Actual Allocation | ||||||||||
Allocation | Return | 2016 | 2015 | ||||||||
Equity Investments | 76 | % | 6.3 - 7.5 % | 70 | % | 70 | % | ||||
Fixed Income | 19 | % | 3.6 - 4.5% | 25 | % | 26 | % | ||||
Other | 5 | % | 5.4 | % | 5 | % | 4 | % | |||
Total | 100 | % | 7.0 | % | 100 | % | 100 | % | |||
62
The Company's investment strategy for its defined benefit pension plans is to achieve moderately aggressive growth, earning a long-term rate of return sufficient to allow the plans to reach fully funded status. Accordingly, allocation targets have been established to fit this strategy, with a heavier long-term weighting of investments in equity securities. The long-term rate of return assumptions consider historic returns and volatilities adjusted for changes in overall economic conditions that may affect future returns and a weighting of each investment class.
The following table presents a reconciliation of the funded status of the defined benefit pension plans (in millions):
2016 | 2015 | |||||||||
Change in Projected Benefit Obligation: | ||||||||||
Obligation at Beginning of Period | $ | 255.1 | $ | 194.3 | ||||||
Service Cost | 8.1 | 10.0 | ||||||||
Interest Cost | 9.8 | 10.7 | ||||||||
Actuarial (Gain) Loss | 3.6 | (18.2 | ) | |||||||
Less: Benefits Paid (1) | 18.9 | 11.7 | ||||||||
Foreign Currency Translation | (0.8 | ) | (0.8 | ) | ||||||
Acquisitions | — | 70.8 | ||||||||
Obligation at End of Period: | $ | 256.9 | $ | 255.1 | ||||||
Change in Fair Value of Plan Assets: | ||||||||||
Fair Value of Plan Assets at Beginning of Period | 162.1 | 126.6 | ||||||||
Actual Return on Plan Assets | 7.9 | (1.0 | ) | |||||||
Employer Contributions | 9.2 | 4.7 | ||||||||
Less: Benefits Paid | 18.9 | 11.7 | ||||||||
Foreign Currency Translation | — | (0.4 | ) | |||||||
Acquisitions | — | 43.9 | ||||||||
Fair Value of Plan Assets at End of Period | $ | 160.3 | $ | 162.1 | ||||||
Funded Status | $ | (96.6 | ) | $ | (93.0 | ) | ||||
(1) 2016 benefit payments included $6.6 million of non-recurring lump sum benefit payments.
Pension Assets
The Company classifies the pension plan investments into Level 1, which refers to securities valued using quoted prices from active markets for identical assets, Level 2, which refers to securities not traded on an active market but for which observable market inputs are readily available, and Level 3, which refers to securities valued based on significant unobservable inputs. Common stocks and mutual funds are valued at the unadjusted quoted market prices for the securities. Real estate fund values are determined using model-based techniques that include relative value analysis and discounted cash flow techniques. Certain common collective trust funds and limited partnership interests are valued based on the net asset value ("NAV") as provided by the administrator of the fund as a practical expedient to estimate fair value. The NAV is based on the value of the underlying assets owned by the fund, minus its liabilities, and then divided by the number of shares outstanding. Investments in units of short-term investment funds, comprised of cash and money market funds, are valued at their respective NAVs as reported by the funds daily.
63
Pension assets by type and level are as follows (in millions):
December 31, 2016 | |||||||||||||||
Total | Level 1 | Level 2 | Level 3 | ||||||||||||
Cash and Cash Equivalents | $ | 3.5 | $ | 3.5 | $ | — | $ | — | |||||||
Common Stocks: | |||||||||||||||
Domestic Equities | 22.9 | 22.9 | — | — | |||||||||||
International Equities | 12.6 | 12.6 | — | — | |||||||||||
Mutual Funds: | |||||||||||||||
US Equity Funds | 18.8 | 18.8 | — | — | |||||||||||
International Equity Funds | 16.2 | 16.2 | — | — | |||||||||||
Balanced Funds | 8.4 | 8.4 | — | — | |||||||||||
Fixed Income Funds | 15.1 | 15.1 | — | — | |||||||||||
Other | 1.3 | 1.3 | — | — | |||||||||||
Real Estate Fund | 10.0 | — | — | 10.0 | |||||||||||
$ | 108.8 | $ | 98.8 | $ | — | $ | 10.0 | ||||||||
Investments Measured at Net Asset Value | 51.5 | ||||||||||||||
Total | $ | 160.3 | |||||||||||||
January 2, 2016 | |||||||||||||||
Total | Level 1 | Level 2 | Level 3 | ||||||||||||
Cash and Cash Equivalents | $ | 4.5 | $ | 4.5 | $ | — | $ | — | |||||||
Common Stocks: | |||||||||||||||
Domestic Equities | 24.9 | 24.9 | — | — | |||||||||||
International Equities | 9.6 | 9.6 | — | — | |||||||||||
Mutual Funds: | |||||||||||||||
US Equity Funds | 22.3 | 22.3 | — | — | |||||||||||
Balanced funds | 9.7 | 9.7 | — | ||||||||||||
International Equity Funds | 16.8 | 16.8 | — | — | |||||||||||
Fixed Income Funds | 15.0 | 15.0 | |||||||||||||
Other | 1.0 | 1.0 | — | — | |||||||||||
Real Estate Fund | 8.1 | — | — | 8.1 | |||||||||||
$ | 111.9 | $ | 103.8 | $ | — | $ | 8.1 | ||||||||
Investments Measured at Net Asset Value | 50.2 | ||||||||||||||
Total | $ | 162.1 | |||||||||||||
The common collective trust funds are investments in the Northern Trust Collective S&P 500 Index Fund and the Northern Trust Collective Aggregate Bond Index Fund. The Northern Trust Collective S&P 500 Index Fund seeks to provide investment results that approximate the overall performance of the common stocks in that index. The Northern Trust Collective Aggregate Bond Index Fund seeks to provide investment results that approximate the overall performance of the Barclays Capital US Aggregate Index by investing primarily, but not exclusively, in securities that comprise that index. The common collective trust funds are available for immediate redemption. The global emerging markets fund limited partnership interest is an investment in the Vontobel Global Emerging Markets Fund, which seeks to provide capital appreciation by investing in a diversified portfolio consisting primarily of equity based securities. The global emerging markets fund limited partnership interest can be redeemed on a monthly basis with immediate payment.
The following table sets forth additional disclosures for the fair value measurement of the fair value of pension plan assets that calculate fair value based on NAV per share practical expedient as of December 31, 2016 (in millions):
64
2016 | 2015 | |||||||||
Common Collective Trust Funds | $ | 45.1 | $ | 43.8 | ||||||
Global Emerging Markets Fund Limited Partnership | 6.4 | 6.4 | ||||||||
Total | $ | 51.5 | $ | 50.2 | ||||||
The Level 3 assets noted below represent investments in real estate funds managed by a major US insurance company and a global emerging markets fund limited partnership. Estimated values provided by fund management approximate the cost of the investments. In determining the reasonableness of the methodology used to value the Level 3 investments, the Company evaluates a variety of factors including reviews of economic conditions, industry and market developments, and overall credit ratings. The real estate fund can be redeemed on a quarterly basis and paid within two weeks of the request for redemption.
The table below sets forth a summary of changes in the Company's Level 3 assets in its pension plan investments as of December 31, 2016 and January 2, 2016 (in millions):
December 31, 2016 | January 2, 2016 | |||||||
Beginning Balance | $ | 8.1 | $ | 6.2 | ||||
Acquisition | — | 1.0 | ||||||
Net Purchases | 1.7 | 0.2 | ||||||
Net Gains | 0.2 | 0.7 | ||||||
Ending Balance | $ | 10.0 | $ | 8.1 | ||||
The following table sets forth a summary of quantitative information about the significant unobservable inputs used in the fair value measurement of the Level 3 real estate fund as of December 31, 2016 (in millions):
Fair Value | Significant Unobservable Inputs | ||||
$ | 10.0 | Exit Capitalization Rate | 4.9% to 7.0% | ||
Discount Rate | 6.6% to 8.0% | ||||
The following table sets forth a summary of quantitative information about the significant unobservable inputs used in the fair value measurement of the Level 3 real estate fund as of January 2, 2016 (in millions):
Fair Value | Significant Unobservable Inputs | ||||
$ | 8.1 | Exit Capitalization Rate | 4.9% to 7.0% | ||
Discount Rate | 6.6% to 8.3% | ||||
Funded Status and Expense
The Company recognized the funded status of its defined benefit pension plans on the Balance Sheet as follows (in millions):
2016 | 2015 | |||||||
Accrued Compensation and Employee Benefits | $ | 2.8 | $ | 2.7 | ||||
Pension and Other Post Retirement Benefits | 93.8 | 90.3 | ||||||
$ | 96.6 | $ | 93.0 | |||||
Amounts Recognized in Accumulated Other Comprehensive Loss | ||||||||
Net Actuarial Loss | $ | 54.5 | $ | 51.1 | ||||
Prior Service Cost | 1.2 | 1.2 | ||||||
$ | 55.7 | $ | 52.3 | |||||
The accumulated benefit obligation for all defined benefit pension plans was $232.9 million and $226.9 million at December 31, 2016 and January 2, 2016, respectively.
The accumulated plan benefit obligation exceeded plan assets for all pension plans as of December 31, 2016 and January 2, 2016.
65
The following weighted average assumptions were used to determine the projected benefit obligation at December 31, 2016 and January 2, 2016, respectively:
2016 | 2015 | ||
Discount Rate | 4.3% | 4.6% | |
The objective of the discount rate assumption is to reflect the rate at which the pension benefits could be effectively settled. In making the determination, the Company takes into account the timing and amount of benefits that would be available under the plans. The methodology for selecting the discount rate was to match the plan's cash flows to that of a theoretical bond portfolio yield curve.
Certain of the Company's defined benefit pension plan obligations are based on years of service rather than on projected compensation percentage increases. For those plans that use compensation increases in the calculation of benefit obligations and net periodic pension cost, the Company used an assumed rate of compensation increase of 3.0% for the years ended December 31, 2016 and January 2, 2016.
Net periodic pension benefit costs and the net actuarial loss and prior service cost recognized in other comprehensive income (“OCI”) for the defined benefit pension plans were as follows (in millions):
2016 | 2015 | 2014 | ||||||||||
Service Cost | $ | 8.1 | $ | 10.0 | $ | 2.5 | ||||||
Interest Cost | 9.8 | 10.7 | 8.3 | |||||||||
Expected Return on Plan Assets | (11.9 | ) | (11.5 | ) | (9.2 | ) | ||||||
Amortization of Net Actuarial Loss | 3.1 | 4.3 | 2.3 | |||||||||
Amortization of Prior Service Cost | 0.2 | 0.2 | 0.2 | |||||||||
Net Periodic Benefit Cost | $ | 9.3 | $ | 13.7 | $ | 4.1 | ||||||
Change in Obligations Recognized in OCI, Net of Tax | ||||||||||||
Prior Service Cost | $ | 0.1 | $ | 0.1 | $ | 0.1 | ||||||
Net Actuarial Loss | 2.0 | 2.8 | 1.3 | |||||||||
Total Recognized in OCI | $ | 2.1 | $ | 2.9 | $ | 1.4 | ||||||
The estimated prior service cost and net actuarial loss for the defined benefit pension plans that will be amortized from AOCI into net periodic benefit cost during the 2017 fiscal year are $0.2 million, and $2.2 million respectively.
As permitted under relevant accounting guidance, the amortization of any prior service cost is determined using a straight-line amortization of the cost over the average remaining service period of employees expected to receive benefits under the plans.
The following weighted average assumptions were used to determine net periodic pension cost for fiscal years 2016, 2015 and 2014, respectively.
2016 | 2015 | 2014 | ||||
Discount Rate | 4.6% | 4.2% | 5.0% | |||
Expected Long-Term Rate of Return on Assets | 7.2% | 7.5% | 8.0% | |||
The Company made contributions to its defined benefit plan of $9.2 million and $4.7 million for the fiscal years ended December 31, 2016 and January 2, 2016, respectively.
The Company estimates that in 2017 it will make contributions in the amount of $3.3 million to fund its defined benefit pension plans.
The following pension benefit payments, which reflect expected future service, as appropriate, are expected to be paid (in millions):
66
Year | Expected Payments | |||
2017 | $ | 13.6 | ||
2018 | 13.2 | |||
2019 | 14.0 | |||
2020 | 14.6 | |||
2021 | 15.7 | |||
2022- 2025 | 83.5 | |||
Post Retirement Health Care Plan
In connection with the PTS acquisition, the Company established an unfunded post retirement health care plan for certain domestic retirees and their dependents.
The following table presents a reconciliation of the benefit obligation of the post retirement health care plan (in millions):
Change in accumulated post retirement benefit obligation | 2016 | 2015 | ||||||
Obligation at Beginning of Period | $ | 16.8 | $ | — | ||||
Service Cost | 0.1 | 0.1 | ||||||
Interest Cost | 0.5 | 0.5 | ||||||
Actuarial (Gain) Loss | (2.4 | ) | 2.9 | |||||
Participant Contributions | 0.2 | 0.6 | ||||||
Less: Benefits Paid | 1.4 | 3.1 | ||||||
Acquisitions | — | 15.8 | ||||||
Obligation at End of Period | $ | 13.8 | $ | 16.8 | ||||
The Company recognized the funded status of its post retirement health care plan on the balance sheet as follows (in millions):
2016 | 2015 | |||||||
Accrued Compensation and Employee Benefits | $ | 1.1 | $ | 1.2 | ||||
Pension and Other Post Retirement Benefits | 12.7 | 15.6 | ||||||
$ | 13.8 | $ | 16.8 | |||||
Amounts Recognized in Accumulated Other Comprehensive Loss | ||||||||
Net Actuarial Loss | $ | 0.4 | $ | 2.9 | ||||
Net periodic benefit costs for the post retirement health care plan were as follows (in millions):
2016 | 2015 | |||||||
Service Cost | $ | 0.1 | $ | 0.1 | ||||
Interest Cost | 0.5 | 0.5 | ||||||
Amortization of Net Actuarial Loss | 0.2 | — | ||||||
Net Periodic Benefit Cost | $ | 0.8 | $ | 0.6 | ||||
The amortization of prior service cost recognized in OCI, net of tax, for fiscal 2016 was $0.1 million. There will be no amortization of net actuarial loss for the post retirement health care plan from Other Comprehensive Income into net periodic benefit cost during the 2017 fiscal year.
The discount rate used to measure the benefit as of December 31, 2016 was 3.9%. The health care cost trend rate for 2017 is 7.0% for pre-65 participants and 5.4% for post-65 participants, decreasing to 4.5% in 2025. A one percentage point change in the health
67
care cost trend rate assumption would have a $0.4 million impact on the benefit obligation and an immaterial impact on post retirement benefits expense.
In 2016, the Company contributed $1.2 million to the post retirement health care plan. The Company estimates that, in 2017, it will make contributions of $1.1 million to the post retirement health care plan.
The following post retirement benefit payments, which reflect expected future service, as appropriate, are expected to be paid (in millions):
Year | Expected Payments | |||
2017 | $ | 1.1 | ||
2018 | 1.2 | |||
2019 | 1.3 | |||
2020 | 1.3 | |||
2021 | 1.3 | |||
2022 - 2026 | 5.5 | |||
(9) Shareholders' Equity
Common Stock
The Company acquired and retired 180,000 shares of its common stock in the quarter ended October 3, 2015 at an average cost of $66.56 per share for a total of $12.0 million. The Company acquired and retired 500,000 shares of its common stock in the third quarter of 2014 at an average cost of $69.94 per share for a total of $35.0 million. The repurchases were under the 3.0 million share repurchase program approved by the Company's Board of Directors. There are approximately 2.3 million shares of our common stock available for repurchase under this program.
Share Based Compensation
The Company recognized approximately $13.3 million, $13.9 million and $11.9 million in share-based compensation expense in 2016, 2015 and 2014, respectively. The total income tax benefit recognized in the Consolidated Statements of Income for share-based compensation expense was $5.1 million, $5.3 million, and $4.5 million in 2016, 2015 and 2014, respectively. The Company recognizes compensation expense on grants of share-based compensation awards on a straight-line basis over the vesting period of each award. The total fair value of shares and options vested was $11.3 million, $10.9 million, and $11.1 million in in 2016, 2015 and 2014, respectively. As of December 31, 2016, total unrecognized compensation cost related to share-based compensation awards was approximately $24.2 million, net of estimated forfeitures, which the Company expects to recognize over a weighted average period of approximately 2.0 years.
During 2014, the Company's shareholders approved the 2013 Equity Incentive Plan ("2013 Plan"). The 2013 Plan authorizes the issuance of 3.5 million shares of common stock for equity-based awards, and terminates any further grants under prior equity plans. Approximately 1.4 million shares were available for future grant or payment under the 2013 Plan at December 31, 2016.
Options and Stock Appreciation Rights
The Company uses several forms of share-based incentive awards, including non-qualified stock options, incentive stock options, and stock settled stock appreciation rights ("SARs"). Options and SARs generally vest over 5 years and expire 10 years from the grant date. All grants are made at prices equal to the fair market value of the stock on the grant date. The majority of the Company’s annual share-based incentive awards are made in the fiscal second quarter. For years ended December 31, 2016, January 2, 2016, and January 3, 2015, expired and canceled shares were immaterial.
The table below presents share-based compensation activity for the three fiscal years ended 2016, 2015 and 2014 (in millions):
2016 | 2015 | 2014 | ||||||||||
Total Intrinsic Value of Share-Based Incentive Awards Exercised | $ | 2.5 | $ | 4.3 | $ | 5.2 | ||||||
Cash Received from Stock Option Exercises | 0.5 | 4.1 | 1.9 | |||||||||
Income Tax Benefit from the Exercise of Stock Options | — | 1.6 | 2.0 | |||||||||
Total Fair Value of Share-Based Incentive Awards Vested | 4.9 | 4.9 | 5.5 | |||||||||
The assumptions used in the Company's Black-Scholes valuation related to grants for options and SARs were as follows:
68
2016 | 2015 | 2014 | |||||||||
Per Share Weighted Average Fair Value of Grants | $ | 15.22 | $ | 27.15 | $ | 28.01 | |||||
Risk-Free Interest Rate | 1.4 | % | 1.9 | % | 2.0 | % | |||||
Expected Life (Years) | 7.0 | 7.0 | 7.0 | ||||||||
Expected Volatility | 29.6 | % | 35.6 | % | 37.7 | % | |||||
Expected Dividend Yield | 1.7 | % | 1.2 | % | 1.2 | % | |||||
The average risk-free interest rate is based on US Treasury security rates in effect as of the grant date. The expected dividend yield is based on the projected annual dividend as a percentage of the estimated market value of the Company's common stock as of the grant date. The Company estimated the expected volatility using a weighted average of daily historical volatility of the Company's stock price over the expected term of the award. The Company estimated the expected term using historical data.
Following is a summary of share-based incentive plan activity (options and SARs) for fiscal 2016:
Number of Shares Under Options and SARs | Shares | Weighted Average Exercise Price | Weighted Average Remaining Contractual Term (years) | Aggregate Intrinsic Value (in millions) | ||||||||
Outstanding at January 2, 2016 | 1,548,266 | $ | 63.09 | |||||||||
Granted | 293,400 | 57.43 | ||||||||||
Exercised | (137,475 | ) | 45.60 | |||||||||
Forfeited | (34,887 | ) | 71.91 | |||||||||
Expired | (58,805 | ) | 68.56 | |||||||||
Outstanding at December 31, 2016 | 1,610,499 | $ | 63.16 | 5.8 | $ | 12.9 | ||||||
Exercisable at December 31, 2016 | 952,766 | $ | 60.77 | 4.0 | 9.2 | |||||||
Compensation expense recognized related to options and SARs was $4.2 million for fiscal 2016.
As of December 31, 2016, there was $9.8 million of unrecognized compensation cost related to non-vested options and SARs that is expected to be recognized as a charge to earnings over a weighted average period of 3.3 years.
The amount of options and SARs expected to vest is materially consistent with those outstanding and not yet exercisable.
Restricted Stock Awards and Restricted Stock Units
Restricted stock awards ("RSA") and restricted stock units ("RSU") consist of shares or the rights to shares of the Company's stock. The awards are restricted such that they are subject to substantial risk of forfeiture and to restrictions on their sale or other transfer. As defined in the individual grant agreements, acceleration of vesting may occur under a change in control, or death, disability or normal retirement of the grantee. RSAs and RSUs are valued using the closing market price as of the grant date.
Following is a summary of RSA activity for fiscal 2016:
Shares | Weighted Average Fair Value at Grant Date | Weighted Average Remaining Contractual Term (years) | |||||||
Unvested RSAs at January 2, 2016 | 14,400 | $ | 78.15 | 0.4 | |||||
Granted | 19,593 | 57.43 | |||||||
Vested | (14,400 | ) | 78.15 | ||||||
Unvested RSAs December 31, 2016 | 19,593 | $ | 57.43 | 0.4 | |||||
The weighted average grant date fair value of awards granted was $57.43, $78.15 and $75.76 in 2016, 2015 and 2014, respectively.
RSAs vest on the first anniversary of the grant date, provided the holder of the shares is continuously employed by or in the service of the Company until the vesting date. Compensation expense recognized related to the RSAs was $1.1 million for fiscal 2016.
69
As of December 31, 2016, there was $0.4 million of unrecognized compensation cost related to non-vested RSAs that is expected to be recognized as a charge to earnings over a weighted average period of 0.4 years.
Following is a summary of RSU activity for fiscal 2016:
Shares | Weighted Average Fair Value at Grant Date | Weighted Average Remaining Contractual Term (years) | |||||||||
Unvested RSUs at January 2, 2016 | 268,655 | $ | 72.91 | 1.8 | |||||||
Granted | 105,648 | 57.50 | |||||||||
Vested | (81,085 | ) | 65.23 | ||||||||
Forfeited | (15,355 | ) | 74.18 | ||||||||
Unvested RSUs at December 31, 2016 | 277,863 | $ | 69.23 | 1.7 | |||||||
The weighted average grant date fair value of awards granted was $57.50, $77.38 and $74.77 in 2016, 2015 and 2014, respectively.
RSUs vest on the third anniversary of the grant date, provided the holder of the shares is continuously employed by the Company until the vesting date. Compensation expense recognized related to the RSUs was $5.6 million for fiscal 2016.
As of December 31, 2016, there was $9.2 million of unrecognized compensation cost related to non-vested RSUs that is expected to be recognized as a charge to earnings over a weighted average period of 1.7 years.
Performance Share Units
Performance share unit ("PSU") awards consist of shares or the rights to shares of the Company's stock which are awarded to employees of the Company. These shares are payable upon the determination that the Company achieved certain established performance targets and can range from 0% to 200% of the targeted payout based on the actual results. PSUs have a performance period of 3 years. As set forth in the individual grant agreements, acceleration of vesting may occur under a change in control, death or disability. There are no voting rights with these instruments until vesting occurs and a share of stock is issued. Some of the PSU awards are valued using a Monte Carlo simulation method as of the grant date while others are valued using the closing market price as of the grant date depending on the performance criteria for the award.
Following is a summary of PSU activity for fiscal 2016:
Shares | Weighted Average Fair Value at Grant Date | Weighted Average Remaining Contractual Term (years) | |||||||||
Unvested PSUs at January 2, 2016 | 87,895 | $ | 75.81 | 1.9 | |||||||
Granted | 83,605 | 51.84 | |||||||||
Forfeited | (38,160 | ) | 60.10 | ||||||||
Unvested PSUs December 31, 2016 | 133,340 | $ | 65.28 | 2.0 | |||||||
The weighted average grant date fair value of awards granted was $51.84, $89.98 and $83.74 in 2016, 2015 and 2014, respectively.
Compensation expense for awards granted are recognized based on the Monte Carlo simulation value or the expected payout ratio depending upon the performance criterion for the award, net of estimated forfeitures. Compensation expense recognized related to PSUs was $2.4 million for fiscal 2016 and $1.8 million for fiscal 2015. Total unrecognized compensation expense for all PSUs granted as of December 31, 2016 was $4.8 million and it is expected to be recognized as a charge to earnings over a weighted average period of 2.0 years.
(10) Income Taxes
Income (loss) before taxes consisted of the following (in millions):
70
2016 | 2015 | 2014 | ||||||||||
United States | $ | 143.4 | $ | 25.8 | $ | (11.2 | ) | |||||
Foreign | 123.0 | 171.1 | 101.5 | |||||||||
Total | $ | 266.4 | $ | 196.9 | $ | 90.3 | ||||||
The provision for income taxes is summarized as follows (in millions):
2016 | 2015 | 2014 | ||||||||||
Current | ||||||||||||
Federal | $ | 23.1 | $ | 13.5 | $ | 37.8 | ||||||
State | 3.5 | 0.2 | 1.5 | |||||||||
Foreign | 30.4 | 45.1 | 41.3 | |||||||||
$ | 57.0 | $ | 58.8 | $ | 80.6 | |||||||
Deferred | ||||||||||||
Federal | $ | 5.6 | $ | (2.0 | ) | $ | (21.2 | ) | ||||
State | 1.8 | (0.9 | ) | (2.0 | ) | |||||||
Foreign | (7.3 | ) | (7.5 | ) | (3.2 | ) | ||||||
0.1 | (10.4 | ) | (26.4 | ) | ||||||||
Total | $ | 57.1 | $ | 48.4 | $ | 54.2 | ||||||
A reconciliation of the statutory federal income tax rate and the effective tax rate reflected in the consolidated statements of income follows:
2016 | 2015 | 2014 | |||||||
Federal Statutory Rate | 35.0 | % | 35.0 | % | 35.0 | % | |||
State Income Taxes, Net of Federal Benefit | 1.5 | % | (0.2 | )% | (0.4 | )% | |||
Domestic Production Activities Deduction | (1.1 | )% | (1.0 | )% | (2.7 | )% | |||
Foreign Rate Differential - China | (2.0 | )% | (3.3 | )% | (7.7 | )% | |||
Foreign Rate Differential - All Other | (6.0 | )% | (7.2 | )% | (4.8 | )% | |||
Research and Development Credit | (2.3 | )% | (4.1 | )% | (7.4 | )% | |||
Goodwill Impairment | — | % | 4.0 | % | 42.9 | % | |||
Valuation Allowance | — | % | — | % | 4.2 | % | |||
Adjustments to Tax Accruals and Reserves | 0.7 | % | 2.1 | % | 2.4 | % | |||
Write Down of Venezuelan Assets | — | % | 2.3 | % | — | % | |||
Other | (4.4 | )% | (3.0 | )% | (1.5 | )% | |||
Effective Tax Rate | 21.4 | % | 24.6 | % | 60.0 | % | |||
Deferred taxes arise primarily from differences in amounts reported for tax and financial statement purposes. The Company's net deferred tax liability was $(75.3) million as of December 31, 2016, classified on the consolidated Balance Sheet as a net non-current deferred tax asset of $22.4 million and a net non-current deferred income tax liability of $(97.7) million. As of January 2, 2016, the Company's net deferred tax liability was $(82.3) million classified on the consolidated Balance Sheet as a net non-current deferred income tax benefit of $18.6 million and a net non-current deferred income tax liability of $(100.9) million.
71
The components of this net deferred tax liability are as follows (in millions):
December 31, 2016 | January 2, 2016 | |||||||||
Accrued Employee Benefits | $ | 75.1 | $ | 72.9 | ||||||
Bad Debt Allowances | 2.7 | 4.9 | ||||||||
Warranty Accruals | 5.5 | 4.9 | ||||||||
Inventory | 21.3 | 22.5 | ||||||||
Accrued Liabilities | 9.2 | 7.4 | ||||||||
Derivative Instruments | 25.9 | 30.3 | ||||||||
Tax Loss Carryforward | 12.4 | 14.4 | ||||||||
Valuation Allowance | (6.8 | ) | (8.2 | ) | ||||||
Other | 5.0 | 4.7 | ||||||||
Deferred Tax Assets | 150.3 | 153.8 | ||||||||
Property Related | (31.4 | ) | (46.1 | ) | ||||||
Intangible Items | (194.2 | ) | (190.0 | ) | ||||||
Deferred Tax Liabilities | (225.6 | ) | (236.1 | ) | ||||||
Net Deferred Tax Liability | $ | (75.3 | ) | $ | (82.3 | ) | ||||
Following is a reconciliation of the beginning and ending amount of unrecognized tax benefits (in millions):
Unrecognized Tax Benefits, December 28, 2013 | $ | 4.4 | ||||||
Gross Increases from Prior Period Tax Positions | 0.1 | |||||||
Gross Increases from Current Period Tax Positions | 3.6 | |||||||
Settlements with Taxing Authorities | (2.1 | ) | ||||||
Lapse of Statute of Limitations | (0.2 | ) | ||||||
Unrecognized Tax Benefits, January 3, 2015 | $ | 5.8 | ||||||
Gross Increases from Prior Period Tax Positions | — | |||||||
Gross Increases from Current Period Tax Positions | 4.0 | |||||||
Settlements with Taxing Authorities | (1.3 | ) | ||||||
Lapse of Statute of Limitations | (0.2 | ) | ||||||
Unrecognized Tax Benefits, January 2, 2016 | $ | 8.3 | ||||||
Gross Increases from Prior Period Tax Positions | — | |||||||
Gross Increases from Current Period Tax Positions | 2.0 | |||||||
Settlements with Taxing Authorities | — | |||||||
Lapse of Statute of Limitations | (0.3 | ) | ||||||
Unrecognized Tax Benefits, December 31, 2016 | $ | 10.0 | ||||||
Unrecognized tax benefits as of December 31, 2016 amount to $10.0 million, all of which would impact the effective income tax rate if recognized.
Potential interest and penalties related to unrecognized tax benefits are recorded in income tax expense. During fiscal 2016, 2015 and 2014, the Company recognized approximately $0.2 million, $0.6 million and $(0.2) million in net interest (income) expense, respectively. The Company had approximately $1.9 million, $1.7 million and $1.1 million of accrued interest as of December 31, 2016, January 2, 2016 and January 3, 2015, respectively.
Due to statute expirations, approximately $0.3 million of the unrecognized tax benefits, including accrued interest, could reasonably change in the coming year.
With few exceptions, the Company is no longer subject to US federal and state/local income tax examinations by tax authorities for years prior to 2011, and the Company is no longer subject to non-US income tax examinations by tax authorities for years prior to 2009.
72
At December 31, 2016, the Company had approximately $12.4 million of tax effected net operating losses in various jurisdictions with a portion expiring over a period of up to 15 years and the remaining without expiration. At January 2, 2016, the Company had approximately $14.4 million of tax effected net operating losses in various jurisdictions with a portion expiring over a period up to 15 years and the remaining without expiration.
Valuation allowances totaling $6.8 million and $8.2 million as of December 31, 2016 and January 2, 2016, respectively, have been established for deferred income tax assets primarily related to certain subsidiary loss carryforwards that may not be realized. Realization of the net deferred income tax assets is dependent on generating sufficient taxable income prior to their expiration. Although realization is not assured, management believes it is more-likely-than-not that the net deferred income tax assets will be realized. The amount of the net deferred income tax assets considered realizable, however, could change in the near term if future taxable income during the carryforward period fluctuates.
The Company has been granted tax holidays for some of its Chinese subsidiaries. These tax holidays expire in 2017 and are renewable subject to certain conditions with which the Company expects to comply. In 2016, these holidays decreased the Provision for Income Taxes by $2.2 million.
The Company considers the earnings of certain non-US subsidiaries to be indefinitely invested outside the United States on the basis of estimates that future domestic cash generation will be sufficient to meet future domestic cash needs and its specific plans for reinvestment of those subsidiary earnings. The Company has not recorded a deferred tax liability of approximately $130.5 million related to the US federal and state income taxes and foreign withholding taxes on approximately $721.9 million of undistributed earnings of foreign subsidiaries indefinitely invested outside the United States. Should the Company decide to repatriate the foreign earnings, it would need to adjust its income tax provision in the period it determined that the earnings will no longer be indefinitely invested outside the United States.
(11) Contingencies and Commitments
One of the Company's subsidiaries that it acquired in 2007 is subject to numerous claims filed in various jurisdictions relating to certain sub-fractional motors that were primarily manufactured through 2004 and that were included as components of residential and commercial ventilation units manufactured and sold in high volumes by a third party. These claims generally allege that the ventilation units were the cause of fires. Based on the current facts, the Company is not able to assure that these claims, individually or in the aggregate, will not have a material effect on its subsidiary’s results of operations, financial condition or cash flows. The Company is not able to reasonably predict the outcome of these claims, the nature or extent of remedial actions, if any, its subsidiary, or the Company on its behalf, may be required to undertake with respect to motors that remain in the field, or the costs that may be incurred, some of which could be significant.
The Company is, from time to time, party to litigation and other legal or regulatory proceedings that arise in the normal course of its business operations and the outcomes of which are subject to significant uncertainty, including product warranty and liability claims, contract disputes and environmental, asbestos, intellectual property, employment and other litigation matters. The Company's products are used in a variety of industrial, commercial and residential applications that subject the Company to claims that the use of its products is alleged to have resulted in injury or other damage. Many of these matters will only be resolved when one or more future events occur or fail to occur. Management conducts regular reviews, including updates from legal counsel, to assess the need for accounting recognition or disclosure of these contingencies, and such assessment inherently involves an exercise in judgment. The Company accrues for exposures in amounts that it believes are adequate, and the Company does not believe that the outcome of any such lawsuit individually or collectively will have a material effect on the Company's financial position, its results of operations or its cash flows.
The Company recognizes the cost associated with its standard warranty on its products at the time of sale. The amount recognized is based on historical experience. The following is a reconciliation of the changes in accrued warranty costs for 2016 and 2015 (in millions):
December 31, 2016 | January 2, 2016 | |||||||
Beginning Balance | $ | 19.1 | $ | 19.3 | ||||
Less: Payments | 20.6 | 21.5 | ||||||
Provisions | 21.9 | 20.5 | ||||||
Acquisitions | — | 0.8 | ||||||
Translation Adjustments | (0.1 | ) | — | |||||
Ending Balance | $ | 20.3 | $ | 19.1 | ||||
73
These liabilities are included in Other Accrued Expenses and Other Noncurrent Liabilities on the Consolidated Balance Sheet.
(12) Leases and Rental Commitments
Rental expenses charged to operations amounted to $31.9 million in 2016, $45.1 million in 2015 and $38.3 million in 2014. The Company has future minimum rental commitments under operating leases as shown in the following table (in millions):
Year | Expected Payments | ||||||
2017 | $ | 19.4 | |||||
2018 | 10.8 | ||||||
2019 | 5.9 | ||||||
2020 | 3.7 | ||||||
2021 | 3.4 | ||||||
Thereafter | 4.8 | ||||||
(13) Derivative Financial Instruments
The Company is exposed to certain risks relating to its ongoing business operations. The primary risks managed using derivative instruments are commodity price risk, currency exchange risk, and interest rate risk. Forward contracts on certain commodities are entered into to manage the price risk associated with forecasted purchases of materials used in the Company's manufacturing process. Forward contracts on certain currencies are entered into to manage forecasted cash flows in certain foreign currencies. Interest rate swaps are entered into to manage interest rate risk associated with the Company's floating rate borrowings.
The Company is exposed to credit losses in the event of non-performance by the counterparties to various financial agreements, including its commodity hedging transactions, foreign currency exchange contracts and interest rate swap agreements. Exposure to counterparty credit risk is managed by limiting counterparties to major international banks and financial institutions meeting established credit guidelines and continually monitoring their compliance with the credit guidelines. The Company does not obtain collateral or other security to support financial instruments subject to credit risk. The Company does not anticipate non-performance by its counterparties, but cannot provide assurances.
The Company recognizes all derivative instruments as either assets or liabilities at fair value in the statement of financial position. The Company designates commodity forward contracts as cash flow hedges of forecasted purchases of commodities, currency forward contracts as cash flow hedges of forecasted foreign currency cash flows and interest rate swaps as cash flow hedges of forecasted LIBOR-based interest payments. There were no significant collateral deposits on derivative financial instruments as of December 31, 2016.
For derivative instruments that are designated and qualify as a cash flow hedge, the effective portion of the gain or loss on the derivative is reported as a component of AOCI and reclassified into earnings in the same period or periods during which the hedged transaction affects earnings. Gains and losses on the derivative representing either hedge ineffectiveness or changes in market value of derivatives not designated as hedges are recognized in current earnings. At December 31, 2016 and January 2, 2016 the Company had $(7.5) million and $(7.4) million, net of tax, of derivative losses on closed hedge instruments in AOCI that will be realized in earnings when the hedged items impact earnings.
The Company had outstanding the following notional amounts to hedge forecasted purchases of commodities (in millions):
December 31, 2016 | January 2, 2016 | |||||||
Copper | $ | 50.7 | $ | 59.4 | ||||
Aluminum | 4.9 | 4.2 | ||||||
As of December 31, 2016, the maturities of commodity forward contracts extended through December 2017.
The Company had outstanding the following notional amounts of currency forward contracts (in millions):
74
December 31, 2016 | January 2, 2016 | |||||||
Mexican Peso | $ | 230.1 | $ | 339.4 | ||||
Chinese Renminbi | 275.5 | 233.9 | ||||||
Indian Rupee | 43.6 | 54.5 | ||||||
Euro | 69.0 | 68.5 | ||||||
Canadian Dollar | 41.8 | 6.2 | ||||||
Australian Dollar | 12.1 | 10.8 | ||||||
Thai Baht | 4.9 | 3.7 | ||||||
Japanese Yen | 2.8 | 2.7 | ||||||
Great Britain Pound | 4.3 | 4.8 | ||||||
Singapore Dollar | — | 0.5 | ||||||
As of December 31, 2016, the maturities of currency forward contracts extended through October 2019.
As of December 31, 2016 and January 2, 2016, the total notional amount of the Company's receive-variable/pay-fixed interest rate swap was $100.0 million (with maturities extending to August 2017).
Fair values of derivative instruments were (in millions):
December 31, 2016 | ||||||||||||||||
Prepaid Expenses | Other Noncurrent Assets | Hedging Obligations (Current) | Hedging Obligations (Noncurrent) | |||||||||||||
Designated as Hedging Instruments: | ||||||||||||||||
Interest Rate Swap Contracts | $ | — | $ | — | $ | 3.3 | $ | — | ||||||||
Currency Contracts | 1.3 | 0.4 | 39.7 | 17.6 | ||||||||||||
Commodity Contracts | 4.7 | — | — | — | ||||||||||||
Not Designated as Hedging Instruments: | ||||||||||||||||
Currency Contracts | 1.5 | — | 6.0 | — | ||||||||||||
Commodity Contracts | 2.6 | — | — | — | ||||||||||||
Total Derivatives | $ | 10.1 | $ | 0.4 | $ | 49.0 | $ | 17.6 | ||||||||
January 2, 2016 | ||||||||||||||||
Prepaid Expenses | Other Noncurrent Assets | Hedging Obligations (Current) | Hedging Obligations (Noncurrent) | |||||||||||||
Designated as Hedging Instruments: | ||||||||||||||||
Interest Rate Swap Contracts | $ | — | $ | — | $ | — | $ | 7.8 | ||||||||
Currency Contracts | 0.7 | 0.4 | 29.9 | 19.5 | ||||||||||||
Commodity Contracts | 0.1 | — | 8.7 | — | ||||||||||||
Not Designated as Hedging Instruments: | ||||||||||||||||
Currency Contracts | 0.5 | 0.6 | 0.9 | 0.3 | ||||||||||||
Commodity Contracts | 5.1 | — | 5.2 | — | ||||||||||||
Total Derivatives | $ | 6.4 | $ | 1.0 | $ | 44.7 | $ | 27.6 | ||||||||
Derivatives Designated as Cash Flow Hedging Instruments
The effect of derivative instruments on the consolidated statements of income and comprehensive income for fiscal 2016, 2015 and 2014 were (in millions):
75
Fiscal 2016 | ||||||||||||||||
Interest | ||||||||||||||||
Commodity | Currency | Rate | ||||||||||||||
Forwards | Forwards | Swaps | Total | |||||||||||||
Gain (Loss) Recognized in Other Comprehensive Income (Loss) | $ | 6.4 | $ | (46.1 | ) | $ | (0.3 | ) | $ | (40.0 | ) | |||||
Amounts Reclassified from Other Comprehensive Income (Loss): | ||||||||||||||||
Gain Recognized in Net Sales | — | 0.2 | — | 0.2 | ||||||||||||
(Loss) Recognized in Cost of Sales | (13.6 | ) | (32.1 | ) | — | (45.7 | ) | |||||||||
(Loss) Recognized in Interest Expense | — | — | (4.8 | ) | (4.8 | ) | ||||||||||
Fiscal 2015 | ||||||||||||||||
Interest | ||||||||||||||||
Commodity | Currency | Rate | ||||||||||||||
Forwards | Forwards | Swaps | Total | |||||||||||||
(Loss) Recognized in Other Comprehensive Income (Loss) | $ | (22.3 | ) | $ | (46.5 | ) | $ | (1.1 | ) | $ | (69.9 | ) | ||||
Amounts Reclassified from Other Comprehensive Income (Loss): | ||||||||||||||||
Gain Recognized in Net Sales | — | 0.2 | — | 0.2 | ||||||||||||
(Loss) Recognized in Cost of Sales | (19.8 | ) | (18.5 | ) | — | (38.3 | ) | |||||||||
(Loss) Recognized in Interest Expense | — | — | (5.2 | ) | (5.2 | ) | ||||||||||
Fiscal 2014 | ||||||||||||||||
Interest | ||||||||||||||||
Commodity | Currency | Rate | ||||||||||||||
Forwards | Forwards | Swaps | Total | |||||||||||||
(Loss) Recognized in Other Comprehensive Income (Loss) | $ | (18.8 | ) | $ | (25.2 | ) | $ | (0.5 | ) | $ | (44.5 | ) | ||||
Amounts Reclassified from Other Comprehensive Income (Loss): | ||||||||||||||||
(Loss) Gain Recognized in Cost of Sales | (7.1 | ) | 7.6 | — | 0.5 | |||||||||||
(Loss) Recognized in Interest Expense | — | — | (10.3 | ) | (10.3 | ) | ||||||||||
The ineffective portion of hedging instruments recognized was immaterial for all periods presented.
Derivatives Not Designated as Cash Flow Hedging Instruments
The effect of derivative instruments on the consolidated statements of income for fiscal 2016, 2015 and 2014 were (in millions):
76
Fiscal 2016 | ||||||||||||||
Commodity Forwards | Currency Forwards | Total | ||||||||||||
Gain Recognized in Cost of Sales | $ | 2.6 | $ | — | $ | 2.6 | ||||||||
Loss Recognized in Operating Expenses | — | (5.2 | ) | (5.2 | ) | |||||||||
Fiscal 2015 | ||||||||||||||
Commodity Forwards | Currency Forwards | Total | ||||||||||||
Loss Recognized in Operating Expenses | $ | — | $ | (8.8 | ) | $ | (8.8 | ) | ||||||
Fiscal 2014 | ||||||||||||||
Commodity Forwards | Currency Forwards | Total | ||||||||||||
Loss Recognized in Cost of Sales | $ | — | $ | (1.3 | ) | $ | (1.3 | ) | ||||||
The net AOCI balance related to hedging activities of $(41.1) million losses at December 31, 2016 includes $(24.1) million of net deferred losses expected to be reclassified to the Statement of Income in the next twelve months. There were no gains or losses reclassified from AOCI to earnings based on the probability that the forecasted transaction would not occur.
The Company's commodity and currency derivative contracts are subject to master netting agreements with the respective counterparties which allow the Company to net settle transactions with a single net amount payable by one party to another party. The Company has elected to present the derivative assets and derivative liabilities on the Consolidated Balance Sheets on a gross basis for the periods ended December 31, 2016 and January 2, 2016.
The following table presents the derivative assets and derivative liabilities presented on a net basis under enforceable master netting agreements (in millions):
December 31, 2016 | ||||||||||||
Gross Amounts as Presented in the Consolidated Balance Sheet | Derivative Contract Amounts Subject to Right of Offset | Derivative Contracts as Presented on a Net Basis | ||||||||||
Prepaid Expenses and Other Current Assets: | ||||||||||||
Derivative Currency Contracts | $ | 2.8 | $ | (1.7 | ) | $ | 1.1 | |||||
Derivative Commodity Contracts | 7.3 | — | 7.3 | |||||||||
Other Non-Current Assets: | ||||||||||||
Derivative Currency Contracts | 0.4 | (0.2 | ) | 0.2 | ||||||||
Hedging Obligations Current: | ||||||||||||
Derivative Currency Contracts | 45.7 | (1.7 | ) | 44.0 | ||||||||
Hedging Obligations: | ||||||||||||
Derivative Currency Contracts | 17.6 | (0.2 | ) | 17.4 | ||||||||
77
January 2, 2016 | ||||||||||||
Gross Amounts as Presented in the Consolidated Balance Sheet | Derivative Contract Amounts Subject to Right of Offset | Derivative Contracts as Presented on a Net Basis | ||||||||||
Prepaid Expenses and Other Current Assets: | ||||||||||||
Derivative Currency Contracts | $ | 1.2 | $ | (1.2 | ) | $ | — | |||||
Derivative Commodity Contracts | 5.2 | (5.2 | ) | — | ||||||||
Other Noncurrent Assets: | ||||||||||||
Derivative Currency Contracts | 1.0 | (1.0 | ) | — | ||||||||
Hedging Obligations Current: | ||||||||||||
Derivative Currency Contracts | 30.8 | (1.2 | ) | 29.6 | ||||||||
Derivative Commodity Contracts | 13.9 | (5.2 | ) | 8.7 | ||||||||
Hedging Obligations: | ||||||||||||
Derivative Currency Contracts | 19.8 | (1.0 | ) | 18.8 | ||||||||
(14) Fair Value
Fair value is defined as the price that would be received to sell an asset or paid to transfer a liability in an orderly transaction between market participants at the measurement date (exit price). The inputs used to measure fair value are classified into the following hierarchy:
Level 1 | Unadjusted quoted prices in active markets for identical assets or liabilities | |||||
Level 2 | Unadjusted quoted prices in active markets for similar assets or liabilities, or | |||||
Unadjusted quoted prices for identical or similar assets or liabilities in markets that are not active, or | ||||||
Inputs other than quoted prices that are observable for the asset or liability | ||||||
Level 3 | Unobservable inputs for the asset or liability | |||||
The Company uses the best available information in measuring fair value. Financial assets and liabilities are classified in their entirety based on the lowest level of input that is significant to the fair value measurement. The following table sets forth the Company's financial assets and liabilities that were accounted for at fair value on a recurring basis as of December 31, 2016 and January 2, 2016, respectively (in millions):
78
December 31, 2016 | January 2, 2016 | ||||||||
Classification | |||||||||
Assets: | |||||||||
Prepaid Expenses and Other Current Assets: | |||||||||
Derivative Currency Contracts | $ | 2.8 | $ | 1.2 | Level 2 | ||||
Derivative Commodity Contracts | 7.3 | 5.2 | Level 2 | ||||||
Other Non-Current Assets: | |||||||||
Assets Held in Rabbi Trust | 5.4 | 5.2 | Level 1 | ||||||
Derivative Currency Contracts | 0.4 | 1.0 | Level 2 | ||||||
Liabilities: | |||||||||
Hedging Obligations Current: | |||||||||
Interest Rate Swap | 3.3 | — | Level 2 | ||||||
Derivative Currency Contracts | 45.7 | 30.8 | Level 2 | ||||||
Derivative Commodity Contracts | — | 13.9 | Level 2 | ||||||
Hedging Obligations: | |||||||||
Interest Rate Swap | — | 7.8 | Level 2 | ||||||
Derivative Currency Contracts | 17.6 | 19.8 | Level 2 | ||||||
Level 1 fair value measurements for assets held in a Rabbi Trust are unadjusted quoted prices.
Level 2 fair value measurements for derivative assets and liabilities are measured using quoted prices in active markets for similar assets and liabilities. Interest rate swaps are valued based on the discounted cash flows for the LIBOR forward yield curve for a swap with similar contractual terms. Foreign currency forwards are valued based on exchange rates quoted by domestic and foreign banks for similar instruments. Commodity forwards are valued based on observable market transactions of forward commodity prices.
The Company did not change its valuation techniques during fiscal 2016.
(15) Restructuring Activities
The Company incurred restructuring and restructuring related costs on projects beginning in 2014. Restructuring costs includes employee termination and plant relocation costs. Restructuring-related costs includes costs directly associated with actions resulting from our Simplification initiatives, such as asset write-downs or accelerated depreciation due to shortened useful lives in connection with site closures, discretionary employment benefit costs and other facility rationalization costs. Restructuring costs for employee termination expenses are generally required to be accrued over the employees remaining service period while restructuring costs for plant relocation costs and restructuring-related costs are generally required to be expensed as incurred
The following is a reconciliation of provisions and payments for the restructuring projects for 2016 and 2015 (in millions):
79
December 31, 2016 | January 2, 2016 | |||||||
Beginning Balance | $ | 1.3 | $ | 6.1 | ||||
Provision | 6.8 | 8.9 | ||||||
Less: Payments | 7.5 | 13.7 | ||||||
Ending Balance | $ | 0.6 | $ | 1.3 | ||||
The following is a reconciliation of expenses by type for the restructuring projects in fiscal 2016 and fiscal 2015 (in millions):
2016 | 2015 | ||||||||||||||||||
Restructuring Costs: | Cost of Sales | Operating Expenses | Total | Cost of Sales | Operating Expenses | Total | |||||||||||||
Employee Termination Expenses | $ | 0.5 | $ | 0.3 | $ | 0.8 | $ | 0.6 | $ | — | $ | 0.6 | |||||||
Facility Related Costs | 2.9 | 0.3 | 3.2 | 3.8 | 1.2 | 5.0 | |||||||||||||
Other Expenses | 0.8 | 0.9 | 1.7 | 3.3 | — | 3.3 | |||||||||||||
Total Restructuring Costs | $ | 4.2 | $ | 1.5 | $ | 5.7 | $ | 7.7 | $ | 1.2 | $ | 8.9 | |||||||
Restructuring Related Costs: | |||||||||||||||||||
Other Employment Benefit Expenses | $ | 0.5 | $ | 0.6 | $ | 1.1 | $ | — | $ | — | $ | — | |||||||
Total Restructuring Related costs | $ | 0.5 | $ | 0.6 | $ | 1.1 | $ | — | $ | — | $ | — | |||||||
Total Restructuring and Restructuring Related Costs | $ | 4.7 | $ | 2.1 | $ | 6.8 | $ | 7.7 | $ | 1.2 | $ | 8.9 | |||||||
The following table shows the allocation of Restructuring Expenses by segment for fiscal 2016 and fiscal 2015 (in millions):
Total | Commercial and Industrial Systems | Climate Solutions | Power Transmission Solutions | ||||||||||||
Restructuring Expenses - 2016 | $ | 6.8 | $ | 2.5 | $ | 2.6 | $ | 1.7 | |||||||
Restructuring Expenses - 2015 | $ | 8.9 | $ | 6.8 | $ | 1.5 | $ | 0.6 | |||||||
The Company's current restructuring activities are expected to continue into 2018. The Company expects to record aggregate future charges of approximately $12.9 million which includes $6.1 million of employee termination expenses and $6.8 million of facility related and other costs.
ITEM 9 - CHANGES IN AND DISAGREEMENTS WITH ACCOUNTANTS ON ACCOUNTING AND FINANCIAL DISCLOSURE
None.
ITEM 9A - Controls and Procedures
In accordance with Rule 13a-15(b) of the Securities Exchange Act of 1934 (the “Exchange Act”), our management evaluated, with the participation of our Chief Executive Officer and our Chief Financial Officer, the effectiveness of the design and operation of our disclosure controls and procedures (as defined in Rule 13a-15(d) and 15(e) under the Exchange Act) as of the end of the year ended December 31, 2016. Based upon their evaluation of these disclosure controls and procedures, our Chief Executive Officer and Chief Financial Officer concluded that the disclosure controls and procedures were effective as of December 31, 2016 to ensure that (a) information required to be disclosed in the reports that we file or submit under the Exchange Act is recorded, processed, summarized and reported within the time periods specified in the rules and forms of the Securities and Exchange Commission, and (b) information required to be disclosed by us in the reports we file or submit under the Exchange Act is accumulated and communicated to our management, including our Chief Executive Officer and our Chief Financial Officer, as
80
appropriate to allow timely decisions regarding required disclosure.
Management's Report on Internal Control over Financial Reporting.
The report of management required under this Item 9A is contained in Item 8 of Part II of this Annual Report on Form 10-K under the heading “Management's Annual Report on Internal Control over Financial Reporting.”
Report of Independent Registered Public Accounting Firm.
The attestation report required under this Item 9A is contained in Item 8 of Part II of this Annual Report on Form 10-K under the heading “Report of Independent Registered Public Accounting Firm.”
Changes in Internal Controls.
There were no changes in the Company's internal control over financial reporting that occurred during the quarter ended December 31, 2016 that have materially affected, or are reasonably likely to materially affect, the Company's internal control over financial reporting.
ITEM 9B - OTHER INFORMATION
None.
81
PART III
ITEM 10 - Directors, Executive Officers and Corporate Governance
The information in the sections titled “Proposal 1: Election of Directors,” “Board of Directors” and “Section 16(a) Beneficial Ownership Reporting Compliance” in our proxy statement for the 2017 annual meeting of shareholders (the “2017 Proxy Statement”) is incorporated by reference herein. Information with respect to our executive officers appears in Part I of this Annual Report on Form 10-K.
We have adopted a Code of Business Conduct and Ethics (the “Code”) that applies to all our directors, officers and employees. The Code is available on our website, along with our current Corporate Governance Guidelines, at www.regalbeloit.com. The Code and our Corporate Governance Guidelines are also available in print to any shareholder who requests a copy in writing from the Secretary of Regal Beloit Corporation. We intend to disclose through our website any amendments to, or waivers from, the provisions of these codes.
Item 11 - Executive Compensation
The information in the sections titled “Compensation Discussion and Analysis,” “Executive Compensation,” “Report of the Compensation and Human Resources Committee,” and “Director Compensation” in the 2017 Proxy Statement is incorporated by reference herein.
Item 12 - Security Ownership of Certain Beneficial Owners and Management
The information in the sections titled “Stock Ownership” in the 2017 Proxy Statement is incorporated by reference herein.
Equity Compensation Plan Information
The following table provides information about our equity compensation plans as of December 31, 2016.
Number of Securities to be Issued upon the Exercise of Outstanding Options, Warrants and Rights (1) | Weighted-average Exercise Price of Outstanding Options, Warrants and Rights | Number of Securities Remaining Available for Future Issuance Under Equity Compensation Plans (excluding securities reflected in the column 1) | |||||||||
Equity Compensation Plans Approved by Security Holders | 1,610,499 | $ | 63.16 | 1,416,433 | |||||||
Equity Compensation Plans Not Approved by Security Holders | — | — | |||||||||
Total | 1,610,499 | 1,416,433 | |||||||||
(1) Represents options to purchase our Common Stock and stock-settled appreciation rights granted under our 2003 Equity Incentive Stock Option Plan, 2007 Equity Incentive Plan and 2013 Equity Incentive Plan. | |||||||||||
Item 13 - Certain Relationships and Related Transactions and Director Independence
The information in the section titled “Board of Directors” in the 2017 Proxy Statement is incorporated by reference herein.
Item 14 - Principal Accountant Fees and Services
The information in the section titled “Proposal 4: Ratification of Deloitte & Touche LLP as our Independent Registered Public Accounting Firm for the year ending December 30, 2017” in the 2017 Proxy Statement is incorporated by reference herein.
82
PART IV
ITEM 15 - EXHIBITS, FINANCIAL STATEMENT SCHEDULE
(a) | 1. Financial statements - The financial statements listed in the accompanying index to financial statements and financial statement schedule are filed as part of this Annual Report on Form 10‑K. |
2. Financial statement schedule - The financial statement schedule listed in the accompanying index to financial statements and financial statement schedule are filed as part of this Annual Report on Form 10‑K.
3. Exhibits - The exhibits listed in the accompanying index to exhibits are filed as part of this Annual Report on Form 10-K.
(b) | Exhibits- see Exhibit Index. |
(c) See (a)(2) above.
ITEM 16 - FORM 10-K SUMMARY
Not Applicable
83
SIGNATURES
Pursuant to the requirements of Section 13 or 15(d) of the Securities Exchange Act of 1934, the registrant has duly caused this report to be signed on its behalf by the undersigned, thereunto duly authorized, on this 1st day of March, 2017.
REGAL BELOIT CORPORATION | ||
By: | /s/ CHARLES A. HINRICHS | |
Charles A. Hinrichs | ||
Vice President and Chief Financial Officer (Principal Financial Officer) | ||
By: | /s/ ROBERT J. REHARD | |
Robert J. Rehard | ||
Vice President and Corporate Controller (Principal Accounting Officer) | ||
84
Pursuant to the requirements of the Securities Exchange Act of 1934, this report has been signed below by the following persons on behalf of the registrant and in the capacities and on the dates indicated:
/s/ MARK J. GLIEBE | Chairman and Chief Executive Officer | March 1, 2017 |
Mark J. Gliebe | (Principal Executive Officer) | |
/s/ STEPHEN M. BURT | Director | March 1, 2017 |
Stephen M. Burt | ||
/s/ CHRISTOPHER L. DOERR | Director | March 1, 2017 |
Christopher L. Doerr | ||
/s/ THOMAS J. FISCHER | Director | March 1, 2017 |
Thomas J. Fischer | ||
/s/ DEAN A. FOATE | Director | March 1, 2017 |
Dean A. Foate | ||
/s/ HENRY W. KNUEPPEL | Director | March 1, 2017 |
Henry W. Knueppel | ||
/s/ RAKESH SACHDEV | Director | March 1, 2017 |
Rakesh Sachdev | ||
/s/ ANESA T. CHAIBI | Director | March 1, 2017 |
Anesa Chaibi | ||
/s/ CURTIS W. STOELTING | Director | March 1, 2017 |
Curtis W. Stoelting | ||
/s/ JANE L. WARNER | Director | March 1, 2017 |
Jane L. Warner | ||
85
REGAL BELOIT CORPORATION
Index to Financial Statements
And Financial Statement Schedule
Page(s) In | |||
Form 10-K | |||
(1) | Financial Statements: | ||
Report of Independent Registered Public Accounting Firm | 39 | ||
Consolidated Statements of Income for the fiscal years ended | |||
December 31, 2016, January 2, 2016 and January 3, 2015 | 40 | ||
Consolidated Statements of Comprehensive Income for the fiscal years ended December 31, 2016, January 2, 2016 and January 3, 2015 | 41 | ||
Consolidated Balance Sheets at December 31, 2016 and January 2, 2016 | 42 | ||
Consolidated Statements of Equity for the fiscal years ended December 31, 2016, January 2, 2016 and January 3, 2015 | 43 | ||
Consolidated Statements of Cash Flows for the fiscal years ended December 31, 2016, January 2, 2016 and January 3, 2015 | 44 | ||
Notes to the Consolidated Financial Statements | 45 | ||
(2) | Financial Statement Schedule: | ||
For the fiscal years ended December 31, 2016, January 2, 2016 and January 3, 2015 Schedule II -Valuation and Qualifying Accounts | 87 | ||
All other schedules are omitted because they are not applicable or the required information is shown in the financial statements or notes thereto.
86
SCHEDULE II
REGAL BELOIT CORPORATION
VALUATION AND QUALIFYING ACCOUNTS
Balance Beginning of Year | Charged to Expenses | Deductions (a) | Adjustments (b) | Balance End of Year | |||||||||||||
(Dollars in Millions) | |||||||||||||||||
Allowance for Receivables: | |||||||||||||||||
Fiscal 2016 | $ | 11.3 | 1.6 | (1.2 | ) | (0.2 | ) | $ | 11.5 | ||||||||
Fiscal 2015 | 11.6 | 12.2 | (12.4 | ) | (0.1 | ) | 11.3 | ||||||||||
Fiscal 2014 | 11.5 | 19.5 | (19.2 | ) | (0.2 | ) | 11.6 | ||||||||||
(a) Deductions consist of write offs charged against the allowance for doubtful accounts and warranty claim costs.
(b) Adjustments related to acquisitions and translation.
87
Exhibit Index
Exhibit Number | Exhibit Description | |
2.1 | Asset and Stock Purchase Agreement, dated as of December 13, 2014, by and between Regal Beloit Corporation and Emerson Electric Co. [Incorporated by reference to Exhibit 2.1 to Regal Beloit Corporation's Current Report on Form 8-K filed on December 15, 2014] | |
3.1 | Amended and Restated Articles of Incorporation of Regal Beloit Corporation. [Incorporated by reference to Exhibit 3 to Regal Beloit Corporation's Current Report on Form 8-K filed on May 1, 2015] | |
3.2 | Amended and Restated Bylaws of Regal Beloit Corporation. [Incorporated by reference to Exhibit 3.1 to Regal Beloit Corporation's Current Report on Form 8-K filed on November 6, 2014] | |
4.1 | Amended and Restated Articles of Incorporation and Amended and Restated Bylaws of Regal Beloit Corporation [Incorporated by reference to Exhibits 3.1 and 3.2 hereto] | |
4.2 | Credit Agreement, dated as of June 30, 2011, among Regal Beloit Corporation, the financial institutions party thereto, Bank of America, N.A., as syndication agent, Wells Fargo Bank, N.A., US Bank National Association and Fifth Third Bank, as co-documentation agents, JPMorgan Chase Bank, N.A., as administrative agent, and J.P. Morgan Securities LLC and Merrill Lynch, Pierce, Fenner & Smith Incorporated, as joint lead arrangers and joint book managers. [Incorporated by reference to Exhibit 4.1 to Regal Beloit Corporation's Current Report on Form 8-K filed on July 7, 2011] | |
4.3 | First Amendment, dated as of June 30, 2011, among Regal Beloit Corporation, the financial institutions party thereto, US Bank National Association and Wells Fargo Bank, N.A., as co-documentation agents, Bank of America, N.A., as administrative agent, and JPMorgan Chase Bank, N.A., as syndication agent, to Term Loan Agreement, dated as of June 16, 2008, among Regal Beloit Corporation, the financial institutions party thereto, US Bank National Association and Wells Fargo Bank, N.A., as co-documentation agents, Bank of America, N.A., as administrative agent, and JPMorgan Chase Bank, N.A., as syndication agent. [Incorporated by reference to Exhibit 4.2 to Regal Beloit Corporation's Current Report on Form 8-K filed on July 7, 2011] | |
4.4 | Note Purchase Agreement, dated as of August 23, 2007, by and among Regal Beloit Corporation and Purchasers listed in Schedule A attached thereto. [Incorporated by reference to Exhibit 4.1 to Regal Beloit Corporation's Current Report on Form 8-K filed on August 24, 2007] | |
4.5 | Subsidiary Guaranty Agreement, dated as of August 23, 2007, from certain subsidiaries of Regal Beloit Corporation. [Incorporated by reference to Exhibit 4.2 to Regal Beloit Corporation's Current Report on Form 8-K filed on August 24, 2007] | |
4.6 | Note Purchase Agreement, dated as of July 14, 2011, by and among Regal-Beloit Corporation and Purchasers listed in Schedule A attached thereto. [Incorporated by reference to Exhibit 4.1 to Regal Beloit Corporation's Current Report on Form 8-K filed on July 20, 2011] | |
4.7 | Subsidiary Guaranty Agreement, dated as of July 14, 2011, from certain subsidiaries of Regal-Beloit Corporation [Incorporated by reference to Exhibit 4.2 to Regal Beloit Corporation's Current Report on Form 8-K filed on July 20, 2011] | |
4.8 | First Amendment, dated as of August 16, 2011, to Note Purchase Agreement dated as of July 14, 2011, by and among Regal-Beloit Corporation, certain subsidiaries of Regal-Beloit Corporation and the Purchasers listed on the signature pages thereto. [Incorporated by reference to Exhibit 4.2 to Regal Beloit Corporation's Current Report on Form 8-K filed on August 22, 2011] | |
4.9 | Credit Agreement, dated as of January 30, 2015, by and among Regal Beloit Corporation, certain of its subsidiaries, JPMorgan Chase Bank, N.A., as Administrative Agent, and the lenders named therein. [Incorporated by reference to Exhibit 10.1 to Regal Beloit Corporation’s Quarterly Report on Form 10-Q for the quarterly period ended April 4, 2015] | |
10.1* | 1998 Stock Option Plan, as amended [Incorporated by reference to Exhibit 99 to Regal Beloit Corporation's Registration Statement on Form S-8 (Reg. No. 333-84779)] | |
10.2* | 2003 Equity Incentive Plan [Incorporated by reference to Exhibit B to Regal Beloit Corporation's Definitive Proxy Statement on Schedule 14A for the 2003 Annual Meeting of Shareholders] | |
10.3* | Regal Beloit Corporation 2007 Equity Incentive Plan [incorporated by reference to Appendix B to Regal Beloit Corporation's definitive proxy statement on Schedule 14A for the Regal Beloit Corporation 2007 annual meeting of shareholders held April 20, 2007] | |
10.4* | Regal Beloit Corporation 2013 Equity Incentive Plan. [Incorporated by reference to Appendix A to Regal Beloit Corporation’s definitive proxy statement on Schedule 14A for the Regal Beloit Corporation 2013 annual meeting of shareholders held April 29, 2013]. | |
10.5* | Form of Key Executive Employment and Severance Agreement between Regal Beloit Corporation and Mark J. Gliebe. [Incorporated by reference to Exhibit 10.6 to Regal Beloit Corporation's Annual Report on Form 10-K for the year ended December 29, 2007] | |
10.6* | Form of Key Executive Employment and Severance Agreement between Regal Beloit Corporation and Terry R. Colvin. [Incorporated by reference to Exhibit 10.7 to Regal Beloit Corporation's Annual Report on Form 10-K for the year ended December 29, 2007] | |
88
10.7* | Form of Key Executive Employment and Severance Agreement between Regal Beloit Corporation and each of Jonathan J. Schlemmer, Charles A Hinrichs, and John M. Avampato. [Incorporated by reference to Exhibit 10.1 to Regal Beloit Corporation's Current Report on Form 8-K filed on November 2, 2010 | |
10.8* | Form of Agreement for Stock Option Grant. [Incorporated by reference to Exhibit 10.9 to Regal Beloit Corporation's Annual Report on Form 10-K for the year ended December 31, 2005] | |
10.9* | Form of Restricted Stock Agreement. [Incorporated by reference to Exhibit 10.10 to Regal Beloit Corporation's Annual Report on Form 10-K for the year ended December 31, 2005] | |
10.10* | Form of Restricted Stock Unit Award Agreement under the Regal Beloit Corporation 2003 Equity Incentive Plan. [Incorporated by reference to Exhibit 10.10 to Regal Beloit Corporation's Annual Report on Form 10-K for the year ended December 29, 2007] | |
10.11* | Form of Stock Option Award Agreement under the Regal Beloit Corporation 2007 Equity Incentive Plan. [Incorporated by reference to Exhibit 10.2 to Regal Beloit Corporation's Current Report on Form 8-K filed on April 25, 2007] | |
10.12* | Form of Restricted Stock Award Agreement under the Regal Beloit Corporation 2007 Equity Incentive Plan. [Incorporated by reference to Exhibit 10.3 to Regal Beloit Corporation's Current Report on Form 8-K filed on April 25, 2007] | |
10.13* | Form of Restricted Stock Unit Award Agreement under the Regal Beloit Corporation 2007 Equity Incentive Plan. [Incorporated by reference to Exhibit 10.4 to Regal Beloit Corporation's Current Report on Form 8-K filed on April 25, 2007] | |
10.14* | Form of Stock Appreciation Right Award Agreement under the Regal Beloit Corporation 2007 Equity Incentive Plan. [Incorporated by reference to Exhibit 10.5 to Regal Beloit Corporation's Current Report on Form 8-K filed on April 25, 2007] | |
10.15* | Target Supplemental Retirement Plan for designated Officers and Key Employees, as amended and restated. [Incorporated by reference to Exhibit 10.2 to Regal Beloit Corporation's Current Report on Form 8-K dated November 2, 2010] | |
10.16* | Form of Participation Agreement for Target Supplemental Retirement Plan. [Incorporated by reference to Exhibit 10.12 to Regal Beloit Corporation's Annual Report on Form 10-K for the year ended December 31, 2005] | |
10.17* | Regal Beloit Corporation 2016 Incentive Compensation Plan. [Incorporated by reference to Appendix A to Regal Beloit Corporation's definitive proxy statement on Schedule 14A for the 2016 annual meeting of shareholders held April 25, 2016] | |
10.18* | Form of Stock Appreciation Rights Award Agreement under the Regal Beloit Corporation 2013 Equity Incentive Plan. [Incorporated by reference to Exhibit 10.2 to Regal Beloit Corporation’s Current Report on Form 8-K filed on May 2, 2013]. | |
10.19* | Form of Restricted Stock Unit Award Agreement under the Regal Beloit Corporation 2013 Equity Incentive Plan. [Incorporated by reference to Exhibit 10.3 to Regal Beloit Corporation’s Current Report on Form 8-K filed on May 2, 2013]. | |
10.20* | Form of TSR Based Performance Share Unit Award Agreement under the Regal Beloit Corporation 2013 Equity Incentive Plan. [Incorporated by reference to Exhibit 10.4 to Regal Beloit Corporation’s Current Report on Form 8-K filed on May 2, 2013]. | |
10.21* | Form of EBIT Based Performance Share Unit Award Agreement under the Regal Beloit Corporation 2013 Equity Incentive Plan. [Incorporated by reference to Exhibit 10.21 to Regal Beloit Corporation’s Annual Report on Form 10-K filed on March 2, 2016] | |
10.22* | Form of ROIC Based Performance Share Unit Award Agreement under the Regal Beloit Corporation 2013 Equity Incentive Plan** | |
10.23* | Key Executive Employment and Severance Agreement, dated as of October 26, 2016, between Regal Beloit Corporation and Thomas E. Valentyn** | |
12 | Computation of Ratio of Earnings to Fixed Charges. | |
21 | Significant Subsidiaries of Regal Beloit Corporation. | |
23 | Consent of Independent Registered Public Accounting Firm. | |
31.1 | Certificate of Chief Executive Officer pursuant to Section 302 of the Sarbanes-Oxley Act of 2002. | |
31.2 | Certificate of Chief Financial Officer pursuant to Section 302 of the Sarbanes-Oxley Act of 2002. | |
32 | Section 1350 Certifications of the Chief Executive Officer and Chief Financial Officer pursuant to Section 906 of the Sarbanes-Oxley Act of 2002.** | |
101.INS | XBRL Instance Document | |
101.SCH | XBRL Taxonomy Extension Schema | |
101.CAL | XBRL Taxonomy Extension Calculation Linkbase | |
101.DEF | XBRL Taxonomy Extension Definition Linkbase | |
101.LAB | XBRL Taxonomy Extension Label Linkbase | |
89
101.PRE | XBRL Taxonomy Extension Presentation Linkbase | |
________________________
* A management contract or compensatory plan or arrangement.
** Furnished herewith.
90