Attached files
| file | filename |
|---|---|
| 8-K - FORM 8-K - Kraton Corp | d249645d8k.htm |
 KRATON PERFORMANCE POLYMERS, INC.
THIRD QUARTER 2011 EARNINGS CONFERENCE CALL
November 1, 2011
Exhibit 99.1 |
 Forward-Looking Statement Disclaimer
2
This presentation may include forward-looking statements that reflect our plans, beliefs,
expectations and current views with respect to, among other things, future events and financial
performance. Forward-looking statements are often characterized by the use of words such as
“outlook”, “believes,” “estimates,” “expects,” “projects,” “may,” “intends,” “plans” or “anticipates,” or by discussions of
strategy, plans or intentions, including statements regarding our general “outlook”;
our ability to obtain raw materials; costs, timing and plans related to our planned joint
venture with Formosa Petrochemical Corporation and the related facility; anticipated capital
expenditures; anticipated sales volumes or levels of demand for our products; anticipated raw
material price movements and related expectations regarding customer activities. All
forward-looking statements in this presentation are made based on management's current
expectations and estimates, which involve known and unknown risks, uncertainties and other important factors that could
cause actual results to differ materially from those expressed in forward-looking statements.
These risks and uncertainties are more fully described in “Part I. Item 1A. Risk
Factors” contained in our Annual Report on 10-K, as filed with the Securities and Exchange
Commission and as subsequently updated in our Quarterly Reports on Form 10-Q, and include the
following risk factors: conditions in the global economy and capital markets; our reliance on
LyondellBasell Industries for the provision of significant operating and other services; the
failure of our raw materials suppliers to perform their obligations under long-term supply agreements, or our inability to
replace or renew these agreements when they expire; limitations in the availability of raw materials
we need to produce our products in the amounts or at the prices necessary for us to effectively
and profitably operate our business; competition in our end-use markets, from other
producers of SBCs and from producers of products that can be substituted for our products; our ability to produce and
commercialize technological innovations; our ability to protect our intellectual property, on which
our business is substantially dependent; the possibility that our products infringe on the
intellectual property rights of others; seasonality in our business, particularly for
Paving and Roofing end uses; financial and operating constraints related to our substantial level of indebtedness; the
inherently hazardous nature of chemical manufacturing; product liability claims and other lawsuits
arising from environmental damage, personal injuries or other damage associated with chemical
manufacturing or our products; political and economic risks in the various countries in which
we operate; health, safety and environmental laws, including laws that govern our employees’ exposure to
chemicals deemed harmful to humans; regulation of our customers, which could affect the demand for our
products or result in increased compliance costs; customs, international trade, export control,
antitrust, zoning and occupancy and labor and employment laws that could require us to modify
our current business practices and incur increased costs; fluctuations in currency exchange rates;
our relationship with our employees; loss of key personnel or our inability to attract and retain new
qualified personnel; the fact that we typically do not enter into long-term contracts with
our customers; a decrease in the fair value of our pension assets, which could require us to
materially increase future funding of the pension plan; future sales of our shares could adversely affect the market price
of our common stock; our planned joint venture in Asia is subject to risks and uncertainties; Delaware
law and some provisions of our organizational documents make a takeover of our company more
difficult; and other risks, factors and uncertainties described in this press release and
our other reports and documents; and other factors of which we are currently unaware or deem immaterial.
Readers are cautioned not to place undue reliance on forward-looking statements. We assume no
obligation to update such information in light of new information or future events.
Further information concerning issues that could materially affect financial performance
related to forward-looking statements can be found in Kraton’s periodic filings with the Securities and Exchange
Commission.
|
 GAAP
Disclaimer This presentation includes the use of both GAAP (generally
accepted accounting principles) and non-GAAP financial measures. The
non-GAAP financial measures are EBITDA and Adjusted EBITDA. The most
directly comparable GAAP financial measure is net income/loss. A
reconciliation of the non-GAAP financial measures used in this presentation
to the
most
directly
comparable
GAAP
measure
is
included
herein.
We
consider
EBITDA
and Adjusted EBITDA important supplemental measures of our performance and believe
they are frequently used by investors and other interested parties in the
evaluation of companies in our industry. EBITDA and Adjusted EBITDA have
limitations as analytical tools and
should
not
be
considered
in
isolation
or
as
a
substitute
for
analysis
of
our
results
under
GAAP in the United States.
3 |
 Update
on 2011 Business Priorities Capital Investment
Progress continues on proposed 30 kT Asian HSBC
plant
Engineering and design work ongoing
Drafting of definitive documentation underway
Taiwan Fair Trade Commission has approved the
proposed joint venture with Formosa
Continuing process to secure necessary permits
Earnings Growth
Q3 sales revenue of $402 million, up 20% year-on-year
Q3 GAAP net income of $43 million or $1.33 per diluted
share
Q3 Adjusted EBITDA
of $71 million
Q3 sales volume of 78 kT
Innovation-led Top-line
Growth
Q3’11 TTM vitality index of 14%
Q3’11 TTM innovation revenue up 31% vs. Q3’10 TTM
Q3’11 TTM innovation volume up 13% vs. Q3’10 TTM
4
(1)
Adjusted EBITDA is EBITDA excluding restructuring and related charges and
non-cash compensation expenses. (1) |
 12%
-5%
Q3'11 vs. Q3'10
Q3'11 vs. Q2'11
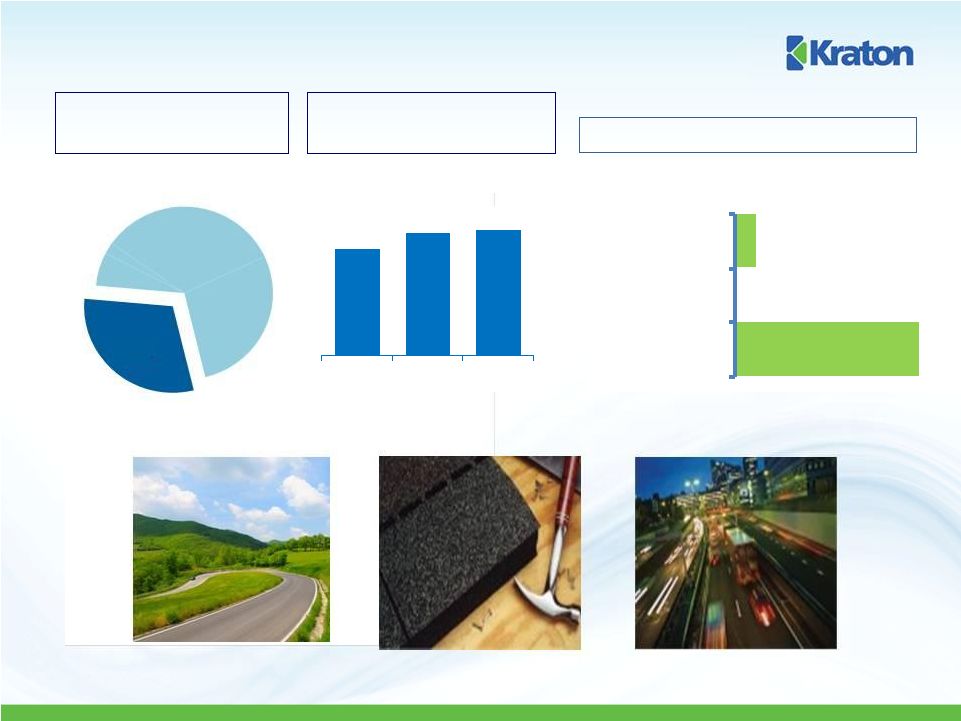
Advanced Materials End Use Review
TTM Sales Revenue
Profile
Change in Sales Revenue
End Use Sales
Revenue
US $ in millions
$92
$108
$103
Q3'10
Q2'11
Q3'11
5
29%
AM |
   Adhesives, Sealants and Coatings End Use Review
ASC
6
TTM Sales Revenue
Profile
Change in Sales Revenue
End Use Sales
Revenue
US $ in millions
4%
-8%
Q3'11 vs. Q3'10
Q3'11 vs. Q2'11
$108
$122
$112
Q3'10
Q2'11
Q3'11
31% |
 Paving
and Roofing End-Use Review 7
TTM Sales Revenue
Profile
Change in Sales Revenue
End Use Sales
Revenue
US $ in millions
17%
2%
Q3'11 vs. Q3'10
Q3'11 vs. Q2'11
$111
$128
$130
Q3'10
Q2'11
Q3'11
P&R
29% |
 $94
$79
$61
$35
TTM Q3'11
2010
2009
2008
Emerging Businesses End Use Review
US $ in millions
$19
$20
$26
Q3'10
Q2'11
Q3'11
8
TTM Sales Revenue
Profile
Sales Revenue
End Use Sales
Revenue
US $ in millions
7%
EB |
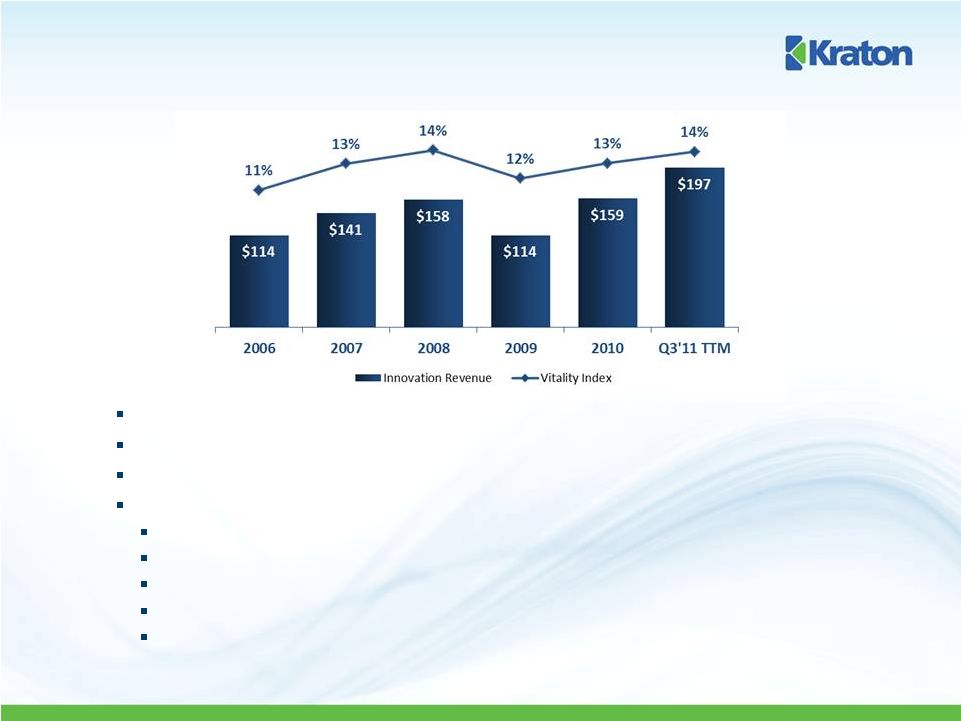 Innovation-led Top Line Growth
Q3’11 TTM vitality index 14%
Q3’11 TTM innovation revenue up 31% vs. Q3’10 TTM
Q3’11 TTM innovation volume up 13% vs. Q3’10 TTM
Key innovations showing strong TTM revenue growth:
PVC replacement for IV bags up 91%
Roofing innovations up 72%
Protective films up 47%
PVC replacement in wire & cable up 33%
Reactive SBS for printing plates up 20%
9 |
 Sales Volume
(Kilotons)
Q3 2011 Sales Volume and Sales Revenue
Sales Revenue
(US $ in Millions)
10
81
82
78
Q3'10
Q2'11
Q3'11
$335
$386
$402
Q3'10
Q2'11
Q3'11 |
 Q3
2011 Sales Revenue Walk Q3 2011 vs. Q2 2011
Q3 2011 vs. Q3 2010
US $ in millions
11 |
 Q3
2011 Gross Profit and Adjusted EBITDA Gross
Profit
and
Gross
Margin
(US $ in Millions)
Adjusted
EBITDA
(US $ in Millions)
Adjusted
EBITDA
Margin
12
$83
$108
$101
24.7%
28.1%
25.2%
Q3'10
Q2'11
Q3'11
$55
$74
$71
16.4%
19.2%
17.7%
Q3'10
Q2'11
Q3'11 |
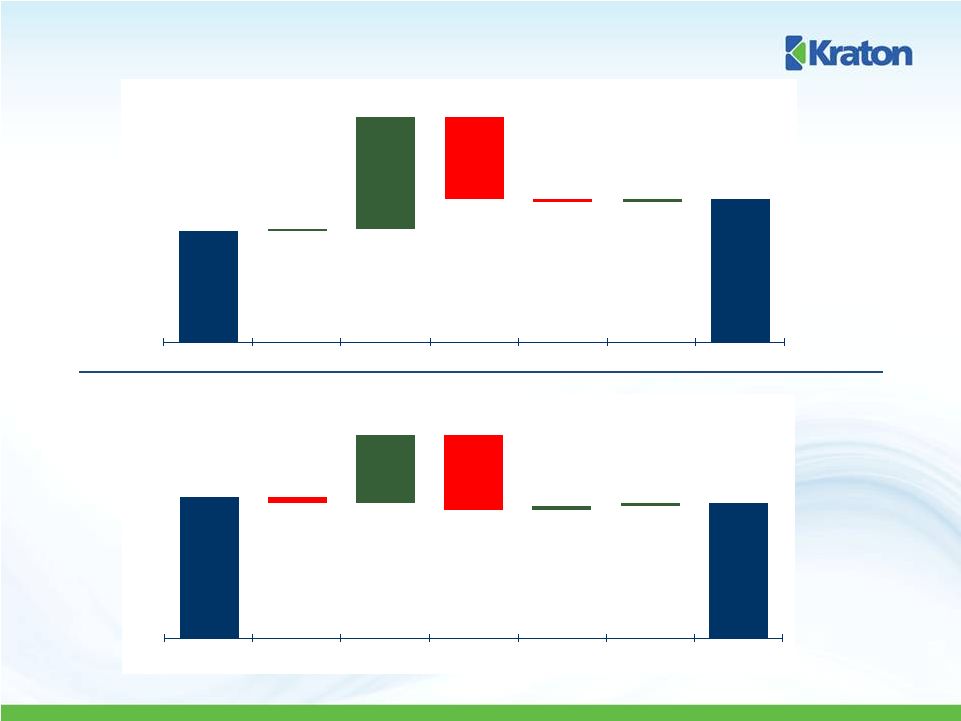 $55
$71
$1
$55
$(40)
$(2)
$2
Q3 2010
Volume/Mix
Price
COGS
R&D/SG&A
FX/Other
Q3 2011
$74
$71
$(3)
$35
$(39)
$2
$2
Q2 2011
Volume/Mix
Price
COGS
R&D/SG&A
FX/Other
Q3 2011
Q3 2011 Adjusted EBITDA Walk
Q3 2011 vs. Q2 2011
US $ in millions
Q3 2011 vs. Q3 2010
13 |
 Impact of Monomer Volatility
$568
$537
$805
$976
$918
$632
$707
$781
$849
$863
$1,046
$1,005
$810
$712
$894
Q1 08
Q2 08
Q3 08
Q4 08
Q1 09
Q2 09
Q3 09
Q4 09
Q1 10
Q2 10
Q3 10
Q4 10
Q1 11
Q2 11
Q3 11
$636
$664
$1,054
$932
$190
$501
$865
$998
$949
$1,034
$1,024
$885
$1,068
$1,318
$1,308
Q1 08
Q2 08
Q3 08
Q4 08
Q1 09
Q2 09
Q3 09
Q4 09
Q1 10
Q2 10
Q3 10
Q4 10
Q1 11
Q2 11
Q3 11
Quarterly Impact of FIFO vs.
Estimated Current Replacement Cost
Gross Profit per Ton at Estimated
Current Replacement Cost
Gross Profit per Ton at FIFO
14
$5.2
$11.9
$22.3
$2.3
$9.3
$12.8
$13.3
$7.3
$14.7
$1.7
$8.1
$49.8
$32.1
$34.3
Q1 08
Q2 08
Q3 08
Q4 08
Q1 09
Q2 09
Q3 09
Q4 09
Q1 10
Q2 10
Q3 10
Q4 10
Q1 11
Q2 11
Q3 11
-
-
-
-
- |
 Q3
2011 Financial Overview US $ in Thousands except per share data
Three months Ended
Three months
Ended
Three months Ended
9/30/2011
6/30/2011
9/30/2010
Sales Volume (Kilotons)
78
82
81
Sales Revenues
$
401,993
$
386,428
$
335,442 Cost of Goods Sold
300,539
278,033
252,561
Gross Profit
101,454
108,395
82,881
Operating expenses
Research and Development
6,703
6,966
6,125
Selling, General and Administrative
25,838
27,912
24,819
Depreciation and Amortization
16,689
15,604
13,027
Earnings (loss) of Unconsolidated Joint Venture
595
(880)
81
Interest Expense, net
6,288
5,915
6,127
Income Before Income Taxes
46,531
51,118
32,864
Income Tax Expense
3,438
4,141
4,828
Net Income
$
43,093
$
46,977
$
28,036 Earnings per Common Share -
Diluted
$
1.33
$
1.44
$
0.88 Adjusted
EBITDA
$
71,063
$
74,199
$
54,947 15 |
 US $
in millions Cash at quarter end of $46
million.
Net Debt-to-Capitalization
ratio of 37.9% at quarter end.
Net Debt to TTM Adjusted
EBITDA was 1.5x at 9/30/11.
(1)
Net debt is equal to total debt, less cash and cash equivalents.
Balance Sheet
16 |
 Selected 2011 Estimates
Working capital (excluding cash) as a % of revenue
~ 30%
Capital spending
$65 to $70 million
Interest expense
(1)
~$30 million
Research & development
~$28 million
SG&A
~ $105 million
Depreciation and amortization
~$63 million
Book tax rate
(2)
~9%
17
Includes accelerated write-off of debt issuance costs associated
with the debt refinancing of $5 million. The estimated book tax rate is based on certain facts and circumstances that
may change. In particular, an increase in the release of the valuation allowance to
reflect the benefit of tax net operating loss carryforwards in the fourth quarter of 2011 or
some future period would result in a lower effective tax rate in the period of the release and
a higher effective tax rate in future periods.
(1)
(2) |
 APPENDIX
November 1, 2011 |
 Reconciliation of Net Income to EBITDA and Adjusted EBITDA
(1)
The EBITDA measure is used by management to evaluate operating performance.
Management believes that EBITDA is useful to investors because it is
frequently
used
by
investors
and
other
interested
parties
in
the
evaluation
of
companies
in
our
industry.
EBITDA
is
not
a
recognized
term
under
GAAP
and
does
not purport to be an alternative to net income (loss) as an indicator of operating
performance or to cash flows from operating activities as a measure of liquidity.
Since not all companies use identical calculations, this presentation of EBITDA
may not be comparable to other similarly titled measures of other companies.
Additionally, EBITDA is not intended to be a measure of free cash flow for
management's discretionary use, as it does not consider certain cash requirements
such as interest payments, tax payments and debt service requirements.
(2)
Adjusted EBITDA is GAAP EBITDA excluding restructuring and related charges
and non-cash compensation expenses.. (3)
The restructuring and related charges were recorded as Selling, General and
Administrative expenses. US $ in Thousands
Three months
Ended
Three months
Ended
Three months
Ended
9/30/2011
6/30/2011
9/30/2010
Net Income
$
43,093
$
46,977
$
28,036 Add:
Interest expense, net
6,288
5,915
6,127
Income tax expense
3,438
4,141
4,828
Depreciation and amortization expenses
16,689
15,604
13,027
EBITDA
(1)
$
69,508
$
72,637
$
52,018 EBITDA
(1)
$
69,508
$
72,637
$
52,018 Add (deduct):
Restructuring and related charges
(3)
308
(93)
1,864
Other non-cash expenses
1,247
1,655
1,065
Adjusted EBITDA
(2)
$
71,063
$
74,199
$
54,947 19 |
 KRATON PERFORMANCE POLYMERS, INC.
THIRD QUARTER 2011 EARNINGS CONFERENCE CALL
November 1, 2011 |