Attached files
 2011
Third-Quarter Results October 20, 2011
Exhibit 99.3 |
 2
Introduction
Unless otherwise stated, we will be talking about results for the
third-quarter 2011 and comparing them with the same period
in 2010
References to PMI volumes refer to PMI shipment data, unless
otherwise stated
Industry volume and market shares are the latest data available from
a number of internal and external sources
Organic volume refers to volume excluding acquisitions
Net revenues exclude excise taxes
OCI stands for Operating Companies Income, which is defined as
operating income before general corporate expenses and the
amortization of intangibles. OCI growth rates are on an adjusted
basis, which excludes asset impairment, exit and other costs
Data tables showing adjustments to net revenues and OCI for
currency, acquisitions, asset impairment, exit and other costs, free
cash flow calculations, adjustments to EPS, and reconciliations to
U.S. GAAP measures are at the end of today’s web cast slides and
are posted on our web site |
 3
Forward-Looking and Cautionary Statements
This presentation and related discussion contain statements that, to
the extent they do not relate strictly to historical or current facts,
constitute
“forward-looking
statements”
within
the
meaning
of
the
Private Securities Litigation Reform Act of 1995. Such forward-looking
statements are based on current plans, estimates and expectations,
and are not guarantees of future performance. They are based on
management’s expectations that involve a number of business risks
and uncertainties, any of which could cause actual results to differ
materially from those expressed in or implied by the forward-looking
statements. PMI undertakes no obligation to publicly update or revise
any forward-looking statements, except in the normal course of its
public disclosure obligations. The risks and uncertainties relating to
the forward-looking statements in this presentation include those
described
under
Item
1A.
“Risk
Factors”
in
PMI’s
Form
10-Q
for
the
quarter ended June 30, 2011, filed with the Securities and Exchange
Commission |
 4
2011 Third-Quarter Results
Outstanding financial performance:
In the quarter, we comfortably surpassed all our mid to
long-term currency neutral annual growth targets even
excluding our business in Japan
Q3, 2011 Results
(a)
Net
Revenues
+15.7%
Adjusted OCI
+23.7%
Adjusted Diluted EPS
+33.0%
(a)
All financial growth rates exclude currency. Net revenues and OCI growth rates also exclude
acquisitions Source: PMI Financials |
 5
2011 EPS Guidance
Business outlook further improved, fully compensating
recent unfavorable currency movements
Allows us to narrow our 2011 reported diluted EPS
guidance range to $4.75 to $4.80 (upper half of previous
range)
Compared to our adjusted diluted EPS of $3.87 in 2010,
this translates into improved growth rates of
approximately 17.5% to 19.0% excluding currency, and
approximately 22.5% to 24.0% at prevailing exchange
rates
Source: PMI forecasts |
 6
PMI Organic Cigarette Volume Growth
(%)
Source: PMI Financials
2011
2011
4.4
0.5
0
5
Q3
YTD Sept |
 7
PMI Brand Performance
% Volume Growth vs. Prior Year
Q3, 2011
YTD Sept, 2011
Marlboro
3.9%
0.5%
L&M
3.9
2.9
Bond Street
6.8
2.2
Fortune
10.1
9.0
(a)
Philip Morris
1.8
1.0
Parliament
16.2
9.9
Chesterfield
7.0
0.4
Sampoerna A
22.8
11.7
Lark
44.1
15.3
Dji Sam Soe
12.1
10.3
(a) March through September
Source: PMI Financials |
 8
Marlboro
Market Shares
Market Shares
YTD
Sept,
2010
YTD
Sept,
2011
Variance
Asia
(a)
6.2%
6.5%
0.3pp
EEMA
(b)
5.6
6.1
0.5
EU
18.1
17.9
(0.2)
LA&C
13.8
13.5
(0.3)
Total
(a)(b)
8.8
9.0
0.2
(a)
Excluding PRC
(b)
Excluding duty-free
(c)
Also excluding the USA
Source: PMI estimates
(c) |
 9
Marlboro
Market Shares –
LA&C Region
Market Shares
YTD
Sept,
2010
YTD
Sept,
2011
Variance
Argentina
23.2%
24.0%
0.8pp
Brazil
6.7
7.0
0.3
Colombia
3.7
4.7
1.0
Mexico
48.9
51.8
2.9
Source: PMI estimates |
 10
PMI Market Share Developments
(%)
Top 30 PMI OCI Markets
(a) Adjusted
for
Philippines
pro
forma
Jan-Feb
2010
Source: PMI Financials and estimates
(a)
34.9
36.3
32
35
38
YTD Sept, 2010
YTD Sept, 2011 |
 11
2011 Third-Quarter Results –
by Region
(a)
Excluding currency and acquisitions
Source: PMI Financials
Q3, 2011 Results
Asia
EEMA
LA&C
EU
Net Revenues
(a)
+39.1%
+11.2%
+8.3%
+2.2%
Adjusted
OCI
(a)
+75.1
+13.8
+9.0
+3.1 |
 12
Japan
Source: PMI Financials, PMI estimates and Tobacco Institute of Japan
PMI shipments up 47.1%:
-
Higher 2011 market share
-
Payback in Q3, 2010, for Q2,
2010, distributor inventory build-
up
September C-store consumer
off-take share slightly above
30%, compared to around
26% pre-crisis
Retention share only
measurable in Q4, 2011, or
Q1, 2012
Industry volume decline not
expected to exceed 15% this
year |
 13
Indonesia
PMI volume up 22.5% in
Q3, 2011
Record market share of
31.2% in Q3, 2011
Indonesian economy
remains strong and
consumer purchasing
power is increasing
Government expected to
continue to implement
plans to simplify excise tax
structure
Source: PMI Financials and PMI estimates
2010
2011
Other
Marlboro
Dji Sam Soe
Sampoerna A
29.2
31.2
(%)
PMI Market Share
Total PMI
11.2
12.1
7.9
7.7
5.7
7.2
4.2
4.4
0
35
Q3
Q3 |
 14
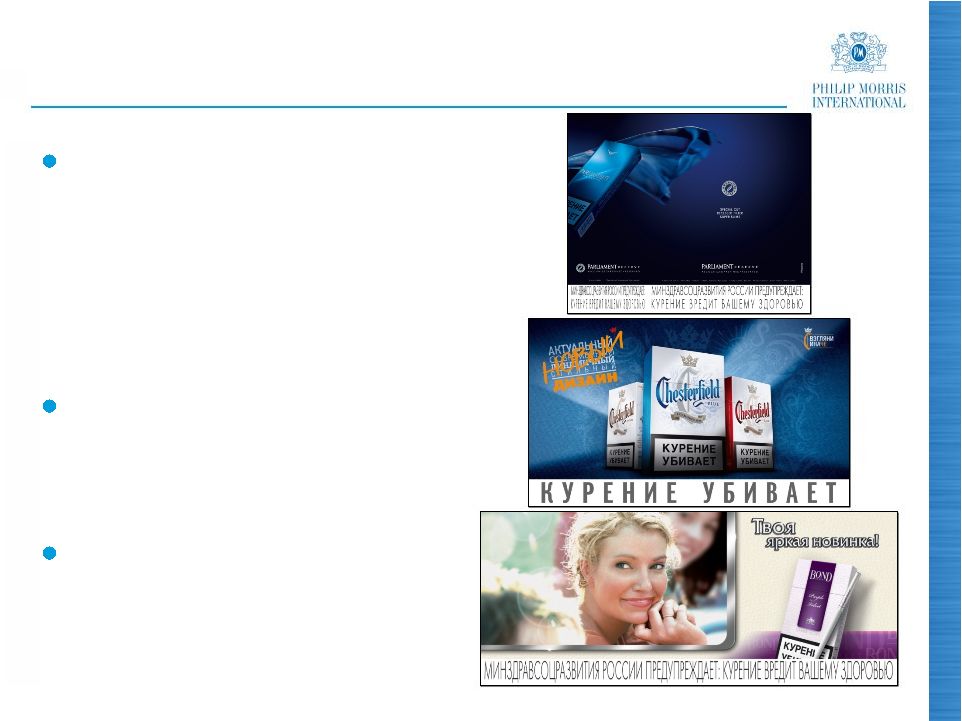
Russia
Market share up slightly to
25.8% QTD Aug, 2011,
behind:
-
Parliament
in premium
-
Chesterfield
in mid-price, and
-
Bond Street
in low-price
segment
PMI volume down 3.5% in
Q3, 2011, due to:
-
Distributor inventory adjustments
-
Lower total market
During Q4, 2011, Russian
Parliament expected to
approve new manageable
road map for excise taxes
Source: A.C. Nielsen, PMI Finance and Russian Ministry of Finance |
 15
Turkey
PMI volume up 21.6% in Q3,
2011
Strong share gains driven by:
-
Parliament
in premium
-
Muratti
in mid-price, and
-
L&M
in low-price
Total market had stabilized,
but recently announced, very
large ad-valorem excise tax
increase expected to be
disruptive
A more balanced excise tax
structure is needed
Source: PMI Financials, PMI estimates and A.C. Nielsen
Premium
Mid-price
Low-price
41.8
45.7
(%)
PMI Market Share
Total PMI
19.2
21.2
5.9
6.5
18.0
16.7
0
50
Q3, 2010
Q3, 2011 |
 16
Germany
Source: PMI Financials and PMI estimates
Q3, 2010
Q3, 2011
L&M
Marlboro
Other
(%)
PMI Market Shares by Segment
Germany had benefited
from more robust market
volume trends this year
Q3, 2011, total German
market volume:
-
Cigarettes +0.3%
-
Fine cut +3.8%
PMI share gains in both
cigarette and fine cut
segments
Price increase in Q2, 2011.
Next tax step in Jan 2012
20.3
2.7
10.3
5.6
6.4
35.2
14.7
4.6
Cigarette
Fine Cut
21.1
1.3
9.2
5.6
7.3
34.9
14.2
4.6
Cigarette
Fine Cut |
 17
France
Great momentum in a
stable market
Cigarette share gain of
0.4pp to 40.4%, driven by
premium Marlboro
and
Philip Morris
Strong growth in fine cut
segment since launch of
Marlboro
in Feb 2011
Cigarette price increase of
€0.30/pack this month
Source: PMI estimates
Q3, 2010
Q3, 2011
40.4
Philip Morris
Marlboro
Other
(%)
PMI Market Shares by Segment
25.9
6.8
8.2
5.7
12.7
25.2
6.3
Cigarette
Fine Cut
25.7
7.7
5.7
13.3
40.0
19.0
6.6
Cigarette
Fine Cut |
 18
Spain
Very high unemployment
driving decline in cigarette
industry volume of at least
15% in 2011
Pricing situation was
resolved in September:
-
Marlboro
back to previous
level of €4.25/pack
-
L&M
raised to €3.75/pack
Source: PMI estimates |
 19
Pricing
The pricing environment
continues to be very
favorable
In 2011, PMI has
implemented or announced
price increases in:
-
Asia: Australia, Indonesia,
Philippines
-
EEMA: Algeria, Russia, Saudi
Arabia, Ukraine
-
EU: France, Germany, Italy,
Poland, Spain
-
LA&C: Argentina, Brazil,
Canada
Source: PMI Financials
($ mio)
Q3
Q1
Pricing Variance
Q2
449
453
341
617
292
564
1,082
1,634
0
900
1,800
2010
2011 |
 20
Costs and Margins
Adjusted OCI Margins
Third-Quarter
2010
2011
(a)
Variance
(a)
Asia
37.6%
47.4%
9.8pp
EEMA
45.1
46.2
1.1
EU
53.0
53.5
0.5
LA&C
32.7
32.9
0.2
Total
44.2
47.3
3.1
(a)
Excluding currency and acquisitions
Source: PMI Financials
Stable tobacco leaf prices
Moderate cost increases offset by productivity savings
that will surpass $250 million in 2011 |
 21
Excise Taxation
Excise tax structures have improved and several
countries have adopted multi-year tax plans
Most governments appear to have understood that large
excise tax increases are disruptive and do not improve
revenue generation over mid to long-term
We expect some VAT increases in 2012, but these should
be manageable
Every year, some governments introduce disruptive
excise tax increases. This happened last week in Turkey
and additional surprises remain possible |
 22
Plain Packaging
We oppose such measures because:
-
No sound evidence it would reduce consumption, smoking
incidence or youth smoking, or provide any other public health
benefit
-
Undermines public health objectives by lowering prices and
increasing illicit trade
-
Violates intellectual property protections and breaches
international trade obligations
We therefore do not believe that plain packaging
regulations should be widely adopted
We are vigorously pursuing several legal avenues to
challenge the Australian Government’s plain packaging
proposal |
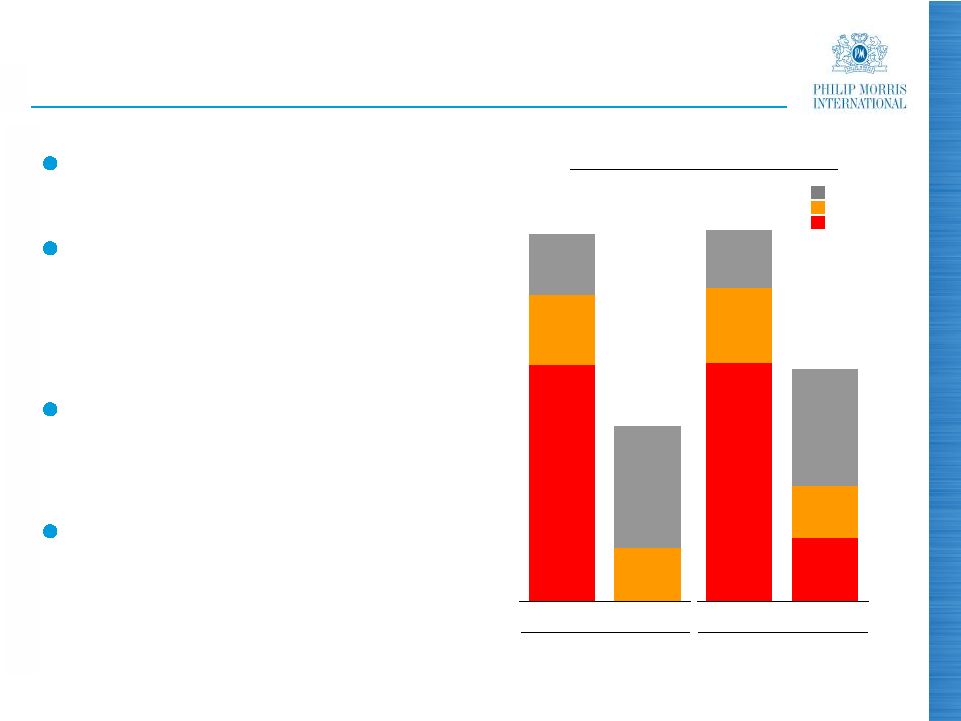
 23
($ million)
+22.1%
Currency
Free
Cash
Flow
(a)
(a)
Free cash flow equals net cash provided by operating activities less capital
expenditures Source: PMI Financials
($ million)
+25.6%
Currency
2010
2011
2010
2011
9,000
2,253
2,830
214
0
1,000
2,000
3,000
Q3
Q3
7,373
478
0
3,000
6,000
9,000
YTD Sept
YTD Sept |
 +10.3%
+20.3%
$3.08
$1.84
+17.4%
2008
Aug
Sept
Sept
Sept
2011
+7.4%
24
Dividend Increases Since Spin-Off
(a)
(a)
Dividends for 2008 and 2011 are annualized rates. 2008 annualized rate is based on
a quarterly dividend of $0.46 per common share, declared June 18, 2008. The
annualized rate for 2011 is based on a quarterly dividend of $0.77 per common share, declared September 14, 2011
Source: PMI Financials
2008
2009
2010
2011
+67.4% |
 25
Share Repurchases and Dividends
During the third quarter, PMI spent $1.4 billion to
repurchase a further 21.2 million shares
Since the March 2008 spin:
-
Over $20 billion spent to repurchase nearly 400 million shares at
an average price of $50.81 per share
-
Over $14 billion paid out in dividends
-
Nearly $35 billion returned to our shareholders
Source: PMI Financials |
 26
Summary
Outstanding third quarter:
-
Organic volume growth of 4.4%
-
Strong market share momentum and favorable pricing
environment
-
Adjusted diluted EPS, excluding currency, increased by 33.0%
-
2011 reported diluted EPS guidance range narrowed to $4.75-
$4.80, with improved business outlook offsetting recent
unfavorable currency movements
-
Compared to an adjusted diluted EPS of $3.87 in 2010, this
corresponds to an increase of approximately 22.5% to 24.0% at
prevailing exchange rates, and approximately 17.5% to 19.0%,
excluding currency
20.3% dividend increase in September demonstrates our
focus on shareholder returns and our belief in a bright
future
Source: PMI Financials |
 Questions & Answers
2011 Third-Quarter Results |
 28
PHILIP MORRIS INTERNATIONAL INC. and Subsidiaries
Reconciliation of Non-GAAP Measures
Adjustments for the Impact of Currency and Acquisitions
For the Quarters Ended September 30,
($ in millions)
(Unaudited)
Reported Net
Revenues
Less
Excise
Taxes
Reported Net
Revenues
excluding
Excise Taxes
Less
Currency
Reported Net
Revenues
excluding
Excise Taxes &
Currency
Less
Acquisi-
tions
Reported Net
Revenues
excluding
Excise Taxes,
Currency &
Acquisitions
Reported
Net
Revenues
Less
Excise
Taxes
Reported Net
Revenues
excluding
Excise Taxes
Reported
Reported
excluding
Currency
Reported
excluding
Currency &
Acquisitions
8,155
$
5,649
$
2,506
$
321
$
2,185
$
-
$
2,185
$
European Union
7,045
$
4,906
$
2,139
$
17.2%
2.2%
2.2%
4,921
2,711
2,210
89
2,121
13
2,108
EEMA
4,184
2,288
1,896
16.6%
11.9%
11.2%
5,143
2,344
2,799
248
2,551
2
2,549
Asia
3,629
1,796
1,833
52.7%
39.2%
39.1%
2,487
1,640
847
39
808
-
808
Latin America & Canada
2,078
1,332
746
13.5%
8.3%
8.3%
20,706
$
12,344
$
8,362
$
697
$
7,665
$
15
$
7,650
$
PMI Total
16,936
$
10,322
$
6,614
$
26.4%
15.9%
15.7%
Reported
Operating
Companies
Income
Less
Currency
Reported
Operating
Companies
Income
excluding
Currency
Less
Acquisi-
tions
Reported
Operating
Companies
Income
excluding
Currency &
Acquisitions
Reported
Operating
Companies
Income
Reported
Reported
excluding
Currency
Reported
excluding
Currency &
Acquisitions
1,262
$
105
$
1,157
$
-
$
1,157
$
European Union
1,113
$
13.4%
4.0%
4.0%
925
(32)
957
(13)
970
EEMA
856
8.1%
11.8%
13.3%
1,309
104
1,205
2
1,203
Asia
690
89.7%
74.6%
74.3%
255
-
255
-
255
Latin America & Canada
244
4.5%
4.5%
4.5%
3,751
$
177
$
3,574
$
(11)
$
3,585
$
PMI Total
2,903
$
29.2%
23.1%
23.5%
2011
2010
% Change in Reported Operating
Companies Income
2011
2010
% Change in Reported Net Revenues
excluding Excise Taxes |
 29
PHILIP MORRIS INTERNATIONAL INC. and Subsidiaries
Reconciliation of Non-GAAP Measures
Reconciliation of Reported Operating Companies Income to Adjusted Operating
Companies Income & Reconciliation of Adjusted Operating Companies Income
Margin, excluding Currency and Acquisitions For the Quarters Ended September
30, ($ in millions)
(Unaudited)
(a) For the calculation of net revenues excluding excise taxes, currency and
acquisitions, refer to previous slide Reported
Operating
Companies
Income
Less
Asset
Impairment &
Exit Costs
Adjusted
Operating
Companies
Income
Less
Currency
Adjusted
Operating
Companies
Income
excluding
Currency
Less
Acquisi-
tions
Adjusted
Operating
Companies
Income
excluding
Currency &
Acquisitions
Reported
Operating
Companies
Income
Less
Asset Impairment &
Exit Costs
Adjusted
Operating
Companies
Income
Adjusted
Adjusted
excluding
Currency
Adjusted
excluding
Currency &
Acquisitions
1,262
$
(11)
$
1,273
$
105
$
1,168
$
-
$
1,168
$
European Union
1,113
$
(20)
$
1,133
$
12.4%
3.1%
3.1%
925
(16)
941
(32)
973
(1)
974
EEMA
856
-
856
9.9%
13.7%
13.8%
1,309
(5)
1,314
104
1,210
2
1,208
Asia
690
-
690
90.4%
75.4%
75.1%
255
(11)
266
-
266
-
266
Latin America & Canada
244
-
244
9.0%
9.0%
9.0%
3,751
$
(43)
$
3,794
$
177
$
3,617
$
1
$
3,616
$
PMI Total
2,903
$
(20)
$
2,923
$
29.8%
23.7%
23.7%
% Points Change
Adjusted
Operating
Companies
Income
excluding
Currency
Net Revenues
excluding
Excise Taxes &
Currency
(a)
Adjusted
Operating
Companies
Income
Margin
excluding
Currency
Adjusted
Operating
Companies
Income
excluding
Currency &
Acquisitions
Net Revenues
excluding
Excise Taxes,
Currency &
Acquisitions
(a)
Adjusted
Operating
Companies
Income Margin
excluding
Currency &
Acquisitions
Adjusted
Operating
Companies
Income
Net Revenues
excluding Excise
Taxes
(a)
Adjusted
Operating
Companies
Income
Margin
Adjusted
Operating
Companies
Income
Margin
excluding
Currency
Adjusted
Operating
Companies
Income Margin
excluding
Currency &
Acquisitions
1,168
$
2,185
$
53.5%
1,168
$
2,185
$
53.5%
European Union
1,133
$
2,139
$
53.0%
0.5
0.5
973
2,121
45.9%
974
2,108
46.2%
EEMA
856
1,896
45.1%
0.8
1.1
1,210
2,551
47.4%
1,208
2,549
47.4%
Asia
690
1,833
37.6%
9.8
9.8
266
808
32.9%
266
808
32.9%
Latin America & Canada
244
746
32.7%
0.2
0.2
3,617
$
7,665
$
47.2%
3,616
$
7,650
$
47.3%
PMI Total
2,923
$
6,614
$
44.2%
3.0
3.1
% Change in Adjusted Operating
Companies Income
2010
2011
2010
2011 |
 30
PHILIP MORRIS INTERNATIONAL INC. and Subsidiaries
Reconciliation of Non-GAAP Measures
Reconciliation of Reported Diluted EPS to Adjusted Diluted EPS and Adjusted
Diluted EPS, excluding Currency For the Quarters Ended September 30,
(Unaudited)
2011
2010
% Change
Reported Diluted EPS
1.35
$
0.99
$
36.4%
Adjustments:
Asset impairment and exit costs
0.02
0.01
Tax items
-
-
Adjusted Diluted EPS
1.37
$
1.00
$
37.0%
Less:
Currency impact
0.04
Adjusted Diluted EPS, excluding Currency
1.33
$
1.00
$
33.0% |
 31
PHILIP MORRIS INTERNATIONAL INC. and Subsidiaries
Reconciliation of Non-GAAP Measures
Reconciliation
of
Operating
Cash
Flow
to
Free
Cash
Flow
and
Free
Cash
Flow,
excluding
Currency
For the Quarters and Nine Months Ended September 30,
($ in millions)
(Unaudited)
(a) Operating Cash Flow
For the Quarters Ended
For the Nine Months Ended
September 30,
September 30,
2011
2010
% Change
2011
2010
% Change
Net cash provided by operating activities
(a)
3,053
$
2,417
$
26.3%
9,568
$
7,856
$
21.8%
Less:
Capital expenditures
223
164
568
483
Free cash flow
2,830
$
2,253
$
25.6%
9,000
$
7,373
$
22.1%
Less:
Currency impact
214
478
Free cash flow, excluding currency
2,616
$
2,253
$
16.1%
8,522
$
7,373
$
15.6%
For the Quarters Ended
For the Nine Months Ended
September 30,
September 30,
2011
2010
% Change
2011
2010
% Change
Net cash provided by operating activities
(a)
3,053
$
2,417
$
26.3%
9,568
$
7,856
$
21.8%
Less:
Currency impact
236
515
Net cash provided by operating activities,
excluding currency
2,817
$
2,417
$
16.5%
9,053
$
7,856
$
15.2% |
 32
PHILIP MORRIS INTERNATIONAL INC. and Subsidiaries
Reconciliation of Non-GAAP Measures
Reconciliation of Reported Diluted EPS to Adjusted Diluted EPS
For the Year Ended December 31,
(Unaudited)
2010
Reported Diluted EPS
3.92
$
Adjustments:
Tax items
(0.07)
Asset impairment and exit costs
0.02
Adjusted Diluted EPS
3.87
$
|
 2011
Third-Quarter Results October 20, 2011 |