Attached files
| file | filename |
|---|---|
| 8-K - FORM 8-K - Kraton Corp | d242302d8k.htm |
 KRATON
PERFORMANCE POLYMERS, INC. October 12, 2011
DEUTSCHE
BANK
19
ANNUAL
LEVERAGED
FINANCE
CONFERENCE
TH
Exhibit 99.1 |
 Forward-Looking Statement Disclaimer
2
This
presentation
may
include
“forward-looking
statements”
that
reflect
our
plans,
beliefs,
expectations
and
current
views
with
respect
to,
among
other
things,
future
events
and
financial
performance.
Forward-looking
statements
are
often
characterized
by
the
use
of
words
such
as
“believes,”
“estimates,”
“expects,”
“projects,”
“may,”
“intends,”
“plans”
or
“anticipates,”
or by discussions of strategy, plans or intentions and include statements regarding
our ability to obtain raw materials; costs, timing and plans related to our
planned joint venture with Formosa Petrochemical Corporation and the related
manufacturing facility; estimated future contributions to our benefit plans; anticipated capital expenditures; and
estimated future pension contributions. All forward-looking statements in this
presentation are made based on management's current expectations and estimates,
which involve risks, uncertainties and other factors that could cause actual
results to differ materially from those expressed in forward-looking statements. Readers are cautioned not to place
undue reliance on forward-looking statements. These risks and uncertainties are
more fully described in “Part I. Item 1A. Risk Factors”
contained in our Annual Report on 10-K, as filed with the Securities and Exchange
Commission and as subsequently updated in our Quarterly Reports on Form
10-Q, and include risks related to: conditions in the global economy and
capital markets; our reliance on LyondellBasell Industries for the provision of significant operating and other services;
the failure of our raw materials suppliers to perform their obligations under
long-term supply agreements, or our inability to replace or renew these
agreements when they expire; limitations in the availability of raw materials we need to produce
our
products
in
the
amounts
or
at
the
prices
necessary
for
us
to
effectively
and
profitably
operate
our
business;
competition in our end-use markets, by other producers of SBCs and by producers of
products that can be substituted for our products; our ability to produce and
commercialize technological innovations; our ability to protect our intellectual
property, on which our business is substantially dependent; infringement of our
products on the intellectual property rights of others; seasonality in our
Paving and Roofing business; financial and operating constraints related to our substantial level
of indebtedness; the inherently hazardous nature of chemical manufacturing; product
liability claims and other lawsuits arising from environmental damage or
personal injuries associated with chemical manufacturing; political and economic
risks in the various countries in which we operate; health, safety and environmental
laws, including laws that govern our employees’
exposure to chemicals deemed harmful to humans; regulation of our customers, which
could affect the demand for our products or result in increased compliance
costs; customs, international trade, export control, antitrust, zoning and
occupancy
and
labor
and
employment
laws
that
could
require
us
to
modify
our
current
business
practices
and
incur
increased costs; fluctuations in currency exchange rates; our relationship with our
employees; loss of key personnel or our inability to attract and retain new
qualified personnel; the fact that we do not enter into long-term contracts with our
customers; a decrease in the fair value of our pension assets, which could require us
to materially increase future funding of the pension plan; future sales of our
shares could adversely affect the market price of our common stock; and Delaware
law and some provisions of our organizational documents make a takeover of our company
more difficult. We assume no obligation to update such information. Further
information concerning issues that could materially affect financial performance
related to forward looking statements can be found in our periodic filings with the Securities and Exchange
Commission. |
 GAAP
Disclaimer 3
This presentation includes the use of both GAAP (generally accepted accounting
principles) and non-GAAP financial measures. The non-GAAP financial
measures are EBITDA, Adjusted EBITDA and Credit Agreement EBITDA. The most
directly comparable GAAP financial measure is net income/loss. A reconciliation
of the non-GAAP financial measures used in this presentation to the most
directly comparable GAAP measure is included herein. We consider EBITDA, Adjusted
EBITDA and Credit Agreement EBITDA important supplemental measures of our performance
and believe they are frequently used by investors and other interested parties
in the evaluation of companies in our industry and, with respect to Credit
Agreement EBITDA, an important measure for compliance with our debt covenants.
EBITDA, Adjusted EBITDA and Credit Agreement EBITDA have limitations as
analytical tools and should not be considered in isolation or as a substitute
for analysis of our results under GAAP in the United States.
|
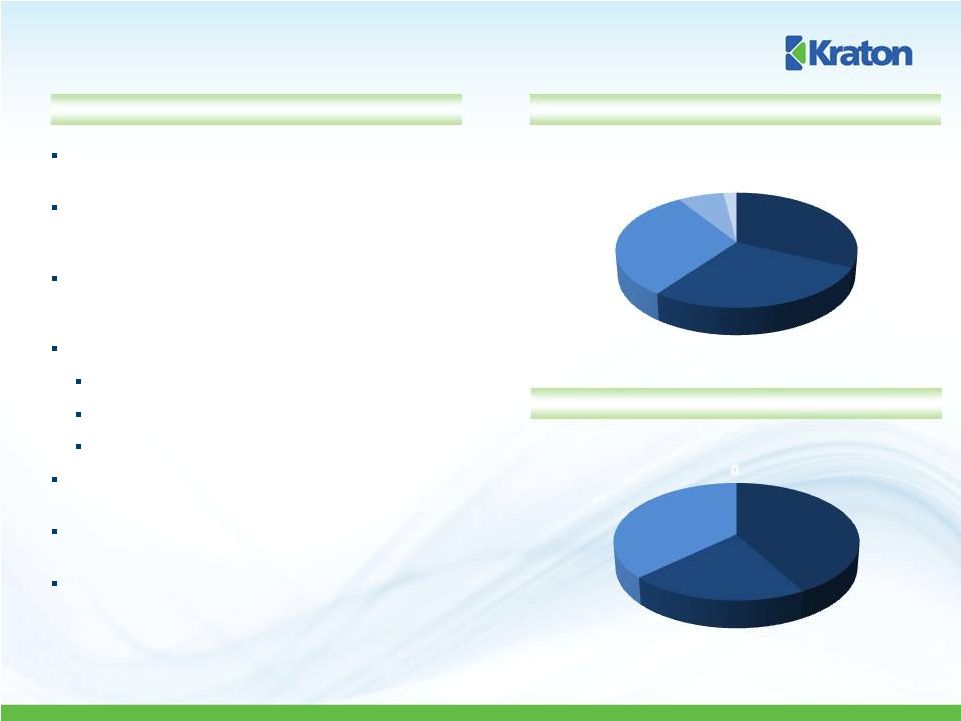 Kraton
Overview We invented and commercialized Styrenic Block
Copolymer (SBC) technology nearly 50 years ago
We hold leading market share positions in each of our
end-use markets providing industrial, consumer and
geographical diversification that is second to none
We design and manufacture customized SBC polymer
and compound solutions to meet our leading
customers’
specific innovation needs
We produce the following:
Unhydrogenated Styrenic Block Copolymers (USBCs)
Hydrogenated Styrenic Block Copolymers (HSBCs)
Isoprene Rubber and Isoprene Rubber Latex
We currently offer approximately 800 products to more
than 700 customers, in over 60 countries
We employ approximately 880 people in 9 locations in
all major regions of the world
2010
revenue
of
$1,228
million
and
Adjusted
EBITDA
(1)
of $195 million; 16% margin
4
Paving
and
Roofing
Adhesives,
Sealants
and
Coatings
Other
Emerging
Businesses
Advanced
Materials
2010 Revenue by End-Use
(2)
2010 Revenue by End-Use
(2)
North and South
America
Asia
Pacific
Europe, Middle
East & Africa
(1)
Adjusted EBITDA is GAAP EBITDA excluding restructuring and related charges and
non-cash expenses. (2)
Management estimates.
Global SBC Market Leader
31%
28%
32%
7%
2%
2%
21%
37%
42% |
 Business
Strategy 5
Industry-leading expertise in market and application development
Worldwide manufacturing, technical support and customer service footprint
Leading market share across multiple end use markets
Deliver application-based solutions to meet specific customer needs
Continue to commercialize next generation of innovations
Expand pipeline of innovation projects
Demonstrate progress through improvement in Vitality Index
Develop new applications for SBCs that do not exist today, improving portfolio
mix over time
Eliminate marginally profitable products
Continue
value
pricing
model
–
extract
value
for
complexity
and
unique
solutions
Proactively manage raw material price volatility
Lever inherent operating leverage
Capitalize on organic growth opportunities
Asian HSBC capacity
Expansion
of
IR
Latex
capacity
in
Paulinia,
Brazil
completed
May
2011
Announced agreement with contract manufacturer to double IR Latex capacity in
Japan (est. completion mid-2013)
Pursue appropriate M&A opportunities
Leverage
Leadership
Position
Drive Growth
Through
Innovation
Maintain Focus
on Margin
Expansion
Invest in
Growth and
Infrastructure |
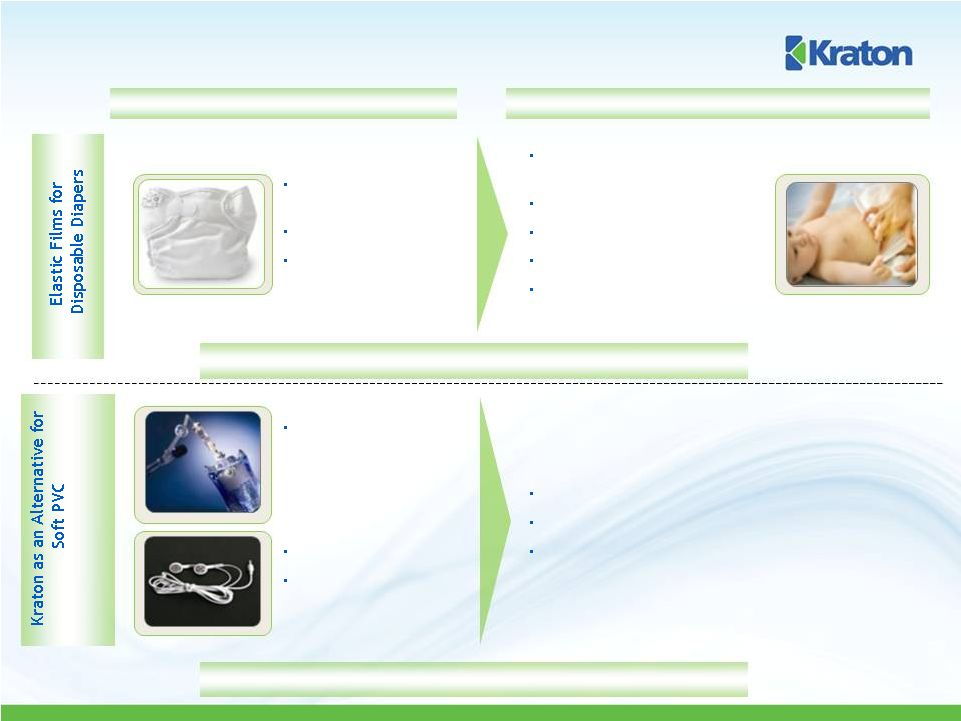 Kraton
Makes Products Better 6
Stretch in legs only
(Spandex)
Not a fitted garment
High leakage rate
Overall improvement in stretch
(where it’s needed)
Better fit
Low leakage rate
Kraton market share: 50%
2001 –
2009 CAGR: 11.5%
Phthalate plasticizers
are used to make PVC
soft but they can leach
from finished products
and create health
concerns
Limited recyclability
PVCs are unsafe when
burned or incinerated
improperly
Environmentally friendly –
100% recyclable
Kraton imparts softness, toughness and clarity
Plasticizer & chlorine free
Before Kraton
After Kraton
Kraton material as % of Diaper cost: <2%
Kraton material as % of finished product cost: <5% |
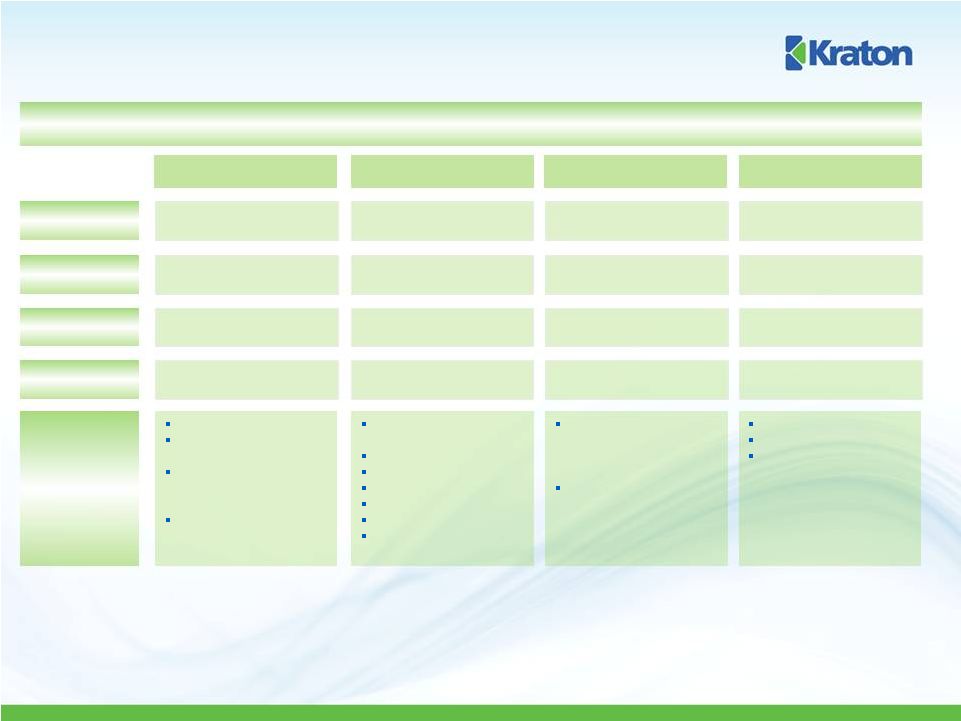 Clear
Leader in Attractive Markets Market Position
2010
Revenue
(1)
#1
~64%
Adhesives, Sealants,
and Coatings
Advanced Materials
#1
~69%
Paving and Roofing
#1
~64%
Emerging Businesses
(3)
#1
100%
32%
30%
28%
7%
#1 Market Position in Each End Use
Top 4 Market
Share
Growth
(2)
7.7%
8.8%
7.1%
33.8%
7
Tapes and labels
Non-woven and
industrial adhesives
Industrial and
consumer weather
sealants
White elastomeric roof
coatings
Soft touch for
consumer products
Elastic films (diapers)
Skin care and lotions
Food packaging
Automotive
Medical packaging
Wire and cable (PVC
alternatives)
Examples of
End Use
Applications
Asphalt modification
for performance
roadways, bridges and
airports
Asphalt modification
for roofing felts and
shingles
Surgical gloves
Condoms
Medical components
Source:
Management estimates.
(1)
Based on 2010 sales of $1,228 million.
(2)
Industry volume growth from 2001-2010, Emerging Businesses growth rate refers to
Kraton’s Isoprene Rubber (“IR”) and Isoprene Rubber Latex (“IRL”) growth from 2005-2010.
(3)
The Emerging Businesses end use market includes our IR and IRL business. |
 Innovation-led Top Line Growth
8
Goal -
20% of revenue from innovation
Vitality Index
Q2 TTM vitality index 14%
Innovation revenue up 25% year-on-year, YTD innovation revenue up 38%
Strong year-on-year revenue growth in key innovations
PVC replacement up 114%
Potable water tubing up 83%
Roofing innovations up 56%
Reactive SBS for printing plates up 46%
Key adhesives applications up 45%
6%
11%
13%
14%
12%
13%
14%
2005
2006
2007
2008
2009
2010
TTM Q2'11 |
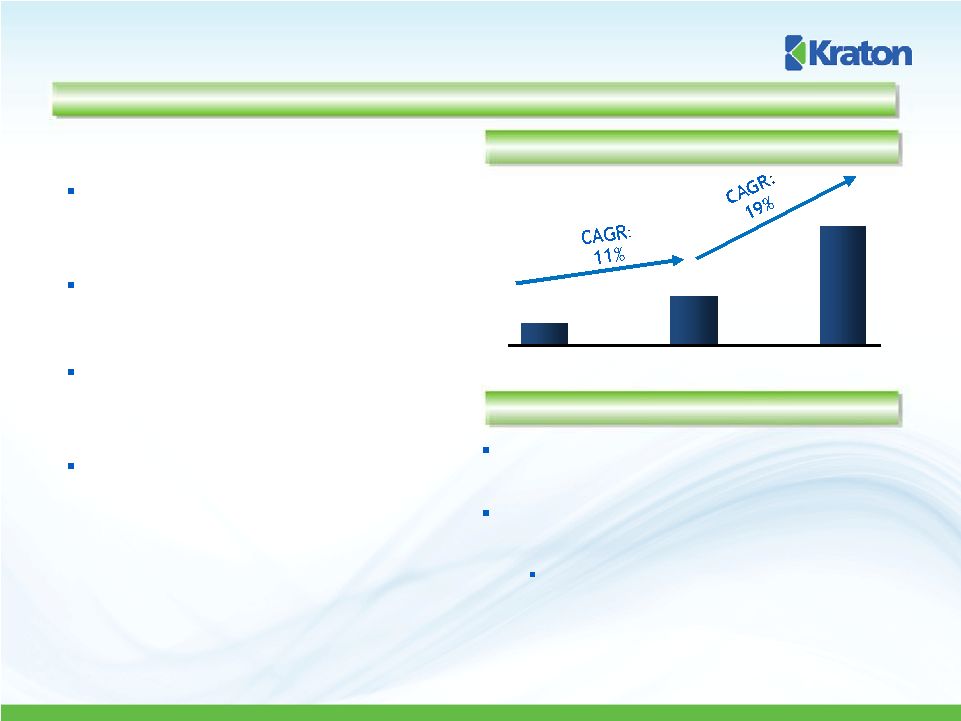
 Innovation-led Top Line Growth
Tremendous growth
Rapidly capture share from $2.2 billion natural
rubber latex industry
Margins well in excess of rest of business
Kraton maintains ~85% market share
Challenging process technology to replicate
for competitors and new entrants
IR line conversion at Belpre, Ohio was
completed June 2011
IRL capacity expansion of Paulinia, Brazil
facility was completed May 2011
Increased IRL capacity by approximately 33%
Announced agreement to double IRL
capacity in Japan
Case Study: IR and IR Latex Revenue Growth
$15
$22
$23
$35
$87
$79
$61
2005
2006
2007
2008
2009
2010
TTM
Q2'11
(US $ in millions)
9
Key Attributes |
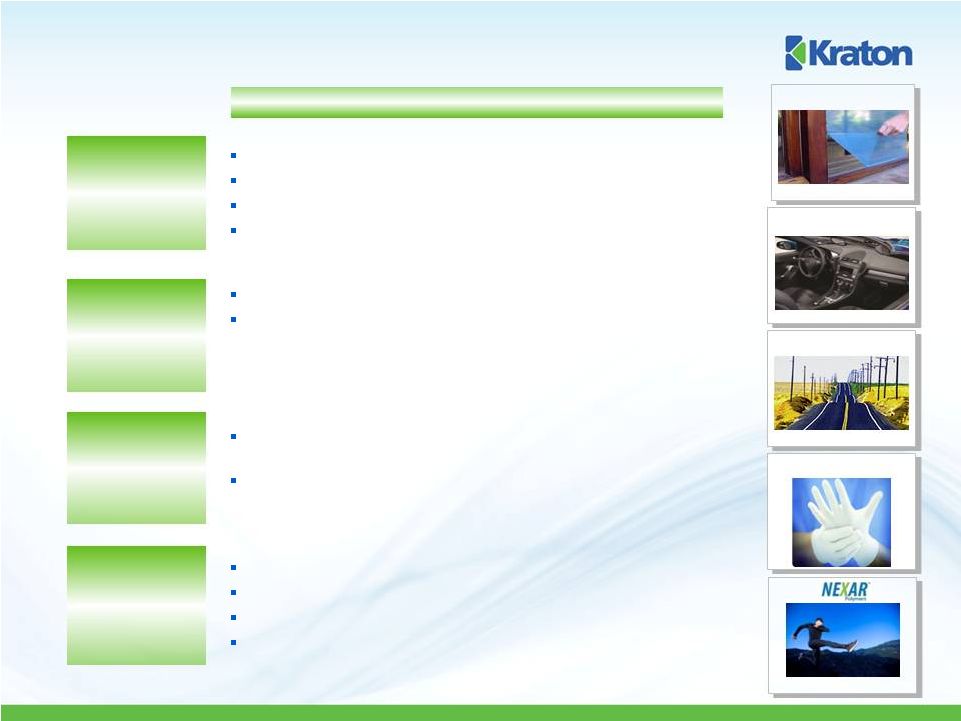 Compelling Organic Growth Platforms
Advanced
Materials
Adhesives,
Sealants &
Coatings
Paving and
Roofing
Emerging markets growth
Expansion into new and differentiated markets, such as white
elastomeric roof coatings, protective films, oilfield service
applications, spray and extrusion coatings, hot melt adhesives,
elastic adhesives, labels and sealant applications
Superior performing SBS modified emulsions for
asphalt
modification
Low VOC roof coating formulations for superior water resistance,
improved adhesion and reduced installation cost
“Green”
PVC alternatives for the wire and cable industry
Enabling technology for high performance fabric solutions
“Soft Touch”
solutions for the automotive industry
Co-extrusion technology for protective films
Applications
Cariflex™
Isoprene
Rubber and
Isoprene
Rubber Latex
Cariflex™
Isoprene Rubber and Isoprene Rubber Latex
Medical applications –
surgical gloves, medical components
Material substitution –
condoms
NEXAR
®
–
high-end membrane technology
IRL Gloves
HiMA
Soft Skins
Protective Films
10 |
 Investing
for Growth In Asia Asia Pacific SBC market –
63% of
global SBC consumption by volume in
2010
(1)
In 2010 Asia Pacific accounted for 21%
of our total revenue, with 43% derived
from higher margin HSBC products
In 2010 relocated Shanghai, China
office to a new facility (double the
size of the previous location)
Expanded warehouse capacity in
Shanghai Wai Gao Qiao Free Trade
Zone
Proposed HSBC expansion in Asia
Forecast strong worldwide growth in HSBC
driven by innovation
Signed framework agreement with Formosa
Petrochemical Corporation in Q2’11
Proposed joint venture to build, own and
operate a 30 kT HSBC plant in Mailiao, Taiwan
Asia is an important component of Kraton’s growth strategy
(1)
Management estimates. Includes SBC consumption for footwear, a market in which Kraton
does not actively compete. 11
Asian HSBC Industry Demand Trends (kT)
27
62
149
2001
2009
2014 |
 Volume (kT)
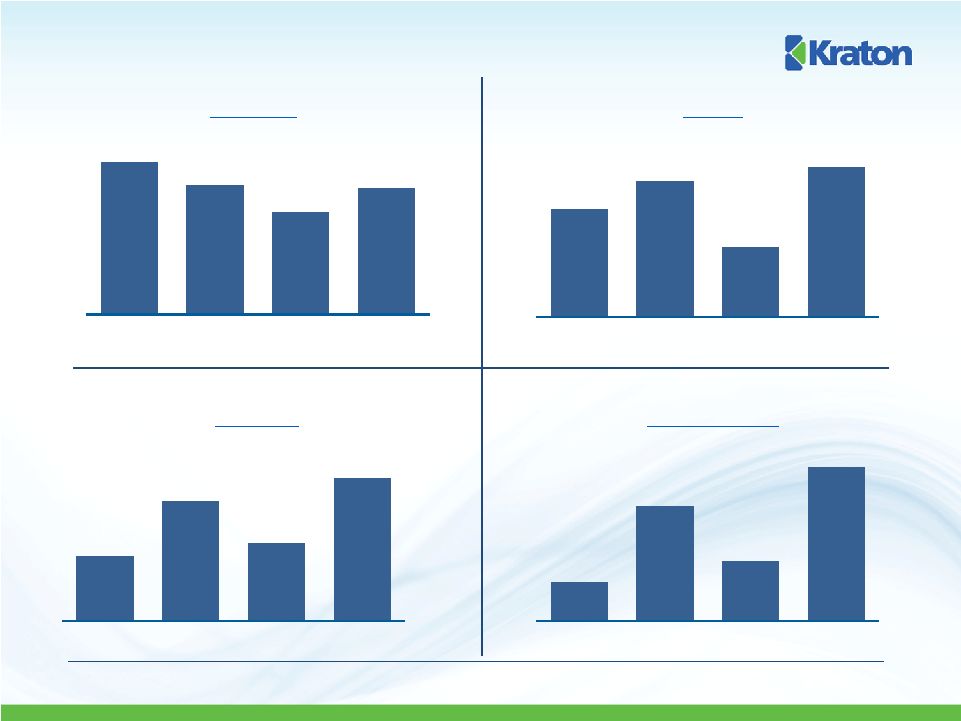
Selected Financial Trends –
FY2007 -
2010
(1)
Adjusted EBITDA is GAAP EBITDA excluding restructuring and related charges,
non-cash compensation expenses, gain on the extinguishment of debt and
management fees.
12
Revenue
(US $ in Millions)
Gross Profit
(US $ in Millions)
Adjusted EBITDA
(1)
(US $ in Millions)
358
313
260
307
2007
2008
2009
2010
$1,066
$1,171
$920
$1,228
2007
2008
2009
2010
$151
$255
$176
$301
2007
2008
2009
2010
$68
$152
$91
$195
2007
2008
2009
2010 |
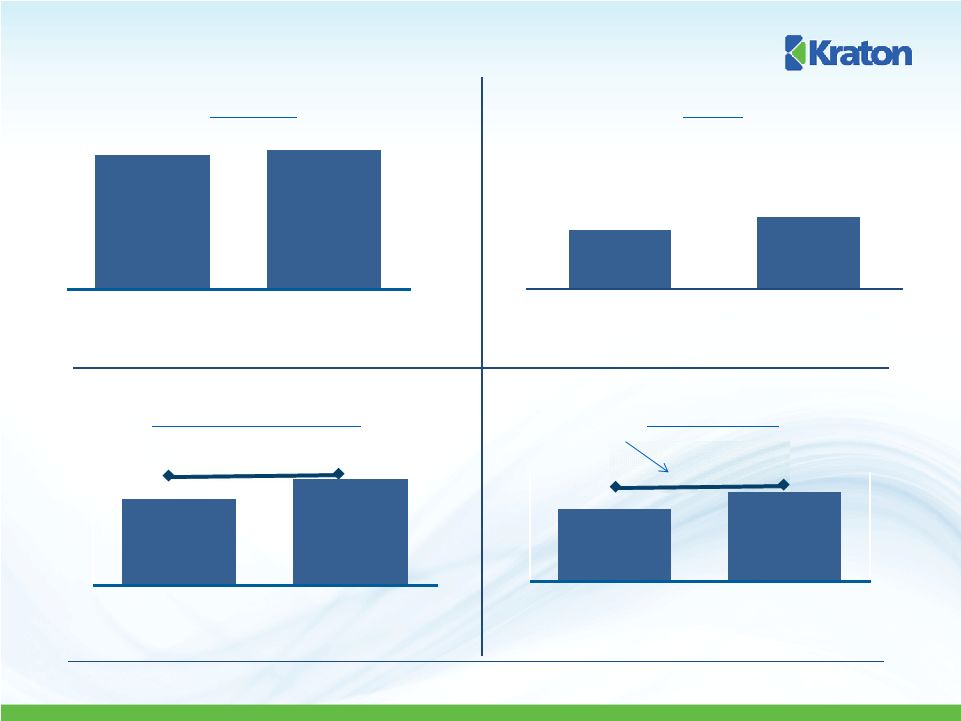 Volume (kT)
Selected YTD Financial Trends –
First Half Comparisons
(1)
Adjusted EBITDA is GAAP EBITDA excluding restructuring and related charges,
non-cash compensation expenses, and loss on the extinguishment of debt.
13
Revenue
(US $ in Millions)
Gross Profit and Gross Margin
(US $ in Millions)
$605
$731
$0
$50
$100
$150
$200
$250
$300
$350
$400
$450
$500
$550
$600
$650
$700
$750
$800
1H 10
1H 11
Adjusted EBITDA
(1)
(US $ in Millions)
Adjusted
EBITDA
Margin
26.7%
26.2%
Q2 2011 TTM Volume: 312 KT
Q2 2011 TTM Gross Profit: $338
Q2 2011 TTM Adj. EBITDA: $219
Q2 2011 TTM Revenue: $1,355
$106
$130
17.5%
17.8%
0
20
40
60
80
100
120
140
160
1H 10
1H 11
$158
$195
0
20
40
60
80
100
120
140
160
180
200
1H 10
1H 11
159
164
40
90
140
190
1H 10
1H 11 |
 Current
Capital Structure 14
US $ in millions
As of June 30, 2011
Amount
Maturity
Rate
Cumulative Debt/ Debt Ratings:
TTM Adj. EBITDA
(1)
S&P / Moody’s
Cash
$
67.2
Debt:
Corporate Family Rating
BB-
/ B1
Revolver ($200 million)
---
Feb 2016
L + 300
---
BB+ / Ba3
Term Debt
$
146.3
Feb 2016
L + 300
0.67x
BB+ / Ba3
Senior Unsecured Notes
$
250.0
Mar 2019
6.75%
1.14x
B+ / B2
Total Debt
$
396.3
1.81x
Net Debt
$
329.1
1.50x
Total Shareholder’s Equity
$
556.4
Total Capitalization @ 6/30/2011
$
885.5
(1)
TTM Adjusted EBITDA is Trailing Twelve Month GAAP EBITDA excluding restructuring and related
charges, non-cash compensation expenses, and loss on the extinguishment of
debt. (2)
Leverage and Interest Coverage Ratios calculated in accordance with credit agreement
definitions, dated as of Feb. 11, 2011. 1.56
3.50
Actual
Covenant
Leverage Ratio
(2)
9.60
3.00
Actual
Covenant
Interest Coverage Ratio
(2) |
 Capitalization Timeline
15
9/30/2009
12/31/2009
3/31/2010
6/30/2010
9/30/2010
12/31/2010
3/31/2011
6/30/2011
US $ in millions
(1)
TTM Adjusted EBITDA is Trailing Twelve Month GAAP EBITDA excluding restructuring
and related charges, non-cash compensation expenses, gain/loss on the
extinguishment of debt and management fees.
Net
Debt/TTM
Adjusted
EBITDA
(1)
Initial Public
Offering:
Dec, 2009
First Secondary
Offering
Reduced Private
Equity Ownership
from 2/3 to 1/3
Debt Refinance:
Feb, 2011
Final Secondary
Offering
Private Equity
Owners’
Sell
Reaming Shares
$204
$349
$377
$388
$454
$452
$499
$556
$463
$316
$376
$347
$306
$290
$368
$329
Shareholders' Equity
Net Debt
5.46
3.46
2.61
1.79
1.57
1.49
1.77
1.50 |
 Scheduled
Maturities 16
US $ in millions
Term Debt Payoff
Sr. Notes Payoff
$3.75
$7.50
$11.25
$15.00
$108.75
$250.00
2011
2012
2013
2014
2015
2019 |
 APPENDIX
October 12, 2011 |
 18
Reconciliation of Net Income to EBITDA
(1)
and Adjusted EBITDA
US $ in Thousands
(1)
The EBITDA measure is used by management to evaluate operating performance. Management
believes that EBITDA is useful to investors because it is frequently used by
investors and other interested parties in the evaluation of companies in our
industry. EBITDA is not a recognized term under GAAP and does not purport
to be an alternative to net income (loss) as an indicator of operating performance or to cash flows from
operating activities as a measure of liquidity. Since not all companies use identical
calculations, this presentation of EBITDA may not be comparable to other similarly titled
measures of other companies. Additionally, EBITDA is not intended to be a measure of
free cash flow for management's discretionary use, as it does not consider certain
cash requirements such as interest payments, tax payments and debt service
requirements. (90)
Twelve Months Ended
Twelve Months Ended
Twelve Months Ended
Twelve Months Ended
12/31/2007
12/31/2008
12/31/2009
12/31/2010
Net Income
$
(43,749)
$
28,419
$
$
96,725
Add(deduct):
Interest expense, net
43,484
36,695
33,956
23,969
Income tax expense
6,120
8,431
(1,367)
15,133
Depreciation and amortization expenses
51,917
53,162
66,751
49,220
EBITDA
57,772
126,707
99,050
185,047
Add:
Management fees and expenses
2,000
2,000
2,000
---
Restructuring and related charges
5,633
13,671
9,677
6,387
Other non-cash expenses
2,905
9,670
4,463
3,472
Gain on extinguishment of debt
---
---
(23,831)
---
Adjusted EBITDA
$
68,310
$
152,048
$
91,359
$
194,906 |
 Reconciliation of Net Income to EBITDA
(1)
and Adjusted EBITDA
19
US $ in Thousands
TTM
6/30/2011
1st Half 2011
1st Half 2010
Net Income
$
107,189
$
68,854
$
58,390
Add(deduct):
Interest expense, net
28,729
17,096
12,336
Income tax expense
12,479
6,691
9,345
Depreciation and amortization expenses
56,435
30,230
23,015
EBITDA
204,832
122,871
103,086
Add:
Restructuring and related charges
7,009
1,412
790
Other non-cash expenses
4,650
2,949
1,771
Loss on extinguishment of debt
2,985
2,985
---
Adjusted EBITDA
$
219,476
$
130,217
$
105,647
(1)
The EBITDA measure is used by management to evaluate operating performance. Management
believes that EBITDA is useful to investors because it is frequently used by
investors and other interested parties in the evaluation of companies in our
industry. EBITDA is not a recognized term under GAAP and does not purport
to be an alternative to net income (loss) as an indicator of operating performance or to cash flows from
operating activities as a measure of liquidity. Since not all companies use identical
calculations, this presentation of EBITDA may not be comparable to other similarly titled
measures of other companies. Additionally, EBITDA is not intended to be a measure of
free cash flow for management's discretionary use, as it does not consider certain
cash requirements such as interest payments, tax payments and debt service
requirements. |
 20
Reconciliation of Net Income to EBITDA
(1)
and Adjusted EBITDA
US $ in Thousands
(1)
The EBITDA measure is used by management to evaluate operating performance. Management
believes that EBITDA is useful to investors because it is frequently used by
investors and other interested parties in the evaluation of companies in our
industry. EBITDA is not a recognized term under GAAP and does not purport
to be an alternative to net income (loss) as an indicator of operating performance or to cash flows from
operating activities as a measure of liquidity. Since not all companies use identical
calculations, this presentation of EBITDA may not be comparable to other similarly
titled measures of other companies. Additionally, EBITDA is not intended to be a
measure of free cash flow for management's discretionary use, as it does not consider
certain cash requirements such as interest payments, tax payments and debt service
requirements. TTM
TTM
TTM
TTM
TTM
TTM
TTM
TTM
09/30/2009
12/31/2009
03/31/2010
06/30/2010
09/30/2010
12/31/2010
03/31/2011
06/30/2011
Net Income
$
(5,769)
$
(290)
$
35,966
$
78,739
$
84,910
$
96,725
$
98,807
$
107,189
Add(deduct):
Interest expense, net
33,776
33,956
31,112
29,559
27,642
23,969
29,086
28,729
Income tax expense
550
(1,367)
2,614
6,818
13,291
15,133
13,433
12,479
Depreciation and amortization expenses
53,865
66,751
65,233
64,660
61,210
49,220
52,800
56,435
EBITDA
82,422
99,050
134,925
179,776
187,053
185,047
194,126
204,832
Add:
Management fees and expenses
2,000
2,000
1,500
1,000
500
--
--
--
Restructuring and related charges
11,722
9,677
9,118
9,360
4,798
6,387
7,757
7,009
Other non-cash expenses
12,554
4,463
2,493
3,678
3,286
3,472
3,434
4,650
(Gain)/Loss on extinguishment of debt
(23,831)
(23,831)
(4,340)
--
--
--
2,985
2,985
Adjusted EBITDA
$
84,867
$
91,359
$
143,696
$
193,814
$
195,638
$
194,906
$
208,301
$
219,475 |
 Reconciliation
of
Net
Income
to
Consolidated
Credit
Agreement
EBITDA
(1)
and
Credit
Agreement
Net
Debt
(2)
(1)
Consolidated Bank EBITDA is GAAP EBITDA with addbacks and exclusions as defined
by the credit agreement, dated Feb. 11, 2011. (2)
For purposes of calculating leverage ratio, total debt is reduced by cash balance in
KPUSLLC at quarter-end. 21
US $ in Thousands
LTM
6/30/2011
Net Income
$
107,189
Add(deduct):
JV Income/(Loss)
(488)
JV Dividend Received
515
Interest expense, net
28,729
Income tax expense
12,479
Depreciation and amortization expenses
56,435
Loss on extinguishment of debt
2,985
Specified Cost Savings
3,596
Non-cash charges
5,922
Cost initiatives in SGA
4,850
Plant turnaround
3,778
Net loss/(gain) on sale of assets
(52)
Stock issuance/permitted acquisitions
2,155
Consolidated
Credit
Agreement
EBITDA
(1)
229,069
Total Debt
396,250
Less: Cash & Equivalents
(67,245)
Net Debt
329,005
Add(deduct):
Foreign Cash & Equivalents
27,906
Credit
Agreement
Net
Debt
(2)
$
356,911 |
 KRATON
PERFORMANCE POLYMERS, INC. DEUTSCHE BANK 19
TH
ANNUAL LEVERAGED FINANCE CONFERENCE
October 12, 2011 |