Attached files
|
|
|
UNITED STATES
SECURITIES AND EXCHANGE COMMISSION
Washington, D.C. 20549
FORM 10-Q
(mark one)
|
x
|
Quarterly Report Pursuant To Section 13 or 15(d) of the Securities Exchange Act of 1934
|
For the quarterly period ended June 30, 2011
|
¨
|
Transition Report Pursuant To Section 13 or 15(d) of the Securities Exchange Act of 1934
|
For the transition period from __________________ to ______________________.
Commission file number 0-16075
PEOPLE’S LIBERATION, INC.
(Exact Name of Registrant as Specified in its Charter)
|
Delaware
(State or other jurisdiction of incorporation or
organization)
|
86-0449546
(I.R.S. Employer Identification No.)
|
1212 S. Flower Street, 5th Floor
Los Angeles, CA 90015
(Address of principal executive offices) (Zip Code)
(213) 745-2123
(Registrant’s telephone number, including area code)
Indicate by check mark whether the registrant (1) has filed all reports required to be filed by Section 13 or 15(d) of the Securities Exchange Act of 1934 during the preceding 12 months (or for such shorter period that the registrant was required to file such reports), and (2) has been subject to such filing requirements for the past 90 days. Yes x No ¨
Indicate by check mark whether the registrant has submitted electronically and posted on its corporate Web site, if any, every Interactive Data File required to be submitted and posted pursuant to Rule 405 of Regulation S-T (§232.405 of this chapter) during the preceding 12 months (or for such shorter period that the registrant was required to submit and post such files). Yes x No ¨
Indicate by check mark whether the registrant is a large accelerated filer, an accelerated filer, a non-accelerated filer, or a smaller reporting company. See the definitions of “large accelerated filer,” “accelerated filer” and “smaller reporting company” in Rule 12b-2 of the Exchange Act.
|
Large accelerated filer ¨
|
Accelerated filer ¨
|
|
|
Non-accelerated filer ¨ (Do not check if smaller reporting
company)
|
|
Smaller reporting company x
|
Indicate by check mark whether the registrant is a shell company (as defined in Rule 12b-2 of the Exchange Act). Yes ¨ No x
As of August 12, 2011, the issuer had 36,002,563 shares of common stock, par value $.001 per share, issued and outstanding.
|
|
|
PEOPLE’S LIBERATION, INC.
INDEX TO FORM 10-Q
|
Page
|
|||
|
PART I
|
FINANCIAL INFORMATION
|
3
|
|
|
Item 1.
|
Financial Statements
|
3
|
|
|
Condensed Consolidated Balance Sheets as of June 30, 2011 (unaudited) and December 31, 2010
|
3
|
||
|
Condensed Consolidated Statements of Operations (unaudited) for the three and six months ended June 30, 2011 and June 30, 2010
|
4
|
||
|
Condensed Consolidated Statements of Cash Flows (unaudited) for the three and six months ended June 30, 2011 and June 30, 2010
|
5
|
||
|
Notes to Condensed Consolidated Financial Statements (unaudited)
|
6
|
||
|
Item 2.
|
Management’s Discussion and Analysis of Financial Condition and Results of Operations
|
21
|
|
|
Item 3.
|
Quantitative and Qualitative Disclosures About Market Risk
|
41
|
|
|
Item 4.
|
Controls and Procedures
|
41
|
|
|
PART II
|
OTHER INFORMATION
|
41
|
|
|
Item 1A.
|
Risk Factors
|
41
|
|
|
Item 6.
|
Exhibits
|
42
|
2
PART I
FINANCIAL INFORMATION
|
Item 1.
|
Financial Statements
|
PEOPLE’S LIBERATION, INC.
CONDENSED CONSOLIDATED BALANCE SHEETS
|
June 30,
2011
|
December 31,
2010
|
|||||||
|
|
(Unaudited)
|
|||||||
|
Assets
|
||||||||
|
Current Assets:
|
||||||||
|
Cash and cash equivalents
|
$ | 661,415 | $ | 1,184,743 | ||||
|
Restricted cash
|
35,196 | 156,248 | ||||||
|
Due from factors
|
- | 278,940 | ||||||
|
Accounts receivable, net of allowance for doubtful accounts
|
3,378 | 67,727 | ||||||
|
Inventories
|
1,573,769 | 1,612,217 | ||||||
|
Prepaid expenses and other current assets
|
178,287 | 25,281 | ||||||
|
Deferred income tax assets, current
|
- | 384,000 | ||||||
|
Current assets of discontinued operations
|
- | 1,824,959 | ||||||
|
Total current assets
|
2,452,045 | 5,534,115 | ||||||
|
Property and equipment, net of accumulated depreciation and amortization
|
1,081,900 | 1,178,056 | ||||||
|
Trademarks, net of accumulated amortization
|
624,539 | 629,799 | ||||||
|
Intangible asset
|
428,572 | 428,572 | ||||||
|
Other assets
|
96,718 | 69,966 | ||||||
|
Net deferred income tax asset, long-term
|
- | 524,000 | ||||||
|
Long-term assets of discontinued operations
|
- | 1,075,128 | ||||||
|
Total assets
|
$ | 4,683,774 | $ | 9,439,636 | ||||
|
Liabilities and Stockholders’ Equity
|
||||||||
|
Current Liabilities:
|
||||||||
|
Accounts payable and accrued expenses
|
$ | 3,851,117 | $ | 4,671,929 | ||||
|
Due to factors
|
252,291 | - | ||||||
|
Note payable to related parties
|
750,000 | - | ||||||
|
Income taxes payable
|
54,932 | 21,317 | ||||||
|
Current liabilities of discontinued operations
|
- | 895,732 | ||||||
|
Total current liabilities
|
4,908,340 | 5,588,978 | ||||||
|
Long-Term Liabilities:
|
||||||||
|
Deferred lease obligations
|
402,570 | 382,814 | ||||||
|
Note payable to related parties
|
- | 750,000 | ||||||
|
Long-term liabilities of discontinued operations
|
- | 525,673 | ||||||
|
Total long-term liabilities
|
402,570 | 1,658,487 | ||||||
|
Total liabilities
|
5,310,910 | 7,247,465 | ||||||
|
Stockholders’ equity:
|
||||||||
|
Common stock, $0.001 par value, 150,000,000 shares authorized; 36,002,563 shares issued and outstanding at June 30, 2011 and December 31, 2010
|
36,002 | 36,002 | ||||||
|
Additional paid-in capital
|
8,334,873 | 8,170,313 | ||||||
|
Accumulated deficit
|
(3,766,377 | ) | (5,453,514 | ) | ||||
|
Total stockholders’ equity
|
4,604,498 | 2,752,801 | ||||||
|
Noncontrolling interest
|
(5,231,634 | ) | (2,467,241 | ) | ||||
|
Noncontrolling interest in discontinued operations
|
- | 1,906,611 | ||||||
|
Total (deficit) equity
|
(627,136 | ) | 2,192,171 | |||||
|
Total liabilities and stockholders’ equity
|
$ | 4,683,774 | $ | 9,439,636 | ||||
See Notes to Condensed Consolidated Financial Statements.
3
PEOPLE’S LIBERATION, INC.
CONDENSED CONSOLIDATED STATEMENTS OF OPERATIONS
(unaudited)
|
Three Months Ended June 30,
|
Six Months Ended June 30,
|
|||||||||||||||
|
2011
|
2010
|
2011
|
2010
|
|||||||||||||
|
Net revenue
|
$ | 2,077,077 | $ | 4,883,510 | $ | 4,391,517 | $ | 10,920,025 | ||||||||
|
Cost of goods sold
|
1,644,173 | 2,466,295 | 3,457,241 | 5,219,287 | ||||||||||||
|
Gross profit
|
432,904 | 2,417,215 | 934,276 | 5,700,738 | ||||||||||||
|
Selling, design and production expenses
|
1,383,504 | 1,309,623 | 2,843,781 | 3,770,039 | ||||||||||||
|
General and administrative expenses
|
1,736,151 | 1,469,297 | 3,586,785 | 3,123,060 | ||||||||||||
|
Total operating expenses
|
3,119,655 | 2,778,920 | 6,430,566 | 6,893,099 | ||||||||||||
|
Loss from operations
|
(2,686,751 | ) | (361,705 | ) | (5,496,290 | ) | (1,192,361 | ) | ||||||||
|
Interest expense, net
|
(29,163 | ) | (54,457 | ) | (69,938 | ) | (94,779 | ) | ||||||||
|
Litigation settlement, net
|
- | - | 3,513,538 | - | ||||||||||||
|
Total other (expense) income
|
(29,163 | ) | (54,457 | ) | 3,443,600 | (94,779 | ) | |||||||||
|
Loss before income taxes
|
(2,715,914 | ) | (416,162 | ) | (2,052,690 | ) | (1,287,140 | ) | ||||||||
|
Provision for income taxes
|
911,500 | 7,390 | 974,000 | 19,890 | ||||||||||||
|
Loss from continuing operations
|
(3,627,414 | ) | (423,552 | ) | (3,026,690 | ) | (1,307,030 | )) | ||||||||
|
Discontinued Operations:
|
||||||||||||||||
|
Income (loss) from discontinued operations
|
136,792 | (114,096 | ) | (125,771 | ) | (210,548 | ) | |||||||||
|
Gain on sale of member interest in subsidiary
|
2,012,323 | - | 2,012,323 | - | ||||||||||||
|
Income (loss) from discontinued operations
|
2,149,115 | (114,096 | ) | 1,886,552 | (210,548 | ) | ||||||||||
|
Net loss
|
(1,478,299 | ) | (537,648 | ) | (1,140,138 | ) | (1,517,578 | ) | ||||||||
|
Noncontrolling interest in continued operations
|
1,323,008 | 289,448 | 2,764,390 | 677,747 | ||||||||||||
|
Noncontrolling interest in discontinued operations
|
(68,396 | ) | 57,048 | 62,885 | 105,275 | |||||||||||
| 1,254,612 | 346,496 | 2,827,275 | 783,022 | |||||||||||||
|
Net (loss) income attributable to common stockholders
|
$ | (223,687 | ) | $ | (191,152 | ) | $ | 1,687,137 | $ | (734,556 | ) | |||||
|
Basic and diluted (loss) income per share:
|
||||||||||||||||
|
Basic and diluted loss from continuing operations
|
$ | (0.07 | ) | $ | (0.01 | ) | $ | (0.01 | ) | $ | (0.02 | ) | ||||
|
Basic and diluted income (loss) from discontinued operations
|
$ | 0.06 | $ | (0.00 | ) | $ | 0.06 | $ | (0.00 | ) | ||||||
|
Basic and diluted (loss) income attributable to common shareholders
|
$ | (0.01 | ) | $ | (0.01 | ) | $ | 0.05 | $ | (0.02 | ) | |||||
|
Basic and diluted weighted average common shares outstanding
|
36,002,563 | 36,002,563 | 36,002,563 | 36,002,563 | ||||||||||||
See Notes to Condensed Consolidated Financial Statements.
4
PEOPLE’S LIBERATION, INC.
CONDENSED CONSOLIDATED STATEMENTS OF CASH FLOWS
(unaudited)
|
Six Months Ended
June 30,
|
||||||||
|
2011
|
2010
|
|||||||
|
Cash flows from operating activities:
|
||||||||
|
Net loss
|
$ | (1,140,138 | ) | $ | (1,517,578 | ) | ||
|
Adjustments to reconcile net loss to net cash used in operating activities:
|
||||||||
|
Loss from discontinued operations
|
125,771 | 210,548 | ||||||
|
Gain on sale of discontinued operations
|
(2,012,323 | ) | - | |||||
|
Depreciation and amortization
|
225,652 | 192,975 | ||||||
|
Allowance for doubtful accounts
|
(20,000 | ) | (70,000 | ) | ||||
|
Stock based compensation
|
75,560 | 55,296 | ||||||
|
Warrant issued in sale of receivable
|
89,000 | - | ||||||
|
Loss on disposal of fixed assets
|
1,374 | - | ||||||
|
Deferred income taxes
|
908,000 | - | ||||||
|
Changes in operating assets and liabilities:
|
||||||||
|
Receivables
|
615,580 | (235,792 | ) | |||||
|
Inventories
|
38,448 | (850,908 | ) | |||||
|
Prepaid expenses and other current assets
|
(153,006 | ) | (25,593 | ) | ||||
|
Other assets
|
(26,752 | ) | - | |||||
|
Accounts payable and accrued expenses
|
(793,730 | ) | 1,459,044 | |||||
|
Deferred lease obligations
|
19,756 | - | ||||||
|
Income taxes payable
|
33,615 | 13,340 | ||||||
|
Net cash flows used in operating activities from continuing operations
|
(2,013,193 | ) | (768,668 | ) | ||||
|
Net cash flows (used in) provided by operating activities from discontinued operations
|
(119,282 | ) | 387,320 | |||||
|
Net cash flows used in operating activities
|
(2,132,475 | ) | (381,348 | ) | ||||
|
Cash flows from investing activities:
|
||||||||
|
Proceeds from sale of receivable
|
722,916 | - | ||||||
|
Decrease in restricted cash
|
121,052 | 910 | ||||||
|
Acquisition of trademarks
|
(20,014 | ) | (43,941 | ) | ||||
|
Acquisition of property and equipment
|
(105,594 | ) | (120,266 | ) | ||||
|
Net cash flows provided by (used in) investing activities from continuing operations
|
718,360 | (163,297 | ) | |||||
|
Cash proceeds received in sale of discontinued operations
|
900,000 | - | ||||||
|
Net cash flows used in investing activities from discontinued operations
|
(9,213 | ) | (314,056 | ) | ||||
|
Net cash flows provided by (used in) investing activities
|
1,609,147 | (477,353 | ) | |||||
|
Net decrease in cash and cash equivalents
|
(523,328 | ) | (858,701 | ) | ||||
|
Cash and cash equivalents, beginning of period
|
1,184,743 | 1,207,644 | ||||||
|
Cash and cash equivalents, end of period
|
$ | 661,415 | $ | 348,943 | ||||
|
Supplemental disclosures of cash flow information:
|
||||||||
|
Cash paid during the period for:
|
||||||||
|
Interest
|
$ | 75,498 | $ | 90,442 | ||||
|
Income taxes paid
|
59,065 | 8,150 | ||||||
|
Non-cash investing and financing activities:
|
||||||||
|
Accumulated noncontrolling interest upon sale of discontinued operations
|
(1,843,727 | ) | - | |||||
|
Receivable received in sale of member interest in subsidiary
|
750,000 | - | ||||||
See Notes to Condensed Consolidated Financial Statements.
5
|
1.
|
Presentation of Interim Information
|
The accompanying unaudited consolidated financial statements have been prepared in accordance with accounting principles generally accepted in the United States for interim financial information and in accordance with the instructions to Form 10-Q and Regulation S-X. Accordingly, they do not include all of the information and footnotes required by accounting principles generally accepted in the United States for complete financial statements. The accompanying unaudited consolidated financial statements reflect all normal recurring adjustments that, in the opinion of the management of People’s Liberation, Inc. (the “Company”) and subsidiaries are considered necessary for a fair presentation of the financial position, results of operations, and cash flows for the periods presented. The results of operations for such periods are not necessarily indicative of the results expected for the full fiscal year or for any future period. The accompanying financial statements should be read in conjunction with the audited consolidated financial statements of the Company included in the Company’s Form 10-K for the year ended December 31, 2010.
The preparation of consolidated financial statements in conformity with accounting principles generally accepted in the United States of America, requires management to make estimates and assumptions that affect the reported amounts of assets and liabilities and disclosure of contingent assets and liabilities at the date of the consolidated financial statements and the reported amounts of revenues and expenses during the reporting period. Actual results could differ from these estimates. The significant assets and liabilities that require management to make estimates and assumptions that affect the reported amounts in the consolidated financial statements included inventories, accounts receivable and due to factor, intangible assets, deferred taxes, accrued expenses, income taxes, stock based compensation and noncontrolling interest. Management is also required to make significant estimates and assumptions related to its disclosure of litigation and the recording of related contingent assets or liabilities, if any.
|
2.
|
Organization and Nature of Operations
|
Organization
The Company’s wholly-owned subsidiary Versatile Entertainment, Inc. conducts its People’s Liberation brand business. The Company’s William Rast brand business is conducted through its wholly-owned subsidiary Bella Rose, LLC. William Rast Sourcing, LLC and William Rast Licensing, LLC are consolidated under Bella Rose and are each owned 50% by Bella Rose and 50% by Tennman WR-T, Inc., an entity owned in part by Justin Timberlake. William Rast Retail, LLC, a California limited liability company, was formed on August 26, 2009 and is a wholly-owned subsidiary of William Rast Sourcing. William Rast Retail was formed to operate the Company’s William Rast retail stores.
Prior to its sale on April 26, 2011, the Company’s J. Lindeberg brand business was conducted through Bella Rose. Beginning July 1, 2008 through April 26, 2011, J. Lindeberg USA, LLC was consolidated under Bella Rose and was owned 50% by Bella Rose and 50% by J. Lindeberg USA Corp. an entity owned by J. Lindeberg AB, a Swedish corporation. J. Lindeberg USA Retail, LLC, a California limited liability company, was formed on August 21, 2009 and is a wholly-owned subsidiary of J. Lindeberg USA. J. Lindeberg Retail was formed to operate the Company’s J. Lindeberg retail stores.
6
Nature of Operations
The Company markets and sells high-end casual apparel under the brand names “People’s Liberation,” “William Rast” and, in the United States through April 26, 2011, “J. Lindeberg.” The majority of the merchandise the Company offers consists of premium denim, knits, wovens, leather goods, golf wear and outerwear for men and women. In the United States, William Rast Sourcing distributes and J. Lindeberg USA distributed, through April 26, 2011, their merchandise to boutiques, specialty stores and better department stores, such as Nordstrom, Saks Fifth Avenue and Neiman Marcus, as well as online at various websites including williamrast.com, jlindebergusa.com and Zappos.com. Beginning July 2008 through April 26, 2011, the Company also marketed and sold its J. Lindeberg branded collection and golf apparel through its retail stores in New York City, Los Angeles and Miami, and sold J. Lindeberg golf wear to green grass golf stores and boutiques in the United States. William Rast products are also sold in its four retail stores located in Los Angeles, San Jose and Cabazon, California, and Miami, Florida. Internationally, in select countries, William Rast Sourcing sells its products directly and through distributors to better department stores and boutiques.
The Company commenced its William Rast clothing line in May 2005. The Company’s William Rast clothing line is a collaboration with Justin Timberlake.
The Company began distributing J. Lindeberg branded apparel products in the United States on an exclusive basis beginning July 2008 in collaboration with J. Lindeberg USA Corp., a New York corporation and an entity owned by J. Lindeberg AB, a Swedish corporation (collectively, “Lindeberg Sweden”). In addition to being sold in the United States through J. Lindeberg USA, J. Lindeberg branded high-end men’s fashion and premium golf apparel is marketed and sold by Lindeberg Sweden worldwide. On April 26, 2011, the Company completed the sale of Bella Rose’s 50% member interest in J. Lindeberg USA to J. Lindeberg USA Corp. pursuant to the terms of a Unit Purchase Agreement entered into by the parties on April 7, 2011. See further discussion in Note 9 to the Company’s consolidated financial statements.
The Company commenced its People’s Liberation business in July 2004. On December 16, 2008, the Company entered into an agreement with Charlotte Russe Holding, Inc. and its wholly-owned subsidiary, Charlotte Russe Merchandising, Inc. (collectively, “Charlotte Russe”), pursuant to which the Company’s wholly-owned subsidiary, Versatile, agreed to exclusively sell to Charlotte Russe, in North America and Central America, People’s Liberation® branded apparel, apparel accessories, eyewear, jewelry, watches, cosmetics and fragrances, and to provide Charlotte Russe with marketing and branding support for People’s Liberation branded apparel and apparel accessories. The Company ceased to sell People’s Liberation branded merchandise in North America and Central America to parties other than Charlotte Russe effective April 30, 2009. Product sales to Charlotte Russe under the terms of this agreement began shipping in June 2009. Commencing in October 2009, the Company was in litigation with Charlotte Russe in relation to the agreement, which litigation was settled by the parties in February 2011. See the further discussion under Note 8 to the condensed consolidated financial statements. The Company is currently exploring options for the marketing and distribution of People’s Liberation branded apparel and apparel accessories both in North America and internationally.
The Company is headquartered in Los Angeles, California, and maintains showrooms in New York and Los Angeles.
Discontinued Operation
The Company accounted for the sale of its 50% member interest in J. Lindeberg, USA as a discontinued operation in accordance with the guidance provided in FASB ASC 360, Accounting for Impairment or Disposal of Long-Lived Assets, which requires that a component of an entity that has been disposed of or is classified as held for sale and has operations and cash flows that can be clearly distinguished from the rest of the entity be reported as assets held for sale and discontinued operations. In the period a component of an entity has been disposed of or classified as held for sale, the results of operations for the periods presented are reclassified into separate line items in the statements of operations. Assets and liabilities are also reclassified into separate line items on the related balance sheets for the periods presented. The statements of cash flows for the periods presented are also reclassified to reflect the results of discontinued operations as separate line items.
7
Liquidity
For the six months ended June 30, 2011, the Company recorded a loss from continuing operations of approximately $3.0 million and utilized cash in continuing operations of $2.0 million. As of June 30, 2011, the Company had a working capital deficit of approximately $2.5 million and a total stockholder’s deficiency of approximately $627,000. The Company intends to raise funds to finance operations, through strategic transactions with its partners or from traditional financing sources, until the Company is able to achieve positive cash flows from operations. The Company’s capital requirements for the next twelve months, as they relate to the production of its products, will continue to be significant. If adequate funds are not available to satisfy the Company’s capital requirements, the Company’s business operations and liquidity could be materially adversely affected and this could ultimately cause the Company to significantly cut back its operations.
|
3.
|
Recently Issued Accounting Standards
|
In May 2011, the Financial Accounting Standards Board (FASB) issued Accounting Standards Update (ASU) No. 2011-4, which amends the Fair Value Measurements Topic of the Accounting Standards Codification (ASC) to help achieve common fair value measurement and disclosure requirements in U.S. GAAP and IFRS. ASU No. 2011-4 does not require additional fair value measurements and is not intended to establish valuation standards or affect valuation practices outside of financial reporting. The ASU is effective for interim and annual periods beginning after December 15, 2011. The Company will adopt the ASU as required. The ASU will affect the Company’s fair value disclosures, but will not affect the Company’s results of operations, financial condition or liquidity.
In June 2011, the FASB issued ASU No. 2011-5, which amends the Comprehensive Income Topic of the ASC. The ASU eliminates the option to present the components of other comprehensive income as part of the statement of changes in shareholders’ equity, and instead requires consecutive presentation of the statement of net income and other comprehensive income either in a continuous statement of comprehensive income or in two separate but consecutive statements. ASU No. 2011-5 is effective for interim and annual periods beginning after December 15, 2011. The Company will adopt the ASU as required. It will have no affect on the Company’s results of operations, financial condition or liquidity.
Other recent accounting pronouncements issued by the FASB (including its Emerging Issues Task Force), the AICPA, and the Securities Exchange Commission (the "SEC") did not or are not believed by management to have a material impact on the Company's present or future consolidated financial statements.
|
4.
|
Noncontrolling Interest
|
In accordance with the provisions of Statement of Financial Accounting Standard No. 160, Noncontrolling interest in Consolidated Financial Statements – an amendment of ARB No. 51, superseded by ASC 810-10-65 adopted by the Company on January 1, 2009, the Company allocates profits and losses to each of the members of William Rast Sourcing and William Rast Licensing in accordance with the amended and restated limited liability company operating agreements for such entities, which became effective as of January 1, 2007 (the “Operating Agreements”). The Operating Agreements provide that losses are allocated to the members of William Rast Sourcing and William Rast Licensing based on their respective percentage interests in such entities and profits are allocated to the members based on their percentage interest to the extent that the member was previously allocated losses. To the extent each member has positive equity in William Rast Sourcing and William Rast Licensing, profits will be allocated consistent with the cash distribution terms as follows:
8
|
|
·
|
first to each member in accordance with each member’s respective percentage interest to enable the members to make timely tax payments which shall be treated as advances of, and be offset against, the distributions described below;
|
|
|
·
|
second to Tennman WR-T, Inc., an entity owned in part by Justin Timberlake (“Tennman”), in an amount equal to 6% of applicable sales for each calendar quarter with respect to William Rast Sourcing and 3% of applicable sales for each calendar quarter with respect to William Rast Licensing, which are referred to hereafter as contingent priority cash distributions;
|
|
|
·
|
third to Bella Rose until the aggregate amount distributed to Bella Rose equals the contingent priority cash distributions made to Tennman; and
|
|
|
·
|
thereafter, in accordance with the members’ respective percentage interests.
|
William Rast Sourcing, and its wholly-owned subsidiaries William Rast Retail and William Rast Europe B.V., and William Rast Licensing have accumulated losses totaling approximately $14.0 million from inception (October 1, 2006) through June 30, 2011. Beginning January 1, 2009 through June 30, 2011, approximately $5.2 million of these losses has been allocated to Tennman, the noncontrolling interest member of William Rast Sourcing and William Rast Licensing. Unpaid accumulated contingent priority cash distributions to Tennman amounted to approximately $3.8 million and $3.0 million as of June 30, 2011 and 2010, respectively. If and when the contingent priority cash distributions are paid to Tennman, such distributions will be accounted for as decreases in noncontrolling interest in the consolidated balance sheet of the Company. Profit and loss allocations made to Tennman are recorded as increases or decreases in noncontrolling interest in the consolidated statements of operations of the Company. From inception (October 1, 2006) through December 31, 2008, losses were not allocated to noncontrolling interest in accordance with Accounting Research Bulletin 51 because the noncontrolling interest member did not have basis in the capital of William Rast Sourcing and William Rast Licensing, prior to January 1, 2009. Instead, all losses were recognized by Bella Rose in consolidation.
Beginning July 1, 2008 through April 26, 2011, the operations of J. Lindeberg USA are included in the consolidated financial statements of the Company. Profit and loss allocations to Lindeberg Sweden were recorded as increases and decreases in noncontrolling interest in the consolidated financial statements of the Company. On April 26, 2011, the Company and its wholly owned subsidiary, Bella Rose, LLC, completed the sale of Bella Rose’s 50% membership interest in J. Lindeberg USA, LLC to J. Lindeberg USA Corp., as further described in Note 9 to the condensed consolidated financial statements.
|
5.
|
Earnings Per Share
|
Basic income (loss) per share is computed by dividing income (loss) available to common shareholders by the weighted average number of common shares outstanding during the period. The diluted income (loss) per share calculation gives effect to all potentially dilutive common shares outstanding during the period using the treasury stock method for warrants and options.
Warrants representing 4,190,000 shares of common stock at exercise prices ranging from $0.20 to $0.50 per share and stock options representing 7,880,000 shares of common stock at exercise prices ranging from $0.15 to $1.25 per share were outstanding as of June 30, 2011, but were excluded from the average number of common shares outstanding in the calculation of diluted earnings per share for the six months ended June 30, 2011 because the average trading price of the Company’s common shares during the period was lower than the exercise price of any of outstanding equity instruments, and therefore were antidilutive. The outstanding shares underling stock options and warrants outstanding as of June 30, 2011 were excluded from the average number of common shares outstanding in the calculation of diluted earnings per share for the three months ended June 30, 2011 because the effect of including these shares would have been antidilutive
9
Warrants representing 3,565,000 shares of common stock at exercise prices ranging from $0.40 to $2.00 per share and stock options representing 2,822,000 shares of common stock at exercise prices ranging from $0.20 to $1.25 per share were outstanding as of June 30, 2010, but were excluded from the average number of common shares outstanding in the calculation of diluted earnings per share for the three and six months ended June 30, 2010 because the effect of including these shares would have been antidilutive.
|
6.
|
Due (to) from Factor
|
Due (to) from factor from continuing operations is summarized as follows:
|
June 30,
|
December 31,
|
|||||||
|
2011
|
2010
|
|||||||
|
Outstanding receivables:
|
||||||||
|
Without recourse
|
$ | 144,427 | $ | 1,798,175 | ||||
|
With recourse
|
167,952 | 160,582 | ||||||
| 312,379 | 1,958,757 | |||||||
|
Advances
|
(480,924 | ) | (1,634,017 | ) | ||||
|
Open credits
|
(83,746 | ) | (45,800 | ) | ||||
| $ | (252,291 | ) | $ | 278,940 | ||||
As a result of the sale of the Company’s 50% member interest in J. Lindeberg USA on April 26, 2011, the Company terminated its factoring facility with FTC and the guarantees of its related entities were released, as further described in Note 9.
|
7.
|
Inventories
|
Inventories from continuing operations are summarized as follows:
|
June 30,
2011
|
December 31,
2010
|
|||||||
|
Piece goods and trim
|
$ | 137,780 | $ | 69,407 | ||||
|
Work in process
|
3,495 | 11,094 | ||||||
|
Finished goods
|
1,714,143 | 1,866,716 | ||||||
| 1,855,418 | 1,947,217 | |||||||
|
Less reserve for obsolescence and slow moving inventory
|
(281,649 | ) | (335,000 | ) | ||||
| $ | 1,573,769 | $ | 1,612,217 | |||||
|
8.
|
Charlotte Russe Litigation
|
Beginning October of 2009, the Company had been in litigation with Charlotte Russe and its affiliates in relation to the exclusive distribution agreement between the parties. On February 3, 2011, People's Liberation, Versatile Entertainment, Colin Dyne, ECA Holdings II, LLC and New Media Retail Concepts entered into a Settlement Agreement and Mutual Release with Charlotte Russe Holding, Inc. and Charlotte Russe Merchandising, Inc., Advent International Corporation, Advent CR Holdings, Inc., David Mussafer, and Jenny Ming. The agreement was entered into to settle all disputes among the parties relating to:
10
|
|
·
|
that certain action in the Los Angeles County Superior Court entitled Charlotte Russe Holding, Inc. et al. v. Versatile Entertainment, Inc. et al., Case No. BC 424734; and
|
|
|
·
|
that certain action entitled Versatile Entertainment, Inc. et al. v. David Mussafer, et al., originally brought in the Los Angeles County Superior Court, Case No. BC 424675.
|
Pursuant to the settlement agreement, on February 3, 2011 the Company received approximately $3.5 million, after the distribution of amounts owed under the terms of an asset purchase agreement (described below), and the payment of legal fees and expenses. The settlement included the dismissal with prejudice of all claims pending between the parties as well as mutual releases, without any admission of liability or wrongdoing by any of the parties to the actions.
The Company also received proceeds of $750,000 in the third quarter of 2010 relating to the Charlotte Russe litigation, for total proceeds relating to the litigation of $4.3 million. The $750,000 was received in connection with an asset purchase agreement entered into by the Company with two related parties pursuant to which the Company sold 50% of the net proceeds, after contingent legal fees and expenses, that may be received by the Company as a result of the litigation.
|
9.
|
Discontinued Operation - J. Lindeberg USA
|
On April 26, 2011, the Company and its wholly owned subsidiary, Bella Rose, LLC, completed the sale of Bella Rose’s 50% membership interest in J. Lindeberg USA, LLC (“Lindeberg USA”) to J. Lindeberg USA Corp. (“Buyer”) pursuant to the terms of a Unit Purchase Agreement entered into by the parties on April 7, 2011. Prior to the closing of the transaction and since July 1, 2008, Lindeberg USA was owned 50% by Bella Rose and 50% by Buyer.
In consideration for Bella Rose’s 50% membership interest in Lindeberg USA, Buyer agreed to pay to the Company an aggregate of $1,650,000, of which $900,000 was paid upon the closing of the transaction and $750,000 was received in the form of a receivable that is non-interest bearing and payable on the six month anniversary of the closing of the transaction.
As of the closing, Bella Rose’s interest in that certain factoring agreement, dated August 6, 2008, by and between Lindeberg USA and FTC Commercial Corp., as amended from time to time, and related agreements (collectively, the “Factoring Agreement”) pursuant to which FTC provided certain factoring services to Lindeberg USA, was assigned to Buyer. Also as of the closing, the guarantees of the Company, Bella Rose, and Versatile Entertainment, Inc. (a wholly-owned subsidiary of People’s Liberation) in favor of FTC which guaranteed the obligations of Lindeberg USA to FTC under the Factoring Agreement were terminated, along with the termination of a personal validity guarantee of Colin Dyne, the Company’s Chief Executive Officer and the manager of J. Lindeberg USA, in favor of FTC.
In connection with the sale of Bella Rose’s membership interest in Lindeberg USA to Buyer, certain customer lists, other intangibles, and lease agreements and lease deposits of J. Lindeberg USA were transferred to J. Lindeberg USA Corp. on the closing date.
The divestiture of the Company’s membership interest in Lindeberg USA has been accounted for as a discontinued operation and, accordingly, all prior periods presented in the accompanying consolidated balance sheets, statements of operations and cash flows have been adjusted to conform to this presentation.
11
The Company recorded a gain in the second quarter of 2011 related to this divestiture as follows:
|
Carrying value of net assets of J. Lindeberg USA
|
$ | (1,501,404 | ) | |
|
Noncontrolling interest on date of divestiture
|
1,863,727 | |||
|
Carrying value of net assets attributable to J. Lindeberg USA
|
362,323 | |||
|
Cash proceeds received at closing
|
900,000 | |||
|
Receivable from Buyer
|
750,000 | |||
|
Gain on sale of member interest in subsidiary
|
$ | 2,012,323 |
The following table summarizes certain selected components of the discontinued operations of J. Lindeberg USA for the three and six months ended June 30, 2011 through the effective date of the divestiture on April 26, 2011, and the three and six months ended June 30, 2010:
|
Three Months Ended
June 30,
|
Six Months Ended
June 30
|
|||||||||||||||
|
2011
|
2010
|
2011
|
2010
|
|||||||||||||
|
Net Revenue
|
$ | 733,150 | $ | 1,965,825 | $ | 3,374,624 | $ | 4,291,333 | ||||||||
|
Income (loss)
|
$ | 136,792 | $ | (114,096 | ) | $ | (125,771 | ) | $ | (210,548 | ) | |||||
|
Noncontrolling interest
|
$ | (68,396 | ) | $ | 57,048 | $ | 62,885 | $ | 105,275 | |||||||
|
Net income (loss) attributable to common shareholders
|
$ | 68,396 | $ | (57,048 | ) | $ | (62,886 | ) | $ | (105,273 | ) | |||||
|
Basis and diluted income (loss) per share from discontinued operations
|
$ | 0.06 | $ | (0.00 | ) | $ | 0.06 | $ | (0.00 | ) | ||||||
The following table summarizes certain selected components of the discontinued operations of J. Lindeberg USA as of June 30, 2011 and December 31, 2010, the periods covered by this report:
|
June 30,
2011
|
December 31,
2010
|
|||||||
|
Current assets
|
$ | - | $ | 1,824,959 | ||||
|
Long-term assets
|
$ | - | $ | 1,075,128 | ||||
|
Current liabilities
|
$ | - | $ | 895,732 | ||||
|
Long-term liabilities
|
$ | - | $ | 525,673 | ||||
On June 24, 2011, the Company and its wholly-owned subsidiary, Bella Rose, LLC, entered into an asset purchase agreement with Monto Holding (Pty) Limited (“Monto”). Pursuant to the agreement, the Company sold to Monto without recourse the $750,000 receivable owed to the Company under the terms of the Unit Purchase Agreement discussed above.
On June 24, 2011, the Company also issued a fully vested, five year warrant to Monto to purchase 3,750,000 shares of its Common Stock at an exercise price of $0.20 per share. In exchange for the rights to the receivable and the warrant, Monto paid to the Company a purchase price of $722,916. The Warrant was valued at $89,000 using the Black-Scholes option pricing model.
12
|
10.
|
Stock Based Compensation
|
On January 5, 2006, the Company adopted its 2005 Stock Incentive Plan (the “Plan”), which authorized the granting of a variety of stock-based incentive awards. The Plan is administered by the Board of Directors, or a committee appointed by the Board of Directors, which determines the recipients and terms of the awards granted. The Plan reserves a total of 5,500,000 shares of common stock for issuance.
The Company recognizes stock-based compensation costs on a straight-line basis over the vesting period of each award, which is generally between one to four years.
During the three and six months ended June 30, 2011, the Company granted 500,000 and 1,530,000 options to employees and officers within the Plan at an exercise price of $0.15 and 5,000,000 options to two employees and an officer outside the Plan, also at an exercise price of $0.15. There were no options or warrants exercised during the three and six months ended June 30, 2011. During the three and six months ended June 30, 2010, the Company did not grant any options and no options or warrants were exercised. Plan options to purchase 2,487,698 and 2,545,938 shares were exercisable as of June 30, 2011 and 2010, respectively. Options granted outside the Plan to purchase 3,000,000 shares were exercisable as of June 30, 2011. There were no options granted outside the Plan outstanding as of June 30, 2010. Total stock based compensation expense for the three and six months ended June 30, 2011 was approximately $1,000 and $20,000, respectively. Total stock based compensation expense for the three and six months ended June 30, 2010 was approximately $76,000 and $55,000, respectively.
The fair value of options is estimated on the date of grant using the Black-Scholes option pricing model. The valuation determined by the Black-Scholes pricing model is affected by the Company’s stock price as well as assumptions regarding a number of highly complex and subjective variables. These variables include, but are not limited to, expected stock price volatility over the term of the awards, and actual and projected employee stock option exercise behaviors. Stock price volatility is estimated based on a peer group of public companies and expected term is estimated using the “safe harbor” provisions provided in accordance with generally accepted accounting principles. The safe harbor provisions were extended beyond December 31, 2007 for companies that did not have sufficient historical data to calculate the expected term of their related options. The Company does not have sufficient historical data to calculate expected term and the safe harbor provisions were used to calculate expected term for options granted during the periods. The weighted-average assumptions the Company used as inputs to the Black-Scholes pricing model for options granted in the Plan during the six months ended June 30, 2011 included a dividend yield of zero, a risk-free interest rate of 2.2%, expected term of 6.1 years and an expected volatility of 64%.
For stock-based awards issued to employees, directors and officers, stock-based compensation is attributed to expense using the straight-line single option method. Stock-based compensation expense recognized in the statements of operations for the three and six months ended June 30, 2011 and 2010 is included in selling, design and production expense and general and administrative expense, and is based on awards ultimately expected to vest. ASC Topic 718 requires forfeitures to be estimated at the time of grant and revised, if necessary, in subsequent periods if actual forfeitures differ from those estimates. For the three and six months ended June 30, 2011, the Company used historical data to calculate the expected forfeiture rate.
Options awarded to non-employees are charged to expense when the services are performed and benefit is received as provided by FASB ASC Topic 505-50.
13
For the six months ended June 30, 2011 and 2010, total stock-based compensation expense included in the consolidated statements of operations was charged to the following expense categories:
|
Six months
ended
June 30, 2011
|
Six months
ended
June 30, 2010
|
|||||||
|
Selling, design and production
|
$ | 1,948 | $ | 9,303 | ||||
|
General and administrative
|
73,612 | 45,993 | ||||||
|
Total stock-based compensation
|
$ | 75,560 | $ | 55,296 | ||||
The following table summarizes the activity in the Plan:
|
Number of
Shares
|
Weighted
Average
Exercise Price
|
|||||||
|
Options outstanding – January 1, 2010
|
2,895,000 | $ | 0.56 | |||||
|
Granted
|
- | - | ||||||
|
Exercised
|
- | - | ||||||
|
Forfeited
|
(310,000 | ) | 0.49 | |||||
|
Options outstanding – December 31, 2010
|
2,585,000 | 0.57 | ||||||
|
Granted
|
1,530,000 | 0.15 | ||||||
|
Exercised
|
- | - | ||||||
|
Forfeited
|
(235,000 | ) | 0.36 | |||||
|
Options outstanding – June 30, 2011
|
3,880,000 | $ | 0.42 | |||||
14
A summary of the changes in the Company’s unvested stock options within the Plan is as follows:
|
Number of Shares
|
Weighted
Average Grant
Date Fair Value
|
|||||||
|
Unvested stock options – January 1, 2010
|
667,853 | $ | 0.14 | |||||
|
Granted
|
- | - | ||||||
|
Vested
|
(222,934 | ) | (0.13 | ) | ||||
|
Forfeited
|
(310,000 | ) | (0.18 | ) | ||||
|
Unvested stock options – December 31, 2010
|
134,919 | 0.06 | ||||||
|
Granted
|
1,530,000 | 0.01 | ||||||
|
Vested
|
(37,618 | ) | 0.39 | |||||
|
Forfeited
|
(235,000 | ) | (0.10 | ) | ||||
|
Unvested stock options – June 30, 2011
|
1,392,301 | $ | 0.01 | |||||
The following table summarizes the activity outside of the Plan:
|
Number of
Shares
|
Weighted
Average
Exercise Price
|
|||||||
|
Options outstanding – January 1, 2011
|
- | - | ||||||
|
Granted
|
5,000,000 | $ | 0.15 | |||||
|
Exercised
|
- | - | ||||||
|
Forfeited
|
(1,000,000 | ) | (0.15 | ) | ||||
|
Options outstanding – June 30, 2011
|
4,000,000 | $ | 0.15 | |||||
A summary of the changes in the Company’s unvested stock options outside of the Plan is as follows:
|
Number of Shares
|
Weighted
Average Grant
Date Fair Value
|
|||||||
|
Unvested stock options – January 1, 2011
|
- | $ | - | |||||
|
Granted
|
5,000,000 | 0.02 | ||||||
|
Vested
|
(3,000,000 | ) | (0.02 | ) | ||||
|
Forfeited
|
(1,000,000 | ) | (0.02 | ) | ||||
|
Unvested stock options – June 30, 2011
|
1,000,000 | $ | 0.02 | |||||
15
Additional information relating to all stock options and warrants outstanding and exercisable at June 30, 2011, summarized by exercise price, is as follows:
|
Outstanding Weighted Average
|
Exercisable
Weighted Average
|
|||||||||||||||||||||
|
Life
|
Exercise
|
Exercise
|
||||||||||||||||||||
|
Exercise Price Per Share
|
Shares
|
(years)
|
Price
|
Shares
|
Price
|
|||||||||||||||||
| $0.15 |
(options)
|
5,500,000 | 9.6 | $ | 0.15 | 3,139,167 | $ | 0.15 | ||||||||||||||
| $0.20 |
(options)
|
151,000 | 8.0 | $ | 0.20 | 123,500 | $ | 0.20 | ||||||||||||||
| $0.20 |
(warrants)
|
3,750,000 | 5.0 | $ | 0.20 | 3,750,000 | $ | 0.20 | ||||||||||||||
| $0.30 |
(options)
|
60,000 | 7.0 | $ | 0.30 | 60,000 | $ | 0.30 | ||||||||||||||
| $0.31 |
(options)
|
48,000 | 6.0 | $ | 0.31 | 48,000 | $ | 0.31 | ||||||||||||||
| $0.38 |
(options)
|
240,000 | 6.2 | $ | 0.38 | 240,000 | $ | 0.38 | ||||||||||||||
| $0.40 |
(options)
|
450,000 | 7.0 | $ | 0.40 | 450,000 | $ | 0.40 | ||||||||||||||
| $0.40 |
(warrants)
|
150,000 | 1.4 | $ | 0.40 | 150,000 | $ | 0.40 | ||||||||||||||
| $0.46 |
(options)
|
385,000 | 6.0 | $ | 0.46 | 385,000 | $ | 0.46 | ||||||||||||||
| $0.50 |
(options)
|
570,000 | 6.4 | $ | 0.50 | 566,032 | $ | 0.50 | ||||||||||||||
| $0.50 |
(warrants)
|
290,000 | 1.4 | $ | 0.50 | 290,000 | $ | 0.50 | ||||||||||||||
| $1.25 |
(options)
|
476,000 | 5.2 | $ | 1.25 | 476,000 | $ | 1.25 | ||||||||||||||
| 12,070,000 | 7.2 | $ | 0.26 | 9,677,699 | $ | 0.29 | ||||||||||||||||
As of June 30, 2011, there were 2,487,699 of vested stock options within the Plan and 3,000,000 of vested options outside the Plan. As of June 30, 2011, there was approximately $13,000 of total unrecognized compensation expense related to share-based compensation arrangements granted within the Plan and approximately $5,000 of total unrecognized compensation expense related to share-based compensation arrangements granted outside the Plan. The cost is expected to be recognized on a weighted-average basis over the next three years. The aggregate intrinsic value of stock options outstanding was zero at June 30, 2011 and 2010 as the market value of the options was lower than the exercise value.
The Company has recorded a valuation allowance on a portion of its deferred tax asset related to net operating loss carryforwards. As a result, the stock-based compensation has not been tax effected on the consolidated statement of operations. For the six months ended June 30, 2011 and 2010, the deferred tax effect related to nonqualified stock options was not material.
On June 24, 2011, the Company issued a warrant to purchase 3,750,000 shares of its common stock to Monto Holdings (Pty) Limited in accordance with an asset purchase agreement as further described in Note 9 to the consolidated financial statements. The warrant has an exercise price of $0.20, a term of five years and is exercisable immediately. The warrant was valued at approximately $89,000 using the Black-Scholes pricing model and the weighted-average assumptions discussed above.
|
11.
|
Segment Reporting
|
The Company designs, markets and sells high-end casual apparel under the brand names William Rast and People’s Liberation and, in the United States through April 26, 2011, J. Lindeberg. The Wholesale segment sells merchandise directly to better specialty stores, boutiques, select department stores, green grass golf stores, off-price retailers, international customers, distributors and agents, and through the Company’s e-commerce sites. The Retail segment sells the Company’s merchandise and merchandise purchased from its licensees in its retail store locations. The International segment sold William Rast apparel and accessories through the Company’s subsidiary, William Rast Europe, directly to European customers, distributors and agents, who in turn sold merchandise to retailers in specific territories. The Company ceased operations in its William Rast Europe subsidiary, and as a result, all sales to European and other international customers and distributors are currently sold through the Company’s wholesale division.
16
Shared operating costs, including design, distribution and customer service departments, are allocated between the operating segments. Management evaluates the performance of each operating segment based on net revenue and operating income. The types of products developed and sold by each segment are not sufficiently different to account for these products separately or to justify segmented reporting by product type or brand name.
Summarized financial information concerning our reportable segments from continuing operations for the three and six months ended June 30, 2011 and 2010, is as follows:
|
Three Months Ended
June 30,
|
Six Months Ended
June 30
|
|||||||||||||||
|
2011
|
2010
|
2011
|
2010
|
|||||||||||||
|
Net Revenue (1):
|
||||||||||||||||
|
Wholesale
|
$ | 1,514,597 | $ | 4,414,623 | $ | 3,351,693 | $ | 10,035,048 | ||||||||
|
Retail
|
562,480 | 470,434 | 1,039,824 | 876,001 | ||||||||||||
|
International
|
- | (1,547 | ) | - | 8,976 | |||||||||||
| $ | 2,077,077 | $ | 4,883,510 | $ | 4,391,517 | $ | 10,920,025 | |||||||||
|
Gross Profit (1):
|
||||||||||||||||
|
Wholesale
|
$ | 79,654 | $ | 2,045,962 | $ | 327,756 | $ | 5,029,413 | ||||||||
|
Retail
|
353,250 | 342,115 | 606,520 | 633,658 | ||||||||||||
|
International
|
- | 29,138 | - | 37,667 | ||||||||||||
| $ | 432,904 | $ | 2,417,215 | $ | 934,276 | $ | 5,700,738 | |||||||||
|
Selling, Design and Production Expense (1):
|
||||||||||||||||
|
Wholesale
|
$ | 1,385,374 | $ | 1,279,494 | $ | 2,840,581 | $ | 3,732,481 | ||||||||
|
Retail
|
(1,870 | ) | 27,221 | 3,200 | 27,400 | |||||||||||
|
International
|
- | 2,908 | - | 10,158 | ||||||||||||
| $ | 1,383,504 | $ | 1,309,623 | $ | 2,843,781 | $ | 3,770,039 | |||||||||
|
General and Administrative Expense (1):
|
||||||||||||||||
|
Wholesale
|
$ | 1,139,463 | $ | 1,041,032 | $ | 2,414,791 | $ | 2,219,274 | ||||||||
|
Retail
|
596,434 | 464,953 | 1,171,740 | 905,765 | ||||||||||||
|
International
|
254 | (36,688 | ) | 254 | (1,979 | ) | ||||||||||
| $ | 1,736,151 | $ | 1,469,297 | $ | 3,586,785 | $ | 3,123,060 | |||||||||
|
Operating Loss (1):
|
||||||||||||||||
|
Wholesale
|
$ | (2,445,183 | ) | $ | (274,564 | ) | $ | (4,927,616 | ) | $ | (922,342 | ) | ||||
|
Retail
|
(241,314 | ) | (150,059 | ) | (568,420 | ) | (299,507 | ) | ||||||||
|
International
|
(254 | ) | 62,918 | (254 | ) | 29,488 | ||||||||||
| $ | (2,686,751 | ) | $ | (361,705 | ) | $ | (5,496,290 | ) | $ | (1,192,361 | ) | |||||
|
Capital Expenditures:
|
||||||||||||||||
|
Wholesale
|
$ | 9,771 | $ | 7,521 | $ | 104,244 | $ | 99,230 | ||||||||
|
Retail
|
- | 11,353 | 1,350 | 21,036 | ||||||||||||
|
International
|
- | - | - | - | ||||||||||||
| $ | 9,771 | $ | 18,874 | $ | 105,594 | $ | 120,266 | |||||||||
|
Total Assets:
|
||||||||||||||||
|
Wholesale
|
$ | 3,477,708 | $ | 5,625,516 | $ | 3,477,708 | $ | 5,625,516 | ||||||||
|
Retail
|
1,177,268 | 1,025,648 | 1,177,268 | 1,025,648 | ||||||||||||
|
International
|
28,798 | 24,125 | 28,798 | 24,125 | ||||||||||||
| $ | 4,683,774 | $ | 6,675,289 | $ | 4,683,774 | $ | 6,675,289 | |||||||||
|
(1)
|
Segment information is presented after the reclassification of revenue and expenses reported under discontinued operations as further described in Note 9 to the financial statements.
|
17
As of June 30, 2011 and 2010, $4.7 million and $9.5 million, respectively, of our assets were located in the United States. The Wholesale segment had net revenue to two customers, exceeding 10% of net revenue, during the six months ended June 30, 2011 amounting to approximately $1.9 million. The Wholesale segment had net revenue to one customer, exceeding 10% of net sales, during the six months ended June 30, 2010 amounting to approximately $1.8 million.
|
12.
|
Customer and Supplier Concentrations
|
During the three months ended June 30, 2011 and 2010, two customers comprised greater than 10% of the Company’s net revenue. Revenue derived from these customers amounted to 14.1% and 13.7% of net revenue for the three months ended June 30, 2011 and 14.2% and 13.0% of net revenue for the three months ended June 30, 2010. During the six months ended June 30, 2011 and 2010, two customers comprised greater than 10% of the Company’s net revenue. Revenue derived from these customers amounted to 14.4% and 10.5% of net revenue for the six months ended June 30, 2011 and 11.6% and 10.7% of net revenue for the six months ended June 30, 2010. At June 30, 2011, the majority of receivables due from these customers are sold to the factor and are included in the due to factor balance.
During the six months ended June 30, 2011, three suppliers comprised greater than 10% of the Company’s purchases. Purchases from these suppliers amounted to 31.3%, 13.6% and 10.9% for the six months ended June 30, 2011. During the six months ended June 30, 2010, two suppliers comprised greater than 10% of the Company’s purchases. Purchases from these suppliers amounted to 38.4% and 21.0% for the six months ended June 30, 2010. At June 30, 2011 and 2010, accounts payable and accrued expenses included an aggregate of approximately $674,000 and $1.7 million, respectively, due to these vendors.
During the six months ended June 30, 2011 (through April 26, 2011) and 2010, the Company purchased all of its J. Lindeberg brand products from J. Lindeberg AB in Sweden, the beneficial owner of 50% of the Company’s subsidiary, J. Lindeberg USA. Total purchases from J. Lindeberg AB for the six months ended June 30, 2011 and 2010 amounted to approximately $1.8 million and $1.7 million, respectively. As of June 30, 2010, approximately $396,000 was due to J. Lindeberg AB for product purchases. There were no amounts owed to J. Lindeberg AB for product purchases as of June 30, 2011.
18
|
13.
|
Off Balance Sheet Risk and Contingencies
|
Financial instruments that potentially subject the Company to off-balance sheet risk consist of factored accounts receivable. The Company sells the majority of its trade accounts receivable to its factors and is contingently liable to the factors for merchandise disputes and other customer claims. At June 30, 2011, total factor receivables approximated $312,000. From time to time, the Company’s factors also issue letters of credit and vendor guarantees on the Company’s behalf. There were no outstanding letters of credit or vendor guarantees as of June 30, 2011. Ledger debt (payables to suppliers that use the same factors as the Company) as of June 30, 2011 amounted to approximately $26,000.
The Company is subject to certain legal proceedings and claims arising in connection with its business. In the opinion of management, there are currently no claims that could have a material adverse effect on the Company’s consolidated financial position, results of operations or cash flows.
In accordance with the bylaws of the Company, officers and directors are indemnified for certain events or occurrences arising as a result of the officer or director serving in such capacity. The term of the indemnification period is for the lifetime of the officer or director. The maximum potential amount of future payments the Company could be required to make under the indemnification provisions of its bylaws is unlimited. At this time, the Company believes the estimated fair value of the indemnification provisions of its bylaws is minimal and therefore, the Company has not recorded any related liabilities.
In addition to the indemnification required by the Company’s Amended and Restated Certificate of Incorporation and bylaws, the Company has entered into indemnity agreements with each of its current officers, former officers Darryn Barber and Thomas Nields, directors and key employees. These agreements provide for the indemnification of the Company’s directors, officers, former officers and key employees for all reasonable expenses and liabilities incurred in connection with any action or proceeding brought against them by reason of the fact that they are or were the Company’s agents. The Company believes these indemnification provisions and agreements are necessary to attract and retain qualified directors, officers and employees.
The Company enters into indemnification provisions under its agreements in the normal course of business, typically with suppliers, customers, distributors and landlords. Under these provisions, the Company generally indemnifies and holds harmless the indemnified party for losses suffered or incurred by the indemnified party as a result of the Company’s activities or, in some cases, as a result of the indemnified party’s activities under the agreement. These indemnification provisions often include indemnifications relating to representations made by the Company with regard to intellectual property rights. These indemnification provisions generally survive termination of the underlying agreement. The maximum potential amount of future payments the Company could be required to make under these indemnification provisions is unlimited. The Company has not incurred material costs to defend lawsuits or settle claims related to these indemnification agreements. As a result, the Company believes the estimated fair value of these agreements is minimal. Accordingly, the Company has not recorded any related liabilities.
19
|
14.
|
Income Taxes
|
Deferred income taxes arise principally from temporary differences in the method of depreciating property and equipment for income tax reporting purposes and the recognition of expense related to the allowance for doubtful accounts, factor open credits and inventory reserves for income tax reporting purposes, and net operating loss carryforwards. The Company has Federal net operating losses available to carryforward to future periods of approximately $8.6 million as of December 31, 2010 which expire beginning 2027. As of December 31, 2010, the Company provided a valuation allowance for a portion of the deferred income tax asset related to its Federal net operating loss carryforwards. As of December 31, 2010, the Company determined that it was more likely than not that it would realize the future income tax benefits related to a portion of its Federal net operating losses. During the three months ended June 30, 2011, the Company increased the valuation allowance related to its net operating loss carryforwards to reserve the entire asset balance, as the Company was unable to determine if it was more likely than not that it would realize the future income tax benefits related to its net operating losses. This resulted in a deferred provision for income taxes from continuing operations of approximately $908,000 recorded during the quarter ended June 30, 2011.
The Company has net operating losses available to carryforward to future periods from California of approximately $8.1 million as of December 31, 2010 which expire beginning 2017. For the years ending December 31, 2010 and 2011, the use of California state operating losses has been suspended for companies with taxable annual income greater than $300,000. As the Company is unable to determine whether it will be able to utilize its California net operating losses against future income, the Company has provided a valuation allowance for all of its deferred income tax asset related to its California net operating loss carryforwards as of June 30, 2011 and December 31, 2010.
The components of the Company’s consolidated deferred income tax balances from continuing operations as of June 30, 2011 and December 31, 2010 are as follows:
|
June 30,
2011
|
December 31,
2010
|
|||||||
|
Deferred income tax assets - current:
|
||||||||
|
Net operating loss carryforwards
|
$ | - | $ | 1,060,000 | ||||
|
Factored accounts receivable and bad debt reserves
|
28,000 | 28,000 | ||||||
|
Other reserves
|
134,000 | 134,000 | ||||||
| 162,000 | 1,222,000 | |||||||
|
Less: Valuation allowance
|
(162,000 | ) | (838,000 | ) | ||||
|
Deferred income tax assets - current
|
$ | - | 384,000 | |||||
|
Deferred income tax asset – long-term:
|
||||||||
|
Net operating loss carryforwards
|
$ | 3,455,000 | 2,395,000 | |||||
|
Deferred income tax liability – long-term:
|
||||||||
|
Property and equipment
|
(314,000 | ) | (314,000 | ) | ||||
| 3,141,000 | 2,081,000 | |||||||
|
Less: Valuation allowance
|
(3,141,000 | ) | (1,557,000 | ) | ||||
|
Net deferred income tax asset – long-term
|
$ | - | $ | 524,000 | ||||
20
Item 2. Management’s Discussion and Analysis of Financial Condition and Results of Operations
The information contained in this Form 10-Q is intended to update the information contained in our Annual Report on Form 10-K for the year ended December 31, 2010 and presumes that readers have access to, and will have read, the “Management’s Discussion and Analysis of Financial Condition and Results of Operations” and other information contained in such Form 10-K. The following discussion and analysis also should be read together with our consolidated financial statements and the notes to the consolidated financial statements included elsewhere in this Form 10-Q.
This discussion summarizes the significant factors affecting the consolidated operating results, financial condition and liquidity and cash flows of People’s Liberation, Inc. for the three and six months ended June 30, 2011 and the three and six months ended June 30, 2010. Except for historical information, the matters discussed in this Management’s Discussion and Analysis of Financial Condition and Results of Operations are forward-looking statements that involve risks and uncertainties and are based upon judgments concerning various factors that are beyond our control. Actual results could differ materially from those projected in the forward-looking statements as a result of, among other things, those factors set forth in “Risk Factors” contained in Item 1A of our Annual Report on Form 10-K for the year ended December 31, 2010 and this Quarterly Report on Form 10-Q.
Overview
We design, market and sell high-end casual apparel under the brand names “People’s Liberation,” “William Rast” and, in the United States through April 26, 2011, “J. Lindeberg.” The majority of the merchandise we offer consists of premium denim, knits, wovens, leather goods, golf wear and outerwear for men and women. In the United States, we distribute our William Rast branded merchandise and, through April 26, 2011, our J. Lindeberg branded merchandise to better specialty stores, boutiques and department stores, such as Nordstrom, Saks Fifth Avenue and Neiman Marcus, as well as online at various websites including williamrast.com, jlindebergusa.com and Zappos.com. Beginning July 2008 through April 26, 2011, we also marketed and sold our J. Lindeberg branded collection and golf apparel through our retail stores in New York City, Los Angeles and Miami, and J. Lindeberg golf wear to green grass golf stores and boutiques in the United States. William Rast products are also sold in our four retail stores located in Los Angeles, San Jose and Cabazon, California, and Miami, Florida. Internationally, in select countries, we sell our William Rast branded apparel products directly and through distributors to better department stores and boutiques. We are currently exploring options for the marketing and distribution of People’s Liberation branded apparel and apparel accessories both in North America and internationally.
We began distributing J. Lindeberg branded apparel products in the United States on an exclusive basis beginning July 2008 through our subsidiary, J. Lindeberg USA, LLC, in collaboration with J. Lindeberg AB of Sweden. After the sale of our 50% member interest in J. Lindeberg USA on April 26, 2011, which is described elsewhere in this report, we no longer sell J. Lindeberg brand products.
We commenced our William Rast clothing line in May 2005 and our People’s Liberation business in July 2004. Our William Rast clothing line is a collaboration with Justin Timberlake.
We are headquartered in Los Angeles, California, and maintain showrooms in New York and Los Angeles.
21
Organization
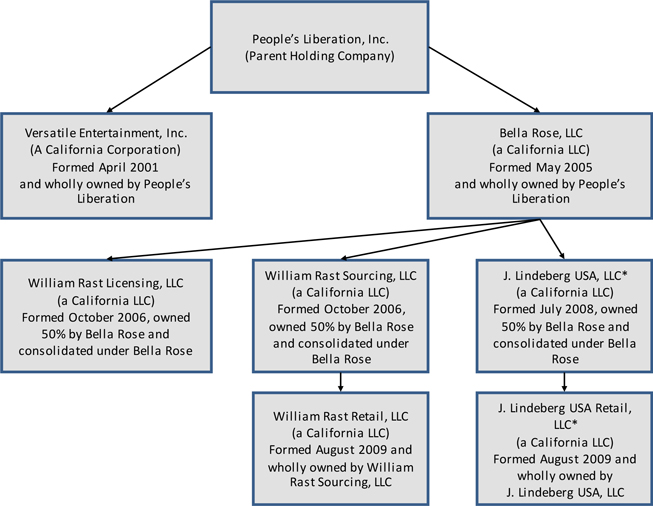
* On April 26, 2011, the Company completed the sale of Bella Rose’s 50% membership interest in J. Lindeberg USA and its wholly-owned subsidiary, J. Lindeberg USA Retail, to J. Lindeberg USA Corp. pursuant to the terms of a Unit Purchase Agreement entered into by the parties on April 7, 2011. See further discussion in Note 9 to the Company’s consolidated financial statements.
As illustrated above, People’s Liberation, Inc. is the parent holding company of Versatile Entertainment, Inc. (“Versatile”) and Bella Rose, LLC (“Bella Rose”), both of which were consolidated under and became wholly-owned subsidiaries of People’s Liberation on November 22, 2005.
Structure of Operations
Our wholly-owned subsidiary Versatile Entertainment, Inc. conducts our People’s Liberation brand business. Our William Rast brand business is conducted through our wholly-owned subsidiary Bella Rose, LLC. William Rast Sourcing, LLC and William Rast Licensing, LLC are consolidated under Bella Rose and are each owned 50% by Bella Rose and 50% by Tennman WR-T, Inc., an entity owned in part by Justin Timberlake. William Rast Retail, LLC, a California limited liability company, was formed on August 26, 2009 and is a wholly-owned subsidiary of William Rast Sourcing. William Rast Retail was formed to operate our William Rast retail stores.
22
Prior to its sale on April 26, 2011, our J. Lindeberg brand business was conducted through Bella Rose. Beginning July 1, 2008 through April 26, 2011, J. Lindeberg USA, LLC was consolidated under Bella Rose and was owned 50% by Bella Rose and 50% by J. Lindeberg USA Corp. an entity owned by J. Lindeberg AB, a Swedish corporation. J. Lindeberg USA Retail, LLC, a California limited liability company, was formed on August 21, 2009 and is a wholly-owned subsidiary of J. Lindeberg USA. J. Lindeberg Retail was formed to operate our J. Lindeberg retail stores.
Recent Developments
J. Lindeberg USA Divestiture
On April 26, 2011, our wholly-owned subsidiary, Bella Rose, completed the sale of its 50% member interest in J. Lindeberg USA to J. Lindeberg USA Corp., the company’s other 50% member, pursuant to the terms of a Unit Purchase Agreement entered into by the parties on April 7, 2011. In consideration for Bella Rose’s 50% membership interest in Lindeberg USA, J. Lindeberg USA Corp. agreed to pay us an aggregate of $1,650,000, of which $900,000 was paid upon the closing of the transaction and $750,000 is payable on the six month anniversary of the closing of the transaction.
In connection with the sale of Bella Rose’s membership interest in J. Lindeberg USA to J. Lindeberg USA Corp., certain customer lists, other intangibles, and lease agreements and lease deposits of J. Lindeberg USA were also transferred to J. Lindeberg USA Corp. on the closing date. We recorded a gain of approximately $2.0 million in the second quarter of 2011 related to this transaction.
The divestiture of our membership interest in Lindeberg USA has been accounted for as a discontinued operation and, accordingly, all prior periods presented in the accompanying consolidated balance sheets, statements of operations and cash flows have been adjusted to conform to this presentation.
On June 24, 2011, Bella Rose entered into an asset purchase agreement with Monto Holding (Pty) Limited (“Monto”). Pursuant to the agreement, Bella Rose sold to Monto without recourse the $750,000 receivable owed to us under the terms of that Unit Purchase Agreement discussed above. On June 24, 2011, we also issued a fully vested, five year warrant to Monto to purchase 3,750,000 shares of our Common Stock at an exercise price of $0.20 per share. In exchange for the rights to the receivable and the warrant, Monto paid a purchase price of $722,916.
Charlotte Russe Litigation
As discussed under Note 8 to the Condensed Consolidated Financial Statements, we were in litigation with Charlotte Russe and its affiliates in relation to an exclusive distribution agreement between Charlotte Russe and the Company. As a result of the litigation, there have been no significant sales of People’s Liberation branded apparel to Charlotte Russe subsequent to October 2009.
On February 3, 2011, People's Liberation, Versatile Entertainment, Colin Dyne, ECA Holdings II, LLC and New Media Retail Concepts entered into a Settlement Agreement and Mutual Release with Charlotte Russe Holding, Inc. and Charlotte Russe Merchandising, Inc., Advent International Corporation, Advent CR Holdings, Inc., David Mussafer, and Jenny Ming. The agreement was entered into to settle all disputes among the parties relating to:
|
|
·
|
that certain action in the Los Angeles County Superior Court entitled Charlotte Russe Holding, Inc. et al. v. Versatile Entertainment, Inc. et al., Case No. BC 424734; and
|
|
|
·
|
that certain action entitled Versatile Entertainment, Inc. et al. v. David Mussafer, et al., originally brought in the Los Angeles County Superior Court, Case No. BC 424675.
|
23
Pursuant to the settlement agreement, on February 3, 2011 we received $3.5 million, after the distribution of amounts owed under the terms of an asset purchase agreement (described below), and the payment of legal fees and expenses. The settlement included the dismissal with prejudice of all claims pending between the parties as well as mutual releases, without any admission of liability or wrongdoing by any of the parties to the actions.
We also received proceeds of $750,000 in the third quarter of 2010 relating to the Charlotte Russe litigation, for total proceeds relating to the litigation of $4.3 million. The $750,000 was received in connection with an asset purchase agreement entered into by us with two related parties pursuant to which we sold 50% of the net proceeds, after contingent legal fees and expenses, that may be received by us as a result of the litigation.
Launch of Newly Designed William Rast Expanded Collection
In February 2011, we showcased our newly designed William Rast expanded collection for Fall 2011 at the ENK tradeshow in Las Vegas. The American-made denim offering will include newly developed fabrics, innovative and on-trend washes and new fits, all accompanied by fresh, modern branding and packaging. We have brought on board a new team of denim experts in design, merchandising and sales to focus on building complete collections for both retail and wholesale to support our denim category.
Retail Sales
Our William Rast branded apparel and accessories are sold through our three full-price William Rast brand retail stores and also through our William Rast brand outlet store. Through April 26, 2011, our J. Lindeberg branded apparel and accessories were sold through our three full-price J. Lindeberg brand retail stores. As further discussed above, we completed the sale of our 50% interest in J. Lindeberg USA, which included our three retail stores, to J. Lindeberg USA Corp.on April 26, 2011.
As of August 12, 2011 we had the following retail store locations:
|
Brand
|
Location
|
Opening Date
|
||
|
William Rast
|
Miami, Florida
|
August 2010
|
||
|
William Rast
|
Century City, California
|
November 2009
|
||
|
William Rast
|
San Jose, California
|
November 2009
|
||
|
William Rast Outlet
|
Cabazon, California
|
November 2009
|
As previously reported, the above stores were opened as part of our retail expansion plan which included the roll-out of retail stores in major metropolitan locations. We currently do not plan to open any additional stores in the near future. We will continue to review our retail strategy as retail market conditions change in response to economic conditions.
24
Critical Accounting Policies, Judgments and Estimates
Our discussion and analysis of our financial condition and results of operations are based upon our consolidated financial statements, which have been prepared in accordance with accounting principles generally accepted in the United States. The preparation of these financial statements requires us to make estimates and judgments that affect the reported amounts of assets, liabilities, revenues and expenses, and related disclosure of contingent assets and liabilities. On an on-going basis, we evaluate our estimates, including those related to our valuation of inventories and our allowance for uncollectible house accounts receivable, recourse factored accounts receivable and chargebacks, and contingent assets and liabilities. We base our estimates on historical experience and on various other assumptions that are believed to be reasonable under the circumstances, the results of which form the basis for making judgments about the carrying values of assets and liabilities that are not readily apparent from other sources. Actual results may differ from these estimates under different assumptions or conditions. We believe the following critical accounting policies affect our more significant judgments and estimates used in the preparation of our consolidated financial statements:
Inventories. Inventories are evaluated on a continual basis and reserve adjustments, if any, are made based on management’s estimate of future sales value of specific inventory items. Reserve adjustments are made for the difference between the cost of the inventory and the estimated market value, if lower, and charged to operations in the period in which the facts that give rise to the adjustments become known. Inventories, consisting of piece goods and trim, work-in-process and finished goods, are stated at the lower of cost (first-in, first-out method) or market.
Accounts Receivable. Factored accounts receivable balances with recourse, chargeback and other receivables are evaluated on a continual basis and allowances are provided for potentially uncollectible accounts based on management’s estimate of the collectability of customer accounts. Factored accounts receivable without recourse are also evaluated on a continual basis and allowances are provided for anticipated returns, discounts and chargebacks based on management’s estimate of the collectability of customer accounts and historical return, discount and other chargeback rates. If the financial condition of a customer were to deteriorate, resulting in an impairment of its ability to make payments, an additional allowance may be required. Allowance adjustments are charged to operations in the period in which the facts that give rise to the adjustments become known.
Intangible Assets. Intangible assets are evaluated on a continual basis and impairment adjustments are made based on management’s reassessment of the useful lives related to intangible assets with definite useful lives. Intangible assets with indefinite lives are evaluated on a continual basis and impairment adjustments are made based on management’s comparison of the carrying amount of an asset to future undiscounted net cash flows expected to be generated by the asset. Impairment adjustments are made for the difference between the carrying value of the intangible asset and the estimated valuation and charged to operations in the period in which the facts that give rise to the adjustments become known.
Revenue Recognition. Wholesale revenue is recognized when merchandise is shipped to a customer, at which point title transfers to the customer, and when collection is reasonably assured. Customers are not given extended terms or dating or return rights without proper prior authorization. Revenue is recorded net of estimated returns, charge backs and markdowns based upon management’s estimates and historical experience. Website revenue is recognized when merchandise is shipped to a customer and when collection is reasonably assured. Retail revenue is recognized on the date of purchase from our retail stores. Advertising revenue received under sponsorship agreements is recorded in the period in which the event to which the advertising rights were granted occurred. Design revenue received under design and license agreements is recorded in the period in which the design services are provided to the licensee.
25
Deferred Tax Assets. We may record a valuation allowance to reduce our deferred tax assets to an amount that we believe is more likely than not to be realized. We consider estimated future taxable income and ongoing prudent and feasible tax planning strategies in assessing the need for a valuation allowance. If we determine that we may not realize all or part of our deferred tax assets in the future, we will make an adjustment to the carrying value of the deferred tax asset, which would be reflected as an income tax expense. Conversely, if we determine that we will realize a deferred tax asset, which currently has a valuation allowance, we would be required to reverse the valuation allowance, which would be reflected as an income tax benefit. Valuation allowance adjustments are made in the period in which the facts that give rise to the adjustments become known.
Income Taxes. We file U.S. Federal tax returns, multiple U.S. state and state franchise tax returns. For U.S. Federal tax purposes, all periods subsequent to December 31, 2006 are subject to examination by the U.S. Internal Revenue Service (“IRS”). We believe that our income tax filing positions and deductions will be sustained on audit and we do not anticipate any adjustments that will result in a material change. Therefore, no reserves for uncertain income tax positions have been recorded. In addition, we do not anticipate that the total amount of unrecognized tax benefit related to any particular tax position will change significantly within the next twelve months. Our policy for recording interest and penalties, if any, associated with IRS audits is to record such items as a component of income taxes.
Stock Based Compensation. Stock-based compensation expense is recognized based on awards ultimately expected to vest on a straight-line prorated basis. The fair value of options is estimated on the date of grant using the Black-Scholes option pricing model. The valuation determined by the Black-Scholes pricing model is affected by our stock price as well as assumptions regarding a number of highly complex and subjective variables. These variables include, but are not limited to our expected stock price volatility over the term of the awards, and actual and projected employee stock option exercise behaviors. Stock price volatility was estimated based on a peer group of public companies and the expected term was estimated using the “safe harbor” provisions provided by generally accepted accounting principles.
Noncontrolling Interest. Profit and loss allocations to noncontrolling interest members of our subsidiaries are recorded as increases and decreases in noncontrolling interest in our consolidated financial statements. Cash distributions, if any, made to a noncontrolling interest member of any of our subsidiaries are accounted for as decreases in noncontrolling interest in the consolidated balance sheet of the Company. To the extent the priority distributions are made, it would reduce the income allocable to the controlling interest.
Litigation Contingencies. We are subject to on-going litigation which requires management to make certain assumptions and estimates regarding gain or loss contingencies, if any, related to the outcome of pending litigation. In consultation with legal counsel, we consider the facts and circumstances surrounding the pending litigation and the probability of the outcome of pending litigation, whether favorable or unfavorable, in our estimates of gain or loss contingencies.
Recent Accounting Pronouncements
Recent accounting pronouncements did not or are not believed to have a material impact on the Company's present or future consolidated financial statements.
26
Results of Operations
Summarized financial information concerning our reportable segments from continuing operations for the three and six months ended June 30, 2011 and 2010, is as follows:
|
Three Months Ended
June 30,
|
Six Months Ended
June 30
|
|||||||||||||||
|
2011
|
2010
|
2011
|
2010
|
|||||||||||||
|
Net Revenue (1):
|
||||||||||||||||
|
Wholesale
|
$ | 1,514,597 | $ | 4,414,623 | $ | 3,351,693 | $ | 10,035,048 | ||||||||
|
Retail
|
562,480 | 470,434 | 1,039,824 | 876,001 | ||||||||||||
|
International
|
- | (1,547 | ) | - | 8,976 | |||||||||||
| $ | 2,077,077 | $ | 4,883,510 | $ | 4,391,517 | $ | 10,920,025 | |||||||||
|
Gross Profit (1):
|
||||||||||||||||
|
Wholesale
|
$ | 79,654 | $ | 2,045,962 | $ | 327,756 | $ | 5,029,413 | ||||||||
|
Retail
|
353,250 | 342,115 | 606,520 | 633,658 | ||||||||||||
|
International
|
- | 29,138 | - | 37,667 | ||||||||||||
| $ | 432,904 | $ | 2,417,215 | $ | 934,276 | $ | 5,700,738 | |||||||||
|
Selling, Design and Production Expense (1):
|
||||||||||||||||
|
Wholesale
|
$ | 1,385,374 | $ | 1,279,494 | $ | 2,840,581 | $ | 3,732,481 | ||||||||
|
Retail
|
(1,870 | ) | 27,221 | 3,200 | 27,400 | |||||||||||
|
International
|
- | 2,908 | - | 10,158 | ||||||||||||
| $ | 1,383,504 | $ | 1,309,623 | $ | 2,843,781 | $ | 3,770,039 | |||||||||
|
General and Administrative Expense (1):
|
||||||||||||||||
|
Wholesale
|
$ | 1,139,463 | $ | 1,041,032 | $ | 2,414,791 | $ | 2,219,274 | ||||||||
|
Retail
|
596,434 | 464,953 | 1,171,740 | 905,765 | ||||||||||||
|
International
|
254 | (36,688 | ) | 254 | (1,979 | ) | ||||||||||
| $ | 1,736,151 | $ | 1,469,297 | $ | 3,586,785 | $ | 3,123,060 | |||||||||
|
Operating Loss (1):
|
||||||||||||||||
|
Wholesale
|
$ | (2,445,183 | ) | $ | (274,564 | ) | $ | (4,927,616 | ) | $ | (922,342 | ) | ||||
|
Retail
|
(241,314 | ) | (150,059 | ) | (568,420 | ) | (299,507 | ) | ||||||||
|
International
|
(254 | ) | 62,918 | (254 | ) | 29,488 | ||||||||||
| $ | (2,686,751 | ) | $ | (361,705 | ) | $ | (5,496,290 | ) | $ | (1,192,361 | ) | |||||
|
Capital Expenditures:
|
||||||||||||||||
|
Wholesale
|
$ | 9,771 | $ | 7,521 | $ | 104,244 | $ | 99,230 | ||||||||
|
Retail
|
- | 11,353 | 1,350 | 21,036 | ||||||||||||
|
International
|
- | - | - | - | ||||||||||||
| $ | 9,771 | $ | 18,874 | $ | 105,594 | $ | 120,266 | |||||||||
|
Total Assets:
|
||||||||||||||||
|
Wholesale
|
$ | 3,477,708 | $ | 5,625,516 | $ | 3,477,708 | $ | 5,625,516 | ||||||||
|
Retail
|
1,177,268 | 1,025,648 | 1,177,268 | 1,025,648 | ||||||||||||
|
International
|
28,798 | 24,125 | 28,798 | 24,125 | ||||||||||||
| $ | 4,683,774 | $ | 6,675,289 | $ | 4,683,774 | $ | 6,675,289 | |||||||||
|
(1)
|
Segment information is presented after the reclassification of revenue and expenses reported under discontinued operations as further described in Note 9 to the financial statements.
|
27
Results of Continuing Operations
The following table presents consolidated statement of operations data from continuing operations for each of the periods indicated as a percentage of net revenue.
|
Three Months
Ended June 30,
|
Six Months
Ended June 30,
|
|||||||||||||||
|
2011
|
2010
|
2011
|
2010
|
|||||||||||||
|
Net revenue
|
100.0 | % | 100.0 | % | 100.0 | % | 100.0 | % | ||||||||
|
Cost of goods sold
|
79.2 | 50.5 | 78.7 | 47.8 | ||||||||||||
|
Gross profit
|
20.8 | 49.5 | 21.3 | 52.2 | ||||||||||||
|
Selling, design and production expenses
|
66.6 | 26.8 | 64.8 | 34.5 | ||||||||||||
|
General and administrative expenses
|
83.6 | 30.1 | 81.7 | 28.6 | ||||||||||||
|
Operating loss from continuing operations
|
(129.4 | )% | (7.4 | )% | (125.2 | )% | (10.9 | )% | ||||||||
Comparison of the three months ended June 30, 2011 and the three months ended June 30, 2010 for continuing operations
Net Revenue
|
Three Months
Ended
June 30, 2011
|
Three Months
Ended
June 30, 2010
|
Percent
Change
|
||||||||||
|
Net Revenue
|
$ | 2,077,077 | $ | 4,883,510 | (57.5 | )% | ||||||
The decrease in net revenue from continuing operations for the three months ended June 30, 2011 was due primarily to decreased wholesale sales of our William Rast apparel line in the United States. In the first quarter of 2011 in response to slow denim sales in 2010, we launched a newly designed American-made William Rast denim and expanded sportswear collection estimated to reach our retail stores in July 2011 and our wholesale customers in Fall 2011. In the second quarter of 2011, wholesale sales of our William Rast apparel line were negatively impacted as our customers did not purchase consistent quantities of our existing products in anticipation of the arrival of our newly designed product line, resulting in a decrease in sales for the second quarter of 2011 compared to the second quarter of 2010. The decrease in wholesale revenue for the second quarter of 2011 was also due to nonrecurring revenue received from the Target Corporation in the second quarter of 2010 in accordance with the design and license agreement we entered into in May 2010 related to exclusive collection of William Rast products that were sold for a limited time in Target stores throughout the United States at the end of 2010. The decrease in wholesale net revenue for the three months ended June 30, 2011 was offset by an increase in retail sales of our William Rast apparel line. The decrease in wholesale net revenue for the three months ended June 30, 2011 was also partially offset by licensing revenue received under the terms of our William Rast eyewear licensing agreement in the second quarter of 2011. Based on the reception our new William Rast denim collection has received in the marketplace, we anticipate that our net revenue for the third quarter of 2011 will improve as compared to our second quarter results.
28
Gross Profit
|
Three Months
Ended
June 30, 2011
|
Three Months
Ended
June 30, 2010
|
Percent
Change
|
||||||||||
|
Gross Profit
|
$ | 432,904 | $ | 2,417,215 | (82.1 | )% | ||||||
Gross profit consists of net revenue less cost of goods sold. Cost of goods sold includes expenses primarily related to inventory purchases and contract labor, duty, freight and overhead expenses. Overhead expenses primarily consist of warehouse and shipping salaries and expenses. As a percentage of net revenue, our gross margin from continuing operations decreased to 20.8% for the three months ended June 30, 2011 from 49.5% for the three months ended June 30, 2010. The decrease in wholesale gross profit as a percentage of net revenue was primarily due to lower margins achieved in off-price sales of our William Rast products in an effort to reduce our remaining William Rast inventory in anticipation of our newly designed American-made William Rast denim line and expanded sportswear collection. The decrease in wholesale gross margin as a percentage of net revenue was also due to revenue received from the Target Corporation in the second quarter of 2010 in accordance with the design and license agreement we entered into in May 2010 related to exclusive collection of William Rast products that were sold for a limited time in Target stores throughout the United States at the end of 2010. There was no cost of revenue associated with the Target design and licensing revenue, which resulted in an increase in wholesale gross profit as a percentage of net revenue during the quarter ended June 30, 2010. In order to boost overall sales in our retail stores during the first half of 2011, we increased the number of select sale items during the period. This resulted in a decrease in retail gross margin during the three months ended June 30, 2011 compared to the three months ended June 30, 2010.
Selling, Design and Production Expenses
|
Three Months
Ended
June 30, 2011
|
Three Months
Ended
June 30, 2010
|
Percent
Change
|
||||||||||
|
Selling, design and production expenses
|
$ | 1,383,504 | $ | 1,309,623 | 5.6 | % | ||||||
Selling, design and production expense for the three months ended June 30, 2011 and 2010 primarily related to salaries and commissions, design fees, advertising, marketing and promotion, samples, travel, tradeshow, fashion show and showroom expenses. The increase in selling, design and production expenses from continuing operations for the quarter ended June 30, 2011 is primarily attributable to increased promotion and marketing of our William Rast brand through our Indy car sponsorship in the second quarter of 2011. The increase in selling, design and production expenses from continuing operations for the quarter ended June 30, 2011 was offset by decreased design and production salaries incurred in the second quarter of 2011 as a result of cost cutting measures implemented to decrease expenditures. As a percentage of net revenue, selling, design and production expense increased to 66.6% for the three months ended June 30, 2011 compared to 26.8% for the three months ended June 30, 2010. The increase in selling, design and production expenses as a percentage of net revenue for the quarter ended June 30, 2011 was due to net revenue decreasing at a higher rate than selling, design and production expenses.
29
General and Administrative Expenses
|
Three Months
Ended
June 30, 2011
|
Three Months
Ended
June 30, 2010
|
Percent
Change
|
||||||||||
|
General and administrative expenses
|
$ | 1,736,151 | $ | 1,469,297 | 18.2 | % | ||||||
General and administrative expenses for the three months ended June 30, 2011 and 2010 primarily related to salaries, professional fees, facility costs, travel and entertainment, depreciation and amortization expense, retail store operating costs, and other general corporate expenses. Retail store operating costs primarily include salaries, rent and other operating costs. As a percentage of net revenue, general and administrative expenses from continuing operations increased to 83.6% for the three months ended June 30, 2011 from 30.1% for three months ended June 30, 2010. The increase in general and administrative expenses during the three months ended June 30, 2011 was primarily due to increased retail store costs and increased professional fees. We had four retail stores open in the second quarter of 2011, compared to three stores that were opened in the second quarter of 2010. The increase in general and administrative expenses from continuing operations for the three months ended June 30, 2011 was offset by decreased administrative salaries incurred in the second quarter of 2011 as a result of cost cutting measures implemented to decrease expenditures.
Interest Expense, net
|
Three Months
Ended
June 30, 2011
|
Three Months
Ended
June 30, 2010
|
Percent
Change
|
||||||||||
|
Interest Expense, net
|
$ | 29,163 | $ | 54,457 | (46.4 | )% | ||||||
Our William Rast factor agreement provides that we can borrow an amount up to 75% of the value of our approved factored customer invoices. We can also borrow up to 50% of our eligible inventory (as defined in the agreement) up to a maximum of $875,000. Under our J. Lindeberg factoring arrangement (prior to the sale of our 50% membership interest in J. Lindeberg USA on April 26, 2011) we were able to borrow up to 85% on our factored accounts receivable and 50% on our eligible inventories. Maximum borrowings, including borrowings related to factored accounts receivable and inventory, related to our J. Lindeberg facility were not to exceed $1.5 million. Our J. Lindeberg factoring facility was amended on February 2, 2011, which amendment included a reduction of the advance rate on eligible accounts receivable from 85% to 75%. Under the amended facility, maximum borrowings remained at $1.5 million. Outstanding borrowings under our factoring arrangements amounted to approximately $481,000 and $3.0 million at June 30, 2011 and 2010, respectively. The decrease in interest expense is due to an average decrease in borrowings under our factoring arrangements during the three months ended June 30, 2011, offset by interest payable at a rate of 8% under the terms of a $750,000 promissory note entered into in August 2010.
Provision for Income Tax
|
Three Months
Ended
June 30, 2011
|
Three Months
Ended
June 30, 2010
|
Percent
Change
|
||||||||||
|
Provision for Income Tax
|
$ | 911,500 | $ | 7,390 | * | |||||||
|
* Not meaningful
|
||||||||||||
30
The provision for income taxes for the three months ended June 30, 2011 represents the minimum tax payments due for state and local purposes, including gross receipts tax on sales generated by our limited liability companies, estimated Federal and state taxes due at statutory effected tax rates and an increase in the valuation allowance provided for our deferred tax asset related to net operating loss carryforwards. The provision for income taxes for the three months ended June 30, 2010 represents the minimum tax payments due for state and local purposes, including gross receipts tax on sales generated by our limited liability companies. A provision for Federal income taxes was not recorded for the three months ended June 30, 2010, as we had a net loss during the quarter. As of June 30, 2011, a valuation allowance has been provided for the entire amount of our deferred income tax asset related to net operating loss carryforwards, factored accounts receivable and bad debt reserves and other reserves. At this time, we cannot determine that it is more likely than not that we will realize the entire balance of the future income tax benefits related to our net operating losses. As of December 31, 2010, total net operating losses available to carry forward to future periods amounted to approximately $8.6 million. As of June 30, 2010, a valuation allowance was provided for all of our deferred income tax assets related to net operating loss carryforwards, factored accounts receivable and bad debt reserves and other reserves. The increase in the provision for income taxes recorded for the three months ended June 30, 2011, compared to the three months ended June 30, 2010 resulted from an increase in the valuation allowance provided for our deferred tax asset related to net operating loss carryforwards recorded during the three months ended June 30, 2011.
Loss from Continuing Operations
|
Three Months
Ended
June 30, 2011
|
Three Months
Ended
June 30, 2010
|
Percent
Change
|
||||||||||
|
Loss from continuing operations
|
$ | (3,627,414 | ) | $ | (423,552 | ) | 756.4 | % | ||||
The increase in net loss from continuing operations incurred for the three months ended June 30, 2011 compared to the three months ended June 30, 2010 is due primarily to decreased net revenue and gross margin and an increase in the provision for income taxes recorded during the second quarter of 2011, as discussed above.
Noncontrolling Interest in Continuing Operations
|
Three Months
Ended
June 30, 2011
|
Three Months
Ended
June 30, 2010
|
Percent
Change
|
||||||||||
|
Noncontrolling interest in continuing operations
|
$ | 1,323,008 | $ | 289,448 | 357.1 | % | ||||||
Noncontrolling interest in continuing operations recorded for the three months ended June 30, 2011 and 2010 represents net loss allocations to Tennman WR-T, Inc., a member of William Rast Sourcing and William Rast Licensing. Beginning January 1, 2009, losses are allocated to the members of William Rast Sourcing and William Rast Licensing based on their respective percentage interests in such entities and profits are allocated to the members based on their percentage interest to the extent that the member was previously allocated losses. The increase in noncontrolling interest recorded for the three months ended June 30, 2011 compared to the three months ended June 30, 2010 was due primarily to increased loss allocations to Tennman during the three months ended June 30, 2011, compared to the three months ended June 30, 2010.
31
Discontinued Operations
Discontinued Operations
|
Three Months
Ended
June 30, 2011
|
Three Months
Ended
June 30, 2010
|
Percent
Change
|
||||||||||
|
Net income (loss) from discontinued operations
|
$ | 136,792 | $ | (114,096 | ) | * | ||||||
|
Gain on sale of member interest in subsidiary
|
2,012,323 | - | ||||||||||
| 2,149,115 | (114,096 | ) | ||||||||||
|
Noncontrolling interest in discontinued operations
|
(68,396 | ) | 57,048 | |||||||||
| $ | 2,080,719 | $ | (57,048 | ) | ||||||||
|
* Not meaningful
|
||||||||||||
Net income from discontinued operations for the period ended June 30, 2011 represents the results of operations of our J. Lindeberg subsidiary from the beginning of the quarter through the date of the sale of our 50% member interest in J. Lindeberg, USA on April 26, 2011. Net loss from discontinued operations for the three months ended June 30, 2010 represents the results of operations of our J. Lindeberg subsidiary from the beginning of the quarter through June 30, 2010. The gain on the sale of member interest in subsidiary is further described in Note 9 to this report.
Net Loss Attributable to Common Stockholders
|
Three Months
Ended
June 30, 2011
|
Three Months
Ended
June 30, 2010
|
Percent
Change
|
||||||||||
|
Net loss attributable to common stockholders
|
$ | (223,687 | ) | $ | (191,152 | ) | (17.0 | )% | ||||
The increase in net loss attributable to common stockholders during the three months ended June 30, 2011 compared to the three months ended June 30, 2010 is due primarily to decreased net revenue and gross margin and an increase in the provision for income taxes recorded during the second quarter of 2011, as discussed above, offset by the gain on the sale of our 50% member interest in J. Lindeberg, USA, as discussed elsewhere in this report.
32
Comparison of six months ended June 30, 2011 and six months ended June 30, 2010 for continuing operations
Net Revenue
|
Six Months
Ended
June 30, 2011
|
Six Months
Ended
June 30, 2010
|
Percent
Change
|
||||||||||
|
Net Revenue
|
$ | 4,391,517 | $ | 10,920,025 | (59.8 | )% | ||||||
The decrease in net revenue from continuing operations for the six months ended June 30, 2011 was due primarily to decreased wholesale sales of our William Rast apparel line in the United States. In the first quarter of 2011 in response to slow denim sales in 2010, we launched a newly designed American-made William Rast denim and expanded sportswear collection estimated to reach our retail stores in July 2011 and our wholesale customers in Fall 2011. In the first half of 2011, wholesale sales of our William Rast apparel line were negatively impacted as our customers did not purchase consistent quantities of our existing products in anticipation of the arrival of our newly designed product line, resulting in a decrease in sales for the first half of 2011 compared to the first half of 2010. The decrease in wholesale revenue for the first half of 2011 was also due to revenue received from Sony Electronics in the first quarter of 2010 in accordance with our sponsorship agreement related to our William Rast fashion show held in February 2010. We did not hold a fashion show in the first quarter of 2011, and as a result, did not receive sponsorship revenue or incur the related costs. The decrease in wholesale revenue for the second half of 2011 was also due to nonrecurring revenue received from the Target Corporation in the second quarter of 2010 in accordance with the design and license agreement we entered into in May 2010 related to exclusive collection of William Rast products that were sold for a limited time in Target stores throughout the United States at the end of 2010. The decrease in wholesale net revenue for the six months ended June 30, 2011 was offset by an increase in retail sales of our William Rast apparel line for the six months ended June 30, 2011and by licensing revenue received under the terms of our William Rast eyewear licensing agreement in the second quarter of 2011. Based on the reception our new William Rast denim collection has received in the marketplace, we anticipate that our net revenue for the remainder of the year will improve as compared to our net revenue for the six months ended June 30, 2011.
Gross Profit
|
Six Months
Ended
June 30, 2011
|
Six Months
Ended
June 30, 2010
|
Percent
Change
|
||||||||||
|
Gross Profit
|
$ | 934,276 | $ | 5,700,738 | (83.6 | )% | ||||||
As a percentage of net revenue, our gross margin from continuing operations decreased to 21.3% for the six months ended June 30, 2011 from 52.2% for the six months ended June 30, 2010. The decrease in wholesale gross profit as a percentage of net revenue was primarily due to lower margins achieved in off-price sales of our William Rast products in an effort to reduce our remaining William Rast inventory in anticipation of our newly designed American-made William Rast denim line and expanded sportswear collection. The decrease in wholesale gross profit as a percentage of net revenue was also due to revenue received from the Target Corporation in the second quarter of 2010 in accordance with the design and license agreement we entered into in May 2010 related to exclusive collection of William Rast products that were sold for a limited time in Target stores throughout the United States at the end of 2010, and advertising revenue received in accordance with our sponsorship agreement with Sony Electronics in the first quarter of 2010. There was no cost of revenue associated with the Target design and licensing revenue and the Sony advertising revenue, which resulted in an increase in wholesale gross profit as a percentage of net revenue during the six months ended June 30, 2010. In order to boost overall sales in our retail stores during the first half of 2011, we increased the number of select sale items during the period. This resulted in a decrease in retail gross margin during the six months ended June 30, 2011 compared to the six months ended June 30, 2010.
33
Selling, Design and Production Expenses
|
Six Months
Ended
June 30, 2011
|
Six Months
Ended
June 30, 2010
|
Percent
Change
|
||||||||||
|
Selling, design and production expenses
|
$ | 2,843,781 | $ | 3,770,039 | (24.6 | )% | ||||||
The decrease in selling, design and production expenses from continuing operations for the six months ended June 30, 2011 is primarily attributable to our William Rast fashion show held in February 2010. We did not hold a fashion show in the first quarter of 2011, and as a result, did not incur the related costs. The decrease in selling, design and production expenses from continuing operations for the six months ended June 30, 2011 was also due to decreased design and production salaries incurred in the second half of 2011 as a result of cost cutting measures implemented to decrease expenditures. The decrease in selling, design and production expenses from continuing operations was offset by increased promotion and marketing of our William Rast brand through our Indy car sponsorship in the second quarter of 2011. As a percentage of net revenue, selling, design and production expense increased to 64.8% for the six months ended June 30, 2011 compared to 34.5% for the six months ended June 30, 2010. The increase in selling, design and production expenses as a percentage of net revenue for the six months ended June 30, 2011 was due to net revenue decreasing at a higher rate than selling, design and production expenses.
General and Administrative Expenses
|
Six Months
Ended
June 30, 20111
|
Six Months
Ended
June 30, 2010
|
Percent
Change
|
||||||||||
|
General and administrative expenses
|
$ | 3,586,785 | $ | 3,123,060 | 14.8 | % | ||||||
As a percentage of net revenue, general and administrative expenses from continuing operations increased to 81.7% for the six months ended June 30, 2011 from 28.6% for six months ended June 30, 2010. The increase in general and administrative expenses during the six months ended June 30, 2011 was primarily due to increased retail store costs, increased professional fees and a bonus paid to our Chief Executive Officer, Colin Dyne, in February 2011. We had four retail stores open during the six months ended June 30, 2011, compared to three stores that were opened during the six months ended June 30, 2010. The increase in general and administrative expenses from continuing operations for the six months ended June 30, 2011 was offset by decreased administrative salaries incurred in the first half of 2011 as a result of cost cutting measures implemented to decrease expenditures.
Interest Expense
|
Six Months
Ended
June 30, 2011
|
Six Months
Ended
June 30, 2010
|
Percent
Change
|
||||||||||
|
Interest Expense
|
$ | 69,938 | $ | 94,779 | (26.2 | )% | ||||||
34
Our William Rast factor agreement provides that we can borrow an amount up to 75% of the value of our approved factored customer invoices. We can also borrow up to 50% of our eligible inventory (as defined in the agreement) up to a maximum of $875,000. Under our J. Lindeberg factoring arrangement (prior to the sale of our 50% membership interest in J. Lindeberg USA on April 26, 2011) we were able to borrow up to 85% on our factored accounts receivable and 50% on our eligible inventories. Maximum borrowings, including borrowings related to factored accounts receivable and inventory, related to our J. Lindeberg facility were not to exceed $1.5 million. Our J. Lindeberg factoring facility was amended on February 2, 2011, which amendment included a reduction of the advance rate on eligible accounts receivable from 85% to 75%. Under the amended facility, maximum borrowings remained at $1.5 million. Outstanding borrowings under our factoring arrangements amounted to approximately $481,000 and $3.0 million at June 30, 2011 and 2010, respectively. The decrease in interest expense is due to an average decrease in borrowings under our factoring arrangements during the six months ended June 30, 2011, offset by interest payable at a rate of 8% under the terms of a $750,000 promissory note entered into in August 2010.
Provision for Income Tax
|
Six Months
Ended
June 30, 2011
|
Six Months
Ended
June 30, 2010
|
Percent
Change
|
||||||||||
|
Provision for Income Tax
|
$ | 974,000 | $ | 19,890 | * | |||||||
|
* Not meaningful
|
||||||||||||
The provision for income taxes for the six months ended June 30, 2011 represents the minimum tax payments due for state and local purposes, including gross receipts tax on sales generated by our limited liability companies, estimated Federal and state taxes due at statutory effected tax rates and an increase in the valuation allowance provided for our deferred tax asset related to net operating loss carryforwards. The provision for income taxes for the six months ended June 30, 2010 represents the minimum tax payments due for state and local purposes, including gross receipts tax on sales generated by our limited liability companies. A provision for Federal income taxes was not recorded for the six months ended June 30, 2010, as we had a net loss during the period. As of June 30, 2011, a valuation allowance has been provided for the entire amount of our deferred income tax asset related to net operating loss carryforwards, factored accounts receivable and bad debt reserves and other reserves. At this time, we cannot determine that it is more likely than not that we will realize the entire balance of the future income tax benefits related to our net operating losses. As of December 31, 2010, total net operating losses available to carry forward to future periods amounted to approximately $8.6 million. As of June 30, 2010, a valuation allowance was provided for all of our deferred income tax assets related to net operating loss carryforwards, factored accounts receivable and bad debt reserves and other reserves. The increase in the provision for income taxes recorded for the six months ended June 30, 2011, compared to the six months ended June 30, 2010 resulted from an increase in the valuation allowance provided for our deferred tax asset related to net operating loss carryforwards recorded during the six months ended June 30, 2011.
Net Loss from Continuing Operations
|
Six Months
Ended
June 30, 2011
|
Six Months
Ended
June 30, 2010
|
Percent
Change
|
||||||||||
|
Net loss from continuing operations
|
$ | (3,026,690 | ) | $ | (1,307,030 | ) | 131.6 | % | ||||
35
The increase in net loss from continuing operations incurred for the six months ended June 30, 2011 compared to the six months ended June 30, 2010 is due primarily to decreased net revenue and gross margin and an increase in the provision for income taxes recorded during the second quarter of 2011, offset by a net decrease in operating expenses, as discussed above. The increase in net loss from continuing operations incurred for the six months ended June 30, 2011 compared to the six months ended June 30, 2010 was also offset by the settlement of our litigation with Charlotte Russe, as further described elsewhere in this report, during the first quarter of 2011.
Noncontrolling Interest from Continuing Operations
|
Six Months
Ended
June 30, 2011
|
Six Months
Ended
June 30, 2010
|
Percent
Change
|
||||||||||
|
Noncontrolling Interest from continuing operations
|
$ | 2,764,390 | $ | 677,747 | 307.9 | % | ||||||
Noncontrolling interest in continuing operations recorded for the six months ended June 30, 2011 and 2010 represents net loss allocations to Tennman WR-T, Inc., a member of William Rast Sourcing and William Rast Licensing. Beginning January 1, 2009, losses are allocated to the members of William Rast Sourcing and William Rast Licensing based on their respective percentage interests in such entities and profits are allocated to the members based on their percentage interest to the extent that the member was previously allocated losses. The increase in noncontrolling interest recorded for the six months ended June 30, 2011 compared to the six months ended June 30, 2010 was due primarily to increased loss allocations to Tennman during the six months ended June 30, 2011, compared to the six months ended June 30, 2010.
Discontinued Operations
Discontinued Operations
|
Six Months
Ended
June 30, 2011
|
Six Months
Ended
June 30, 2010
|
Percent
Change
|
||||||||||
|
Net income (loss) from discontinued operations
|
$ | (125,771 | ) | $ | (210,548 | ) | * | |||||
|
Gain on sale of member interest in subsidiary
|
2,012,323 | - | ||||||||||
| 1,886,552 | (210,548 | ) | ||||||||||
|
Noncontrolling interest in discontinued operations
|
62,885 | 105,275 | ||||||||||
| $ | 1,949,437 | $ | (105,273 | ) | ||||||||
|
* Not meaningful
|
||||||||||||
Net loss from discontinued operations for the period ended June 30, 2011 represents the results of operations of our J. Lindeberg subsidiary from the beginning of the year through the date of the sale of our 50% member interest in J. Lindeberg, USA on April 26, 2011. Net loss from discontinued operations for the six months ended June 30, 2010 represents the results of operations of our J. Lindeberg subsidiary from the beginning of the year through June 30, 2010. The gain on the sale of member interest in subsidiary is further described in Note 9 to this report.
36
Net Income (Loss) Attributable to Common Stockholders
|
Six Months
Ended
June 30, 2011
|
Six Months
Ended
June 30, 2010
|
Percent
Change
|
||||||||||
|
Net income (loss) attributable to common stockholders
|
$ | 1,687,137 | $ | (734,556 | ) | * | ||||||
|
* Not meaningful
|
||||||||||||
The net income attributable to common shareholders for the six months ended June 30, 2011 compared to the net loss attributable to common shareholders incurred for the six months ended June 30, 2011 is due primarily to the settlement of our litigation with Charlotte Russe, as further described elsewhere in this report, during the first quarter of 2011 and the gain on the sale of our 50% member interest in J. Lindeberg, USA, also discussed elsewhere in this report. The increase in net income attributable to common shareholders was offset by a decrease in net revenue and gross margin during the period and an increase in the provision for income taxes recorded during the second quarter of 2011.
Liquidity and Capital Resources
As of June 30, 2011, we had cash and cash equivalents of approximately $661,000, a working capital deficit of approximately $2.5 million, and approximately $214,000 of availability from our factors. As of June 30, 2011, net advances from our factors, net of matured funds, totaled approximately $481,000. As of June 30, 2010, we had cash and cash equivalents of approximately $1.0 million, working capital of approximately $1,000, and approximately $1.0 million of availability from our factor. As of June 30, 2010, advances from our factor totaled approximately $3.0 million.
Sources and Uses of Cash
Cash Received from the Sale of our 50% Member Interest in J. Lindeberg USA
On April 26, 2011, we completed the sale of Bella Rose’s 50% member interest in J. Lindeberg USA to J. Lindeberg USA Corp. pursuant to the terms of a Unit Purchase Agreement entered into by the parties on April 7, 2011. In consideration for Bella Rose’s 50% member interest in Lindeberg USA, J. Lindeberg USA Corp. agreed to pay us an aggregate of $1,650,000, of which $900,000 was paid upon the closing of the transaction and $750,000 is payable on the six month anniversary of the closing of the transaction.
As a result of the sale of our 50% interest in J. Lindeberg USA, we anticipate a decrease in future sales of both our wholesale and retail divisions. We also anticipate a reduction in direct operating expenses related to the J. Lindeberg brand in future periods.
Cash Received from the Sale of our Receivable due from J. Lindeberg USA Corp.
On June 24, 2011, we and our wholly-owned subsidiary, Bell Rose, LLC, entered into an asset purchase agreement with Monto Holding (Pty) Limited (“Monto”). Pursuant to the agreement, Bella Rose sold to Monto without recourse the $750,000 receivable owed to us under the terms of the Unit Purchase Agreement discussed above. On June 24, 2011, we also issued a fully vested, five year warrant to Monto to purchase 3,750,000 shares of our Common Stock at an exercise price of $0.20 per share. In exchange for the rights to the receivable and the warrant, Monto paid a purchase price of $722,916.
37
Cash Received from our Settlement with Charlotte Russe
On February 3, 2011, we (along with the other parties to the litigation) settled our litigation with Charlotte Russe Holding, Inc. Pursuant to the settlement, we received $3.5 million, after the distribution of amounts owed under the terms of an asset purchase agreement, as described elsewhere in this report, and the payment of legal fees and expenses. We also received proceeds of $750,000 in the third quarter of 2010 relating to the litigation in connection with an asset purchase agreement, for total proceeds related to the litigation of $4.3 million. The settlement included the dismissal with prejudice of all claims pending between the parties as well as mutual releases, without any admission of liability or wrongdoing by any of the parties to the actions.
Factoring Agreements
Pursuant to the terms of our factoring agreements, our factors purchase our eligible accounts receivable and assume the credit risk with respect to those accounts for which the factors have given their prior approval. If the factors do not assume the credit risk for a receivable, the collection risk associated with the receivables remains with us.
On October 7, 2010, William Rast Sourcing entered into a factoring agreement with Rosenthal & Rosenthal, Inc. Our William Rast factor agreement provides that we can borrow an amount up to 75% of the value of approved factored customer invoices. We can also borrow up to 50% of eligible inventory (as defined in the agreement) up to a maximum of $875,000. The factor commission is 0.75% of the customer invoice amount and interest is charged on accounts receivable and inventory advances at prime plus 1.5% and prime plus 2.5%, respectively. The factor facility is secured by substantially all of the assets of William Rast Sourcing, a security interest granted by William Rast Licensing in certain royalties payable to William Rast Licensing, and is guaranteed by certain of our other consolidated entities and is personally guaranteed by Colin Dyne, the Chief Executive Officer of People’s Liberation and Manager of William Rast, up to a maximum of $1 million.
Beginning July 28, 2008 through April 26, 2011, our subsidiary, J. Lindeberg USA, entered into various factoring arrangements with FTC Commercial Corp ("FTC"). The most recent agreement provided that FTC may make factoring advances to J. Lindeberg of up to 75% of the purchase price of all accounts purchased by FTC and interest was charged with respect to advances from the greater of 5.5% per annum or prime plus 1% to the greater of 7.0% per annum or prime plus 1%. Under the terms of the most recent factoring agreement, we could also borrow up to 50% of our eligible inventory (as defined in the agreement). Maximum borrowings, including borrowings related to factored accounts receivable and inventory, related to the facility were not to exceed $1.5 million. The factor commission was 0.8% of the customer invoice amount for terms up to 60 days, plus one quarter of one percent (.25%) for each additional thirty-day term. The factor facility was secured by substantially all of the assets of J. Lindeberg and, through April 26, 2011, was guaranteed by our related entities, People’s Liberation, Inc., Bella Rose, LLC, and Versatile Entertainment, Inc. As a result of the sale of our 50% member interest in J. Lindeberg USA on April 26, 2011, the guarantees of our related entities were released by FTC and our interest in the factoring facility with FTC was terminated.
As of June 30, 2011 and 2010, total factored accounts receivable included in due to factor amounted to approximately $312,000 and $3.1 million, respectively. Outstanding advances, net of matured funds, amounted to approximately $481,000 and $3.0 million as of June 30, 2011 and 2010, respectively, and are included in the due from factor balance.
38
Future Capital Requirements
For the six months ended June 30, 2011, we recorded a loss from continuing operations of approximately $3.0 million and utilized cash in continuing operations of $2.0 million. As of June 30, 2011, we had cash and cash equivalents of approximately $661,000, a working capital deficit of approximately $2.5 million, and approximately $214,000 of availability from our factors. We intend to raise funds to finance operations, through strategic transactions with our partners or from traditional financing sources, until we are able to achieve positive cash flows from operations. Our capital requirements for the next twelve months, as they relate to the production of our products, will continue to be significant.
The extent of our future capital requirements will depend on many factors, including our results of operations. We may also need to raise additional capital if our working capital requirements or capital expenditures are greater than we expect or if we expand our business by acquiring or investing in additional brands. There can be no assurance that additional debt or equity financing will be available on acceptable terms or at all, especially given the economic conditions that currently prevail.
In addition, any additional equity funding may result in significant dilution to existing stockholders, and, if we raise debt financing, a substantial portion of our operating cash flow may be dedicated to the payment of principal and interest on such indebtedness, thus limiting funds available for our business activities. If adequate funds are not available to satisfy our capital requirements, we may be required to delay or curtail significantly our business activities. This would have a material adverse effect on our business, financial condition and/or results of operations, and could ultimately cause us to have to cease operations.
Cash Flows from Continuing Operations
Cash flows from continuing operations for operating, investing and financing activities for the six months ended June 30, 2011 and 2010 are summarized in the table below.
|
Six Months
Ended June 30,
|
||||||||
|
Activity:
|
2011
|
2010
|
||||||
|
Operating activities
|
$ | (2,013,193 | ) | $ | (768,668 | ) | ||
|
Investing activities
|
718,360 | (163,297 | ) | |||||
| $ | (1,294,833 | ) | $ | (931,965 | ) | |||
Operating Activities
Net cash used in operating activities from continued operations was approximately $2.0 million for the six months ended June 30, 2011 and $769,000 for the six months ended June 30, 2010. Net cash used in operating activities from continued operations for the six months ended June 30, 2011 was primarily a result of our net loss of approximately $1.0 million and decreased accounts payable and accrued expenses, offset by decreased accounts receivable. Net cash used in operating activities from continued operations for the six months ended June 30, 2010 was primarily a result of a net loss of approximately $1.5 million and increased receivables and inventories, offset by increased accounts payable and accrued expenses.
39
Investing Activities
Net cash provided by investing activities from continued operations was approximately $718,000 for the six months ended June 30, 2011 and net cash used in investing activities was approximately $163,000 for the six months ended June 30, 2010. Net cash provided by investing activities from continued operations for the six months ended June 30, 2011 consisted primarily of proceeds received from the sale of a receivable resulting from the sale of our member interest in J. Lindeberg, USA and a decrease in restricted cash, offset by capital expenditures. On June 24, 2011, we entered into an asset purchase agreement with Monto Holding (Pty) Limited (“Monto”). Pursuant to the agreement, we sold to Monto without recourse the $750,000 receivable owed to us under the terms of the unit purchase agreement we entered into for the sale of our membership interest in J. Lindeberg, USA, as described elsewhere in this report. On June 24, 2011, we also issued a fully vested, five year warrant to Monto to purchase 3,750,000 shares of our Common Stock at an exercise price of $0.20 per share. In exchange for the rights to the receivable and the warrant, Monto paid us a purchase price of $722,916. Net cash used in investing activities from continued operations for the six months ended June 30, 2010 primarily consisted of an increase in capital expenditures for computer equipment, leasehold improvements and furniture and fixtures for our new retail store locations, and expenditures for our tradeshow booth.
Contractual Obligations and Off-Balance Sheet Arrangements
The following summarizes our contractual obligations at June 30, 2011 and the effects such obligations are expected to have on liquidity and cash flows in future periods:
|
Payments Due by Period
|
||||||||||||||||||||
|
Less than
|
1-3 | 4-5 |
After
|
|||||||||||||||||
|
Contractual Obligations
|
Total
|
1 Year
|
Years
|
Years
|
5 Years
|
|||||||||||||||
|
Operating leases
|
$ | 8,651,923 | $ | 1,582,617 | $ | 3,280,163 | $ | 1,896,431 | $ | 1,892,712 | ||||||||||
|
Note payable to related party
|
750,000 | 750,000 | - | - | - | |||||||||||||||
|
Consulting and endorsement agreements
|
1,408,000 | 549,000 | 859,000 | - | - | |||||||||||||||
|
Total
|
$ | 10,809,923 | $ | 2,881,617 | $ | 4,139,163 | $ | 1,896,431 | $ | 1,892,712 | ||||||||||
At June 30, 2011, approximately $35,000 of the Company’s cash is held as collateral to secure its credit card facility.
At June 30, 2011 and 2010, we did not have any relationships with unconsolidated entities or financial partnerships, such as entities often referred to as structured finance or special purpose entities, which would have been established for the purpose of facilitating off-balance sheet arrangements or other contractually narrow or limited purposes. As such, we are not exposed to any financing, liquidity, market or credit risk that could arise if we had engaged in such relationships.
Factored accounts receivable may subject us to off-balance sheet risk. We sell the majority of our trade accounts receivable to a factor and are contingently liable to the factor for merchandise disputes, other customer claims and invoices that are not credit approved by the factor. From time to time, our factor also issues letters of credit and vendor guarantees on our behalf. There were no outstanding letters of credit or vendor guarantees as of June 30, 2011 and 2010. Ledger debt (payables to suppliers that use the same factor as the Company) amounted to approximately $26,000 and $1.4 million and at June 30, 2011 and 2010, respectively.
40
|
Item 3.
|
Quantitative and Qualitative Disclosures About Market Risk
|
Not required.
|
Item 4.
|
Controls and Procedures
|
Evaluation of Controls and Procedures
Members of the our management, including our Chief Executive Officer, Colin Dyne, and our Chief Financial Officer, Patrick Chow, have evaluated the effectiveness of our disclosure controls and procedures, as defined by paragraph (e) of Exchange Act Rules 13a-15 or 15d-15, as of June 30, 2011, the end of the period covered by this report. Based upon that evaluation, Mr. Dyne and Mr. Chow concluded that our disclosure controls and procedures were effective as of June 30, 2011.
Changes in Internal Control Over Financial Reporting
There were no changes in our internal control over financial reporting or in other factors identified in connection with the evaluation required by paragraph (d) of Exchange Act Rules 13a-15 or 15d-15 that occurred during the second quarter ended June 30, 2011 that have materially affected, or are reasonably likely to materially affect, our internal control over financial reporting.
PART II
OTHER INFORMATION
Item 1A. Risk Factors
Cautionary Statements and Risk Factors
This Quarterly Report on Form 10-Q contains forward-looking statements, which are subject to a variety of risks and uncertainties. Our actual results could differ materially from those anticipated in those forward-looking statements as a result of various factors, including those set forth herein and in our Annual Report on Form 10-K for the year ended December 31, 2010. There have been no material changes to such risk factors during the six months ended June 30, 2011.
41
Item 6. Exhibits
The following exhibits are filed as part of this report:
|
Exhibit
Number
|
Exhibit Title
|
|
|
10.1
|
Asset Purchase Agreement dated June 24, 2011 by and between Monto Holdings (Pty) Ltd and People’s Liberation, Inc. and its wholly-owned subsidiary, Bella Rosa, LLC.
|
|
|
10.2
|
Form of Common Stock Purchase Warrant issued to Monto Holdings (Pty) Ltd. dated June 24, 2011
|
|
|
31.1
|
Certification of Principal Executive Officer pursuant to Securities Exchange Act Rules 13a-14(a) and 15d-14(a) as adopted pursuant to section 302 of the Sarbanes-Oxley Act of 2002.
|
|
|
31.2
|
Certification of Principal Financial Officer pursuant to Securities Exchange Act Rules 13a-14(a) and 15d-14(a) as adopted pursuant to section 302 of the Sarbanes-Oxley Act of 2002.
|
|
|
32.1
|
|
Certification of Principal Executive Officer and Principal Financial Officer pursuant to 18 U.S.C. Section 1350, as adopted pursuant to section 906 of the Sarbanes-Oxley Act of 2002.
|
|
101.INS**
|
XBRL Instance Document
|
||
|
101.SCH**
|
XBRL Taxonomy Extension Schema Document
|
||
|
101.CAL**
|
XBRL Taxonomy Extension Calculation Linkbase Document
|
||
|
101.DEF**
|
XBRL Taxonomy Extension Definition Linkbase Document
|
||
|
101.LAB**
|
XBRL Taxonomy Extension Label Linkbase Document
|
||
|
101.PRE**
|
XBRL Taxonomy Extension Presentation Linkbase Document
|
||
|
**
|
XBRL information is furnished and not filed or a part of a registration statement or prospectus for purposes of sections 11 or 12 of the Securities Act of 1933, as amended, is deemed not filed for purposes of section 18 of the Securities Exchange Act of 1934, as amended, and otherwise is not subject to liability under these sections.
|
42
SIGNATURES
Pursuant to the requirements of Section 13 or 15(d) of the Securities Exchange Act of 1934, as amended, the Registrant caused this report to be signed on its behalf by the undersigned, thereunto duly authorized.
|
PEOPLE’S LIBERATION, INC.
|
|
|
Date: August 17, 2011
|
/s/ Patrick Chow
|
|
By: Patrick Chow
|
|
|
Its: Chief Financial Officer (Principal Financial
and Accounting Officer)
|
43