Attached files
| file | filename |
|---|---|
| EX-99.3 - EX-99.3 - ROSETTA STONE INC | a11-23606_2ex99d3.htm |
| EX-99.1 - EX-99.1 - ROSETTA STONE INC | a11-23606_2ex99d1.htm |
| 8-K - 8-K - ROSETTA STONE INC | a11-23606_28k.htm |
Exhibit 99.2
|
|
Second Quarter Results August 4, 2011 |

|
|
Our presentation today contains forward-looking statements about our plans for development and release of new products and for business expansion, as well as other subjects. These statements relate to future events and involve known and unknown risks and uncertainties that may cause our actual results to be materially different from those expressed or implied by these forward-looking statements. You should not place undue reliance on forward-looking statements because they involve factors that are, in some cases, beyond our control and that could materially affect actual results, levels of activity, performance, or achievements. Factors that could materially affect actual results include those listed under the caption “Risk Factors” of Rosetta Stone’s Form 10-K for the year ended December 31, 2010. We encourage you to review those factors before making any investment decision. Today’s presentation and discussion reflect our views as of August 4, 2011, and Rosetta Stone assumes no duty to update the information. Today’s presentation and discussion also contains references to non-GAAP financial measures. The full definition and reconciliation of those measures is available in our Form 8-K filed with the SEC on August 4, 2011. Management uses these non-GAAP measures to compare the company's performance to that of prior periods for trend analyses, for purposes of determining executive incentive compensation, and for budgeting and planning purposes. Management believes that the use of these non-GAAP financial measures provides an additional tool for investors to use in evaluating ongoing operating results and trends. Our definitions of non-GAAP measures may not be comparable to the definitions used by other companies, and we encourage you to review and understand all our financial reporting before making any investment decision. Reminder |
|
|
Tom Adams President and CEO August 4, 2011 |
|
|
Rosetta Stone’s Strategy for Growth |

|
|
Second-quarter Overview Financial results slightly ahead of our expectations Strong international growth Institutional stronger than expected Headwinds from US government budget cuts Progress in US consumer initiatives Several new offerings in the market Strong balance sheet |
|
|
Rosetta Stone ReFLEXTM |

|
|
Key Objectives for 2011 Objective Actions to Date Next Steps US Consumer repositioning Segment marketing and product New pricing Hispanic advertising launched Further segmented marketing Brand elevation and renewal “More than Words” ad running Developing new ad campaigns Brand identity development Rationalized distribution and new delivery platforms iPad app launched Closed net 56 kiosks in H1 Five new languages, online-only Negotiate retail relationships Testing campaigns to drive greater online purchases Rationalized cost structure Executed savings plan to hold G&A expenses level 2H11 vs. 1H11 Conversational English for Asia Soft launch Q3 Full marketing launch August 8 New market entries Brazil office opened China country manager hired China strategy development Institutional expansion and development Brazil institutional wins Signing more $20k+ deals Renew US Army contract Continue strategic selling Leverage opportunities to do business with sections of US Army |
|
|
Steve Swad Chief Financial Officer August 4, 2011 |

|
|
Bookings(1) and Operating EBITDA(2) $M $M Trailing Twelve Months Second Quarter “Bookings” are defined as executed sales contracts received by company that are recorded immediately either as revenue or as deferred revenue. “Operating EBITDA” equals GAAP net income or loss plus interest expense, income tax expense, depreciation, amortization, stock-based compensation expenses and change in deferred revenue. Second Quarter Trailing Twelve Months $M 64.0 667 10.9 (1.6) 2Q10 2Q11 $M 278.2 277.4 57.6 12.8 Bookings operation EBITDA TTM end 6/30/10 TTM end 6/30/11 Bookings Operating EBITDA |
|
|
International represents significant opportunity $M Trailing Twelve Months Second Quarter $M International Consumer Bookings |
|
|
Growing institutional business $M Trailing Twelve Months Second Quarter $M Worldwide Institutional Bookings |
|
|
Reaching U.S. consumers $M Trailing Twelve Months Second Quarter $M US Consumer Sales Bookings |
|
|
Revenue and Net Income $M Second Quarter $M Trailing Twelve Months |
|
|
Deferred Revenue $M |
|
|
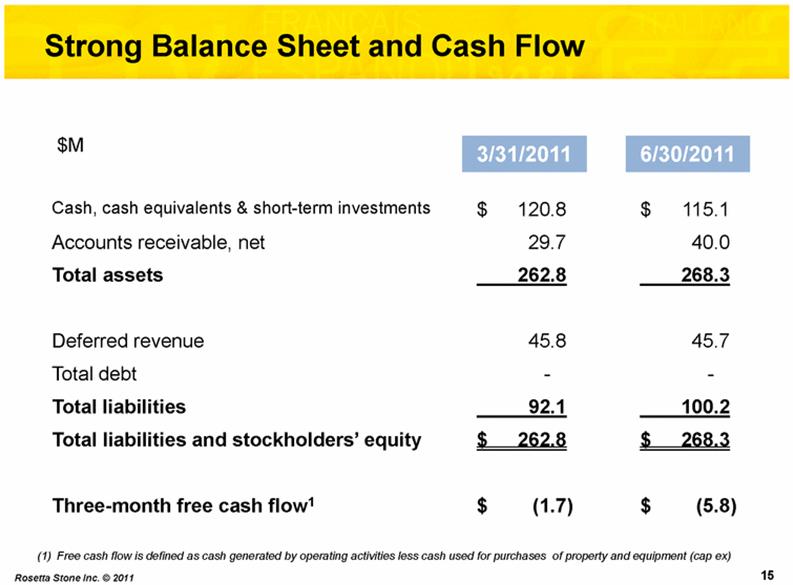
Strong Balance Sheet and Cash Flow 3/31/2011 6/30/2011 Cash, cash equivalents & short-term investments $ 120.8 $ 115.1 Accounts receivable, net 29.7 40.0 Total assets 262.8 268.3 Deferred revenue 45.8 45.7 Total debt - - Total liabilities 92.1 100.2 Total liabilities and stockholders’ equity $ 262.8 $ 268.3 Three-month free cash flow1 $ (1.7) $ (5.8) $M Free cash flow is defined as cash generated by operating activities less cash used for purchases of property and equipment (cap ex) 15 |
|
|
Financial Outlook – Q3 2011 3Q11 Guidance Sales bookings1 $70M to $75M US Consumer – 12 - 17% Worldwide Institutional – 10 - 0% International Consumer + 40 - 60% Revenue $65M to $70M Net Loss $(5)M to $(1)M Loss per share (24)¢ to (5)¢ Operating EBITDA2 $2M to $7M Free cash flow3 positive Basic shares outstanding 20.7M 1.“Sales bookings” are defined as executed sales contracts received by company that are recorded immediately either as revenue or as deferred revenue. 2. “Operating EBITDA” equals GAAP net income or loss plus interest expense, income tax expense, depreciation, amortization, stock-based compensation expenses and change in deferred revenue. 3. “Free cash flow” is defined as cash provided by operations less cash used for purchases of property and equipment. |
|
|
Financial Outlook – FY2011 Consistent with prior expectations Growth in total sales bookings1 versus 2010 Growth of 40 to 50% in combined sales bookings from international consumer and worldwide institutional consumers Lower sales bookings from US consumers Growth in total revenue versus 2010 Lower operating income and Operating EBITDA2 versus 2010 attributable to lower contribution from US consumer sales and continued investment in international opportunities; with positive Operating EBITDA Positive free cash flow in 2011 “Sales bookings” are defined as executed sales contracts received by company that are recorded immediately either as revenue or as deferred revenue. “Operating EBITDA” equals GAAP net income or loss plus interest expense, income tax expense, depreciation, amortization, stock-based compensation expenses and change in deferred revenue. |