Attached files
| file | filename |
|---|---|
| EX-24.1 - EXHIBIT 24.1 - ROSETTA STONE INC | a2202364zex-24_1.htm |
| EX-21.1 - EXHIBIT 21.1 - ROSETTA STONE INC | a2202364zex-21_1.htm |
| EX-31.1 - EXHIBIT 31.1 - ROSETTA STONE INC | a2202364zex-31_1.htm |
| EX-31.2 - EXHIBIT 31.2 - ROSETTA STONE INC | a2202364zex-31_2.htm |
| EX-32.1 - EXHIBIT 32.1 - ROSETTA STONE INC | a2202364zex-32_1.htm |
| EX-23.1 - EXHIBIT 23.1 - ROSETTA STONE INC | a2202364zex-23_1.htm |
| EX-32.2 - EXHIBIT 32.2 - ROSETTA STONE INC | a2202364zex-32_2.htm |
| EX-10.19 - EXHIBIT 10.19 - ROSETTA STONE INC | a2202364zex-10_19.htm |
Use these links to rapidly review the document
TABLE OF CONTENTS
INDEX TO CONSOLIDATED FINANCIAL STATEMENTS
UNITED STATES
SECURITIES AND EXCHANGE COMMISSION
Washington, D.C. 20549
Form 10-K
ANNUAL REPORT PURSUANT TO SECTION 13 OR 15(d)
OF THE SECURITIES EXCHANGE ACT OF 1934
For the fiscal year ended December 31, 2010
Commission file number: 1-34283
Rosetta Stone Inc.
(Exact name of registrant as specified in its charter)
| Delaware (State of incorporation) |
043837082 (I.R.S. Employer Identification No.) |
|
1919 North Lynn St., 7th Fl, Arlington, Virginia (Address of principal executive offices) |
22209 (Zip Code) |
Registrant's
telephone number, including area code:
800-788-0822
Securities Registered Pursuant to Section 12(b) of the Act:
| Title of Each Class | Name of Each Exchange on Which Registered | |
|---|---|---|
| Common Stock, par value $0.00005 per share | New York Stock Exchange |
Securities
Registered Pursuant to Section 12(g) of the Act:
None
Indicate by check mark if the registrant is a well-known seasoned issuer, as defined in Rule 405 of the Securities Act. Yes o No ý
Indicate by check mark if the registrant is not required to file reports pursuant to Section 13 or 15(d) of the Act. Yes o No ý
Indicate by check mark whether the registrant (1) has filed all reports required to be filed by Section 13 or 15(d) of the Securities Exchange Act of 1934 during the preceding 12 months (or for such shorter period that the registrant was required to file such reports) and (2) has been subject to such filing requirements for the past 90 days. Yes ý No o
Indicate by check mark whether the registrant has submitted electronically and posted on its corporate Web site, if any, every Interactive Data File required to be submitted and posted pursuant to Rule 405 of Regulation S-T (§ 232.405 of this chapter) during the preceding 12 months (or for such shorter period that the registrant was required to submit and post such files). Yes o No o
Indicate by check mark if disclosure of delinquent filers pursuant to Item 405 of Regulation S-K is not contained herein, and will not be contained, to the best of the registrant's knowledge, in definitive proxy or information statements incorporated by reference in Part III of this Form 10-K or any amendment to this Form 10-K. ý
Indicate by check mark whether the registrant is a large accelerated filer, an accelerated filer, a non-accelerated filer, or a smaller reporting company. See the definitions of "large accelerated filer," "accelerated filer" and "smaller reporting company" in Rule 12b-2 of the Exchange Act. (Check one):
| Large Accelerated filer o | Accelerated filer ý | Non-accelerated filer o (Do not check if a smaller reporting company) |
Smaller reporting company o |
Indicate by check mark whether the registrant is a shell company (as defined in Rule 12b-2 of the Act). Yes o No ý
The aggregate market value of the common stock held by non-affiliates of the registrant was approximately $261 million as of June 30, 2010 (based on the last sale price of such stock as quoted on the New York Stock Exchange).
As of February 16, 2011, there were 20,979,574 shares of common stock outstanding.
Documents incorporated by reference: Portions of the definitive Proxy Statement to be delivered to stockholders in connection with the 2011 Annual Meeting of Stockholders to be held on May 26, 2011 are incorporated by reference into Part III.
2
CAUTIONARY STATEMENT REGARDING FORWARD-LOOKING STATEMENTS
This Annual Report on Form 10-K contains forward-looking statements within the meaning of the federal securities laws. These forward-looking statements include, but are not limited to, statements regarding: our business strategies; information regarding our future financial performance; our projected plans and objectives; our development of new products including an English remediation solution; international expansion and our development of a business model to drive growth; the sufficiency of our cash flows from operations and available sources of funds; the impact of inflation on our financial position and results of operations; the effect of state tax law examination on our results of operations and financial position; our technology and product development initiatives; and our intellectual property strategy. These forward-looking statements are subject to risks and uncertainties that could cause actual results and events to differ. A detailed discussion of these and other risks and uncertainties that could cause actual results and events to differ materially from such forward-looking statements is included throughout this filing and particularly in Item 1A: "Risk Factors" section set forth in this Annual Report on Form 10-K. All forward-looking statements included in this document are based on information available to us on the date hereof, and we assume no obligation to revise or publicly release any revision to any such forward-looking statement, except as may otherwise be required by law.
Overview
We are a leading provider of technology-based language learning solutions. We develop, market and sell language learning solutions consisting of software, online services and audio practice tools primarily under our Rosetta Stone brand. Our teaching method, which we call Dynamic Immersion, is designed to leverage the innate, natural language learning ability that children use to learn their native language. Our courses are based on our proprietary interactive technologies and pedagogical content, and utilize a sophisticated sequencing of images, text and sounds to teach a new language without translation or grammar explanation. We believe our award-winning solutions provide an effective, convenient and fun way to learn languages. We currently offer our self-study language learning solutions in 34 languages. Our customers include individuals, educational institutions, armed forces, government agencies and corporations.
People throughout the world seek to learn foreign languages for a variety of reasons, including to learn about other cultures, to communicate with friends and family, to enhance their career prospects, to travel internationally and to obtain personal enjoyment and enrichment.
The strength and breadth of our solutions have allowed us to develop a business model that we believe distinguishes us from other language learning companies. Our scalable technology platform and our proprietary content can be deployed across many languages, which have enabled us to cost-effectively develop a broad product portfolio. We have a multi-channel marketing and distribution strategy that directly targets customers, utilizing print, online, television and radio advertising, public relations initiatives and our branded kiosks. Approximately 82% of our revenue in 2010 was generated through our direct sales channels, which include our call centers, websites, institutional sales force and kiosks. We also distribute our solutions through select retailers such as Amazon.com, Apple, Barnes & Noble, Borders, Best Buy, Staples, Costco and Office Depot. According to an August 2008 survey we commissioned from Global Market Insite Inc., or GMI, a market research services firm, which we refer to as the GMI survey, Rosetta Stone is the most recognized language learning brand in the United States. Additionally, of those surveyed who had an opinion of our brand, over 80% associated it with high quality and effective products and services for teaching foreign languages. January and February 2009 internal studies showed aided brand awareness for Rosetta Stone in the United States was
3
approximately 74-79%, based on general population surveys and confirmed that Rosetta Stone is the most recognized language learning brand in the United States.
Our Industry
Market Size. According to a December 2007 industry analysis we commissioned from the Nielsen Company, a market research firm, which we refer to as the Nielsen survey, the worldwide language learning industry represented more than $83 billion in consumer spending in 2007, of which more than $32 billion was for self-study. The Nielsen survey also estimated that the language learning industry in the United States, where we generated 92% of our revenue in 2009, represented more than $5 billion in consumer spending in 2007, of which more than $2 billion was for self-study. In a more recent study we conducted in December 2010, we estimated the language learning industry in the U.S. has contracted and represented approximately $4.0 billion in consumer spending in 2010, of which $2.2 billion was for self-study. Our study also indicates that U.S. consumer spending on language learning has declined by 24% since 2007, even as the total number of buyers has expanded by 28%.
The language learning market is highly fragmented and consists of the following primary models: classroom instruction utilizing the traditional approach of memorization, grammar and translation; immersion-based classroom instruction; self-study books, audio tapes and software that rely primarily on grammar and translation; and free online offerings that provide basic content and opportunities to practice writing and speaking.
Key Drivers of Demand in Language Learning Market. We believe that language learning is important and valued by individuals and institutions in the United States and throughout the world. The demand for language learning is driven in part by:
- •
- individuals seeking the enjoyment and enrichment brought by learning a language;
- •
- professionals conducting business in a global economy;
- •
- schools seeking to educate their students in local and foreign languages;
- •
- companies training their employees;
- •
- leisure travelers seeking language proficiency for independent international travel;
- •
- armed forces training soldiers to communicate in foreign languages;
- •
- immigrants and expatriates seeking to successfully function in their new environments;
- •
- individuals connecting with their ethnic and family roots; and
- •
- parents supplementing their children's education.
Limitations of Traditional Methods for Language Learning. The human brain has a natural capacity to learn languages. Children learn their native language without using rote memorization or adult analytical abilities for grammatical understanding. They learn at their own pace through their immersion in the language spoken around them and using trial and error. They do not rely on translation. By contrast, foreign languages have traditionally been taught by focusing on memorization, grammar translation and word translation, typically in an academic classroom setting. This traditional method involves learning complex grammar rules, conjugating verbs and memorizing vocabulary lists. Students have little practice speaking or listening in the classroom, and practice outside the classroom typically involves rote listening to audio recordings and pronunciation exercises, with little or no feedback on pronunciation accuracy. Many students who were taught languages using the traditional method regard it as ineffective and boring.
4
Emergence of Immersion Language Learning. To address some of the shortcomings of traditional language learning methods, language learning specialists have developed an alternative method for teaching language known as immersion learning, in which only the target language is spoken. We believe that immersion learning is more effective than the traditional translation and grammar method in helping learners move towards conversational fluency. Immersion learning provides a more natural, direct learning environment, where the learner deduces meaning and develops an intuition of language structure. This is similar to the manner in which children learn their native language, without an awareness of formal grammar rules or the necessity to translate. Most immersion learning programs, however, require either one-on-one teaching, a small group course or travel to a foreign country. These programs can cost several thousand dollars and are less convenient than self-study alternatives.
Use of Interactive Technologies. There has been a rapid adoption of interactive technologies and software tools to help learning in both consumer and institutional markets, supported by the rapid increase in computing technologies and internet use. Given busy lifestyles, adult language learners seek solutions that work flexibly and do not require physical classroom attendance. Educators are interested in deploying learning tools that are relevant to their students, who have had extensive exposure to computer software and interactive games. Corporations are recognizing the value and effectiveness of using their technology investment to help increase the skills of their workforce.
The Need for a High-Quality, Trusted Solution. Consumers and institutions face a confusing array of alternatives when choosing a language course due to the fragmented nature of the language learning market. Most providers of language learning offer little information to potential customers about their teaching methods and do not have well known brands. The few major internationally known language learning providers generally offer only classroom instruction, which is not convenient for all prospective language learners. In addition, there are numerous self-study courses in the market available at a variety of price points, most of which are offered as audio and books and do not provide an interactive, immersion learning experience. There are also many community websites that provide free opportunities to practice.
We believe that language learners seek a trusted name-brand solution that is more convenient and affordable than classroom alternatives, and more effective, interactive and engaging than other self-study options. We believe the combination of these elements is not offered by traditional providers of language instruction.
The Rosetta Stone Solution
Our mission is to change the way people learn languages. We believe our solutions provide an effective way to learn languages in a convenient and engaging manner. Our approach, called Dynamic Immersion, eliminates translation and grammar explanation and is designed to leverage the innate, natural language learning ability that children use to learn their native language. We consider traditional translation and grammar methods as obstacles that delay and impede the successful acquisition of language proficiency, and our solutions avoid those elements. Our computer-based self-study courses allow our customers to learn using the immersion method on their own schedule and for a price that is significantly lower than most classroom-based or one-on-one alternatives. Although other audio and software publishers claim to teach with immersion methods, we believe that we are the only self-study solution that teaches strictly without any translation or explicit grammar explanations. Our proprietary solutions have been developed over the past 18 years by professionals with extensive expertise in linguistic, education and instructional technology. We estimate that our content library consists of more than 25,000 individual photographic images and more than 400,000 professionally recorded sound files. We design the sequencing of our content to optimize learning. The result is a rigorous and complete language learning curriculum that is also designed to be flexible, fun and convenient.
5
Our language learning solutions are built upon a flexible software platform that supports multiple languages and is deployable on personal computers, on local networks and online. The platform incorporates a number of proprietary technologies that are key to enabling language learning, including:
- •
- speech recognition that is focused on the unique challenges of language learners;
- •
- Adaptive Recall algorithms that repeat content at scheduled intervals to
promote long-term retention;
- •
- reporting features and curriculum options designed to enhance the effectiveness and administration of classroom,
enterprise and home school learning; and
- •
- an intuitive user interface that assists the learner's transition from listening comprehension to speaking.
Rosetta Stone offers a broad product suite, with courses currently available in 34 languages. Our courses are available in up to five levels of proficiency per language, with each level providing approximately 40 hours of instruction and containing multiple units, lessons and activities.
In July 2009, we introduced Rosetta Stone TOTALe, an online language learning solution that integrates our online courses with coach-led practice sessions, fun and engaging language games, interaction with native speakers and live support from customer service agents. Rosetta Stone V4 TOTALe, which was released in September 2010, combines packaged software and dedicated conversational coaching. The content of our packaged software and subscription offerings are the same. We simply offer our customers the ability to choose which format they prefer without differentiating the learning experience. We began bundling time-based subscription licenses of our web-based TOTALe services with perpetual licenses of our Rosetta Stone Version 3 language learning solutions in the U.S. consumer market as part of our Rosetta Stone Version 4 TOTALe launch. We launched Rosetta Stone Version 4 TOTALe in Japan in February 2011 and we intend to launch this solution in our other foreign markets as well.
We also provide an online peer-to-peer practice environment called SharedTalk, at www.sharedtalk.com, where registered language learners meet for language exchange to practice their foreign language skills. During 2010, we had more than 135,000 active SharedTalk users.
Our innovative solutions have received numerous awards and recognitions, including a finalist for the 2011 SXSW Interactive Awards in the Education Resource category for Rosetta Stone Version 4 TOTALe, a 2010 Consumer Electronics Show (CES) Innovation Design and Engineering award in the online retail category for Rosetta Stone TOTALe, an honorable mention for the Adobe MAX 2010 Awards for Rosetta Stone TOTALe, a 2010 United States Distance Learning Association (USDLA) silver award in the Best Practices in Distance Learning Programming category for Rosetta Stone Classroom Version 3, a 2010 Best Educational Software Award (BESSIE) in the Best Multi-Level Foreign Language Website category for Rosetta Stone Classroom Version 3, a 2010 Chief Learning Officer Learning in Practice Award (bronze for excellence in e-learning) for Rosetta Stone Enterprise Version 3, the 2010 Top Training and Simulation Companies list for companies that have made a significant impact on the military training industry by Military Training Technology, the 2009 National Parenting Publications Awards (NAPPA) Honors Award for Rosetta Stone Version 3 Personal Edition, four classroom specific awards in 2009 for Classroom Version 3, two enterprise specific awards in 2009, the 2009 BESSIE in the Best Multi-Level Foreign Language Website category for Rosetta Stone Classroom Version 3, iParenting Media Excellent Product of 2009 award in the software category for Rosetta Stone Personal Edition Version 3, the 2009 Children's Technology Review Editor's Choice Award for Rosetta Stone Personal Edition Version 3, the 2009 Parent Tested Parent Approved (PTPA) Media Awards for Rosetta Stone Personal Edition Version 3, and the 2009 Creative Child Media of the Year Award in the educational media category for Rosetta Stone Personal Edition Version 3.
6
Our Strategy
Our goal is to strengthen our position as a leading provider of language learning solutions and address the challenges facing our company. Our challenges include a changing U.S. consumer market, an extremely competitive marketplace, a tightened media environment and evolving product delivery platforms. These factors have contributed to a decline in our U.S. consumer bookings from 2009 to 2010. We intend to strengthen our position and address our challenges through the following strategies:
Reposition U.S. Consumer Business and Increase U.S. Market Share. We are evaluating changes in our marketing, pricing, packaging and delivery methods to strengthen our brand and improve the relevance of our offering. In addition, we are evaluating developing more targeted language learning solutions for learners with different needs. We are also considering diversifying our product portfolio and marketing to address new segments in the language learning market. In addition, we are exploring ways to provide greater lifetime values to customers, such as the introduction of Version 4 TOTALe, and thus generate greater revenue per customer over time. We also plan to expand select retail relationships and to continue to review kiosk performance, as we close our underperforming kiosk locations. In addition, we will realign our cost structure to focus on our areas of growth.
Increase Our Focus on the Institutional Market. We plan to intensify our efforts to engage new large institutional customers for which language learning is critical. We expect to expand our direct sales force along with our institutional marketing activities.
Increase Our Focus on Sizeable Non-U.S. Markets. We generated approximately 18% of our revenue in 2010 from sales outside the United States. According to the Nielsen survey, over 90% of the $83 billion spent in 2007 on consumer language learning products and services was spent outside the United States. We therefore believe that there is a significant opportunity for us to expand our business internationally utilizing many of the successful marketing and distribution strategies we have used in the United States. We have established subsidiaries in the United Kingdom, Japan and Germany as well as a branch office in South Korea to develop our international business. In addition, we are exploring opportunities to expand our presence in Asia, Europe and Latin America. Because our solutions do not rely upon translation from the target language into the learner's native language, they require only modest localization to be used by learners from other native language backgrounds, and thus we believe that we can efficiently scale our business internationally. In February 2011, we launched Version 4 TOTALe in Japan and we intend to launch this offering in our other foreign markets.
Extend Our Technological and Product Leadership. We intend to apply new technologies to maintain our product leadership. We currently are working on a variety of product development initiatives. For example, Rosetta Stone Version 4 TOTALe, which was released in September 2010, combines packaged software with opportunities to practice with dedicated conversational coaches and other language learners to increase language socialization as well as online language learning games. In addition, we are developing an English remediation solution targeting advanced learners in Asia. This online solution will focus on both the foundational phonetic skills needed to properly hear and produce distinctions that are present in English, but absent in Asian languages and activating learners' strong English grammar and vocabulary knowledge in conversational practice sessions designed to carefully advance learners to converse fluidly and confidently with native speakers. In addition, we intend to explore developing new platforms for delivering our language learning content, such as platforms for iPhones, iPads and similar devices. We intend to also continue to improve the efficacy of our solutions by continuing to develop products with higher frequency of socialization and optimizing the content of our solutions.
Expand Our Core Product Portfolio. We plan to expand our product portfolio by adding more advanced course levels for our existing languages. We give learners the option to purchase our solutions at a single level of difficulty, or as a bundle of all available levels. Currently, 7 of our languages are
7
offered in all five levels of proficiency and another 18 of our languages are offered in the first three levels of proficiency. Our other 9 languages are available in only one level of proficiency. We also plan to add new languages and new skill development and remediation courses for advanced language learners. We believe that there is an opportunity to increase our revenue as we introduce additional levels of proficiency to our existing languages. In addition, we believe that there may be opportunities for us to introduce additional language learning solutions containing industry-specific content.
Products and Services
We offer language learning solutions in three versions for 34 languages under the Rosetta Stone brand. Each language currently has up to five levels, with each consecutive level representing a higher level of proficiency. We sell each level as a standalone unit, although we offer a price incentive to customers to purchase all available levels of a language as a bundle, where that option is available.
As of December 31, 2010, we offer the following languages
| Version 4 (24 Languages) | ||||||
| 5 Levels (7 Languages) | ||||||
| English (American) | English (British) | French | German | |||
| Italian | Spanish (Latin American) | Spanish (Spain) | ||||
| 3 Levels (17 Languages) | ||||||
| Arabic | Chinese | Dutch | Farsi (Persian) | |||
| Greek | Hebrew | Hindi | Irish (Gaelic) | |||
| Japanese | Korean | Polish | Portuguese | |||
| Russian | Swedish | Tagalog | Turkish | |||
| Vietnamese | ||||||
| Version 3 (7 Languages) | ||||||
| 3 Levels (1 Language) | ||||||
| Latin | ||||||
| 1 Level (6 Languages) | ||||||
| Arabic (Iraqi) | Dari | Indonesian | Pashto | |||
| Swahili | Urdu | |||||
| Version 2 (3 Languages) | ||||||
| 1 Level (3 Languages) | ||||||
| Danish | Thai | Welsh | ||||
Rosetta Stone continues to sell previous versions (i.e., Version 3 and Version 2) of our software in addition to the Version 2 and Version 3 list of languages set forth above in some of our overseas markets and to institutional customers.
In September 2010, we released Rosetta Stone Version 4 TOTALe (Version 4) in 24 languages. Version 4 TOTALe integrates our CD solution with coach-led practice sessions, fun and engaging language games, interaction with native speakers and live support from customer service agents. TOTALe is also available in an online only subscription based service.
In November 2010, we released Rosetta Stone Discover, a stand-alone mobile application for Apple iPhone and iPod Touch, in French.
8
As of December 31, 2010, the following components are included with each software version:
| Version | Rosetta Course | Rosetta Studio | Rosetta World | Audio Companion |
TOTALe Mobile Companion |
|||||
|---|---|---|---|---|---|---|---|---|---|---|
V4 TOTALe |
X | X | X | X | X | |||||
V3 |
X | X | ||||||||
V2 |
X |
- •
- Rosetta Course is the self-study interactive language learning curriculum
that is the core component of the Rosetta Stone offering. The course consists of sequences of listening, speaking, reading and writing interactions designed to teach, reinforce and test learners
through our software program.
- •
- Rosetta Studio is a series of coach-led practice sessions that align with
the curriculum in Rosetta Course. Studio sessions provide learners with the opportunity to practice what they have learned in Rosetta Course, improving
confidence.
- •
- Rosetta World is an interactive community of language learners. Rosetta
World gives learners the opportunity to play games with other learners in a structured manner that reinforces what they have learned in Rosetta Course
and Rosetta Studio.
- •
- Audio Companion is a series of digital audio files that contain lessons
directly aligned to the Rosetta Stone curriculum, allowing users to practice and carry on their immersive experience when they are away from a computer. The lessons on the Audio Companion can be
transferred to MP3 players. The Audio Companion provides a convenient opportunity
for practicing material that was previously learned through the software program. Unlike other common audio products, Rosetta Stone does not rely solely on an audio environment to teach, so we can
create an immersive audio environment, using only the target language, which reinforces material learned from our software program.
- •
- TOTALe Mobile Companion is an additional practice tool that is available on Apple iPhone and iPod Touch. TOTALe Mobile Companion includes a series of practice lessons which use images, audio and our speech recognition technology to help users refine their speaking skills while they are away from their computer.
We have four different editions of our product: personal, enterprise, classroom and homeschool.
| Version | Personal Edition |
Home School Edition |
Enterprise Edition |
Classroom Edition |
||||
|---|---|---|---|---|---|---|---|---|
| V4 | X | X | ||||||
| V3 | X | X | X | X | ||||
| V2 | X | X |
Each edition utilizes the same core software product, but includes different ancillary features as follows:
- •
- Personal Edition—This edition is targeted to individual
consumers and contains the core software product we use for all editions.
- •
- Enterprise Edition—This edition is targeted to businesses, armed forces, government organizations and not-for-profit entities and can accommodate organizations of any size, from individual learners to entire global organizations. This edition includes management tools that provide easy-to-use administrative and reporting functionality. These tools deliver easy-to-read reports and graphs that track learner activity, progress and scores, thereby providing
9
- •
- Classroom Edition—This edition is targeted to language
programs in primary, secondary and higher education settings and is scalable to accommodate a variety of implementations, from individual schools to district-wide programs and
universities. The classroom edition is designed to be incorporated into a teacher's overall language-learning curriculum, complementing in-class teaching and enabling individualized
self-paced learning outside the classroom. The classroom edition includes a learner management tool, the Rosetta Stone Manager, which
provides easy-to-use administrative and reporting functionality. This tool enables teachers to plan lessons and generate reports and graphs that track student and classroom
activity, progress and scores.
- •
- Home School Edition—This edition is targeted to families with home school students and is designed to provide parents the tools and resources they need to manage student progress without extensive planning or supervision. The home school edition includes administrative tools that permit parents to follow student progress and access specific information about student performance, such as completed exercises, test scores, and time spent learning, and to generate printable progress reports. In addition, parents have the ability to enroll their students in predefined curriculum paths designed to assist in lesson planning and in achieving learning objectives.
organizations with key information they need to measure return on their language learning investment.
Our solutions are available both pre-packaged and by subscription online through our language learning portal. For the year ended December 31, 2010, approximately 83% of our revenue was from CD-ROM sales to both consumers and institutions, while approximately 17% was from online subscriptions.
We also provide an online peer-to-peer practice environment called SharedTalk, at www.sharedtalk.com, where registered language learners meet for language exchange and to practice their foreign language skills. During 2010, we had more than 135,000 active SharedTalk users.
In addition, we have developed Rosetta Stone products for the exclusive use of Native American communities to help to save their endangered languages, including Mohawk, Chitimacha, Inuktitut and Iñupiaq. In 2010, we continued our work with Native American communities by adding a product for Navajo.
Technology
We develop most of our own technology, including our proprietary unified language learning software platform. Our newest application, Version 4, currently supports up to five levels of proficiency and is available in 24 languages. Version 3 currently supports up to five levels of proficiency and is available in 31 languages. Version 2, our legacy application, is available for our other 3 languages. We intend to offer additional languages. The technology underlying Version 2, Version 3 and Version 4 is designed to handle the complexities of a wide variety of languages, including languages written from right-to-left such as Arabic and Hebrew and languages with characters such as Chinese and Japanese.
10
Our Version 3 and Version 4 platform is flexible and capable of meeting a wide range of market requirements, including:
- •
- enabling reporting features and additional curriculum options for our home school edition;
- •
- providing our solutions in a local networked environment to enable a class management tool in the classroom edition;
- •
- offering our solutions online through a commercial learning management system for our enterprise customers; and
- •
- providing localized interfaces and help files in the user's native language, which are currently available in eight languages.
In each of these cases, the learner receives the same engaging language learning experience and content.
We have developed a speech recognition technology focused on the unique challenges of language learners, stressing non-native speech understanding and pronunciation feedback. This technology, which is included in Version 3 and Version 4, is available for all of our languages on those versions and runs on all widely available operating systems and on local and online applications. Our speech recognition models include languages traditionally not supported by general-purpose speech recognition software, such as Irish.
We have developed proprietary algorithms we call Adaptive Recall, which are designed to enhance the learner's experience by reintroducing content at longer and longer intervals in order to improve long-term retention. Adaptive Recall, available in Version 3 and Version 4, is designed to be efficient with a learner's time, bringing material back in the program less and less frequently as the learner remembers over extended periods of time.
We have developed a proprietary student management system, which is designed to allow teachers and administrators to configure their own lesson plans using our content and exercises and to review reports for evaluation of student progress.
We have developed an intuitive user interface that assists in the learner's transition from listening comprehension to speaking, making language skill development an integrated experience.
We have also created proprietary content development tools that allow our curriculum specialists to write, edit, manage and publish our course materials. These tools allow authors, translators, voicers, photographers and editors to work efficiently and cooperatively across multiple locations.
Content and Curriculum
The foundation of Dynamic Immersion is our proprietary content, consisting of a total of more than 25,000 individual photographic images and more than 400,000 professionally recorded sound files. Each Version 3 and Version 4 language contains approximately 10,000 individual photographic images and 15,000 professionally recorded sound files. We believe these photographic images and recorded sound files are a competitive strength, as we have created many of the pictures and all of the sound files ourselves. We believe that our images and their juxtaposition convey a universal meaning, which makes it possible for us to broadly deploy the same images across multiple languages. In addition, we have developed a sophisticated method for sequencing the images, which is designed to build a rich curriculum that incrementally teaches the user the most important and relevant language skills necessary to achieve fluency. We believe that our sequence of images is as effective for someone learning Arabic or Mandarin Chinese as it is for someone learning Spanish or English. To supplement our core content, we incorporate specific nuances for each language, such as dual forms for parts of speech in Arabic. Our ability to tailor our content also enables us to develop customized versions of our language learning solutions to address the specific needs of various industries. For example, we
11
created a customized version of our Arabic learning solution for the U.S. Army, which includes military-specific content, such as vocabulary, images and curriculum sequencing. In the future, we may develop customized versions for other industries, such as healthcare, business, real estate and retail.
In addition to visual learning experiences, our Version 3 and Version 4 solutions incorporate an integrated speech program utilizing our voice recognition application, which works in languages that are traditionally not supported by general-purpose speech recognition software. As an integral component of the program, this voice recognition feature works with our learners to promote the appropriate pronunciation of the words and concepts included in the lesson.
Throughout the curriculum sequence, our program combines the introduction of new concepts, practice of recent material and production of key phrases. As learners progress along our curriculum, they transition from seeing and recognizing to speaking as our program prompts them to pronounce the words they are being taught. Our solution covers all aspects necessary for fluency within a completely immersive environment without requiring translation or explanation, including alphabet, vocabulary, intuitive grammar, reading, writing, listening, pronunciation and conversation. While rigorous and complete, the curriculum is designed to remain flexible, allowing learners to alter their individual pace and focus of instruction to meet their particular goals and abilities. The language content for our respective courses is organized into up to five levels of proficiency, with each level providing approximately 40 hours of instruction and containing multiple units, lessons and activities.
Customers
Our customers include individuals, home school parents, educational institutions, armed forces, government agencies, corporations and not-for-profit institutions. We sell to our customers through a direct-to-consumer and institutional marketing and distribution strategy.
Channel
|
Customer Type | Representative Customers | ||
|---|---|---|---|---|
| Consumer | Individual | Based on our internal studies, 57% annually earn more than $75,000 and 40% earn more than $100,000 | ||
| Retailers | Amazon.com, Apple, Barnes & Noble, Borders, Best Buy, Staples, Costco and Office Depot | |||
| Institutional | Educational Institutions | Primary and Secondary Schools: New York City Department of Education (NY), DeKalb County Schools (GA), Clark County School District (NV), School District of Hillsborough County (FL), District School Board of Collier County (FL), Palatine Community Consolidated School District (IL), Region 7 Education Service Center (TX), Sarasota County School District (FL) | ||
| Universities: University of Wisconsin, Virginia Commonwealth University, Community College of the District of Columbia | ||||
| Government, Armed Forces and Not-for-Profit Organizations | U.S. Department of Homeland Security, U.S. Immigration and Customs Enforcement, Foreign Service Institute, the Federal Bureau of Investigation, U.S. Air Force, U.S. Army, U.S. Marines, the Australian Department of Defence, Foreign and Commonwealth Office (UK), Servicio Nacional de Aprendizaje (Columbia), Fulbright Commission, Council for Adult and Experiential Learning, Pacific Training Institute Clinic, Seattle Goodwill | |||
| Corporations | Best Buy Co., Inc., General Motors Corp., Andarko Petroleum Corp., Alfa Corporativo, S.A. de C.V., Neoris de Mexico S.A. de C.V., Pitney Bowes Inc., Molex Inc., Marriott International, Inc. |
12
Marketing and Distribution Channels
Our multi-channel marketing and distribution model consists of print, online, television and radio direct-response advertising, kiosks, our institutional sales force and retail resellers. We believe that this marketing and distribution model, through which each channel complements and supports the others, provides:
- •
- greater brand awareness across channels;
- •
- cost-effective consumer acquisition and education;
- •
- premium brand building; and
- •
- improved convenience for consumers.
Consumer
Consumer sales accounted for approximately 79% of our revenue for the year ended December 31, 2010. Our consumer distribution model comprises a mix of our call centers, websites, network of kiosks and select retail resellers, such as Amazon.com, Apple, Barnes & Noble, Borders, Best Buy, Staples, Costco and Office Depot. We believe these channels complement each other, as consumers that have seen our direct-to-consumer advertising may purchase at our kiosks or retailers, and those who have seen our solutions demonstrated at our kiosks may purchase solutions through our retailers, websites or call centers.
Direct to Consumer. Our direct-to-consumer channel, which we define as sales generated through either our websites or call centers, accounted for approximately 58% of our consumer revenue for the year ended December 31, 2010. We utilize several forms of advertising to drive our direct-to-consumer sales, including print, online, television and radio. Our marketing to this channel also supports the kiosk and retail channels.
Rosetta Stone Kiosks. As of December 31, 2010, we operated 259 retail kiosks, including 4 full service retail outlets, in airports, malls and other strategic high-traffic locations in 36 states and the District of Columbia. As of December 31, 2010, we operated 14 kiosks in the United Kingdom, 15 in Japan and 56 in South Korea and one in Germany. Some of our international kiosks are inside the stores of other retailers. These company-operated kiosks accounted for approximately 17% of our consumer revenue for the year ended December 31, 2010.
Most of our kiosk site licenses range between three to six months with renewal options. Our policy is to close under-performing kiosks expeditiously.
Retailers. Sales to retailers accounted for approximately 23% of our consumer revenue for the year ended December 31, 2010. Our retailers enable us to provide additional points of contact to educate consumers about our solutions, expand our presence beyond our own kiosks and websites, and further strengthen and enhance our brand image. Our retail relationships include Amazon.com, Apple, Barnes & Noble, Borders, Best Buy, Staples, Costco and Office Depot. Sales in the retail channel are highly correlated with our media expenditures in the direct-to-consumer channel. In February 2011, Borders filed for Chapter 11 bankruptcy reorganization and announced plans to close approximately 200 stores.
Home Schools. We promote interest in this market through advertising in publications focused on home schooling, attending local trade shows and seminars and direct mailings. For the year ended December 31, 2010, we reclassified our home school sales vertical from Institutional to Consumer. We believe the drivers of acquiring a home school customer are more aligned with a typical sale in our consumer sales vertical. Prior year information has been modified to conform to current year presentation. Home school sales accounted for approximately 2% of our consumer revenue for the year ended December 31, 2010.
13
Institutional
Institutional sales accounted for approximately 21% of our revenue for the year ended December 31, 2010. Our institutional distribution model is focused on targeted sales activity primarily through a direct sales force in four markets: schools, colleges and universities; the U.S. armed forces and federal government agencies; corporations; and not-for-profit organizations. Regional sales managers are responsible for sales of our solutions in their territories and supervise account managers who are responsible for maintaining our customer base.
Educational Institutions. These customers include primary and secondary schools and represented approximately 51% of our institutional revenue for the year ended December 31, 2010. In our experience, colleges, universities and schools frequently rely on references from peer institutions and an official request-for-proposal, or RFP, process when selecting a vendor. We generate sales leads from sources such as visiting potential customer sites to provide briefings on our solutions and the industry, interacting with attendees at trade shows and conferences, responding to inbound calls based on recommendations from existing customers and monitoring and responding to RFPs.
Federal Government Agencies and Armed Forces, Not-for-Profit. These customers include governmental agencies and armed forces and organizations developing workforces to serve non-native speaking populations, offering literacy programs and preparing members for overseas missions and accounted for approximately 28% of our institutional revenue for the year ended December 31, 2010. Many customers in this market license our products through online subscriptions. We have recently been adding sales representatives to this group to allow greater focus by senior sales executives on expanding some of our key relationships.
Corporations. We promote interest in this market with onsite visits, trade show and seminar attendance, speaking engagements and direct mailings. Many of our customers in the market prefer online subscription delivery. Corporations represented 21% of our institutional revenue for the year ended December 31, 2010.
International
International sales accounted for approximately 18% of our revenue for the year ended December 31, 2010. In the near term, our international activity is primarily focused on successfully growing our business in the United Kingdom, Germany, South Korea and Japan, where we are utilizing many of the same direct-to-consumer and channel strategies that we developed in the domestic market. We opened our United Kingdom office in 2005, our Japan office in 2007, our Korea office in 2009, and our Germany office in 2010. Over time, we believe that we will be able to develop a similar business model in other markets in Europe, Asia and Latin America.
Product Development
Our product portfolio is a result of significant investment in product development over 18 years. Our product development focuses on both software and content development. Our development efforts include both creating new solutions and adding new languages to existing solutions. Our development team has specific expertise in speech recognition, interface design, immersion learning and instructional design.
Our research and development expenses were $23.4 million in the year ended December 31, 2010.
Sourcing and Fulfillment
Our strategy is to maintain a flexible, diversified and low-cost manufacturing base. We use third-party contract manufacturers and suppliers to obtain substantially all our product and packaging components and to manufacture finished products. We believe that we have good relationships with our
14
manufacturers and suppliers and that there are alternative sources in the event that one or more of these manufacturers or suppliers is not available. We continually review our manufacturing and supply needs against the capacity of our contract manufacturers and suppliers with a view to ensuring that we are able to meet our production goals, reduce costs and operate more efficiently.
We package and distribute our products primarily from our fulfillment facility in Harrisonburg, Virginia. We also contract with third-party fulfillment vendors in Munich, Germany, and Tokyo, Japan. From Tokyo, we distribute products for consumer orders in Japan. From Munich, we distribute products for consumer orders in Europe. We distribute products for the remainder of our orders from Harrisonburg, Virginia.
Competition
The language learning industry is highly fragmented and subject to rapidly changing consumer preferences and industry trends. We expect competition in the markets that we serve to persist and intensify. We face varying degrees of competition from a wide variety of companies providing language learning solutions including:
- •
- language learning center operators;
- •
- audio CD and MP3 download providers;
- •
- pre-packaged software producers;
- •
- textbook publishers;
- •
- online tutoring service providers; and
- •
- online peer-to-peer practice providers.
Our competitors include Berlitz International Inc., Simon & Schuster, Inc. (Pimsleur), Random House Ventures LLC (Living Language), Disney Publishing Worldwide and McGraw-Hill Education.
We believe that the principal competitive factors in our industry include:
- •
- product differentiation, including:
- •
- teaching method,
- •
- effectiveness,
- •
- accessibility and convenience,
- •
- availability and quality of speech recognition, and
- •
- fun and likelihood of continued engagement,
- •
- brand recognition and reputation;
- •
- price; and
- •
- effective advertising.
Intellectual Property
Our ability to protect our core technology and intellectual property is critical to our success. We rely on a combination of measures to protect our intellectual property, including patents, trade secrets, trademarks, trade dress, copyrights and non-disclosure and other contractual arrangements.
We have three U.S. patents and several international and U.S. patents pending. Many of these pending patents relate to our language teaching methods.
15
We hold a perpetual, irrevocable and worldwide license from the University of Colorado allowing us to use speech recognition technology for language learning solutions. We entered into the license agreement in December 2006, and paid the University of Colorado an up-front license fee.
We have registered a variety of trademarks, including Rosetta Stone, Rosetta World, Rosetta Stone Language Learning Success & global design, Audio Companion, Dynamic Immersion, The Fastest Way to Learn a Language. Guaranteed., Adaptive Recall, Contextual Formation, the Rosetta Stone blue stone logo and design, the Rosetta Stone blue stone logo and design/Language Learning Success, Rosettastone.com, Rosetta Stone TOTALe, rWorld, SharedTalk and TOTALe. We have applied to register our Rosetta Studio, Rosetta Course, and Simbio trademarks. All these trademarks are the subject of either registrations or pending applications in the United States, as well as numerous countries worldwide where we do business. We intend to continue to strategically register, both domestically and internationally, trademarks we utilize today and those we develop in the future.
We own the copyright on our Version 2 English editions. We are registering or have registered in the United States our Version 2 non-English editions and all editions of our Version 3 languages.
We believe that the distinctive marks that we use in connection with our solutions are important in building our brand image and distinguishing our solutions from those of our competitors. These marks are among our most valuable assets. In addition to our distinctive marks, we own several copyrights and trade dress rights to our solutions, product packaging and user manuals. We also place significant value on our trade dress, which is the overall image and appearance of our solutions, and we believe that our trade dress helps to distinguish our solutions in the marketplace.
Furthermore, our employees, contractors and other parties with access to our confidential information sign agreements that prohibit the unauthorized disclosure of our proprietary rights, information and technology.
Employees
As of December 31, 2010, we had 1,910 total employees, consisting of 1,084 full-time and 826 part-time employees. Our personnel consisted of 643 employees in sales and marketing, 202 employees in research and development, 260 in general and administrative and 805 kiosk sales employees. None of our employees is represented by a collective bargaining agreement. We believe our employee relations are good.
In addition to the other information set forth in this annual report on Form 10-K, you should carefully consider the risk factors discussed below and in other documents we file with the Securities and Exchange Commission, which could materially affect our business, financial condition or future results. These are not the only risks facing our Company. Additional risks and uncertainties not currently known to us or that we currently deem to be immaterial also may materially adversely affect our business, financial condition and/or operating results.
Our actual operating results may differ significantly from our guidance.
From time to time, we may release guidance in our quarterly earnings releases, quarterly earnings conference call, or otherwise, regarding our future performance that represents our management's estimates as of the date of release. This guidance, which includes forward-looking statements, is based on projections prepared by our management. These projections are not prepared with a view toward compliance with published guidelines of the American Institute of Certified Public Accountants, and neither our registered public accountants nor any other independent expert or outside party compiles or examines the projections and, accordingly, no such person expresses any opinion or any other form of assurance with respect thereto.
16
Projections are based upon a number of assumptions and estimates that, while presented with numerical specificity, are inherently subject to significant business, economic and competitive uncertainties and contingencies, many of which are beyond our control and are based upon specific assumptions with respect to future business decisions, some of which will change. We generally state possible outcomes as high and low ranges, which are intended to provide a sensitivity analysis as variables are changed but are not intended to represent that actual results could not fall outside of the suggested ranges. The principal reason that we release guidance is to provide a basis for our management to discuss our business outlook with analysts and investors. We do not accept any responsibility for any projections or reports published by any such persons.
Guidance is necessarily speculative in nature, and it can be expected that some or all of the assumptions of the guidance furnished by us will not materialize or will vary significantly from actual results. Accordingly, our guidance is only an estimate of what management believes is realizable as of the date of release. Actual results will vary from our guidance and the variations may be material. In light of the foregoing, investors are urged not to rely upon, or otherwise consider, our guidance in making an investment decision in respect of our common stock.
Any failure to successfully implement our operating strategy or the occurrence of any of the events or circumstances set forth in our "Risk Factors" and in this annual report on Form 10-K could result in the actual operating results being different from our guidance, and such differences may be adverse and material.
Risks Related to Our Business
Our introduction of Rosetta Stone Version 4 TOTALe will increase our costs as a percentage of revenue, may not succeed and may harm our business, financial results and reputation.
We released Rosetta Stone Version 4 TOTALe in the third quarter of 2010. Rosetta Stone Version 4 TOTALe integrates our existing language learning software solutions with web-based services, which will provide opportunities for practice with dedicated language conversation coaches and other language learners to increase language socialization. These web-based services have a much higher cost as a percentage of revenue than our software solutions. We offer Rosetta Stone Version 4 TOTALe primarily by bundling the web-based services of TOTALe with our software and audio offerings. At the same time, we expect to provide augmented, free peer-to-peer language practice. The services associated with Rosetta Stone Version 4 TOTALe will decrease our margins. Rosetta Stone Version 4 TOTALe sells at a higher price per unit than our Version 3 software solutions and customers may not choose to engage with conversation coaches or pay higher prices to do so. Rosetta Stone Version 4 TOTALe will also present new management and marketing challenges that differ from the challenges we face in our existing business. In addition, we will be required to defer recognition of a portion of each sale of Version 4 TOTALe in connection with the subscription terms of our on-line socialization services. Initial consumer demand for Rosetta Stone Version 4 TOTALe has not been as high as we projected and overall, our unit sales contracted in 2010 compared to 2009. We cannot assure you that Rosetta Stone Version 4 TOTALe will be successful or profitable, or if it is profitable, that it will provide an adequate return on capital expended. If Rosetta Stone Version 4 TOTALe is not successful, our business, financial results and reputation may be harmed.
Our introduction of an English remediation solution targeting advanced learners in Asia may not succeed and may harm our business, financial results and reputation.
We have publicly announced plans to introduce an English remediation solution targeting advanced learners in Asia. This solution will provide learners with foundational phonetic skills needed to properly hear and produce distinctions that are present in English, but absent in Asian languages. This online solution will carry lower price points than our full Rosetta Stone Version 4 TOTALe language learning solution and may cannibalize sales of our Version 4 solution in Asia. We will devote significant capital,
17
personnel and management attention to develop and launch the English remediation offering, including related research and development expenses, and incurring marketing expenses relating to the launch. This new product will present new management and marketing challenges that differ from the challenges we face in our existing business. We cannot assure you that the English remediation solution will be successful or profitable, or if it is profitable, that it will provide an adequate return on capital expended. If we are not successful in our launch of the English remediation solution, our business, financial results and reputation may be harmed.
Because we generate all of our revenue from language learning solutions, a decline in demand for our language learning solutions or for language learning solutions in general could cause our revenue to decline.
We generate substantially all of our revenue from our language learning solutions, and we expect that we will continue to depend upon language learning solutions for substantially all of our revenue in the foreseeable future. Because we are dependent on our language learning solutions, factors such as changes in consumer preferences for these products may have a disproportionately greater impact on us than if we offered multiple product categories. If consumer interest in our language learning software products declines, or if consumer interest in learning foreign languages in general declines, we would likely experience a significant loss of sales. Our December 2010 study, found that the consumer spending on language learning in the U.S. contracted from approximately $5.2 billion in 2007 to approximately $4 billion in 2010. Our study also indicates that U.S. consumer spending on language learning has declined by 24% since 2007, even as the total number of buyers has expanded by 28%. Some of the potential developments that could negatively affect interest in and demand for language learning software products include:
- •
- a decline in international travel;
- •
- changes in U.S. laws or policies making it more difficult for foreign persons to visit or take up residence in the United
States; and
- •
- a reduction in the roles of the U.S. armed forces or other governmental agencies in foreign countries.
Because a substantial portion of our revenue is generated from our consumer business, if we fail to accurately forecast consumer demand and trends in consumer preferences, our Rosetta Stone brand, sales and customer relationships may be harmed.
In 2010, unit sales of our products decreased compared to 2009 and initial sales of Version 4 TOTALe have been less than expected. Demand for our language learning software products and related services, and for consumer products and services in general, is subject to rapidly changing consumer demand and trends in consumer preferences. Therefore, our success depends upon our ability to:
- •
- identify, anticipate, understand and respond to these trends in a timely manner;
- •
- introduce appealing new products and performance features on a timely basis;
- •
- anticipate and meet consumer demand for additional languages, learning levels and new platforms for delivery;
- •
- effectively position and market our products and services;
- •
- identify and secure cost-effective means of marketing our products to reach the appropriate consumers;
- •
- identify cost-effective sales distribution channels, kiosk locations and other sales outlets where interested consumers will buy our products;
18
- •
- anticipate and respond to consumer price sensitivity and pricing changes of competitive products; and
- •
- identify and successfully implement ways of building brand loyalty and reputation.
A decline in consumer demand for our solutions, or any failure on our part to satisfy changing consumer preferences, could harm our business and profitability.
We depend on discretionary consumer spending in the consumer segment of our business. Adverse trends in general economic conditions, including retail shopping patterns, airport traffic or consumer confidence, may compromise our ability to generate revenue.
The success of our business depends to a significant extent upon discretionary consumer spending, which is subject to a number of factors, including general economic conditions, consumer confidence, employment levels, business conditions, interest rates, availability of credit, inflation and taxation. Adverse trends in any of these economic indicators may cause consumer spending to decline further, which could hurt our sales and profitability. We depend on the continued popularity of malls as shopping destinations and the ability of mall anchor tenants and other attractions to generate customer traffic for our retail mall-based kiosks. We also depend on continued airline travel to generate traffic for our retail kiosks located in airports. Decreases in mall or airport traffic adversely affect the sales from our kiosks and our profitability and financial condition. In addition, an increase in the taxation of online sales could result in reduced online purchases or reduced margins on such sales. Furthermore, consumers may defer purchases of our solutions in anticipation of new products or new versions from us or our competitors.
Because a significant portion of our sales are made to or through retailers and distributors, none of which have any obligation to sell our products, the failure or inability of these parties to sell our products effectively could hurt our revenue and profitability.
We rely on retailers and distributors, together with our direct sales force, to sell our products. Our sales to retailers are highly concentrated on a small group, including Amazon.com, Apple, Barnes & Noble, Borders, Staples, Best Buy, Costco and Office Depot. Sales to or through our retailer and distributors accounted for approximately 18% of our revenue for the year ended December 31, 2010, which was down approximately 3% from our revenue generated from these channels for the year ended December 31, 2009. On February 16, 2011, Borders filed for Chapter 11 bankruptcy reorganization and we recorded a charge of $0.9 million associated with the potential loss of our accounts receivable from Borders which was recorded during the three-months ended December 31, 2010. In addition, we changed the accounting for revenue and bookings for the three months ended December 31, 2010 for Borders on a cash basis, which reduced both revenue and bookings by approximately $1.7 million and $2 million respectively. Borders also announced plans to close down approximately 200 stores, which will decrease the sales of our products. In addition, the liquidation of inventory at these Borders stores could diminish foot traffic and sales of our products by our other retailers. Additional store closures by Borders could result in more inventory liquidations and negatively impact sales of our products by other retailers.
We have no control over the amount of products that these retailers purchase from us or sell on our behalf, we do not have long-term contracts with any of them, and they have no obligation to offer or sell our products or to give us any particular shelf space or product placement within their stores. Thus, there is no guarantee that this source of revenue will continue at the same level as it has in the past or that these retailers will not promote competitors' products over our products or enter into exclusive relationships with competitors. Any material adverse change in the principal commercial terms, material decrease in the volume of sales generated by our larger retailers or distributors or major disruption or termination of a relationship with these retailers and distributors could result in a potentially significant decline in our revenue and profitability. Furthermore, product display locations
19
and promotional activities that retailers undertake can affect the sales of our products. The fact that we also sell our products directly could cause retailers or distributors to reduce their efforts to promote our products or stop selling our products altogether. As evidenced by the Borders Chapter 11 bankruptcy reorganization and plan to close approximately 200 stores, book stores are experiencing diminished foot traffic and sales. Reduced customer foot traffic in these stores is likely to reduce their sales of our products. In addition, if one or more these bookstores or other retailers or distributors are unable to meet their obligations with respect to accounts payable to us, we could be forced to write off such accounts. Any bankruptcy, liquidation, insolvency or other failure of any of these retailers or distributors could result in significant financial loss and cause us to lose revenue in future periods.
Product returns and pricing concessions could exceed our estimates, which would diminish our reported revenue.
We offer consumers who purchase our packaged software and audio practice products directly from us an unconditional full money-back six-month guarantee. We also permit some of our retailers and distributors to return packaged products, subject to limitations. For example, as of December 31, 2010, we recorded reserves for product returns in the first quarter of approximately $2 million, primarily associated with lower than expected sales of Version 4 TOTALe during the holiday season. We establish revenue reserves for packaged product returns based on historical experience, estimated channel inventory levels and the timing of new product introductions and other factors. If packaged product returns exceed our reserve estimates, the excess would offset reported revenue, which could hurt our reported financial results.
We are in the process of testing changes to the pricing of our products. If we reduce our prices as a result of successful tests in an effort to increase sales volume and overall market penetration we may provide our retailers and distributors with price protection on existing inventories, which would allow these retailers and distributors a credit against amounts owed with respect to unsold packaged product under certain conditions. These price protection reserves could be material in future periods.
Intense competition in our industry may hinder our ability to generate revenue and may diminish our margins.
The market for foreign language learning solutions is rapidly evolving, highly fragmented and intensely competitive, and we expect both product and pricing competition to persist and intensify. Increased competition could cause reduced revenue, price reductions, reduced gross margins and loss of market share. Our competitors include Berlitz International Inc., Simon & Schuster, Inc. (Pimsleur), a subsidiary of CBS Corporation, Random House Ventures LLC (Living Language), Disney Publishing Worldwide, a subsidiary of Walt Disney Company, and McGraw-Hill Education, a subsidiary of The McGraw-Hill Companies. Many of our current and potential competitors have longer operating histories and substantially greater financial, technical, sales, marketing and other resources than we do, as well as greater name recognition worldwide. The resources of these competitors also may enable them to respond more rapidly to new or emerging technologies and changes in customer requirements, reduce prices to win new customers and offer free language learning software or online services. We may not be able to compete successfully against current or future competitors.
As the market for foreign language solutions continues to develop, a number of other companies with greater resources than ours could attempt to enter the market or increase their presence by acquiring or forming strategic alliances with our competitors or our distributors or by introducing their own competing products. These companies and their products may be superior to any of our current competition. We also expect to see increased competition from imitation products which are lower priced, lower quality products that attempt to capitalize on the popularity of our products by utilizing similar packaging and marketing materials. We may not have the financial resources, technical
20
expertise, marketing, distribution or support capabilities to compete effectively with any of these new entrants to the market.
We have seen an increase of language learning applications on mobile platforms, such as iPhones and iPads, that are offered at extremely low prices and, while they are currently limited in scope and ability to teach languages, they may present a threat as they develop.
As we continue to expand into foreign markets, we expect that we will experience competition from local foreign language learning companies that have strong brand recognition and more experience in selling to local consumers and a better understanding of local marketing, sales channels and consumer preferences.
Our success will depend on our ability to adapt to these competitive forces, to adapt to technological advances, to develop more advanced products more rapidly and less expensively than our competitors, to continue to develop an international sales network, to adapt to changing consumer preferences and to educate potential customers about the benefits of using our solutions rather than our competitors' products and services. Existing or new competitors could introduce new products and services with superior features and functionality at lower prices. This could impair our ability to sell our products and services.
Demand for paid language learning solutions such as ours could decline if effective language learning solutions become available for free.
Presently there are a number of free online language websites offering limited vocabulary lists and grammar explanations and tips. In addition, there are some online services offering limited free lessons and learning tools, including one sponsored by the U.S. Department of Education to help immigrants learn English. Many of these websites offer free language practice opportunities with other language learners. If these free products become more sophisticated and competitive or gain widespread acceptance by the public, demand for our solutions could decline.
Our future growth and profitability will depend in large part upon the effectiveness and efficiency of our marketing expenditures.
Our future growth and profitability will depend in large part upon the effectiveness and efficiency of our marketing expenditures, including our ability to:
- •
- create greater awareness of our brands and our language learning solutions;
- •
- select the right market, media and specific media vehicle in which to advertise;
- •
- identify the most effective and efficient level of spending in each market, media and specific media vehicle;
- •
- determine the appropriate creative message and media mix for advertising, marketing and promotional expenditures;
- •
- effectively manage marketing costs, including creative and media expenses, in order to maintain acceptable customer
acquisition costs;
- •
- drive traffic to our websites, call centers, kiosks and distribution channels; and
- •
- convert customer inquiries into actual orders.
Our planned marketing expenditures may not result in increased revenue or generate sufficient levels of product and brand name awareness, and we may not be able to increase our net sales at the same rate as we increase our advertising expenditures.
Much of our radio, television and print advertising has been through the purchase of "remnant" advertising segments. These segments are random time slots and publication dates that have remained
21
unsold and are offered at discounts to advertisers who are willing to be flexible with respect to time slots. There is a limited supply of this type of advertising and the availability of such advertising may decline or the cost of such advertising may increase. In addition, if we increase our marketing budget we cannot assure you that we can increase the amount of remnant advertising at the discounted prices we have obtained in the past. If any of these events occur, we may be forced to purchase time slots and publication dates at higher prices, which will increase our costs.
Our business depends on our Rosetta Stone brand, and if we are not able to maintain and enhance our brand, our business and operating results may be harmed.
We believe that market awareness of our Rosetta Stone brand in the United States has contributed significantly to the success of our business. We also believe that maintaining and enhancing the Rosetta Stone brand is critical to maintaining our competitive advantage. As we continue to grow in size, expand our products and services and extend our geographic reach, maintaining the quality and consistency of our language learning solutions, and thus the quality of our brand, may be more difficult. In addition, software piracy and trademark infringement may harm our Rosetta Stone brand by undermining our reputation for quality software programs. We must continue to update our marketing communications in order to maintain and enhance our brand awareness and the value of our brand. Failure to do so may result in a decrease in brand value and related sales.
We depend on search engines and other online sources to attract visitors to our websites, and if we are unable to attract these visitors and convert them into customers in a cost-effective manner, our business and financial results may be harmed.
Our success depends on our ability to attract online consumers to our websites and convert them into customers in a cost-effective manner. We depend, in part, on search engines and other online sources for our website traffic. We are included in search results as a result of both paid search listings, where we purchase specific search terms that will result in the inclusion of our listing, and algorithmic searches that depend upon the searchable content on our sites. Search engines and other online sources revise their algorithms from time to time in an attempt to optimize their search results.
If one or more of the search engines or other online sources on which we rely for website traffic were to modify its general methodology for how it displays our websites, resulting in fewer consumers clicking through to our websites, our sales could suffer. If any free search engine on which we rely begins charging fees for listing or placement, or if one or more of the search engines or other online sources on which we rely for purchased listings, modifies or terminates its relationship with us, our expenses could rise, we could lose customers and traffic to our websites could decrease.
Our expansion into international markets may not succeed and imposes special risks.
Our business strategy contemplates continued expansion into international markets. We are currently expanding our direct sales channels in Europe and Asia. In addition, we are expanding our indirect sales channels in Europe, Asia and Latin America through retailer and distributor arrangements with third parties. If we are unable to expand our international operations successfully and in a timely manner, our ability to pursue our growth strategy will be impaired. Such expansion may be more difficult or take longer than we anticipate, and we may not be able to successfully market, sell, deliver and support our products and services internationally.
Our international operations and our efforts to increase sales in international markets are subject to a number of risks that are in addition to or different than those affecting our U.S. operations, including:
- •
- difficulty in staffing and managing geographically dispersed operations and culturally diverse work forces and increased travel, infrastructure and legal compliance costs associated with multiple international locations;
22
- •
- difficulty in establishing and maintaining financial and other internal controls over geographically dispersed operations;
- •
- competition from local foreign language software providers and preferences for local products in some regions;
- •
- expenses associated with customizing products, support services and websites for foreign countries;
- •
- inability to identify an effective and efficient level of advertising, marketing and promotional expenditures in order to
maintain acceptable customer acquisition costs;
- •
- difficulties with providing appropriate and appealing products to suit consumer preferences and capabilities in these
markets, such as the potential need to customize English language software solutions for local markets;
- •
- difficulties with establishing successful kiosk sales channels;
- •
- inability to successfully develop relationships with significant retailers and distributors;
- •
- potential political and economic instability in some regions;
- •
- potential unpredictable changes in foreign government regulations;
- •
- legal and cultural differences in the conduct of business;
- •
- import and export license requirements, tariffs, taxes and other trade barriers;
- •
- inflation and fluctuations in currency exchange rates;
- •
- potentially adverse tax consequences;
- •
- difficulties in enforcing contracts and collecting accounts receivable, and longer payment cycles, especially in emerging
markets;
- •
- the burden and difficulties of complying with a wide variety of U.S. and foreign laws, regulations, trade standards,
treaties and technical standards, including the Foreign Corrupt Practices Act;
- •
- difficulty in protecting our intellectual property and the high incidence of software piracy in some regions;
- •
- costs and delays in downsizing foreign work forces as a result of differing employment and other laws;
- •
- protectionist laws and business practices that favor local competitors; and
- •
- uncertainty regarding liability for information retrieved and replicated in foreign countries.
The effects of any of the risks described above could reduce our future revenue from our international operations and could harm our overall business, revenue and financial results.
If the recognition by schools and other institutions of the value of technology-based education does not continue to grow, our ability to generate revenue from institutions could be impaired.
Our success depends in part upon the continued adoption by institutions and potential customers of technology-based education initiatives. Some academics and educators oppose online education in principle and have expressed concerns regarding the perceived loss of control over the education process that can result from offering courses online. If the acceptance of technology-based education does not grow our ability to continue to grow our institutional business could be impaired.
23
If there are changes in the spending policies or budget priorities for government funding of colleges, universities, schools, other education providers, armed forces or government agencies, we could lose revenue.
Many of our institutional customers are colleges, universities, primary and secondary schools, other education providers, armed forces and government agencies that depend substantially on government funding. Accordingly, any general decrease, delay or change in federal, state or local funding for colleges, universities, primary and secondary schools, or other education providers or for armed forces or government agencies that use our products and services could cause our current and potential customers to reduce their purchases of our products and services, to exercise their right to terminate licenses, or to decide not to renew licenses, any of which could cause us to lose revenue. In addition, a specific reduction in governmental funding support for products such as ours would also cause us to lose revenue and could hurt our overall gross margins.
Some of our institutional business faces a lengthy and unpredictable sales cycle for our solutions, which could delay new sales.
We face a lengthy sales cycle between our initial contact with some potential institutional customers and the signing of license agreements with these customers. As a result of this lengthy sales cycle, we have only a limited ability to forecast the timing of such institutional sales. A delay in or failure to complete license transactions could cause us to lose revenue, and could cause our financial results to vary significantly from quarter to quarter. Our sales cycle varies widely, reflecting differences in our potential institutional customers' decision-making processes, procurement requirements and budget cycles, and is subject to significant risks over which we have little or no control, including:
- •
- customers' budgetary constraints and priorities;
- •
- the timing of our customers' budget cycles;
- •
- the need by some customers for lengthy evaluations that often include both their administrators and faculties; and
- •
- the length and timing of customers' approval processes.
If we are unable to continually enhance our products and services and adapt them to technological changes and customer needs, including the emergence of new computing devices and more sophisticated online services, we may lose market share and revenue and our business could suffer.
We need to anticipate, develop and introduce new products, services and applications on a timely and cost-effective basis that keeps pace with technological developments and changing customer needs. For example, the number of individuals who access the internet through devices other than a personal computer, such as tablet computers, personal digital assistants, mobile telephones, televisions and set-top box devices, has increased dramatically, and this trend is likely to continue. Our traditional products and services were designed for high resolution, graphical environments such as those available on desktop and laptop computers. The lower resolution, functionality and memory associated with alternative devices currently available may make the use of our products and services through such devices difficult. In addition, our products and services may not work or be viewable on these devices because each manufacturer or distributor may establish unique technical standards for such devices. With the exception of the recently released TOTALe Mobile Companion and Rosetta Stone Discover, we have no experience to date in operating versions of our products and services developed or optimized for users of alternative devices, and new devices and new platforms are continually being released. Accordingly, it is difficult to predict the problems we may encounter in developing versions of our products and services for use on these alternative devices, and we may need to devote significant resources to the creation, support and maintenance of such versions. If we fail to develop or sell products and services that respond to these or other technological developments and changing customer needs cost effectively, we may lose market share and revenue and our business could suffer.
24
If we fail to manage our growth effectively, we may experience difficulty in filling purchase orders, declines in product and service quality and customer satisfaction, increased costs or disruption in our operations.
We have experienced rapid growth in our business, which has strained our managerial, operational, financial and other resources.
We anticipate that continued growth of our operations will be required to satisfy increasing consumer and institutional demand and to avail ourselves of new market opportunities. The expanding scope of our business and growth in the number of our employees, customers and sales locations will continue to place a significant strain on our management team, information technology systems and other resources. To properly manage our growth, we need to hire and retain personnel, upgrade our existing operational, management and financial and reporting systems, including warehouse management and inventory control, improve our business processes and controls and identify and develop relationships with additional retailers and distributors. We may also be required to expand our distribution facilities and our operational facilities or add new facilities, which could require significant capital expenditures. Failure to effectively manage our growth in a cost-effective manner could result in difficulty in filling purchase orders, declines in product and service quality and customer satisfaction, increased costs or disruption of our operations.
Our growth also makes it difficult for us to adequately predict the expenditures we will need to make in the future. If we do not make the necessary overhead expenditures to accommodate our future growth, we may not be successful in executing our growth strategy.
Our revenue is subject to seasonal and quarterly variations, which could cause our financial results to fluctuate significantly.
We have experienced, and we believe we will continue to experience, substantial seasonal and quarterly variations in our revenue and net income. These variations are primarily related to increased sales of our products and services to consumers in the fourth quarter during the holiday selling season as well as higher sales to governmental and educational institutions in the second and third quarters. We sell to a significant number of our retailers, distributors and institutional customers on a purchase order basis and we receive orders when these customers need products and services. As a result, their orders are typically not evenly distributed throughout the year. Our quarterly results of operations also may fluctuate significantly as a result of a variety of other factors, including the timing of holidays and advertising initiatives, changes in our products, services and advertising initiatives and changes in those of our competitors. Budgetary constraints of our institutional customers may also cause our quarterly results to fluctuate.
As a result of these seasonal and quarterly fluctuations, we believe that comparisons of our results of operations between different quarters are not necessarily meaningful and that these comparisons are not reliable as indicators of our future performance. In addition, these fluctuations could result in volatility and adversely affect our cash flows. As our business grows, these seasonal fluctuations may become more pronounced. Any seasonal or quarterly fluctuations that we report in the future may differ from the expectations of market analysts and investors. This could cause the price of our common stock to fluctuate significantly.
Substantially all of our inventory is located in one warehouse facility. Any damage or disruption at this facility could cause significant financial loss, including loss of revenue and harm to our reputation.
Substantially all of our inventory is located in one warehouse facility. We could experience significant interruption in the operation of this facility or damage or destruction of our inventory due to natural disasters, accidents, failures of the inventory locator or automated packing and shipping systems or other events. If a material portion of our inventory were to be damaged or destroyed, we might be unable to meet our contractual obligations which could cause us significant financial loss, including loss of revenue and harm to our reputation.
25
The loss of key personnel or the failure to attract and retain highly qualified personnel could compromise our ability to effectively manage our business and pursue our growth strategy.
Our future performance depends on the continued service of our key technical, development, sales, services and management personnel. We rely on our executive officers and senior management to execute our existing business plans and to identify and pursue new opportunities. We rely on our technical and development personnel for product innovation. We generally do not have employment agreements with our personnel and, therefore, they could terminate their employment with us at any time. The loss of key employees could result in significant disruptions to our business, and the integration of replacement personnel could be costly and time consuming, could cause additional disruptions to our business, and could be unsuccessful. We do not carry key person life insurance covering any of our employees.
Our future success also depends on our continued ability to attract and retain highly qualified technical, development, sales, services and management personnel. Competition for such personnel is intense, and we may fail to retain our key employees or attract or retain other highly qualified personnel in the future. Many of our employees are located in Harrisonburg, Virginia, a city that does not have a large pool of qualified replacement personnel. The lack of qualified local replacement personnel may make it more difficult to quickly find replacement personnel and may increase the costs of identifying and relocating replacement personnel to Harrisonburg, Virginia.
In addition, wage inflation and the cost of retaining our key personnel in the face of competition for such personnel may increase our costs faster than we can offset these costs with increased prices or increased sales volume.
If we are unable to hire, train, motivate and retain sales personnel to staff our kiosks, or to identify suitable locations and negotiate site licenses on acceptable terms, we could lose revenue, our costs could increase and our profitability could decline.
In order to successfully grow our kiosk sales channel we must be able to hire, train, motivate and retain sales personnel to staff these kiosks. Our kiosks are small and widely dispersed, and, as such, are operated without substantial hands-on management or oversight by us. As a result, we depend on our kiosk sales personnel to effectively manage sales, customer issues and reporting of financial transactions from these kiosks. The opening and success of new kiosks will depend upon various additional factors, including our ability to identify suitable locations and our ability to negotiate site licenses on acceptable terms and labor costs. Specifically, we must identify and negotiate cost-effective site licenses for kiosk locations that will generate sufficient consumer demand. Many of these site licenses contain terms and conditions that are highly favorable to licensors including allowing licensors to cancel them on short notice, sometimes as little as thirty days, and broad indemnification terms in favor of licensors. If competition for kiosk space increases, license rates may increase and other terms may become even less favorable to us, resulting in lower profitability. Our failure to properly manage the expansion of this sales channel could cause us to lose revenue and increase our expenses.
Failure to maintain the availability of the systems, networks, databases and software required to operate and deliver our internet-based products and services could damage our reputation and cause us to lose revenue.
We rely on internal systems and external systems, networks and databases maintained by us and third-party providers to process customer orders, handle customer service requests, and host and deliver our internet-based language learning solutions, including our online language courses and Rosetta Stone TOTALe, and our SharedTalk online peer-to-peer collaborative and interactive community. Any damage, interruption or failure of our systems, networks and databases could prevent us from processing customer orders and result in degradation or interruptions in delivery of our products and services. Notwithstanding our efforts to protect against interruptions in the availability of our e-commerce websites and internet-based products and services, we do occasionally experience unplanned outages or
26
technical difficulties. In addition, we do not have complete redundancy for all of our systems. We do not maintain real-time back-up of all of our data, and in the event of system disruptions, we could experience loss of data which could cause us to lose customers and could harm our reputation and cause us to face unexpected liabilities and expenses. If we continue to expand our business, we will put additional strains on these systems. We may also need to grow, reconfigure or relocate our data centers in response to changing business needs, which may be costly and lead to unplanned disruptions of service.
We are subject to U.S. and foreign government regulation of online services which could subject us to claims, judgments, and remedies including monetary liabilities and limitations on our business practices.
We are subject to regulations and laws directly applicable to providers of online services. The application of existing domestic and international laws and regulations to us relating to issues such as user privacy and data protection, defamation, promotions, billing, consumer protection, accessibility, content regulation, quality of services, and intellectual property ownership and infringement in many instances is unclear or unsettled. In addition, we will also be subject to any new laws and regulations directly applicable to our domestic and international activities. Internationally, we may also be subject to laws regulating our activities in foreign countries and to foreign laws and regulations that are inconsistent from country to country. We may incur substantial liabilities for expenses necessary to defend litigation in connection with such regulations and laws or to comply with these laws and regulations, as well as potential substantial penalties for any failure to comply.
We may be subject to legal liability for new web-based online services.
Rosetta Stone TOTALe enables individuals to exchange information and engage in various online activities on a domestic and an international basis. The law relating to the liability of providers of online services for activities of their users is currently unsettled both within the U.S. and internationally. Claims may be brought against us for defamation, negligence, copyright or trademark infringement, unlawful activity, tort, including personal injury, fraud, or other theories based on the nature and content of information that may be posted online or generated by our users. Defense of any such actions could be costly and involve significant time and attention of our management and other resources and may require us to change our business in an adverse manner.
In addition, the amount of data we store for our users on our servers (including personal information) will increase as we increase our web based services. Any systems failure or compromise of our security that results in the release of our users' data could seriously limit the adoption of our products and services as well as harm our reputation and brand and, therefore, our business. We may also need to expend significant resources to protect against security breaches. The risk that these types of events could seriously harm our business is likely to increase as we expand the number of web based products and services we offer as well as increase the number of countries where we operate.
Further, failure or perceived failure by us to comply with our policies, applicable requirements, or industry self-regulatory principles related to the collection, use, sharing or security of personal information, or other privacy, data-retention or data-protection matters could result in a loss of user confidence in us, damage to our brands, and ultimately in a loss of users, advertising partners, or affiliates which could adversely affect our business.
Our possession and use of personal information presents risks and expenses that could harm our business. Unauthorized disclosure or manipulation of such data, whether through breach of our network security or otherwise, could expose us to costly litigation and damage our reputation.
Maintaining our network security is of critical importance because our online e-commerce systems and our online administration tools for our institutional business store proprietary and confidential customer, employee and other sensitive data, such as names, addresses, other personal information and
27
credit card numbers. We and our vendors use commercially available encryption technology to transmit personal information when taking orders. We use security and business controls to limit access and use of personal information. However, third parties may be able to circumvent these security and business measures by developing and deploying viruses, worms and other malicious software programs that are designed to attack or attempt to infiltrate our systems and networks. In addition, employee error, malfeasance or other errors in the storage, use or transmission of personal information could result in a breach of customer or employee privacy. We employ contractors and temporary and part-time employees who may have access to the personal information of customers and employees. It is possible such individuals could circumvent our controls, which could result in a breach of customer or employee privacy.
Possession and use of personal information in conducting our business subjects us to legislative and regulatory burdens that could require notification of data breach, restrict our use of personal information and hinder our ability to acquire new customers or market to existing customers. We have incurred, and will continue to incur, expenses to comply with privacy and security standards and protocols imposed by law, regulation, industry standards or contractual obligations.
If third parties improperly obtain and use the personal information of our customers or employees, we may be required to expend significant resources to resolve these problems. A major breach of our network security and systems could have serious negative consequences for our businesses, including possible fines, penalties and damages, reduced customer demand for our products and services, harm to our reputation and brand and loss of our ability to accept and process customer credit card orders.
We are exposed to risks associated with credit card and payment fraud and with credit card processing, which could cause us to lose revenue.
Many of our customers use credit cards or automated payment systems to pay for our products and services. We have suffered losses, and may continue to suffer losses, as a result of orders placed with fraudulent credit cards or other fraudulent payment data. For example, under current credit card practices, we may be liable for fraudulent credit card transactions if we do not obtain a cardholder's signature, a frequent practice in internet sales. We employ technology solutions to help us detect fraudulent transactions. However, the failure to detect or control payment fraud could cause us to lose sales and revenue.
Any significant interruptions in the operations of our call center or third-party call centers could cause us to lose sales and disrupt our ability to process orders and deliver our solutions in a timely manner.
We rely on both an in-house call center and third-party call centers to sell our solutions, respond to customer service and technical support requests and process orders. Any significant interruption in the operation of these facilities, including an interruption caused by our failure to successfully expand or upgrade our systems or to manage these expansions or upgrades, could reduce our ability to receive and process orders and provide products and services, which could result in lost and cancelled sales and damage to our brand and reputation.
As we grow, we will need more capacity from those existing call centers or we will need to identify and contract with new call centers. We may not be able to continue to locate and contract for call center capacity on favorable terms, or at all. Additionally, the rates those call centers charge us may increase or those call centers may not continue to provide service at the current levels.
We structure our marketing and advertising to drive potential customers to our call centers and websites to purchase our solutions. If our call center operators do not convert inquiries into sales at expected rates, our ability to generate revenue could be impaired. Training and retaining qualified call center operators is challenging due to the expansion of our product and service offerings and the seasonality of our business. If we do not adequately train our call center operators, they will not convert inquiries into sales at an acceptable rate.
28
Our call center employs a large number of personnel and historically has been subject to a high turnover rate among employees. We may have to terminate employees from time to time as our business changes and labor demands shift among our facilities. Any significant increase in labor costs, deterioration of employee relations, slowdowns or work stoppages at any of our locations, due to employee turnover or otherwise, could harm our business and profitability. In addition, high employee turnover could increase our exposure to employee-related litigation. Likewise, the third-party call centers we utilize face similar issues.
If any of our products contain defects or errors or if new product releases or services are delayed, our reputation could be harmed, resulting in significant costs to us and impairing our ability to sell our solutions.
If our products contain defects, errors or security vulnerabilities, our reputation could be harmed, which could result in significant costs to us and impair our ability to sell our products in the future. In the past, we have encountered product development delays due to errors or defects. We would expect that, despite our testing, errors will be found in new products and product enhancements in the future. Significant errors in our products or services could lead to, among other things:
- •
- delays in or loss of market acceptance of our products and services;
- •
- diversion of our resources;
- •
- a lower rate of license renewals or upgrades for consumer and institutional customers;
- •
- injury to our reputation; or
- •
- increased service expenses or payment of damages.
In addition, we could face claims for product liability, tort or breach of warranty. Our contracts with customers contain provisions relating to warranty disclaimers and liability limitations, which may not be upheld. Defending a lawsuit, regardless of its merit, is costly and may divert management's attention and adversely affect the market's perception of us and our products and services. In addition, if our business liability insurance coverage proves inadequate or future coverage is unavailable on acceptable terms, or at all, we could face significant financial losses.
Our sales to U.S. government agencies and armed forces subject us to special risks that could adversely affect our business.
Government sales entail a variety of risks including:
- •
- government contracts are subject to the approval of appropriations by the United States Congress to fund the expenditures
by the agencies under these contracts. Congress often appropriates funds for government agencies on a yearly basis, even though their contracts may call for performance over a number of years;
- •
- our products and services are included on a General Services Administration, or GSA, schedule. The loss of the GSA
schedule covering our software products and related services could cause us to lose our ability to sell our products and services to U.S. government customers;
- •
- we must comply with complex federal procurement laws and regulations in connection with government contracts, which may
impose added costs on our business; and
- •
- federal government contracts contain provisions and are subject to laws and regulations that provide government customers with rights and remedies not typically found in commercial contracts. These rights and remedies allow government clients, among other things, to terminate existing contracts, with short notice, for convenience without cause, reduce or modify contracts or subcontracts, and claim rights in products, systems, and technology produced by us.
29
If we fail to effectively upgrade our information technology systems, we may not be able to accurately report our financial results or prevent fraud.
As part of our efforts to continue improving our internal control over financial reporting, we plan to continue to upgrade our existing financial information technology systems in order to automate several controls that are currently performed manually. We may experience difficulties in transitioning to these upgraded systems, including loss of data and decreases in productivity, as personnel become familiar with these new systems. In addition, our management information systems will require modification and refinement as we grow and as our business needs change, which could prolong difficulties we experience with systems transitions, and we may not always employ the most effective systems for our purposes. If we experience difficulties in implementing new or upgraded information systems or experience significant system failures, or if we are unable to successfully modify our management information systems or respond to changes in our business needs, we may not be able to effectively manage our business and we may fail to meet our reporting obligations. In addition, as a result of the automation of these manual processes, the data produced may cause us to question the accuracy of previously reported financial results.
Our software products must interoperate with computer operating systems of our customers. If we are unable to ensure that our products interoperate properly with customer systems, our business could be harmed.
Our products must interoperate with our customers' computer systems, including student learning management systems of our institutional customers. As a result, we must continually ensure that our products interoperate properly with these systems. Changes in operating systems, the technologies we incorporate into our products or the computer systems our customers use may damage our business. For example, our online Version 2 software subscriptions, which we offer in four languages, does not currently operate properly with the newly released Microsoft Windows® 7 and Mac OS® X operating systems.
As our product and service offerings become more complex, our reported revenue may become less predictable.
Our planned expansion of products and services will generate more varied sources of revenue than our existing business. The accounting policies that apply to these sources of revenue may be more complex than those that apply to our traditional products and services. In addition, we may change the manner in which we sell our software licenses, and such change could cause delays in revenue recognition in accordance with accounting standards. Under these accounting standards, even if we deliver products and services to, and collect cash from, a customer in a given fiscal period, we may be required to defer recognizing revenue from the sale of such product or service until a future period when all the conditions necessary for revenue recognition have been satisfied. Conditions that can cause delays in revenue recognition include software arrangements that have undelivered elements for which we have not yet established vendor specific objective evidence of fair value, requirements that we deliver services for significant enhancements or modifications to customize our software for a particular customer or material customer acceptance criteria.
Many of our expenses are fixed and many are based, in significant part, on our expectations of our future revenue and are incurred prior to the sale of our products and services. Therefore, any significant decline in revenue for any period could have an immediate negative impact on our margins, net income and financial results for the period.
Our expense levels are based, in significant part, on our estimates of future revenue and many of these expenses are fixed in the short term. As a result, we may be unable to adjust our spending in a timely manner if our revenue falls short of our expectations. Accordingly, any significant shortfall of revenue in relation to our estimates could have an immediate negative effect on our profitability. In addition, as our business grows, we anticipate increasing our operating expenses to expand our product
30
development, technical support, sales and marketing and administrative organizations. Any such expansion could cause material losses to the extent we do not generate additional revenue sufficient to cover the additional expenses.
We may need to raise additional funds to pursue our growth strategy or continue our operations, and we may be unable to raise capital when needed.
From time to time, we may seek additional equity or debt financing to provide for the capital expenditures required to finance working capital requirements, continue our expansion, develop new products and services or make acquisitions or other investments. In addition, if our business plans change, general economic, financial or political conditions in our markets change, or other circumstances arise that have a material effect on our cash flow, the anticipated cash needs of our business as well as our conclusions as to the adequacy of our available sources of capital could change significantly. Any of these events or circumstances could result in significant additional funding needs, requiring us to raise additional capital. We cannot predict the timing or amount of any such capital requirements at this time. If financing is not available on satisfactory terms, or at all, we may be unable to expand our business or to develop new business at the rate desired and our results of operations may suffer.
Risks Related to Intellectual Property Rights
Protection of our intellectual property is limited, and any misuse of our intellectual property by others, including software piracy, could harm our business, reputation and competitive position.
Our intellectual property is important to our success. We believe our trademarks, copyrights, trade secrets, pending patents, trade dress and designs are valuable and integral to our success and competitive position. To protect our proprietary rights, we rely on a combination of copyrights, trademarks, trade secret laws, confidentiality procedures, contractual provisions and technical measures.
We have several patent applications on file. However, we do not know whether any of our pending patent applications will result in the issuance of patents or whether the examination process will require us to narrow our claims. Even if patents are issued from our patent applications, which is not certain, they may be contested, circumvented or invalidated in the future. Moreover, the rights granted under any issued patents may not provide us with proprietary protection or competitive advantages, and, as with any technology, competitors may be able to develop similar or superior technologies now or in the future. In addition, we have not emphasized patents as a source of significant competitive advantage and have instead sought to primarily protect our proprietary rights under laws affording protection for trade secrets, copyright and trademark protection of our products, brands, trademarks and other intellectual property where available and appropriate. However, all of these measures afford only limited protection and may be challenged, invalidated or circumvented by third parties. In addition, these protections may not be adequate to prevent our competitors or customers from copying or reverse-engineering our products. Third parties could copy all or portions of our products or otherwise obtain, use, distribute and sell our proprietary information without authorization. Third parties may also develop similar or superior technology independently by designing around our intellectual property, which would decrease demand for our products. In addition, our patents may not provide us with any competitive advantages and the patents of others may seriously impede our ability to conduct our business.
We protect our products, trade secrets and proprietary information, in part, by requiring all of our employees to enter into agreements providing for the maintenance of confidentiality and the assignment of rights to inventions made by them while employed by us. We also enter into non-disclosure agreements with our technical consultants, customers, vendors and resellers to protect our confidential and proprietary information. We cannot assure you that our confidentiality agreements
31
with our employees, consultants and other third parties will not be breached, that we will be able to effectively enforce these agreements, that we will have adequate remedies for any breach, or that our trade secrets and other proprietary information will not be disclosed or will otherwise be protected.
We rely on contractual and license agreements with third parties in connection with their use of our products and technology. There is no guarantee that such parties will abide by the terms of such agreements or that we will be able to adequately enforce our rights, in part because we rely, in many instances, on "click-wrap" and "shrink-wrap" licenses, which are not negotiated or signed by individual licensees. Accordingly, some provisions of our licenses, including provisions protecting against unauthorized use, copying, transfer, resale and disclosure of the licensed software program, may be unenforceable under the laws of several jurisdictions.
Protection of trade secret and other intellectual property rights in the markets in which we operate and compete is highly uncertain and may involve complex legal questions. The laws of countries in which we operate may afford little or no protection to our trade secrets and other intellectual property rights. Although we defend our intellectual property rights and combat unlicensed copying and use of software and intellectual property rights through a variety of techniques, preventing unauthorized use or infringement of our intellectual property rights is inherently difficult. Despite our enforcement efforts against software piracy, we lose significant revenue due to illegal use of our software. If piracy activities increase, it may further harm our business.
We also expect that the more successful we are, the more likely that competitors will try to illegally use our proprietary information and develop products that are similar to ours, which may infringe on our proprietary rights. In addition, we could potentially lose future trade secret protection for our source code if any unauthorized disclosure of such code occurs. The loss of future trade secret protection could make it easier for third parties to compete with our products by copying functionality. In addition, any changes in, or unexpected interpretations of, the trade secret and other intellectual property laws in any country in which we operate may compromise our ability to enforce our trade secret and intellectual property rights. Costly and time-consuming litigation could be necessary to enforce and determine the scope of our confidential information and trade secret protection. If we are unable to protect our proprietary rights or if third parties independently develop or gain access to our or similar technologies, our business, revenue, reputation and competitive position could be harmed.
Third-party use of our trademarks as keywords in internet search engine advertising programs may direct potential customers to competitors' websites, which could harm our reputation and cause us to lose sales.
Competitors and other third parties purchase our trademarks and confusingly similar terms as keywords in internet search engine advertising programs and in the header and text of the resulting sponsored link advertisements in order to divert potential customers to their websites. Preventing such unauthorized use is inherently difficult. If we are unable to protect our trademarks and confusingly similar terms from such unauthorized use, competitors and other third parties may continue to drive potential online customers away from our websites to competing websites, which could harm our reputation and cause us to lose sales.
Our trademarks are limited in scope and geographic coverage and may not significantly distinguish us from our competition.
We own several federal trademark registrations, including the Rosetta Stone mark, hold common law trademark rights and have federal trademark applications pending in the United States and abroad for additional trademarks. Even if federal registrations are granted to us, our trademark rights may be challenged. It is also possible that our competitors will adopt trademarks similar to ours, thus impeding our ability to build brand identity and possibly leading to customer confusion. In fact, various third parties have registered trademarks that are similar to ours in the United States and overseas. We could
32
incur substantial costs in prosecuting or defending trademark infringement suits. If we fail to effectively enforce our trademark rights, our competitive position and brand recognition may be diminished.
We have not registered copyrights for all our products, which may limit our ability to enforce them.
We have not registered our copyrights in all of our software, written materials, website information, designs or other copyrightable works. The United States Copyright Act automatically protects all of our copyrightable works, but without a registration we cannot enforce those copyrights against infringers or seek certain statutory remedies for any such infringement. Preventing others from copying our products, written materials and other copyrightable works is important to our overall success in the marketplace. In the event we decide to enforce any of our copyrights against infringers, we will first be required to register the relevant copyrights, and we cannot be sure that all of the material for which we seek copyright registration would be registrable in whole or in part, or that once registered, we would be successful in bringing a copyright claim against any such infringers.
We must monitor and protect our internet domain names to preserve their value. We may be unable to prevent third parties from acquiring domain names that are similar to, infringe on or otherwise decrease the value of our trademarks.
We own several domain names that include the terms Rosetta Stone and Rosetta World. Third parties may acquire substantially similar domain names that decrease the value of our domain names and trademarks and other proprietary rights which may hurt our business. Moreover, the regulation of domain names in the United States and foreign countries is subject to change. Governing bodies could appoint additional domain name registrars or modify the requirements for holding domain names. Governing bodies could also establish additional "top-level" domains, which are the portion of the Web address that appears to the right of the "dot," such as "com," "gov" or "org." As a result, we may not maintain exclusive rights to all potentially relevant domain names in the United States or in other countries in which we conduct business, which could harm our business or reputation.
Claims that we misuse the intellectual property of others could subject us to significant liability and disrupt our business.
We may become subject to material claims of infringement by competitors and other third parties with respect to current or future products, e-commerce and other web-related technologies, online business methods, trademarks or other proprietary rights. Our competitors, some of which may have substantially greater resources than us and have made significant investments in competing products and technologies, may have, or seek to apply for and obtain, patents, copyrights or trademarks that will prevent, limit or interfere with our ability to make, use and sell our current and future products and technologies, and we may not be successful in defending allegations of infringement of these patents, copyrights or trademarks. Further, we may not be aware of all of the patents and other intellectual property rights owned by third parties that may be potentially adverse to our interests. We may need to resort to litigation to enforce our proprietary rights or to determine the scope and validity of a third-party's patents or other proprietary rights, including whether any of our products, technologies or processes infringe the patents or other proprietary rights of third parties. We may incur substantial expenses in defending against third-party infringement claims regardless of the merit of such claims. The outcome of any such proceedings is uncertain and, if unfavorable, could force us to discontinue sales of the affected products or impose significant penalties or restrictions on our business. We do not conduct comprehensive patent searches to determine whether the technologies used in our products infringe upon patents held by others. In addition, product development is inherently uncertain in a rapidly evolving technological environment in which there may be numerous patent applications pending, many of which are confidential when filed, with regard to similar technologies.
33
We do not own all of the software, other technologies and content used in our products and services.
Some of our products and services include intellectual property owned by third parties, including software that is integrated with internally developed software and a portion of our voice recognition software, which we license from the University of Colorado. From time to time we may be required to renegotiate with these third parties or negotiate with new third parties to include their technology or content in our existing products, in new versions of our existing products or in wholly new products. We may not be able to negotiate or renegotiate licenses on commercially reasonable terms, or at all, and the third-party software may not be appropriately supported, maintained or enhanced by the licensors. If we are unable to obtain the rights necessary to use or continue to use third-party technology or content in our products and services, the inability to support, maintain and enhance any software could result in increased costs, or in delays or reductions in product shipments until equivalent software could be developed, identified, licensed and integrated.
Our use of open source software could impose limitations on our ability to commercialize our products.
We incorporate open source software into our products and may use more open source software in the future. The use of open source software is governed by license agreements. The terms of many open source licenses have not been interpreted by U.S. courts, and there is a risk that these licenses could be construed in a manner that could impose unanticipated conditions or restrictions on our ability to commercialize our products. In such event, we could be required to seek licenses from third parties in order to continue offering our products, make generally available, in source code form, proprietary code that links to certain open source modules, re-engineer our products, discontinue the sale of our products if re-engineering could not be accomplished on a cost-effective and timely basis, or become subject to other consequences. In addition, open source licenses generally do not provide warranties or other contractual protections regarding infringement claims or the quality of the code. Thus, we may have little or no recourse if we become subject to infringement claims relating to the open source software or if the open source software is defective in any manner.
Risks Related to Owning Our Common Stock
Some of our stockholders could together exert significant influence over our company.
As of December 31, 2010, funds affiliated with ABS Capital Partners beneficially owned in the aggregate shares representing approximately 25% of our outstanding voting power. Two managing members of the general partner of ABS Capital Partners currently serve on our board of directors. Additionally, as of December 31, 2010, Norwest Equity Partners VIII, LP, or Norwest, beneficially owned in the aggregate shares representing approximately 16% of our outstanding voting power. One managing member of the general partner of Norwest currently serves on our board of directors. As a result, these stockholders could together potentially have significant influence over all matters presented to our stockholders for approval, including election and removal of our directors and change of control transactions. The interests of these stockholders may not always coincide with the interests of the other holders of our common stock.
As a public company we incur additional cost and face increased demands on our management and key employees.
We have operated as a public company only since April 15, 2009. As a public company, we incur significant legal, accounting and other expenses that we did not incur as a private company. In addition, the Sarbanes-Oxley Act of 2002, as well as rules implemented by the Securities and Exchange Commission, or SEC, and the New York Stock Exchange, impose various requirements on public companies. Our management and other personnel devote substantial amounts of time to these requirements. Moreover, these requirements have significantly increased our legal and financial
34
compliance costs and have made some activities more time-consuming and costly. In addition, we incur additional costs associated with our public company reporting requirements. These rules and regulations also make it more difficult and more expensive for us to obtain director and officer liability insurance. We estimate that the incremental annual public company costs will be between $1.5 million and $2.0 million in fiscal 2011, which will primarily be reflected in general and administrative costs. However, these estimates may prove to be inaccurate as many of these costs are beyond our control, and the actual incremental costs associated with our public company status could materially exceed our estimates. If our profitability is harmed by these additional costs, it could have a negative effect on the trading price of our common stock.
If securities analysts do not publish research or reports about our business or if they publish negative evaluations of our stock, the price of our stock could decline.
The trading market for our common stock depends in part on the research and reports that industry or financial analysts publish about us or our business. If one or more of the analysts covering our business downgrade their evaluations of or recommendations regarding our stock, or if one or more of the analysts cease providing research coverage on our stock, the price of our stock could decline. If one or more of these analysts cease providing research coverage on our stock, we could lose visibility in the market for our stock, which in turn could cause our stock price to decline.
Provisions in our organizational documents and in the Delaware General Corporation Law may prevent takeover attempts that could be beneficial to our stockholders.
Provisions in our second amended and restated certificate of incorporation and second amended and restated bylaws, and in the Delaware General Corporation Law, may make it difficult and expensive for a third-party to pursue a takeover attempt we oppose even if a change in control of our company would be beneficial to the interests of our stockholders. Any provision of our second amended and restated certificate of incorporation or second amended and restated bylaws or Delaware law that has the effect of delaying or deterring a change in control could limit the opportunity for our stockholders to receive a premium for their shares of our common stock, and could also affect the price that some investors are willing to pay for our common stock. Our board of directors has the authority to issue up to 10,000,000 shares of preferred stock in one or more series and to fix the powers, preferences and rights of each series without stockholder approval. The ability to issue preferred stock could discourage unsolicited acquisition proposals or make it more difficult for a third party to gain control of our company, or otherwise could adversely affect the market price of our common stock. Further, as a Delaware corporation, we are subject to Section 203 of the Delaware General Corporation Law. This section generally prohibits us from engaging in mergers and other business combinations with stockholders that beneficially own 15% or more of our voting stock, or with their affiliates, unless our directors or stockholders approve the business combination in the prescribed manner. However, because funds affiliated with ABS Capital Partners and Norwest acquired their shares prior to our initial public offering, Section 203 is currently inapplicable to any business combination or transaction with them or their affiliates. In addition, our second amended and restated certificate of incorporation includes a classified board of directors and requires that any action to be taken by stockholders must be taken at a duly called meeting of stockholders and may not be taken by written consent. Our second amended and restated bylaws require that any stockholder proposals or nominations for election to our board of directors must meet specific advance notice requirements and procedures, which make it more difficult for our stockholders to make proposals or director nominations.
35
Our corporate headquarters are located in Arlington, Virginia, where we sublease approximately 31,281 square feet of space. The term of this sublease runs through December 31, 2013.
We continue to lease approximately 8,038 square feet of space in Arlington, Virginia, which was the site of our corporate headquarters until late 2008, with lease terms ending August 31, 2013. We intend to occupy this space until the end of the lease term.
We currently own two facilities with approximately 62,000 and 14,500 square feet of usable space in Harrisonburg, Virginia, that serve as our operations offices. In addition, we lease two facilities with approximately 56,000 and 6,000 square feet in Harrisonburg, Virginia for use as a packing and distribution center for all of our U.S. and some of our international fulfillment, in addition to sales operations.
We also lease space for our three full service retail outlets in Missouri, New Jersey, and New York and for small offices in Boulder, Colorado, Tokyo, Japan, Seoul, South Korea, Munich, Germany and London, United Kingdom. Our Boulder office serves as a research and development location while our Tokyo, Seoul and London offices serve as our regional sales offices.
As of December 31, 2010, we also had site licenses for 259 kiosks. Most of our kiosk site licenses have terms of three to six months and provide for a minimum rent plus a percentage rent based upon sales after certain minimum thresholds have been achieved. These site licenses generally require that we pay insurance, utilities, real estate taxes and repair and maintenance expenses. Some of the site licenses also contain early termination options, which can be exercised by us or the licensor under certain conditions.
In July 2009, we filed a lawsuit in the United States District Court for the Eastern District of Virginia against Google Inc., seeking, among other things, to prevent Google from infringing upon our trademarks. In August 2010, the U.S. District Court for the Eastern District of Virginia issued its final order dismissing our trademark infringement lawsuit against Google. We have appealed the District Court's decision to the U.S. Court of Appeals for the Fourth Circuit. We have incurred, and may continue to incur material legal fees and other costs and expenses in pursuit of our claims against Google.
On or about April 28, 2010, a purported class action lawsuit was filed against us in the Superior Court of the State of California, County of Alameda for unspecified damages, injunctive relief and restitution in the matter of Michael Pierce, Patrick Gould, individually and on behalf of all others similarly situated v. Rosetta Stone Ltd. and DOES 1 to 50. The complaint alleges that plaintiffs and other persons similarly situated who are or were employed by us as salaried managers in its retail locations in California are due unpaid wages and other relief for the Company's violations of state wage and hour laws. Plaintiffs moved to amend their complaint to include a nationwide class on January 21, 2011. We intend to vigorously defend this matter. However, we cannot predict the timing and the ultimate outcome of this matter. Even if the plaintiffs are unsuccessful in their claims against us, we will incur legal fees and other costs in defense of these claims.
From time to time, we have been subject to various claims and legal actions in the ordinary course of our business. We are not currently involved in any legal proceeding the ultimate outcome of which, in our judgment based on information currently available, would have a material adverse impact on our business, financial condition or results of operations.
36
Item 5. Market for Registrant's Common Equity, Related Stockholder Matters and Issuer Purchases of Equity Securities
Market for Common Stock
Our common stock is listed on the New York Stock Exchange, or NYSE, under the symbol "RST." The following table sets forth, for each of the periods indicated, the high and low reported sales price of our common stock on the NYSE.
| |
High | Low | |||||
|---|---|---|---|---|---|---|---|
Year ended December 31, 2010 |
|||||||
Fourth Quarter |
$ | 24.50 | $ | 19.00 | |||
Third Quarter |
25.66 | 16.75 | |||||
Second Quarter |
27.50 | 21.10 | |||||
First Quarter |
26.37 | 16.30 | |||||
Year ended December 31, 2009 |
|||||||
Fourth Quarter |
$ | 23.72 | $ | 16.55 | |||
Third Quarter |
30.69 | 20.35 | |||||
Second Quarter (beginning April 16) |
31.67 | 22.10 | |||||
First Quarter |
— | — | |||||
On March 8, 2011, the last reported sales price of our common stock on the NYSE was $13.82 per share. As of that date, there were approximately 232 holders of record of our common stock.
Dividends
We have not paid any cash dividends on our common stock and do not intend to do so in the foreseeable future. We currently intend to retain all available funds and any future earnings to support the operation of and to finance the growth and development of our business. We do not anticipate paying any cash dividends in the foreseeable future.
Securities Authorized For Issuance Under Equity Compensation Plans
For information regarding securities authorized for issuance under equity compensation plans, see Part III "Item 12—Security Ownership of Certain Beneficial Owners and Management and Related Stockholder Matters."
Stockholder Return Performance Presentation
The following graph compares the change in the cumulative total stockholder return on our common stock during the period from April 16, 2009 (the first day our stock began trading on the NYSE) through December 31, 2010, with the cumulative total return on the NYSE Composite Index and the SIC Code Index that includes all U.S. public companies in the Standard Industrial Classification (SIC) Code 7372-Prepackaged Software. The comparison assumes that $100 was invested on April 16, 2009 in our common stock and in each of the foregoing indices and assumes reinvestment of dividends, if any.
37
COMPARISON OF 20 MONTH CUMULATIVE TOTAL RETURN*
Among Rosetta Stone Inc., the NYSE Composite Index
and SIC code 7372 index
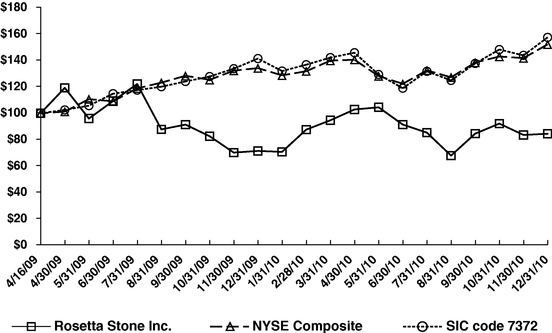
*$100 invested on 4/16/09 in stock or index, including reinvestment of dividends.
Fiscal year ending December 31.
Use of Proceeds from Public Offering of Common Stock
On April 15, 2009, our registration statement (File No. 333-153632) was declared effective for our initial public offering, pursuant to which we registered the offering and sale of 3,125,000 shares of common stock by Rosetta Stone Inc. and the associated sale of 3,125,000 shares of common stock by funds associated with ABS Capital Partners and Norwest Equity Partners VIII, LP (collectively, the "Private Equity Funds") and the additional sale pursuant to the underwriters' over-allotment option for an additional 937,500 shares of common stock by the Private Equity Funds, at a public offering price of $18.00 per share. The offering closed on April 21, 2009. The managing underwriters were Morgan Stanley & Co. Incorporated and William Blair & Company, LLC.
As a result of the offering, we received net proceeds of approximately $49.0 million, after deducting underwriting discounts and commissions of $3.9 million and additional offering-related expenses of approximately $3.3 million. In April 2009, we used $7.9 million to satisfy the federal, state and local withholding tax obligations associated with the "net issuance" of stock grants we made to 10 of our key employees, including executive officers, on April 15, 2009. In April 2009, we used $9.9 million of the net proceeds to repay the outstanding balances under our revolving line of credit with Wells Fargo. We anticipate that we will use the remaining net proceeds from our initial public offering for working capital and other general corporate purposes, which may include the acquisition of other businesses, products or technologies. We do not, however, have agreements or commitments for any specific acquisitions at this time. Pending such uses, we plan to invest the net proceeds in short-term, interest-bearing, investment grade securities.
38
Item 6. Selected Consolidated Financial Data
The following table sets forth our selected consolidated statement of operations, balance sheet and other data for the periods indicated. The selected consolidated statement of operations data for the years ended December 31, 2010, 2009, 2008, 2007, and the period from January 4, 2006 through December 31, 2006, and the consolidated balance sheet data as of December 31, 2010, 2009, 2008, 2007 and 2006 have been derived from Rosetta Stone Inc., or the Successor, audited consolidated financial statements. The selected consolidated statement of operations data for the period from January 1, 2006 through January 4, 2006, represents the operations of Fairfield & Sons, Ltd., or the Predecessor, which was acquired by Rosetta Stone Inc. on January 4, 2006 and have been derived from Predecessor audited consolidated financial statements. This information should be read in conjunction "Management's Discussion and Analysis of Financial Condition and Results of Operations" and our consolidated financial statements contained elsewhere in this Annual Report on Form 10-K. Our historical results for any prior period are not necessarily indicative of results to be expected in any future period.
39
The Predecessor incurred transaction-related expenses during the period from January 1, 2006 through January 4, 2006 relating to the acquisition by Rosetta Stone Inc. on January 4, 2006. Included in the expenses were $5.9 million related to restricted common stock, $3.1 million in cash bonuses and $1.2 million in acquisition-related bank fees.
| |
Successor | Predecessor | ||||||||||||||||||||
|---|---|---|---|---|---|---|---|---|---|---|---|---|---|---|---|---|---|---|---|---|---|---|
| |
Year Ended December 31 |
Period from January 4, through December 31, |
Period from January 1, through January 4, |
|||||||||||||||||||
| |
2010 | 2009 | 2008 | 2007 | 2006 | 2006 | ||||||||||||||||
| |
|
(in thousands, except per share data) |
||||||||||||||||||||
Statements of Operations Data: |
||||||||||||||||||||||
Revenue |
$ | 258,868 | $ | 252,271 | $ | 209,380 | $ | 137,321 | $ | 91,298 | $ | 272 | ||||||||||
Cost of revenue |
38,999 | 33,427 | 28,676 | 20,687 | 12,541 | 203 | ||||||||||||||||
Gross profit |
219,869 | 218,844 | 180,704 | 116,634 | 78,757 | 69 | ||||||||||||||||
Operating expenses: |
||||||||||||||||||||||
Sales and marketing |
130,879 | 114,899 | 93,384 | 65,437 | 45,854 | 695 | ||||||||||||||||
Research and development |
23,437 | 26,239 | 18,387 | 12,893 | 8,117 | 41 | ||||||||||||||||
Acquired in-process research and development |
— | — | — | — | 12,597 | — | ||||||||||||||||
General and administrative |
53,239 | 57,174 | 39,577 | 29,786 | 16,590 | 142 | ||||||||||||||||
Lease abandonment |
(583 | ) | — | 1,831 | — | — | — | |||||||||||||||
Transaction-related expenses |
— | — | — | — | — | 10,315 | ||||||||||||||||
Total operating expenses |
206,972 | 198,312 | 153,179 | 108,116 | 83,158 | 11,193 | ||||||||||||||||
Income (loss) from operations |
12,897 | 20,532 | 27,525 | 8,518 | (4,401 | ) | (11,124 | ) | ||||||||||||||
Other income and expense: |
||||||||||||||||||||||
Interest income |
262 | 159 | 454 | 673 | 613 | — | ||||||||||||||||
Interest expense |
(66 | ) | (356 | ) | (891 | ) | (1,331 | ) | (1,560 | ) | — | |||||||||||
Other (expense) income |
(220 | ) | 112 | 239 | 154 | 60 | 3 | |||||||||||||||
Interest and other income (expense), net |
(24 | ) | (85 | ) | (198 | ) | (504 | ) | (887 | ) | 3 | |||||||||||
Income (loss) before income taxes |
12,873 | 20,447 | 27,327 | 8,014 | (5,288 | ) | (11,121 | ) | ||||||||||||||
Income tax expense (benefit) |
(411 | ) | 7,084 | 13,435 | 5,435 | (1,240 | ) | — | ||||||||||||||
Net income (loss) |
13,284 | 13,363 | 13,892 | 2,579 | (4,048 | ) | (11,121 | ) | ||||||||||||||
Preferred stock accretion |
— | — | — | (80 | ) | (159 | ) | — | ||||||||||||||
Income (loss) attributable to common stockholders |
$ | 13,284 | $ | 13,363 | $ | 13,892 | $ | 2,499 | $ | (4,207 | ) | $ | (11,121 | ) | ||||||||
Income (loss) per share attributable to common stockholders: |
||||||||||||||||||||||
Basic |
$ | 0.65 | $ | 0.89 | $ | 7.29 | $ | 1.47 | $ | (2.63 | ) | $ | (37,194 | ) | ||||||||
Diluted |
$ | 0.63 | $ | 0.67 | $ | 0.82 | $ | 0.15 | $ | (2.63 | ) | $ | (37,194 | ) | ||||||||
Common shares and equivalents outstanding: |
||||||||||||||||||||||
Basic weighted average shares |
20,439 | 14,990 | 1,905 | 1,702 | 1,598 | 0.299 | ||||||||||||||||
Diluted weighted average shares |
21,187 | 19,930 | 16,924 | 16,533 | 1,598 | 0.299 | ||||||||||||||||
Other Data: |
||||||||||||||||||||||
Stock-based compensation included in: |
||||||||||||||||||||||
Cost of sales |
$ | 39 | $ | 34 | $ | 2 | $ | 2 | $ | 1 | $ | — | ||||||||||
Sales and marketing |
774 | 999 | 153 | 189 | 59 | — | ||||||||||||||||
Research and development |
1,181 | 5,959 | 482 | 360 | 128 | — | ||||||||||||||||
General and administrative |
2,393 | 15,158 | 953 | 776 | 373 | — | ||||||||||||||||
Transaction-related expenses |
— | — | — | — | 5,930 | |||||||||||||||||
Total stock-based compensation expense |
$ | 4,387 | $ | 22,150 | $ | 1,590 | $ | 1,327 | $ | 561 | $ | 5,930 | ||||||||||
Intangible amortization included in: |
||||||||||||||||||||||
Cost of sales |
$ | — | $ | — | $ | 13 | $ | 1,227 | $ | 1,213 | $ | — | ||||||||||
Sales and marketing |
58 | 42 | 3,003 | 3,596 | 4,113 | — | ||||||||||||||||
Total intangible amortization expense |
$ | 58 | $ | 42 | $ | 3,016 | $ | 4,823 | $ | 5,326 | $ | — | ||||||||||
40
| |
Sucessor | ||||||||||||||||
|---|---|---|---|---|---|---|---|---|---|---|---|---|---|---|---|---|---|
| |
Year Ended December 31, | ||||||||||||||||
| |
2010 | 2009 | 2008 | 2007 | 2006 | ||||||||||||
| |
(in thousands) |
||||||||||||||||
Consolidated Balance Sheet Data: |
|||||||||||||||||
Cash and cash equivalents |
$ | 115,756 | $ | 95,188 | $ | 30,626 | $ | 21,691 | $ | 16,917 | |||||||
Total assets |
276,474 | 225,442 | 138,818 | 110,376 | 96,754 | ||||||||||||
Deferred revenue |
47,158 | 26,106 | 15,744 | 12,939 | 8,105 | ||||||||||||
Notes payable and capital lease obligation |
— | — | 9,910 | 13,324 | 15,917 | ||||||||||||
Redeemable convertible preferred stock |
— | — | — | 5,000 | 4,920 | ||||||||||||
Total stockholders' equity |
$ | 178,316 | $ | 156,435 | $ | 79,071 | $ | 58,125 | $ | 53,548 | |||||||
Item 7. Management's Discussion and Analysis of Financial Condition and Results of Operations
This Management's Discussion and Analysis of Financial Condition and Results of Operations ("MD&A") should be read in conjunction with our consolidated financial statements and notes thereto which appear elsewhere in this Annual Report on Form 10-K. Our actual results may differ materially from those currently anticipated and expressed in such forward-looking statements as a result of a number of factors, including those discussed under "Risk Factors" and elsewhere in this Annual Report on Form 10-K.
Overview
We are a leading provider of technology-based language learning solutions. We develop, market and sell language learning solutions consisting of software, online services and audio practice tools primarily under our Rosetta Stone brand. Our teaching method, which we call Dynamic Immersion, is designed to leverage the innate, natural language learning ability that children use to learn their native language. Our courses are based on our proprietary interactive technologies and pedagogical content and utilize a sophisticated sequencing of images, text and sounds to teach a new language without translation or grammar explanation. We believe our award-winning solutions provide an effective, convenient and fun way to learn languages. We currently offer our self-study language learning solutions in 34 languages. Our customers include individuals, educational institutions, armed forces, government agencies and corporations.
The strength and breadth of our solutions have allowed us to develop a business model that we believe distinguishes us from other language learning companies. Our scalable technology platform and our proprietary content can be deployed across many languages, which have enabled us to cost-effectively develop a broad product portfolio. We have a multi-channel marketing and distribution strategy that directly targets customers, utilizing print, online, television and radio advertising, public relations initiatives and our branded kiosks. Approximately 82% of our revenue for the year ended December 31, 2010 was generated through our direct sales channels, which include our call centers, websites, institutional sales force and kiosks. We also distribute our solutions through select retailers such as Amazon.com, Apple, Barnes & Noble, Borders, Best Buy, Staples, Costco and Office Depot.
We generate revenue primarily from sales of packaged software and audio practice products and online software subscriptions. Our continued growth depends, in part, on our ability to maintain strong brand recognition in order to generate sales from new customers. We continuously balance our need to achieve short-term financial goals with the equally critical need to invest in our products, our brand and our infrastructure to ensure our future success. In making decisions about spending levels in our various functional organizations, we consider many factors, including:
- •
- our ability to expand our presence and penetration of existing markets;
- •
- the extent to which we can sell new products and services to existing customers;
41
- •
- our success in expanding our brand;
- •
- the evolution of our product and service offerings; and
- •
- our ability to expand our presence and reach geographically.
We believe the primary factors that affect our financial performance include the following:
- •
- customer acceptance of our product and service offerings;
- •
- continued product and service innovation;
- •
- average revenue per customer;
- •
- direct marketing variables, including:
- •
- print, television and radio media discounts and rates;
- •
- the relevance of our advertising;
- •
- online pay-per-click and other online advertising rates;
- •
- internal and external call center conversion rates; and
- •
- website traffic and conversion rates;
- •
- customer brand loyalty;
- •
- the number and quality of our kiosk locations;
- •
- our presence in international markets; and
- •
- cross-channel management of consumer and institutional markets.
We believe that our multi-channel marketing and distribution models are fundamental to our success. Specifically, we focus on educating customers about the many benefits of our products and services by leveraging our advertising and kiosk network in order to drive website and call center traffic.
Components of Our Statement of Operations
Revenue
We derive revenue from sales of language learning solutions consisting of packaged software and audio practice products and online software subscriptions. Revenue is presented as product revenue or subscription and service revenue in our consolidated financial statements. Our audio practice products are normally combined with our packaged software products and sold as a solution.
Revenue is primarily derived from the sale of packaged software and audio practice products, online software subscriptions and professional services. Our professional services include training, implementation services and dedicated conversational coaching associated with Rosetta Stone TOTALe. Rosetta Stone TOTALe online, which was released in July 2009, combines dedicated conversational coaching and an online software subscription. Rosetta Stone Version 4 TOTALe, which was released in September 2010, combines packaged software and dedicated conversational coaching. The content of our packaged software and subscription offerings are the same. We simply offer our customers the ability to choose which format they prefer without differentiating the learning experience. We began bundling time-based subscription licenses of our web-based TOTALe services with perpetual licenses of our Rosetta Stone Version 3 language learning solutions in the U.S. consumer market as part of our Rosetta Stone Version 4 TOTALe launch. As a result, we defer approximately 15%-20% of each of these bundled sales over the term of the subscription license.
42
We sell our solutions directly to individuals, educational institutions, armed forces, government agencies and corporations. We distribute our consumer products predominantly through our direct sales channels, primarily our websites and call centers, which we refer to as our direct-to-consumer channel. We also distribute our consumer products through our kiosks, which we own, as well as through select retailers. The majority of our consumer customers purchase our packaged software and audio practice products, online software subscriptions and professional services. We sell to institutions primarily through our direct institutional sales force. Many institutions elect to license our products on a subscription basis. For purposes of explaining variances in our revenue, we separately discuss changes in our consumer and institutional sales channels because the customers and revenue drivers of these channels are different. We anticipate that revenue growth in 2011 will slow and revenue associated with the U.S. Consumer business may decline.
For the year ended December 31, 2010, we reclassified our home school sales vertical from Institutional to Consumer. We believe the drivers of acquiring a home school customer are more aligned with a typical sale in our consumer sales vertical. Prior year information has been modified to conform to current year presentation. This presentation is also consistent with how we manage the home school channel.
Our consumer revenue is affected by seasonal trends associated with the holiday shopping season. As a result, our fourth quarter ended December 31, 2010 accounted for 29% of our annual revenue in 2010. Our institutional revenue is seasonally stronger in the second and third quarters of the calendar year due to education and government purchasing cycles. We expect these trends to continue.
Cost of Revenue
Cost of product revenue consists of the direct and indirect materials and labor costs to produce and distribute our products. Such costs include packaging materials, computer headsets, freight, inventory receiving, personnel costs associated with product assembly, third-party royalty fees and inventory storage, obsolescence and shrinkage. Cost of subscription and service revenue primarily represents costs associated with supporting our online language learning service, which includes hosting costs and depreciation. We also include the cost of credit card processing and customer technical support in both cost of product revenue and cost of subscription and service revenue. Cost of revenue will also increase as a percentage of revenue in future periods as a result of our launch of Rosetta Stone Version 4 TOTALe, which includes services that have higher direct costs to deliver to customers than our existing software solutions.
Operating Expenses
We classify our operating expenses into three categories: sales and marketing, research and development and general and administrative.
Our operating expenses primarily consist of personnel costs, direct advertising and marketing expenses and professional fees associated with contract product development, legal, accounting and consulting. Personnel costs for each category of operating expenses include salaries, bonuses, stock-based compensation and employee benefit costs.
Sales and Marketing. Our sales and marketing expenses consist primarily of direct advertising expenses related to television, print, radio, online and other direct marketing activities, personnel costs for our sales and marketing staff, rental payments for our kiosks and commissions paid to our sales personnel. Sales and marketing expenses also include amortization expense of intangible assets related to customer relationships associated with the 2006 acquisition of Fairfield & Sons, Ltd. These intangible assets were fully amortized by January 2009. In 2007, we began to make significant investments to expand our sales and marketing operations in Europe and Japan. In 2009, we began to make significant investments to expand our sales and marketing operations in South Korea, and in 2010 we established
43
an office in Germany. In each case we established local sales offices and call centers, added employees and launched marketing and public relations campaigns within the region. We intend to continue to expand our sales activities within these regions as well as to expand our presence into new countries, in addition to expanding our media and advertising campaigns in the United States. As a result, we expect sales and marketing expenses to increase in future periods.
Research and Development. Research and development expenses consist primarily of personnel costs and contract development fees associated with the development of our solutions. Our development efforts are primarily based in the United States and are devoted to expanding our product portfolio through the addition of new content and new complimentary products and services to our language learning solutions. We expect our investment in research and development expenses to increase in future years but provide us with significant benefits in the future.
General and Administrative. General and administrative expenses consist primarily of personnel costs of our executive, finance, legal, human resources and other administrative personnel, as well as accounting and legal professional services fees and other corporate expenses. We expect general and administrative expenses to increase in future periods as we expect to continue to invest in corporate infrastructure and incur additional expenses associated with being a public company, including increased legal and accounting costs, investor relations costs, independent director compensation, exchange listing fees and stockholder related fees, higher insurance premiums and compliance costs in connection with Section 404 of the Sarbanes-Oxley Act of 2002. In 2011, we expect there will be increases to certain general and administrative expenses to support our expansion into new international markets. However, we also are taking steps to reduce certain general and administrative expenses as we realign our resources with our business priorities.
Stock Compensation Charge. Included in the respective operating expense lines for 2009 is an aggregate $18.8 million expense, consisting of $18.5 million in stock-based compensation expense and $0.3 million in payroll tax expense, related to common stock grants awarded to key employees equal to a total of 591,491 shares in April 2009. This grant was net of the number of shares required to be withheld to satisfy the federal, state and local tax withholding obligations. The aggregate grant date fair value of the awards was $18.5 million, which we recognized as stock-based compensation expense on the grant date, as the awards were immediately vested. We allocated this $18.8 million aggregate expense among the operating expense line items in accordance with the functions performed by the respective employees who received the grants. No such grant was made in 2010.
Other Income (Expense)
Other income (expense) primarily consists of interest income and interest expense. Interest expense is related to our long-term debt, the outstanding balance of which was zero as of December 31, 2010. Interest income represents interest received on our cash and cash equivalents.
Income Tax Expense (Benefit)
Income tax expense (benefit) consists of federal, state and foreign income taxes. For the year ended December 31, 2010, our worldwide effective tax rate was approximately (3%), primarily as a result of the release of the valuation allowance on deferred tax assets in the United Kingdom and Japanese subsidiaries. We expect our worldwide rate to be approximately 35%-38% in 2011 and beyond assuming no general increase in federal, state or foreign income tax rates applicable to companies such as ours. We expect our income tax expense to increase in absolute dollars as our income continues to grow.
44
Critical Accounting Policies and Estimates
In presenting our financial statements in conformity with accounting principles generally accepted in the United States, or GAAP, we are required to make estimates and assumptions that affect the reported amounts of assets, liabilities, revenues, costs and expenses and related disclosures.
Some of the estimates and assumptions we are required to make relate to matters that are inherently uncertain as they pertain to future events. We base these estimates and assumptions on historical experience or on various other factors that we believe to be reasonable and appropriate under the circumstances. On an ongoing basis, we reconsider and evaluate our estimates and assumptions. Our future estimates may change if the underlying assumptions change. Actual results may differ significantly from these estimates.
We believe that the critical accounting policies listed below involve our more significant judgments, assumptions and estimates and, therefore, could have the greatest potential impact on our consolidated financial statements. In addition, we believe that a discussion of these policies is necessary to understand and evaluate the consolidated financial statements contained in this annual report on Form 10-K.
Revenue Recognition
Revenue is primarily derived from the sale of packaged software and audio practice products, online software subscriptions and professional services. Our professional services include training, implementation services and dedicated conversational coaching associated with Rosetta Stone TOTALe. Rosetta Stone TOTALe online, which was released in July 2009, combines dedicated conversational coaching and an online software subscription. Rosetta Stone Version 4 TOTALe, which was released in September 2010, combines packaged software and dedicated conversational coaching. We recognize revenue for software products and related services in accordance with Accounting Standards Codification subtopic 985-605, Software: Revenue Recognition ("ASC 985-605").
Revenue is recognized when all of the following criteria are met: there is persuasive evidence of an arrangement; the product has been delivered or services have been rendered; the fee is fixed and determinable; and collectability is probable. Revenues from packaged software and audio practice products and online software subscriptions are recorded net of discounts.
Revenue is recognized from the sale of packaged software and audio practice products when the product has been delivered, assuming the remaining revenue recognition criteria have been met. Software products include sales to end-user customers and resellers. In most cases, revenue from sales to resellers is not contingent upon resale of the software to the end user and is recorded in the same manner as all other product sales. Revenue from sales of packaged software products are recognized as the products are shipped and title passes and risks of loss have been transferred. For most of our product sales, these criteria are met at the time the product is shipped. For some sales to resellers and certain other sales, we defer revenue until the customer receives the product because we legally retain a portion of the risk of loss on these sales during transit. A limited amount of packaged software products are sold to resellers on a consignment basis. Revenue is recognized for these consignment transactions once the end-user sale has occurred, assuming the remaining revenue recognition criteria have been met. In accordance with Accounting Standards Codification subtopic 985-605-50, Software: Revenue Recognition: Customer Payments and Incentives ("ASC 985-605-50"), price protection for changes in the manufacturer suggested retail value granted to resellers for the inventory that they have on hand at the date the price protection is offered is recorded as a reduction to revenue. We offer customers the ability to make payments for packaged software purchases in installments over a period of time, which typically ranges between three and five months. Given that these installment payment plans are for periods less than 12 months and a successful collection history has been established, revenue is recognized at the time of sale, assuming the remaining revenue recognition criteria have
45
been met. For the years ended December 31, 2010 and 2009, installment sales represented 11%, and 8% of revenue, respectively. Packaged software is provided to customers who purchase directly from us with a six-month right of return. We also allow our retailers to return unsold products, subject to some limitations. In accordance with Accounting Standards Codification subtopic 985-605-15, Software: Revenue Recognition: Products ("ASC 985-605-15"), product revenue is reduced for estimated returns, which are based on historical return rates.
Revenue for software license agreements sold via online software subscriptions as hosting agreements are recognized in accordance with Accounting Standards Codification subtopic 985-605-05, Software: Revenue Recognition: Background ("ASC 985-605-05"). Revenue for online software subscriptions is recognized ratably over the term of the subscription period, assuming all revenue recognition criteria have been met, which typically ranges between three and 12 months. Some online licensing arrangements include a specified number of licenses that can be activated over a period of time, which typically ranges between 12 and 24 months. Revenue for these arrangements is recognized on a per license basis ratably over the term of the individual license subscription period, assuming all revenue recognition criteria have been met, which typically ranges between three and 12 months. Revenue for set-up fees related to online licensing arrangements is recognized ratably over the term of the online licensing arrangement, assuming all revenue recognition criteria have been met. Accounts receivable and deferred revenue are recorded at the time a customer enters into a binding subscription agreement and the subscription services are made available to the customer. In connection with packaged software product sales and online software subscriptions, technical support is provided to customers, including customers of resellers, at no additional charge. As the fee for technical support is included in the initial licensing fee, the technical support and services are generally provided within one year, the estimated cost of providing such support is deemed insignificant and no unspecified upgrades/enhancements are offered, technical support revenues are recognized together with the software product and license revenue. Costs associated with the technical support are accrued at the time of sale.
Revenue for online service subscriptions for dedicated conversational coaching are recognized ratably over the term of the subscription period, assuming all revenue recognition criteria have been met, which typically ranges between three and 15 months. Rosetta Stone V4 TOTALe bundles, which include dedicated conversational coaching online services and packaged software, allow customers to begin their online services at any point during a registration window, which typically ranges between six and 12 months from the date of purchase from the Company or an authorized reseller. Dedicated conversational coaching online service subscriptions that are not activated during this registration window are forfeited and revenue is recognized upon expiry. Accounts receivable and deferred revenue are recorded at the time a customer purchases the online services.
In accordance with ASC 985-605-50, cash sales incentives to resellers are accounted for as a reduction of revenue, unless a specific identified benefit is identified and the fair value is reasonably determinable.
We have been engaged to develop language learning software for certain endangered languages under fixed-fee arrangements. These arrangements also include contractual periods of post-contract support ("PCS") and online hosting services ranging from one to ten years. Revenue for multi-element contracts are recognized ratably once the PCS and online hosting periods begin, over the longer of the PCS or online hosting period. When the current estimates of total contract revenue and contract cost indicate a loss for a fixed fee arrangement, a provision for the entire loss on the contract is recorded.
Revenue Recognition for Arrangements with Multiple Deliverables
As of January 1, 2010, we began to recognize revenue prospectively for new arrangements with multiple deliverables in accordance with ASU No. 2009-13, "Revenue Recognition (Topic 605)—Multiple
46
Deliverable Revenue Arrangements ("ASU No. 2009-13"). For multi-element arrangements that include online services and auxiliary items, such as headsets and audio practice products which provide stand-alone value to the customer, we allocate revenue to all deliverables based on their relative selling prices in accordance with ASU No. 2009-13. The new accounting principles establish a hierarchy to determine the selling price to be used for allocating revenue to deliverables as follows: (i) vendor-specific objective evidence of fair value ("VSOE"), (ii) third-party evidence of selling price ("TPE"), and (iii) best estimate of the selling price ("ESP"). VSOE generally exists only when we sell the deliverable separately and is the price that we actually charge for that deliverable. ESPs reflect our best estimates of what the selling prices of elements would be if they were sold regularly on a stand-alone basis.
We have identified two deliverables generally contained in arrangements involving the sale of online services bundled with auxiliary items. The first deliverable is the auxiliary items, which are delivered at the time of sale, and the second deliverable is the online services. We allocate revenue between these two deliverables using the relative selling price method. Amounts allocated to the auxiliary items are recognized at the time of sale, provided the other conditions for revenue recognition have been met. Amounts allocated to the online services are deferred and recognized on a straight-line basis over the term of the online services. The auxiliary item cost of sales are generally recognized at the time of sale. Costs for online services and sales and marketing are expensed as incurred.
We have identified two deliverables generally contained in Rosetta Stone V4 TOTALe software arrangements. The first deliverable is the packaged software, which is delivered at the time of sale, and the second deliverable is the dedicated conversational coaching online services. We allocate revenue between these two deliverables using the relative selling price method. Amounts allocated to the software are recognized at the time of sale, provided the other conditions for revenue recognition have been met. Amounts allocated to the online services are deferred and recognized on a straight-line basis over the term of the online services or upon expiry of the online services. The language learning software cost of sales are generally recognized at the time of sale. Costs for online services and sales and marketing are expensed as incurred.
We account for multiple element arrangements that consist only of software or software related products, in accordance with industry specific accounting guidance for software and software related transactions. For such transactions, revenue on arrangements that include multiple elements is allocated to each element based on the relative fair value of each element, and fair value is generally determined by VSOE. If we cannot objectively determine the fair value of any undelivered element included in such multiple element arrangements, we defer revenue until all elements are delivered and services have been performed, or until fair value can objectively be determined for any remaining undelivered elements.
Stock-Based Compensation
We account for stock-based compensation in accordance Accounting Standards Codification topic 718, Compensation—Stock Compensation ("ASC 718"), which we adopted effective January 1, 2006. Under ASC 718, all stock-based awards, including employee stock option grants, are recorded at fair value as of the grant date and recognized as expense in the statement of operations on a straight-line basis over the requisite service period, which is the vesting period.
As of December 31, 2010 and 2009, there were approximately $8.3 million and $5.3 million of unrecognized stock-based compensation expense related to non-vested stock option awards that is expected to be recognized over a weighted average period of 2.76 and 2.49 years, respectively.
47
The following table presents the stock-based compensation expense for stock options and restricted stock included in the related financial statement line items (in thousands):
| |
Years Ended December 31, | ||||||||||||
|---|---|---|---|---|---|---|---|---|---|---|---|---|---|
| |
2010 | 2009 | 2008 | ||||||||||
Included in cost of revenue: |
|||||||||||||
Cost of product revenue |
$ | 39 | $ | 34 | $ | 2 | |||||||
Cost of subscription and service revenue |
— | — | — | ||||||||||
Total included in cost of revenue |
39 | 34 | 2 | ||||||||||
Included in operating expenses: |
|||||||||||||
Sales and marketing |
774 | 999 | 153 | ||||||||||
Research and development |
1,181 | 5,959 | 482 | ||||||||||
General and administrative |
2,393 | 15,158 | 953 | ||||||||||
Total included in operating expenses |
4,348 | 22,116 | 1,588 | ||||||||||
Total |
$ | 4,387 | $ | 22,150 | $ | 1,590 | |||||||
In accordance with ASC topic 718, the fair value of stock-based awards to employees is calculated as of the date of grant. Compensation expense is then recognized on a straight-line basis over the requisite service period of the award. We use the Black-Scholes pricing model to value our stock options, which requires the use of estimates, including future stock price volatility, expected term and forfeitures. Stock-based compensation expense recognized is based on the estimated portion of the awards that are expected to vest. Estimated forfeiture rates were applied in the expense calculation. The fair value of each option grant is estimated on the date of grant using the Black Scholes option pricing model as follows:
| |
Year Ended December 31, | |||||
|---|---|---|---|---|---|---|
| |
2010 | 2009 | 2008 | |||
Expected stock price volatility |
58%-66% | 61% | 57%-62% | |||
Expected term of options |
6 years | 6 years | 6 years | |||
Expected dividend yield |
— | — | — | |||
Risk-free interest rate |
1.14%-2.59% | 1.71%-2.46% | 2.08%-3.36% | |||
Prior to the completion of our initial public offering in April 2009, our stock was not publicly quoted and we had a limited history of stock option activity, so we reviewed a group of comparable industry-related companies to estimate our expected volatility over the most recent period commensurate with the estimated expected term of the awards. In addition to analyzing data from the peer group, we also considered the contractual option term and vesting period when determining the expected option life and forfeiture rate. Subsequent to the initial public offering, we continue to review a group of comparable industry-related companies to estimate volatility, but also review the volatility of our own stock since the initial public offering. We consider the volatility of the comparable companies to be the best estimate of future volatility. For the risk-free interest rate, we use a U.S. Treasury Bond rate consistent with the estimated expected term of the option award.
48
The following table sets forth a summary of stock option grants since the date of plan inception, through the date of this Annual Report on Form 10-K:
Grant Date
|
Number of Options Granted |
Exercise Price | Common Stock Fair Value Per Share at Grant Date |
||||
|---|---|---|---|---|---|---|---|
2006 |
1,704,950 | $3.85-$3.85 | $4.57-$5.92 | ||||
2007 |
436,254 | 3.85-11.19 | 6.35-11.30 | ||||
2008 |
402,805 | 10.36-17.49 | 10.36-17.49 | ||||
2009 |
472,589 | 16.74-22.30 | 16.74-22.30 | ||||
2010 |
593,017 | 17.10-25.99 | 17.10-25.99 | ||||
Stock-based Compensation Expense in Connection with Executive Stock Grants and IPO Option and Restricted Stock Grants
We made stock grants, restricted stock grants and stock option grants to our employees on April 15, 2009. In connection with these grants, we recorded an aggregate expense of approximately $18.5 million in the second quarter of 2009, and an additional $6.3 million that will be recorded over the four-year vesting period of the stock options and restricted stock grants.
Accounts Receivable and Allowance for Doubtful Accounts
Accounts receivable consist of amounts due to us from our normal business activities. We provide an allowance for doubtful accounts to reflect the expected non-collection of accounts receivable based on past collection history and specific risks identified.
Intangible Assets
Intangible assets consist of acquired technology, including developed and core technology, customer related assets, trade name and trademark and other intangible assets. Those intangible assets with finite lives are recorded at cost and amortized on a straight line basis over their expected lives in accordance with Accounting Standards Codification topic 350, Goodwill and Other Intangible Assets ("ASC 350"). On an annual basis, we review our indefinite lived intangible assets for impairment based on the fair value of indefinite lived intangible assets as compared to the carrying value in accordance with ASC 350. In the event the carrying value exceeds the fair value of the assets, the assets are written down to their fair value. There has been no impairment of intangible assets during any of the periods presented.
Goodwill
In accordance with ASC 350, goodwill is not amortized and is tested for impairment annually on June 30th and whenever events and circumstances occur indicating goodwill might be impaired. The first step is a screen for potential impairment by comparing the fair value of our one reporting unit with its carrying amount. The second step measures the amount of impairment loss, if any. As of June 30, 2010 and 2009, we reviewed the goodwill for impairment and determined that no impairment of goodwill was identified during any of the periods presented, nor is the reporting unit at risk of failing step one of the goodwill impairment test.
Valuation of Long-Lived Assets
In accordance with Accounting Standards Codification topic 360, Accounting for the Impairment or Disposal of Long-lived Assets ("ASC 360"), we evaluate the recoverability of our long-lived assets. ASC 360 requires recognition of impairment of long-lived assets in the event that the net book value of such
49
assets exceeds the future undiscounted net cash flows attributable to such assets. Impairment, if any, is recognized in the period of identification to the extent the carrying amount of an asset exceeds the fair value of such asset. Based on our analysis, we believe that no impairment of our long-lived assets was indicated as of December 31, 2010 and 2009.
Income Taxes
For the years ended December 31, 2010, 2009 and 2008, we accounted for income taxes in accordance with Accounting Standards Codification topic 740, Income Taxes ("ASC 740"), which provides for an asset and liability approach to accounting for income taxes. Deferred tax assets and liabilities represent the future tax consequences of the differences between the financial statement carrying amounts of assets and liabilities versus the tax bases of assets and liabilities. Under this method, deferred tax assets are recognized for deductible temporary differences, and operating loss and tax credit carryforwards. Deferred tax liabilities are recognized for taxable temporary differences. Deferred tax assets are reduced by a valuation allowance when, in the opinion of management, it is more likely than not that some portion or all of the deferred tax assets will not be realized. The impact of tax rate changes on deferred tax assets and liabilities is recognized in the year that the change is enacted.
In 2010, we recognized a tax benefit of $2.4 million due to the release of the valuation allowance on deferred tax assets which we believe are more likely than not to be realized. Our effective income tax rate has benefited from the availability of previously unrealized deferred tax assets which we have utilized to reduce tax expense for United Kingdom and Japanese income tax purposes. The release of our valuation allowance was determined in accordance with the provisions of ASC 740, which requires an assessment of both positive and negative evidence when determining whether it is more likely than not that deferred tax assets are recoverable; such assessment is required on a jurisdiction by jurisdiction basis. Historical operating income and continuing projected income represent sufficient positive evidence that we have used to conclude that it is more likely than not that our deferred tax assets will be realized and accordingly, a release of our valuation allowance was recorded in the fourth quarter of 2010.
In June 2006, the Financial Accounting Standards Board ("FASB") issued certain provisions in the Accounting Standards Codification topic 740-10-25, Income Taxes: Overall: Recognition, ("ASC 740-10-25"), which clarify the accounting for uncertainty in income taxes recognized in an enterprise's financial statements in accordance with ASC 740 and prescribe a recognition threshold and measurement attribute for the financial statement recognition and measurement of a tax position taken or expected to be taken in a tax return. These provisions also provide guidance on de-recognition, classification, interest and penalties, accounting in interim periods, disclosures, and transition. We adopted these recognition provisions of ASC 740-10-25 effective January 1, 2007. The adoption of ASC 740-10-25 did not have a material impact on our financial condition, results of operations or cash flows.
50
Results of Operations
The following table sets forth our consolidated statement of operations for the periods indicated.
| |
Year Ended December 31, | |||||||||||
|---|---|---|---|---|---|---|---|---|---|---|---|---|
| |
2010 | 2009 | 2008 | |||||||||
| |
(in thousands, except per share data) |
|||||||||||
Statements of Operations Data: |
||||||||||||
Revenue |
$ | 258,868 | $ | 252,271 | $ | 209,380 | ||||||
Cost of revenue |
38,999 | 33,427 | 28,676 | |||||||||
Gross profit |
219,869 | 218,844 | 180,704 | |||||||||
Operating expenses: |
||||||||||||
Sales and marketing |
130,879 | 114,899 | 93,384 | |||||||||
Research and development |
23,437 | 26,239 | 18,387 | |||||||||
General and administrative |
53,239 | 57,182 | 39,577 | |||||||||
Lease abandonment |
(583 | ) | (8 | ) | 1,831 | |||||||
Total operating expenses |
206,972 | 198,312 | 153,179 | |||||||||
Income from operations |
12,897 |
20,532 |
27,525 |
|||||||||
Other income and expense: |
||||||||||||
Interest income |
262 | 159 | 454 | |||||||||
Interest expense |
(66 | ) | (356 | ) | (891 | ) | ||||||
Other (expense) income |
(220 | ) | 112 | 239 | ||||||||
Interest and other income (expense), net |
(24 | ) | (85 | ) | (198 | ) | ||||||
Income before income taxes |
12,873 | 20,447 | 27,327 | |||||||||
Income tax expense (benefit) |
(411 | ) | 7,084 | 13,435 | ||||||||
Net income |
13,284 | 13,363 | 13,892 | |||||||||
Preferred stock accretion |
— | — | — | |||||||||
Income attributable to common stockholders |
$ | 13,284 | $ | 13,363 | $ | 13,892 | ||||||
Income per share attributable to common stockholders: |
||||||||||||
Basic |
$ | 0.65 | $ | 0.89 | $ | 7.29 | ||||||
Diluted |
$ | 0.63 | $ | 0.67 | $ | 0.82 | ||||||
Common shares and equivalents outstanding: |
||||||||||||
Basic weighted average shares |
20,439 | 14,990 | 1,905 | |||||||||
Diluted weighted average shares |
21,187 | 19,930 | 16,924 | |||||||||
Stock-based compensation included in: |
||||||||||||
Cost of sales |
$ | 39 | $ | 34 | $ | 2 | ||||||
Sales and marketing |
774 | 999 | 153 | |||||||||
Research and development |
1,181 | 5,959 | 482 | |||||||||
General and administrative |
2,393 | 15,158 | 953 | |||||||||
|
$ | 4,387 | $ | 22,150 | $ | 1,590 | ||||||
Intangible amortization included in: |
||||||||||||
Cost of sales |
$ | — | $ | — | $ | 13 | ||||||
Sales and marketing |
58 | 42 | 3,003 | |||||||||
|
$ | 58 | $ | 42 | $ | 3,016 | ||||||
51
Comparison of the Year Ended December 31, 2010 and the Year Ended December 31, 2009
| |
Year Ended December 31, | |
|
|||||||||||||||||
|---|---|---|---|---|---|---|---|---|---|---|---|---|---|---|---|---|---|---|---|---|
| |
2010 | 2009 | Change | % Change | ||||||||||||||||
| |
(dollars in thousands) |
|||||||||||||||||||
Product revenue |
$ | 215,590 | 83.3 | % | $ | 218,549 | 86.6 | % | $ | (2,959 | ) | (1.4 | )% | |||||||
Subscription and service revenue |
43,278 | 16.7 | % | 33,722 | 13.4 | % | 9,556 | 28.3 | % | |||||||||||
Total revenue |
258,868 | 100.0 | % | $ | 252,271 | 100.0 | % | $ | 6,597 | 2.6 | % | |||||||||
Revenue by sales channel: |
||||||||||||||||||||
Direct-to-consumer |
$ | 118,164 | 45.6 | % | $ | 115,791 | 45.9 | % | $ | 2,373 | 2.0 | % | ||||||||
Kiosk |
35,000 | 13.5 | % | 40,565 | 16.1 | % | (5,565 | ) | (13.7 | )% | ||||||||||
Retail |
46,054 | 17.8 | % | 45,894 | 18.2 | % | 160 | 0.3 | % | |||||||||||
Home school |
5,045 | 1.9 | % | 6,817 | 2.7 | % | (1,772 | ) | (26.0 | )% | ||||||||||
Total consumer |
204,263 | 78.9 | % | 209,067 | 82.9 | % | (4,804 | ) | (2.3 | )% | ||||||||||
Institutional |
54,605 | 21.1 | % | 43,204 | 17.1 | % | 11,401 | 26.4 | % | |||||||||||
Total revenue |
$ | 258,868 | 100.0 | % | $ | 252,271 | 100.0 | % | $ | 6,597 | 2.6 | % | ||||||||
Revenue
Total revenue for the year ended December 31, 2010 was $258.9 million, an increase of $6.6 million, or 3%, from the year ended December 31, 2009.
Consumer
Consumer revenue was $204.3 million for the year ended December 31, 2010, a decrease of $4.8 million, or 2%, from the year ended December 31, 2009. The number of units sold decreased 7% during the year ended December 31, 2010 compared to the prior year period, offset by a 12% increase in average selling price per unit. The decrease in consumer revenue was primarily driven by continued weakness in the U.S. kiosk and U.S. direct-to-consumer sales verticals, offset by growth in our international consumer verticals. Additionally, we deferred $12.8 million in revenue in the U.S. consumer market related to our Version 4 TOTALe online services as described below.
Product revenue represented 97% of total consumer revenue for the year ended December 31, 2010, with the balance attributable to subscription and service revenue. We began bundling time-based subscription licenses of our web-based TOTALe services with perpetual licenses of our Rosetta Stone Version 3 language learning solutions in the U.S. consumer market during the third quarter of 2010 with the launch of Rosetta Stone Version 4 TOTALe. As a result, we defer approximately 15% - 20% of each of these bundled sales. We will recognize the deferred revenue over the term of the subscription license in accordance with Accounting Standards Codification subtopic 985-605, Software: Revenue Recognition.
Direct-to-Consumer
Direct-to-consumer revenue was $118.2 million for the year ended December 31, 2010 an increase of $2.4, million or 2%, from the year ended December 31, 2009. The increase in direct-to-consumer revenue was primarily driven by growth in our international direct-to-consumer markets, offset by continued decline in our U.S. direct-to-consumer business. The decline in our U.S. direct-to-consumer business was driven by lower web and call center traffic. Additionally, the price of media increased causing a decline in returns on invested media. The downward trends in the U.S. could continue into 2011. We are considering significant changes in our marketing, pricing, product and packaging to change the negative trends in the U.S. market. It is not clear whether these changes will improve the downward revenue and profit trends.
52
Kiosk
Kiosk revenue was $35.0 million for the year ended December 31, 2010, a decrease of $5.6 million, or 14%, from the year ended December 31, 2009. Despite the increase in the number of worldwide kiosks from 242 to 259 during the year ended December 31, 2010, annual net revenue per kiosk declined due to lower foot traffic. We plan to continually review kiosk performance in 2011 and we may close our underperforming kiosk locations.
Retail
Retail revenue was $46.1 million for the year ended December 31, 2010, an increase of $0.2 million or 0.3% from the year ended December 31, 2009. The increase in retail revenue was primarily driven by holiday season stock in orders received from our larger retail partners during the fourth quarter of 2010, as well as the expansion of our retail footprint with the addition of new retail relationships in 2010. During the fourth quarter of 2010, we reduced revenue by $1.7 million as a result of changing our revenue recognition to cash basis for Borders, as a result of its Chapter 11 bankruptcy reorganization.
We work with retail partners to monitor quantity on hand and sell through of our product within the retail channel. As a result of lower than anticipated sell through in our retail channel during the fourth quarter of 2010, we believe inventory levels at our two largest retail partners are higher than historical levels. As such, we expect shipments of our products and related revenue to those retailers to be down substantially during the first quarter of 2011.
We are in the process of testing changes to the pricing of our products. If we reduce our prices as a result of successful tests in an effort to increase sales volume and overall market penetration we may provide our retailers and distributors with price protection on existing inventories, which would allow these retailers and distributors a credit against amounts owed with respect to unsold packaged product under certain conditions. These price protection reserves could be material in future periods.
Home School
For the year ended December 31, 2010, we reclassified our home school sales vertical from Institutional to Consumer. We believe the drivers of acquiring a home school customer are more aligned with a typical sale in our consumer sales vertical. Prior year information has been modified to conform to current year presentation.
Home school revenue was $5.0 million for the year ended December 31, 2010, a decrease of $1.8 million or 26% from the year ended December 31, 2009. In 2009, we began offering home school edition products through other sales channels, including direct-to-consumer call centers and our retail channels. As the availability of home school products in other sales channels increased during 2010, consumers began utilizing these new channels to make purchases. For the year ended December 31, 2010, home school product sales through direct-to-consumer and retail increased by $0.4 million and $2.1 million, respectively, from the year ended December 31, 2009. As sales through these new channels increased during 2010, sales from our traditional home school channels, including home school resellers and the home school website, decreased $1.8 million. In the aggregate, revenue from sales of our home school edition products increased $0.8 million during the twelve months ended December 31, 2010, compared to 2009.
Institutional
Institutional revenue was $54.6 million for the year ended December 31, 2010, an increase of $11.4 million, or 26%, compared to the year ended December 31, 2009. The increase in institutional revenue was primarily due to the expansion of our direct sales force. As a result, we had a $4.3 million
53
increase in education revenue, a $1.3 million increase in government revenue and a $5.8 million increase in corporate and non-profit revenue in 2010 compared to the prior year period.
Product revenue represented 33% of total institutional revenue for the year ended December 31, 2010, and subscription and service revenue represented 67% for the same period.
Cost of Revenue and Gross Profit
| |
Year Ended December 31, | |
|
|||||||||||
|---|---|---|---|---|---|---|---|---|---|---|---|---|---|---|
| |
2010 | 2009 | Change | % Change | ||||||||||
| |
(dollars in thousands) |
|||||||||||||
Revenue: |
||||||||||||||
Product |
$ | 215,590 | $ | 218,549 | $ | (2,959 | ) | (1.4 | )% | |||||
Subscription and service |
43,278 | 33,722 | $ | 9,556 | 28.3 | % | ||||||||
Total revenue |
$ | 258,868 | $ | 252,271 | $ | 6,597 | 2.6 | % | ||||||
Cost of revenue: |
||||||||||||||
Cost of product revenue |
$ | 32,549 | $ | 30,264 | $ | 2,285 | 7.6 | % | ||||||
Cost of subscription and service revenue |
6,450 | 3,163 | $ | 3,287 | 103.9 | % | ||||||||
Total cost of revenue |
38,999 | 33,427 | 5,572 | 16.7 | % | |||||||||
Gross profit |
$ | 219,869 | $ | 218,844 | $ | 1,025 | ||||||||
Gross margin percentages |
84.9 | % | 86.7 | % | (1.8 | )% | ||||||||
Cost of revenue for the year ended December 31, 2010 was $39.0 million, an increase of $5.6 million, or 17%, from the year ended December 31, 2009. As a percentage of total revenue, cost of revenue increased to 15% for the year ended December 31, 2010 compared to 13% for the year ended December 31, 2009. Cost of product revenue for the year ended December 31, 2010 was $32.5 million, an increase of $2.3 million, or 8%, from the year ended December 31, 2009. The increase in cost was primarily attributable to the $2.2 million increase in expense for inventory scrap of our V3 product associated with the launch of Rosetta Stone Version 4 TOTALe in the U.S. market. We are exploring the possibility of changing our packaging in 2011, which could result in an increase in the cost of our product revenue and additional charges as we replace the packaging within our sales channels.
Cost of subscription and service revenue for the year ended December 31, 2010 was $6.5 million, an increase of $3.3 million, or 104% from the year ended December 31, 2009. The increase in cost was primarily attributable to our web-based service offering in our Version 4 TOTALe product that includes a component of dedicated online language conversation coaching and higher direct costs to deliver to customers than our previous software solutions. We expect our cost of subscription and service revenue will increase in future periods, as a percent of revenue, associated with the launch of our Version 4 TOTALe solution in our international markets.
Operating Expenses
| |
Year Ended December 31, |
|
|
||||||||||
|---|---|---|---|---|---|---|---|---|---|---|---|---|---|
| |
2010 | 2009 | Change | % Change | |||||||||
| |
(dollars in thousands) |
||||||||||||
Sales and marketing |
$ | 130,879 | $ | 114,899 | $ | 15,980 | 13.9 | % | |||||
Research and development |
23,437 | 26,239 | (2,802 | ) | (10.7 | )% | |||||||
General and administrative |
53,239 | 57,182 | (3,943 | ) | (6.9 | )% | |||||||
Lease abandonment |
(583 | ) | (8 | ) | (575 | ) | 7187.5 | % | |||||
Total operating expenses |
$ | 206,972 | $ | 198,312 | $ | 8,660 | 4.4 | % | |||||
54
Sales and Marketing Expenses
Sales and marketing expenses for the year ended December 31, 2010 were $130.9 million, an increase of $16.0 million, or 14%, from the year ended December 31, 2009. As a percentage of total revenue, sales and marketing expenses were 51% for the year ended December 31, 2010, compared to 46% for the year ended December 31, 2009. The dollar and percentage increase in sales and marketing expenses were primarily attributable to the continued expansion of our direct marketing activities in the U.S. and international markets. Personnel costs related to growth in our institutional sales channel and marketing and sales support activities increased by $6.2 million over the prior year period. Advertising and marketing expenses grew by $5.9 million and were primarily related to television and radio media and retail visual displays associated with our launch of Rosetta Stone Version 4 TOTALe. Travel and training expense increased by $1.1 million over the prior year period as a result of increased travel in our institutional sales channel and global initiatives. We also expanded the number of our kiosks from 242 as of December 31, 2009 to 259 as of December 31, 2010, which resulted in $3.3 million of additional kiosk operating expenses, including rent and sales compensation related expenses. These increases were partially offset by a reduction in stock compensation charge related to common stock awarded to key employees in 2009, resulting in a $0.4 million decrease in sales and marketing expense in the 2010 period. In the U.S. market we are considering, among other alternatives changing our media strategy to include advertising that promotes language learning and our brand. This change could increase our marketing expenses relative to revenue in future periods.
Research and Development Expenses
Research and development expenses were $23.4 million for the year ended December 31 2010, a decrease of $2.8 million, or 11%, from the year ended December 31, 2009. As a percentage of revenue, research and development expenses decreased to 9% for the year ended December 31, 2010 compared to 10% for the year ended December 31, 2009. The dollar and percentage decreases were primarily attributable to the absence in 2010 of a stock compensation charge related to common stock awards to key employees during the twelve months ended December 31, 2009 of $5.0 million. This decrease was partially offset by an increase of $1.3 million due to the addition of new product development personnel and consulting expense associated with the development of new products and services that are complementary to our existing solutions, and a $0.4 million increase in travel and training associated with this development. We expect research and development expenses to increase in 2011 as we develop our English remediation solution for our Asian markets, invest in new digital platforms such as the iPad, roll out our Version 4 TOTALe product in our international markets, and support institutional development initiatives.
General and Administrative Expenses
General and administrative expenses for the year ended December 31, 2010 were $53.2 million, a decrease of $3.9 million, or 7%, from the year ended December 31, 2009. As a percentage of revenue, general and administrative expenses decreased to 21% for the year ended December 31, 2010 compared to 23% for the year ended December 31, 2009. The dollar and percentage decreases were primarily attributable to a stock compensation charge related to common stock awarded to key employees during the twelve months ended December 31, 2009 in connection with our initial public offering of $13.4 million. This decrease was partially offset by a $5.3 million increase in legal fees primarily attributable to our trademark infringement lawsuit against Google, Inc. and other intellectual property enforcement actions. In addition, personnel related costs increased $1.1 million due to expansion of our finance, legal, human resources, information technology and other administrative functions which enable continued support our overall growth and international expansion. Consulting expense increased $1.0 million primarily the result of increased expenses associated with investment in our IT infrastructure. Liability insurances for directors and officers increased $0.3 million, business taxes increased by $0.2 million and audit fees increased $0.4 million. Bad debt expense increased $0.8 million primarily due
55
to an additional reserve to limit our financial exposure related to the Chapter 11 bankruptcy reorganization of Borders Group, Inc. In 2011, we expect there will be increases to certain general and administrative expenses to support expansion into new international markets. However, we also are taking steps to reduce certain general and administrative expenses as we realign our resources with our business priorities.
Stock-Based Compensation Charge
Included in each of the respective operating expense lines for the year ended December 31, 2009 is a portion of the $18.8 million charge related to the total of 591,491 shares of common stock awarded to 10 of our key employees in April 2009. The following table presents the stock-based compensation charge by operating expense line item:
| |
Year Ended December 31, |
|
|
||||||||||
|---|---|---|---|---|---|---|---|---|---|---|---|---|---|
| |
2010 | 2009 | Change | % Change | |||||||||
| |
(dollars in thousands) |
||||||||||||
Sales and marketing |
— | $ | 377 | $ | (377 | ) | (100 | )% | |||||
Research and development |
— | 5,033 | (5,033 | ) | (100 | )% | |||||||
General and administrative |
— | 13,393 | (13,393 | ) | (100 | )% | |||||||
Total |
$ | — | $ | 18,803 | $ | (18,803 | ) | (100 | )% | ||||
Lease Abandonment Expenses
As a result of accelerated growth in our Arlington, Virginia headquarters, the Company exceeded maximum capacity in our leased office space in the third quarter of 2010. At that time, there was no additional space available for lease in the 1919 N. Lynn St. location and additional space was needed to support continued growth. Our previously abandoned office space at 1101 Wilson Blvd was unoccupied, and as a result of its close proximity to the 1919 N. Lynn St. location, we made the decision to reoccupy the formerly abandoned space. As of September 30, 2010, the remaining liability associated with the abandonment of the operating lease at 1101 Wilson Blvd was reversed resulting in a $0.6 million decrease in expense for the year ended December 31, 2010 compared to December 31, 2009.
Interest and Other Income (Expense)
| |
Year Ended December 31, | 2010 versus 2009 | |||||||||||
|---|---|---|---|---|---|---|---|---|---|---|---|---|---|
| |
2010 | 2009 | Change | % Change | |||||||||
| |
(dollars in thousands) |
||||||||||||
Interest Income |
$ | 262 | $ | 159 | $ | 103 | 64.8 | % | |||||
Interest Expense |
(66 | ) | (356 | ) | 290 | (81.5 | )% | ||||||
Other Income (Expense) |
(220 | ) | 112 | (332 | ) | (296.4 | )% | ||||||
Total |
$ | (24 | ) | $ | (85 | ) | $ | 61 | (71.8 | )% | |||
Interest income represents interest earned on our cash and cash equivalents. Interest income for the year ended December 31, 2010 was $0.3 million, an increase of $0.1 million, or 65%, from the year ended December 31, 2009.
Interest expense is primarily related to our long-term debt, the outstanding balance of which was zero as of December 31, 2010, as well as interest related to our other capital leases. Interest expense for the year ended December 31, 2010 was $66,000, a decrease of $0.3 million, or 82% from the year ended December 31, 2009. The decrease was primarily due to the retirement of our previous Madison Capital term loan.
56
Other expense for the year ended December 31, 2010 was $0.2 million compared to other income of $0.1 million for the year ended December 31, 2009, a decrease of $0.3 million or 296%. The decrease is primarily the result of foreign exchange losses and a decrease in trademark infringement awards.
Income Tax Expense (Benefit)
| |
Year Ended December 31, | |
|
||||||||||
|---|---|---|---|---|---|---|---|---|---|---|---|---|---|
| |
2010 | 2009 | Change | % Change | |||||||||
| |
(dollars in thousands) |
||||||||||||
Income tax expense (benefit) |
$ | (411 | ) | $ | 7,084 | $ | (7,495 | ) | (105.8 | )% | |||
Income tax benefit for the year ended December 31, 2010 was $0.4 million, a decrease of $7.5 million, or 106%, compared to the year ended December 31, 2009. The decrease was the result of a decrease of $7.6 million in pre-tax income for the year ended December 31, 2010 and a lower effective tax rate, compared to the year ended December 31, 2009. Our effective tax rate decreased to (3%) for the year ended December 31, 2010 compared to 35% for the year ended December 31, 2009. The reduction in our effective tax rate was a result of changes in the geographic distribution of our income and the release of the valuation allowance on net operating loss carryforwards and other deferred tax assets of our U.K. and Japan subsidiaries. In 2011, we expect our income tax rate to increase to levels comparable to 2009.
Comparison of the Year Ended December 31, 2009 and the Year Ended December 31, 2008
| |
Year Ended December 31, | |
|
|||||||||||||||||
|---|---|---|---|---|---|---|---|---|---|---|---|---|---|---|---|---|---|---|---|---|
| |
2009 | 2008 | Change | % Change | ||||||||||||||||
| |
(dollars in thousands) |
|||||||||||||||||||
Product revenue |
$ | 218,549 | 86.6 | % | $ | 184,182 | 88.0 | % | $ | 34,367 | 18.7 | % | ||||||||
Subscription and service revenue |
33,722 | 13.4 | % | 25,198 | 12.0 | % | 8,524 | 33.8 | % | |||||||||||
Total revenue |
$ | 252,271 | 100.0 | % | $ | 209,380 | 100.0 | % | $ | 42,891 | 20.5 | % | ||||||||
Revenue by sales channel: |
||||||||||||||||||||
Direct-to-consumer |
$ | 115,791 | 45.9 | % | $ | 96,702 | 46.2 | % | $ | 19,089 | 19.7 | % | ||||||||
Kiosk |
40,565 | 16.1 | % | 36,314 | 17.3 | % | 4,251 | 11.7 | % | |||||||||||
Retail |
45,894 | 18.2 | % | 34,638 | 16.5 | % | 11,256 | 32.5 | % | |||||||||||
Home school |
6,817 | 2.7 | % | 9,170 | 4.4 | % | (2,353 | ) | (25.7 | )% | ||||||||||
Total consumer |
209,067 | 82.9 | % | 176,824 | 84.5 | % | 32,243 | 18.2 | % | |||||||||||
Institutional |
43,204 | 17.1 | % | 32,556 | 15.5 | % | $ | 10,648 | 32.7 | % | ||||||||||
Total revenue |
$ | 252,271 | 100.0 | % | $ | 209,380 | 100.0 | % | $ | 42,891 | 20.5 | % | ||||||||
Revenue
Total revenue for the year ended December 31, 2009 was $252.3 million, an increase of $42.9 million, or 21%, from the year ended December 31, 2008.
Consumer
Consumer revenue was $209.1 million for the year ended December 31, 2009, an increase of $32.2 million, or 18%, from the year ended December 31, 2008. The increase in consumer revenue was attributable to a 3% increase in unit sales, which resulted in a $26.5 million increase in revenue, combined with a 14% increase in the average selling price of each unit, which accounted for a
57
$4.6 million increase in revenue. The change in online subscription deferred revenue decreased revenue by $1.2 million and $0.1 million in 2008 and 2009, respectively. Growth in unit sales was driven by the planned expansion of our direct marketing programs, as well as growth in our retail distribution network. Direct advertising expenses increased 25% to $42.4 million during the year ended December 31, 2009, while the number of kiosks increased from 150 to 242 from December 31, 2008 to December 31, 2009. Our 2008 revenue includes a $2.6 million initial stocking order we received from Barnes & Noble in June 2008 to support their expansion of our product line to over 650 of their stores nationally. We did not have any such large initial stocking orders in 2009.
Product revenue represented 96% of total consumer revenue for the year ended December 31, 2009, with the balance attributable to subscription and service revenue. With the launch of Rosetta Stone Version 4 TOTALe during the third quarter of 2010, we began bundling time-based subscription licenses of our web-based TOTALe services with perpetual licenses of our Rosetta Stone Version 3 language learning solutions in the U.S. consumer market. As a result, we began deferring revenue of approximately 15%—20% of each of these bundled sales. We will recognize the deferred revenue over the term of the subscription license in accordance with Accounting Standards Codification subtopic 985-605, Software: Revenue Recognition.
Institutional
Institutional revenue was $43.2 million for the year ended December 31, 2009, an increase of $10.7 million, or 33%, compared to the year ended December 31, 2008. The increase in institutional revenue was primarily due to the expansion of our direct sales force. As a result, we had a $4.8 million increase in education revenue, a $3.9 million increase in government revenue and a $2.0 million increase in corporate revenue.
Product revenue represented 52% of total institutional revenue for the year ended December 31, 2009, and subscription and service revenue represented 48% for the same period.
Cost of Revenue and Gross Profit
| |
Year Ended December 31, | |
|
|||||||||||
|---|---|---|---|---|---|---|---|---|---|---|---|---|---|---|
| |
2009 | 2008 | Change | % Change | ||||||||||
| |
(dollars in thousands) |
|||||||||||||
Revenue: |
||||||||||||||
Product |
$ | 218,549 | $ | 184,182 | $ | 34,367 | 18.7 | % | ||||||
Subscription and service |
33,722 | 25,198 | $ | 8,524 | 33.8 | % | ||||||||
Total revenue |
$ | 252,271 | $ | 209,380 | $ | 42,891 | 20.5 | % | ||||||
Cost of revenue: |
||||||||||||||
Cost of product revenue |
$ | 30,264 | $ | 26,539 | $ | 3,725 | 14.0 | % | ||||||
Cost of subscription and service revenue |
3,163 | 2,137 | $ | 1,026 | 48.0 | % | ||||||||
Total cost of revenue |
33,427 | 28,676 | 4,751 | 16.6 | % | |||||||||
Gross profit |
$ | 218,844 | $ | 180,704 | $ | 38,140 | ||||||||
Gross margin percentages |
86.7 | % | 86.3 | % | 0.4 | % | ||||||||
Cost of revenue for the year ended December 31, 2009 was $33.4 million, an increase of $4.8 million, or 17%, from the year ended December 31, 2008. As a percentage of total revenue, cost of revenue decreased to 13% for the year ended December 31, 2009 compared to 14% for the year ended December 31, 2008. The dollar increase in cost of revenue was primarily attributable to expansion of our product offering combined with a change in our sales mix, offset in part by a reduction in affiliate commissions and the absence in the 2009 period of intangible amortization related
58
to core technology associated with the acquisition of Fairfield & Sons, Ltd., which was fully amortized in 2008. Cost of subscription and service revenue increased by $1.0 million or 48% as we released Rosetta Stone TOTALe, our new web-based service offering that included a component of dedicated language conversation coaching.
Operating Expenses
| |
Year Ended December 31, | |
|
||||||||||
|---|---|---|---|---|---|---|---|---|---|---|---|---|---|
| |
2009 | 2008 | Change | % Change | |||||||||
| |
(dollars in thousands) |
||||||||||||
Sales and marketing |
$ | 114,899 | $ | 93,384 | $ | 21,515 | 23.0 | % | |||||
Research and development |
26,239 | 18,387 | 7,852 | 42.7 | % | ||||||||
General and administrative |
57,182 | 39,577 | 17,605 | 44.5 | % | ||||||||
Lease abandonment |
(8 | ) | 1,831 | (1,839 | ) | (100.4 | )% | ||||||
Total operating expenses |
$ | 198,312 | $ | 153,179 | $ | 45,133 | 29.5 | % | |||||
Sales and Marketing Expenses
Sales and marketing expenses for the year ended December 31, 2009 were $114.9 million, an increase of $21.5 million, or 23%, from the year ended December 31, 2008. As a percentage of total revenue, sales and marketing expenses were 46% for the year ended December 31, 2009, compared to 45% for the year ended December 31, 2008. The dollar and percentage increase in sales and marketing expenses were primarily attributable to the continued expansion of our direct marketing activities. Advertising expenses grew by $8.6 million and were primarily related to television and radio media and internet marketing. We also expanded the number of our kiosks from 150 as of December 31, 2008 to 242 as of December 31, 2009, which resulted in $6.2 million of additional kiosk operating expenses, including rent and sales compensation related expenses. Personnel costs related to growth in our institutional sales channel and marketing and sales support activities also increased by $6.4 million. The stock compensation charge related to a common stock grant to key employees in connection with our initial public offering resulted in a $0.4 million increase in sales and marketing expense in 2009 compared to the prior year period. Completion in January 2009 of the amortization of the intangible assets associated with the 2006 acquisition of Fairfield & Sons, Ltd. resulted in a $3.0 million reduction in amortization expense in 2009 when compared to the prior year period.
Sales and marketing expenses without consideration of the stock compensation charge associated with the common stock grant to key employees in connection with our initial public offering would have been $114.5 million, an increase of $21.1 million or 23% from the prior year. As a percentage of revenue, sales and marketing expenses would have remained the same at 45% for the year ended December 31, 2009 compared to the prior year period.
Research and Development Expenses
Research and development expenses were $26.2 million for the year ended December 31 2009, an increase of $7.9 million, or 43%, from the year ended December 31, 2008. As a percentage of total revenue, research and development expenses increased to 10% for the year ended December 31, 2009 compared to 9% for the year ended December 31, 2008. The dollar and percentage increase were primarily attributable to a stock compensation charge related to common stock awarded to key employees which resulted in a $5.0 million increase in research and development expense in 2009 when compared to the prior year period. In addition, research and development expenses increased $3.0 million due to the addition of new product development personnel associated with the development of new products and services that are complementary to our existing solutions.
59
Research and development expenses without consideration of the stock compensation charge associated with the common stock grant to key employees in connection with our initial public offering would have been $21.2 million, an increase of $2.9 million or 16% from the prior year. As a percentage of revenue, research and development expenses would have decreased to 8% for the year ended December 31, 2009 from 9% for the prior year period.
General and Administrative Expenses
General and administrative expenses for the year ended December 31, 2009 were $57.2 million, an increase of $17.6 million, or 45%, from the year ended December 31, 2008. As a percentage of revenue, general and administrative expenses increased to 23% for the year ended December 31, 2009 compared to 19% for the year ended December 31, 2008. The dollar and percentage increases were primarily attributable to a stock compensation charge related to common stock awarded to key employees in connection with our initial public offering resulting in a $13.4 million increase in general and administrative expense. In addition, general and administrative expenses increased due to greater personnel related costs as we expanded our finance, legal, information technology and other administrative functions to support the overall growth in our business. Personnel-related costs increased $4.2 million with a corresponding increase in communications, training, recruitment, travel and other support costs of $0.6 million and new office space and equipment depreciation costs of $0.9 million. Legal fees also increased $0.4 million related to intellectual property protection matters, and liability insurances for directors and officers increased $0.3 million. This increase was partially offset by decreased professional service expenses of $1.5 million as we replaced contract staff with employees and a decrease in bad debt expense $0.7 million during the year ended December 31, 2009 as a result of improved collection efforts.
General and administrative expenses without consideration of the stock compensation charge associated with the common stock grant to key employees in connection with our initial public offering would have been $43.8 million, an increase of $4.2 million or 11% from the prior year. As a percentage of revenue, general and administrative expenses would have decreased to 17% for the year ended December 31, 2009 from 19% for the prior year period.
Stock-Based Compensation Charge
Included in each of the respective operating expense lines for the year ended December 31, 2009 is a portion of the $18.8 million charge related to the total of 591,491 shares of common stock awarded to 10 of our key employees in April 2009. The following table presents the stock-based compensation charge by operating expense line item:
| |
Year Ended December 31, | |
|
||||||||||
|---|---|---|---|---|---|---|---|---|---|---|---|---|---|
| |
2009 | 2008 | Change | % Change | |||||||||
| |
(dollars in thousands) |
||||||||||||
Sales and marketing |
$ | 377 | $ | — | $ | 377 | 100 | % | |||||
Research and development |
5,033 | — | $ | 5,033 | 100 | % | |||||||
General and administrative |
13,393 | — | 13,393 | 100 | % | ||||||||
Total |
$ | 18,803 | $ | — | $ | 18,803 | 100 | % | |||||
Lease Abandonment Expenses
We incurred a lease abandonment benefit of $(8,000) for the year ended December 31, 2009; however, with respect to the year ended December 31, 2008, we incurred lease abandonment expense associated with the relocation of our headquarters of $1.8 million consisting of accrued exit costs and liabilities under operating lease agreements.
60
Interest and Other Income (Expense)
| |
Year Ended December 31, | |
|
||||||||||
|---|---|---|---|---|---|---|---|---|---|---|---|---|---|
| |
2009 | 2008 | Change | % Change | |||||||||
| |
(dollars in thousands) |
||||||||||||
Interest income |
$ | 159 | $ | 454 | $ | (295 | ) | (65.0 | )% | ||||
Interest expense |
(356 | ) | (891 | ) | $ | 535 | (60.0 | )% | |||||
Other income |
112 | 239 | $ | (127 | ) | (53.1 | )% | ||||||
Total |
$ | (85 | ) | $ | (198 | ) | $ | 113 | (57.1 | )% | |||
Interest income represents interest earned on our cash and cash equivalents. Interest income for the year ended December 31, 2009 was $0.2 million, a decrease of $0.3 million, or 65%, from the year ended December 31, 2008. Interest expense is primarily related to our long-term debt, the outstanding balance of which was zero as of December 31, 2009. Interest expense for the year ended December 31, 2009 was $0.4 million, a decrease of $0.5 million, or 60% from the year ended December 31, 2008. The decrease was primarily due to the retirement of our previous Madison Capital term loan. Other income for the year ended December 31, 2009 was $0.1 million, a decrease of $0.1 million, or 53% and is primarily due to foreign currency fluctuations.
Income Tax Expense
| |
Year Ended December 31, | |
|
||||||||||
|---|---|---|---|---|---|---|---|---|---|---|---|---|---|
| |
2009 | 2008 | Change | % Change | |||||||||
| |
(dollars in thousands) |
||||||||||||
Income tax expense |
$ | 7,084 | $ | 13,435 | $ | (6,351 | ) | (47.3 | )% | ||||
Income tax expense for the year ended December 31, 2009 was $7.1 million, a decrease of $6.4 million, or 47%, compared to the year ended December 31, 2008. The decrease was the result of a decrease of $6.9 million in pre-tax income for the year ended December 31, 2009 and a lower effective tax rate, compared to the year ended December 31, 2008. Our effective tax rate decreased to 35% for the year ended December 31, 2009 compared to 49% for the year ended December 31, 2008. The reduction in our effective tax rate was a result of changes in the geographic distribution of our income and a change in our transfer pricing agreements.
We determine the pricing among our associated entities on the basis of detailed functional and economic analysis involving benchmarking against transactions among entities that are not under common control. Based on our analysis, we made changes to the transfer pricing agreements effective January 1, 2009. The resulting change in geographic distributions of income contributed to a lower effective tax rate as compared to the year ended December 31, 2008.
We do not currently record income tax on the results of our U.K., Japan or Germany subsidiaries. Despite enacting certain tax planning strategies during the year ended December 31, 2009, no subsidiary has produced sustainable pretax profits as of December 31, 2009 and each remains in a three-year cumulative loss position. Accordingly we continue to carry a full valuation allowance on net operating loss carryforwards and other deferred tax assets for these jurisdictions. As we continue operations in accordance with the revised transfer pricing agreements, we will monitor actual results and updated projections on a quarterly basis. When and if the subsidiaries realize or realistically anticipate sustainable profitability, we will assess the appropriateness of releasing the valuation allowance in whole or in part.
61
Liquidity and Capital Resources
Our primary operating cash requirements include the payment of salaries, incentive compensation, employee benefits and other personnel-related costs, as well as direct advertising expenses, costs of office facilities and costs of information technology systems. We fund these requirements through cash flow from our operations.
On January 16, 2009, we entered into a new secured credit agreement with Wells Fargo Bank, N.A., or Wells Fargo, that provided us with a $12.5 million revolving line of credit. This revolving credit facility has a two-year term and the applicable interest rate is 2.5% above one month LIBOR. On January 16, 2009, we borrowed approximately $9.9 million under this revolving credit facility and used these funds to repay the entire outstanding principal and interest of the term loan we had with Madison Capital. As a result, we have no borrowings owed to Madison Capital under either their term loan or revolving credit facility, and we have terminated these credit agreements.
On January 17, 2011, the Company allowed its $12.5 million revolving line of credit with Wells Fargo to expire.
We expect that our future growth will continue to require additional working capital. Our future capital requirements will depend on many factors, including development of new products, market acceptance of our products, the levels of advertising and promotion required to launch additional products and improve our competitive position in the marketplace, the expansion of our sales, support and marketing organizations, the establishment of additional offices in the United States and worldwide and building the infrastructure necessary to support our growth, the response of competitors to our products and our relationships with suppliers and clients. We have experienced increases in our expenditures consistent with the growth in our operations and personnel, and we anticipate that our expenditures will continue to increase in the future. We believe that anticipated cash flows from operations will provide sufficient liquidity to fund our business and meet our obligations in the foreseeable future.
Cash Flow Analysis
Net Cash Provided By Operating Activities
Net cash provided by operating activities was $31.7 million for the year ended December 31, 2010 compared to $41.2 million for the year ended December 31, 2009. Net cash provided by operating activities was primarily generated from net income as adjusted for depreciation and amortization and stock compensation expense. Net income totaled $13.3 million for the year ended December 31, 2010 compared to $13.4 million for the year ended December 31, 2009. Depreciation, amortization and stock compensation expense for the period totaled $11.0 million. A decrease in stock-based compensation expense was primarily the result of $18.5 million in non cash expense associated with the issuance of common stock to key employees in April 2009. This decrease was offset by a $21.0 million increase in deferred revenue due to increased sales of subscription licenses, and a $6.0 million increase in accounts payable as a result of increased management of our cash flow and the deferral of payments to certain vendors during the fourth quarter of 2010, to better match cash outflows with cash inflows, which contributed to net cash provided by operations. In the future, our cash flow management may not be successful in extending the timing of payments to vendors, which would then cause this cash flow benefit to reverse. If our efforts to reposition the U.S. consumer business are not successful, we would anticipate our cash flow from operations to decline in 2011.
Net cash provided by operating activities was $41.2 million for the year ended December 31, 2009. Net cash provided by operating activities was primarily generated from net income as adjusted for depreciation and amortization and stock compensation expense. Net income totaled $13.4 million for the year ended December 31, 2009. Depreciation, amortization and stock compensation expense for the
62
period totaled $27.6 million. A decrease in amortization resulting from the full amortization of intangible assets in January 2009 was partially offset by increases in depreciation on tangible assets associated with the expansion of the business. The increase in stock-based compensation expense was primarily the result of $18.5 million in non cash expense associated with the issuance of common stock to key employees in April 2009. Additionally, a $10.3 million increase in deferred revenue resulting from greater sales of subscription licenses contributed to net cash provided by operations.
Net cash provided by operating activities was $18.3 million for the year ended December 31, 2008. Net cash provided by operating activities was primarily generated from net income as adjusted for depreciation and amortization and stock compensation expense. Net income totaled $13.9 million for the year ended December 31, 2008. Depreciation, amortization and stock compensation expense for the period totaled $8.7 million. Increases in deferred revenue resulting from greater sales of subscription licenses also contributed to net cash provided by operations; the increase represented $3.1 million for the year ended December 31, 2008. As a result of the growth in our retail channel and institutional sales, accounts receivable increased by $16.5 million. This increase in accounts receivable was offset in part by increases in net liabilities associated with the expansion of our business.
Net Cash Used In Investing Activities
Net cash used in investing activities was $14.9 million, $8.6 million, and $7.0 million for the years ended December 31, 2010, 2009 and 2008, respectively. Our investing activities during these periods primarily related to the purchase of property and equipment associated with the expansion of our information technology systems and our facilities as a result of our growth and international expansion, and the purchase of short-term investments.
Net Cash Used In Financing Activities
Net cash provided by financing activities was $3.4 million for the year ended December 31, 2010 compared to $32.0 million for the year ended December 31, 2009. Net cash provided by financing activities during the year ended December 31, 2010 primarily related to net proceeds received from stock option exercises. Net cash provided by financing activities during the year ended December 31, 2009 primarily related to $49.0 million in net proceeds from our initial public offering, offset by the $9.9 million payment of the balance outstanding under our revolving credit facility with Wells Fargo and the $7.9 million payment of taxes associated with the common stock grant to some of our key employees.
Net cash used in financing activities was $4.6 million for the year ended December 31, 2008. Net cash used in financing activities during this period was primarily related to principal payments on our long-term debt. Additionally, for the year ended December 31, 2008, net cash used in financing activities also included payments associated with our planned initial public offering.
We believe our current cash and cash equivalents, short term investments and funds generated from our operations will be sufficient to meet our working capital and capital expenditure requirements through 2011. Thereafter, we may need to raise additional funds through public or private financings or increased borrowings to develop or enhance products, to fund expansion, to respond to competitive pressures or to acquire complementary products, businesses or technologies. If required, additional financing may not be available on terms that are favorable to us, if at all. If we raise additional funds through the issuance of equity or convertible debt securities, the percentage ownership of our stockholders will be reduced and these securities might have rights, preferences and privileges senior to those of our current stockholders. No assurance can be given that additional financing will be available or that, if available, such financing can be obtained on terms favorable to our stockholders and us.
63
During the last three years, inflation and changing prices have not had a material effect on our business and we do not expect that inflation or changing prices will materially affect our business in the foreseeable future.
Off-Balance Sheet Arrangements
We do not engage in any off-balance sheet financing arrangements. We do not have any interest in entities referred to as variable interest entities, which include special purpose entities and other structured finance entities.
Contractual Obligations
The following table summarizes our contractual obligations at December 31, 2010 and the effect such obligations are expected to have on our liquidity and cash flow in future periods.
| |
Total | Less than 1 Year | 1 - 3 Years | 3 - 5 Years | More than 5 Years | |||||||||||
|---|---|---|---|---|---|---|---|---|---|---|---|---|---|---|---|---|
| |
(in thousands) |
|||||||||||||||
Long-term debt |
$ | — | $ | — | $ | — | $ | — | $ | — | ||||||
Operating lease obligations |
12,392 | 6,611 | 5,218 | 563 | — | |||||||||||
Total |
$ | 12,392 | $ | 6,611 | $ | 5,218 | $ | 563 | $ | — | ||||||
The operating lease obligations reflected in the table above include our corporate office leases and site licenses for our kiosks.
We anticipate that we will experience an increase in our capital expenditures and lease commitments consistent with our anticipated growth in operations, infrastructure and personnel during the remainder of 2011.
Recent Accounting Pronouncements
In December 2009, the Financial Accounting Standards Board ("FASB") issued Accounting Standards Update ("ASU") No. 2009-17, "Consolidations (Topic 810)—Improvements to Financial Reporting by Enterprises Involved with Variable Interest Entities." ASU No. 2009-17 changes how a reporting entity determines when an entity that is insufficiently capitalized or is not controlled through voting (or similar rights) should be consolidated. The determination of whether a reporting entity is required to consolidate another entity is based on, among other things, the other entity's purpose and design and the reporting entity's ability to direct the activities of the other entity that most significantly impact the other entity's economic performance. ASU No. 2009-17 requires a reporting entity to provide additional disclosures about its involvement with variable interest entities and any significant changes in risk exposure due to that involvement. A reporting entity is required to disclose how its involvement with a variable interest entity affects the reporting entity's financial statements. ASU No. 2009-17 is effective for fiscal years beginning after November 15, 2009, and interim periods within those fiscal years. We adopted ASU No. 2009-17 as of January 1, 2010, and its application had no impact on our consolidated financial statements.
In October 2009, the FASB issued ASU No. 2009-13, "Revenue Recognition (Topic 605)—Multiple-Deliverable Revenue Arrangements." ASU No. 2009-13 addresses the accounting for multiple-deliverable arrangements to enable vendors to account for products or services (deliverables) separately rather than as a combined unit. ASU No. 2009-13 permits prospective or retrospective adoption. The Company elected prospective adoption during the quarter ended March 31, 2010. Under the historical accounting principles, the Company was required to account for online services bundled with auxiliary items, such as headsets and audio companions, using the residual method or by treating the arrangements as one unit of accounting. ASU No. 2009-13 requires the Company to account for the sale of online services
64
bundled with auxiliary items as two deliverables. The first deliverable is the auxiliary items which are delivered at the time of sale, and the second deliverable is the online services. This results in the recognition of a portion of the revenue from the sales of online services bundled with auxiliary items at time of sale. We adopted ASU No. 2009-13 as of January 1, 2010, and its application did not have a material impact on our consolidated financial statements.
In October 2009, the FASB issued ASU 2009-14 which amended the accounting requirements under the Software Topic, ASC 985-605 Revenue Recognition. The objective of this update is to address the accounting for revenue arrangements that contain tangible products and software. Specifically, products that contain software that is "more than incidental" to the product as a whole will be removed from the scope of ASC subtopic 985-605 (previously AICPA Statement of Position 97-2). The amendments align the accounting for these revenue transaction types with the amendments under ASU 2009-13 mentioned above. The guidance provided within ASU 2009-14 is effective for fiscal years beginning on or after June 15, 2010 and allows for either prospective or retrospective application, with early adoption permitted. We adopted ASU No. 2009-14 as of January 1, 2010, and its application did not have a material impact on our consolidated financial statements.
Item 7A. Quantitative and Qualitative Disclosures About Market Risk
Foreign Currency Exchange Risk
The functional currency of our foreign subsidiaries is their local currency. Accordingly, our results of operations and cash flows are subject to fluctuations due to changes in foreign currency exchange rates. The volatility of the prices and applicable rates are dependent on many factors that we cannot forecast with reliable accuracy. In the event our foreign sales and expenses increase, our operating results may be more greatly affected by fluctuations in the exchange rates of the currencies with which we do business. At this time we do not, but we may in the future, invest in derivatives or other financial instruments in an attempt to hedge our foreign currency exchange risk.
Interest Rate Sensitivity
Interest income and expense are sensitive to changes in the general level of U.S. interest rates. However, based on the nature and current level of our marketable securities, which are primarily short-term investment grade and government securities and our notes payable, we believe that there is no material risk of exposure.
Item 8. Financial Statements and Supplementary Data
Our consolidated financial statements, together with the related notes and the report of independent registered public accounting firm, are set forth on the pages indicated in Item 15.
Item 9. Changes In and Disagreements with Accountants on Accounting and Financial Disclosure
None.
Item 9A. Controls and Procedures
Evaluation of Disclosure Controls and Procedures
Our management, with the participation of our Chief Executive Officer and our Chief Financial Officer, evaluated the effectiveness of our disclosure controls and procedures as of December 31, 2010. The term "disclosure controls and procedures," as defined in Rules 13a-15(e) and 15d-15(e) under the Exchange Act, means controls and other procedures of a company that are designed to ensure that information required to be disclosed by a company in the reports that it files or submits under the Exchange Act is recorded, processed, summarized and reported, within the time periods specified in the
65
SEC's rules and forms. Disclosure controls and procedures include, without limitation, controls and procedures designed to ensure that information required to be disclosed by a company in the reports that it files or submits under the Exchange Act is accumulated and communicated to the company's management, including its principal executive and principal financial officers, as appropriate to allow timely decisions regarding required disclosure. Management recognizes that any controls and procedures, no matter how well designed and operated, can provide only reasonable assurance of achieving their objectives and management necessarily applies its judgment in evaluating the cost-benefit relationship of possible controls and procedures. Based on the evaluation of our disclosure controls and procedures as of December 31, 2010, our Chief Executive Officer and Chief Financial Officer concluded that, as of such date, our disclosure controls and procedures were effective at the reasonable assurance level.
Management's annual report on internal control over financial reporting
We are responsible for establishing and maintaining adequate internal control over our financial reporting. We have assessed the effectiveness of internal control over financial reporting as of December 31, 2010. Our assessment was based on criteria set forth by the Committee of Sponsoring Organizations of the Treadway Commission, or COSO, in Internal Control-Integrated Framework.
Our internal control over financial reporting is a process designed to provide reasonable assurance regarding the reliability of financial reporting and the preparation of financial statements for external purposes in accordance with generally accepted accounting principles. Our internal control over financial reporting includes those policies and procedures that:
- (1)
- pertain
to the maintenance of records that, in reasonable detail, accurately and fairly reflect our transactions and dispositions of our assets;
- (2)
- provide
reasonable assurance that transactions are recorded as necessary to permit preparation of financial statements in accordance with generally accepted
accounting principles, and that our receipts and expenditures are being made only in accordance with authorizations of our management and board of directors; and
- (3)
- provide reasonable assurance regarding prevention or timely detection of unauthorized acquisition, use, or disposition of our assets that could have a material effect on the financial statements.
Because of its inherent limitations, internal control over financial reporting may not prevent or detect misstatements. Also, projections of any evaluation of effectiveness to future periods are subject to the risk that controls may become inadequate because of changes in conditions, or that the degree of compliance with the policies or procedures may deteriorate.
Based on using the COSO criteria, we believe our internal control over financial reporting as of December 31, 2010 was effective.
Our independent registered public accounting firm, Deloitte & Touche LLP, has audited the financial statements included in this Annual Report on Form 10-K and has issued a report on the effectiveness of our internal control over financial reporting. The attestation report of Deloitte & Touche LLP is included on page F-3 of this Form 10-K.
Changes in Internal Control over Financial Reporting
There was no change in our internal control over financial reporting identified in connection with the evaluation required by Rule 13a-15(d) and 15d-15(d) of the Exchange Act that occurred during the period covered by this report that has materially affected, or is reasonably likely to materially affect, our internal control over financial reporting.
66
None.
Certain information required by Part III is omitted from this Annual Report on Form 10-K as we intend to file our definitive Proxy Statement for the 2011 Annual Meeting of Stockholders pursuant to Regulation 14A of the Securities Exchange Act of 1934, as amended, not later than 120 days after the end of the fiscal year covered by this Annual Report, and certain information included in the Proxy Statement is incorporated herein by reference.
Item 10. Directors, Executive Officers and Corporate Governance
The information required by this Item is incorporated herein by reference to the information provided under the headings "Election of Directors," "Section 16(A) Beneficial Ownership Reporting Compliance," "Corporate Governance—Board of Directors," "Corporate Governance—Committees," "Corporate Governance—Audit Committee," "Corporate Governance—Nominating & Corporate Governance Committee" and "Stockholder Proposals for 2011 Annual Meeting and Director Nominations" in our definitive proxy statement for the 2011 Annual Meeting of Stockholders to be filed with the Securities and Exchange Commission no later than 120 days after the fiscal year ended December 31, 2010 (the "2011 Proxy Statement").
Code of Ethics and Business Conduct
We have adopted a code of ethics and business conduct ("code of conduct") that applies to all of our employees, officers and directors, including without limitation our principal executive officer, principal financial officer and controller or principal accounting officer. Copies of both the code of conduct, as well as any waiver of a provision of the code of conduct granted to any senior officer or director or material amendment to the code of conduct, if any, are available, without charge, under the "Corporate Governance—Highlights" tab on our website at www.rosettastone.com. We intend to disclose any amendments or waivers of this code on our website.
Item 11. Executive Compensation
The information required by this Item is incorporated herein by reference to the information provided under the headings "Compensation & Management Development Committee Report", "Executive Compensation," "Non-Employee Director Compensation" and "Compensation Committee Interlocks and Insider Participation" in the 2011 Proxy Statement.
Item 12. Security Ownership of Certain Beneficial Owners and Management and Related Stockholder Matters
The information required by this Item is incorporated herein by reference to the information provided under the headings "Security Ownership of Certain Beneficial Owners and Management" and "Equity Compensation Plan Information" in the 2011 Proxy Statement.
Item 13. Certain Relationships and Related Transactions, and Director Independence
The information required by this Item is incorporated herein by reference to the information provided under the headings "Corporate Governance—Board of Directors," "Corporate Governance—Committees" and "Interests of Management and Others in Certain Transactions" in the 2011 Proxy Statement.
67
Item 14. Principal Accounting Fees and Services
The information required by this Item is incorporated herein by reference to the information provided under the heading "Principal Accountant Fees and Services" in the 2011 Proxy Statement.
Item 15. Exhibits and Financial Statement Schedules
(a) Consolidated Financial Statements
- 1.
- Consolidated Financial Statements. The consolidated financial statements as listed in the accompanying "Index
to Consolidated Financial Information" are filed as part of this Annual Report.
- 2.
- Consolidated Financial Statement Schedules. Schedules have been omitted because they are not applicable or are not required or the information required to be set forth in those schedules is included in the consolidated financial statements or related notes.
All other schedules not listed in the accompanying index have been omitted as they are either not required or not applicable, or the required information is included in the consolidated financial statements or the notes thereto.
- (b)
- Exhibits
The exhibits listed in the Index to Exhibits are filed as part of this Annual Report on Form 10-K.
68
Pursuant to the requirements of Section 13 or 15(d) of the Securities Exchange Act of 1934, the registrant has duly caused this report to be signed on its behalf by the undersigned, thereunto duly authorized.
| ROSETTA STONE INC. | ||||
By: |
/s/ TOM P.H. ADAMS Tom P. H. Adams Chief Executive Officer |
|||
Date: March 14, 2011
Pursuant to the requirements of the Securities Exchange Act of 1934, this report has been signed below by the following persons on behalf of the registrant and in the capacities on the 14th day of March, 2011.
Signature
|
Title
|
|
|---|---|---|
| /s/ TOM P. H. ADAMS Tom P. H. Adams |
Chief Executive Officer and Director (Principal Executive Officer) |
|
/s/ STEPHEN M. SWAD Stephen M. Swad |
Chief Financial Officer (Principal Financial Officer) |
|
/s/ LAURENCE FRANKLIN Laurence Franklin |
Chairman of the Board, Director |
|
/s/ PHILLIP A. CLOUGH Phillip A. Clough |
Director |
|
/s/ JOHN T. COLEMAN John T. Coleman |
Director |
|
/s/ PATRICK W. GROSS Patrick W. Gross |
Director |
|
/s/ THEODORE J. LEONSIS Theodore J. Leonsis |
Director |
|
/s/ JOHN E. LINDAHL John E. Lindahl |
Director |
|
/s/ LAURA L. WITT Laura L. Witt |
Director |
69
INDEX TO CONSOLIDATED FINANCIAL STATEMENTS
F-1
REPORT OF INDEPENDENT REGISTERED PUBLIC ACCOUNTING FIRM
To
the Board of Directors and Stockholders of
Rosetta Stone Inc.
Arlington, VA
We have audited the accompanying consolidated balance sheets of Rosetta Stone Inc. and subsidiaries (the "Company") as of December 31, 2010 and 2009, and the related consolidated statements of operations, changes in stockholders' equity, and cash flows for each of the three years in the period ended December 31, 2010. These financial statements are the responsibility of the Company's management. Our responsibility is to express an opinion on the financial statements based on our audits.
We conducted our audits in accordance with the standards of the Public Company Accounting Oversight Board (United States). Those standards require that we plan and perform the audit to obtain reasonable assurance about whether the financial statements are free of material misstatement. An audit includes examining, on a test basis, evidence supporting the amounts and disclosures in the financial statements. An audit also includes assessing the accounting principles used and significant estimates made by management, as well as evaluating the overall financial statement presentation. We believe that our audits provide a reasonable basis for our opinion.
In our opinion, such consolidated financial statements present fairly, in all material respects, the financial position of the Company as of December 31, 2010 and 2009, and the results of their operations and their cash flows for each of the three years in the period ended December 31, 2010, in conformity with accounting principles generally accepted in the United States of America.
We have also audited, in accordance with the standards of the Public Company Accounting Oversight Board (United States), the Company's internal control over financial reporting as of December 31, 2010, based on the criteria established in Internal Control—Integrated Framework issued by the Committee of Sponsoring Organizations of the Treadway Commission and our report dated March 11, 2011 expressed an unqualified opinion on the Company's internal control over financial reporting.
/s/ DELOITTE & TOUCHE LLP
McLean,
Virginia
March 11, 2011
F-2
REPORT OF INDEPENDENT REGISTERED PUBLIC ACCOUNTING FIRM
To
the Board of Directors and Stockholders of
Rosetta Stone Inc.
Arlington, VA
We have audited the internal control over financial reporting of Rosetta Stone Inc. and subsidiaries (the "Company") as of December 31, 2010, based on criteria established in Internal Control—Integrated Framework issued by the Committee of Sponsoring Organizations of the Treadway Commission. The Company's management is responsible for maintaining effective internal control over financial reporting and for its assessment of the effectiveness of internal control over financial reporting, included in the accompanying Management's annual report on internal control over financial reporting. Our responsibility is to express an opinion on the Company's internal control over financial reporting based on our audit.
We conducted our audit in accordance with the standards of the Public Company Accounting Oversight Board (United States). Those standards require that we plan and perform the audit to obtain reasonable assurance about whether effective internal control over financial reporting was maintained in all material respects. Our audit included obtaining an understanding of internal control over financial reporting, assessing the risk that a material weakness exists, testing and evaluating the design and operating effectiveness of internal control based on the assessed risk, and performing such other procedures as we considered necessary in the circumstances. We believe that our audit provides a reasonable basis for our opinion.
A company's internal control over financial reporting is a process designed by, or under the supervision of, the company's principal executive and principal financial officers, or persons performing similar functions, and effected by the company's board of directors, management, and other personnel to provide reasonable assurance regarding the reliability of financial reporting and the preparation of financial statements for external purposes in accordance with generally accepted accounting principles. A company's internal control over financial reporting includes those policies and procedures that (1) pertain to the maintenance of records that, in reasonable detail, accurately and fairly reflect the transactions and dispositions of the assets of the company; (2) provide reasonable assurance that transactions are recorded as necessary to permit preparation of financial statements in accordance with generally accepted accounting principles, and that receipts and expenditures of the company are being made only in accordance with authorizations of management and directors of the company; and (3) provide reasonable assurance regarding prevention or timely detection of unauthorized acquisition, use, or disposition of the company's assets that could have a material effect on the financial statements.
Because of the inherent limitations of internal control over financial reporting, including the possibility of collusion or improper management override of controls, material misstatements due to error or fraud may not be prevented or detected on a timely basis. Also, projections of any evaluation of the effectiveness of the internal control over financial reporting to future periods are subject to the risk that the controls may become inadequate because of changes in conditions, or that the degree of compliance with the policies or procedures may deteriorate.
In our opinion, the Company maintained, in all material respects, effective internal control over financial reporting as of December 31, 2010, based on the criteria established in Internal Control—Integrated Framework issued by the Committee of Sponsoring Organizations of the Treadway Commission.
We have also audited, in accordance with the standards of the Public Company Accounting Oversight Board (United States), the consolidated financial statements as of and for the year ended December 31, 2010 of the Company and our report dated March 11, 2011 expressed an unqualified opinion on those financial statements.
/s/ DELOITTE & TOUCHE LLP
McLean,
Virginia
March 11, 2011
F-3
ROSETTA STONE INC.
CONSOLIDATED BALANCE SHEETS
(in thousands, except per share amounts)
| |
As of December 31, | ||||||||
|---|---|---|---|---|---|---|---|---|---|
| |
2010 | 2009 | |||||||
Assets |
|||||||||
Current assets: |
|||||||||
Cash and cash equivalents |
$ | 115,756 | $ | 95,188 | |||||
Restricted cash |
85 | 50 | |||||||
Short term investments |
6,410 | — | |||||||
Accounts receivable (net of allowance for doubtful accounts of $1,761 and $1,349, respectively) |
48,056 | 37,400 | |||||||
Inventory, net |
9,928 | 8,984 | |||||||
Prepaid expenses and other current assets |
7,763 | 7,447 | |||||||
Income tax receivable |
2,210 | — | |||||||
Deferred income taxes |
11,159 | 6,020 | |||||||
Total current assets |
201,367 | 155,089 | |||||||
Property and equipment, net |
21,073 | 18,374 | |||||||
Goodwill |
34,856 | 34,838 | |||||||
Intangible assets, net |
10,948 | 10,704 | |||||||
Deferred income taxes |
6,498 | 5,565 | |||||||
Other assets |
1,732 | 872 | |||||||
Total assets |
$ | 276,474 | $ | 225,442 | |||||
Liabilities and stockholders' equity |
|||||||||
Current liabilities: |
|||||||||
Accounts payable |
$ | 7,631 | $ | 1,605 | |||||
Accrued compensation |
10,514 | 10,463 | |||||||
Other current liabilities |
32,625 | 25,638 | |||||||
Deferred revenue |
41,965 | 24,291 | |||||||
Income tax payable |
— | 4,184 | |||||||
Total current liabilities |
92,735 | 66,181 | |||||||
Deferred revenue |
5,193 |
1,815 |
|||||||
Other long-term liabilities |
230 | 1,011 | |||||||
Total liabilities |
98,158 | 69,007 | |||||||
Commitments and contingencies (Note 14) |
|||||||||
Stockholders' equity: |
|||||||||
Preferred Stock, $0.001 par value; 10,000 and 10,000 shares authorized; zero and zero shares issued and outstanding at December 31, 2010 and December 31, 2009, respectively |
— | — | |||||||
Non-designated common stock, $0.00005 par value, 190,000 and 190,000 shares authorized, 20,975 and 20,440 shares issued and outstanding at December 31, 2010 and December 31, 2009, respectively |
2 | 2 | |||||||
Additional paid-in capital |
139,022 | 130,872 | |||||||
Accumulated income |
39,069 | 25,785 | |||||||
Accumulated other comprehensive income (loss) |
223 | (224 | ) | ||||||
Total stockholders' equity |
178,316 | 156,435 | |||||||
Total liabilities and stockholders' equity |
$ | 276,474 | $ | 225,442 | |||||
See accompanying notes to consolidated financial statements.
F-4
ROSETTA STONE INC.
CONSOLIDATED STATEMENTS OF OPERATIONS
(in thousands except per share amounts)
| |
Year Ended December 31, | ||||||||||||
|---|---|---|---|---|---|---|---|---|---|---|---|---|---|
| |
2010 | 2009 | 2008 | ||||||||||
Revenue: |
|||||||||||||
Product |
$ | 215,590 | $ | 218,549 | $ | 184,182 | |||||||
Subscription and service |
43,278 | 33,722 | 25,198 | ||||||||||
Total revenue |
258,868 | 252,271 | 209,380 | ||||||||||
Cost of revenue: |
|||||||||||||
Cost of product revenue |
32,549 | 30,264 | 26,539 | ||||||||||
Cost of subscription and service revenue |
6,450 | 3,163 | 2,137 | ||||||||||
Total cost of revenue |
38,999 | 33,427 | 28,676 | ||||||||||
Gross profit |
219,869 | 218,844 | 180,704 | ||||||||||
Operating expenses |
|||||||||||||
Sales and marketing |
130,879 | 114,899 | 93,384 | ||||||||||
Research and development |
23,437 | 26,239 | 18,387 | ||||||||||
General and administrative |
53,239 | 57,182 | 39,577 | ||||||||||
Lease abandonment |
(583 | ) | (8 | ) | 1,831 | ||||||||
Total operating expenses |
206,972 | 198,312 | 153,179 | ||||||||||
Income from operations |
12,897 | 20,532 | 27,525 | ||||||||||
Other income and expense: |
|||||||||||||
Interest income |
262 | 159 | 454 | ||||||||||
Interest expense |
(66 | ) | (356 | ) | (891 | ) | |||||||
Other income (expense) |
(220 | ) | 112 | 239 | |||||||||
Total other income (expense) |
(24 | ) | (85 | ) | (198 | ) | |||||||
Income before income taxes |
12,873 |
20,447 |
27,327 |
||||||||||
Income tax provision (benefit) |
(411 | ) | 7,084 | 13,435 | |||||||||
Net income |
$ | 13,284 | $ | 13,363 | $ | 13,892 | |||||||
Net income per share: |
|||||||||||||
Basic |
$ | 0.65 | $ | 0.89 | $ | 7.29 | |||||||
Diluted |
$ | 0.63 | $ | 0.67 | $ | 0.82 | |||||||
Common shares and equivalents outstanding: |
|||||||||||||
Basic weighted average shares |
20,439 | 14,990 | 1,905 | ||||||||||
Diluted weighted average shares |
21,187 | 19,930 | 16,924 | ||||||||||
See accompanying notes to consolidated financial statements.
F-5
CONSOLIDATED STATEMENTS OF CHANGES IN STOCKHOLDERS' EQUITY
(in thousands)
| |
Class A, Series A-1 Convertible Preferred Stock |
Class A, Series A-2 Convertible Preferred Stock |
|
|
|
|
|
|
|
|
|
|
|
|
|||||||||||||||||||||||||||||||||||||
|---|---|---|---|---|---|---|---|---|---|---|---|---|---|---|---|---|---|---|---|---|---|---|---|---|---|---|---|---|---|---|---|---|---|---|---|---|---|---|---|---|---|---|---|---|---|---|---|---|---|---|---|
| |
Class B Convertible Preferred Stock |
Class A Convertible Common Stock |
Class B Convertible Common Stock |
Non-Designated Common Stock |
|
|
Accumulated Other Comprehensive Income (loss) |
|
|||||||||||||||||||||||||||||||||||||||||||
| |
Additional Paid-in Capital |
Accumulated Income (loss) |
Total Stockholders' Equity |
||||||||||||||||||||||||||||||||||||||||||||||||
| |
Shares | Amount | Shares | Amount | Shares | Amount | Shares | Amount | Shares | Amount | Shares | Amount | |||||||||||||||||||||||||||||||||||||||
Balance—January 1, 2008 |
269 | 26,876 | 178 | 17,820 | 63 | 6,341 | — | — | — | — | 1,837 | 1 | 8,613 | (1,470 | ) | (56 | ) | 58,125 | |||||||||||||||||||||||||||||||||
Stock issued upon the exercise of stock options |
— | — | — | — | — | — | — | — | — | — | 99 | — | 365 | — | — | 365 | |||||||||||||||||||||||||||||||||||
Stock-based compensation expense |
— | — | — | — | — | — | — | — | — | — | — | — | 1,590 | — | — | 1,590 | |||||||||||||||||||||||||||||||||||
Tax benefit on stock options exercised |
— | — | — | — | — | — | — | — | — | — | — | — | 246 | — | — | 246 | |||||||||||||||||||||||||||||||||||
Expiration of redemption rights of Class B Redeemable Convertible Preferred Stock |
— | — | — | — | 48 | 5,000 | — | — | — | — | — | — | — | — | — | 5,000 | |||||||||||||||||||||||||||||||||||
Comprehensive income: |
|||||||||||||||||||||||||||||||||||||||||||||||||||
Net income |
— | — | — | — | — | — | — | — | — | — | — | — | — | 13,892 | — | 13,892 | |||||||||||||||||||||||||||||||||||
Foreign currency translation loss, net of tax of $52 |
— | — | — | — | — | — | — | — | — | — | — | — | — | — | (147 | ) | (147 | ) | |||||||||||||||||||||||||||||||||
Total comprehensive income |
— | — | — | — | — | — | — | — | — | — | — | — | — | — | — | 13,745 | |||||||||||||||||||||||||||||||||||
Balance—December 31, 2008 |
269 | $ | 26,876 | 178 | $ | 17,820 | 111 | $ | 11,341 | — | $ | — | — | $ | — | 1,936 | $ | 1 | $ | 10,814 | $ | 12,422 | $ | (203 | ) | $ | 79,071 | ||||||||||||||||||||||||
Stock issued upon the exercise of stock options |
— | — | — | — | — | — | — | — | — | — | 89 | — | 386 | — | — | 386 | |||||||||||||||||||||||||||||||||||
Stock issued to employees |
— | — | — | — | — | — | — | — | — | — | 591 | — | 10,647 | — | — | 10,647 | |||||||||||||||||||||||||||||||||||
Stock-based compensation expense |
— | — | — | — | — | — | — | — | — | — | — | — | 3,616 | — | — | 3,616 | |||||||||||||||||||||||||||||||||||
Tax benefit on stock options exercised |
— | — | — | — | — | — | — | — | — | — | — | — | 336 | — | — | 336 | |||||||||||||||||||||||||||||||||||
Conversion of preferred stock |
(269 | ) | (26,876 | ) | (178 | ) | (17,820 | ) | (111 | ) | (11,341 | ) | — | — | — | — | 14,508 | 1 | 56,036 | — | — | — | |||||||||||||||||||||||||||||
Sale of common stock |
— | — | — | — | — | — | — | — | — | — | 3,125 | — | 49,037 | — | — | 49,037 | |||||||||||||||||||||||||||||||||||
Comprehensive income: |
|||||||||||||||||||||||||||||||||||||||||||||||||||
Net income |
— | — | — | — | — | — | — | — | — | — | — | — | — | 13,363 | — | 13,363 | |||||||||||||||||||||||||||||||||||
Foreign currency translation loss, net of tax of $(8) |
— | — | — | — | — | — | — | — | — | — | — | — | — | — | (21 | ) | (21 | ) | |||||||||||||||||||||||||||||||||
Total comprehensive income |
— | — | — | — | — | — | — | — | — | — | — | — | — | — | — | 13,342 | |||||||||||||||||||||||||||||||||||
Balance—December 31, 2009 |
— | $ | — | — | $ | — | — | $ | — | — | $ | — | — | $ | — | 20,249 | $ | 2 | $ | 130,872 | $ | 25,785 | $ | (224 | ) | $ | 156,435 | ||||||||||||||||||||||||
Stock issued upon the exercise of stock options |
— | — | — | — | — | — | — | — | — | — | 364 | — | 2,387 | — | — | 2,387 | |||||||||||||||||||||||||||||||||||
Stock issued to employees |
— | — | — | — | — | — | — | — | — | — | 54 | — | — | — | — | — | |||||||||||||||||||||||||||||||||||
Stock-based compensation expense |
— | — | — | — | — | — | — | — | — | — | — | — | 4,387 | — | — | 4,387 | |||||||||||||||||||||||||||||||||||
Tax benefit on stock options exercised |
— | — | — | — | — | — | — | — | — | — | — | — | 1,376 | — | — | 1,376 | |||||||||||||||||||||||||||||||||||
Conversion of preferred stock |
— | — | — | — | — | — | — | — | — | — | — | — | — | — | — | — | |||||||||||||||||||||||||||||||||||
Sale of common stock |
— | — | — | — | — | — | — | — | — | — | — | — | — | — | — | — | |||||||||||||||||||||||||||||||||||
Comprehensive income: |
|||||||||||||||||||||||||||||||||||||||||||||||||||
Net income |
— | — | — | — | — | — | — | — | — | — | — | — | — | 13,284 | — | 13,284 | |||||||||||||||||||||||||||||||||||
Foreign currency translation gain, net of tax of $110 |
— | — | — | — | — | — | — | — | — | — | — | — | — | — | 447 | 447 | |||||||||||||||||||||||||||||||||||
Total comprehensive income |
— | — | — | — | — | — | — | — | — | — | — | — | — | — | — | 13,731 | |||||||||||||||||||||||||||||||||||
Balance—December 31, 2010 |
— | $ | — | — | $ | — | — | $ | — | — | $ | — | — | $ | — | 20,667 | $ | 2 | $ | 139,022 | $ | 39,069 | $ | 223 | $ | 178,316 | |||||||||||||||||||||||||
See accompanying notes to consolidated financial statements.
F-6
ROSETTA STONE INC.
CONSOLIDATED STATEMENTS OF CASH FLOWS
(in thousands)
| |
Year Ended December 31, | |||||||||||||
|---|---|---|---|---|---|---|---|---|---|---|---|---|---|---|
| |
2010 | 2009 | 2008 | |||||||||||
Cash Flows From Operating Activities: |
||||||||||||||
Net income |
$ | 13,284 | $ | 13,363 | $ | 13,892 | ||||||||
Adjustments to reconcile net income to cash provided by operating activities, net of business acquisitions |
||||||||||||||
Stock-based compensation expense |
4,387 | 22,150 | 1,590 | |||||||||||
Bad debt expense |
1,750 | 911 | 1,611 | |||||||||||
Depreciation and amortization |
6,615 | 5,428 | 7,075 | |||||||||||
Amortization of deferred financing costs |
— | 209 | 104 | |||||||||||
Gain on embedded derivative |
— | — | (4 | ) | ||||||||||
Deferred income tax benefit |
(6,057 | ) | (2,475 | ) | (2,177 | ) | ||||||||
Loss on disposal of equipment |
37 | 42 | 17 | |||||||||||
Net change in: |
||||||||||||||
Restricted cash |
(30 | ) | (16 | ) | 359 | |||||||||
Accounts receivable |
(12,260 | ) | (11,779 | ) | (16,494 | ) | ||||||||
Inventory |
(935 | ) | (3,916 | ) | (1,092 | ) | ||||||||
Prepaid expenses and other current assets |
(236 | ) | (1,006 | ) | (1,041 | ) | ||||||||
Other assets |
(761 | ) | (429 | ) | (91 | ) | ||||||||
Accounts payable |
5,987 | (1,604 | ) | (1,430 | ) | |||||||||
Accrued compensation |
(16 | ) | 1,905 | 3,933 | ||||||||||
Other current liabilities |
6,106 | 5,678 | 7,393 | |||||||||||
Income tax payable |
(5,028 | ) | 3,188 | 925 | ||||||||||
Excess tax benefit from stock options exercised |
(1,377 | ) | (336 | ) | (246 | ) | ||||||||
Other long-term liabilities |
(789 | ) | (463 | ) | 963 | |||||||||
Deferred revenue |
21,029 | 10,300 | 3,051 | |||||||||||
Net cash provided by operating activities |
31,706 | 41,150 | 18,338 | |||||||||||
Cash Flows From Investing Activities: |
||||||||||||||
Purchases of property and equipment |
(8,256 | ) | (8,455 | ) | (7,019 | ) | ||||||||
Purchases of available-for-sale securities |
(6,410 | ) | — | — | ||||||||||
Acquisition, net of cash acquired |
(225 | ) | (100 | ) | — | |||||||||
Net cash used in investing activities |
(14,891 | ) | (8,555 | ) | (7,019 | ) | ||||||||
Cash Flows From Financing Activities: |
||||||||||||||
Proceeds from common stock issuance, net of issuance costs |
— | 49,037 | — | |||||||||||
Proceeds from the exercise of stock options |
2,387 | 473 | 365 | |||||||||||
Tax benefit of stock options exercised |
1,377 | 336 | 246 | |||||||||||
Costs incurred for intended initial public offering |
— | — | (1,801 | ) | ||||||||||
Payment of payroll taxes on net common stock issuance |
— | (7,887 | ) | — | ||||||||||
Payment of payroll taxes on stock options exercised |
— | (89 | ) | — | ||||||||||
Proceeds from long-term debt |
— | 9,929 | — | |||||||||||
Principal payments under long-term debt |
— | (19,839 | ) | (3,402 | ) | |||||||||
Payments under capital lease obligations and acquisition liabilities |
(367 | ) | (3 | ) | (12 | ) | ||||||||
Net cash provided by (used in) financing activities |
3,397 | 31,957 | (4,604 | ) | ||||||||||
Increase in cash and cash equivalents |
20,212 | 64,552 | 6,715 | |||||||||||
Effect of exchange rate changes in cash and cash equivalents |
356 | 10 | 2,220 | |||||||||||
Net increase in cash and cash equivalents |
20,568 | 64,562 | 8,935 | |||||||||||
Cash and cash equivalents—beginning of year |
95,188 | 30,626 | 21,691 | |||||||||||
Cash and cash equivalents—end of year |
$ | 115,756 | $ | 95,188 | $ | 30,626 | ||||||||
Supplemental Cash Flow Disclosure: |
||||||||||||||
Cash paid during the periods for: |
||||||||||||||
Interest |
$ | 66 | $ | 104 | $ | 936 | ||||||||
Income taxes, net |
$ | 9,989 | $ | 6,364 | $ | 14,642 | ||||||||
Noncash financing and investing activities: |
||||||||||||||
Accrued liability for purchase of property , equipment and intangibles |
$ | 1,567 | $ | 546 | $ | 1,076 | ||||||||
Equipment acquired under capital lease |
$ | — | $ | 14 | $ | — | ||||||||
Contingent liability for acquisition |
$ | — | $ | 850 | $ | — | ||||||||
See accompanying notes to consolidated financial statements.
F-7
ROSETTA STONE INC.
NOTES TO CONSOLIDATED FINANCIAL STATEMENTS
1. NATURE OF OPERATIONS
Rosetta Stone Inc. and its subsidiaries ("Rosetta Stone," the "Company" or the "Successor") develops, markets and supports a suite of language learning solutions consisting of software products, online services and audio practice tools under the Rosetta Stone brand name. The Company's software products are sold on a direct basis and through select retailers. The Company provides its software applications to customers through the sale of packaged software and online subscriptions. Rosetta Stone Inc. was incorporated on December 23, 2005 in the state of Delaware and acquired Rosetta Stone Holdings Inc., a Delaware corporation, on January 4, 2006. Rosetta Stone Holdings Inc. acquired Rosetta Stone Ltd. (formerly Fairfield & Sons, Ltd.) and Rosetta Stone (UK) Limited (formerly Fairfield & Sons UK Limited), on January 4, 2006. Rosetta Stone Inc. has seven wholly owned operating subsidiaries—Rosetta Stone Holdings Inc., a Delaware corporation, Rosetta Stone Ltd., a Virginia corporation, Rosetta Stone International Inc., a Delaware corporation, Rosetta Stone Brazil Holding LLC, a Delaware Corporation, Rosetta Stone (UK) Limited, a corporation incorporated under the laws of England and Wales, Rosetta Stone Japan Inc., a company incorporated under the laws of Japan, and Rosetta Stone GmbH, a company incorporated under the laws of Germany.
On November 1, 2009, the Company acquired certain assets from SGLC International Co. Ltd., headquartered in Seoul, South Korea.
2. SUMMARY OF SIGNIFICANT ACCOUNTING POLICIES
Initial Public Offering
In April 2009, the Company completed an initial public offering consisting of 7,187,500 shares of common stock at $18.00 per share. The total shares sold in the offering included 4,062,500 sold by selling stockholders and 3,125,000 shares sold by the Company.
After deducting the payment of underwriters' discounts and commissions and offering expenses, the net proceeds to the Company from the sale of shares in the offering were $49.0 million. The net proceeds from the offering were used to repay a $9.9 million balance on the revolving credit facility and $7.9 million to satisfy the federal, state and local withholding tax obligations associated with the net issuance of stock grants made to key employees.
Principles of Consolidation
The consolidated financial statements are prepared in accordance with accounting principles generally accepted in the United States of America and include the accounts of the Company and its wholly-owned subsidiaries. All intercompany balances and transactions have been eliminated in consolidation.
Use of Estimates
The preparation of financial statements in accordance with accounting principles generally accepted in the United States of America requires that management make certain estimates and assumptions. Significant estimates and assumptions have been made regarding the allowance for doubtful accounts, estimated sales returns, stock-based compensation, fair value of assets and liabilities acquired, lease abandonment accrual, fair value of intangibles and goodwill, fair value of stock issued, inventory reserve, disclosure of contingent assets and liabilities and disclosure of contingent litigation. Actual results may differ from these estimates.
F-8
ROSETTA STONE INC.
NOTES TO CONSOLIDATED FINANCIAL STATEMENTS (Continued)
2. SUMMARY OF SIGNIFICANT ACCOUNTING POLICIES (Continued)
Revenue Recognition
Revenue is primarily derived from the sale of packaged software and audio practice products, online software subscriptions and professional services. Professional services include training, implementation services and dedicated conversational coaching associated with Rosetta Stone TOTALe. Rosetta Stone TOTALe online, which was released in July 2009, combines dedicated conversational coaching and an online software subscription. Rosetta Stone V4 TOTALe, which was released in September 2010, combines packaged software and dedicated conversational coaching. The Company recognizes revenue for software products and related services in accordance with Accounting Standards Codification subtopic 985-605, Software: Revenue Recognition ("ASC 985-605").
Revenue is recognized when all of the following criteria are met: there is persuasive evidence of an arrangement; the product has been delivered or services have been rendered; the fee is fixed and determinable; and collectability is probable. Revenues from packaged software and audio practice products and online software subscriptions are recorded net of discounts.
Revenue is recognized from the sale of packaged software and audio practice products when the product has been delivered, assuming the remaining revenue recognition criteria have been met. Software products include sales to end-user customers and resellers. In most cases, revenue from sales to resellers is not contingent upon resale of the software to the end user and is recorded in the same manner as all other product sales. Revenue from sales of packaged software products are recognized as the products are shipped and title passes and risks of loss have been transferred. For most of the Company's product sales, these criteria are met at the time the product is shipped. For some sales to resellers and certain other sales, the Company defers revenue until the customer receives the product because the Company legally retains a portion of the risk of loss on these sales during transit. A limited amount of packaged software products are sold to resellers on a consignment basis. Revenue is recognized for these consignment transactions once the end-user sale has occurred, assuming the remaining revenue recognition criteria have been met. In accordance with Accounting Standards Codification subtopic 985-605-50, Software: Revenue Recognition: Customer Payments and Incentives ("ASC 985-605-50"), price protection for changes in the manufacturer suggested retail value granted to resellers for the inventory that they have on hand at the date the price protection is offered is recorded as a reduction to revenue. The Company offers customers the ability to make payments for packaged software purchases in installments over a period of time, which typically ranges between three and five months. Given that these installment payment plans are for periods less than 12 months and a successful collection history has been established, revenue is recognized at the time of sale, assuming the remaining revenue recognition criteria have been met. For the year ended December 31, 2010 and 2009, installment sales represented 11%, and 8% of revenue, respectively. Packaged software is provided to customers who purchase directly from us with a six-month right of return. The company also allows its retailers to return unsold products, subject to some limitations. In accordance with Accounting Standards Codification subtopic 985-605-15, Software: Revenue Recognition: Products ("ASC 985-605-15"), product revenue is reduced for estimated returns, which are based on historical return rates.
Revenue for software license agreements sold via online software subscriptions as hosting agreements are recognized in accordance with Accounting Standards Codification subtopic 985-605-05, Software: Revenue Recognition: Background ("ASC 985-605-05"). Revenue for online software subscriptions is recognized ratably over the term of the subscription period, assuming all revenue
F-9
ROSETTA STONE INC.
NOTES TO CONSOLIDATED FINANCIAL STATEMENTS (Continued)
2. SUMMARY OF SIGNIFICANT ACCOUNTING POLICIES (Continued)
recognition criteria have been met, which typically ranges between 3 and 12 months. Some online licensing arrangements include a specified number of licenses that can be activated over a period of time, which typically ranges between 12 and 24 months. Revenue for these arrangements is recognized on a per license basis ratably over the term of the individual license subscription period, assuming all revenue recognition criteria have been met, which typically ranges between three and 12 months. Revenue for set-up fees related to online licensing arrangements is recognized ratably over the term of the online licensing arrangement, assuming all revenue recognition criteria have been met. Accounts receivable and deferred revenue are recorded at the time a customer enters into a binding subscription agreement and the subscription services are made available to the customer. In connection with packaged software product sales and online software subscriptions, technical support is provided to customers, including customers of resellers, at no additional charge. As the fee for technical support is included in the initial licensing fee, the technical support and services are generally provided within one year, the estimated cost of providing such support is deemed insignificant and no unspecified upgrades/enhancements are offered, technical support revenues are recognized together with the software product and license revenue. Costs associated with the technical support are accrued at the time of sale.
Revenue for online service subscriptions for dedicated conversational coaching are recognized ratably over the term of the subscription period, assuming all revenue recognition criteria have been met, which typically ranges between 3 and 15 months. Rosetta Stone V4 TOTALe bundles, which include dedicated conversational coaching online services and packaged software, allow customers to begin their online services at any point during a registration window, which typically ranges between 6 and 12 months from the date of purchase from the Company or an authorized reseller. Dedicated conversational coaching online service subscriptions that are not activated during this registration window are forfeited and revenue is recognized upon expiry. Accounts receivable and deferred revenue are recorded at the time a customer purchases the online services.
In accordance with ASC 985-605-50, cash sales incentives to resellers are accounted for as a reduction of revenue, unless a specific identified benefit is identified and the fair value is reasonably determinable.
The Company has been engaged to develop language learning software for certain endangered languages under fixed-fee arrangements. These arrangements also include contractual periods of post-contract support ("PCS") and online hosting services ranging from one to ten years. Revenue for multi-element contracts are recognized ratably once the PCS and online hosting periods begin, over the longer of the PCS or online hosting period. When the current estimates of total contract revenue and contract cost indicate a loss for a fixed fee arrangement, a provision for the entire loss on the contract is recorded.
Revenue Recognition for Arrangements with Multiple Deliverables
As of January 1, 2010, the Company began to recognize revenue prospectively for new arrangements with multiple deliverables in accordance with ASU No. 2009-13, "Revenue Recognition (Topic 605)—Multiple Deliverable Revenue Arrangements ("ASU No. 2009-13"). For multi-element arrangements that include online services and auxiliary items, such as headsets and audio practice products which provide stand-alone value to the customer, the Company allocates revenue to all deliverables based on their relative selling prices in accordance with ASU No. 2009-13. The new
F-10
ROSETTA STONE INC.
NOTES TO CONSOLIDATED FINANCIAL STATEMENTS (Continued)
2. SUMMARY OF SIGNIFICANT ACCOUNTING POLICIES (Continued)
accounting principles establish a hierarchy to determine the selling price to be used for allocating revenue to deliverables as follows: (i) vendor-specific objective evidence of fair value ("VSOE"), (ii) third-party evidence of selling price ("TPE"), and (iii) best estimate of the selling price ("ESP"). VSOE generally exists only when the Company sells the deliverable separately and is the price actually charged by the Company for that deliverable. ESPs reflect its best estimates of what the selling prices of elements would be if they were sold regularly on a stand-alone basis.
The Company has identified two deliverables generally contained in arrangements involving the sale of online services bundled with auxiliary items. The first deliverable is the auxiliary items, which are delivered at the time of sale, and the second deliverable is the online services. The Company allocates revenue between these two deliverables using the relative selling price method. Amounts allocated to the auxiliary items are recognized at the time of sale, provided the other conditions for revenue recognition have been met. Amounts allocated to the online services are deferred and recognized on a straight-line basis over the term of the online services. The auxiliary item cost of sales are generally recognized at the time of sale. Costs for online services and sales and marketing are expensed as incurred.
The Company has identified two deliverables generally contained in Rosetta Stone V4 TOTALe software arrangements. The first deliverable is the packaged software, which is delivered at the time of sale, and the second deliverable is the dedicated conversational coaching online services. The Company allocates revenue between these two deliverables using the relative selling price method. Amounts allocated to the software are recognized at the time of sale, provided the other conditions for revenue recognition have been met. Amounts allocated to the online services are deferred and recognized on a straight-line basis over the term of the online services or upon expiry of the online services. The language learning software cost of sales are generally recognized at the time of sale. Costs for online services and sales and marketing are expensed as incurred.
The Company accounts for multiple element arrangements that consist only of software or software related products, in accordance with industry specific accounting guidance for software and software related transactions. For such transactions, revenue on arrangements that include multiple elements is allocated to each element based on the relative fair value of each element, and fair value is generally determined by VSOE. If the Company cannot objectively determine the fair value of any undelivered element included in such multiple element arrangements, the Company defers revenue until all elements are delivered and services have been performed, or until fair value can objectively be determined for any remaining undelivered elements.
Cash and Cash Equivalents
Cash and cash equivalents consist of highly liquid investments with original maturities of three months or less and demand deposits with financial institutions.
Restricted Cash
Restricted cash is restricted for the reimbursement of funds to employees under the Company's flexible benefit plan and security for a credit card processing vendor.
F-11
ROSETTA STONE INC.
NOTES TO CONSOLIDATED FINANCIAL STATEMENTS (Continued)
2. SUMMARY OF SIGNIFICANT ACCOUNTING POLICIES (Continued)
Short-Term Investments
Short-term investments generally consist of highly liquid, fixed-income investments with an original maturity at the time of purchase of greater than three months. Such investments consist of obligations of the U.S. government and government agencies.
Investments are classified as available-for-sale and stated at fair value. The net unrealized gains or losses on available-for-sale securities are reported as a component of comprehensive income. The specific identification method is used to compute the realized gains and losses on investments. Investments are periodically reviewed for impairment. If the carrying value of an investment exceeds its fair value and the decline in value is determined to be other-than-temporary, an impairment loss is recognized for the difference.
Accounts Receivable and Allowance for Doubtful Accounts
Accounts receivable consist of amounts due to the Company from its normal business activities. The Company provides an allowance for doubtful accounts to reflect the expected non-collection of accounts receivable based on past collection history and specific risks identified.
Inventories
Inventories are stated at the lower of cost, determined on a first-in first-out basis, or market. The Company reviews inventory for excess quantities and obsolescence based on its best estimates of future demand, product lifecycle status and product development plans. The Company uses historical information along with these future estimates to reserve for obsolete and potential obsolete inventory.
Concentrations of Credit Risk
Accounts receivable and cash and cash equivalents subject the Company to its highest potential concentrations of credit risk. The Company reserves for credit losses and does not require collateral on its trade accounts receivable. In addition, the Company maintains cash and investment balances in accounts at various banks and brokerage firms. The Company is insured by the Federal Deposit Insurance Corporation for up to $250,000 at each bank. The Company's cash and cash equivalents generally exceed the insured limits. The Company has not experienced any losses on cash and cash equivalent accounts to date and the Company believes it is not exposed to any significant credit risk related to cash. The Company sells products to retailers, resellers, government agencies, and individual consumers and extends credit based on an evaluation of the customer's financial condition, without requiring collateral. Exposure to losses on receivables is principally dependent on each customer's financial condition. The Company monitors its exposure for credit losses and maintains allowances for anticipated losses. No customer accounted for more than 10% of the Company's revenue during the years ended December 31, 2010, 2009 or 2008. The Company had four customers that accounted for 46% of accounts receivable at December 31, 2010 and three customers that accounted for 47% of accounts receivable at December 31, 2009.
Fair Value of Financial Instruments
In 2008 and 2009, the Company adopted the provisions of ASC No. 820, "Fair Value Measurements." The valuation techniques required by ASC No. 820 are based upon observable and
F-12
ROSETTA STONE INC.
NOTES TO CONSOLIDATED FINANCIAL STATEMENTS (Continued)
2. SUMMARY OF SIGNIFICANT ACCOUNTING POLICIES (Continued)
unobservable inputs. Observable inputs reflect market data obtained from independent sources, while unobservable inputs reflect our market assumptions. These two types of inputs create the following fair value hierarchy:
Level 1: Quoted prices for identical instruments in active markets.
Level 2: Quoted prices for similar instruments in active markets; quoted prices for identical or similar instruments in markets that are not active; and model-derived valuations whose inputs are observable or whose significant value drivers are observable.
Level 3: Significant inputs to the valuation model are unobservable.
The carrying amounts reported in the consolidated balance sheets for cash and cash equivalents, restricted cash, accounts receivable, accounts payable and other accrued expenses approximate fair value due to relatively short periods to maturity.
See table below for summary of the Company's financial instruments accounted for at fair value on a recurring basis, which consist only of our short-term investments that are marked to fair value at each balance sheet date, as well as the fair value of the accrual for the contingent purchase price of our acquisition of SGLC in 2009:
| |
|
Fair Value as of December 31, 2010 using: | |||||||||||
|---|---|---|---|---|---|---|---|---|---|---|---|---|---|
| |
December 31, 2010 |
Quoted Prices in Active Markets for Identical Assets (Level 1) |
Significant Other Observable Inputs (Level 2) |
Significant Unobservable Inputs (Level 3) |
|||||||||
Assets: |
|||||||||||||
Short-term investments |
$ | 6,410 | $ | 6,410 | $ | — | $ | — | |||||
Total |
$ | 6,410 | $ | 6,410 | $ | — | $ | — | |||||
Liabilities: |
|||||||||||||
Contingent purchase price accrual |
$ | 573 | $ | — | $ | — | $ | 573 | |||||
Total |
$ | 573 | $ | — | $ | — | $ | 573 | |||||
Property, Equipment and Software
Property, equipment, and software are stated at cost, less accumulated depreciation and amortization. Depreciation on property, leasehold improvements, equipment, and software is computed on a straight-line basis over the estimated useful lives of the assets, as follows:
| Software | 3 years | |
| Computer equipment | 3 - 5 years | |
| Automobiles | 5 years | |
| Furniture and equipment | 5 - 7 years | |
| Building | 39 years | |
| Building improvements | 15 years | |
| Leasehold improvements | 4 - 7 years | |
| Assets under capital leases | lesser of lease term or economic life |
F-13
ROSETTA STONE INC.
NOTES TO CONSOLIDATED FINANCIAL STATEMENTS (Continued)
2. SUMMARY OF SIGNIFICANT ACCOUNTING POLICIES (Continued)
Expenses for repairs and maintenance that do not extend the life of equipment are charged to expense as incurred. Expenses for major renewals and betterments, which significantly extend the useful lives of existing property and equipment, are capitalized and depreciated. Upon retirement or disposition of property and equipment, the cost and related accumulated depreciation are removed from the accounts and any resulting gain or loss is recognized.
Intangible Assets
Intangible assets consist of acquired technology, including developed and core technology, customer related assets, trade name and trademark and other intangible assets. Those intangible assets with finite lives are recorded at cost and amortized on a straight line basis over their expected lives in accordance with Accounting Standards Codification topic 350, Goodwill and Other Intangible Assets ("ASC 350"). On an annual basis, the Company reviews its indefinite lived intangible assets for impairment based on the fair value of indefinite lived intangible assets as compared to the carrying value in accordance with ASC 350. In the event the carrying value exceeds the fair value of the assets, the assets are written down to their fair value. There has been no impairment of intangible assets during any of the periods presented.
Goodwill
In accordance with ASC 350, goodwill is not amortized and is tested for impairment annually on June 30th and whenever events and circumstances occur indicating goodwill might be impaired. As of June 30, 2010 and 2009, the Company reviewed the goodwill for impairment and determined that no impairment of goodwill was identified during any of the periods presented.
Valuation of Long-Lived Assets
In accordance with Accounting Standards Codification topic 360, Accounting for the Impairment or Disposal of Long-lived Assets ("ASC 360"), the Company evaluates the recoverability of its long-lived assets. ASC 360 requires recognition of impairment of long-lived assets in the event that the net book value of such assets exceeds the future undiscounted net cash flows attributable to such assets. Impairment, if any, is recognized in the period of identification to the extent the carrying amount of an asset exceeds the fair value of such asset. Based on its analysis, the Company believes that no impairment of its long-lived assets was indicated as of December 31, 2010 and 2009.
Financial Instruments with Characteristics of Both Liabilities and Equity
The Company issues financial instruments that have characteristics of both liabilities and equity. The Company accounts for these arrangements in accordance with Accounting Standards Codification topic 480, Accounting for Certain Financial Instruments with Characteristics of Both Liabilities and Equity ("ASC 480"), as well as related interpretations of this standard.
Derivative Instruments
The Company enters into financing arrangements that consist of freestanding derivative instruments or are hybrid instruments that contain embedded derivative features. The Company accounts for these arrangements in accordance with Accounting Standards Codification topic 815, Accounting for Derivative Instruments and Hedging Activities ("ASC 815") as well as related
F-14
ROSETTA STONE INC.
NOTES TO CONSOLIDATED FINANCIAL STATEMENTS (Continued)
2. SUMMARY OF SIGNIFICANT ACCOUNTING POLICIES (Continued)
interpretation of this standard. In accordance with this standard, derivative instruments are recognized as either assets or liabilities in the balance sheet and are measured at fair values with gains or losses recognized in earnings. Embedded derivatives that are not clearly and closely related to the host contract are bifurcated and are recognized at fair value with changes in fair value recognized as either a gain or loss in earnings. The Company determines the fair value of derivative instruments and hybrid instruments based on available market data using appropriate valuation models, giving consideration to all of the rights and obligations of each instrument.
Stock Split
On March 23, 2009, in connection with the Company's initial public offering of common stock, the Board of Directors approved a 1.3-to-1 split of common stock to stockholders of record as of such date. All references to the number of common shares and per share amounts have been restated as appropriate to reflect the effect of the split for all periods presented.
Guarantees
Indemnifications are provided of varying scope and size to certain institutional customers against claims of intellectual property infringement made by third parties arising from the use of its products. The Company has not incurred any costs or accrued any liabilities as a result of such obligations.
Cost of Revenue
Cost of product revenue consists of the direct and indirect materials and labor costs to produce and distribute our products. Such costs include packaging materials, computer headsets, freight, inventory receiving, personnel costs associated with product assembly, third-party royalty fees and inventory storage, obsolescence and shrinkage. Cost of subscription and service revenue primarily represents costs associated with supporting our online language learning service, which includes hosting costs and depreciation. We also include the cost of credit card processing and customer technical support in both cost of product revenue and cost of subscription and service revenue.
Research and Development
Research and development expenses include employee compensation costs, professional services fees and overhead costs associated with product development. Software products are developed for sale to external customers. The Company considers technological feasibility to be established when all planning, designing, coding, and testing has been completed according to design specifications. The Company has determined that technological feasibility for its software products is reached shortly before the products are released to manufacturing. Costs incurred after technological feasibility is established have not been material, and accordingly, the Company has expensed all research and development costs when incurred.
Software Developed for Internal Use
Product development also includes certain software products for internal use. Development costs for internal use software are expensed as incurred until the project reaches the application development stage, in accordance with Accounting Standards Codification topic 350, Accounting for the Costs of Computer Software Developed or Obtained for Internal Use ("ASC 350"). Internal-use software is defined
F-15
ROSETTA STONE INC.
NOTES TO CONSOLIDATED FINANCIAL STATEMENTS (Continued)
2. SUMMARY OF SIGNIFICANT ACCOUNTING POLICIES (Continued)
to have the following characteristics: (a) the software is internally developed, or modified solely to meet the entity's internal needs, and (b) during the software's development or modification, no substantive plan exists or is being developed to market the software externally. Internally developed software is amortized over a three-year useful life.
For the years ended December 31, 2010, 2009 and 2008, the Company capitalized zero, zero and $0.2 million in internal-use software, respectively.
For the years ended December 31, 2010, 2009 and 2008, the Company recorded amortization expense relating to internal-use software of $0.3 million, $0.5 million and $0.5 million, respectively.
Income Taxes
The Company accounts for income taxes in accordance with Accounting Standards Codification topic 740, Income Taxes ("ASC 740"), which provides for an asset and liability approach to accounting for income taxes. Deferred tax assets and liabilities represent the future tax consequences of the differences between the financial statement carrying amounts of assets and liabilities versus the tax bases of assets and liabilities. Under this method, deferred tax assets are recognized for deductible temporary differences, and operating loss and tax credit carryforwards. Deferred liabilities are recognized for taxable temporary differences. Deferred tax assets are reduced by a valuation allowance when, in the opinion of management, it is more likely than not that some portion or all of the deferred tax assets will not be realized. The impact of tax rate changes on deferred tax assets and liabilities is recognized in the year that the change is enacted.
In 2010, the Company concluded that it is more likely than not that its deferred tax assets will be utilized and thus recognized a tax benefit of $2.4 million due to the release of the valuation allowance. The effective income tax rate has benefited from the availability of previously unrealized deferred tax assets which have been utilized to reduce tax expense for United Kingdom and Japanese income tax purposes. The release of the valuation allowance was determined in accordance with the provisions of ASC 740, which requires an assessment of both positive and negative evidence when determining whether it is more likely than not that deferred tax assets are recoverable; such assessment is required on a jurisdiction by jurisdiction basis. Historical operating income and continuing projected income represent sufficient positive evidence that the Company used to conclude that it is more likely than not that our deferred tax assets will be realized and accordingly, released the valuation allowance in the fourth quarter of 2010.
Stock-Based Compensation
The Company accounts for its stock-based compensation in accordance Accounting Standards Codification topic 718, Compensation—Stock Compensation ("ASC 718"), which was adopted by the Company effective January 1, 2006. Under ASC 718, all stock-based awards, including employee stock option grants, are recorded at fair value as of the grant date and recognized as expense in the statement of operations on a straight-line basis over the requisite service period, which is the vesting period.
F-16
ROSETTA STONE INC.
NOTES TO CONSOLIDATED FINANCIAL STATEMENTS (Continued)
2. SUMMARY OF SIGNIFICANT ACCOUNTING POLICIES (Continued)
Net Income Per Share
Net income per share is computed under the provisions of Accounting Standards Codification topic 260, Earnings Per Share. Basic income per share is computed using net income and the weighted average number of common shares outstanding. Diluted earnings per share reflect the weighted average number of common shares outstanding plus any potentially dilutive shares outstanding during the period. Potentially dilutive shares consist of shares issuable upon the exercise of stock options (using the treasury stock method), restricted stock awards, restricted stock units and conversion of preferred shares (using the as-converted method). Common equivalent shares are excluded from the diluted computation if their effect is anti-dilutive.
The following table sets forth the computation of basic and diluted net income per common share (in thousands, except per share amounts):
| |
Years Ended December 31, | |||||||||||
|---|---|---|---|---|---|---|---|---|---|---|---|---|
| |
2010 | 2009 | 2008 | |||||||||
Numerator: |
||||||||||||
Net income |
$ | 13,284 | $ | 13,363 | $ | 13,892 | ||||||
Denominator: |
||||||||||||
Weighted average number of common shares: |
||||||||||||
Basic |
20,439 | 14,990 | 1,905 | |||||||||
Diluted |
21,187 | 19,930 | 16,924 | |||||||||
Income per common share: |
||||||||||||
Basic |
$ | 0.65 | $ | 0.89 | $ | 7.29 | ||||||
Diluted |
$ | 0.63 | $ | 0.67 | $ | 0.82 | ||||||
The following table sets forth common stock equivalent shares included in the calculation of the Company's diluted net income per share (in thousands):
| |
Years Ended December 31, | ||||||||||
|---|---|---|---|---|---|---|---|---|---|---|---|
| |
2010 | 2009 | 2008 | ||||||||
Equity instruments: |
|||||||||||
Convertible preferred stock |
— | 4,134 | 14,508 | ||||||||
Restricted common stock units |
11 | 7 | — | ||||||||
Restricted common stock |
86 | 93 | — | ||||||||
Stock options |
651 | 706 | 511 | ||||||||
Total common stock equivalent shares |
748 | 4,940 | 15,019 | ||||||||
Share-based awards to purchase approximately 470,000, 15,000 and 135,000 shares of common stock that had an exercise price in excess of the average market price of the common stock during the years ended December 31, 2010, 2009 and 2008, respectively, were not included in the calculation of diluted earnings per share because they were anti-dilutive.
F-17
ROSETTA STONE INC.
NOTES TO CONSOLIDATED FINANCIAL STATEMENTS (Continued)
2. SUMMARY OF SIGNIFICANT ACCOUNTING POLICIES (Continued)
Comprehensive Income (Loss)
Comprehensive income consists of net income and other comprehensive income. Other comprehensive income refers to revenues, expenses, gains, and losses that are not included in net income, but rather are recorded directly in stockholders' equity. For the years ended December 31, 2010, 2009 and 2008, the Company's comprehensive income consisted of net income and foreign currency translation gains (losses).
Foreign Currency Translation and Transactions
The functional currency of the Company's foreign subsidiaries is their local currency. Accordingly, assets and liabilities of the foreign subsidiaries are translated into U.S. dollars at exchange rates in effect on the balance sheet date. Income and expense items are translated at average rates for the period. Translation adjustments are recorded as a component of other comprehensive income in stockholders' equity.
Cash flows of consolidated foreign subsidiaries, whose functional currency is the local currency, are translated to U.S. dollars using average exchange rates for the period. The Company reports the effect of exchange rate changes on cash balances held in foreign currencies as a separate item in the reconciliation of the changes in cash and cash equivalents during the period.
F-18
2. SUMMARY OF SIGNIFICANT ACCOUNTING POLICIES (Continued)
Gains and losses resulting from foreign currency transactions are included in other income and expense. Foreign currency transaction gains (losses) were $(0.2) million, $(44,000) and $0.2 million for the years ended December 31, 2010, 2009 and 2008, respectively.
Recently Issued Accounting Standards
In December 2009, the Financial Accounting Standards Board ("FASB") issued Accounting Standards Update ("ASU") No. 2009-17, "Consolidations (Topic 810)—Improvements to Financial Reporting by Enterprises Involved with Variable Interest Entities." ASU No. 2009-17 changes how a reporting entity determines when an entity that is insufficiently capitalized or is not controlled through voting (or similar rights) should be consolidated. The determination of whether a reporting entity is required to consolidate another entity is based on, among other things, the other entity's purpose and design and the reporting entity's ability to direct the activities of the other entity that most significantly impact the other entity's economic performance. ASU No. 2009-17 requires a reporting entity to provide additional disclosures about its involvement with variable interest entities and any significant changes in risk exposure due to that involvement. A reporting entity is required to disclose how its involvement with a variable interest entity affects the reporting entity's financial statements. ASU No. 2009-17 is effective for fiscal years beginning after November 15, 2009, and interim periods within those fiscal years. The Company adopted ASU No. 2009-17 as of January 1, 2010, and its application had no impact on its consolidated financial statements.
In October 2009, the FASB issued ASU No. 2009-13, "Revenue Recognition (Topic 605)—Multiple-Deliverable Revenue Arrangements." ASU No. 2009-13 addresses the accounting for multiple-deliverable arrangements to enable vendors to account for products or services (deliverables) separately rather than as a combined unit. ASU No. 2009-13 permits prospective or retrospective adoption. The Company elected prospective adoption during the quarter ended March 31, 2010. Under the historical accounting principles, the Company was required to account for online services bundled with auxiliary items, such as headsets and audio companions, using the residual method or by treating the arrangements as one unit of accounting. ASU No. 2009-13 requires the Company to account for the sale of online services bundled with auxiliary items as two deliverables. The first deliverable is the auxiliary items which are delivered at the time of sale, and the second deliverable is the online services. This results in the recognition of a portion of the revenue from the sales of online services bundled with auxiliary items at time of sale. The Company adopted ASU No. 2009-13 as of January 1, 2010, and its application did not have a material impact on its consolidated financial statements.
In October 2009, the FASB issued ASU 2009-14 which amended the accounting requirements under the Software Topic, ASC 985-605 Revenue Recognition. The objective of this update is to address the accounting for revenue arrangements that contain tangible products and software. Specifically, products that contain software that is "more than incidental" to the product as a whole will be removed from the scope of ASC subtopic 985-605 (previously AICPA Statement of Position 97-2). The amendments align the accounting for these revenue transaction types with the amendments under ASU 2009-13 mentioned above. The guidance provided within ASU 2009-14 is effective for fiscal years beginning on or after June 15, 2010 and allows for either prospective or retrospective application, with early adoption permitted. The Company adopted ASU No. 2009-14 as of January 1, 2010, and its application did not have a material impact on its consolidated financial statements.
F-19
3. INVENTORY
Inventory consisted of the following (in thousands):
| |
As of December 31, |
||||||
|---|---|---|---|---|---|---|---|
| |
2010 | 2009 | |||||
Raw materials |
$ | 4,423 | $ | 4,053 | |||
Finished goods |
7,892 | 5,696 | |||||
|
12,315 | 9,749 | |||||
Reserve for obsolete inventory |
(2,387 | ) | (765 | ) | |||
Inventory, net |
$ | 9,928 | $ | 8,984 | |||
4. ACQUISITIONS
On November 1, 2009, the Company acquired certain assets from SGLC International Co. Ltd., a software reseller headquartered in Seoul, South Korea. As the assets acquired constituted a business, this transaction was accounted for under Accounting Standards Codification topic 805, Business Combination ("ASC 805"). The purchase price consisted of an initial cash payment of $100,000, followed by three annual cash installment payments, based on revenue performance in South Korea. The terms of the acquisition agreement provide for additional consideration to be paid by the Company in each of the following three years, if the acquired company's revenues exceed certain targeted levels each of these years. The amount is calculated as the lesser of a percentage of the revenue generated or a fixed amount for each year, based on the terms of the agreement.
Based on these terms, the minimum additional cash payment is zero if none of the minimum revenue targets are met, and the maximum additional payment is $1.1 million. Management determined that the total contingent consideration for inclusion in the purchase price was the maximum of $1.1 million, the fair value of which is $850,000. Including the cash paid upon the acquisition date of $100,000, the total purchase price was $950,000. In 2010, we made an additional payment of $400,000 in accordance with the terms of the purchase.
Under the purchase method of accounting, the total purchase price was allocated to the tangible and intangible assets acquired on the basis of their respective estimated fair values at the date of acquisition. The valuation of the identifiable intangible assets and their useful lives acquired reflects management's estimates.
The summary of fair value of assets acquired in the asset acquisition is as follows (in thousands):
Tangible assets: |
|||||
Inventory |
$ | 135 | |||
Property and equipment |
95 | ||||
Intangible assets: |
|||||
Customer relationships |
100 | ||||
Goodwill |
620 | ||||
Total assets acquired |
$ | 950 | |||
A total of $100,000 was allocated to amortizable intangible assets consisting of customer relationships, and a total of $620,257 was allocated to goodwill. Goodwill represents the excess of the purchase price over the fair value of tangible and amortizable intangible assets acquired. No liabilities were assumed in this acquisition, and proforma requirements were immaterial to the presentation.
F-20
5. PROPERTY AND EQUIPMENT
Property and equipment consisted of the following (in thousands):
| |
As of December 31, | ||||||
|---|---|---|---|---|---|---|---|
| |
2010 | 2009 | |||||
Land |
$ | 390 | $ | 390 | |||
Buildings and improvements |
8,110 | 7,952 | |||||
Leasehold improvements |
1,682 | 1,453 | |||||
Computer equipment |
12,046 | 7,617 | |||||
Software |
13,723 | 11,327 | |||||
Furniture and equipment |
4,158 | 2,589 | |||||
|
40,109 | 31,328 | |||||
Less: accumulated depreciation |
(19,036 | ) | (12,954 | ) | |||
Property and equipment, net |
$ | 21,073 | $ | 18,374 | |||
The Company leases certain computer equipment, software and machinery under capital lease agreements, with bargain purchase options at the end of the lease term. As of December 31, 2010 and 2009, leased computer equipment and software included in property and equipment above was $56,000 and $56,000, respectively.
The Company recorded depreciation expense for the years ended December 31, 2010, 2009 and 2008 in the amount of $6.6 million, $5.4 million and $4.0 million, respectively.
6. GOODWILL
The value of goodwill is primarily derived from the acquisition of Rosetta Stone, Ltd. in January 2006 and the acquisition of certain assets of SGLC International Co. Ltd. in November 2009, as detailed in Note 4. The Company tests goodwill for impairment annually on June 30 of each year at the reporting unit level using a fair value approach, in accordance with the provisions of Accounting Standards Codification topic 350, Intangibles—Goodwill and Other ("ASC 350"). If an event occurs or circumstances change that would more likely than not reduce the fair value of a reporting unit below its carrying value, goodwill will be evaluated for impairment between annual tests. The Company's annual testing resulted in no impairments of goodwill since the dates of acquisition. For income tax purposes, the goodwill balance is amortized over a period of 15 years.
The following table represents the balance and changes in goodwill for the years ended December 31, 2010 and 2009 (in thousands):
Balance as of January 1, 2009 |
$ | 34,199 | |||
SGLC International Co. LTD. acquisition |
620 | ||||
Balance as of December 31, 2009 |
$ | 34,819 | |||
No acquisition activity |
— | ||||
Balance as of December 31, 2010 |
$ | 34,819 | |||
Effect of change in foreign currency rate |
37 | ||||
Balance as of December 31, 2010 |
$ | 34,856 | |||
F-21
7. INTANGIBLE ASSETS
Intangible assets consisted of the following items as of the dates indicated (in thousands):
| |
December 31, 2010 | December 31, 2009 | |||||||||||||||||
|---|---|---|---|---|---|---|---|---|---|---|---|---|---|---|---|---|---|---|---|
| |
Gross Carrying Amount |
Accumulated Amortization |
Net Carrying Amount |
Gross Carrying Amount |
Accumulated Amortization |
Net Carrying Amount |
|||||||||||||
Trade name / trademark |
$ | 10,607 | $ | — | $ | 10,607 | $ | 10,607 | $ | — | $ | 10,607 | |||||||
Core technology |
2,453 | (2,453 | ) | — | 2,453 | (2,453 | ) | — | |||||||||||
Customer relationships |
10,844 | (10,800 | ) | 44 | 10,842 | (10,747 | ) | 95 | |||||||||||
Website |
12 | (12 | ) | — | 12 | (10 | ) | 2 | |||||||||||
Patents |
300 | (3 | ) | 297 | — | — | — | ||||||||||||
Total |
$ | 24,216 | $ | (13,268 | ) | $ | 10,948 | $ | 23,914 | $ | (13,210 | ) | $ | 10,704 | |||||
The Company recorded intangible assets of $23.8 million, associated with the acquisition of Rosetta Stone Ltd. in January 2006, and $0.1 million with the acquisition of certain assets of SGLC International Co. Ltd. in November 2009. During 2010, the Company recorded the purchase of two patents associated with the development of new products in the amount of $0.3 million. The estimated lives of the acquired core technology and customer relationships are between 18 to 36 months. The intangible asset associated with the trade name and trademark has an indefinite useful life. The estimated life of the website rights is 60 months, and estimated useful life of the patents are based on the effective date of the purchase agreement through the expiration date of the patents. The Company computes amortization of intangible assets on a straight-line basis over the estimated useful life. Below are the estimated useful lives of the intangible assets acquired:
| |
Weighted Average Life |
|
|---|---|---|
Trade name / trademark |
Indefinite | |
Core technology |
24 months | |
Customer relationships |
24 months | |
Website |
60 months | |
Patents |
72 - 100 months |
Amortization expense consisted of the following (in thousands):
| |
Years Ended December 31, | ||||||||||||
|---|---|---|---|---|---|---|---|---|---|---|---|---|---|
| |
2010 | 2009 | 2008 | ||||||||||
Included in cost of revenue: |
|||||||||||||
Cost of product revenue |
$ | — | $ | — | $ | 13 | |||||||
Cost of subscription and service revenue |
— | — | — | ||||||||||
Total included in cost of revenue |
— | — | 13 | ||||||||||
Included in operating expenses: |
$ | 58 | $ | 42 | $ | 3,003 | |||||||
Total |
$ | 58 | $ | 42 | $ | 3,016 | |||||||
F-22
7. INTANGIBLE ASSETS (Continued)