Attached files
| file | filename |
|---|---|
| 8-K - FORM 8-K - CenterState Bank Corp | d8k.htm |
 Investor Presentation
Second Quarter 2011
Exhibit 99.1 |
 This presentation contains forward-looking statements, as defined by Federal
Securities
Laws,
relating
to
present
or
future
trends
or
factors
affecting
the
operations, markets and products of CenterState Banks, Inc. (CSFL). These
statements
are
provided
to
assist
in
the
understanding
of
future
financial
performance. Any such statements are based on current expectations and involve a
number of risks and uncertainties. For a discussion of factors that may
cause such forward-looking statements to differ materially from actual
results, please refer to CSFL’s most recent Form 10-Q and Form
10-K filed with the Securities Exchange Commission.
CSFL undertakes no obligation to release revisions to these forward-looking
statements or reflect events or circumstances after the date of this
presentation. Forward Looking Statement
2 |
 Birmingham
Atlanta
Winston-Salem
Tamp
a
Winter Haven
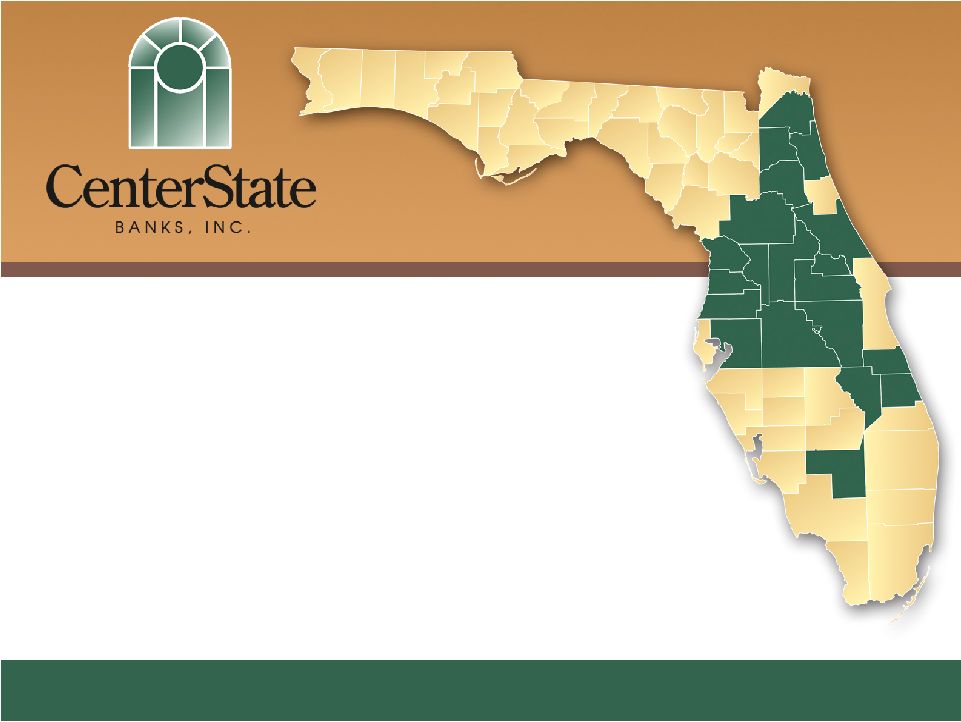
Corporate Overview
3
Correspondent Banking market
Headquartered in Davenport, FL
$2.2 billion in assets
$1.2 billion in loans
$1.8 billion in deposits
Company formed: June 2000
2 Subsidiary Banks
53 locations |
 Conservative Balance Sheet
•
Total Risk-Based Capital Ratio -
18%
•
Loans / Assets -
55%
•
Loans with credit protection –
24%
•
15%
of loans are covered by loss sharing agreements with the FDIC
•
9%
are subject to a 2 year “Put Back”
agreement with TD Bank
•
Assets
backed
by
the
US
Government*
–
40%
•
Low Concentration Levels
•
CRE
at
139%
of
capital
vs.
300%
guidance
•
CD&L
at
34%
of
capital
vs.
100%
guidance
•
Operating leverage that is yet untapped
4
*Includes cash and cash equivalents, AFS securities issued by U.S. Government
Sponsored Entities, FDIC covered assets, and FHLB and FRB stock.
|
 Opportunistic through the Crisis
5
1)
FDIC
Acquisitions
•
Ocala National Bank
•
Olde Cypress Community Bank
•
Independent National Bank of Ocala
•
Community National Bank of Bartow
3)
New
Fee-Based
Business
Lines
•
Correspondent Banking Division
•
Prepaid Card Division
•
Wealth Management Division
2)
Non
–
FDIC
Acquisitions
•
TD Bank divesture in Putnam
•
Federal Trust Acquisition from
The Hartford Insurance
Company
4)
Strategic
Expansion
&
Management
Lift-Outs
•
Vero Beach
•
Okeechobee
•
Jacksonville |
 Reserves / Loans (%)
Credit Cycle Burn Down
Since 12-31-07, 9.3%
of
the loan portfolio balance
has been expensed as a
write down or elevated
reserves.
Credit Quality Trends
NPAs / Loans & OREO (%)
Problem Loan Trends ($MM)
6
Source: SNL Financial
Nonperforming assets include 90 days or more past due.
Florida peers include publicly traded banks and thrifts headquartered in
Florida. Southeastern peers include publicly traded financial institutions
located in AL, AR, FL, GA, MS, NC, SC, TN VA, and WV with total assets between $2 and $5 billion. |
 7
NPA Inflows -
Slowing Down |
 Building Franchise Value
with Core Deposits
Value of core deposits not fully realized in this low rate environment.
Approximately 103,171 total accounts -
$17,117 average balance per account
Core deposits defined as non-time deposits.
22%
18%
25%
15%
20%
Total Deposits ($MM)
Number of Deposit Accounts
8
DDA and NOW
6/30/10
6/30/11
Change
% Change
Balance
$497MM
$707MM
$210MM
42%
No. of Accounts
45,365
66,930
21,565
48%
2006
2007
2008
2009
2010
6/30/11
Jumbo Time
Retail Time
MMDA & Savings
NOW
DDA
0
500
1,000
1,500
2,000
352
260
448
311
396
10,579
13,191
11,001
12,025
14,998
14,802
32,280
40,822
43,974
54,561
78,874
88,369
0
25,000
50,000
75,000
2006
2007
2008
2009
2010
6/30/2011
Time Deposits
Core Deposits
100,000 |
 9
Profitability Metrics
Return on Assets %
(PTPP excluding nonrecurring items and Correspondent Division) Net Interest Margin
% (excluding Correspondent Division)
Operating Expenses as a % of Avg Assets
(excluding credit costs, nonrecurring items, and Corresp Div)
|
 10
Conversions Will Bring Efficiencies
Scheduled for September and December
Five
Completed
since
December |
 11
Talent Acquisition through the Crisis
Name
Position
Age
Years in
Banking
Prior Experience
Dan Bockhorst
Chief Risk Officer
48
28
Fifth
Third,
IRNB
Chief
Credit
Officer
-
$800M
Jennifer Idell
CFO of Bank
36
15
Bank of Florida -
CFO
Darlene Bennett
Director of Operations
55
38
SunTrust -Central FL Operations & Technology
Cindy Robbins
Director of Retail
50
33
Barnett
&
Riverside
-
Director
of
Retail
-
$3B
Debbie Harsh
Director of HR
56
35
First Sterling & Colonial
Dave Kopec
Director of Residential Lending
52
28
First Federal S&L and Highland Homes
Brad Jones
Director of Correspondent Banking
46
20
Silverton
-
$5B
Joe Keating
Director of Wealth Management
59
35
Federal
Res.,
Old
Kent
&
Alabama
National
-
$8B
Presidents
Andy Beindorf
Treasure Coast
55
33
Flagship,
Indian
River
National
Bank
CEO
-
$800M
Gil Pomar
Northeast Florida
50
30
First
Union
&
Jacksonville
Bancorp
CEO
-
$600M
John Williams
Okeechobee Region
56
32
Farm
Credit
&
Riverside
National
Bank
-
President |
 12
Results of Opportunities Since Crisis
**Results include approximate deposits and number of deposit accounts from Federal
Trust acquisition but does not include net income impact of $46M discount on
performing loans. OFFENSE INITIATIVE
Net Income
since
Inception
Total Deposits /
Assets $M
# of Deposit
Accounts
FDIC Acquisitions
$3,041
$327,981
33,862
Non-FDIC Acquisitions **
$7,696
$341,616
17,922
New Business Lines
$15,679
$362,429
714
Strategic Expansion
($1,150)
$69,233
2,812
Totals
$25,266
$1,101,259
55,310 |
 Federal Trust Acquisition
13
Headquarters
Sanford, FL
Year Established
1988
Deposits
$230,000
Loans
$170,000
Self-capitalizing transaction
27% loan discount on selected performing
loans; 0% deposit premium
1 year put back on any past due or
adversely classified loan
Assumption of approximately $5 million of
TruPs at LIBOR + 2.95%
Efficiency achieved as 6 of 11 branches
closed
Dollars in thousands
Selected Deal Terms
Financial Highlights |
 14
Federal Trust Loans
Selected SF 1-4
Balances by Origination Year
(Percent of Outstandings, excluding HELOCs)
Selected Residential Loans by Florida County
Selected Loan Criteria:
Loan
portfolio
mix
-
90%
1-4
Single
Family,
6%
HELOCs,
4%
Commercial
No
problem
loans
-
excludes
all
OREO,
nonaccrual
loans,
adversely
classified
for
regulatory
purposes
and
Troubled Debt Restructures
No
past
due
loans
–
excludes
all
loans
60
days
past
due
anytime
during
the
last
12
months
and
all
loans
30
days past due more than 2 times during last 12 months
|
 15
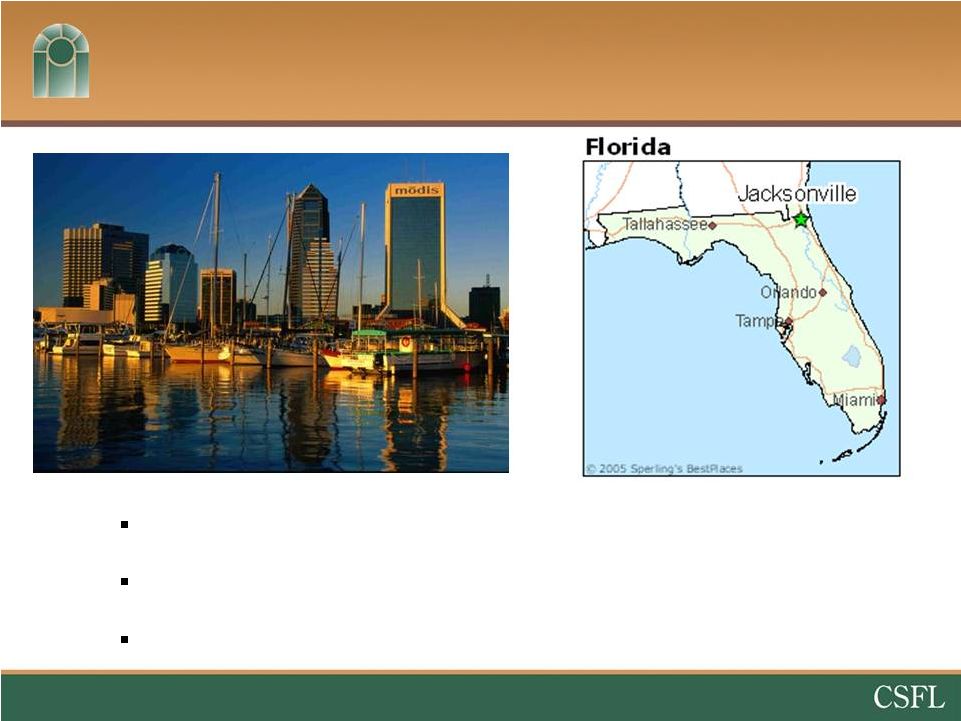
Greater Jacksonville Expansion
Gil Pomar on board as Market President of Northeast Florida
Previously served as President & CEO of The Jacksonville Bank
Worked with CSFL management in the 90’s at First Union
|
 Summary
Energetic & experienced local management team taking
advantage of opportunities
NPA inflow rate declining the last three quarters
On the brink of realizing conversion related efficiencies
& operating leverage
Turmoil offers significant organic growth & FDIC
acquisition opportunities
16 |
 Investor Presentation
Second Quarter 2011 |
 Appendix |
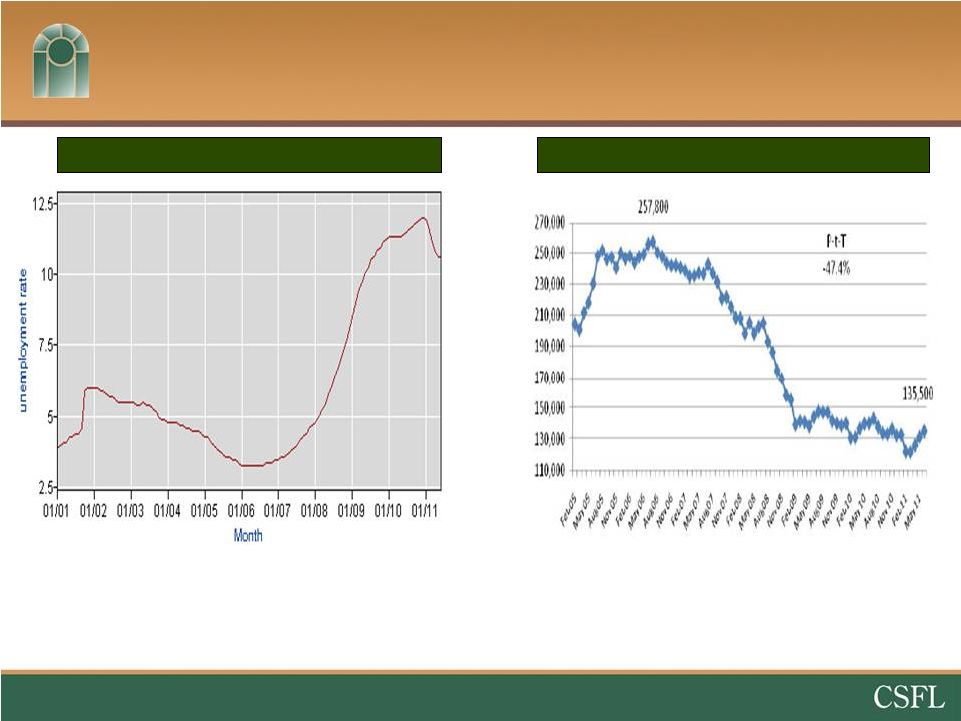 Florida Economy Slowly Recovering
19
Source:
The
Florida
Legislature
Office
of
Economic
and
Demographic
Research
&
US
Bureau
of
Labor Statistics
Unemployment at 10.6%, down from
12% -
eight consecutive months of job
growth after losing jobs for three years
Florida Unemployment Rate
Florida Median Home Price
Median home prices for existing homes
have been essentially flat since
February 2009 (27 Months) with a slight
downward drift |
 Birmingham
Atlanta
Winston-Salem
Tamp
a
Winter Haven
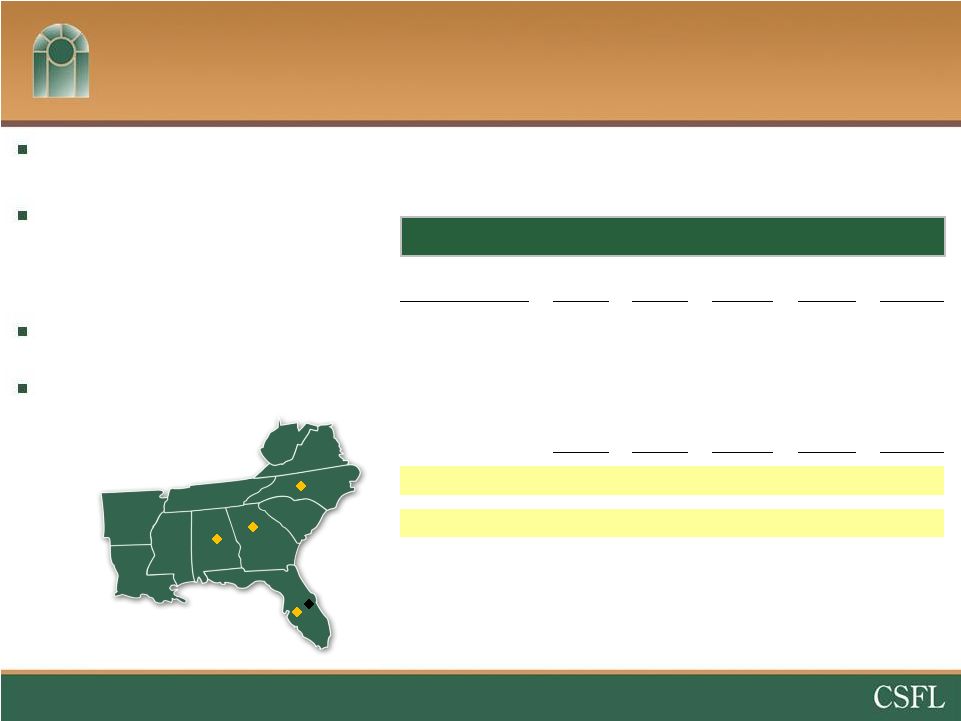
Primary business lines
–
Bond Sales
–
Fed funds
–
Safekeeping, bond accounting, and
asset/liability consulting services
Customer
base
–
557
community
banks
Opportunity
–
Bank Clearing & Cash Management
–
Talent Recruiting / M&A
Correspondent Banking Division
Division Contribution
20
($000s, except per share)
2Q10
3Q10
4Q10
1Q11
2Q11
Net Interest Income
$1,319
$1,148
$974
$662
$1,113
Non-Interest Income
7,758
12,358
7,576
4,984
6,305
Non-Interest Expense
(6,740)
(9,249)
(6,689)
(4,978)
(5,732)
Income Tax Expense
(900)
(1,564)
(700)
(251)
(634)
Net Income Impact
$1,437
$2,693
$1,161
$417
$1,052
EPS Impact
$0.05
$0.09
$0.04
$0.01
$0.04
Management
lift
out
from
RBC
(formerly
ALAB)
and
Capital
Markets
Division
of
Silverton
(73 employees) |
 Loan Portfolio
(excluding FDIC Covered Loans)
21
Loan Type
No. of
Loans
06/30/11
Balance
Avg
Loan
Balance
Residential
Real Estate
2,918
$262MM
$90,000
Commercial
Real Estate
1,405
485MM
345,000
Construction,
A&D, & Land
584
101MM
173,000
Commercial &
Industrial
1,187
113MM
95,000
Consumer
/Other
2,944
53MM
18,000
Total
9,038
$1,014MM
$112,000
Includes $105MM of loans purchased from TD Bank which
are subject to a 2 year “Put Back”
option .
Total Loans by Type
(%)
Total Loans Detail |
 $65,959,000 (6.50% of Gross Loans)
25% of NPLs are current
74% of legal unpaid loan balance
(net of specific reserves and partial charge-offs)
$11,284,000
55% of legal unpaid loan
balance at repossession
date
Residential
Real Estate
$18,951K
(128 loans)
Commercial Real Estate
$29,437K
(76 loans)
Construction,
A&D, & Land
$15,344K
(61 loans)
Commercial
$1,612K
(27 loans)
Consumer / Other
$615K
(39 loans)
22
Commercial
Buildings
(13)
$4,615K
Mobile
Homes w/
Land
(5)
$262K
Vacant Land
(8 parcels of land)
$1,783K
Single Family
Homes (17)
$2,239K
Residential
Lots
(69)
$2,385K
Data as of 6/30/11
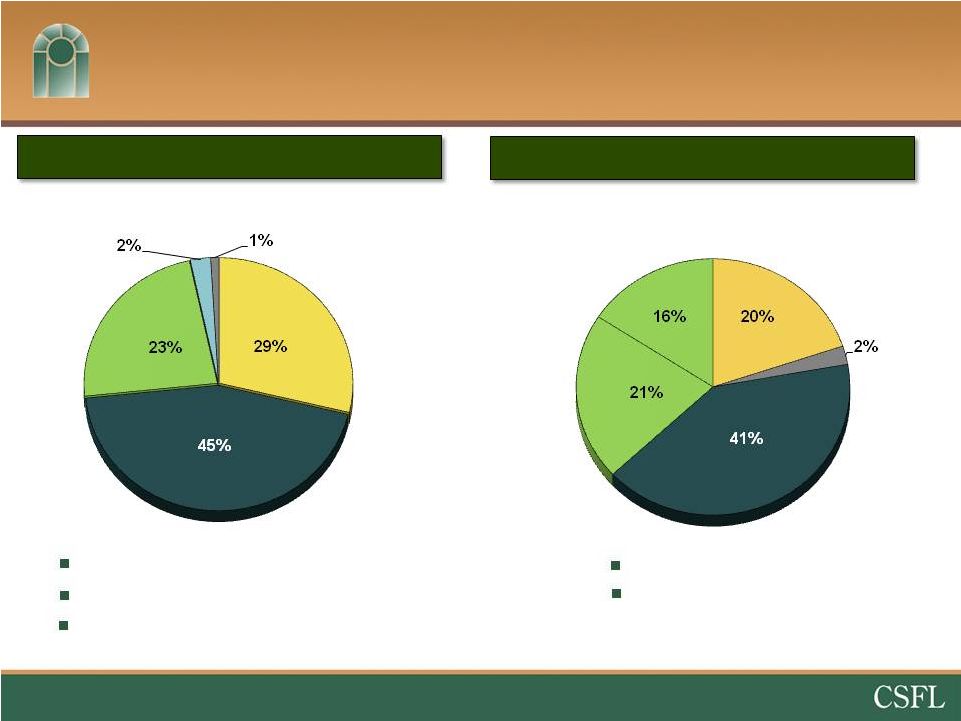
Non Performing Assets
(excluding FDIC Covered Assets)
Other Real Estate Owned
Non-Performing Loans |
 23
Federal Trust Deposits
Total Deposits by Type (%)
Total Deposits Detail
Deposit
Type
No.
of
Accts
12/31/10
Balance
Avg
Balance
WA
Rate
Demand
Deposits
3,289
$11MM
$3,300
0.00%
NOW
778
18MM
23,100
0.42%
Savings
& MMDA
2,307
118MM
51,100
0.98%
Time
Deposits
3,107
87MM
28,000
2.42%
Total
9,481
$234MM
$24,700
1.44%
Data as of 12/31/10 |