Attached files
| file | filename |
|---|---|
| EX-99.1 - EXHIBIT 99.1 - AMERICAN CAMPUS COMMUNITIES INC | a6807700ex99_1.htm |
| 8-K - AMERICAN CAMPUS COMMUNITIES, INC. 8-K - AMERICAN CAMPUS COMMUNITIES INC | a6807700.htm |
Exhibit 99.2
SUPPLEMENTAL ANALYST PACKAGE - 2Q 2011 July 26, 2011
TABLE OF CONTENTS :: Financial Highlights 1 Consolidated Balance Sheets 2 Consolidated Statements of Operations 3 Consolidated Statements of Funds from Operations 4 Wholly-owned Property Results of Operations 5 Seasonality of Operations 6 Capital Structure 7 Portfolio Overview 8 2011/2012 Leasing Status – Summary 9 2011/2012 Leasing Status - By Property 10 Owned Development Update 13 Third-party Development Update 14 Management Services Update 15 Investor Information 16 AMERICAN CAMPUS COMMUNITIES ::
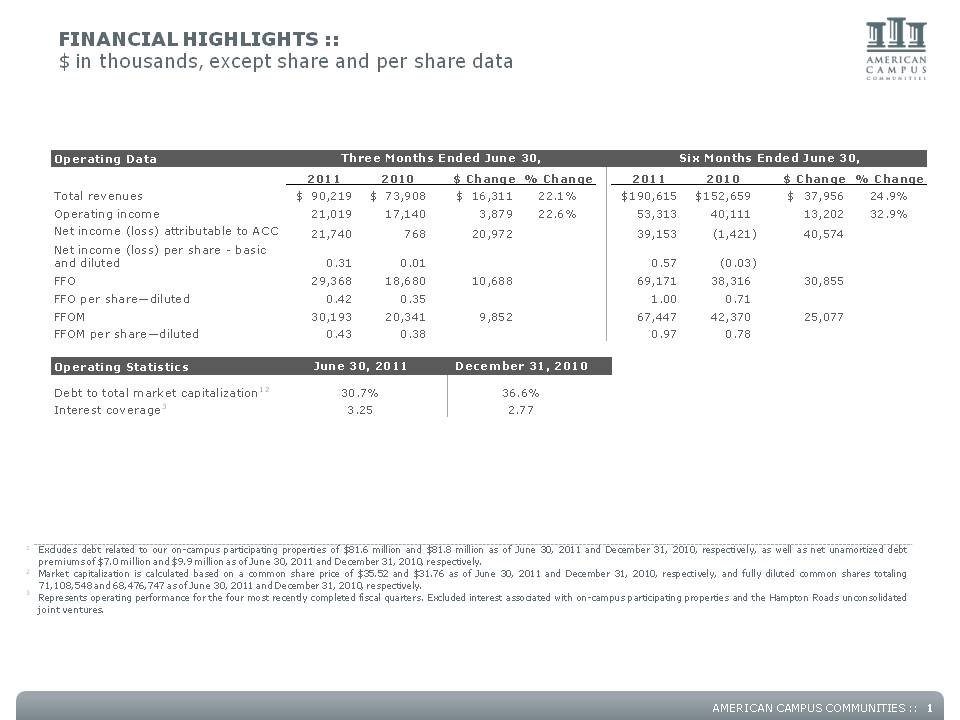
FINANCIAL HIGHLIGHTS :: $ in thousands, except share and per share data Operating Data Three Months Ended June 30, Six Months Ended June 30, 2011 2010 $ Change % Change 2011 2010 $ Change % Change Total revenues $ 90,219 $ 73,908 $ 16,311 $ 22.1% $ 190,615 $ 152,659 $ 37,956 $ 24.9% Operating income 21,019 17,140 3,879 22.6% 53,313 40,111 13,202 32.9% Net income (loss) attributable to ACC 21,740 768 20,972 39,153 (1,421) 40,574 Net income (loss) per share – basic and diluted 0.31 0.01 0.57 (0.03) FFO 29,368 18,680 10,688 69,171 38,316 30,855 FFO per share—diluted 0.42 0.35 1.00 0.71 FFOM 30,193 20,341 9,852 67,447 42,370 25,077 FFOM per share—diluted 0.43 0.38 0.97 0.78 Operating Statistics June 30, 2011 December 31, 2010 Debt to total market capitalization1 2 Interest coverage3 30.7% 36.6% 3.25 2.77 1 Excludes debt related to our on-campus participating properties of $81.6 million and $81.8 million as of June 30, 2011 and December 31, 2010, respectively, as well as net unamortized debt premiums of $7.0 million and $9.9 million as of June 30, 2011 and December 31, 2010, respectively. 2 Market capitalization is calculated based on a common share price of $35.52 and $31.76 as of June 30, 2011 and December 31, 2010, respectively, and fully diluted common shares totaling 71,108,548 and 68,476,747 as of June 30, 2011 and December 31, 2010, respectively. 3 Represents operating performance for the four most recently completed fiscal quarters. Excluded interest associated with on-campus participating properties and the Hampton Roads unconsolidated joint ventures. AMERICAN CAMPUS COMMUNITIES :: 1
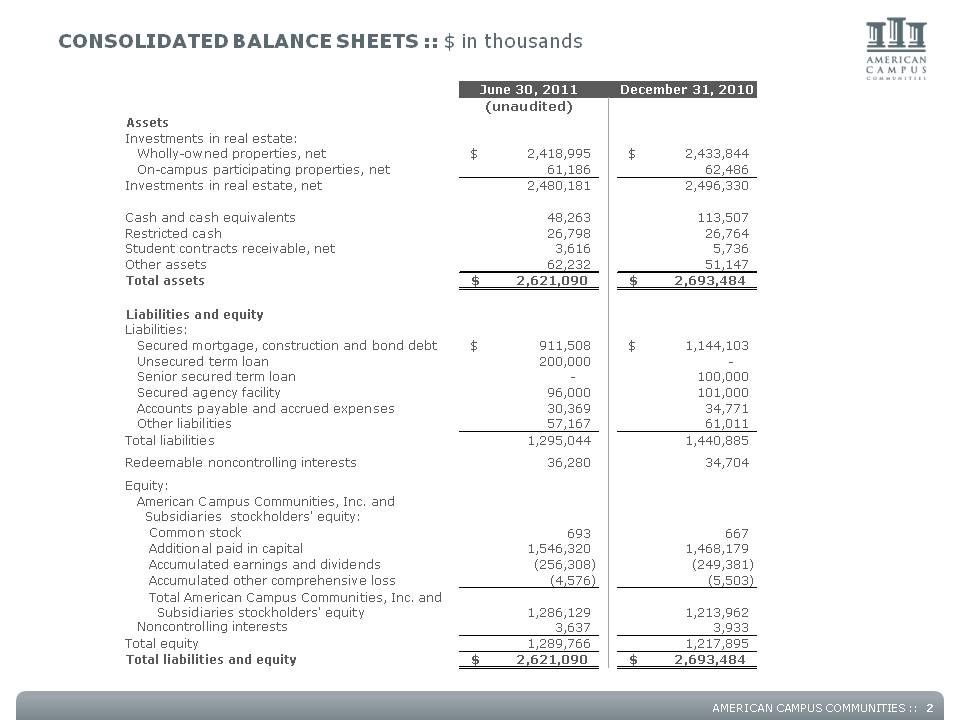
CONSOLIDATED BALANCE SHEETS :: $ in thousands June 30, 2011 December 31, 2010 (unaudited) Assets Investments in real estate: Wholly-owned properties, net $ 2,418,995 $ 2,433,844 On-campus participating properties, net 61,186 62,486 Investments in real estate, net 2,480,181 2,496,330 Cash and cash equivalents 48,263 113,507 Restricted cash 26,798 26,764 Student contracts receivable, net 3,616 5,736 Other assets 62,232 51,147 Total assets $ 2,621,090 $ 2,693,484 Liabilities and equity Liabilities: Secured mortgage, construction and bond debt $ 911,508 $ 1,144,103 Unsecured term loan 200,000 - Senior secured term loan - 100,000 Secured agency facility 96,000 101,000 Accounts payable and accrued expenses 30,369 34,771 Other liabilities 57,167 61,011 Total liabilities 1,295,044 1,440,885 Redeemable noncontrolling interests 36,280 34,704 Equity: American Campus Communities, Inc. and Subsidiaries stockholders' equity: Common stock 693 667 Additional paid in capital 1,546,320 1,468,179 Accumulated earnings and dividends (256,308) (249,381) Accumulated other comprehensive loss (4,576) (5,503) Total American Campus Communities, Inc. and Subsidiaries stockholders equity 1,286,129 1,213,962 Noncontrolling interests 3,637 3,933 Total equity 1,289,766 1,217,895 Total liabilities and equity $ 2,621,090 $ 2,693,484 AMERICAN CAMPUS COMMUNITIES :: 2
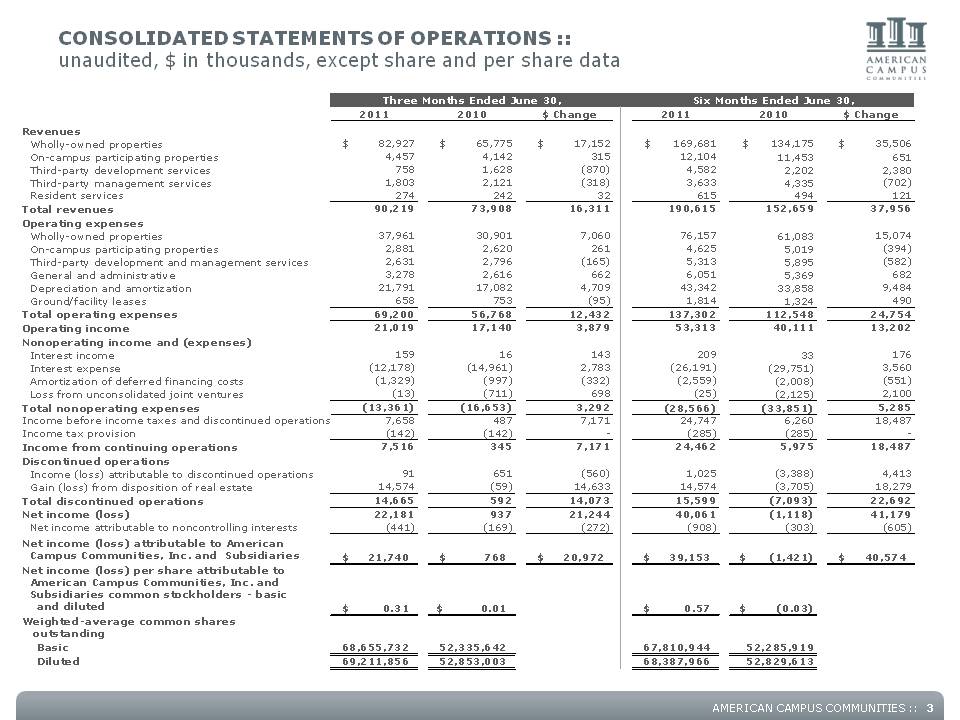
CONSOLIDATED STATEMENTS OF OPERATIONS :: unaudited, $ in thousands, except share and per share data Three Months Ended June 30, Six Months Ended June 30, 2011 2010 $ Change 2011 2010 $ Change Revenues Wholly-owned properties $ 82,927 $ 65,775 $ 17,152 $ 169,681 $ 134,175 $ 35,506 On-campus participating properties 4,457 4,142 315 12,104 11,453 651 Third-party development services 758 1,628 (870) 4,582 2,202 2,380 Third-party management services 1,803 2,121 (318) 3,633 4,335 (702) Resident services 274 242 32 615 494 121 Total revenues 90,219 73,908 16,311 190,615 152,659 37,956 Operating expenses Wholly-owned properties 37,961 30,901 7,060 76,157 61,083 15,074 On-campus participating properties 2,881 2,620 261 4,625 5,019 (394) Third-party development and management services 2,631 2,796 (165) 5,313 5,895 (582) General and administrative 3,278 2,616 662 6,051 5,369 682 Depreciation and amortization 21,791 17,082 4,709 43,342 33,858 9,484 Ground/facility leases 658 753 (95) 1,814 1,324 490 Total operating expenses 69,200 56,768 12,432 137,302 112,548 24,754 Operating income 21,019 17,140 3,879 53,313 40,111 13,202 Nonoperating income and (expenses) Interest income 159 16 143 209 33 176 Interest expense (12,178) (14,961) 2,783 (26,191) (29,751) 3,560 Amortization of deferred financing costs (1,329) (997) (332) (2,559) (2,008) (551) Loss from unconsolidated joint ventures (13) (711) 698 (25) (2,125) 2,100 Total nonoperating expenses (13,361) (16,653) 3,292 (28,566) (33,851) 5,285 Income before income taxes and discontinued operations 7,658 487 7,171 24,747 6,260 18,487 Income tax provision (142) (142) - (285) (285) - Income from continuing operations 7,516 345 7,171 24,462 5,975 18,487 Discontinued operations Income (loss) attributable to discontinued operations 91 651 (560) 1,025 (3,388) 4,413 Gain (loss) from disposition of real estate 14,574 (59) 14,633 14,574 (3,705) 18,279 Total discontinued operations 14,665 592 14,073 15,599 (7,093) 22,692 Net income (loss) 22,181 937 21,244 40,061 (1,118) 41,179 Net income attributable to noncontrolling interests (441) (169) (272) (908) (303) (605) Net income (loss) attributable to American Campus Communities, Inc. and Subsidiaries $ 21,740 $ 768 $ 20,972 $ 39,153 $ (1,421) $ 40,574 Net income (loss) per share attributable to American Campus Communities, Inc. and Subsidiaries common stockholders – basic and diluted $ 0.31 $ 0.01 $ 0.57 $ (0.03) Weighted-average common shares outstanding Basic 68,655,732 52,335,642 67,810,944 52,285,919 Diluted 69,211,856 52,853,003 68,387,966 52,829,613 AMERICAN CAMPUS COMMUNITIES :: 3
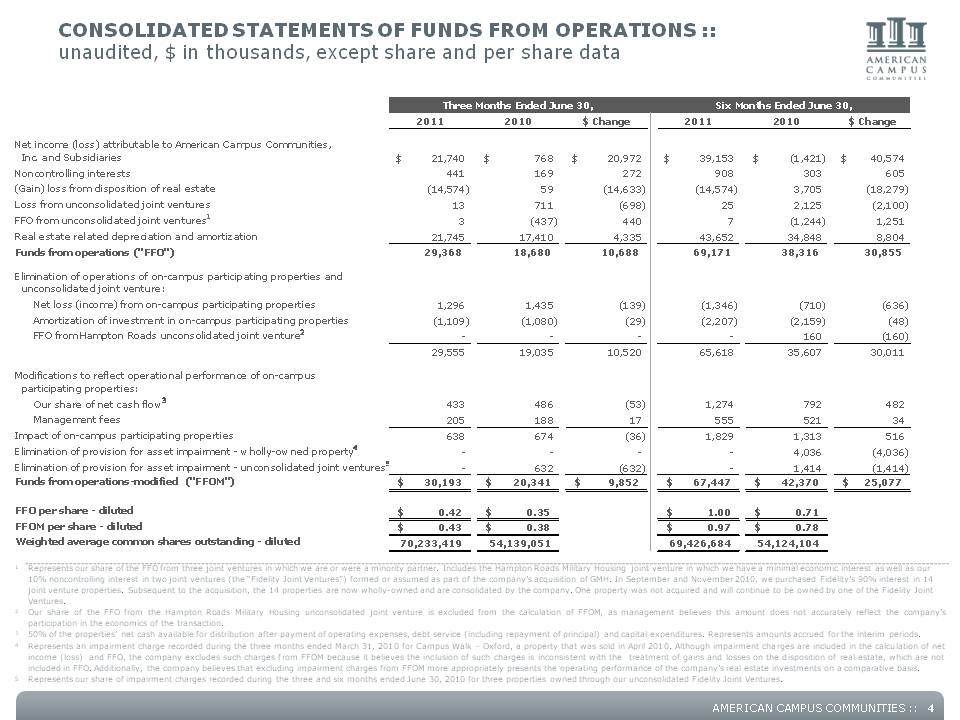
CONSOLIDATED STATEMENTS OF FUNDS FROM OPERATIONS :: unaudited, $ in thousands, except share and per share data Three Months Ended June 30, Six Months Ended June 30, 2011 2010 $ Change 2011 2010 $ Change Net income (loss) attributable to American Campus Communities, Inc. and Subsidiaries $ 21,740 $ 768 $ 20,972 $ 39,153 $ (1,421) $ 40,574 Noncontrolling interests 441 169 272 908 303 605 (Gain) loss from disposition of real estate (14,574) 59 (14,633) (14,574) 3,705 (18,279) Loss from unconsolidated joint ventures 13 711 (698) 25 2,125 (2,100) FFO from unconsolidated joint ventures1 3 (437) 440 7 (1,244) 1,251 Real estate related depreciation and amortization 21,745 17,410 4,335 43,652 34,848 8,804 Funds from operations ("FFO") 29,368 18,680 10,688 69,171 38,316 30,855 Elimination of operations of on-campus participating properties and unconsolidated joint venture: Net loss ( income) from on-campus participating properties 1,296 1,435 (139) (1,346) (710) (636) Amortization of investment in on-campus participating properties (1,109) (1,080) (29) (2,207) (2,159) (48) FFO from Hampton Roads unconsolidated joint venture2 - - - - 160 (160) 29,555 19,035 10,520 65,618 35,607 30,011 Modifications to reflect operational performance of on-campus participating properties: Our share of net cash flow3 433 486 (53) 1,274 792 482 Management fees 205 188 17 555 521 34 Impact of on-campus participating properties 638 674 (36) 1,829 1,313 516 Elimination of provision for asset impairment - wholly-owned property4 - - - - 4,036 (4,036) Elimination of provision for asset impairment - unconsolidated joint ventures5 - 632 (632) - 1,414 (1,414) Funds from operations-modified ("FFOM") $ 30,193 $ 20,341 $ 9,852 $ 67,447 $ 42,370 $ 25,077 FFO per share - diluted $ 0.42 $ 0.35 $ 1.00 $ 0.71 FFOM per share - diluted $ 0.43 $ 0.38 $ 0.97 $ 0.78 Weighted average common shares outstanding - diluted 70,233,419 54,139,051 69,426,684 54,124,104 1 Represents our share of the FFO from three joint ventures in which we are or were a minority partner. Includes the Hampton Roads Military Housing joint venture in which we have a minimal economic interest as well as our 10% noncontrolling interest in two joint ventures (the “Fidelity Joint Ventures”) formed or assumed as part of the company’s acquisition of GMH. In September and November 2010, we purchased Fidelity’s 90% interest in 14 joint venture properties. Subsequent to the acquisition, the 14 properties are now wholly-owned and are consolidated by the company. One property was not acquired and will continue to be owned by one of the Fidelity Joint Ventures. 2 Our share of the FFO from the Hampton Roads Military Housing unconsolidated joint venture is excluded from the calculation of FFOM, as management believes this amount does not accurately reflect the company’s participation in the economics of the transaction. 3 50% of the properties’ net cash available for distribution after payment of operating expenses, debt service (including repayment of principal) and capital expenditures. Represents amounts accrued for the interim periods. 4 Represents an impairment charge recorded during the three months ended March 31, 2010 for Campus Walk – Oxford, a property that was sold in April 2010. Although impairment charges are included in the calculation of net income (loss) and FFO, the company excludes such charges from FFOM because it believes the inclusion of such charges is inconsistent with the treatment of gains and losses on the disposition of real estate, which are not included in FFO. Additionally, the company believes that excluding impairment charges from FFOM more appropriately presents the operating performance of the company’s real estate investments on a comparative basis. 5 Represents our share of impairment charges recorded during the three and six months ended June 30, 2010 for three properties owned through our unconsolidated Fidelity Joint Ventures. AMERICAN CAMPUS COMMUNITIES :: 4
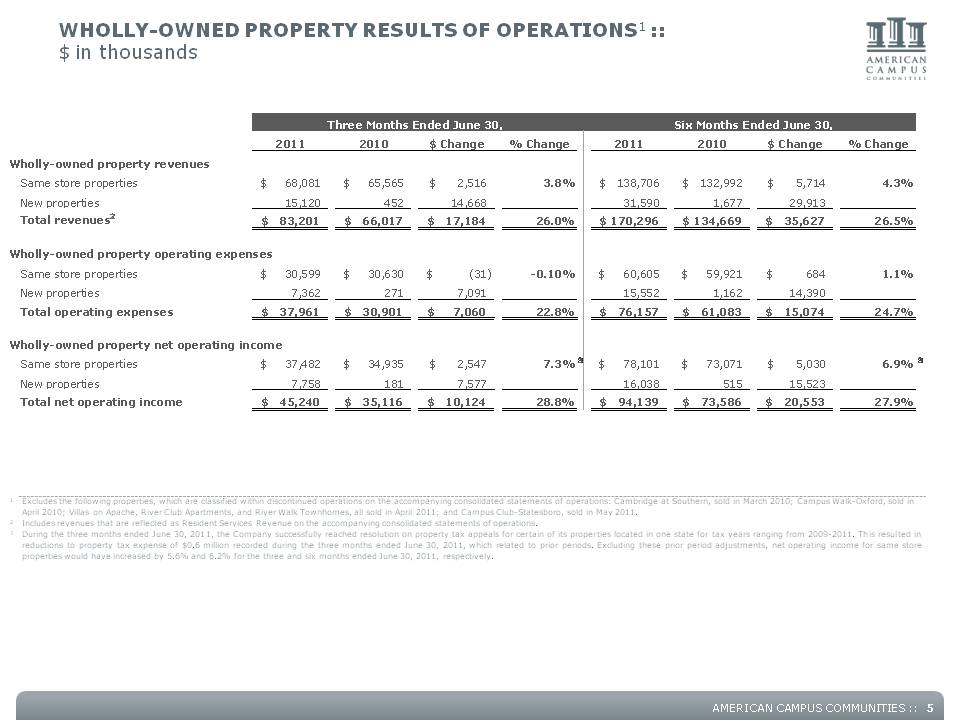
WHOLLY-OWNED PROPERTY RESULTS OF OPERATIONS1 :: $ in thousands Three Months Ended June 30, Six Months Ended June 30, 2011 2010 $ Change % Change 2011 2010 $ Change % Change Wholly-owned property revenues Same store properties $ 68,081 $ 65,565 $ 2,516 3.8% 138,706 $ 132,992 $ 5,714 $ 4.3% New properties 15,120 452 14,668 31,590 1,677 29,913 Total revenues2 $ 83,201 $ 66,017 $ 17,184 $ 26.0% 170,296 $ 134,669 $ 35,627 $ 26.5% Wholly-owned property operating expenses Same store properties $ 30,599 $ 30,630 $ (31) -0.10% 60,605 $ 59,921 $ 684 $ 1.1% New properties 7,362 271 7,091 15,552 1,162 14,390 Total operating expenses $ 37,961 $ 30,901 $ 7,060 22.8% $ 76,157 $ 61,083 $ 15,074 24.7% Wholly-owned property net operating income Same store properties $ 37,482 $ 34,935 $ 2,547 7.3% 3 78,101 $ 73,071 $ 5,030 $ 6.9% 3 New properties 7,758 181 7,577 16,038 515 15,523 Total net operating income $ 45,240 $ 35,116 $ 10,124 28.8% 94,139 $ 73,586 $ 20,553 $ 27.9% 1 Excludes the following properties, which are classified within discontinued operations on the accompanying consolidated statements of operations: Cambridge at Southern, sold in March 2010; Campus Walk-Oxford, sold in April 2010; Villas on Apache River Club Apartments and Walk Townhomes and Club-Statesboro sold in May 2011 Apache, Apartments, River Townhomes, all sold in April 2011; Campus Club Statesboro, 2011. 2 Includes revenues that are reflected as Resident Services Revenue on the accompanying consolidated statements of operations. 3 During the three months ended June 30, 2011, the Company successfully reached resolution on property tax appeals for certain of its properties located in one state for tax years ranging from 2009-2011. This resulted in reductions to property tax expense of $0.6 million recorded during the three months ended June 30, 2011, which related to prior periods. Excluding these prior period adjustments, net operating income for same store properties would have increased by 5.6% and 6.2% for the three and six months ended June 30, 2011, respectively. AMERICAN CAMPUS COMMUNITIES :: 5
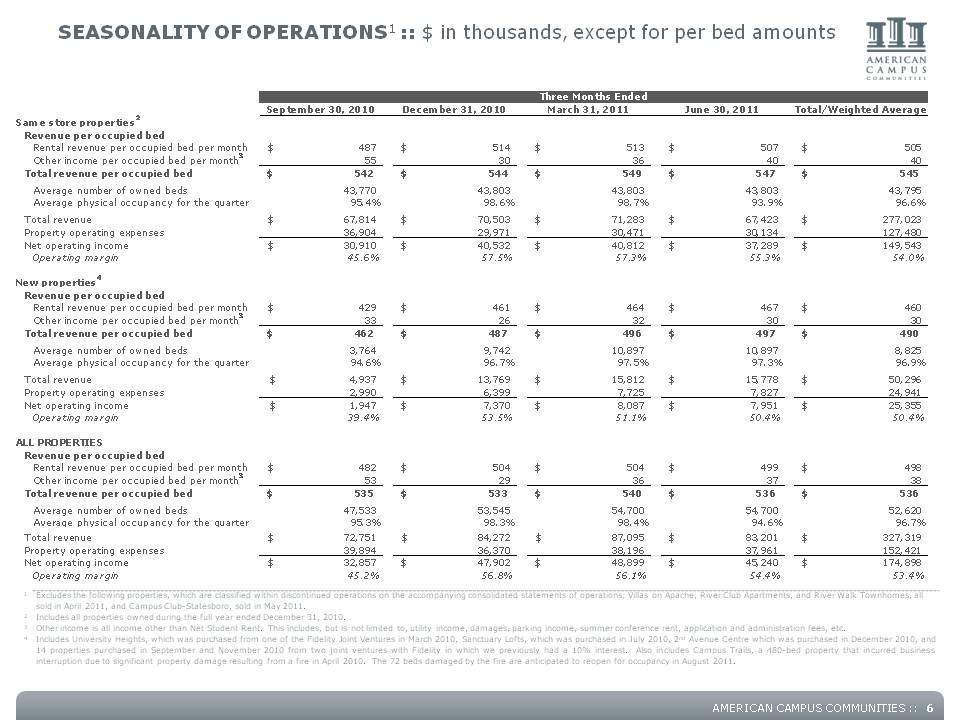
SEASONALITY OF OPERATIONS1 :: $ in thousands, except for per bed amounts Three Months Ended September 30, 2010 December 31, 2010 March 31, 2011 June 30, 2011 Total/Weighted Average Same store properties2 Revenue per occupied bed Rental revenue per occupied bed per month $ 487 $ 514 $ 513 $ 507 $ 505 Other income per occupied bed per month3 55 30 36 40 40 Total revenue per occupied bed $ 542 $ 544 $ 549 $ 547 $ 545 Average number of owned beds 43,770 43,803 43,803 43,803 43,795 Average physical occupancy for the quarter 95.4% 98.6% 98.7% 93.9% 96.6% Total revenue $ 67,814 $ 70,503 $ 71,283 $ 67,423 $ 277,023 Property operating expenses 36,904 29,971 30,471 30,134 127,480 Net operating income $ 30,910 $ 40,532 $ 40,812 $ 37,289 $ 149,543 Operating margin 45.6% 57.5% 57.3% 55.3% 54.0% New properties4 Revenue per occupied bed Rental revenue per occupied bed per month $ 429 $ 461 $ 464 $ 467 $ 460 Other income per occupied bed per month3 33 26 32 30 30 Total revenue per occupied bed $ 462 $ 487 $ 496 $ 497 $ 490 Average number of owned beds 3,764 9,742 10,897 10,897 8,825 Average physical occupancy for the quarter 94.6% 96.7% 97.5% 97.3% 96.9% Total revenue $ 4,937 $ 13,769 $ 15,812 $ 15,778 $ 50,296 Property operating expenses 2,990 6,399 7,725 7,827 24,941 Net operating income $ 1,947 $ 7,370 $ 8,087 $ 7,951 $ 25,355 Operating margin 39.4% 53.5% 51.1% 50.4% 50.4% ALL PROPERTIES Revenue per occupied bed Rental revenue per occupied bed per month $ 482 $ 504 $ 504 $ 499 $ 498 Other income per occupied bed per month3 53 29 36 37 38 Total revenue per occupied bed $ 535 $ 533 $ 540 $ 536 $ 536 Average number of owned beds 47,533 53,545 54,700 54,700 52,620 Average physical occupancy for the quarter 95.3% 98.3% 98.4% 94.6% 96.7% Total revenue $ 72,751 $ 84,272 $ 87,095 $ 83,201 $ 327,319 Property operating expenses 39,894 36,370 38,196 37,961 152,421 Net operating income $ 32,857 $ 47,902 $ 48,899 $ 45,240 $ 174,898 Operating margin 45.2% 56.8% 56.1% 54.4% 53.4% 1 Excludes the following properties, which are classified within discontinued operations on the accompanying consolidated statements of operations: Villas on Apache, River Club Apartments, and River Walk Townhomes, all sold in April 2011, and Campus Club-Statesboro, sold in May 2011. 2 Includes all properties owned during the full year ended December 31, 2010. 3 Other income is all income other than Net Student Rent. This includes, but is not limited to, utility income, damages, parking income, summer conference rent, application and administration fees, etc. 4 Includes University Heights, which was purchased from one of the Fidelity Joint Ventures in March 2010, Sanctuary Lofts, which was purchased in July 2010, 2nd Avenue Centre which was purchased in December 2010, and 14 properties purchased in September and November 2010 from two joint ventures with Fidelity in which we previously had a 10% interest. Also includes Campus Trails, a 480-bed property that incurred business interruption due to significant property damage resulting from a fire in April 2010. The 72 beds damaged by the fire are anticipated to reopen for occupancy in August 2011. AMERICAN CAMPUS COMMUNITIES :: 6
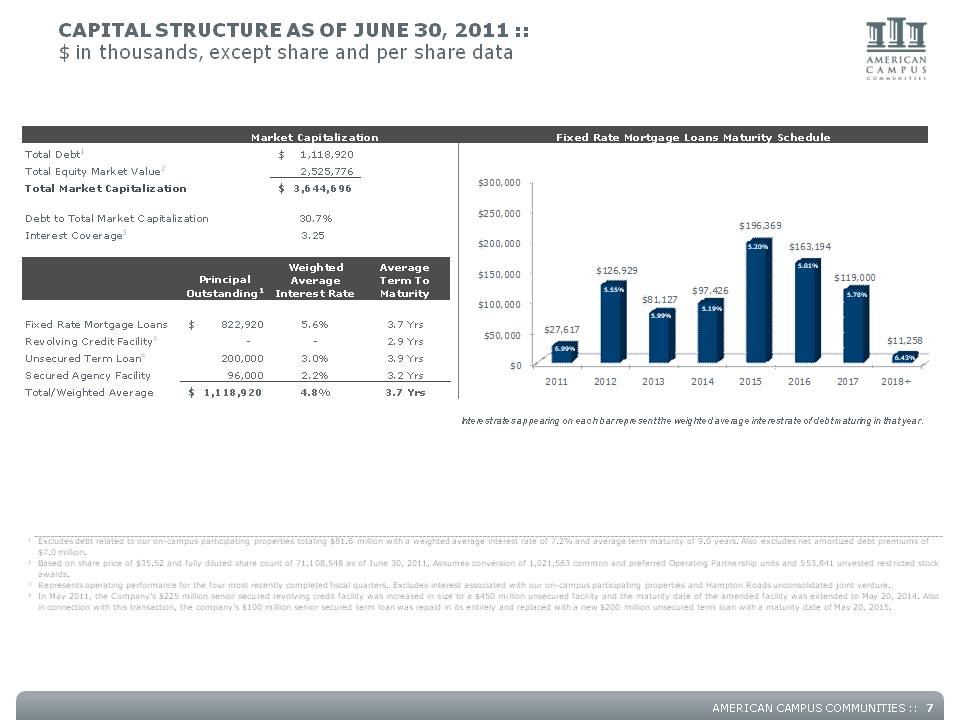
CAPITAL STRUCTURE AS OF JUNE 30, 2011 :: $ in thousands, except share and per share data Market Capitalization Fixed Rate Mortgage Loans Maturity Schedule Total Debt1 $ 1,118,920 Total Equity Market Value2 2,525,776 Total Market Capitalization $ 3,644,696 Debt to Total Market Capitalization 30.7% Interest Coverage3 3.25 Principal Outstanding1 Weighted Average Interest Rate Average Term To Maturity $300,000 $250,000 $200,000 $150,000 $100,000 $50,000 $0 $27,617 $126,929 $81,127 $97,426 $196,369 $163,194 $119,000 $11,258 2011 2012 2013 2014 2015 2016 2017 2018+ 6.99% 5.55% 5.99% 5.19% 5.20% 5.81% 5.78% 6.43% Fixed Rate Mortgage Loans $ 822,920 $ 5.6% 3.7 Yrs Revolving Credit Facility4 - - 2.9 Yrs Unsecured Term Loan4 200,000 3.0% 3.9 Yrs Secured Agency Facility 96,000 2.2% 3.2 Yrs Total/Weighted Average $ 1,118,920 4.8% 3.7 Yrs Interest rates appearing on each bar represent the weighted average interest rate of debt maturing in that year. 1 Excludes debt related to our on-campus participating properties totaling $81.6 million with a weighted average interest rate of 7.2% and average term maturity of 9.0 years. Also excludes net amortized debt premiums of $7.0 million. 2 Based on share price of $35.52 and fully diluted share count of 71,108,548 as of June 30, 2011. Assumes conversion of 1,021,563 common and preferred Operating Partnership units and 553,841 unvested restricted stock awards. 3 Represents operating performance for the four most recently completed fiscal quarters. Excludes interest associated with our on-campus participating properties and Hampton Roads unconsolidated joint venture. 4 In May 2011, the Company’s $225 million senior secured revolving credit facility was increased in size to a $450 million unsecured facility and the maturity date of the amended facility was extended to May 20, 2014. Also in connection with this transaction, the company’s $100 million senior secured term loan was repaid in its entirely and replaced with a new $200 million unsecured term loan with a maturity date of May 20, 2015. AMERICAN CAMPUS COMMUNITIES :: 7
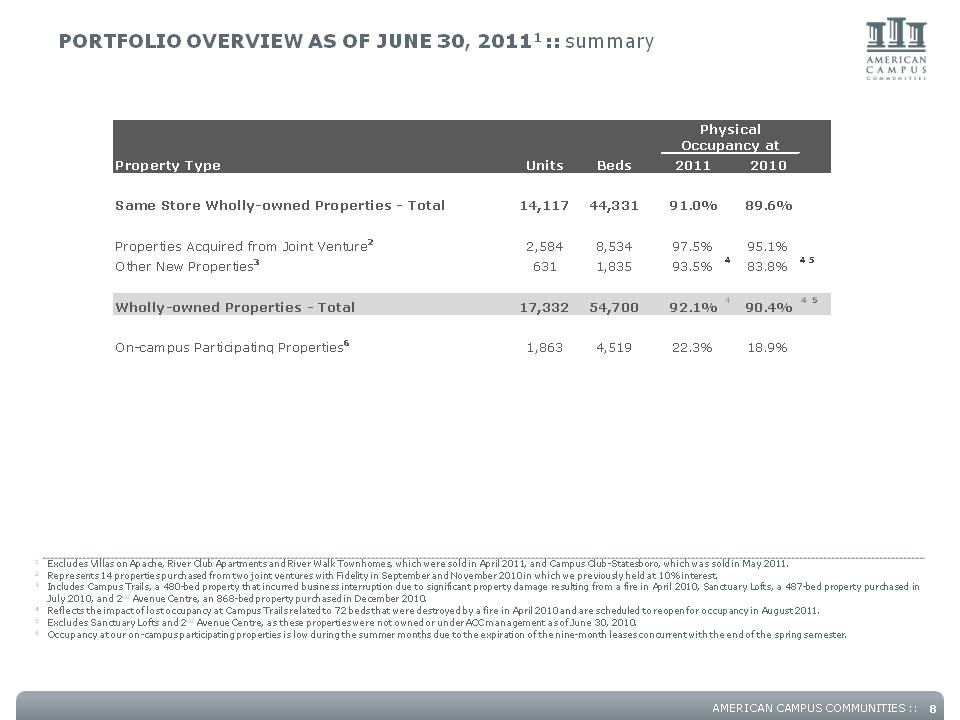
PORTFOLIO OVERVIEW AS OF JUNE 30, 20111 :: summary Property Type Units Beds 2011 2010 Physical Occupancy at Same Store Wholly-owned Properties - Total 14,117 44,331 91.0% 89.6% Properties Acquired from Joint Venture2 2,584 8,534 97.5% 95.1% Other New Properties3 631 1,835 93.5% 4 83.8% 4 5 Wholly-owned Properties – Total 17,332 54,700 92.1% 4 90.4% 4 5 On-campus Participating Properties6 1,863 4,519 22.3% 18.9% 1 Excludes Villas on Apache, River Club Apartments and River Walk Townhomes, which were sold in April 2011, and Campus Club-Statesboro, which was sold in May 2011. 2 Represents 14 properties purchased from two joint ventures with Fidelity in September and November 2010 in which we previously held at 10% interest. 3 Includes Campus Trails, a 480-bed property that incurred business interruption due to significant property damage resulting from a fire in April 2010, Sanctuary Lofts, a 487-bed property purchased in July 2010, and 2nd Avenue Centre, an 868-bed property purchased in December 2010. 4 Reflects the impact of lost occupancy at Campus Trails related to 72 beds that were destroyed by a fire in April 2010 and are scheduled to reopen for occupancy in August 2011. 5 Excludes Sanctuary Lofts and 2nd Avenue Centre, as these properties were not owned or under ACC management as of June 30, 2010. 6 Occupancy at our on-campus participating properties is low during the summer months due to the expiration of the nine-month leases concurrent with the end of the spring semester. AMERICAN CAMPUS COMMUNITIES :: 8
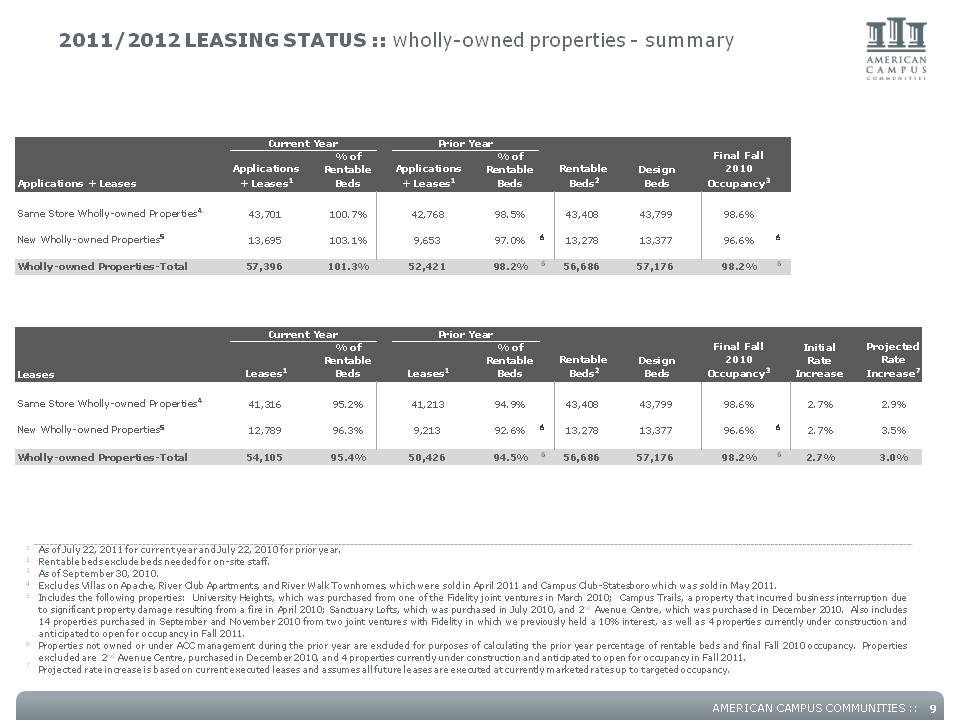
2011/2012 LEASING STATUS :: wholly-owned properties - summary Current Year Prior Year Applications + Leases Applications + Leases1 % of Rentable Beds Applications + Leases1 % of Rentable Beds Rentable Beds2 Design Beds Final Fall 2010 Occupancy3 Same Store Wholly-owned Properties4 43,701 100.7% 42,768 98.5% 43,408 43,799 98.6% New Wholly-owned Properties5 13,695 103.1% 9,653 97.0% 6 13,278 13,377 96.6% 6 Wholly-owned Properties-Total 57,396 101.3% 52,421 98.2% 6 56,686 57,176 98.2% 6 Current Year Prior Year Leases Leases1 % of Rentable Beds Leases1 % of Rentable Beds Rentable Beds2 Design Beds Final Fall 2010 Occupancy3 Initial Rate Increase Projected Rate Increase7 Same Store Wholly-owned Properties4 41,316 95.2% 41,213 94.9% 43,408 43,799 98.6% 2.7% 2.9% New Wholly-owned Properties5 12,789 96.3% 9,213 92.6% 6 13,278 13,377 96.6% 6 2.7% 3.5% Wholly-owned Properties-Total 54,105 95.4% 50,426 94.5% 6 56,686 57,176 98.2% 6 2.7% 3.0% 1 As of July 22, 2011 for current year and July 22, 2010 for prior year. 2 Rentable beds exclude beds needed for on-site staff. 3 As of September 30, 2010. 4 Excludes Villas on Apache, River Club Apartments, and River Walk Townhomes, which were sold in April 2011 and Campus Club-Statesboro which was sold in May 2011. 5 Includes the following properties: University Heights, which was purchased from one of the Fidelity joint ventures in March 2010; Campus Trails, a property that incurred business interruption due to significant property damage resulting from a fire in April 2010; Sanctuary Lofts, which was purchased in July 2010, and 2nd Avenue Centre, which was purchased in December 2010. Also includes 14 properties purchased in September and November 2010 from two joint ventures with Fidelity in which we previously held a 10% interest, as well as 4 properties currently under construction and anticipated to open for occupancy in Fall 2011. 6 Properties not owned or under ACC management during the prior year are excluded for purposes of calculating the prior year percentage of rentable beds and final Fall 2010 occupancy. Properties excluded are 2nd Avenue Centre, purchased in December 2010, and 4 properties currently under construction and anticipated to open for occupancy in Fall 2011. 7 Projected rate increase is based on current executed leases and assumes all future leases are executed at currently marketed rates up to targeted occupancy. AMERICAN CAMPUS COMMUNITIES :: 9
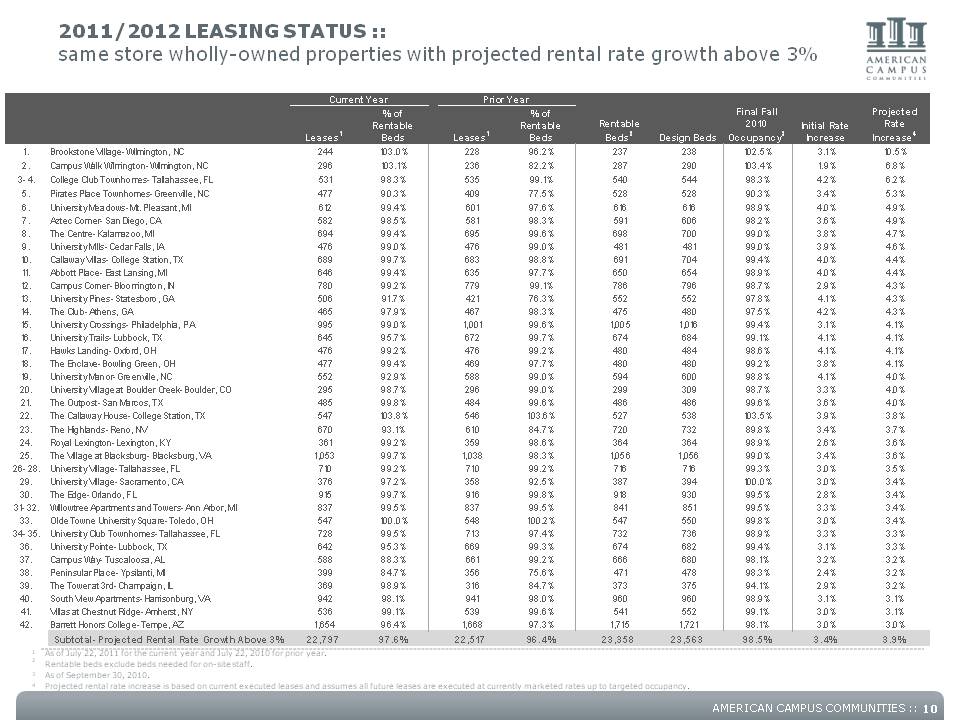
2011/2012 LEASING STATUS :: same store wholly-owned properties with projected rental rate growth above 3% Current Year Prior Year Leases1 % of Rentable Beds Leases1 % of Rentable Beds Rentable Beds2 Design Beds Final Fall 2010 Occupancy3 Initial Rate Increase Projected Rate Increase 4 1. Brookstone Village-Wilmington, NC 244 103.0% 228 96.2% 237 238 102.5% 3.1% 10.5% 2. Campus Walk Wilmington-Wilmington, NC 296 103.1% 236 82.2% 287 290 103.4% 1.9% 6.8% 3- 4. College Club Townhomes-Tallahassee, FL 531 98.3% 535 99.1% 540 544 98.3% 4.2% 6.2% 5. Pirates Place Townhomes-Greenville, NC 477 90.3% 409 77.5% 528 528 90.3% 3.4% 5.3% 6 University Meadows- Mt. Pleasant, MI 612 99.4% 601 97.6% 616 616 98.9% 4.0% 4.9% 7. Aztec Corner-San Diego, CA 582 98.5% 581 98.3% 591 606 98.2% 3.6% 4.9% 8. The Centre-Kalamazoo, MI 694 99.4% 695 99.6% 698 700 99.0% 3.8% 4.7% 9. University Mills-Cedar Falls, IA 476 99.0% 476 99.0% 481 481 99.0% 3.9% 4.6% 10. Callaway Villas- College Station, TX 689 99.7% 683 98.8% 691 704 99.4% 4.0% 4.4% 11. Abbott Place-East Lansing, MI 646 99.4% 635 97.7% 650 654 98.9% 4.0% 4.4% 12. Campus Corner-Bloomington, IN 780 99.2% 779 99.1% 786 796 98.7% 2.9% 4.3% 13. University Pines-Statesboro, GA 506 91.7% 421 76.3% 552 552 97.8% 4.1% 4.3% 14. The Club- Athens, GA 465 97.9% 467 98.3% 475 480 97.5% 4.2% 4.3% 15. University Crossings-Philadelphia, PA 995 99.0% 1,001 99.6% 1,005 1,016 99.4% 3.1% 4.1% 16. University Trails- Lubbock, TX 645 95.7% 672 99.7% 674 684 99.1% 4.1% 4.1% 17. Hawks Landing-Oxford, OH 476 99.2% 476 99.2% 480 484 98.6% 4.1% 4.1% 18. The Enclave-Bowling Green, OH 477 99.4% 469 97.7% 480 480 99.2% 3.8% 4.1% 19. University Manor-Greenville, NC 552 92.9% 588 99.0% 594 600 98.8% 4.1% 4.0% 20. University Village at Boulder Creek- Boulder, CO 295 98.7% 296 99.0% 299 309 98.7% 3.3% 4.0% 21. The Outpost-San Marcos, TX 485 99.8% 484 99.6% 486 486 99.6% 3.6% 4.0% 22. The Callaway House-College Station, TX 547 103.8% 546 103.6% 527 538 103.5% 3.9% 3.8% 23. The Highlands-Reno, NV 670 93.1% 610 84.7% 720 732 89.8% 3.4% 3.7% 24. Royal Lexington- Lexington, KY 361 99.2% 359 98.6% 364 364 98.9% 2.6% 3.6% 25. The Village at Blacksburg-Blacksburg, VA 1,053 99.7% 1,038 98.3% 1,056 1,056 99.0% 3.4% 3.6% 26- 28. University Village- Tallahassee, FL 710 99.2% 710 99.2% 716 716 99.3% 3.0% 3.5% 29. University Village- Sacramento, CA 376 97.2% 358 92.5% 387 394 100.0% 3.0% 3.4% 30. The Edge-Orlando, FL 915 99.7% 916 99.8% 918 930 99.5% 2.8% 3.4% 31- 32. Willowtree Apartments and Towers-Ann Arbor, MI 837 99.5% 837 99.5% 841 851 99.5% 3.3% 3.4% 33. Olde Towne University Square- Toledo, OH 547 100.0% 548 100.2% 547 550 99.8% 3.0% 3.4% 34- 35. University Club Townhomes- Tallahassee, FL 728 99.5% 713 97.4% 732 736 98.9% 3.3% 3.3% 36. University Pointe- Lubbock, TX 642 95.3% 669 99.3% 674 682 99.4% 3.1% 3.3% 37. Campus Way-Tuscaloosa, AL 588 88.3% 661 99.2% 666 680 98.1% 3.2% 3.2% 38. Peninsular Place-Ypsilanti, MI 399 84.7% 356 75.6% 471 478 98.3% 2.4% 3.2% 39. The Tower at 3rd-Champaign, IL 369 98.9% 316 84.7% 373 375 94.1% 2.9% 3.2% 40. South View Apartments-Harrisonburg, VA 942 98.1% 941 98.0% 960 960 98.9% 3.1% 3.1% 41. Villas at Chestnut Ridge-Amherst, NY 536 99.1% 539 99.6% 541 552 99.1% 3.0% 3.1% 42. Barrett Honors College- Tempe, AZ 1,654 96.4% 1,668 97.3% 1,715 1,721 98.1% 3.0% 3.0% Subtotal- Projected Rental Rate Growth Above 3% 22,797 97.6% 22,517 96.4% 23,358 23,563 98.5% 3.4% 3.9% 1 As of July 22, 2011 for the current year and July 22, 2010 for prior year. 2 Rentable beds exclude beds needed for on-site staff. 3 As of September 30, 2010. 4 Projected rental rate increase is based on current executed leases and assumes all future leases are executed at currently marketed rates up to targeted occupancy. AMERICAN CAMPUS COMMUNITIES :: 10
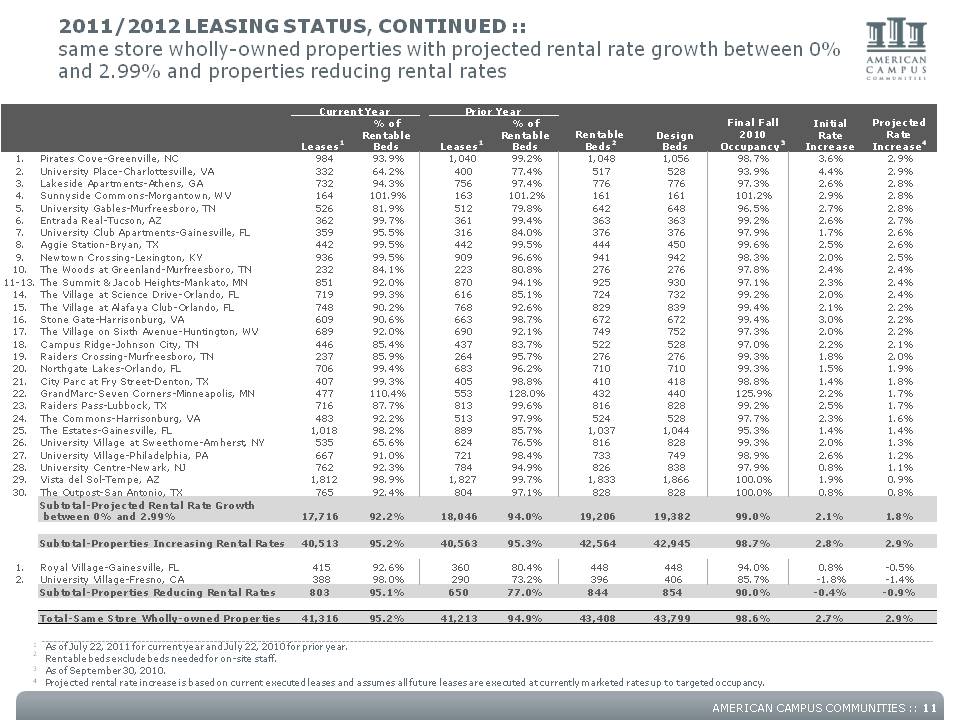
2011/2012 LEASING STATUS, CONTINUED :: same store wholly-owned properties with projected rental rate growth between 0% and 2.99% and properties reducing rental rates Current Year Prior Year Leases1 % of Rentable Beds Leases1 % of Rentable Beds Rentable Beds2 Design Beds Final Fall 2010 Occupancy3 Initial Rate Increase Projected Rate Increase4 1. Pirates Cove-Greenville, NC 984 93.9% 1,040 99.2% 1,048 1,056 98.7% 3.6% 2.9% 2. University Place-Charlottesville, VA 332 64.2% 400 77.4% 517 528 93.9% 4.4% 2.9% 3. Lakeside Apartments-Athens, GA 732 94.3% 756 97.4% 776 776 97.3% 2.6% 2.8% 4. Sunnyside Commons-Morgantown, WV 164 101.9% 163 101.2% 161 161 101.2% 2.9% 2.8% 5. University Gables-Murfreesboro, TN 526 81.9% 512 79.8% 642 648 96.5% 2.7% 2.8% 6. Entrada Real-Tucson, AZ 362 99.7% 361 99.4% 363 363 99.2% 2.6% 2.7% 7. University Club Apartments-Gainesville, FL 359 95.5% 316 84.0% 376 376 97.9% 1.7% 2.6% 8. Aggie Station-Bryan, TX 442 99.5% 442 99.5% 444 450 99.6% 2.5% 2.6% 9. Newtown Crossing-Lexington, KY 936 99.5% 909 96.6% 941 942 98.3% 2.0% 2.5% 10. The Woods at Greenland-Murfreesboro, TN 232 84.1% 223 80.8% 276 276 97.8% 2.4% 2.4% 11-13. The Summit & Jacob Heights-Mankato, MN 851 92.0% 870 94.1% 925 930 97.1% 2.3% 2.4% 14. The Village at Science Drive-Orlando, FL 719 99.3% 616 85.1% 724 732 99.2% 2.0% 2.4% 15. The Village at Alafaya Club-Orlando FL 748 90.2% 768 92.6% 829 839 99.4% 2.1% 2.2% 16. Stone Gate-Harrisonburg, VA 609 90.6% 663 98.7% 672 672 99.4% 3.0% 2.2% 17. The Village on Sixth Avenue-Huntington, WV 689 92.0% 690 92.1% 749 752 97.3% 2.0% 2.2% 18. Campus Ridge-Johnson City, TN 446 85.4% 437 83.7% 522 528 97.0% 2.2% 2.1% 19. Raiders Crossing-Murfreesboro, TN 237 85.9% 264 95.7% 276 276 99.3% 1.8% 2.0% 20. Northgate Lakes-Orlando, FL 706 99.4% 683 96.2% 710 710 99.3% 1.5% 1.9% 21. City Parc at Fry Street-Denton, TX 407 99.3% 405 98.8% 410 418 98.8% 1.4% 1.8% 22. GrandMarc-Seven Corners-Minneapolis, MN 477 110.4% 553 128.0% 432 440 125.9% 2.2% 1.7% 23. Raiders Pass-Lubbock, TX 716 87.7% 813 99.6% 816 828 99.2% 2.5% 1.7% 24. The Commons-Harrisonburg, VA 483 92.2% 513 97.9% 524 528 97.7% 2.3% 1.6% 25. The Estates-Gainesville, FL 1,018 98.2% 889 85.7% 1,037 1,044 95.3% 1.4% 1.4% 26. University Village at Sweethome-Amherst, NY 535 65.6% 624 76.5% 816 828 99.3% 2.0% 1.3% 27. University Village-Philadelphia, PA 667 91.0% 721 98.4% 733 749 98.9% 2.6% 1.2% 28. University Centre-Newark, NJ 762 92.3% 784 94.9% 826 838 97.9% 0.8% 1.1% 29. Vista del Sol-Tempe, AZ 1,812 98.9% 1,827 99.7% 1,833 1,866 100.0% 1.9% 0.9% 30. The Outpost-San Antonio, TX 765 92.4% 804 97.1% 828 828 100.0% 0.8% 0.8% Subtotal-Projected Rental Rate Growth between 0% and 2.99% 17,716 92.2% 18,046 94.0% 19,206 19,382 99.0% 2.1% 1.8% Subtotal-Properties Increasing Rental Rates 40,513 95.2% 40,563 95.3% 42,564 42,945 98.7% 2.8% 2.9% 1. Royal Village-Gainesville, FL 415 92.6% 360 80.4% 448 448 94.0% 0.8% -0.5% 2. University Village-Fresno, CA 388 98.0% 290 73.2% 396 406 85.7% -1.8% -1.4% Subtotal-Properties Reducing Rental Rates 803 95.1% 650 77.0% 844 854 90.0% -0.4% -0.9% Total-Same Store Wholly-owned Properties 41,316 95.2% 41,213 94.9% 43,408 43,799 98.6% 2.7% 2.9% 1 As of July 22, 2011 for current year and July 22, 2010 for prior year. 2 Rentable beds exclude beds needed for on-site staff. 3 As of September 30, 2010. 4 Projected rental rate increase is based on current executed leases and assumes all future leases are executed at currently marketed rates up to targeted occupancy. AMERICAN CAMPUS COMMUNITIES :: 11
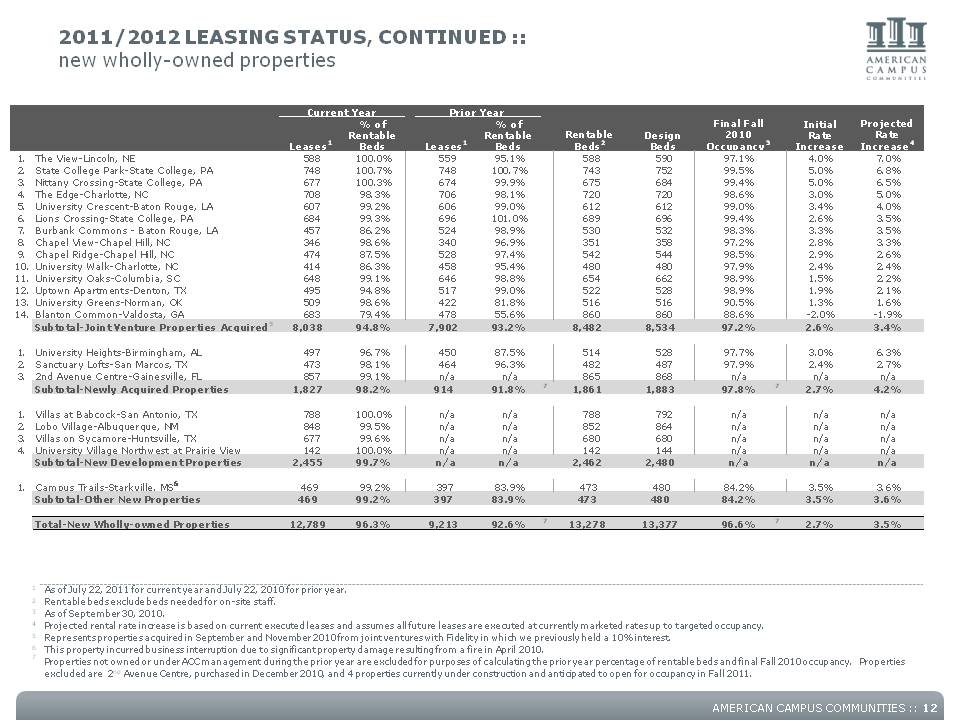
2011/2012 LEASING STATUS, CONTINUED :: new wholly-owned properties Current Year Prior Year Leases1 % of Rentable Beds Leases1 % of Rentable Beds Rentable Beds2 Design Beds Final Fall 2010 Occupancy3 Initial Rate Increase Projected Rate Increase4 1. The View-Lincoln, NE 588 100.0% 559 95.1% 588 590 97.1% 4.0% 7.0% 2. State College Park-State College, PA 748 100.7% 748 100.7% 743 752 99.5% 5.0% 6.8% 3. Nittany Crossing-State College, PA 677 100.3% 674 99.9% 675 684 99.4% 5.0% 6.5% 4. The Edge-Charlotte, NC 708 98.3% 706 98.1% 720 720 98.6% 3.0% 5.0% 5. University Crescent-Baton Rouge, LA 607 99.2% 606 99.0% 612 612 99.0% 3.4% 4.0% 6. Lions Crossing-State College, PA 684 99.3% 696 101.0% 689 696 99.4% 2.6% 3.5% 7. Burbank Commons - Baton Rouge, LA 457 86.2% 524 98.9% 530 532 98.3% 3.3% 3.5% 8. Chapel View-Chapel Hill, NC 346 98.6% 340 96.9% 351 358 97.2% 2.8% 3.3% 9. Chapel Ridge-Chapel Hill, NC 474 87.5% 528 97.4% 542 544 98.5% 2.9% 2.6% 10. University Walk-Charlotte, NC 414 86.3% 458 95.4% 480 480 97.9% 2.4% 2.4% 11. University Oaks-Columbia, SC 648 99.1% 646 98.8% 654 662 98.9% 1.5% 2.2% 12. Uptown Apartments-Denton, TX 495 94.8% 517 99.0% 522 528 98.9% 1.9% 2.1% 13. University Greens-Norman, OK 509 98.6% 422 81.8% 516 516 90.5% 1.3% 1.6% 14. Blanton Common-Valdosta, GA 683 79.4% 478 55.6% 860 860 88.6% -2.0% -1.9% Subtotal-Joint Venture Properties Acquired5 8,038 94.8% 7,902 93.2% 8,482 8,534 97.2% 2.6% 3.4% 1. University Heights-Birmingham, AL 497 96.7% 450 87.5% 514 528 97.7% 3.0% 6.3% 2. Sanctuary Lofts-San Marcos, TX 473 98.1% 464 96.3% 482 487 97.9% 2.4% 2.7% 3. 2nd Avenue Centre-Gainesville, FL 857 99.1% n/a n/a 865 868 n/a n/a n/a Subtotal-Newly Acquired Properties 1,827 98.2% 914 91.8% 7 1,861 1,883 97.8% 7 2.7% 4.2% 1. Villas at Babcock-San Antonio, TX 788 100.0% n/a n/a 788 792 n/a n/a n/a 2. Lobo Village-Albuquerque, NM 848 99.5% n/a n/a 852 864 n/a n/a n/a 3. Villas on Sycamore-Huntsville, TX 677 99.6% n/a n/a 680 680 n/a n/a n/a 4. University Village Northwest at Prairie View 142 100.0% n/a n/a 142 144 n/a n/a n/a Subtotal-New Development Properties 2,455 99.7% n/a n/a 2,462 2,480 n/a n/a n/a 1. Campus Trails-Starkville, MS6 469 99.2% 397 83.9% 473 480 84.2% 3.5% 3.6% Subtotal-Other New Properties 469 99.2% 397 83.9% 473 480 84.2% 3.5% 3.6% Total-New Wholly-owned Properties 12,789 96.3% 9,213 92.6% 7 13,278 13,377 96.6% 7 2.7% 3.5% 1 As of July 22, 2011 for current year and July 22, 2010 for prior year. 2 Rentable beds exclude beds needed for on-site staff. 3 As of September 30, 2010. 4 Projected rental rate increase is based on current executed leases and assumes all future leases are executed at currently marketed rates up to targeted occupancy. 5 Represents properties acquired in September and November 2010 from joint ventures with Fidelity in which we previously held a 10% interest. 6 This property incurred business interruption due to significant property damage resulting from a fire in April 2010. 7 Properties not owned or under ACC management during the prior year are excluded for purposes of calculating the prior year percentage of rentable beds and final Fall 2010 occupancy. Properties excluded are 2nd Avenue Centre, purchased in December 2010, and 4 properties currently under construction and anticipated to open for occupancy in Fall 2011. AMERICAN CAMPUS COMMUNITIES :: 12
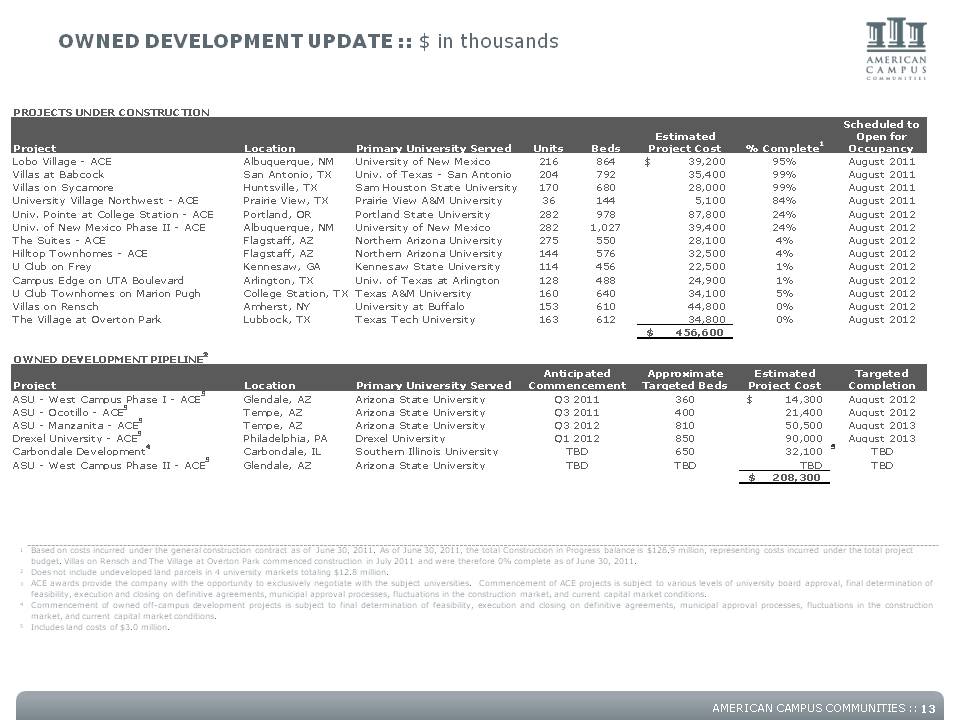
OWNED DEVELOPMENT UPDATE :: $ in thousands PROJECTS UNDER CONSTRUCTION Project Location Primary University Served Units Beds Estimated Project Cost % Complete1 Scheduled to Open for Occupancy Lobo Village - ACE Albuquerque, NM University of New Mexico 216 864 39,200 $ 95% August 2011 Villas at Babcock San Antonio, TX Univ. of Texas - San Antonio 204 792 35,400 99% August 2011 Villas on Sycamore Huntsville, TX Sam Houston State University 170 680 28,000 99% August 2011 University Village Northwest - ACE Prairie View, TX Prairie View A&M University 36 144 5,100 84% August 2011 Univ. Pointe at College Station - ACE Portland, OR Portland State University 282 978 87,800 24% August 2012 Univ. of New Mexico Phase II - ACE Albuquerque, NM University of New Mexico 282 1,027 39,400 24% August 2012 The Suites - ACE Flagstaff, AZ Northern Arizona University 275 550 28,100 4% August 2012 Hilltop Townhomes - ACE Flagstaff, AZ Northern Arizona University 144 576 32,500 4% August 2012 U Club on Frey Kennesaw, GA Kennesaw State University 114 456 22,500 1% August 2012 Campus Edge on UTA Boulevard Arlington, TX Univ. of Texas at Arlington 128 488 24,900 1% August 2012 U Club Townhomes on Marion Pugh College Station, TX Texas A&M University 160 640 34,100 5% August 2012 Villas on Rensch Amherst, NY University at Buffalo 153 610 44,800 0% August 2012 The Village at Overton Park Lubbock, TX Texas Tech University 163 612 34,800 0% August 2012 $ 456,600 OWNED DEVELOPMENT PIPELINE2 Project Location Primary University Served Anticipated Commencement Approximate Targeted Beds Estimated Project Cost Targeted Completion ASU - West Campus Phase I - ACE3 Glendale, AZ Arizona State University Q3 2011 360 14,300 $ August 2012 ASU Ocotillo ACE 3 Tempe, AZ Arizona State University Q3 2011 400 21 400 August 2012 ASU - Manzanita - ACE3 Tempe, AZ Arizona State University Q3 2012 810 50,500 August 2013 Drexel University - ACE3 Philadelphia, PA Drexel University Q1 2012 850 90,000 August 2013 Carbondale Development4 Carbondale, IL Southern Illinois University TBD 650 32,100 5 TBD ASU - West Campus Phase II - ACE3 Glendale, AZ Arizona State University TBD TBD TBD TBD $ 208,300 1 Based on costs incurred under the general construction contract as of June 30, 2011. As of June 30, 2011, the total Construction in Progress balance is $126.9 million, representing costs incurred under the total project budget. Villas on Rensch and The Village at Overton Park commenced construction in July 2011 and were therefore 0% complete as of June 30, 2011. 2 Does not include undeveloped land parcels in 4 university markets totaling $12.8 million. 3 ACE awards provide the company with the opportunity to exclusively negotiate with the subject universities. Commencement of ACE projects is subject to various levels of university board approval, final determination of feasibility, execution and closing on definitive agreements, municipal approval processes, fluctuations in the construction market, and current capital market conditions. 4 Commencement of owned off-campus development projects is subject to final determination of feasibility, execution and closing on definitive agreements, municipal approval processes, fluctuations in the construction market and current capital market conditions. 5 Includes land costs of $3.0 million. AMERICAN CAMPUS COMMUNITIES :: 13
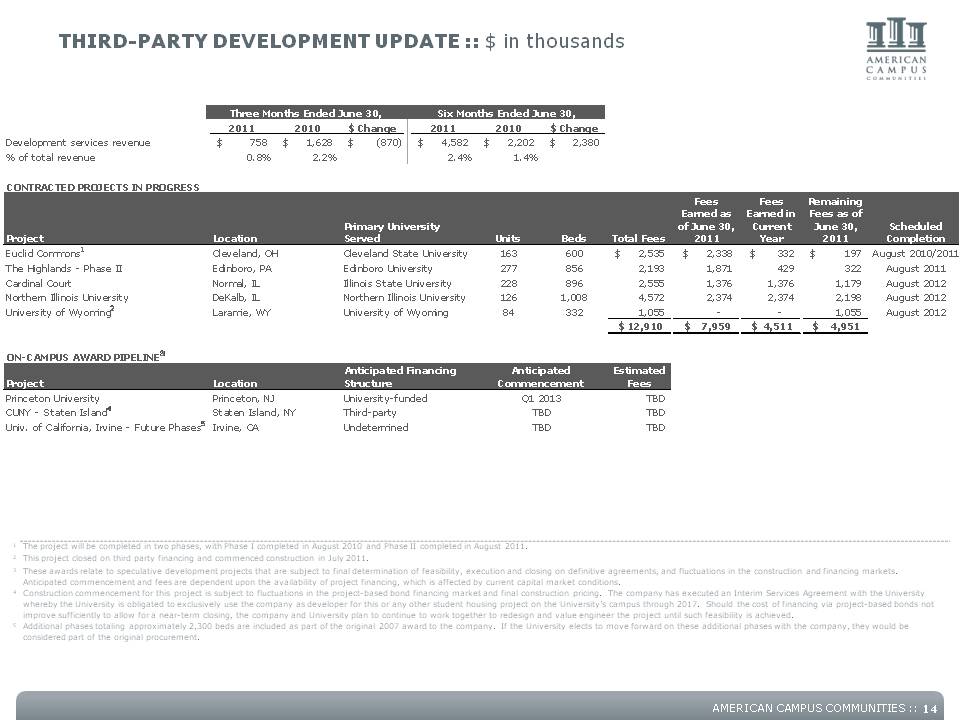
THIRD-PARTY DEVELOPMENT UPDATE :: $ in thousands Three Months Ended June 30, Six Months Ended June 30, 2011 2010 $ Change 2011 2010 $ Change Development services revenue $ 758 $ 1,628 $ (870) $ 4,582 $ 2,202 $ 2,380 % of total revenue 0.8% 2.2% 2.4% 1.4% CONTRACTED PROJECTS IN PROGRESS Project Location Primary University Served Units Beds Total Fees Fees Earned as of June 30, 2011 Fees Earned in Current Year Remaining Fees as of June 30, 2011 Scheduled Completion Euclid Commons1 Cleveland, OH Cleveland State University 163 600 $ 2,535 $ 2,338 $ 332 $ 197 August 2010/2011 The Highlands - Phase II Edinboro, PA Edinboro University 277 856 2,193 1,871 429 322 August 2011 Cardinal Court Normal, IL Illinois State University 228 896 2,555 1,376 1,376 1,179 August 2012 Northern Illinois University DeKalb, IL Northern Illinois University 126 1,008 4,572 2,374 2,374 2,198 August 2012 University of Wyoming2 Laramie, WY University of Wyoming 84 332 1,055 - - 1,055 August 2012 $ 12,910 $ 7,959 $ 4,511 $ 4,951 ON-CAMPUS AWARD PIPELINE3 Project Location Anticipated Financing Structure Anticipated Commencement Estimated Fees Princeton University Princeton, NJ University-funded Q1 2013 TBD CUNY Island4 Staten Island NY Third-party TBD TBD Univ. of California, Irvine - Future Phases5 Irvine, CA Undetermined TBD TBD 1 The project will be completed in two phases, with Phase I completed in August 2010 and Phase II completed in August 2011. 2 This project closed on third party financing and commenced construction in July 2011. 3 These awards relate to speculative development projects that are subject to final determination of feasibility, execution and closing on definitive agreements, and fluctuations in the construction and financing markets. Anticipated commencement and fees are dependent upon the availability of project financing, which is affected by current capital market conditions. 4 Construction commencement for this project is subject to fluctuations in the project-based bond financing market and final construction pricing. The company has executed an Interim Services Agreement with the University whereby the University is obligated to exclusively use the company as developer for this or any other student housing project on the University’s campus through 2017. Should the cost of financing via project-based bonds not improve sufficiently to allow for a near-term closing the company and University plan to continue to work and value engineer the project until such feasibility is achieved. 5 Additional phases totaling approximately 2,300 beds are included as part of the original 2007 award to the company. If the University elects to move forward on these additional phases with the company, they would be considered part of the original procurement. AMERICAN CAMPUS COMMUNITIES :: 14
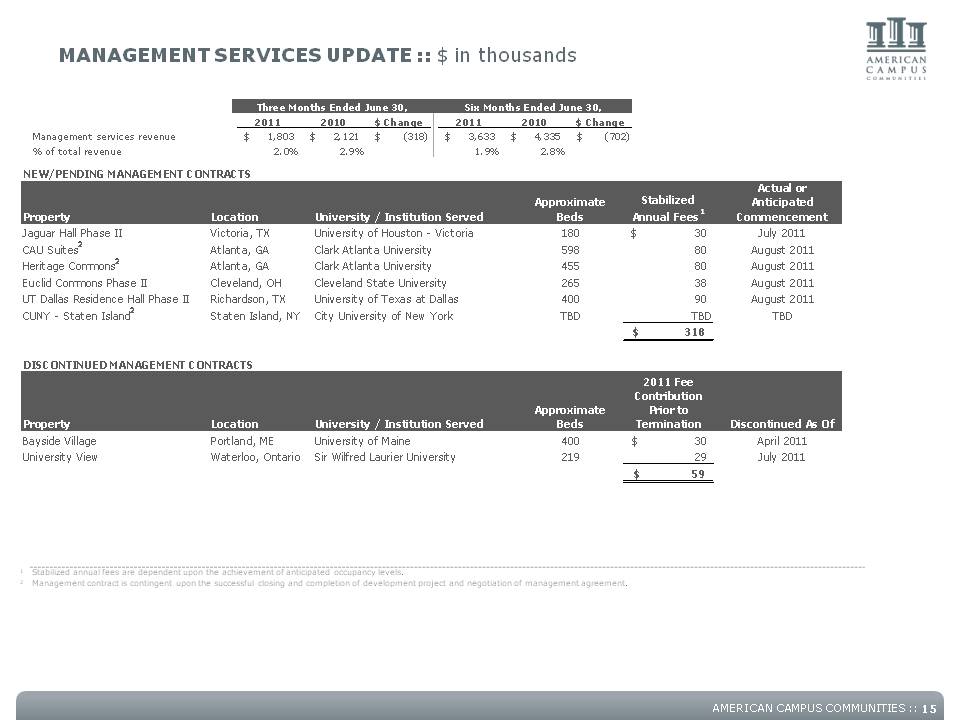
MANAGEMENT SERVICES UPDATE :: $ in thousands Three Months Ended June 30, Six Months Ended June 30, 2011 2010 $ Change 2011 2010 $ Change Management services revenue $ 1,803 $ 2,121 $ (318) $ 3,633 $ 4,335 $ (702) % of total revenue 2.0% 2.9% 1.9% 2.8% NEW/PENDING MANAGEMENT CONTRACTS Property Location University / Institution Served Approximate Beds Stabilized Annual Fees1 Actual or Anticipated Commencement Jaguar Hall Phase II Victoria, TX University of Houston - Victoria 180 $ 30 July 2011 CAU Suites2 Atlanta, GA Clark Atlanta University 598 80 August 2011 Heritage Commons2 Atlanta, GA Clark Atlanta University 455 80 August 2011 Euclid Commons Phase II Cleveland, OH Cleveland State University 265 38 August 2011 UT Dallas Residence Hall Phase II Richardson, TX University of Texas at Dallas 400 90 August 2011 CUNY - Staten Island2 Staten Island, NY City University of New York TBD TBD TBD $ 318 DISCONTINUED MANAGEMENT CONTRACTS Property Location University / Institution Served Approximate Beds 2011 Fee Contribution Prior to Termination Discontinued As Of Bayside Village Portland, ME University of Maine $ 400 30 April 2011 University View Waterloo, Ontario Sir Wilfred Laurier University 219 29 July 2011 $59 1 Stabilized annual fees are dependent upon the achievement of anticipated occupancy levels. 2 Management contract is contingent upon the successful closing and completion of development project and negotiation of management agreement. AMERICAN CAMPUS COMMUNITIES :: 15
INVESTOR INFORMATION :: Executive Management Bill Bayless Chief Executive Officer Greg Dowell Chief Operating Officer Jon Graf Chief Financial Officer Research Coverage Jeffery Spector / Jana Galan Bank of America / Merrill Lynch (646) 855-1363 / (646) 855-3081 jeff.spector@baml.com / jana.galan@baml.com Michael Bilerman / Eric Wolfe Citigroup Equity Research (212) 816-1383 / (212) 816-5871 michael.bilerman@citi.com / eric.wolfe@citi.com John Perry Deutsche Bank Securities, Inc. (212) 250-4912 john.perry@db.com Andrew McCulloch / Chris Van Ens Green Street Advisors (949) 640-8780 amcculloch@greenstreetadvisors.com / cvanens@greenstreetadvisors.com Carol Kemple Hilliard Lyons (502) 588-1839 ckemple@hilliard.com Steve Sakwa / Seth Laughlin ISI Group Inc. (212) 446-9462 / (212) 446-9458 ssakwa@isigrp.com / slaughlin@isigrp.com Anthony Paolone / Joseph Dazio J.P. Morgan Securities (212) 622-6682 / (212) 622-6416 anthony.paolone@jpmorgan.com / joseph.c.dazio@jpmorgan.com Andrew DiZio Janney Capital Markets (215) 665-6439 adizio@janney.com Haendel E. St. Juste Keefe, Bruyette & Woods (212) 887-3842 hstjuste@kbw.com Jordan Sadler / Karin Ford KeyBanc Capital Markets (917) 368-2280 / (917) 368-2293 jsadler@keybanccm.com / kford@keybanccm.com Stephen C. Swett Morgan Keegan (212) 508-7585 stephen.swett@morgankeegan.com Paula Poskon / Lindsey Yao Robert W. Baird & Co., Inc. (703) 821-5782 / (703) 918-7852 pposkon@rwbaird.com / lyao@rwbaird.com Alexander Goldfarb / James Milam Sandler O'Neill + Partners, L.P. (212) 466-7937 / (212) 466-8066 agoldfarb@sandleroneill.com / jmilam@sandleroneill.com Ross Nussbaum UBS Investment Research (212) 713-2484 ross.nussbaum@ubs.com American Campus Communities, Inc. is followed by the analysts listed above. Please note that any opinions, estimates or forecasts regarding American Campus Communities, Inc.'s performance made by such analysts are theirs alone and do not represent the opinions, forecasts or predictions of the company or its management. American Campus Communities, Inc. does not by its reference above or distribution imply its endorsement of or concurrence with such information, conclusions or recommendations. Additional Information Corporate Headquarters: American Campus Communities, Inc. 12700 Hill Country Blvd., Suite T-200 Austin, Texas 78738 Tel: (512) 732-1000; Fax: (512) 732-2450 www.americancampus.com Investor Relations: Gina Cowart VP, Investor Relations and Corporate Marketing (512) 732-1041 gcowart@americancampus.com AMERICAN CAMPUS COMMUNITIES :: 16
FORWARD-LOOKING STATEMENT :: In addition to historical information, this supplemental package contains forward-looking statements under the federal securities law. These statements are based on current expectations, estimates and projections about the industry and markets in which American Campus operates, management's beliefs, and assumptions made by management. Forward-looking statements are not guarantees of future performance and involve certain risks and uncertainties, which are difficult to predict. AMERICAN CAMPUS COMMUNITIES ::