Attached files
| file | filename |
|---|---|
| 8-K - FORM 8-K - STERLING BANCORP | d8k.htm |
| EX-99.1 - PRESS RELEASE - STERLING BANCORP | dex991.htm |
 Earnings Conference Call
July 26, 2011
July 26, 2011
(PBNY)
Exhibit 99.2 |
 2
We make statements in this presentation, and we may from time to
time make other statements,
regarding our outlook or expectations for earnings, revenues, expenses and/or other
matters regarding or affecting us that are forward-looking statements
within the meaning of the Private Securities Litigation Reform Act.
Forward-looking statements are typically identified by words such as
“believe”, “expect”, “anticipate", “intend", “outlook", “estimate", “forecast", “project”
and
other similar words and expressions.
These statements are based on the current beliefs and expectations of management.
Since these statements reflect the views of management concerning future
events, these statements involve risks, uncertainties, and
assumptions. These risks and uncertainties include among others:
changes in market interest rates and general and regional economic conditions;
changes in government regulations; changes in the value of goodwill and
intangible assets; changes in the quality or composition of the loan and
investment portfolios; potential breaches of information security,
competition from banks and non-banking companies; and other factors discussed in the
documents filed by us with the Securities and Exchange Commission from time to
time. These factors should be considered in evaluating the
forward-looking statements and undue reliance should not be placed on
such statements. Actual results or future events could differ, possibly
materially, from those that we anticipated in our forward-looking statements,
and future results could differ materially from our historical performance.
We undertake no obligation to update these forward-looking statements to
reflect events or circumstances that occur after the date on
which such statements were made.
Forward-looking
Forward-looking
Statements
Statements |
 Provident Bank Investment Profile
Attractive Regional Market
Low Cost, Longer Duration Funding Sources
Strong Capital and Liquidity
Credit Quality
Expandable Operating Platform
Positioning Relative to Competitors
3 |
 Third
Quarter Result Summary Third Quarter Result Summary
Quarterly earnings of $1.9 MM vs. $4.8 MM last year and $3.6
MM last quarter
Diluted EPS of $0.05 per share
Net Interest Margin of 3.70% vs. 3.68% last quarter
Enhanced Commercial Loan Production
$125.5 MM in originations
Commercial pipeline at historical highs
Credit metrics
Substandard and special mention decline of $13.1 MM
NPL
increased
by
$10.9
MM
resulting
from
a
previously
classified
performing
TDR into non-accrual
4 |
 5
Earning Assets and Loan Yields-
Earning Assets and Loan Yields-
Last Five Quarters
Last Five Quarters
6/30/10
9/30/10
12/31/10
3/31/11
6/30/11
YOY
6/10
6/11
Linked
Quarters
Earning
Asset Yield
4.87%
4.67%
4.54%
4.51%
4.50%
Down 37
Down 1
Loan Yields
5.68%
5.48%
5.47%
5.40%
5.41%
Down 27
Up 1
Investment
Yield and Other
Earning Assets
3.45%
3.16%
2.82%
2.91%
2.87%
Down 58
Down 4
Cost of Funds
1.00%
0.97%
0.93%
0.86%
0.83%
Down 17
Down 3
Total Deposits
0.37%
0.34%
0.32%
0.31%
0.29%
Down 8
Down 2
Borrowings
3.63%
3.53%
3.49%
3.58%
3.67%
Up 4
Up 9
NIM
3.91%
3.75%
3.66%
3.68%
3.70%
Down 21
Up 2 |
 6
Loan Balance Sheet / Originations
Loan Balance Sheet / Originations
BALANCES
3Q10
2Q11
3Q11
% LINKED
YOY
C&I
129,314
122,769
124,345
1%
-4%
CRE
469,075
540,402
566,395
5%
21%
ADC
227,521
205,593
193,312
-6%
-15%
CBL
195,303
184,356
179,299
-3%
-8%
Total
Commercial
1,021,213
1,053,120
1,063,351
1%
4%
Consumer
240,364
227,391
226,518
-0.4%
-6%
Residential
444,160
401,309
395,403
-1%
-11%
Total
1,705,737
1,681,820
1,685,272
0.2%
-1%
ORIGINATIONS
3Q10
2Q11
3Q11
% LINKED
YOY
C&I
25,682
21,468
24,466
14%
-5%
CRE
54,538
42,029
63,140
50%
16%
ADC
32,196
10,558
25,012
137%
-22%
CBL
18,052
13,566
12,835
-5%
-29%
Total
Commercial
130,468
87,621
125,453
43%
-4%
Consumer
13,435
13,604
13,550
0%
1%
Residential
13,513
16,209
9,345
-42%
-31%
Total
157,416
117,434
148,348
26%
-6% |
 7
Core Deposit Growth
Core Deposit Growth
3Q10
4Q10
1Q11
2Q11
3Q11
QTR
% Growth
YOY
% Growth
Retail Trans
307,673
279,283
318,514
327,674
329,793
0.65%
7.19%
Comm Trans
289,226
311,322
322,952
308,746
309,550
0.26%
7.03%
Muni Trans (1)
110,541
107,904
123,097
137,794
129,435
-6.07%
17.09%
Total Trans
707,440
698,509
764,563
774,214
768,778
-0.70%
8.67%
Savings
404,810
427,286
399,472
420,775
428,120
1.75%
5.76%
MMDA (2)
128,068
130,190
135,274
139,097
136,328
-1.99%
6.45%
Total
1,240,318
1,255,985
1,299,309
1,334,086
1,333,226
-0.06%
7.49%
% Core Deposits
65%
65%
65.60%
64.00%
63.55%
(1) Excludes municipal tax deposits
(2) Excluding Power and Premium MMDA and wholesale deposits, municipal
|
 8
Strong Capital Position
Strong Capital Position
9/10
12/10
3/11
6/11
Tier 1 Leverage
8.43%
8.89%
9.1%
8.8%
Total RBC Ratio
13.3%
13.9%
13.9%
13.5%
Tangible
Capital/Tangible
Assets
9.33%
9.20%
9.31%
9.37%
Tangible Book
Value per Share
$6.96
$6.69
$6.74
$6.93 |
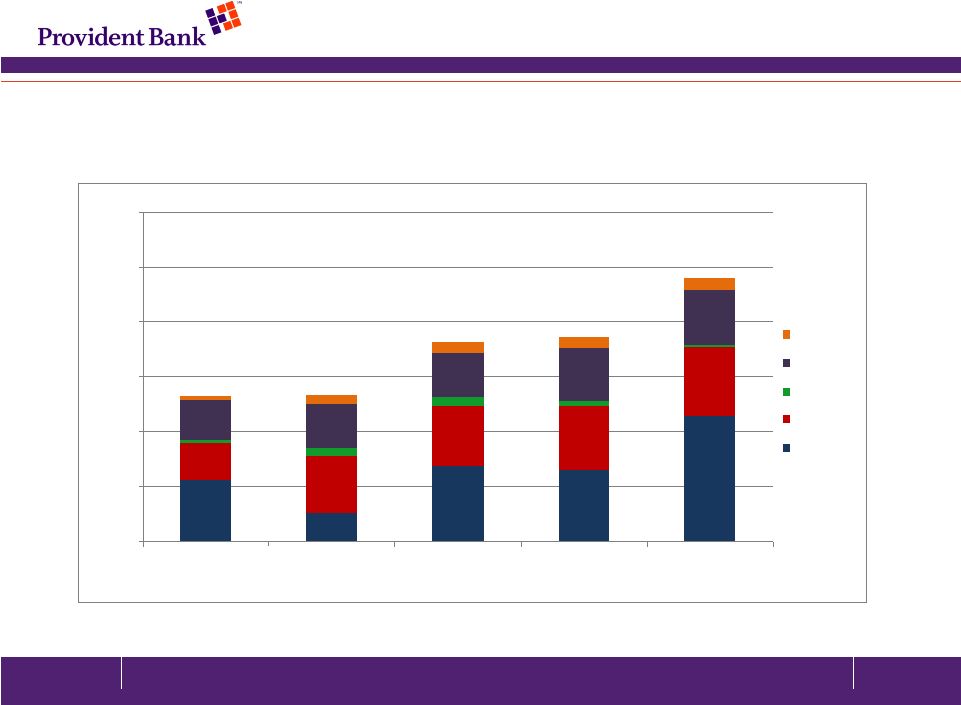 Non-Performing Loan Trend by Category
(Non-accrual and past due 90 days)
(Non-accrual and past due 90 days)
0
10000
20000
30000
40000
50000
60000
9/30/2009
9/30/2010
12/31/2010
3/31/2011
6/30/2011
Consumer
Residential
C&I
CRE
ADC
9 |
 10
Credit Quality
Year Ended
9/30/09
Year Ended
9/30/10
1Q11
2Q11
3Q11
Thrift
Bank
Non-performing loans to
total loans
Net charge-offs to
average loans (1)
Loan loss reserve to total loans
1.76%
1.81%
1.83%
1.79%
1.74%
1.34%
1.53%
Non-performing assets & OREO
to total assets
Special Mention (MM)
$36.9
$37.9
$63.7
$27.1
$24.1
Substandard/Doubltful (MM)
$89.9
$130.7
$114.6
$113.9
$103.8
* Source: SNL
(1) Annualized
2.21%
0.71%
81%
1.46%
Peer As Of 3/31/11
1-5B MidAtlantic*
2.38%
2.85%
1.03%
61%
1.79%
1.55%
1.66%
1.48%
0.34%
0.37%
40%
71%
1.02%
1.35%
0.93%
Loan loss reserve to non-performing loans
0.62%
3.07%
1.58%
0.57%
115%
114%
2.13%
0.45%
86% |
 Provident Bank Imperatives
Continue to improve credit metrics
Significantly improve efficiency levels
Grow revenue and earnings by expanding
client acquisitions
Overall Objective:
Become a Consistent Top Tier Performing Bank
11 |
 Strategic Framework
Focus on high value client segments
Expand delivery channels and distribution to
increase client acquisitions
Execute effectively –
create a highly
productive performance culture
Proactively Manage Enterprise Risk
12 |
 (PBNY) |