Attached files
 2011
Second-Quarter Earnings Results
July 21, 2011
Exhibit 99.3 |
 2
Introduction
Unless otherwise stated, we will be talking about results for the
second-quarter 2011 and comparing them with the same period in
2010
References to PMI volumes refer to PMI shipment data, unless
otherwise stated
Industry volume and market shares are the latest data available from
a number of internal and external sources
Organic volume refers to volume excluding acquisitions
Net revenues exclude excise taxes
OCI stands for Operating Companies Income, which is defined as
operating income before general corporate expenses and the
amortization of intangibles. OCI growth rates are on an adjusted
basis, which excludes asset impairment, exit and other costs
Data tables showing adjustments to net revenues and OCI for
currency, acquisitions, asset impairment, exit and other costs, free
cash flow calculations, adjustments to EPS, and reconciliations to
U.S. GAAP measures are at the end of today’s web cast slides and
are posted on our web site |
 3
Forward-Looking and Cautionary Statements
This presentation and related discussion contain statements that, to
the extent they do not relate strictly to historical or current facts,
constitute “forward-looking statements”
within the meaning of the
Private Securities Litigation Reform Act of 1995. Such forward-looking
statements are based on current plans, estimates and expectations,
and are not guarantees of future performance. They are based on
management’s expectations that involve a number of business risks
and uncertainties, any of which could cause actual results to differ
materially from those expressed in or implied by the forward-looking
statements. PMI undertakes no obligation to publicly update or revise
any forward-looking statements, except in the normal course of its
public disclosure obligations. The risks and uncertainties relating to
the forward-looking statements in this presentation include those
described
under
Item
1A.
“Risk
Factors”
in
PMI’s
Form
10-Q
for
the
quarter ended March 31, 2011, filed with the Securities and Exchange
Commission |
 4
Second-Quarter 2011 Results
Very strong financial performance:
Key drivers:
Excellent results in the Asia Region, led by Indonesia, Japan,
Korea and the Philippines
Higher prices in a wide range of markets
Q2,
2011
Results
(a)
Organic Cigarette Volume
+0.1%
Net
Revenues
+10.1%
Adjusted OCI
+16.5%
Adjusted Diluted EPS
+21.0%
(a)
All financial growth rates exclude currency. Net revenues and OCI growth rates also exclude
acquisitions Source: PMI Financials |
 5
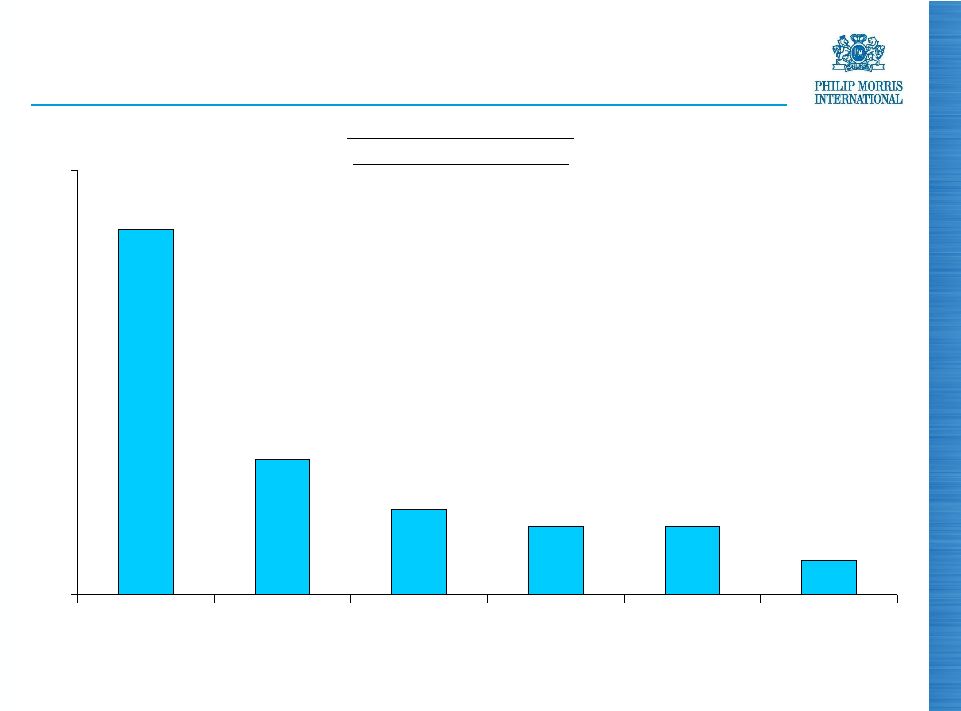
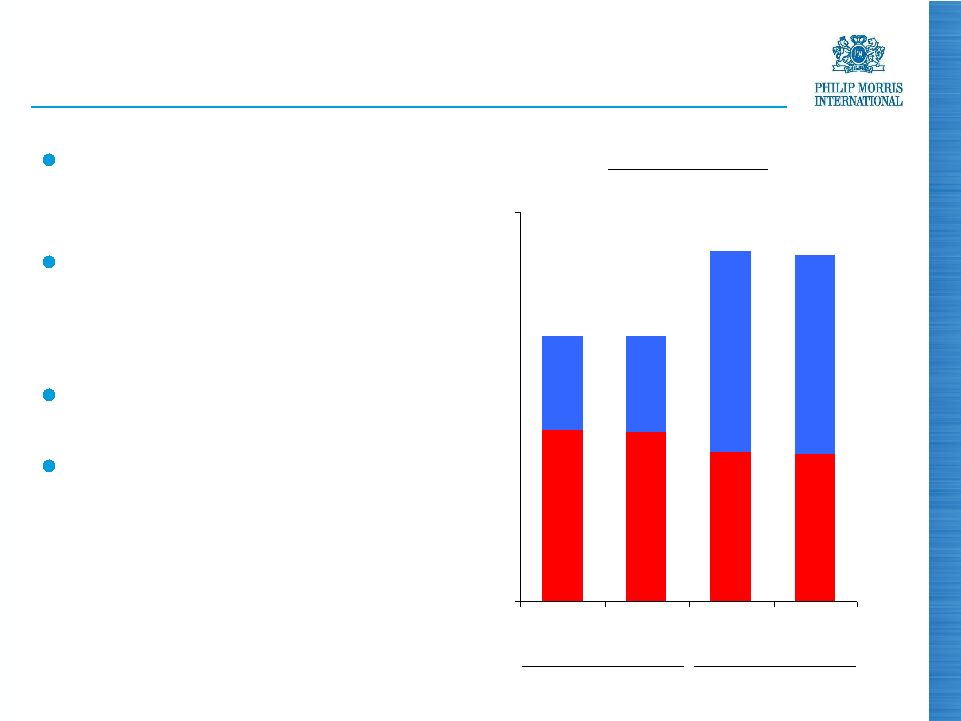
Pricing Variance
Pricing remains the key
driver of our increased
profitability
During the last three
months, PMI implemented
or announced price
increases in numerous
markets
Pricing situation in Spain
improved in July
Source: PMI Financials
($ mio)
790
1,070
Q2
Q1
449
453
341
617
0
600
1,200
2010
2011 |
 6
PMI Market Share Developments
(%)
Top 30 PMI OCI Markets
Source: PMI Financials and estimates
36.2
38.5
30
35
40
Q2, 2010
Q2, 2011 |
 7
Marlboro
Market Share Developments
Market Shares
Q2, 2010
Q2, 2011
Variance
EU
18.1 %
18.1 %
-
pp
EEMA
6.3
6.9
0.6
Asia
(a)
6.0
6.7
0.7
LA&C
13.6
13.7
0.1
Total
(a)(b)
8.9
9.3
0.4
(a)
Excluding PRC
(b)
Also excluding the USA
Source: PMI estimates |
 8
L&M
Market Share Developments
Market Share Increases
Q2, 2011 vs. Q2, 2010
(pp)
Turkey
(a)
Netherlands
Germany
Poland
Slovakia
Egypt
4.3
1.6
0.8
1.0
0.8
0.4
(a)
QTD May
Source: A.C. Nielsen and PMI estimates
0
5 |
 9
2011 EPS Guidance
Reported diluted EPS guidance for 2011 is being raised
by a further 15 cents to $4.70 to $4.80
Ten cents of the increase are attributable to
improvements in the business, largely Japan
Five cents relate to a more favorable currency outlook at
prevailing exchange rates
Compared to our adjusted diluted EPS of $3.87 in 2010,
this corresponds to a growth rate of approximately 21.5 to
24% at prevailing exchange rates, and approximately
15% to 17.5% excluding currency
Source: PMI forecasts |
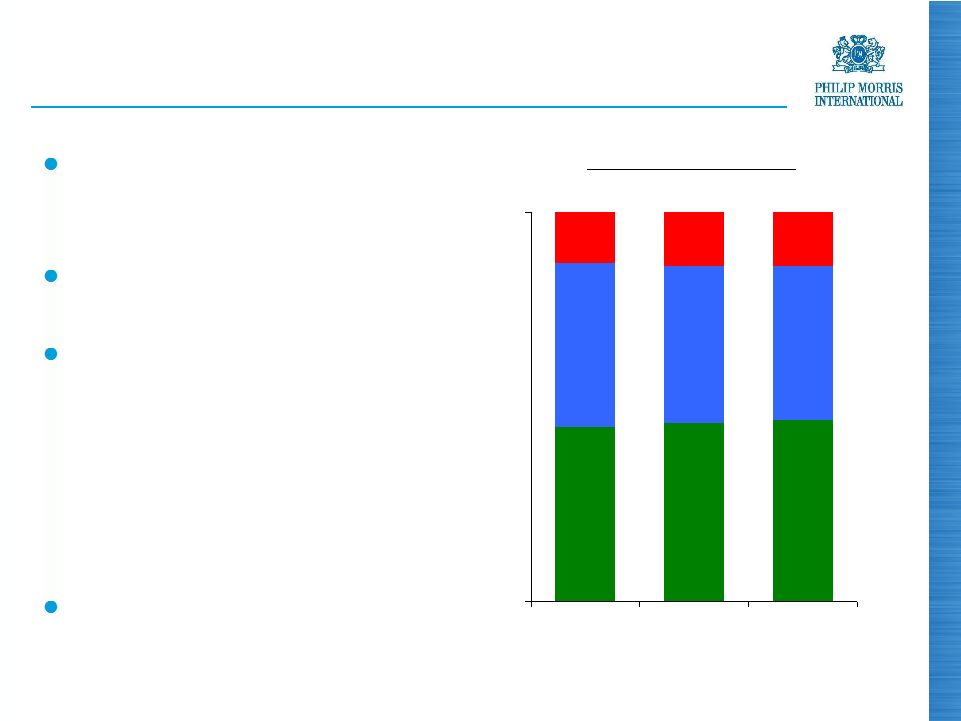
 10
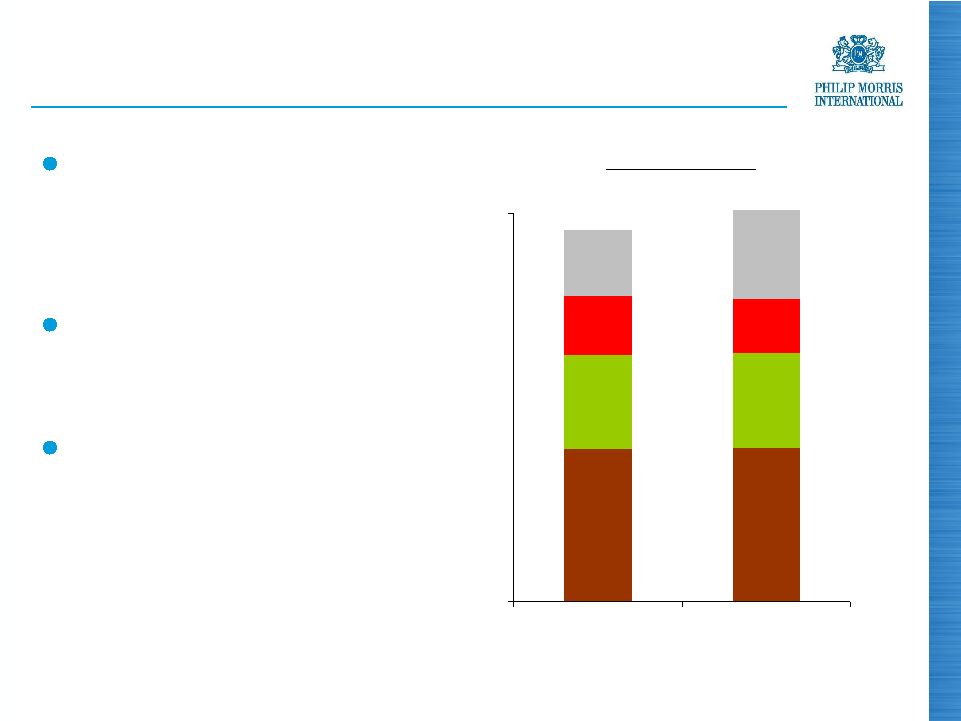
PMI Results by Region
Asia
(a)
Eastern Europe, Middle East & Africa Region
Source: PMI Financials
H1, 2011 Net Revenues:
$15.1 billion
H1, 2011 Adjusted OCI:
$6.9 billion
EEMA
(a)
EU
Latin America
& Canada
Latin America
& Canada
Asia
EU
EEMA
(a)
24%
35%
30%
11%
23%
36%
33%
8% |
 11
Japan
Source: PMI Financials and Tobacco Institute of Japan
Total PMI
PMI shipments to Japan
reached 19.5 billion units
in Q2, 2011, up 1.9 billion,
or 11.0%
Second half impact subject
to complex interaction of
multiple factors
New base for industry
volume and PMI share will
not be clear until Q4, 2011,
at the earliest
Other
Lark
Marlboro
24.3
42.0
2010
2011
(%)
PMI Market Share
10.8
16.4
6.7
14.4
11.2
6.8
0
50
Q2
Q2 |
 12
Indonesia
Strong economy and
relatively soft Q2, 2010,
drove industry volume up
13.9% in Q2, 2011
PMI volume up 20.7% to
22.6 billion units in the
same period
Strong profitability growth
in Asia’s second largest
market after China
Source: PMI estimates and PMI Financials
2010
2011
Other
Marlboro
Dji Sam Soe
Sampoerna A
28.6
30.2
(%)
PMI Market Share
Total PMI
11.7
11.8
7.3
7.3
4.2
4.5
0
30
Q2
Q2 |
 13
Korea
Strong volume and share
growth momentum
continued, driven by
Marlboro
and
Parliament
Innovative Marlboro
menthol line extensions
contributed 1.0 share
points in Q2, 2011
PMI seeking to secure
excise tax reform
Source: PMI Financials and Hankook Research
(%)
2010
2011
Other
Parliament
Marlboro
16.6
19.9
Total PMI
PMI Market Share
6.8
8.6
5.5
6.7
0
20
Q2
Q2 |
 14
EEMA Region
PMI’s organic volume declined by 3.4% due primarily to
Ukraine
Full-year Regional volume expected to be stable
Net revenues and adjusted OCI, excluding currency and
acquisitions, were up 3.6% and 4.8%, respectively in Q2
Profitability improvement driven by:
Increased volumes in Turkey and North Africa, and
Higher prices across the Region, most notably in Russia,
partly offset by
Lower volumes in Eastern Europe, and
Increased investments in business building initiatives in Russia
Source: PMI Financials |
 15
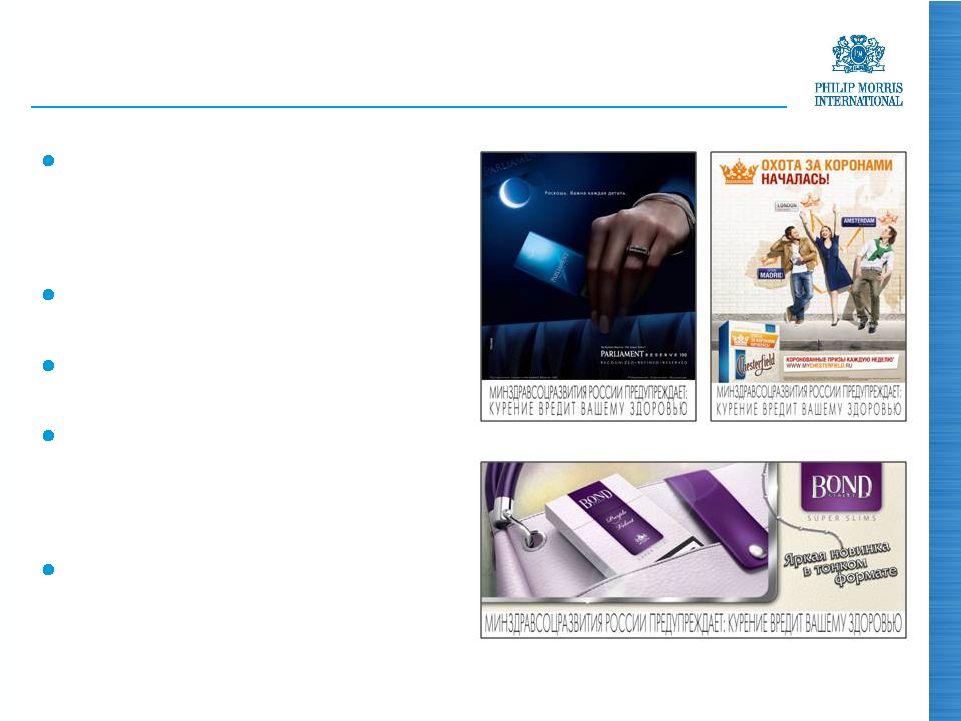
Russia
Investments to support strong
performance of Parliament,
Chesterfield
and Bond Street,
and address Marlboro
issues
Market share down 0.1pp QTD
May, 2011, to 25.4%
PMI price increase announced
earlier this month
Limited consumer uptrading and
expected overall market decline
of 2-3% this year, in line with
2010
Russian Government has
approved new road map for
excise taxes
Source: A.C. Nielsen, PMI estimates and Russian Ministry of Finance |
 16
Ukraine
Estimated industry volume
decline of 15% distorted by
trade loading in Q2, 2010
Total market expected to
stabilize during second half
PMI share down 3.5pp to
32.1% in the second quarter,
due to under-representation in
super-low segment. Issue
being addressed through
more attractive pricing of
Bond Street
Market
shares
of
Parliament
and
Marlboro
are
growing
Source: PMI estimates and A.C. Nielsen
(%)
2010
2011
Industry Price Segments
Premium
Mid/Low
2010
Super-
Low
44.9
45.7
46.5
42.1
40.5
39.5
13.8
14.0
13.0
0
100
H1
H2
H1 |
 17
Turkey
Total market has stabilized
PMI volume up 12.1% in Q2,
2011
PMI reached a market share
of 44.6% in QTD May, 2011,
up 3.8pp
PMI share improvement in
all three price segments, led
by Parliament, Muratti
and
L&M
(%)
2010
2011
Total
PMI
Premium
Mid
Low
40.8
44.6
PMI Market Share
(a)
QTD May
Source: PMI estimates, PMI Financials and A.C. Nielsen
(a)
19.0
21.4
5.8
6.2
17.0
16.0
0
45
Q2
Q3
Q4
Q1
Q2 |
 18
EU Region
Despite the issues that continued to impact Spain and to
a lesser extent Greece, the results in the second quarter
were more positive:
-
Industry volume declined by a modest 1.7%
-
PMI volume was 3.1% lower due to Greece, Poland and Spain
-
further 0.3pp to 6.6%
-
Net revenues and adjusted OCI were up 0.7% and 2.3%,
respectively, excluding currency and acquisitions
Source: PMI estimates and PMI Financials
Marlboro’s Regional
share
was
stable
at
18.1%
and
L&M
grew
a |
 19
Cigarettes
Fine cut
Germany
Total industry volumes of
cigarettes and fine cut have
increased this year
PMI cigarette and fine cut
market shares are growing
Very strong performance of
L&M
Unit margin-enhancing price
increases implemented
Continued growth of “maxi”
pack segment
(a) Big packs (22-25 cigs) and Maxi packs (26+ cigs)
Source: PMI estimates
(%)
2011
2010
PMI Market Share
2011
(%)
Big and Maxi Packs
(a)
SoM
Maxi
Big
35.6
35.9
14.4
14.8
2009
2010
36.4
40.5
40.2
5.2
7.1
10.0
0
50
FY
FY
H1
0
40
H1
H1 |
 20
Spain
Source: PMI estimates
(%)
2010
2011
PMI Market Share
High unemployment
Cigarette industry contracting at
double-digit rate and consumer
downtrading
Price competition exacerbated in
May/June this year
Recent developments indicate the
situation has improved
BUT
31.2
31.3
31.0
30.4
32.6
31.6
25
35
Q1
Q2
Q3
Q4
Q1
Q2 |
 21
France and Italy
Industry cigarette volume up
1.8% in France and stable in
Italy during Q2, 2011
Following entry of Marlboro,
PMI became market leader in
fine cut in France in Q2 with a
share of 25.0%, up 5.6pp
High single digit profitability
increases in both markets
PMI has announced a price
increase of €0.10/pack in Italy
Source: PMI estimates
Other
Marlboro
40.8
40.9
(%)
54.1
53.4
2010
2011
2010
2011
France
France
Italy
PMI Market Shares
Total
PMI
26.3
26.0
23.0
22.7
14.5
14.9
31.1
30.7
0
60
Q2
Q2
Q2
Q2 |
 22
Greece
Government has increased
Minimum Excise Tax from
75% to 100% of excise tax on
“WAP”
(Weighted Average
Price)
Tax pass-on at bottom of the
market (€2.40/20) is almost
€0.50/20
PMI has announced price
increase on L&M
25s from
€3.20 to €3.70 per pack
Price gap reduction should
help spur Marlboro
share
recovery
Source: Greek Ministry of Finance and PMI estimates
2010
2011
Marlboro
Market Share
(%)
19.7
19.4
18.7
20.0
19.3
21.7
15
25
Q1
Q2
Q3
Q4
Q1
Q2 |
 23
Latin America & Canada Region
Regional volume down
4.8%, driven by impact of
tax-driven price increases
in Mexico and timing of
shipments in Brazil
Strong Marlboro
performance
Regional net revenues
grew by 5.8% and
adjusted OCI was up
8.8%, both excluding
currency and acquisitions
Source: PMI Financials and PMI estimates
(%)
2010
2011
Mexico
Marlboro
Market Share
Argentina
Marlboro
Market Share
(%)
2010
2011
48.2
52.0
45
50
55
Q2
Q2
23.4
24.0
20
25
Q2
Q2 |
 24
Australia -
Plain Packaging
Australian Government appears intent on mandating the
implementation of plain packaging
Plain packaging will result in the illegal confiscation of our
very valuable trademarks and branded assets
PMI has served notice of its intention to file an arbitration
claim for compensation under the Hong Kong –
Australia
Bilateral Investment Treaty |
 25
Adjusted OCI Margins
Second-Quarter
2011
(a)
2010
Variance
(a)
EU
48.9 %
48.1 %
0.8 pp
EEMA
42.1
41.6
0.5
Asia
46.2
39.8
6.4
LA&C
32.5
31.6
0.9
Total
44.6
42.1
2.5
(a)
Excluding currency and acquisitions
Source: PMI Financials |
 26
Free Cash
Flow
(a)
Free cash flow equals net cash provided by operating activities less capital expenditures
Source: PMI Financials
Free Cash Flow
(a)
($ million)
+19.4%
Quarterly increase of $402
million, or 12.2%,
excluding currency
Driven mainly by our
excellent business results
For the first half, free cash
flow is up more than $1
billion to nearly $6.2 billion
Currency
3,296
3,934
236
0
500
1,000
1,500
2,000
2,500
3,000
3,500
4,000
Q2, 2010
Q2, 2011 |
 27
Share Repurchases
During the second quarter, PMI spent $1.5 billion to
purchase a further 22.7 million shares at an average price
of $68.32 per share
Since the March 2008 spin, 17.9% of shares outstanding
at that time have been repurchased
Source: PMI Financials |
 28
Summary
Very strong second-quarter results
Adjusted diluted EPS growth of 21.0%, excluding
currency
Outlook is promising, with strong market share and
business momentum
Pricing remains the key driver of profitability, with Spain a
special case
Very limited input cost pressures and we expect to
exceed our $250 million annual productivity target
2011 reported diluted EPS guidance raised by another 15
cents to a range of $4.70-$4.80
We continue to use our growing cash flow to generously
reward our shareholders
Source: PMI Financials |
 Questions & Answers
2011 Second-Quarter Results |
 30
PHILIP MORRIS INTERNATIONAL INC. and Subsidiaries
Reconciliation of Non-GAAP Measures
Adjustments for the Impact of Currency and Acquisitions
For the Quarters Ended June 30,
($ in millions)
(Unaudited)
Reported Net
Revenues
Less
Excise
Taxes
Reported Net
Revenues
excluding
Excise Taxes
Less
Currency
Reported Net
Revenues
excluding
Excise Taxes &
Currency
Less
Acquisi-
tions
Reported Net
Revenues
excluding
Excise Taxes,
Currency &
Acquisitions
Reported
Net
Revenues
Less
Excise
Taxes
Reported Net
Revenues
excluding
Excise Taxes
Reported
Reported
excluding
Currency
Reported
excluding
Currency &
Acquisitions
8,080
$
5,583
$
2,497
$
187
$
2,310
$
-
$
2,310
$
European Union
7,260
$
4,965
$
2,295
$
8.8%
0.7%
0.7%
4,603
2,591
2,012
55
1,957
-
1,957
EEMA
4,125
2,236
1,889
6.5%
3.6%
3.6%
5,146
2,210
2,936
222
2,714
3
2,711
Asia
3,903
1,780
2,123
38.3%
27.8%
27.7%
2,405
1,577
828
30
798
-
798
Latin America & Canada
2,095
1,341
754
9.8%
5.8%
5.8%
20,234
$
11,961
$
8,273
$
494
$
7,779
$
3
$
7,776
$
PMI Total
17,383
$
10,322
$
7,061
$
17.2%
10.2%
10.1%
Reported
Operating
Companies
Income
Less
Currency
Reported
Operating
Companies
Income
excluding
Currency
Less
Acquisi-
tions
Reported
Operating
Companies
Income
excluding
Currency &
Acquisitions
Reported
Operating
Companies
Income
Reported
Reported
excluding
Currency
Reported
excluding
Currency &
Acquisitions
1,280
$
152
$
1,128
$
(1)
$
1,129
$
European Union
1,105
$
15.8%
2.1%
2.2%
835
11
824
-
824
EEMA
786
6.2%
4.8%
4.8%
1,398
145
1,253
1
1,252
Asia
845
65.4%
48.3%
48.2%
268
9
259
-
259
Latin America & Canada
238
12.6%
8.8%
8.8%
3,781
$
317
$
3,464
$
-
$
3,464
$
PMI Total
2,974
$
27.1%
16.5%
16.5%
2011
2010
% Change in Reported Operating
Companies Income
2011
2010
% Change in Reported Net Revenues
excluding Excise Taxes |
 31
PHILIP MORRIS INTERNATIONAL INC. and Subsidiaries
Reconciliation of Non-GAAP Measures
Reconciliation of Reported Operating Companies Income to Adjusted Operating
Companies Income & Reconciliation of Adjusted Operating Companies Income
Margin, excluding Currency and Acquisitions For the Quarters Ended June
30, ($ in millions)
(Unaudited)
(a) For the calculation of net revenues excluding excise taxes, currency and
acquisitions, refer to previous slide Reported
Operating
Companies
Income
Less
Asset
Impairment &
Exit Costs
Adjusted
Operating
Companies
Income
Less
Currency
Adjusted
Operating
Companies
Income
excluding
Currency
Less
Acquisi-
tions
Adjusted
Operating
Companies
Income
excluding
Currency &
Acquisitions
Reported
Operating
Companies
Income
Less
Asset Impairment &
Exit Costs
Adjusted
Operating
Companies
Income
Adjusted
Adjusted
excluding
Currency
Adjusted
excluding
Currency &
Acquisitions
1,280
$
(1)
$
1,281
$
152
$
1,129
$
(1)
$
1,130
$
European Union
1,105
$
-
$
1,105
$
15.9%
2.2%
2.3%
835
-
835
11
824
-
824
EEMA
786
-
786
6.2%
4.8%
4.8%
1,398
-
1,398
145
1,253
1
1,252
Asia
845
-
845
65.4%
48.3%
48.2%
268
-
268
9
259
-
259
Latin America & Canada
238
-
238
12.6%
8.8%
8.8%
3,781
$
(1)
$
3,782
$
317
$
3,465
$
-
$
3,465
$
PMI Total
2,974
$
-
$
2,974
$
27.2%
16.5%
16.5%
% Points Change
Adjusted
Operating
Companies
Income
excluding
Currency
Net Revenues
excluding
Excise Taxes &
Currency
(a)
Adjusted
Operating
Companies
Income
Margin
excluding
Currency
Adjusted
Operating
Companies
Income
excluding
Currency &
Acquisitions
Net Revenues
excluding
Excise Taxes,
Currency &
Acquisitions
(a)
Adjusted
Operating
Companies
Income Margin
excluding
Currency &
Acquisitions
Adjusted
Operating
Companies
Income
Net Revenues
excluding Excise
Taxes
(a)
Adjusted
Operating
Companies
Income
Margin
Adjusted
Operating
Companies
Income
Margin
excluding
Currency
Adjusted
Operating
Companies
Income Margin
excluding
Currency &
Acquisitions
1,129
$
2,310
$
48.9%
1,130
$
2,310
$
48.9%
European Union
1,105
$
2,295
$
48.1%
0.8
0.8
824
1,957
42.1%
824
1,957
42.1%
EEMA
786
1,889
41.6%
0.5
0.5
1,253
2,714
46.2%
1,252
2,711
46.2%
Asia
845
2,123
39.8%
6.4
6.4
259
798
32.5%
259
798
32.5%
Latin America & Canada
238
754
31.6%
0.9
0.9
3,465
$
7,779
$
44.5%
3,465
$
7,776
$
44.6%
PMI Total
2,974
$
7,061
$
42.1%
2.4
2.5
% Change in Adjusted Operating
Companies Income
2010
2011
2010
2011 |
 32
PHILIP MORRIS INTERNATIONAL INC. and Subsidiaries
Reconciliation of Non-GAAP Measures
Reconciliation of Reported Diluted EPS to Adjusted Diluted EPS and Adjusted
Diluted EPS, excluding Currency For the Quarters Ended June 30,
(Unaudited)
2011
2010
% Change
Reported Diluted EPS
1.35
$
1.07
$
26.2%
Adjustments:
Asset impairment and exit costs
-
-
Tax items
(0.01)
(0.07)
Adjusted Diluted EPS
1.34
$
1.00
$
34.0%
Less:
Currency impact
0.13
Adjusted Diluted EPS, excluding Currency
1.21
$
1.00
$
21.0% |
 For
the Quarters Ended For the Six Months Ended
June 30,
June 30,
2011
2010
% Change
2011
2010
% Change
Net
cash
provided
by
operating
activities
(a)
4,120
$
3,465
$
18.9%
6,515
$
5,439
$
19.8%
Less:
Capital expenditures
186
169
345
319
Free cash flow
3,934
$
3,296
$
19.4%
6,170
$
5,120
$
20.5%
Less:
Currency impact
236
264
Free cash flow, excluding currency
3,698
$
3,296
$
12.2%
5,906
$
5,120
$
15.4%
33
PHILIP MORRIS INTERNATIONAL INC. and Subsidiaries
Reconciliation of Non-GAAP Measures
Reconciliation
of
Operating
Cash
Flow
to
Free
Cash
Flow
and
Free
Cash
Flow,
excluding
Currency
For the Quarters and Six Months Ended June 30,
($ in millions)
(Unaudited)
(a) Operating Cash Flow |
 34
PHILIP MORRIS INTERNATIONAL INC. and Subsidiaries
Reconciliation of Non-GAAP Measures
Adjustments for the Impact of Currency and Acquisitions
For the Six Months Ended June 30,
($ in millions)
(Unaudited)
(a) Includes the business combination in the Philippines ($105)
(b) Includes the business combination in the Philippines ($23)
Reported Net
Revenues
Less
Excise
Taxes
Reported Net
Revenues
excluding
Excise Taxes
Less
Currency
Reported Net
Revenues
excluding
Excise Taxes &
Currency
Less
Acquisi-
tions
Reported Net
Revenues
excluding
Excise Taxes,
Currency &
Acquisitions
Reported
Net
Revenues
Less
Excise
Taxes
Reported Net
Revenues
excluding
Excise Taxes
Reported
Reported
excluding
Currency
Reported
excluding
Currency &
Acquisitions
14,495
$
9,997
$
4,498
$
81
$
4,417
$
-
$
4,417
$
European Union
14,008
$
9,529
$
4,479
$
0.4%
(1.4)%
(1.4)%
8,274
4,575
3,699
26
3,673
-
3,673
EEMA
7,481
3,846
3,635
1.8%
1.0%
1.0%
9,434
4,175
5,259
350
4,909
108
(a)
4,801
Asia
7,465
3,469
3,996
31.6%
22.8%
20.1%
4,561
2,953
1,608
54
1,554
-
1,554
Latin America & Canada
4,016
2,569
1,447
11.1%
7.4%
7.4%
36,764
$
21,700
$
15,064
$
511
$
14,553
$
108
$
14,445
$
PMI Total
32,970
$
19,413
$
13,557
$
11.1%
7.3%
6.6%
Reported
Operating
Companies
Income
Less
Currency
Reported
Operating
Companies
Income
excluding
Currency
Less
Acquisi-
tions
Reported
Operating
Companies
Income
excluding
Currency &
Acquisitions
Reported
Operating
Companies
Income
Reported
Reported
excluding
Currency
Reported
excluding
Currency &
Acquisitions
2,286
$
131
$
2,155
$
(1)
$
2,156
$
European Union
2,167
$
5.5%
(0.6)%
(0.5)%
1,557
(1)
1,558
-
1,558
EEMA
1,556
0.1%
0.1%
0.1%
2,491
247
2,244
24
(b)
2,220
Asia
1,569
58.8%
43.0%
41.5%
519
10
509
-
509
Latin America & Canada
455
14.1%
11.9%
11.9%
6,853
$
387
$
6,466
$
23
$
6,443
$
PMI Total
5,747
$
19.2%
12.5%
12.1%
% Change in Reported Net Revenues
excluding Excise Taxes
2011
2010
% Change in Reported Operating
Companies Income
2011
2010 |
 35
PHILIP MORRIS INTERNATIONAL INC. and Subsidiaries
Reconciliation of Non-GAAP Measures
Reconciliation of Reported Operating Companies Income to Adjusted Operating
Companies Income & Reconciliation of Adjusted Operating Companies Income
Margin, excluding Currency and Acquisitions For the Six Months Ended June
30, ($ in millions)
(Unaudited)
(a) Includes the business combination in the Philippines ($23)
(b) For the calculation of net revenues excluding excise taxes, currency and
acquisitions, refer to previous slide Reported
Operating
Companies
Income
Less
Asset
Impairment &
Exit Costs
Adjusted
Operating
Companies
Income
Less
Currency
Adjusted
Operating
Companies
Income
excluding
Currency
Less
Acquisi-
tions
Adjusted
Operating
Companies
Income
excluding
Currency &
Acquisitions
Reported
Operating
Companies
Income
Less
Asset Impairment &
Exit Costs
Adjusted
Operating
Companies
Income
Adjusted
Adjusted
excluding
Currency
Adjusted
excluding
Currency &
Acquisitions
2,286
$
(12)
$
2,298
$
131
$
2,167
$
(1)
$
2,168
$
European Union
2,167
$
-
$
2,167
$
6.0%
-
%
-
%
1,557
(2)
1,559
(1)
1,560
-
1,560
EEMA
1,556
-
1,556
0.2%
0.3%
0.3%
2,491
(2)
2,493
247
2,246
24
(a)
2,222
Asia
1,569
-
1,569
58.9%
43.1%
41.6%
519
(1)
520
10
510
-
510
Latin America & Canada
455
-
455
14.3%
12.1%
12.1%
6,853
$
(17)
$
6,870
$
387
$
6,483
$
23
$
6,460
$
PMI Total
5,747
$
-
$
5,747
$
19.5%
12.8%
12.4%
% Points Change
Adjusted
Operating
Companies
Income
excluding
Currency
Net Revenues
excluding
Excise Taxes &
Currency
(b)
Adjusted
Operating
Companies
Income
Margin
excluding
Currency
Adjusted
Operating
Companies
Income
excluding
Currency &
Acquisitions
Net Revenues
excluding
Excise Taxes,
Currency &
Acquisitions
(b)
Adjusted
Operating
Companies
Income Margin
excluding
Currency &
Acquisitions
Adjusted
Operating
Companies
Income
Net Revenues
excluding Excise
Taxes
(b)
Adjusted
Operating
Companies
Income
Margin
Adjusted
Operating
Companies
Income
Margin
excluding
Currency
Adjusted
Operating
Companies
Income Margin
excluding
Currency &
Acquisitions
2,167
$
4,417
$
49.1%
2,168
$
4,417
$
49.1%
European Union
2,167
$
4,479
$
48.4%
0.7
0.7
1,560
3,673
42.5%
1,560
3,673
42.5%
EEMA
1,556
3,635
42.8%
(0.3)
(0.3)
2,246
4,909
45.8%
2,222
4,801
46.3%
Asia
1,569
3,996
39.3%
6.5
7.0
510
1,554
32.8%
510
1,554
32.8%
Latin America & Canada
455
1,447
31.4%
1.4
1.4
6,483
$
14,553
$
44.5%
6,460
$
14,445
$
44.7%
PMI Total
5,747
$
13,557
$
42.4%
2.1
2.3
2010
2011
2010
2011
% Change in Adjusted Operating
Companies Income |
 36
PHILIP MORRIS INTERNATIONAL INC. and Subsidiaries
Reconciliation of Non-GAAP Measures
Reconciliation of Reported Diluted EPS to Adjusted Diluted EPS
For the Year Ended December 31,
(Unaudited)
2010
Reported Diluted EPS
3.92
$
Adjustments:
Tax items
(0.07)
Asset impairment and exit costs
0.02
Adjusted Diluted EPS
3.87
$
|
 2011
Second-Quarter Results July 21, 2011 |