Attached files
| file | filename |
|---|---|
| 8-K - 8-K - OM GROUP INC | d8k.htm |
| EX-2.1 - EX-2.1 - OM GROUP INC | dex21.htm |
| EX-99.2 - EX-99.2 - OM GROUP INC | dex992.htm |
| EX-10.1 - EX 10.1 - OM GROUP INC | dex101.htm |
Exhibit 99.1

Historical Financials of VAC
The following summary financials are based on VAC’s financial statements prepared under IFRS.
| Summary Historical Financial Data |
FYE | FYE | FYE | FYE | Q1 | LTM | ||||||||||||||||||||||||
| (Euros in millions) |
2007 | 2008 | 2009 | 2010 | Q1-10 | Q1-11 | Q1-11 | |||||||||||||||||||||||
| Operating Performance |
||||||||||||||||||||||||||||||
| Revenues |
||||||||||||||||||||||||||||||
|
|
Materials & Parts |
€ 139 | € 123 | € 82 | € 117 | € 26 | € 41 | € 132 | ||||||||||||||||||||||
| Cores & Components |
121 | 108 | 87 | 138 | 29 | 44 | 153 | |||||||||||||||||||||||
| Permanent Magnets |
82 | 93 | 66 | 91 | 20 | 32 | 104 | |||||||||||||||||||||||
| Total Revenues |
€ 342 | € 324 | € 235 | € 346 | € 74 | € 117 | € 389 | |||||||||||||||||||||||
| % Growth |
12.2% | (5.2%) | (27.6%) | 47.5% | 26.6% | 57.7% | 55.4% | |||||||||||||||||||||||
| Cost of materials |
(117) | (101) | (54) | (115) | (20) | (38) | (134) | |||||||||||||||||||||||
| Change in Inventories |
9 | 8 | (23) | 19 | (1) | 4 | 24 | |||||||||||||||||||||||
| Gross Profit |
€ 234 | € 231 | € 158 | € 250 | € 53 | € 83 | € 279 | |||||||||||||||||||||||
| % Margin |
68.4% | 71.2% | 67.4% | 72.3% | 72.0% | 70.8% | 71.7% | |||||||||||||||||||||||
| Other operating income |
10 | 23 | 16 | 24 | 3 | 3 | 24 | |||||||||||||||||||||||
| Personnel expenses |
(114) | (112) | (94) | (125) | (26) | (37) | (136) | |||||||||||||||||||||||
| Other operating expenses |
(72) | (80) | (63) | (85) | (19) | (24) | (90) | |||||||||||||||||||||||
| Depreciation and amortization |
(22) | (24) | (24) | (24) | (6) | (6) | (24) | |||||||||||||||||||||||
| Impairment on goodwill |
- | (27) | (67) | - | - | - | - | |||||||||||||||||||||||
| Total Operating profit (loss) |
€ 36 | € 7 | (€ 74 | ) | € 40 | € 5 | € 19 | € 54 | ||||||||||||||||||||||
| % Margin |
10.6% | 2.2% | (31.5%) | 11.7% | 6.7% | 16.2% | 14.0% | |||||||||||||||||||||||
| Financial Income |
0 | 1 | 1 | 1 | ||||||||||||||||||||||||||
| Financial expenses |
(32) | (34) | (29) | (24) | ||||||||||||||||||||||||||
| Financial result |
(32) | (33) | (28) | (23) | (7) | (5) | (21) | |||||||||||||||||||||||
| Taxes |
4 | (6) | 7 | (3) | 0 | (2) | (5) | |||||||||||||||||||||||
| Consolidated Profit/Loss for Period |
€ 8 | (€ 32 | ) | (€ 95 | ) | € 15 | (€ 1 | ) | € 12 | € 28 | ||||||||||||||||||||
| % Margin |
2.5% | (9.9%) | (40.4%) | 4.2% | (1.4%) | 10.7% | 7.2% | |||||||||||||||||||||||
| Adjusted EBITDA (1) |
||||||||||||||||||||||||||||||
| Materials & Parts |
32 | 27 | 8 | 27 | 4 | 11 | 34 | |||||||||||||||||||||||
| Cores & Components |
12 | 14 | 7 | 22 | 5 | 6 | 23 | |||||||||||||||||||||||
| Permanent Magnets |
14 | 20 | 4 | 12 | 2 | 8 | 18 | |||||||||||||||||||||||
| Adjusted EBITDA |
€ 58 | € 61 | € 19 | € 61 | € 11 | € 25 | € 75 | |||||||||||||||||||||||
| % Margin |
17.0% | 18.8% | 8.1% | 17.6% | 14.9% | 21.4% | 19.3% | |||||||||||||||||||||||
| Pro Forma Expenses |
||||||||||||||||||||||||||||||
| Development Costs |
(2) | (2) | (2) | (2) | (0) | (0) | (2) | |||||||||||||||||||||||
| Pension Interest |
(5) | (5) | (5) | (5) | (2) | (2) | (5) | |||||||||||||||||||||||
| Pro Forma Adjusted EBITDA |
€ 51 | € 54 | € 12 | € 54 | € 9 | € 23 | € 68 | |||||||||||||||||||||||
| % Margin |
14.9% | 16.6% | 5.0% | 15.5% | 11.6% | 19.3% | 17.4% | |||||||||||||||||||||||
| Cash from Operations |
€ 43 | € 39 | € 26 | € 35 | € 6 | € 7 | € 36 | |||||||||||||||||||||||
| Capital Expenditures |
14 | 14 | 10 | 13 | 2 | 4 | 15 | |||||||||||||||||||||||
| (1) | EBITDA adjustments include the add-back of goodwill impairment charges and other minor non-operational one-time effects or restructuring costs (e.g. tax reimbursement, release of bonus provision). |
| CONFIDENTIAL | Page 65 |
VAC Management Discussion & Analysis
Three Months Ended March 31, 2011 Compared to Three Months Ended March 31, 2010
| ¢ | Sales increased year-over-year by 58.0% from €74 million to €117 million primarily as the result of positive developments in all three divisions, especially for the Automation & Drives Energy Conversion & Distribution, Electronic Article Surveillance & Communications and Automotive market segments |
| ¢ | Adjusted EBITDA increased by €14 million year-over-year and margins increased from 14.9% in Q1-2010 to 21.4% in Q1-2011. The year-over-year increase was attributable to strong top-line performance and increased fixed cost absorption and consumption of raw materials below market prices |
Twelve Months Ended December 31, 2010 Compared to Twelve Months Ended December 31, 2009
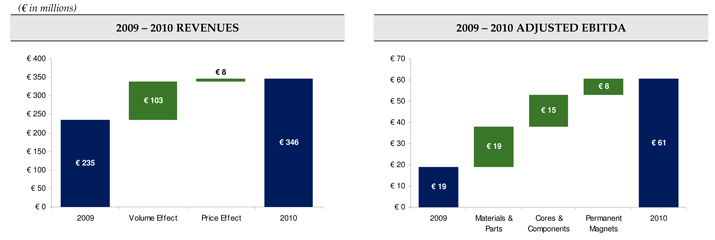
| ¢ | 2010 sales increased to €346 million from €235 million in 2009, a 47.2% year-over-year improvement. 2010 sales also exceeded pre-crisis total sales in 2007 and 2008 |
| ¢ | Margins partially recovered in 2010 due to difficult pass-through of raw material price increases. The stronger sales recovery in 2010 was mainly driven by higher volumes from product innovation and a return of confidence in various end-user markets |
| ¢ | Key growth markets included Energy Conversion & Distribution, Automotive and Automation & Drives |
| ¢ | Cores & Components outperformed, mainly driven by strong performance in Energy Conversion & Distribution |
| ¢ | EBITDA in Materials & Parts fully rebounded in 2010, after being impacted by the global economic downturn in 2009. The margin impact on EBITDA in 2010 was more than offset by a strong recovery of EBITDA in Cores & Components, which exceeded pre-crisis levels on the basis of its strong performance in Energy Conservation & Distribution |
| ¢ | A €19 million increase in working capital in 2010 is due to (i) restocking resulting from the recovery in volumes and (ii) increase in raw material prices in the course of the economic recovery |
| CONFIDENTIAL | Page 66 |
Twelve Months Ended December 31, 2009 Compared to Twelve Months Ended December 31, 2008
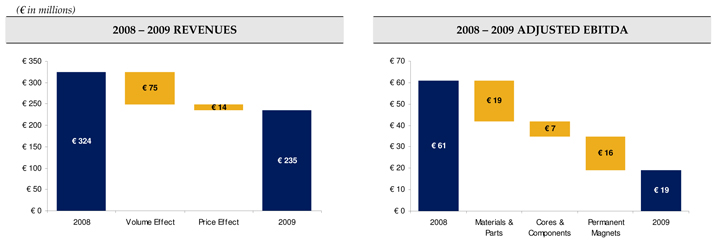
| ¢ | 2009 sales declined by 27.6% to €235 million from €324 million. The decrease was mainly driven by declining volumes due to the global economic downturn. Changes in raw material prices were mostly passed onto customers by ratchet clauses or new price agreements |
| ¢ | After experiencing a sales and margin uplift in 2008, both sales and margins in Permanent Magnets contracted significantly in 2009 due to an adverse shift in product mix and fast-rising raw material prices. |
| ¢ | During the global recession in 2009, inventories were reduced to improve cash flow and adjust to lower sales levels. In 2009, the operating cash flow was positively impacted by a favorable working capital development. The positive change in trade working capital resulted from (i) destocking of major raw materials (€8 million) and (i) higher stock provisions by €3 million compared to 2008. |
| ¢ | Stock provisions increased in 2009 in light of the decreased customer demand and respective low consumption of inventories during the economic downturn |
| ¢ | Inventory destocking contributed to positive operating cash flow in 2009 |
| CONFIDENTIAL | Page 67 |