Attached files
| file | filename |
|---|---|
| EX-23 - EXHIBIT 23 - OM GROUP INC | exhibit23.htm |
| EX-32.1 - EXHIBIT 32.1 - OM GROUP INC | exhibit32.htm |
| EX-24 - EXHIBIT 24 - OM GROUP INC | exhibit24.htm |
| EX-21 - EXHIBIT 21 - OM GROUP INC | exhibit21.htm |
| EX-31.1 - EXHIBIT 31.1 - OM GROUP INC | exhibit311.htm |
| EX-32 - EXHIBIT 32 - OM GROUP INC | exhibit312.htm |
| EX-10.46 - EXHIBIT 10.46 - OM GROUP INC | exhibit1046.htm |
| EXCEL - IDEA: XBRL DOCUMENT - OM GROUP INC | Financial_Report.xls |
UNITED STATES SECURITIES AND EXCHANGE COMMISSION
Washington, D.C. 20549
FORM 10-K
x | ANNUAL REPORT PURSUANT TO SECTION 13 OR 15(d) OF THE SECURITIES EXCHANGE ACT OF 1934 | |
For the fiscal year ended December 31, 2014 | Commission file number 001-12515 | |
OR
¨ | TRANSITION REPORT PURSUANT TO SECTION 13 OR 15(d) OF THE SECURITIES EXCHANGE ACT OF 1934 | |
OM GROUP, INC.
(Exact name of Registrant as specified in its charter)
Delaware (State or other jurisdiction of incorporation or organization) | 52-1736882 (I.R.S. Employer Identification No.) | |
950 Main Avenue, Suite 1300, Cleveland, Ohio (Address of principal executive offices) | 44113-7210 (Zip Code) | |
216-781-0083
Registrant’s telephone number, including area code
Securities registered pursuant to Section 12(b) of the Act:
Title of each class | Name of each exchange on which registered | |
Common Stock, par value $0.01 per share | New York Stock Exchange | |
Securities registered pursuant to Section 12(g) of the Act:
None
Indicate by check mark if the registrant is a well-known seasoned issuer, as defined in Rule 405 of the Securities Act.
Yes x No ¨
Indicate by check mark if the registrant is not required to file reports pursuant to Section 13 or Section 15(d) of the Act.
Yes ¨ No x
Indicate by check mark whether the registrant (1) has filed all reports required to be filed by Section 13 or 15(d) of the Securities Exchange Act of 1934 during the preceding 12 months (or for such shorter period that the registrant was required to file such reports), and (2) has been subject to such filing requirements for the past 90 days.
Yes x No ¨
Indicate by check mark whether the registrant has submitted electronically and posted on its corporate Web site, if any, every Interactive Data File required to be submitted and posted pursuant to Rule 405 of Regulation S-T during the preceding 12 months (or for such shorter period that the registrant was required to submit and post such files). Yes x No ¨
Indicate by check mark if disclosure of delinquent filers pursuant to Item 405 of Regulation S-K is not contained herein, and will not be contained, to the best of the Registrant’s knowledge, in definitive proxy or information statements incorporated by reference in Part III of this Form 10-K or any amendment to this Form 10-K. ¨
Indicate by check mark whether the registrant is a large accelerated filer, an accelerated filer, a non-accelerated filer, or a smaller reporting company. See the definitions of “large accelerated filer,” “accelerated filer” and “smaller reporting company” in Rule 12b-2 of the Exchange Act. (Check one):
Large accelerated filer x | Accelerated filer o | Non-accelerated filer o | Smaller reporting company o |
(Do not check if a smaller reporting company)
Indicate by check mark whether the registrant is a shell company (as defined in Rule 12b-2 of Act). Yes ¨ No x
The aggregate market value of Common Stock, par value $.01 per share, held by nonaffiliates (based upon the closing sale price on the NYSE) on June 30, 2014 was approximately $1,010.6 million.
As of February 27, 2015 there were 30,240,512 shares of Common Stock, par value $.01 per share, outstanding.
DOCUMENTS INCORPORATED BY REFERENCE
Portions of the Company’s Proxy Statement for the 2015 Annual Meeting of Stockholders to be held on May 12, 2015 are incorporated by reference into Part III of this Annual Report on Form 10-K.
OM Group, Inc.
TABLE OF CONTENTS
PART I
Item 1. Business
Overview
OM Group, Inc. (the “Company”, “we”, “our”, “us”) is a technology-driven industrial company serving attractive global markets, including automotive systems, electronic devices, aerospace and defense, industrial and medical. We use innovative technologies to address customers' complex applications and demanding requirements. Our strategy is to grow organically through product and application innovation and new market and customer development, to grow strategically through complementary acquisitions to build-out our growth platforms, and to maximize total stockholder returns through a combination of business growth, financial discipline, optimal deployment of capital and continued operational excellence. Our objective is to deliver sustainable, profitable growth and create long-term stockholder value. The Company is a Delaware Corporation and was formed in 1991.
We operate three strategic business platforms: Magnetic Technologies, Battery Technologies, and Specialty Chemicals. We also have limited continuing involvement in our Advanced Materials business through transition agreements with the buyer of that business as described below. Further discussion of and financial information for these segments, including external sales, operating profit and total assets, is contained in Note 17 to the accompanying consolidated financial statements of this Annual Report on Form 10-K.
On February 18, 2015, we announced a wide-ranging set of competitive repositioning and cost optimization opportunities throughout the enterprise that are expected to improve our ability to serve customers, better compete in global markets and deliver stronger financial performance. The opportunities include headcount reductions across the enterprise; site consolidations; relocation of certain operations to improve our cost structure and better serve customers; better alignment of various research and development, marketing and technical activities with customers’ next generation products and applications; and further corporate cost reductions.
Over the next three years, we expect to incur total cash expenses related to these opportunities of approximately $50 - $65 million. We also anticipate annualized savings of $30 - $40 million by the end of 2017, which are expected to ramp up starting in late 2015. Certain of these opportunities will take place in Europe and are subject to negotiations with employee works councils and unions, which could impact the timing and scope of the expected expenses and savings. We expect that the cost of these opportunities will not have a material impact on our financial position or liquidity and will be funded by operating cash flows and borrowing on our revolving line of credit when necessary.
On November 24, 2014, we completed the acquisition of Ener-Tek International, Inc., which operates under the brand name Yardney Technical Products ("Yardney"), and now operates as a part of our Battery Technologies business. Based in East Greenwich, Rhode Island, Yardney is a designer, developer and manufacturer of high-performance lithium-ion and silver-zinc cells and batteries for niche applications in the defense and aerospace markets. We funded the $24.6 million acquisition price through existing cash balances.
On May 31, 2013, we completed the divestiture of our Ultra Pure Chemicals ("UPC") business for cash proceeds of $63 million. The results of operations of the UPC business are reflected as discontinued operations in the accompanying unaudited condensed consolidated financial statements for all periods presented. A loss, of $9.8 million, net of tax, was recorded on the divestiture. We used the proceeds of the UPC divestiture, along with cash on hand, to repay our then-existing indebtedness.
On March 29, 2013, we completed the divestiture of our cobalt-based Advanced Materials business and the transfer of our 55% equity interests in the Democratic Republic of Congo-based joint venture known as GTL to the joint venture partners. In connection with this transaction, we received net proceeds of $328.7 million, $302.1 million of which was used, together with cash on hand, to repay approximately $346.0 million of our Term B debt. A loss of $111.6 million was recorded on the divestiture. The sale agreement for the downstream portion of the business also provides for potential future additional cash consideration of up to $110.0 million based on the business achieving certain revenue targets over a period of three years. Using our projected trends of cobalt prices and volumes, it is not probable that the business will meet the revenue targets, and no value was assigned to the potential future cash consideration while calculating the loss at the time of the divestiture or at December 31, 2013 and 2014.
The Company consists of the following segments:
Magnetic Technologies segment
The Magnetic Technologies segment develops, manufactures and distributes high-performance, industrial-use magnetic materials and related products with differentiated magnetic and/or other performance properties. A large majority of our products are specially designed and manufactured for specific customers. We offer a wide range of magnetic technology products, from magnetically soft products to some of the most powerful permanent magnets in the world. Our products are sold into a wide array of end markets, including automotive systems, electrical installation technology, industrial, retail and renewable energy. We sell the majority of our products directly to original equipment manufacturers who incorporate them into their sub-assemblies and final assemblies.
In February 2015, the Magnetic Technologies business entered into negotiations with its employee works council in Germany regarding proposed changes to improve competitiveness and performance. The opportunities are intended to improve the business's ability to serve customers, better compete and grow in global markets and improve financial performance.
At December 31, 2014 and 2013, backlog was $77.1 million and $97.9 million, respectively. The decrease from 2013 to 2014 is partially due to foreign currency. The entire December 2014 backlog is expected to be converted into sales during the next twelve months.
We believe we are a market leader for many of our applications within our primary geographic markets; however, the competitive landscape remains fragmented with many competitors, and no single competitor has significant market share and geographic coverage.
Magnetic Technologies uses a variety of raw material inputs, including dysprosium and neodymium, to produce its products. The supply of these rare earths is currently concentrated in China and has been constrained at times, leading to price volatility. Rare earth prices declined moderately in 2014.
The segment is focused on developing and leveraging its substantial patent portfolio and applications expertise to develop new products, enter new markets and generally increase market share, and on competitive repositioning and cost optimization opportunities.
Battery Technologies segment
The Battery Technologies segment provides advanced batteries, battery management systems, and energetic devices primarily for defense, space and medical markets. We sell these products directly to customers who incorporate them into sub-assemblies. The business is also developing and commercializing products, technologies and applications for emerging markets, including commercial aerospace, alternative energy storage and oil and gas.
At December 31, 2014, backlog was $156.5 million as compared to $135.2 million at December 31, 2013. The increase from 2013 to 2014 is partially due to the Yardney acquisition in November 2014. At December 31, 2014, $19.4 million of the backlog is expected to be converted to sales in periods after 2015.
We believe we are a market leader for defense and space applications in the U.S. due to our innovation, reliability, broad applications and chemistries expertise and long-standing relationships with key customers. There are few competitors qualified to supply into our principal markets. The segment is a prime contractor or subcontractor for numerous U.S. Government programs, including U.S. Government customers, and its top three customers account for approximately half of its sales. Please see "Risk Factors" for important information regarding U.S. government contracts and programs.
The segment is focused on developing new battery chemistries, expanding the markets it serves, developing products and technologies for emerging markets and applications and competitive repositioning and cost optimization opportunities.
Specialty Chemicals segment
The Specialty Chemicals segment develops, produces and supplies chemicals for electronic applications; industrial applications including coatings, composites and tire; and photomasks used by customers to produce semiconductors and related products. The majority of our products are sold directly to customers. Orders are filled quickly, and backlog is not material in this segment.
We participate in fragmented markets and believe we are a market leader for certain of our products for electronic
2
device and coatings applications. Our customer base in this segment requires significant technical support and high-quality formulations and products that meet stringent requirements and quality specifications. New products and customers often require a long qualification process.
We are focused on providing innovative products that meet specific customer requirements, expanding our geographical reach and competitive repositioning and cost optimization opportunities.
Advanced Materials segment
As discussed above, we completed the divestiture of this business in March 2013. Through the date of sale, this business manufactured inorganic products using unrefined cobalt and other metals, for the mobile energy storage, renewable energy, automotive systems, construction and mining, and industrial end markets. It also had a 55% interest in GTL.
Following the sale, to assist in the transition of the downstream business, we entered into two agreements with the buyer pursuant to which: (1) We act as intermediary in a supply agreement between GTL and the buyer, in back-to-back arrangements for a period of at least two years. We met the cobalt feed supply target under that agreement in October 2014 and the supply agreement will terminate in March 2015. (2) We also served as the U.S. distributor for refined cobalt products in primarily back-to-back arrangements until December 31, 2013.
Raw Materials
We use a variety of raw materials purchased from a broad supplier base. The primary raw materials used by Magnetic Technologies are nickel, cobalt and certain rare earth materials, primarily alloys containing dysprosium and neodymium. Multiple suppliers are generally available for each of these materials; however, some raw materials are sourced from a single supplier. Rare earth materials are critical to the production of certain Magnetic Technologies products and currently are available from a limited number of suppliers, primarily in China. Temporary shortages of raw materials may occasionally occur and cause short-term price increases. Historically, these shortages have not resulted in lack of availability of raw materials. We also use certain raw materials that must be qualified prior to being used in production. For these raw materials, changes in suppliers may result in disruption of production, forward purchasing of contract requirements or re-qualification expenses.
We generally pass through rare earth and certain other raw material prices to our customers in our selling prices. During periods of rapidly changing prices of key raw materials, there may be price lags that can positively or negatively impact our short-term profitability and cash flow from operations. Declines in the selling prices of our finished goods, which can result from decreases in the market price of raw materials and the timing of our pass-through of certain raw materials costs in our selling prices, can result in our inventory carrying value being written down to a lower market value.
Foreign Operations
We have operations in North America, Europe and Asia, with the majority of our operations located outside of the United States. We market our products worldwide and purchase important raw materials from suppliers located outside of the United States. Some of our sales, raw material prices, operating expenses and income taxes are denominated in local currencies. Accordingly, fluctuations in currency prices affect our operating results. The primary currencies for which we have foreign currency rate exposure are the European Union Euro, Taiwanese Dollar, Malaysian Ringgit, Singapore Dollar, British Pound Sterling, and the Chinese Renminbi. Please see "Risk Factors" for additional information regarding our foreign operations and Note 17 to the accompanying consolidated financial statements to this Annual Report on Form 10-K for financial information about geographic areas.
Research and Development
Our research and development programs are part of our strategy to grow the business through new products, applications and markets. Research and development expenses were approximately $26.0 million in 2014, $26.3 million in 2013 and $32.2 million in 2012. The decrease from 2012 to 2013 is primarily due to the sale of the cobalt business in 2013. These amounts do not include development and application engineering costs incurred in conjunction with fulfilling customer orders and executing customer projects.
Patents and Other Intellectual Property
We hold patents, registered primarily in Europe and the United States, relating to the formulation, content, manufacturing, processing and use of certain products, materials and chemistries. We also possess other intellectual property, including trademarks, tradenames, know-how, developed technology and trade secrets. Although we believe these intellectual property rights are important in the operations of our specific businesses, we do not consider any
3
single patent, trademark, tradename, know-how, developed technology or trade secret to be material to our business as a whole.
Environmental Matters
We are subject to a variety of environmental and pollution control laws and regulations in the jurisdictions in which we operate. As is the case with other companies in similar industries, we face exposure from actual and potential claims and legal proceedings involving environmental matters. A number of factors affect the cost of environmental remediation, including the determination of the extent of contamination, the length of time the remediation may require, the complexity of environmental regulations and the continuing improvements in remediation techniques. Taking these factors into consideration, we estimate the undiscounted costs of remediation, which will be incurred over several years, and accrue an amount consistent with the estimates of these costs when it is probable that a liability has been incurred. We continually evaluate the adequacy of our reserves and adjust the reserves when determined to be appropriate. Ongoing environmental compliance costs, which are expensed as incurred, were approximately $7.9 million in 2014 and $8.0 million in 2013. Ongoing environmental compliance costs include permitting, inspections, pollution control system operations and environmental, health and safety personnel. We anticipate that we will continue to incur compliance costs for the foreseeable future; however, the amount and timing of future environmental expenditures could vary significantly. We believe that our ultimate aggregate cost of environmental remediation as well as liability under environmental protection laws will not materially adversely affect our financial condition or results of operations.
Employees
At December 31, 2014, we had approximately 6,200 full-time employees.
SEC Reports
We make available, free of charge, through our website, (www.omgi.com) our reports on Forms 10-K, 10-Q and 8-K as soon as reasonably practicable after the reports are electronically filed with the Securities and Exchange Commission. A copy of any of these documents is available in print, free of charge, to any stockholder who requests a copy, by writing to OM Group, Inc., 950 Main Avenue, Suite 1300, Cleveland, Ohio 44113-7210, USA, Attention: Investor Relations. The SEC maintains an Internet website at http://www.SEC.gov that contains the Company's annual report and proxy statements and other information. You may read and copy any materials filed with the SEC at the SEC's Public Reference Room at 100 F Street, NE, Washington DC 20549. You may obtain information on the operation of the Public Reference Room by calling the SEC at 1-800-SEC-0330.
Item 1A. Risk Factors
The following discussion of “risk factors” identifies the most significant risks that our business faces. Our business, financial condition and results of operations could be materially adversely affected by any of these risks. There may be additional risks and uncertainties not presently known to us or that we currently deem to be immaterial. These risks should be read in conjunction with the other information in this Annual Report on Form 10-K.
We are subject to risks arising from uncertainty in worldwide economic conditions.
Overall demand for our products and our profitability may be adversely affected by changes in global economic conditions, including inflationary or deflationary pressures; interest rates; access to and functioning of capital markets; consumer and business spending rates; and higher commodity, raw material and fuel costs. Current uncertainty regarding global economic conditions could lead to reduced demand for our products, reduced profitability, and increased payment delays or defaults. We are limited in our ability to reduce costs to offset the results of a prolonged or severe economic downturn in light of certain fixed costs associated with our operations.
We may not be able to respond effectively to technological changes in our industry or in our customers' products.
Our future business success will depend in part upon our ability to continue to enhance our technological capabilities, develop and market products and applications that meet changing customer needs and successfully anticipate or respond to technological changes on a cost-effective and timely basis. Moreover, technological and other changes in our customers' products or processes may render some of our products obsolete, which would reduce the demand for those products. In addition, technical advances by competitors may lead to production of less expensive or more effective products which could reduce our future sales.
We may not be able to execute upon our competitive repositioning and cost optimization opportunities.
In February 2015, we announced a wide-ranging set of competitive repositioning and cost optimization opportunities throughout the enterprise that are expected to improve our ability to serve customers, compete in global markets and
4
deliver stronger financial performance. Achieving the targeted savings from these opportunities within the expected time and cost parameters is dependent upon many factors, including negotiations with employee unions and works councils. The implementation of these opportunities could disrupt our operations. If we cannot implement these opportunities without disrupting our operations, or if the assumptions used to estimate the costs, benefits and timing of these opportunities are incorrect, our business and financial results could be adversely affected and we could achieve different results than those initially projected.
Our Battery Technologies segment maintains contracts with the United States Government and is subject to government regulations, uncertain levels of funding, modifications due to changes in customer priorities and potential termination.
U.S. Government contracts are subject to specific regulations including those related to employment practices, environmental protection, recordkeeping and accounting. These laws impact how we transact business with our governmental clients and, in some instances, impose significant costs on our business operations. If we fail to comply with any of these regulations, requirements or statutes, our existing government contracts could be terminated, and we could be temporarily suspended or even debarred from government contracting or subcontracting which would reduce our sales and profits. Non-compliance with government regulations could also result in financial penalties, disallowed payments to us, and criminal prosecution.
The funding of U.S. Government programs is subject to congressional budget authorization and appropriation processes. We cannot predict the extent to which funding will be provided as part of the budget ultimately approved by Congress. In the event that appropriations for any of our or our customers' programs are impacted, our contract or subcontract under such program may be terminated or adjusted by the U.S. Government. We also cannot predict the impact of potential changes in priorities due to sequestration, military transformation and planning and/or the nature of war-related activity on related programs.
We intend to seek additional acquisitions, but we may not be able to identify attractive targets, complete transactions, or successfully integrate acquired companies, which could adversely affect our strategy.
Our strategy anticipates growth partly through future acquisitions; however, our ability to identify and consummate any future acquisitions on terms that are favorable to us may be limited by the number of attractive acquisition targets, internal demands on our resources and our ability to obtain financing. Our success in integrating newly-acquired businesses could be compromised if we fail to retain key personnel or fail to execute effective integration plans. Integration of acquired operations may take longer, or be more costly or disruptive to our business, than originally anticipated, and it is also possible that expected synergies from future acquisitions may not materialize. We also may incur costs and divert management attention for potential acquisitions that are never consummated. Acquisitions could result in the incurrence of additional debt, costs and contingent liabilities.
There may be liabilities of the acquired companies that we fail to properly determine during the due diligence investigation and for which we, as a successor owner, may be responsible. Indemnities and warranties obtained from the seller may not fully cover the liabilities due to limitations in scope, amount, duration, financial limitations of the indemnitor or warrantor or other reasons.
Failure to retain and recruit key personnel would harm our ability to meet key objectives.
Our key personnel are critical to the management and direction of our businesses. Our future success depends, in large part, on our ability to retain key personnel and other capable management personnel. It is particularly important that we retain our senior management group that is responsible for implementing our strategy. If we were not able to attract and retain talented personnel and replace key personnel should the need arise, we may not successfully execute our strategy.
The majority of our operations are outside the United States, which subjects us to risks that may adversely affect our operating results.
Conducting business outside the U.S subjects us to risks related to the differing legal and regulatory requirements and the social, political and economic conditions of many jurisdictions. These risks include currency rate fluctuations; labor difficulties; difficulty collecting receivables and longer customer payment cycles; unexpected additional taxes, tariffs, restrictions on capital flows, restrictions on trade; and changes in foreign laws or regulatory requirements. Furthermore, unexpected devaluations of currencies in developing or emerging markets could negatively affect the value of our earnings from, and of the assets located in, those markets.
We engage in business in certain countries where the risk of public sector corruption and bribery is high. We have implemented policies and procedures and conducted employee training to assure that our operations are in compliance
5
with anti-corruption laws. If our compliance actions fail, a violation of anti-corruption laws could result in serious penalties, including criminal and civil sanctions.
We are at risk from fluctuations in the price and uncertainties in the supply of certain raw materials.
Nickel, cobalt and certain rare earth materials, primarily dysprosium and neodymium, are the primary raw materials used by Magnetic Technologies. Fluctuations in the price of rare earth materials and other raw materials have been significant in the past and we believe price fluctuations are possible in the future. Our ability to pass increases in raw material costs through to our customers by increasing the selling prices of our products is an important factor in our business. We cannot guarantee that we will be able to maintain an appropriate differential between customer prices and our costs at all times, which could lead to reduced profitability. In addition, we may be required under US generally accepted accounting policies ("US GAAP") accounting rules to write down the carrying value of our inventory when rare earth and other raw material prices decrease, which could reduce our profit margins.
Rare earth materials are available from a limited number of suppliers, primarily in China. Political instability and unexpected adverse changes in laws or regulatory requirements, including with respect to export duties, quotas or embargoes, may affect the market price and availability of raw materials, including rare earth materials, particularly from China. If a substantial interruption should occur in the supply of rare earth materials, we may not be able to obtain other sources of supply in a timely fashion or at a reasonable price. A substantial increase in the price or an interruption in supply of rare earth materials may cause our customers to look for substitute materials or processes which could lead to reduced demand for our products.
The level of returns on pension plan assets and changes in the actuarial assumptions used could adversely affect us.
Our operating results may be positively or negatively impacted by the amount of expense we record for our defined benefit pension plans. US GAAP requires that we calculate pension expense using actuarial valuations, which are dependent upon our various assumptions including estimates of expected long-term rate of return on plan assets, discount rates for future payment obligations, and the expected rate of increase in future compensation levels. Our pension expense and funding requirements may also be affected by our actual return on plan assets, and by legislation and other government regulatory actions. Changes in assumptions, laws or regulations could lead to variability in operating results and could have a material adverse impact on liquidity.
The insurance that we maintain may not fully cover all potential exposures.
We maintain property, business interruption and casualty insurance but such insurance may not cover all risks associated with the hazards of our business and is subject to limitations, including deductibles and maximum liabilities covered. We are potentially at risk if one or more of our insurance carriers fail. Additionally, severe disruptions in the domestic and global financial markets could adversely impact the ratings and survival of some insurers. In the future, we may not be able to obtain coverage at current levels, and our premiums may increase significantly on coverage that we maintain.
Changes in effective tax rates or adverse outcomes resulting from examination of our income tax returns could adversely affect us.
We are subject to income taxes in the United States and numerous jurisdictions outside of the United States. Significant judgment is required in evaluating our worldwide provision for income taxes. During the ordinary course of business, there are many transactions for which the ultimate tax determination is uncertain. For example, our effective tax rates could be adversely affected by the mix of earnings in various tax jurisdictions with different tax rates, changes in the valuation of our deferred tax assets and liabilities, the timing and amounts of funds repatriated to the U.S., and changes in tax laws, regulations and accounting principles and interpretations.
We are subject to tax audits in various jurisdictions, and such jurisdictions may assess additional income tax against us. The final determination of tax audits and any related litigation could be materially different from our historical income tax provisions and accruals, resulting in a material reduction of net income.
We are subject to stringent environmental regulation that could cause us to incur unanticipated costs or liabilities and could affect sales of our products.
We have expended, and may be required to expend in the future, substantial funds for compliance with laws and regulations relating to the storage, handling, disposal, emission and discharge of materials into the environment. In addition, we may from time to time be subjected to claims for personal injury, property damages or natural resource damages made by third parties or regulators. Given the many uncertainties involved in assessing liability for environmental claims or fully anticipating the scope of unknown contamination and remediation, our current reserves
6
may prove to be insufficient.
In addition, new or revised governmental regulations relating to health, safety and the environment may affect demand for our products. Such new or revised regulations may result in heightened concerns about the materials involved and in additional requirements being placed on the production, handling, or labeling of these materials and may increase the cost of producing them, transporting them and/or limit the use of such materials or products containing such materials, which could lead to a decrease in demand. As a result of these regulations, customers may avoid purchasing some products in favor of perceived environmentally sensitive, less hazardous or less costly alternatives.
Our financial condition could be negatively impacted if we fail to maintain sufficient cash in the United States.
The majority of our cash and cash equivalents are held outside the United States. If a substantial amount of cash were required in the United States for debt repayment, capital expenditures or other initiatives including future acquisitions, we may be required to repatriate funds to the United States with potentially unfavorable tax consequences or otherwise finance the desired activity.
We may not be able to adequately protect or enforce our intellectual property rights.
We rely on patents and trade secrets to protect our intellectual property. We attempt to protect and restrict access to our trade secrets and proprietary information, but it may be possible for a third party to obtain our information and develop similar technologies. If a competitor infringes upon our patent or other intellectual property rights, enforcing those rights could be difficult, expensive and time-consuming, making the outcome uncertain. Even if we are successful, litigation to enforce our intellectual property rights or to defend our patents against challenges could be costly and could divert management's attention.
Because we depend on several large customers for a significant portion of our revenues, our operating results could be adversely affected by any disruption of our relationship with these customers or any material adverse change in their businesses.
We depend on several large customers for a significant portion of our business. For example, sales to the top three customers in the Battery Technologies segment represented approximately half of Battery Technologies' net sales in 2013 and 2014. Any disruption in our relationships with our major customers, including any adverse modification of our agreements with them or their unwillingness or inability to perform their obligations under the agreements, could adversely affect us. In addition, any material adverse change in the financial condition of any of our major customers could have similar adverse effects on us.
We operate in very competitive industries.
We have many competitors. Some of our principal competitors have greater financial resources, greater brand recognition, or are operating in lower cost environments. Accordingly, these competitors may be better able to withstand changes in conditions within the industries in which we operate and may have significantly greater operating and financial flexibility. As a result of the competitive environment in the markets in which we operate, we currently face and will continue to face pressure on the sales prices of our products from competitors and large customers. With these pricing pressures, we may experience future reductions in the profit margins on our sales, or may be unable to pass on future raw material price or operating cost increases to our customers, or incur to a sudden loss of business.
We believe that industry consolidation among our peers could result in stronger competitors with greater financial and other resources that are better able to compete for customers.
Future indebtedness may impair our ability to operate our business successfully.
The terms of our Senior Secured Revolving Credit Facility the ("Facility") could adversely affect our ability to finance future operations or capital needs and pursue available business opportunities. This Facility contains various provisions that limit our ability to, among other things, incur additional indebtedness, make investments, or sell assets. These restrictions could place us at a competitive disadvantage against competitors. In addition future borrowings could expose us to material increases in interest expense since future borrowings will have variable interest rate provisions.
In addition, our Facility requires us to maintain specified financial ratios, satisfy certain financial condition tests, and repay our indebtedness when it becomes due. Events beyond our control, including changes in general economic and business conditions, may affect our ability to meet these requirements. We cannot assure that we will meet those requirements or that the lenders will waive any failure to meet those requirements. A breach of any of these covenants or any other restrictive covenants contained in our Facility would result in an event of default. An event of default could result in the holders of the affected indebtedness declaring all amounts outstanding, together with accrued interest, to be immediately due and payable. If we were unable to pay such amounts or secure new financing, the Facility
7
lenders could proceed against the collateral pledged to them, which is a substantial portion of our assets.
Any impairment in the value of our intangible assets, including goodwill, would negatively affect our operating results and total capitalization.
Our total assets include substantial intangible assets, including goodwill. The goodwill results from our acquisitions and represents the excess of cost over the fair value of the identifiable net assets we acquired. We assess at least annually whether there has been any impairment in the value of our intangible assets. If future operating performance at one or more of our business units were to fall significantly below current levels, if competing or alternative technologies emerge, if market conditions for acquired businesses decline, if significant and prolonged negative industry or economic trends continue, if our stock price and market capitalization declines, or if future cash flow estimates decline, we could incur under current applicable accounting rules, a non-cash charge to operating earnings for goodwill or intangibles impairment. Any determination requiring the write-off of a significant portion of unamortized intangible assets would negatively affect our results of operations and equity book value, the effect of which could be material.
Extended business interruption at our key facilities could have an adverse impact on operating results.
Our results of operations are dependent in large part upon our ability to produce and deliver products promptly upon receipt of orders. Our facilities in Germany, the United States, and Taiwan are critical to our business, and any damage to or other conditions significantly interfering with the operation of our facilities, such as an interruption of our supply lines or work stoppages, could have a material adverse effect on our business, financial condition and results of operations.
Item 1B. Unresolved Staff Comments
None.
Item 2. Properties
We believe that our plants and facilities, which are of varying ages and of different construction types, have been satisfactorily maintained, are suitable for our operations and generally provide sufficient capacity to meet the Company’s production requirements.
The number, type, location and size of our properties as of December 31, 2014, by segment, are set forth below:
Number and Nature of Facilities | Square Footage (in thousands) | |||||||||
Segment | Manufacturing | Warehouse | Sales/Service | Owned | Leased | |||||
Magnetic Technologies | 6 | 6 | 15 | 1,966 | 332 | |||||
Battery Technologies | 8 | 9 | 9 | 408 | 270 | |||||
Specialty Chemicals | 12 | 12 | 14 | 566 | 320 | |||||
Geographic Locations | Leased Facilities Expiration Dates (years) | |||||||||
Segment | North America | Europe | Asia | Minimum | Maximum | |||||
Magnetic Technologies | 1 | 4 | 10 | 1 | 8 | |||||
Battery Technologies | 5 | — | — | 1 | 7 | |||||
Specialty Chemicals | 7 | 5 | 6 | 1 | 27 | |||||
Item 3. Legal Proceedings
We are a party to various legal and administrative proceedings incidental to our business. We believe that disposition of all suits and claims related to our ordinary course of business should not in the aggregate have a material adverse effect on our financial position or results of operations.
Item 4. Mine Safety Disclosures - Not applicable.
Executive Officers of the Registrant
The information under this item is being furnished pursuant to Instruction 3 to Item 401(b) of Regulation S-K and General Instruction G of Form 10-K. Set forth below is the name, age, positions and offices held by each of our executive officers, as well as their business experience during the past five years. Dates indicate when the individual was named to or held the indicated position.
8
Joseph Scaminace - 61
Chairman and Chief Executive Officer (August 2005)
David B. Knowles - 54
President and Chief Operating Officer (April 2013)
Executive Vice President and Chief Operating Officer, Myers Industries, Inc. (June 2009 - March 2013)
Christopher M. Hix - 52
Vice President and Chief Financial Officer (January 2012)
Vice President and Chief Financial Officer, Robbins & Myers, Inc. (August 2006 - December 2011)
Valerie Gentile Sachs - 59
Vice President, General Counsel and Secretary (September 2005)
Gregory J. Griffith - 59
Vice President, Strategic Planning and Development (May 2012)
Vice President, Strategic Planning, Development and Investor Relations (February 2007)
Michael V. Johnson - 63
Vice President, Human Resources (November 2010)
Senior Vice President, Human Resources, FXI Foamex Innovations (January 2008 - October 2010)
PART II
Item 5. Market for Registrant’s Common Equity, Related Stockholder Matters and Issuer Purchases of Equity Securities
Our common stock is traded on the New York Stock Exchange under the symbol “OMG”. As of December 31, 2014, there were 817 record holders of our common stock. Please see Item 12 in this Form 10-K for information regarding our equity compensation plans.
The high and low market prices of our common stock for each quarter during the past two years are presented in the table below:
2014 | 2013 | |||||||||||||||
Sales Price | Cash | Sales Price | Cash | |||||||||||||
High | Low | Dividend | High | Low | Dividend | |||||||||||
First quarter | $37.58 | $30.62 | $ | 0.075 | $29.00 | $22.28 | $ | — | ||||||||
Second quarter | $33.79 | $28.01 | $ | 0.075 | $32.13 | $22.22 | $ | — | ||||||||
Third quarter | $33.56 | $24.08 | $ | 0.075 | $33.83 | $28.36 | $ | — | ||||||||
Fourth quarter | $30.77 | $21.87 | $ | 0.075 | $36.49 | $31.26 | $ | — | ||||||||
In 2014 our Board of Directors declared our first quarterly dividend since 2002. A $0.075 dividend was declared each quarter in 2014. On February 10, 2015, our Board of Directors declared a dividend of $0.085 per share payable on March 6, 2015 to the holders of record of all issued and outstanding shares of our Common Stock as of the close of business on February 23, 2015. Future payments of dividends will be based on factors such as our earnings, financial condition, debt covenant restrictions, and other factors as deemed appropriate by the Board. Our credit agreement includes certain covenants which restrict our payment of dividends generally to $15,000,000 per year, so long as no potential default or event of default has occurred and is continuing at the time of declaration.
Comparison of Cumulative Total Stockholder Return(a)
9
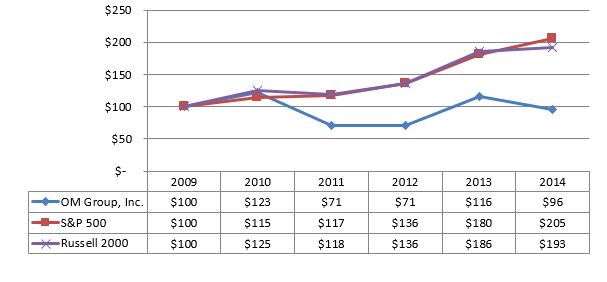
(a) The chart above compares our cumulative total stockholder return to that of (1) the Standard & Poor's 500 index and (2) Russell 2000 index. In all cases, the information assumes $100 invested at December 31, 2008, and is presented on a dividends-reinvested basis. The table does not forecast performance of our common stock.
Unregistered Sales of Equity Securities and Use of Proceeds
Issuer Purchases of Equity Securities | |||||||||||||||||||
Period | Total Number of Shares Purchased | Average Price Paid per Share | Total Number of Shares Purchased as Part of Publicly Announced Plans or Programs (1) | Maximum Approximate Dollar Value of Shares that May Yet Be Purchased under the Plans or Programs | |||||||||||||||
October 1 - 31, 2014 | 337,211 | $ | 24.75 | — | $ | 50,742,712 | |||||||||||||
November 1 - 30, 2014 | — | — | — | 50,742,712 | |||||||||||||||
December 1 - 31, 2014 | — | — | — | 50,742,712 | |||||||||||||||
Total October 1 - December 31, 2014 | 337,211 | $ | 24.75 | — | $ | 50,742,712 | |||||||||||||
(1) On January 21, 2013, we announced that our Board of Directors had authorized a share repurchase plan of up to $50 million of the Company's then outstanding common shares. On August 12, 2014, we announced that our Board of Directors had authorized the repurchase of up to an additional $50 million of the Company's outstanding common shares. There is no expiration date for these authorizations under the repurchase program. All of the shares indicated above were purchased under the share repurchase program. By December 31, 2014, we repurchased 1,874,686 shares under the repurchase program and approximately $51 million of the share repurchase authorizations remained outstanding as of December 31, 2014. Our Senior Secured Revolving Credit Facility (“the Facility”) includes certain covenants regarding restricted payments, including share repurchases, that could limit the Company's ability to repurchase shares.
Item 6. Selected Financial Data
10
Year Ended December 31, | ||||||||||||||||||||
2014 | 2013 | 2012 | 2011 | 2010 | ||||||||||||||||
(In millions, except per share data) | ||||||||||||||||||||
Income Statement Data: | ||||||||||||||||||||
Net sales | $ | 1,067.5 | $ | 1,157.5 | $ | 1,544.4 | $ | 1,419.6 | $ | 1,110.8 | ||||||||||
Amounts attributable to OM Group, Inc. common stockholders: | ||||||||||||||||||||
Income (loss) from continuing operations before cumulative effect of change in accounting principle, net of tax | $ | (172.3 | ) | $ | (71.7 | ) | $ | (38.3 | ) | $ | 39.8 | $ | 79.7 | |||||||
Income (loss) from discontinued operations, net of tax | (0.3 | ) | (12.3 | ) | (0.4 | ) | 2.2 | 3.6 | ||||||||||||
Net income (loss) | $ | (172.6 | ) | $ | (84.0 | ) | $ | (38.7 | ) | $ | 42.0 | $ | 83.3 | |||||||
Net income (loss) per common share attributable to OM Group, Inc. common stockholders — diluted: | ||||||||||||||||||||
Continuing operations | $ | (5.54 | ) | $ | (2.27 | ) | $ | (1.21 | ) | $ | 1.28 | $ | 2.61 | |||||||
Discontinued operations | (0.01 | ) | (0.39 | ) | (0.01 | ) | 0.07 | 0.12 | ||||||||||||
Net income (loss) | $ | (5.55 | ) | $ | (2.66 | ) | $ | (1.22 | ) | $ | 1.28 | $ | 2.73 | |||||||
Dividends declared per common share | $ | 0.30 | $ | — | $ | — | $ | — | $ | — | ||||||||||
Balance Sheet Data: | ||||||||||||||||||||
Cash and cash equivalents | $ | 91.7 | $ | 118.4 | $ | 227.6 | $ | 292.1 | $ | 400.6 | ||||||||||
Total assets | $ | 1,419.5 | $ | 1,783.1 | $ | 2,499.4 | $ | 2,873.8 | $ | 1,772.7 | ||||||||||
Long-term debt, excluding current portion | — | — | $ | 454.1 | $ | 633.2 | $ | 90.0 | ||||||||||||
Certain financial data may have been rounded. As a result of such rounding, the totals of data presented in this document may vary slightly from the actual arithmetical totals of such data. The results of our Ultra Pure Chemicals business are reported as discontinued operations in the table above.
Results for 2014 include a $195.4 million goodwill and intangible asset non-cash impairment charge on the Magnetic Technologies goodwill and tradename. Please see additional information regarding this impairment in the Management's Discussion and Analysis of Financial Conditions and Results of Operations and Note 6 to the Consolidated Financial Statements include in Item 8 of this Form 10-K. The results also include costs related to cost optimization and other business improvement initiatives of $1.9 million in Magnetic Technologies, $2.6 million in Battery Technologies, $2.1 million in Specialty Chemicals, and $0.2 million in Corporate, respectively. There was also a $3.2 million non-cash pension settlement charge recorded in Battery Technologies during the fourth quarter.
Results for 2013 include a $111.6 million loss on the divestiture of the Advanced Materials business within continuing operations and a $9.8 million loss on the divestiture of the UPC business within discontinued operations.
Results for 2012 include $55.9 million of charges related to VAC inventory purchase accounting step-up, $2.5 million non-cash pension settlement charge, $2.9 million gain recognized on the sale of property in China, $6.5 million acceleration of deferred financing fees due to debt repayment and $6.0 million income from an acquisition escrow settlement.
Results for 2011 include $111.2 million pre-tax of acquisition-related charges recorded in Magnetic Technologies, $15.4 million of Corporate acquisition-related fees and a $9.7 million gain recognized from a Specialty Chemicals property sale.
Results for 2010 include a $3.2 million Battery Technologies acquisition-related charge and $2.2 million Corporate acquisition-related fees.
Item 7. Management’s Discussion and Analysis of Financial Condition and Results of Operations
(In millions, except as noted and share and per share amounts)
Management’s discussion and analysis of financial condition and results of operations should be read in conjunction with the consolidated financial statements and the notes thereto appearing elsewhere in this Annual Report.
11
Certain financial data may have been rounded. As a result of such rounding, the totals of data presented in this document may vary slightly from the actual arithmetical totals of such data.
General
OM Group, Inc. (the “Company”, “we”, “our”, “us”) is a technology-driven industrial company serving attractive global markets, including automotive systems, electronic devices, aerospace and defense, industrial and medical. We use innovative technologies to address customers' complex applications and demanding requirements. Our strategy is to grow organically through product and application innovation and new market and customer development, to grow strategically through complementary acquisitions to build-out our growth platforms, and to maximize total stockholder returns through a combination of business growth, financial discipline, optimal deployment of capital and continued operational excellence. Our objective is to deliver sustainable, profitable growth and create long-term stockholder value.
On February 18, 2015, we announced a wide-ranging set of competitive repositioning and cost optimization opportunities throughout the enterprise that are expected to improve our ability to serve customers, better compete in global markets and deliver stronger financial performance. The opportunities include headcount reductions across the enterprise; site consolidations; relocation of certain operations to improve our cost structure and better serve customers; better alignment of various research and development, marketing and technical activities with customers’ next generation products and applications; and further corporate cost reductions.
Over the next three years, we expect to incur total cash expenses related to these opportunities of approximately $50.0 - $65.0 million. We also anticipate annualized savings of $30.0 - $40.0 million by the end of 2017, which are expected to ramp up starting in late 2015. Certain of these opportunities will take place in Europe and are subject to negotiations with employee works councils and unions, which could impact the timing and scope of the expected expenses and savings. We expect that the cost of these opportunities will not have a material impact on our financial position or liquidity and will be funded by operating cash flows and borrowing on our revolving line of credit when necessary.
On November 24, 2014, we completed the acquisition of Ener-Tek International, Inc., which operates under the brand name Yardney Technical Products ("Yardney") and has been included in our Battery Technologies business. Based in Rhode Island, Yardney is a designer, developer and manufacturer of high-performance lithium-ion and silver-zinc cells and batteries for niche applications in the defense and aerospace markets. We funded the $24.6 million acquisition price through existing cash balances.
On May 31, 2013, we completed the divestiture of our Ultra Pure Chemicals (UPC) business for cash proceeds of $63.3 million. The results of operations of the UPC business are reflected as discontinued operations in the accompanying unaudited condensed consolidated financial statements for all periods presented. A loss, net of tax, of $9.8 million was recorded on the divestiture, which included a $1.5 million gain on the sale of net assets offset by the realization of a loss in accumulated other comprehensive income of $8.8 million, a $1.5 million write-off of deferred financing fees related to the required debt pre-payment and transaction expenses of $1.0 million. We used the proceeds of the UPC divestiture, along with cash on hand, to repay our then-existing indebtedness.
On March 29, 2013, we completed the divestiture of our cobalt-based Advanced Materials business and the transfer of our 55% equity interests in the Democratic Republic of Congo-based joint venture known as GTL to the joint venture partners. In connection with this transaction, we received net proceeds of $328.7 million. As required by the Company's Senior Secured Credit agreement in place at the time, $302.1 million of net proceeds received at closing were used, together with cash on hand, to repay approximately $346.0 million of our Term B debt. A loss of $111.6 million was recorded on the divestiture. The sale agreement for the downstream portion of the business also provides for potential future additional cash consideration of up to $110.0 million based on the business achieving certain revenue targets over a period of three years. Using our projected trends of cobalt prices and volumes, it is not probable that the business will meet the revenue targets, and no value was assigned to the potential future cash consideration while calculating the loss on the divestiture or at December 31, 2013 and 2014.
We operate three strategic business platforms: Magnetic Technologies, Battery Technologies, and Specialty Chemicals. Through March 2015, we also have limited continuing involvement in the Advanced Materials business through transition agreements with the buyer as described below. Further discussion of and financial information for these segments,
12
including external sales, operating profit and total assets, is contained in Note 17 to the accompanying consolidated financial statements of this Annual Report on Form 10-K.
Magnetic Technologies
The Magnetic Technologies segment develops, manufactures and distributes differentiated, high-performance industrial-use magnetic materials and related products and systems with exceptional magnetic and/or physical properties for a wide array of end markets, including automotive systems, electrical installation technology, energy conversion and distribution, industrial, retail and renewable energy.
Battery Technologies
The Battery Technologies segment develops, manufactures and distributes specialty batteries, battery management systems, battery-related research and energetic devices for the defense, space, medical, energy storage, commercial aerospace and oil and gas markets.
Specialty Chemicals
The Specialty Chemicals segment develops, produces and supplies chemicals for consumer electronics applications; industrial applications including coatings, composites and catalysts; and photomasks used by customers to produce semiconductors and related products.
Advanced Materials (divested)
As discussed above, on March 29, 2013, we exited this business. During 2012 and through the date of sale, this business manufactured inorganic products using unrefined cobalt and other metals for the mobile energy storage, renewable energy, automotive systems, construction and mining, and industrial markets. It also had a 55% interest in a joint venture (GTL) in the Democratic Republic of Congo (DRC).
Following the sale, to assist in the transition of the downstream business, we entered into two agreements with the buyer pursuant to which: (1) We act as intermediary in a supply agreement between GTL and the buyer, in back-to-back arrangements for a period of two years. We met the cobalt feed supply target under that agreement as of early October 2014 and the supply agreement will terminate in March 2015. (2) We served as the U.S. distributor for refined cobalt products in primarily back-to-back arrangements until December 31, 2013. These agreements will be reported in the Advanced Materials segment until the supply agreement expires or is terminated.
Executive Overview
In 2014, we completed the acquisition of Yardney, returned $44.5 million to stockholders in the form of share repurchases and a regular quarterly cash dividend that we initiated in Q1 2014, and developed and initiated a set of actions to improve growth, margins and returns, including replacing four of our five business unit leaders. We believe these new leaders, in Magnetic Technologies and all three of our Specialty Chemicals businesses, have the abilities and experience to execute our initiatives and accelerate the pace of our competitive repositioning and cost optimization opportunities.
Consolidated net sales decreased by $90.0 million in 2014 compared to 2013, due primarily to the divestiture of the Advanced Materials business ($63.7 million impact) and lower sales at Magnetic Technologies ($27.6 million impact). Excluding the Advanced Materials business, net sales decreased 2.7% in 2014 compared to 2013. Sales in Magnetic Technologies were down 5.3% compared to a year earlier, due primarily to weakening business conditions in Europe and lower rare earth prices, which are generally passed-through to customers in our selling prices. Battery Technologies sales increased by 2.3% due to favorable price/mix and higher volumes in defense and medical applications. Specialty Chemicals sales were essentially flat to a year ago.
During the fourth quarter of 2014, in response to deteriorating European macroeconomic conditions and increasing competition, the Magnetic Technologies management team conducted a strategic evaluation of the business, led by the new business leader who joined in the third quarter of 2014. The evaluation included an assessment of business strengths and challenges and the consideration of various alternatives to improve business performance, including competitive repositioning and cost optimization opportunities. As a result of this evaluation, including a projection of future business results and consideration of the anticipated costs and benefits from business improvement opportunities, we determined that certain intangible assets of the business were impaired, and recorded goodwill and intangible asset non-cash impairment charges totaling $195.4 million. Throughout 2014, we recorded charges of $10.0 million related to cost reduction and business improvement initiatives across the enterprise, including a non-cash charge of $3.2 million related to a pension settlement in Battery Technologies, severance related to headcount
13
reductions in Specialty Chemicals, severance and other charges related to reducing operations at our medical battery facility in Vancouver in response to the loss of a key customer contract, and charges related to the business leadership changes discussed above.
Excluding the impact of the special charges noted above and the results of Advanced Materials in both years, adjusted operating profit and EBITDA were $45.9 million and $113.4 million, respectively, in 2014 compared to $51.2 million and $121.0 million, respectively, in 2013. A reconciliation of these adjusted numbers to US GAAP is contained on pages 17 and 18. The decrease in earnings in 2014 resulted from lower sales volumes and higher operating expenses in Magnetic Technologies, and $3.7 million of insurance proceeds in Specialty Chemicals in 2013 that did not repeat in 2014. These factors were partially offset by higher profitability in 2014 in Battery Technologies due to favorable price/mix and higher sales volumes, as well as lower Corporate expenses.
Consolidated Operating Results for 2014, 2013 and 2012
Set forth below is a summary of the Statements of Consolidated Operations for the years ended December 31,
2014 | 2013 | 2012 | |||||||||||||||||||
(percent of net sales) | |||||||||||||||||||||
Net sales | $ | 1,067.5 | $ | 1,157.5 | $ | 1,544.4 | |||||||||||||||
Cost of goods sold | 829.3 | 899.1 | 1,300.8 | ||||||||||||||||||
Gross profit | 238.2 | 22.3 | % | 258.4 | 22.3 | % | 243.6 | 15.8 | % | ||||||||||||
Selling, general and administrative expenses | 207.9 | 19.5 | % | 217.3 | 18.8 | % | 251.2 | 16.3 | % | ||||||||||||
Goodwill and intangible asset impairment | 195.4 | — | — | ||||||||||||||||||
Gain on sale of property | — | — | (2.9 | ) | |||||||||||||||||
Operating profit (loss) | (165.1 | ) | (15.5 | )% | 41.1 | 3.6 | % | (4.7 | ) | (0.3 | )% | ||||||||||
Other expense, net | (7.7 | ) | (103.9 | ) | (43.9 | ) | |||||||||||||||
Income tax expense (benefit) | (0.5 | ) | 10.7 | (3.2 | ) | ||||||||||||||||
Loss from continuing operations, net of tax | (172.3 | ) | (73.5 | ) | (45.4 | ) | |||||||||||||||
Loss from discontinued operations, net of tax | (0.3 | ) | (12.3 | ) | (0.4 | ) | |||||||||||||||
Consolidated net loss | (172.6 | ) | (85.8 | ) | (45.8 | ) | |||||||||||||||
Net loss attributable to noncontrolling interests | — | 1.8 | 7.1 | ||||||||||||||||||
Loss attributable to OM Group, Inc. common stockholders | $ | (172.6 | ) | $ | (84.0 | ) | $ | (38.7 | ) | ||||||||||||
Earnings per common share — basic: | |||||||||||||||||||||
Loss from continuing operations attributable to OM Group, Inc.common stockholders | $ | (5.54 | ) | $ | (2.27 | ) | $ | (1.21 | ) | ||||||||||||
Loss from discontinued operations attributable to OM Group, Inc. common stockholders | (0.01 | ) | (0.39 | ) | (0.01 | ) | |||||||||||||||
Net loss attributable to OM Group, Inc. common stockholders | $ | (5.55 | ) | $ | (2.66 | ) | $ | (1.22 | ) | ||||||||||||
Earnings per common share — assuming dilution: | |||||||||||||||||||||
Loss from continuing operations attributable to OM Group, Inc. common stockholders | $ | (5.54 | ) | $ | (2.27 | ) | $ | (1.21 | ) | ||||||||||||
Loss from discontinued operations attributable to OM Group, Inc. common stockholders | (0.01 | ) | (0.39 | ) | (0.01 | ) | |||||||||||||||
Net loss attributable to OM Group, Inc. common stockholders | $ | (5.55 | ) | $ | (2.66 | ) | $ | (1.22 | ) | ||||||||||||
Weighted average shares outstanding | |||||||||||||||||||||
Basic | 31.1 | 31.6 | 31.9 | ||||||||||||||||||
Assuming dilution | 31.1 | 31.6 | 31.9 | ||||||||||||||||||
Amounts attributable to OM Group, Inc. common stockholders: | |||||||||||||||||||||
Loss from continuing operations, net of tax | $ | (172.3 | ) | $ | (71.7 | ) | $ | (38.3 | ) | ||||||||||||
Loss from discontinued operations, net of tax | (0.3 | ) | (12.3 | ) | (0.4 | ) | |||||||||||||||
Net loss | $ | (172.6 | ) | $ | (84.0 | ) | $ | (38.7 | ) | ||||||||||||
14
In this report we provide adjusted operating profit (loss), adjusted EBITDA, and adjusted earnings per common share attributable to OM Group, Inc. common stockholders - assuming dilution, which are non-GAAP financial measures. The tables below present reconciliations of these amounts to the comparable US GAAP amounts. We believe that the non-GAAP financial measures presented in the tables facilitate a comparative assessment of the Company's operating performance and enhance investors' understanding of the performance of the Company's operations. The non-GAAP financial information set forth in the tables below are not alternatives to reported results determined in accordance with US GAAP.
2014 | ||||||||||||||||||||||||||||
Magnetic Technologies | Battery Technologies | Specialty Chemicals | Corporate | Subtotal | Advanced Materials | Consolidated | ||||||||||||||||||||||
Operating profit (loss) - as reported | $ | (177.1 | ) | $ | 19.9 | $ | 31.3 | $ | (33.6 | ) | $ | (159.5 | ) | $ | (5.6 | ) | $ | (165.1 | ) | |||||||||
Goodwill and intangible asset impairment | 195.4 | — | — | — | 195.4 | — | 195.4 | |||||||||||||||||||||
Charges related to initiatives | 1.9 | 2.6 | 2.1 | 0.2 | 6.8 | — | 6.8 | |||||||||||||||||||||
Pension settlement expense | — | 3.2 | — | — | 3.2 | — | 3.2 | |||||||||||||||||||||
Adjusted operating profit | $ | 20.2 | $ | 25.7 | $ | 33.4 | $ | (33.4 | ) | $ | 45.9 | $ | (5.6 | ) | $ | 40.3 | ||||||||||||
Depreciation and amortization | 42.2 | 10.5 | 14.0 | 0.8 | 67.5 | — | 67.5 | |||||||||||||||||||||
Adjusted EBITDA | $ | 62.4 | $ | 36.2 | $ | 47.4 | $ | (32.6 | ) | $ | 113.4 | $ | (5.6 | ) | $ | 107.8 | ||||||||||||
2013 | ||||||||||||||||||||||||||||
Magnetic Technologies | Battery Technologies | Specialty Chemicals | Corporate | Subtotal | Advanced Materials | Consolidated | ||||||||||||||||||||||
Operating profit (loss) - as reported | $ | 22.4 | $ | 21.8 | $ | 35.8 | $ | (38.5 | ) | $ | 41.5 | $ | (0.4 | ) | $ | 41.1 | ||||||||||||
Charges related to initiatives | 5.4 | — | 0.8 | 1.1 | 2.4 | 9.7 | — | 9.7 | ||||||||||||||||||||
Adjusted operating profit | $ | 27.8 | $ | 22.6 | $ | 36.9 | $ | (36.1 | ) | $ | 51.2 | $ | (0.4 | ) | $ | 50.8 | ||||||||||||
Depreciation and amortization (a) | 44.2 | 10.1 | 14.8 | 0.7 | 69.8 | 3.9 | 73.7 | |||||||||||||||||||||
Adjusted EBITDA | $ | 72.0 | $ | 32.7 | $ | 51.7 | $ | (35.4 | ) | $ | 121.0 | $ | 3.5 | $ | 124.5 | |||||||||||||
2012 | ||||||||||||||||||||||||||||
Magnetic Technologies | Battery Technologies | Specialty Chemicals | Corporate | Subtotal | Advanced Materials | Consolidated | ||||||||||||||||||||||
Operating profit (loss) - as reported | $ | (22.3 | ) | $ | 19.6 | $ | 34.5 | $ | (42.9 | ) | $ | (11.1 | ) | $ | 6.4 | $ | (4.7 | ) | ||||||||||
Total VAC inventory purchase accounting step-up and LCM charges | 55.9 | — | — | — | 55.9 | — | 55.9 | |||||||||||||||||||||
Pension settlement expense | — | — | — | 2.5 | 2.5 | — | 2.5 | |||||||||||||||||||||
Gain on sale of property | — | — | (2.9 | ) | — | (2.9 | ) | — | (2.9 | ) | ||||||||||||||||||
Adjusted operating profit | $ | 33.6 | $ | 19.6 | $ | 31.6 | $ | (40.4 | ) | $ | 44.4 | $ | 6.4 | $ | 50.8 | |||||||||||||
Depreciation and amortization | 40.8 | 10.1 | 15.7 | 0.8 | $ | 67.4 | 16.9 | 84.3 | ||||||||||||||||||||
Adjusted EBITDA | $ | 74.4 | $ | 29.7 | $ | 47.3 | $ | (39.6 | ) | $ | 111.8 | $ | 23.3 | $ | 135.1 | |||||||||||||
(a) $0.2 million of accelerated software amortization is included in Corporate charges related to cost-reduction initiatives and excluded from Corporate depreciation and amortization in the table above for the twelve months ended December 31, 2013.
15
Year Ended | ||||||||||||||||||||||||
December 31, | ||||||||||||||||||||||||
2014 | 2013 | 2012 | ||||||||||||||||||||||
(in millions, except per share data) | $ | Diluted EPS | $ | Diluted EPS | $ | Diluted EPS | ||||||||||||||||||
Net income (loss) from continuing operations attributable to OM Group Inc. - as reported | $ | (172.3 | ) | $ | (5.50 | ) | $ | (71.7 | ) | $ | (2.25 | ) | $ | (38.3 | ) | $ | (1.20 | ) | ||||||
Less: | ||||||||||||||||||||||||
(Gain) loss on divestiture of Advanced Materials business | (1.7 | ) | (0.05 | ) | 111.6 | 3.51 | — | — | ||||||||||||||||
Goodwill and intangible asset impairment | 195.4 | 6.24 | — | — | ||||||||||||||||||||
Charges related to initiatives | 6.8 | 0.22 | 9.7 | 0.30 | — | — | ||||||||||||||||||
VAC inventory purchase accounting step-up and lower of cost or market charges | — | — | — | — | 55.9 | 1.75 | ||||||||||||||||||
Pension settlement expense | 3.2 | 0.10 | — | — | 2.5 | 0.08 | ||||||||||||||||||
Gain on sale of property | — | — | — | — | (2.9 | ) | (0.09 | ) | ||||||||||||||||
Acceleration of deferred financing fees | — | — | 1.0 | 0.03 | 6.5 | 0.20 | ||||||||||||||||||
EPT escrow settlement, net of tax | — | — | — | — | (6.0 | ) | (0.19 | ) | ||||||||||||||||
Contingent consideration adjustment | — | — | (13.0 | ) | (0.41 | ) | — | — | ||||||||||||||||
Tax effect of special items | (9.0 | ) | (0.30 | ) | (1.2 | ) | (0.04 | ) | (17.3 | ) | (0.54 | ) | ||||||||||||
Adjusted net income from continuing operations attributable to OM Group, Inc. | $ | 22.4 | $ | 0.71 | $ | 36.4 | $ | 1.14 | $ | 0.4 | $ | 0.01 | ||||||||||||
Weighted average shares outstanding - diluted (a) | 31.3 | 31.8 | 32.0 | |||||||||||||||||||||
(a) Because the reported loss from continuing operations is income on a adjusted basis, we used diluted shares to calculate EPS
The 2014 items in the above table are described more fully in the Executive Overview above.
The 2013 charges related to enterprise-wide cost-reduction initiatives, including headcount reductions, minor facility consolidations, supply chain optimization, corporate cost reductions, and other structural changes to improve profitability. These actions increased pre-tax profit by $17.3 million in 2013. In 2013, we incurred charges of $9.7 million associated with these actions.
Magnetic Technologies acquisition-related charges in 2012 totaled $55.9 million (net of related tax benefit), representing the step-up value for inventory in purchase accounting that turned through cost of goods sold after the business was acquired. Other items impacting operating profit included a land sale gain of $2.9 million (net of tax) in Specialty Chemicals, and expense of $2.5 million (net of tax) related to a settlement charge associated with lump-sum cash settlements to certain participants in one of our U.S. defined benefit pension plans. Other income (expense) included a $6.0 million (net of tax) benefit for a fourth quarter 2012 receipt of cash from an escrow account related to the 2010 Battery Technologies acquisition, and it included Interest expense of $1.0 million (net of tax) in the second half of 2012 related to accelerated amortization of deferred financing fees as a result of early repayments of debt.
2014 Compared with 2013
The following table identifies, by segment, the components of change in net sales and operating profit in 2014 compared with 2013:
Net sales | Operating profit - as reported | Adjusted operating profit | |||||||||
2013 | $ | 1,157.5 | $ | 41.1 | $ | 50.8 | |||||
Increase (decrease) in 2013 from: | |||||||||||
Magnetic Technologies | (27.6 | ) | (199.5 | ) | (7.6 | ) | |||||
Battery Technologies | 3.5 | (1.9 | ) | 3.1 | |||||||
Specialty Chemicals | (2.5 | ) | (4.5 | ) | (3.5 | ) | |||||
Advanced Materials | (63.7 | ) | (5.2 | ) | (5.2 | ) | |||||
Corporate | — | 4.9 | 2.7 | ||||||||
Intersegment items | 0.3 | — | — | ||||||||
2014 | $ | 1,067.5 | $ | (165.1 | ) | $ | 40.3 | ||||
Excluding the impact of the divested Advanced Materials business ($63.7 million), net sales in 2014 were $26.3 million, or 2.7%, lower than 2013. This decrease is due primarily to lower net sales in our Magnetic Technologies business
16
and resulted from lower rare earth prices in 2014, which are generally passed-through to our customers in our selling prices, as well as weakening business conditions in Europe and increased competition and lower prices. This decrease was partially offset by a sales increase of $3.4 million, or 2.3%, in our Battery Technologies business, which was driven by favorable price/mix and higher volumes in defense and medical applications. Net sales in Specialty Chemicals were roughly flat in 2014 compared to 2013.
Gross profit decreased to $238.2 million in 2014, compared with $258.4 million in 2013. The largest factors affecting the $20.2 million decrease were the sale of Advanced Materials ($12 million impact), and lower sales and rare-earth price impacts in Magnetic Technologies.
Selling, general and administrative expenses (“SG&A”) decreased to $207.9 million in 2014 compared with $217.3 million in 2013 due primarily to the Advanced Materials divestiture ($6 million impact). Excluding the Advanced Materials business, SG&A as a percentage of net sales was 21% in both 2014 and 2013.
The intangible impairment charge of $195.4 million in 2014 relates to goodwill and intangible assets in Magnetic Technologies and is described more fully in the Executive Overview above.
The following table summarizes the components of Other expense, net:
Year Ended December 31, | ||||||||||||
2014 | 2013 | Change | ||||||||||
Interest expense | $ | (2.6 | ) | $ | (12.3 | ) | $ | 9.7 | ||||
Accelerated amortization of deferred financing fees | — | (6.5 | ) | 6.5 | ||||||||
Foreign exchange gain (loss) | (6.5 | ) | 8.0 | (14.5 | ) | |||||||
Gain (loss) on divestiture of Advanced Materials | 1.7 | (111.6 | ) | 113.3 | ||||||||
Other income (expense), net | (0.3 | ) | 12.0 | (12.3 | ) | |||||||
$ | (7.7 | ) | $ | (110.4 | ) | $ | 102.7 | |||||
The decrease in interest expense is due to lower debt outstanding in 2014 compared to 2013, as we repaid our debt in the first half of 2013. The 2013 accelerated amortization of deferred financing fees is related to the debt paydown.
The foreign exchange loss in 2014 is primarily related to movements in Euro/U.S. dollar exchange rates and the resulting impact on the revaluation of non-functional currency cash and debt balances. During 2014, the Euro weakened against the dollar from 1.38 at December 31, 2013 to 1.21 at December 31, 2014, resulting in a foreign exchange loss. During 2013, the opposite occurred when the Euro strengthened from 1.32 at December 31, 2012 to 1.38 at December 31, 2013, resulting in a foreign exchange gain.
Other income in 2013 is primarily comprised of a $13 million reduction of the contingent consideration liability associated with our 2011 acquisition of Rahu Catalytics Limited ("Rahu") in 2011.
We recorded an income tax benefit of $0.5 million on a pre-tax loss of $172.8 million in 2014. The effective income tax rate for the year ended December 31, 2014 is impacted by the Magnetic Technologies impairment charges of $195.4 million and other special charges totaling $10.0 million described more fully above. There is no tax benefit for the $168.7 million goodwill portion of the impairment charges due to its permanent nature. Excluding the impairment charge, the other special items and the Advanced Materials results, our effective income tax rate was 22.7%. This rate is lower than the U.S. statutory tax rate primarily due to income earned in tax jurisdictions with lower statutory rates than the U.S. and our financing structure, partially offset by losses and carry-forwards in certain jurisdictions (including the U.S. and Germany) with no corresponding tax benefit.
We recorded an income tax expense of $10.7 million on pre-tax loss of $62.8 million for 2013. The effective tax rate was impacted by the loss on the divestiture of Advanced Materials, which had no income tax benefit, and other special items. Excluding these special items, our effective income tax rate would have been 25.6%. This rate is lower than the U.S. statutory tax rate primarily due to income earned in tax jurisdictions with lower statutory rates than the U.S., and our financing structure, partially offset by losses and carry-forwards in certain jurisdictions (including the U.S. and Germany) with no corresponding tax benefit.
2013 Compared with 2012
The following table identifies, by segment, the components of change in net sales in 2013 compared with 2012:
17
Net sales | Operating profit (loss) - as reported | Adjusted operating profit | |||||||||
2012 | $ | 1,544.4 | $ | (4.7 | ) | $ | 50.8 | ||||
Increase (decrease) in 2012 from: | |||||||||||
Magnetic Technologies | (109.0 | ) | 44.7 | (5.8 | ) | ||||||
Battery Technologies | 7.3 | 2.3 | 3.0 | ||||||||
Specialty Chemicals | (5.0 | ) | 1.3 | 5.3 | |||||||
Advanced Materials | (280.8 | ) | (6.9 | ) | 4.3 | ||||||
Corporate | — | 4.4 | (6.8 | ) | |||||||
Intersegment items | 0.5 | — | — | ||||||||
2013 | $ | 1,157.5 | $ | 41.1 | $ | 50.8 | |||||
Net sales decreased $387.0 million, or 25.1%, due primarily to the divestiture of the Advanced Materials business ($280.8 million impact) and lower rare earth prices ($113.3 million impact) in our Magnetic Technologies business, which are generally passed-through to customers in the business' selling prices. Excluding these two items, net sales increased 0.8% in 2013 compared to 2012, including $16.0 million of translation benefit from a stronger Euro. Battery Technologies sales grew 5.1% due to higher sales into both defense and medical markets. Excluding the rare earth price impact and the translation benefit, sales in Magnetic Technologies were slightly lower than a year ago, due to macroeconomic weakness in Europe. Specialty Chemicals sales were down 1.6%, as weaker conditions impacting our Advanced Organics and Photomasks product lines more than offset higher demand for our memory disk product line.
Gross profit increased to $258.4 million in 2013, compared with $243.6 million in 2012. The largest factors affecting the $14.9 million increase in gross profit were higher sales volumes in Battery Technologies and savings from cost reductions actions net of related charges. Gross profit in 2012 was negatively impacted by VAC purchase accounting step-up charges that did not repeat in 2013. Gross profit in 2012 benefited from the full year of Advanced Materials gross profit.
Selling, general and administrative expenses (“SG&A”) decreased to $217.3 million in 2013 compared with $251.2 million in 2012 due primarily to the Advanced Materials divestiture.
Year Ended December 31, | ||||||||||||
2013 | 2012 | Change | ||||||||||
Interest expense | $ | (12.3 | ) | $ | (49.7 | ) | $ | 37.4 | ||||
Foreign exchange gain (loss) | 8.0 | (0.8 | ) | 8.8 | ||||||||
Loss on divestiture of Advanced Materials | (111.6 | ) | — | (111.6 | ) | |||||||
Other expense, net | 12.0 | 6.6 | 5.4 | |||||||||
$ | (103.9 | ) | (43.9 | ) | $ | (60.0 | ) | |||||
The decrease in interest expense is due to lower debt outstanding in 2013 compared to 2012, as we repaid our then-existing debt in the first half of 2013. The foreign exchange gain in 2013 is primarily related to movements in Euro/U.S. dollar exchange rates and the resulting impact on the revaluation of non-functional currency cash and debt balances.
Other income in 2013 is primarily comprised of a $13 million reduction of the contingent consideration liability associated with the 2011 acquisition of Rahu. Other income in 2012 relates primarily to a receipt of $6 million from an escrow settlement related to the 2010 Battery Technologies acquisition.
We recorded income tax expense of $10.7 million on pre-tax loss of $62.8 million for 2013. The effective tax rate was impacted by the loss on the divestiture of Advanced Materials, which had no income tax benefit, and other special items. Excluding these special items, our effective income tax rate would have been 25.6%. This rate is lower than the U.S. statutory tax rate primarily due to income earned in tax jurisdictions with lower statutory rates than the U.S., and our financing structure, partially offset by losses and carry-forwards in certain jurisdictions (including the U.S. and Germany) with no corresponding tax benefit.
We recorded an income tax benefit of $3.2 million on pre-tax loss of $48.6 million for 2012. The effective tax rate was impacted by VAC purchase accounting related inventory charges of $55.9 million, a tax expense of $10.4 million related
18
to GTL which included a $5.6 million increase in the valuation allowance for prepaid tax asset and $6.6 million for other GTL permanent differences.
Excluding the impact of VAC purchase accounting-related inventory charges and GTL discrete and permanent items, the effective tax rate for the year ended December 31, 2012 would have been 31.8%. This rate is lower than the U.S. statutory tax rate primarily due to income earned in tax jurisdictions with lower statutory rates than the U.S., and our financing structure, partially offset by losses and carry-forwards in certain jurisdictions (including the U.S. and Germany) with no corresponding tax benefit.
Segment Results and Corporate Expenses
Magnetic Technologies
In 2014 this segment focused on (1) replacing its leadership, (2) developing new products and applications, including leveraging its substantial patent portfolio, know-how and expertise to enter new markets and increase market share and (3) conducting a strategic evaluation of the business to identify opportunities to improve operating performance.
The primary raw materials used by Magnetic Technologies are nickel, cobalt and certain rare earth materials, primarily dysprosium and neodymium. Rare earth materials are currently available from a limited number of suppliers, primarily in China. We generally pass through rare earth prices to our customers in our selling prices, typically with a lag period. Rare earth prices declined moderately throughout 2014, which negatively impacted net sales and profitability.
For the year ended December 31, | 2014 | 2013 | 2012 | |||||||||
Net sales | $ | 495.0 | $ | 522.6 | $ | 631.6 | ||||||
Operating income (loss) | $ | (177.1 | ) | $ | 22.4 | $ | (22.3 | ) | ||||
Goodwill and intangible asset impairment | 195.4 | — | — | |||||||||
Charges related to initiatives | 1.9 | 5.4 | — | |||||||||
VAC inventory purchase accounting step-up and LCM charges | — | — | 55.9 | |||||||||
Adjusted operating profit | $ | 20.2 | $ | 27.8 | $ | 33.6 | ||||||
The intangible impairment of $195.4 million is related to the write-down of goodwill and other intangible assets to fair value in the fourth quarter of 2014. Charges of $1.9 million related to initiatives in 2014 related to cost optimization and other business improvement initiatives. Charges related to cost-reduction initiatives of $5.4 million in 2013 relate to the cost reduction program that year. Acquisition-related charges in 2012 include $55.9 million of charges as a result of purchase accounting for acquired inventory. As of December 31, 2012, all of the inventory step-up related to the 2011 acquisition had been charged to cost of goods sold.
2014 Compared with 2013
The following table identifies the components of change in net sales and operating profit:
Net sales | Operating profit | Adjusted operating profit | ||||||||||
2013 | $ | 522.6 | $ | 22.4 | $ | 27.8 | ||||||
Increase (decrease) in 2014 from: | ||||||||||||
Volume/mix | (6.1 | ) | (1.0 | ) | (1.0 | ) | ||||||
Selling price | (3.7 | ) | (3.7 | ) | (3.7 | ) | ||||||
Rare earth pricing effects | (14.0 | ) | (3.3 | ) | (3.3 | ) | ||||||
Other commodity input pricing | (4.7 | ) | (1.1 | ) | (1.1 | ) | ||||||
Goodwill and intangible asset impairment | — | (195.4 | ) | — | ||||||||
Charges related to cost-reduction initiatives | — | 3.5 | — | |||||||||
Foreign currency translation effect | 1.1 | (0.1 | ) | (0.1 | ) | |||||||
Other | (0.2 | ) | 1.6 | 1.6 | ||||||||
2014 | $ | 495.0 | $ | (177.1 | ) | $ | 20.2 | |||||
Net sales decreased $27.6 million, primarily due to lower rare earth prices in 2014 compared to 2013. Typically we pass through these raw material price changes to our customers in our selling prices, with a lag between the inventory
19
purchase and the subsequent price adjustment with our customers. Volume declines and pricing pressures in 2014 also contributed to the sales decline and are attributed to weaker business conditions and increasing competition. These same factors negatively impacted operating profit in 2014 compared to 2013.
2013 Compared with 2012
The following table identifies the components of change in net sales and operating profit:
Net sales | Operating profit | Adjusted operating profit | ||||||||||
2012 | $ | 631.6 | $ | (22.3 | ) | $ | 33.6 | |||||
Increase (decrease) in 2012 from: | ||||||||||||
Purchase accounting charges in 2012 | — | 55.9 | — | |||||||||
Volume/mix | (6.9 | ) | 0.1 | 0.1 | ||||||||
Selling price | (4.9 | ) | (4.9 | ) | (4.9 | ) | ||||||
Rare earth pricing effects | (113.3 | ) | (22.4 | ) | (22.4 | ) | ||||||
Operating expenses, including savings from cost-reduction initiatives | — | 12.7 | 12.7 | |||||||||
Charges related to cost-reduction initiatives | — | (5.4 | ) | — | ||||||||
Foreign currency translation effect | 16.1 | 0.4 | 0.4 | |||||||||
Other | — | 8.3 | 8.3 | |||||||||
2013 | $ | 522.6 | $ | 22.4 | $ | 27.8 | ||||||
Net sales decreased $109.0 million, primarily due to lower rare earth prices in 2013 compared to 2012. Typically we pass through these raw material price changes to our customers in our selling prices, with a lag between the inventory purchase and the subsequent price adjustment with our customers. Volume declines are attributed to weaker macroeconomic conditions in certain markets, primarily in Europe.
Battery Technologies
In 2014 this segment was focused on (1) executing and beginning to integrate the complementary Yardney acquisition, (2) developing new specialty battery chemistries, products and applications, (3) expanding its served markets into new or emerging markets, including grid energy storage, commercial aerospace and oil and gas, and (4) reducing medical battery production costs in response to the loss of a key customer contract.
For the year ended December 31,
2014 | 2013 | 2012 | ||||||||||
Net sales | $ | 153.8 | $ | 150.3 | $ | 143.0 | ||||||
Operating profit | $ | 19.9 | $ | 21.8 | $ | 19.6 | ||||||
Charges related to initiatives | 2.6 | 0.8 | — | |||||||||
Pension settlement expense | 3.2 | — | — | |||||||||
Adjusted operating profit | $ | 25.7 | $ | 22.6 | $ | 19.6 | ||||||
The Battery Technologies segment tracks backlog, which is equal to the value of unfulfilled orders for which funding is contractually obligated by the customer and for which revenue has not been recognized. At December 31, 2014, backlog was $156.5 million as compared with $135.2 million at December 31, 2013, with the majority of the increase related to the Yardney acquisition in November 2014. Approximately $19.4 million of the backlog at December 31, 2014 is expected to be converted to sales in periods after 2015.
2014 Compared with 2013
The following table identifies the components of change in net sales and operating profit:
20
Sales | Operating profit | Adjusted operating profit | |||||||||
2013 | $ | 150.3 | $ | 21.8 | $ | 22.6 | |||||
Increase (decrease) in 2013 from: | |||||||||||
Sales volume | 4.0 | 1.6 | 1.6 | ||||||||
Price/mix | (0.5 | ) | 1.6 | 1.6 | |||||||
Charges related to initiatives | — | (1.8 | ) | — | |||||||
Pension settlement expense | — | (3.2 | ) | — | |||||||
Other | — | (0.1 | ) | (0.1 | ) | ||||||
2014 | $ | 153.8 | $ | 19.9 | $ | 25.7 | |||||
Battery Technologies net sales and adjusted operating profit increased in 2014 due primarily to favorable sales volume and mix. Operating profit in 2014 was negatively impacted by the special charges and pension settlement expense described earlier.
2013 Compared with 2012
The following table identifies the components of change in net sales and operating profit:
Sales | Operating profit | Adjusted operating profit | |||||||||
2012 | $ | 143.0 | $ | 19.6 | $ | 19.6 | |||||
Increase (decrease) in 2012 from: | |||||||||||
Sales volume | 7.1 | 2.1 | 2.1 | ||||||||
Price/mix | 0.1 | 1.9 | 1.9 | ||||||||
Charges related to cost-reduction initiatives | — | (0.8 | ) | — | |||||||
Other | 0.1 | (1.0 | ) | (1.0 | ) | ||||||
2013 | $ | 150.3 | $ | 21.8 | $ | 22.6 | |||||
Battery Technologies net sales increased in 2013 due to increased sales volumes, driven primarily by increased sales into defense, where the business benefited from customer spending on programs showing continued growth, and medical markets, benefiting from new customer device qualifications. Operating profit benefited from the higher volumes, as well as favorable mix.
Specialty Chemicals
In 2014 this segment was focused on (1) replacing its leadership team, (2) utilizing its technology to provide solutions for electronic devices with increasing demanding performance specifications and miniaturization, (3) taking steps to optimize its cost structure, and (4) streamlining its product portfolio.
For the year ended December 31,
2014 | 2013 | 2012 | ||||||||||
Net sales | $ | 316.1 | $ | 318.6 | $ | 323.6 | ||||||
Operating profit (loss) | $ | 31.3 | $ | 35.8 | $ | 34.5 | ||||||
Charges related to cost-reduction initiatives | 2.1 | 1.1 | — | |||||||||
Gain on sale of property | — | — | (2.9 | ) | ||||||||
Adjusted operating profit | $ | 33.4 | $ | 36.9 | $ | 31.6 | ||||||
2014 Compared with 2013
The following table identifies the components of change in net sales and operating profit:
21
Sales | Operating profit | Adjusted operating profit | |||||||||
2013 | $ | 318.6 | $ | 35.8 | $ | 36.9 | |||||
Increase (decrease) in 2014 from: | |||||||||||
Volume | (10.9 | ) | (6.4 | ) | (6.4 | ) | |||||
Selling price/mix | 8.5 | 3.3 | 3.3 | ||||||||
Foreign currency | 0.7 | — | — | ||||||||
Insurance proceeds in 2013 | — | (3.7 | ) | (3.7 | ) | ||||||
Charges related to cost-reduction initiatives | — | (1.1 | ) | — | |||||||
Other | (0.8 | ) | 3.4 | 3.4 | |||||||
2014 | $ | 316.1 | $ | 31.3 | $ | 33.4 | |||||
Sales were relatively flat compared with the previous year, as lower sales volumes for printed circuit board applications were mostly offset by favorable price/mix and higher volumes in memory disk applications. Sales in our Advanced Organics business were at approximately the same levels as the prior year.
Excluding the charges related to cost-reduction initiatives, adjusted operating profit in 2014 was $3.4 million lower than in 2013 due primarily to insurance proceeds of $3.7 million in 2013 that did not repeat in 2014, and lower sales volumes, partially offset by improved mix and lower operating expenses.
2013 Compared with 2012
The following table identifies the components of change in net sales and operating profit:
Sales | Operating profit | Adjusted operating profit | |||||||||
2012 | $ | 323.6 | $ | 34.5 | $ | 31.6 | |||||
Increase (decrease) in 2012 from: | |||||||||||
Volume | (3.4 | ) | (2.6 | ) | (2.6 | ) | |||||
Selling price/mix | (4.3 | ) | 3.6 | 3.6 | |||||||
Foreign currency | 1.8 | 0.2 | (0.2 | ) | |||||||
Charges related to cost-reduction initiatives | — | (1.1 | ) | — | |||||||
Gain on sale of property | — | (2.9 | ) | — | |||||||
Other | 0.9 | 4.1 | 4.1 | ||||||||
2013 | $ | 318.6 | $ | 35.8 | $ | 36.9 | |||||
Sales declined in 2013 compared to a year ago, as weak economic conditions in Europe and pricing pressures in a competitive environment negatively impacted customer demand for our Advanced Organics and Photomasks products. These decreases were partially offset by higher volumes and improved mix for our electronic chemicals products primarily in memory disk applications for mass data storage. The improved price/mix benefit is attributed to focused selling efforts to promote our highest performing products.
Excluding the 2012 land sale gain and charges in 2013 related to cost-reductions initiatives, adjusted operating profit in 2013 was $5.3 million higher than in 2012, as favorable mix and increased demand in electronic chemicals more than offset weaker demand in the other product lines. In addition, the 2013 amount includes income from insurance proceeds for reimbursement of a portion of operating expenses incurred and paid in prior years for environmental matters associated with a site closure.
Advanced Materials
During 2012 and through the date of sale, this business manufactured inorganic products using unrefined cobalt and other metals for a range of end markets. It also had a 55% interest in the DRC-based joint venture known as GTL prior to March 29, 2013.
As discussed above, we divested this business as of March 29, 2013. Activity in this segment beginning in the second quarter of 2013 represents performance under the transition agreements described above. The higher operating loss in 2014 reflects an increase in sales under the supply agreement in 2014 compared to a year ago.
For the year ended December 31,
22
2014 | 2013 | 2012 | ||||||||||
Net sales | $ | 102.6 | $ | 166.3 | $ | 447.0 | ||||||
Operating (loss) profit | $ | (5.6 | ) | $ | (0.4 | ) | $ | 6.4 | ||||
Corporate Expenses
Corporate expenses consist of corporate overhead supporting the operating segments but not specifically allocated to an operating segment, including certain legal, finance, human resources and strategic development activities, as well as all share-based compensation across the enterprise.
2014 Compared with 2013
Corporate expenses were $33.6 million in 2014 compared with $38.5 million in 2013. Corporate expenses were lower in 2014 due to lower professional services fees, the benefit of Corporate cost-reduction initiatives in the current year and insurance proceeds of $1.3 million.
2013 Compared with 2012
Corporate expenses were $38.5 million in 2013 compared with $42.9 million in 2012. Corporate expenses were lower in 2013 due to a $2.5 million settlement charge in 2012 associated with 2012 lump-sum cash settlements to certain participants in one of our U.S. defined benefit pension plans, lower incentive compensation expense and lower professional services fees in 2013 and the benefit of Corporate cost-reduction initiatives in the current year.
Liquidity and Capital Resources
Cash Flow Summary
Our cash flows from operating, investing and financing activities for 2014, 2013 and 2012, as reflected in the Statements of Consolidated Cash Flows, are summarized and discussed in the following tables and related narrative:
2014 | 2013 | 2012 | ||||||||||
Net cash provided by (used for): | ||||||||||||
Operating activities | $ | 85.4 | $ | 62.9 | $ | 209.5 | ||||||
Investing activities | (58.1 | ) | 333.9 | (56.5 | ) | |||||||
Financing activities | (48.5 | ) | (503.7 | ) | (213.8 | ) | ||||||
Effect of exchange rate changes on cash | (4.7 | ) | 0.6 | 1.4 | ||||||||
Decrease in cash from continuing operations | $ | (25.9 | ) | $ | (106.3 | ) | $ | (59.4 | ) | |||
Operating Activities
In 2014, net cash flow from operating activities was $85.4 million compared with $62.9 million in the prior year, largely due to lower cash requirements to fund operating assets and liabilities in 2014. Cash flows from operating activities can fluctuate significantly from period-to-period due to profitability, working capital changes and the timing of payments for items such as income taxes, pensions and other items.
In 2013, net cash flow from operating activities was $62.9 million compared $209.5 million in the prior year. 2012 cash flow performance benefited from declining commodity prices in the Advanced Materials business.
Investing Activities
In 2014, net cash used for investing activities included net cash paid of $24.6 million for the acquisition of Ener-Tek International, Inc. and capital expenditures of $34.5 million. Capital expenditures were made primarily to expand capacity; to maintain and improve productivity; for compliance with environmental, health and safety regulations; and for other fixed asset additions at existing facilities.
In 2013, net cash provided by investing activities in 2013 included net proceeds of $392.0 million from the divestitures of the Advanced Materials and UPC businesses, less capital expenditures of $53.1 million.
In 2012, net cash used in investing activities included capital expenditures of $67.6 million.
Financing Activities
Cash used for financing activities in 2014 primarily consisted of $35.2 million in repurchases of common stock and $9.3 million for dividends paid to stockholders, and $12.5 million of net borrowings under the Company's revolving line
23
of credit. In addition, we made payments of $16.2 million to the seller of VAC in 2014. We remain in discussions with the seller regarding the remainder of the withheld consideration of $46.2 million.
The cash used in financing activities in 2013 was primarily for prepayment of long-term debt using proceeds from divestitures of our Advanced Materials and UPC businesses, additional pre-payment of long-term debt utilizing cash on hand, repurchases of common stock, and payments made to the seller of VAC.
Net cash used in financing activities in 2012 included $466.5 million of debt repayments.
Financial Condition
Cash balances are held in numerous locations throughout the world. As of December 31, 2014, most of our cash and cash equivalents were held outside the United States, primarily in Germany. Most of the amounts held outside the U.S. could be repatriated to the U.S. but, under current law, would be subject to U.S. income taxes, less applicable foreign tax credits. Our intent is to retain the majority of our cash balances where generated and to meet U.S. liquidity needs through cash generated from operations in the U.S., limited repatriation of future foreign earnings, and external borrowings. We expect our available cash, 2015 operating cash flows and availability under our credit facility described below to be adequate to fund 2015 operating needs and capital expenditures.
Debt and Other Financing Activities
On September 4, 2013 we entered into a five-year Senior Secured Revolving Credit Facility (“the Facility”), and terminated our previous credit facility dated August 2, 2011 that was scheduled to expire in August 2016. The Facility provides for $350 million of revolving borrowing capacity and includes an expansion option of up to an additional $150 million, subject to certain conditions. The borrowers under the agreement are the Company, Harko C.V. (“Harko”), a limited partnership organized under the laws of the Netherlands, and VAC Germany GmbH (“VAC”), a limited liability company under the laws of Germany. Harko and VAC are wholly-owned subsidiaries of the Company. The Facility matures on September 4, 2018. As of December 31, 2014, we had $12.5 million outstanding under this credit facility, which was repaid with available cash in January 2015. In the first six months of 2013 we repaid the Term A and Term B loans under the previous credit facility with the proceeds from the divestitures of the Advanced Materials and UPC businesses, as required, and cash on hand. See Note 7 in the Notes to Consolidated Financial Statements included in Item 8 of this Form 10-K for further discussion of the Facility.
Pension Plans
As a result of the VAC acquisition, we hold pension obligations of $184.0 million as of December 31, 2014, substantially all of which are unfunded. VAC sponsors various defined benefit plans for its employees, including pension, early retirement benefits and anniversary benefits, mainly in Germany. As a result of the EaglePicher acquisition, we assumed the EaglePicher defined benefit pension obligations, made up of two frozen and two active, partially-funded defined benefit pension plans. Certain non-U.S. employees are covered under other defined benefit plans. See Critical Accounting Policies below and Note 11 in the Notes to Consolidated Financial Statements included in Item 8 of this Form 10-K for further discussion of our pension plans.
Contractual Obligations
We have entered into contracts with various third parties in the normal course of business that will require future payments. The following table summarizes our contractual cash obligations and their expected maturities at December 31, 2014.
Payments due by period | ||||||||||||||||||||||||||||
2015 | 2016 | 2017 | 2018 | 2019 | Thereafter | Total | ||||||||||||||||||||||
Purchase and other obligations(1) | $ | 185.5 | $ | 5.5 | $ | 1.8 | $ | 1.8 | $ | 1.2 | $ | 0.6 | $ | 196.4 | ||||||||||||||
Capital lease obligations (principal and interest) | 0.7 | 0.7 | 0.6 | 0.4 | 0.4 | 0.4 | 3.2 | |||||||||||||||||||||
Operating lease obligations | 6.6 | 6.0 | 5.1 | 3.4 | 2.1 | 8.2 | 31.4 | |||||||||||||||||||||
Total | $ | 192.8 | $ | 12.2 | $ | 7.5 | $ | 5.6 | $ | 3.7 | $ | 9.2 | $ | 231.0 | ||||||||||||||
(1) | For 2015 through 2019, purchase obligations include raw material contractual obligations reflecting estimated future payments based on committed tons of material per the applicable contract multiplied by the reference price of each metal. The price used in the computation is the average price for the month of December 2014 for each respective metal. Commitments made under these contracts represent future purchases in line with expected usage. |
24
Not included in the table above is $46.2 million of the VAC purchase price we withheld to fund indemnification claims. See Note 5 to the Consolidated Financial Statements included in Item 8 of this Form 10-K for further discussion of the amount withheld.
Pension funding can vary significantly each year due to changes in the market value of plan assets, legislation and our funding decisions to contribute any excess above the minimum legislative funding requirements. As a result, pension funding has not been included in the table above. We expect to contribute $0.7 million to our U.S. pension plans in 2015. Pension benefit payments for the U.S. pension plans are made from assets of the pension plans. We expect to make annual benefit payments of approximately $10.7 million related to our non-U.S. pension plans in 2015.
At December 31, 2014, the liability for uncertain tax positions includes $5.9 million for which it is reasonably possible the uncertainty will be resolved within the next twelve months. We are not able to reasonably estimate the period in which cash outflows related to the remaining $7.8 million of uncertain tax positions could occur, if at all. See Note 10 to the Consolidated Financial Statements included in Item 8 of this Form 10-K for further discussion of our uncertain tax positions.
Off Balance Sheet Arrangements
We have not entered into any off balance sheet financing arrangements, other than operating leases, which are disclosed in the contractual obligations table above and in Note 16 to the Consolidated Financial Statements included in Item 8 of this Form 10-K.
Critical Accounting Policies
The preparation of these financial statements in conformity with US generally accepted accounting principles ("US GAAP") requires our management to make its best estimates, judgments and assumptions of certain amounts included in the financial statements related to the critical accounting policies described below. Actual results could differ from our estimates. In addition, other companies may utilize different estimates, which may impact the comparability of our results of operations to similar businesses.
Revenue Recognition — Revenues are recognized when the revenue is realized or realizable, and has been earned, in accordance with the U.S. Securities and Exchange Commission’s Staff Accounting Bulletin No. 104, “Revenue Recognition". The majority of our sales are product sales, which are recognized when persuasive evidence of an arrangement exists, unaffiliated customers take title and assume risk of loss, the sales price is fixed or determinable and collection of the related receivable is reasonably assured. Revenue recognition generally occurs upon shipment of product or usage of consignment inventory. Freight costs and any directly related associated costs of transporting finished product to customers are recorded as Cost of goods sold.
The Battery Technologies segment uses the percentage-of-completion method to recognize the majority of its revenue. See Note 1 in our Consolidated Financial Statements included in Item 8 of this Form 10-K for a more complete discussion on revenue recognized under the percentage of completion method.
Inventories — Magnetic Technologies' inventories are valued using the average cost method. Cost of sales, under the average cost method, represents the weighted average cost of the items sold. We believe the average cost method provides for a better matching of inventory costs with related sales, based on Magnetic Technologies' manufacturing process. The remaining inventory held is valued using the first-in, first-out (“FIFO”) method. Inventory accounted for under the percentage-of-completion method is included in work-in-process inventory and represents accumulated contract costs less the portion of such costs allocated to delivered units. The costs attributed to units delivered are based on the estimated average cost of all units expected to be produced on a contract-by-contract basis.
We evaluate the need for a lower of cost or market (“LCM”) adjustment to inventories based on the selling prices of our finished products. Changes in the price of rare earth and other materials can have a significant impact on inventory valuation. Declines in the selling prices of finished goods due to decreases in the market price of raw materials or other factors can result in the inventory carrying value being written down to a lower market value.
Goodwill — We had goodwill of $252.6 million and $432.7 million at December 31, 2014 and 2013, respectively. We test goodwill for impairment annually and more often if indicators of impairment exist. Our reporting units have been determined to be our reportable segments or one level below the reportable segments in certain instances.
We estimate the fair value of a reporting unit (including goodwill) and compare that amount to the carrying value of that reporting unit. If the estimated fair value of the reporting unit is less than its carrying value, a second step would be undertaken to determine the implied fair value of goodwill of the reporting unit, which is then compared with the carrying value of the goodwill of the reporting unit. This second step would include valuing all of the tangible and
25
intangible assets and liabilities of the reporting unit as if they had been acquired in a business combination on the testing date.
We conduct our annual goodwill impairment test as of October 1. The results of testing as of October 1, 2014 for all reporting units except Magnetic Technologies confirmed that the estimated fair value of each of the reporting units substantially exceeded its carrying value and no impairment loss was required to be recognized. During a strategic evaluation by the management team, led by the new business leader, of the business and of various opportunities to optimize performance, we noted indicators of potential impairment in the Magnetic Technologies business, including deteriorating European macroeconomic conditions and increasing competition. The resulting test confirmed that the carrying value of the Magnetic Technologies business exceeded its fair value for goodwill. In the fourth quarter of 2014, we performed the second step as discussed above and goodwill impairment of $168.7 million was recognized.
The results of testing as of October 1, 2013 and 2012 for all reporting units except Magnetic Technologies in 2012 confirmed that the estimated fair value of each of the reporting units substantially exceeded its carrying value and no impairment loss was required to be recognized. The October 1, 2012 estimated fair value of the Magnetic Technologies reporting unit exceeded its carrying value by 4%.
We estimated the fair value of the reporting units utilizing a discounted cash flow valuation technique (“DCF”). We selected DCF as we believe it is comparable to what would be used by market participants to estimate its fair value. The impairment test incorporates our judgment and estimates of future cash flows, future growth rates, terminal value amounts, allocations of certain assets, liabilities and cash flows among reporting units, and the applicable weighted-average cost of capital used to discount those estimated cash flows. The estimates and projections used in the estimate of fair value are consistent with our current budget and long-range plans, including anticipated changes in market conditions, industry trends, growth rates, and planned capital expenditures, among other considerations. See Note 6 in our Consolidated Financial Statements included in Item 8 of this Form 10-K for a more complete discussion of goodwill.
Other Intangible Assets — Intangible assets consist of (i) definite-lived assets subject to amortization and (ii) indefinite-lived intangible assets not subject to amortization. At December 31, 2014 and 2013, we had definite-lived intangible assets of $247.0 million and $288.9 million and indefinite-lived intangible assets of $77.8 million and $114.1 million, respectively. Definite-lived intangible assets consist principally of customer relationships, know-how, developed technology and capitalized software and are being amortized using the straight-line or other appropriate methods if applicable. Indefinite-lived intangible assets consist of tradenames. The carrying values of indefinite-lived intangible assets are also evaluated for impairment annually utilizing the discounted cash flow method based on royalty relief as of October 1 and whenever events or changes in circumstances indicate that the carrying value may not be recoverable. The definite-lived intangible asset would be considered impaired if the future net undiscounted cash flows generated by the asset are less than its carrying value. During a strategic evaluation by the management team we noted indicators of potential impairment at the Magnetic Technologies business as discussed above. In the fourth quarter of 2014, we performed the discounted cash flow calculation based on a relief of royalty method and determined that the value for the Magnetic Technologies tradename was less than the carrying value and a tradename impairment of $26.7 million was recognized.
Long-lived Assets - The goodwill and intangible asset impairment led to an impairment review of the Magnetic Technologies long-lived assets other than goodwill and indefinite lived intangibles. The future net undiscounted cash flows generated by the assets were greater than the carrying value, indicating no impairment of long-lived assets.
Pension Plans — Our long-term pension obligations as of December 31, 2014 amounted to $244.4 million. In addition, we have an unfunded obligation to our former chief executive officer in settlement of an unfunded supplemental executive retirement plan (“SERP”). Calculations of the amount of defined benefit pension expense and obligations depend on the assumptions used in the actuarial valuations including the discount rate used in calculating the present value of benefits, the expected long-term rate of return on defined benefit plan assets, and the rate of compensation increase. Changes in key economic indicators can result in changes in the assumptions we use. While we believe that the assumptions used in calculating our defined benefit pension expense and obligations are appropriate, differences in actual experience or changes in the assumptions may affect our results of operations or financial position.
For the VAC defined benefit pension obligations, we used a weighted average discount rate of 2.0% in computing the amount of the defined benefit pension obligations to be recorded at December 31, 2014. A 25 basis point reduction in the discount rate used for the plans would have increased the net obligation by $4.7 million from the amount recorded in the financial statements at December 31, 2014.
26
For the EaglePicher defined benefit pension obligations, we used a weighted average discount rate of 3.5% and 3.7% for the two active and two frozen EaglePicher plans, respectively, in computing the amount of the defined benefit pension obligations to be recorded at December 31, 2014. A 25 basis point reduction in the discount rate used for the plans would have increased the net obligation related to the four EaglePicher plans by $5.3 million from the amount recorded in the financial statements at December 31, 2014.
Defined benefit pension plan assets consist primarily of publicly traded stocks and government and corporate bonds. There is no guarantee the actual return on the plans' assets will equal the expected long-term rate of return on plan assets or that the plans will not incur investment losses. For 2014, the expected long-term rate of return assumptions applicable to assets held in the four EaglePicher plans offsetting the obligation was an estimated 6.5% for the two active and two frozen plans. These expected rates of return reflect the asset allocation of the plans and the expected long-term returns on equity and debt investments included in plan assets. If the expected long-term rates of return on plan assets in the four EaglePicher plans were reduced by 50 basis points, pension expense for 2014 would have increased by $0.8 million.
See Note 11 in our Consolidated Financial Statements included in Item 8 of this Form 10-K for a more complete discussion of pension plans.
Income Taxes — Significant judgment is required in determining our income tax expense and in evaluating tax positions. Deferred income tax assets and liabilities have been recorded for the differences between the financial accounting and income tax basis of assets and liabilities. When we determine, based on all available evidence, that it is more likely than not that deferred tax assets will not be realized, a valuation allowance is established. We assess our income tax positions and record accruals when we determine that a position is more likely than not to be unsustainable. The ultimate resolution of these events could result in adjustments to our financial statements and such adjustments could be material. We believe the current assumptions, judgments and other considerations used to estimate the current year accrued and deferred tax positions are appropriate. If the actual outcome of future tax consequences differs from these estimates and assumptions, due to changes or future events, the resulting change to the provision for income taxes could have a material impact on our results of operations and financial position. We review our tax positions on a regular basis and adjust the balances as new information becomes available. See Note 10 in our Consolidated Financial Statements included in Item 8 of this Form 10-K for a more complete discussion of income taxes.
Share-Based Compensation — We use a Black-Scholes option pricing model to calculate the fair value of our stock options. The fair value of time-based and performance-based restricted stock grants is calculated based upon the market value of an unrestricted share of our common stock at the date of grant. The performance-based restricted stock vests solely upon our achievement of specific measurable performance objectives over a three-year performance period, and the related compensation expense is based upon current performance projections. This requires the use of assumptions, including estimating the length of time employees will retain their vested stock options before exercising and the volatility of the our common stock price. Expected stock price volatility is based on historical volatility of our stock price. Changes in these assumptions may result in a material change to the fair value calculation of share-based awards. See Note 14 in our Consolidated Financial Statements included in Item 8 of this Form 10-K for a more complete discussion of share-based compensation.
Acquisitions - The allocation of the purchase price to the tangible assets and liabilities and identifiable intangible assets acquired requires management to make significant estimates in determining the fair values of assets acquired and liabilities assumed, especially with respect to intangible assets in the Ener-Tek and VAC acquisitions and inventory in the VAC acquisition. These estimates are based on historical experience, information obtained from management of the acquired companies, and future volume forecasts with respect to the contingent consideration. These estimates are dependent on assumptions that are difficult to predict, and if different estimates were used, the purchase price for the acquisition may have been allocated to the acquired assets differently from the current allocation. Although we believe the assumptions, judgments and estimates used are reasonable and appropriate, different assumptions, judgments and estimates could materially affect the value ascribed to an acquired asset and, potentially, our results of operations and financial position if impairment charges were required to be recorded.
Recently Issued Accounting Standards
See Note 2 in our Consolidated Financial Statements included in Item 8 of this Form 10-K for recently issued accounting standards and the effects, if any, on our financial statements.
27
Effects of Foreign Currency
See Item 7A for a discussion of our foreign currency effects and related risks.
Environmental Matters
We are subject to a wide variety of environmental laws and regulations in the United States and in other countries as a result of our operations and use of certain substances that are, or have been, used, produced or discharged by our plants. In addition, soil and/or groundwater contamination presently exists and may in the future be discovered at levels that require remediation under environmental laws at properties we now or previously owned, operated or used.
Due to the ongoing development and understanding of facts and remedial options and due to the possibility of unanticipated regulatory developments, the amount and timing of future environmental expenditures could vary significantly. Although it is difficult to quantify the potential impact of compliance with or liability under environmental protection laws, based on presently available information, we believe that our ultimate aggregate cost of environmental remediation as well as liability under environmental protection laws will not result in a material adverse effect upon our financial condition or results of operations.
See Item I of this Annual Report on Form 10-K for further discussion of these matters.
Cautionary Statement for “Safe Harbor” Purposes under the Private Securities Litigation Reform Act of 1995
The Private Securities Litigation Reform Act of 1995 provides a safe harbor for forward-looking statements made by or on behalf of the Company. This report contains statements that we believe may be “forward-looking statements” within the meaning of Section 21E of the Securities Exchange Act of 1934. These forward-looking statements are not historical facts and generally can be identified by use of statements that include words such as “believe,” “expect,” “anticipate,” “intend,” “plan,” “foresee” or other words or phrases of similar import. Similarly, statements that describe our business objectives, plans or goals also are forward-looking statements. These forward-looking statements are based upon specific assumptions and are subject to uncertainties and factors relating to the company's operations and business environment, all of which are difficult to predict and many of which are beyond our control. These uncertainties and factors could cause actual results of the company to differ materially from those expressed or implied in the forward-looking statements. We undertake no obligation to publicly revise these forward-looking statements to reflect events or circumstances that arise after the date hereof. Significant factors affecting these expectations are set forth under Item 1A — Risk Factors in this Annual Report on Form 10-K.
Item 7A. Quantitative and Qualitative Disclosures about Market Risk
Quantitative and Qualitative Disclosures about Market Risk
As a result of our global operating and financing activities, we are exposed to changes in raw material prices, interest rates and foreign currency exchange rates, which may have a material adverse effect on our business, financial condition and results of operation. In seeking to minimize the risks and/or costs associated with such activities, we manage exposures to changes in raw material prices, interest rates and foreign currency exchange rates through our regular operating and financing activities, which may include the use of derivative instruments.
Raw Material Price Risk
The primary raw materials used by Magnetic Technologies are nickel, cobalt and certain rare earth materials, mostly dysprosium and neodymium. The cost of raw materials fluctuates due to changes in the reference prices (rare earths), actual or perceived changes in supply and demand of raw materials and changes in availability from suppliers. Fluctuations in the price of rare earth materials and other raw materials have been significant in the past and we believe price fluctuations could occur in the future.
We attempt to mitigate increases in raw material prices by passing through such increases to our customers in the prices of our products and, when possible, by entering into sales contracts that contain variable pricing that adjusts based on changes in the price of certain raw materials. During periods of rapidly changing metal prices there may be price lags that can positively or negatively impact the short-term profitability and cash flow from operations of the Company. Declines in the selling prices of our finished goods, which can result from decreases in the market price of raw materials or other factors, can result in our inventory carrying value being written down to a lower market value.
From time to time we employ derivative instruments in connection with certain purchases and sales of nickel in order to establish a fixed margin and mitigate the risk of price volatility. This hedging limits our ability to participate in gains from favorable commodity price fluctuations and limits the risk of loss from adverse commodity price fluctuations.
28
Interest Rate Risk
We are exposed to interest rate risk primarily through our borrowing activities. There is an inherent rollover risk for borrowings as they mature and are renewed at current market rates. The extent of this risk is not quantifiable or predictable because of the variability of future interest rates and business financing requirements (see Note 7 in our Consolidated Financial Statements contained in Item 8 of this Annual Report).
From time-to-time, we enter into derivative instruments and hedging activities to manage interest rate risk related to borrowings. We use interest rate swap agreements to partially reduce risks related to floating rate financing agreements that are subject to changes in the market rate of interest. Terms of the interest rate swap agreements require us to receive a variable interest rate and pay a fixed interest rate. We had no outstanding interest rate swaps of December 31, 2013 or 2014.
Foreign Currency Exchange Rate Risk
We manufacture and sell our products worldwide. Prices of certain raw materials, non-U.S. operating expenses and income taxes are denominated in local currencies. As such, the results of operations are subject to the variability that arises from exchange rate movements (particularly the Euro). In addition, fluctuations in exchange rates may affect product demand and profitability in U.S. dollars of products we provide in foreign markets in cases where payments for our products are made in local currency. Accordingly, fluctuations in currency prices affect the Company’s operating results. The primary currencies for which we have foreign currency rate exposure are the European Union Euro, Taiwanese Dollar, Malaysian Ringgit, Singapore Dollar, British Pound Sterling, Chinese Renminbi and the Canadian Dollar.
Item 8. Financial Statements and Supplementary Data
Report of Independent Registered Public Accounting Firm
The Board of Directors and Stockholders of OM Group, Inc. and subsidiaries
We have audited the accompanying consolidated balance sheets of OM Group, Inc. and subsidiaries as of December 31, 2014 and 2013, and the related statements of consolidated operations, consolidated comprehensive loss, consolidated total stockholders' equity, and consolidated cash flows for each of the three years in the period ended December 31, 2014. Our audits also included the financial statement schedule listed in the index at Item 15. These financial statements and schedule are the responsibility of the Company’s management. Our responsibility is to express an opinion on these financial statements and schedule based on our audits.
We conducted our audits in accordance with the standards of the Public Company Accounting Oversight Board (United States). Those standards require that we plan and perform the audit to obtain reasonable assurance about whether the financial statements are free of material misstatement. An audit includes examining, on a test basis, evidence supporting the amounts and disclosures in the financial statements. An audit also includes assessing the accounting principles used and significant estimates made by management, as well as evaluating the overall financial statement presentation. We believe that our audits provide a reasonable basis for our opinion.
In our opinion, the financial statements referred to above present fairly, in all material respects, the consolidated financial position of OM Group, Inc. and subsidiaries at December 31, 2014 and 2013, and the consolidated results of its operations and its cash flows for each of the three years in the period ended December 31, 2014, in conformity with U.S. generally accepted accounting principles. Also, in our opinion, the related financial statement schedule, when considered in relation to the basic financial statements taken as a whole, presents fairly in all material respects the information set forth therein.
We also have audited, in accordance with the standards of the Public Company Accounting Oversight Board (United States), OM Group, Inc. and subsidiaries’ internal control over financial reporting as of December 31, 2014, based on criteria established in Internal Control-Integrated Framework issued by the Committee of Sponsoring Organizations of the Treadway Commission (2013 framework) and our report dated March 2, 2015, expressed an unqualified opinion thereon.
/s/ Ernst & Young LLP
Cleveland, Ohio
March 2, 2015
Report of Independent Registered Public Accounting Firm
The Board of Directors and Stockholders of OM Group, Inc. and subsidiaries
We have audited OM Group, Inc. and subsidiaries’ internal control over financial reporting as of December 31, 2014, based on criteria established in Internal Control-Integrated Framework issued by the Committee of Sponsoring Organizations of the Treadway Commission “(2013 framework)” (the COSO criteria). OM Group, Inc. and subsidiaries’ management is responsible for maintaining effective internal control over financial reporting, and for its assessment of the effectiveness of internal control over financial reporting included in the accompanying Management’s Report on Internal Control over Financial Reporting. Our responsibility is to express an opinion on the company’s internal control over financial reporting based on our audit.
We conducted our audit in accordance with the standards of the Public Company Accounting Oversight Board (United States). Those standards require that we plan and perform the audit to obtain reasonable assurance about whether effective internal control over financial reporting was maintained in all material respects. Our audit included obtaining an understanding of internal control over financial reporting, assessing the risk that a material weakness exists, testing and evaluating the design and operating effectiveness of internal control based on the assessed risk, and performing such other procedures as we considered necessary in the circumstances. We believe that our audit provides a reasonable basis for our opinion.
A company’s internal control over financial reporting is a process designed to provide reasonable assurance regarding the reliability of financial reporting and the preparation of financial statements for external purposes in accordance with generally accepted accounting principles. A company’s internal control over financial reporting includes those policies and procedures that (1) pertain to the maintenance of records that, in reasonable detail, accurately and fairly reflect the transactions and dispositions of the assets of the company; (2) provide reasonable assurance that transactions are recorded as necessary to permit preparation of financial statements in accordance with generally accepted accounting principles, and that receipts and expenditures of the company are being made only in accordance with authorizations of management and directors of the company; and (3) provide reasonable assurance regarding prevention or timely detection of unauthorized acquisition, use or disposition of the company’s assets that could have a material effect on the financial statements.
Because of its inherent limitations, internal control over financial reporting may not prevent or detect misstatements. Also, projections of any evaluation of effectiveness to future periods are subject to the risk that controls may become inadequate because of changes in conditions, or that the degree of compliance with the policies or procedures may deteriorate.
In our opinion, OM Group, Inc. and subsidiaries maintained, in all material respects, effective internal control over financial reporting as of December 31, 2014, based on the COSO criteria.
We also have audited, in accordance with the standards of the Public Company Accounting Oversight Board (United States), the consolidated balance sheets as of December 31, 2014 and 2013, and the related statements of consolidated operations, consolidated comprehensive loss, consolidated total stockholders' equity, and consolidated cash flows for each of the three years in the period ended December 31, 2014 of OM Group, Inc. and subsidiaries and our report dated March 2, 2015 expressed an unqualified opinion thereon.
/s/ Ernst & Young LLP
Cleveland, Ohio
March 2, 2015
29
OM Group, Inc. and Subsidiaries
Consolidated Balance Sheets
December 31, 2014 | December 31, 2013 | |||||||||
(In millions, except share and per share data) | ||||||||||
ASSETS | ||||||||||
Current assets | ||||||||||
Cash and cash equivalents | $ | 91.7 | $ | 118.4 | ||||||
Accounts receivable, less allowance of $2.5 in 2014 and $3.9 in 2013 | 134.5 | 150.7 | ||||||||
Inventories | 228.4 | 240.9 | ||||||||
Other current assets | 21.5 | 32.3 | ||||||||
Total current assets | 476.1 | 542.3 | ||||||||
Property, plant and equipment, net | 308.3 | 345.6 | ||||||||
Goodwill | 252.6 | 432.7 | ||||||||
Intangible assets, net | 324.8 | 403.0 | ||||||||
Other non-current assets | 57.7 | 59.5 | ||||||||
Total assets | $ | 1,419.5 | $ | 1,783.1 | ||||||
LIABILITIES AND STOCKHOLDERS’ EQUITY | ||||||||||
Current liabilities | ||||||||||
Revolving credit facility | $ | 12.5 | $ | — | ||||||
Accounts payable | 74.7 | 93.6 | ||||||||
Accrued income taxes | 5.6 | 4.2 | ||||||||
Accrued employee costs | 34.9 | 36.2 | ||||||||
Purchase price of VAC payable to seller | 46.2 | 52.5 | ||||||||
Other current liabilities | 51.8 | 59.2 | ||||||||
Total current liabilities | 225.7 | — | 245.7 | |||||||
Deferred income taxes | 74.8 | 102.5 | ||||||||
Pension liabilities | 244.4 | 220.5 | ||||||||
Purchase price of VAC payable to seller | — | 11.3 | ||||||||
Other non-current liabilities | 37.7 | 43.3 | ||||||||
Stockholders’ equity: | ||||||||||
Preferred stock, $.01 par value: | ||||||||||
Authorized 2,000,000 shares, no shares issued or outstanding | — | — | ||||||||
Common stock, $.01 par value: | ||||||||||
Authorized 90,000,000 shares; 32,408,222 shares issued in 2014 and 32,304,490 shares issued in 2013 | 0.3 | 0.3 | ||||||||
Capital in excess of par value | 647.3 | 639.8 | ||||||||
Retained earnings | 405.3 | 587.2 | ||||||||
Treasury stock (2,136,116 shares in 2014 and 825,956 shares in 2013, at cost) | (58.2 | ) | (22.3 | ) | ||||||
Accumulated other comprehensive loss | (157.8 | ) | (45.2 | ) | ||||||
Total stockholders' equity | 836.9 | 1,159.8 | ||||||||
Total liabilities and stockholders' equity | $ | 1,419.5 | $ | 1,783.1 | ||||||
See accompanying notes to consolidated financial statements.
OM Group, Inc. and Subsidiaries
Statements of Consolidated Operations
Year Ended December 31 | |||||||||||||
2014 | 2013 | 2012 | |||||||||||
(In millions, except per share data) | |||||||||||||
Net sales | $ | 1,067.5 | $ | 1,157.5 | $ | 1,544.4 | |||||||
Cost of goods sold | 829.3 | 899.1 | 1,300.8 | ||||||||||
Gross profit | 238.2 | 258.4 | 243.6 | ||||||||||
Selling, general and administrative expenses | 207.9 | 217.3 | 251.2 | ||||||||||
Goodwill and intangible asset impairment | 195.4 | — | — | ||||||||||
Gain on sale of property | — | — | (2.9 | ) | |||||||||
Operating profit (loss) | (165.1 | ) | 41.1 | (4.7 | ) | ||||||||
Other income (expense): | |||||||||||||
Interest expense | (2.6 | ) | (12.3 | ) | (49.7 | ) | |||||||
Foreign exchange gain (loss) | (6.5 | ) | 8.0 | (0.8 | ) | ||||||||
Gain (loss) on divestiture of Advance Materials business | 1.7 | (111.6 | ) | — | |||||||||
Other, net | (0.3 | ) | 12.0 | 6.6 | |||||||||
(7.7 | ) | (103.9 | ) | (43.9 | ) | ||||||||
Loss from continuing operations before income tax expense | (172.8 | ) | (62.8 | ) | (48.6 | ) | |||||||
Income tax expense (benefit) | (0.5 | ) | 10.7 | (3.2 | ) | ||||||||
Loss from continuing operations, net of tax | (172.3 | ) | (73.5 | ) | (45.4 | ) | |||||||
Loss from discontinued operations, net of tax | (0.3 | ) | (12.3 | ) | (0.4 | ) | |||||||
Consolidated net loss | (172.6 | ) | (85.8 | ) | (45.8 | ) | |||||||
Net loss attributable to noncontrolling interests | — | 1.8 | 7.1 | ||||||||||
Loss attributable to OM Group, Inc. common stockholders | $ | (172.6 | ) | $ | (84.0 | ) | $ | (38.7 | ) | ||||
Earnings per common share — basic: | |||||||||||||
Loss from continuing operations attributable to OM Group, Inc.common stockholders | $ | (5.54 | ) | $ | (2.27 | ) | $ | (1.21 | ) | ||||
Loss from discontinued operations attributable to OM Group, Inc. common stockholders | (0.01 | ) | (0.39 | ) | (0.01 | ) | |||||||
Net loss attributable to OM Group, Inc. common stockholders | $ | (5.55 | ) | $ | (2.66 | ) | $ | (1.22 | ) | ||||
Earnings per common share — assuming dilution: | |||||||||||||
Loss from continuing operations attributable to OM Group, Inc. common stockholders | $ | (5.54 | ) | $ | (2.27 | ) | $ | (1.21 | ) | ||||
Loss from discontinued operations attributable to OM Group, Inc. common stockholders | (0.01 | ) | (0.39 | ) | (0.01 | ) | |||||||
Net loss attributable to OM Group, Inc. common stockholders | $ | (5.55 | ) | $ | (2.66 | ) | $ | (1.22 | ) | ||||
Weighted average shares outstanding | |||||||||||||
Basic | 31.1 | 31.6 | 31.9 | ||||||||||
Assuming dilution | 31.1 | 31.6 | 31.9 | ||||||||||
Dividends declared per common share | $ | 0.30 | $ | — | $ | — | |||||||
Amounts attributable to OM Group, Inc. common stockholders: | |||||||||||||
Loss from continuing operations, net of tax | $ | (172.3 | ) | $ | (71.7 | ) | $ | (38.3 | ) | ||||
Loss from discontinued operations, net of tax | (0.3 | ) | (12.3 | ) | (0.4 | ) | |||||||
Net loss | $ | (172.6 | ) | $ | (84.0 | ) | $ | (38.7 | ) | ||||
See accompanying notes to consolidated financial statements.
OM Group, Inc. and Subsidiaries
Statements of Consolidated Comprehensive Loss
Year Ended December 31 | |||||||||||||
2014 | 2013 | 2012 | |||||||||||
(In millions) | |||||||||||||
Consolidated net loss | $ | (172.6 | ) | $ | (85.8 | ) | $ | (45.8 | ) | ||||
Foreign currency translation adjustments | (81.7 | ) | 25.0 | 20.7 | |||||||||
Reclassification of hedging activities into earnings, net of tax | 0.2 | 0.2 | (1.9 | ) | |||||||||
Unrealized (loss) gain on cash flow hedges, net of tax | — | (0.3 | ) | 5.9 | |||||||||
Pension and post-retirement obligation, net of tax | (31.1 | ) | 17.9 | (19.3 | ) | ||||||||
Net change in accumulated other comprehensive income (loss) | (112.6 | ) | 42.8 | 5.4 | |||||||||
Comprehensive loss | (285.2 | ) | (43.0 | ) | (40.4 | ) | |||||||
Comprehensive loss attributable to noncontrolling interests | — | 1.8 | 7.1 | ||||||||||
Comprehensive loss attributable to OM Group, Inc. | $ | (285.2 | ) | $ | (41.2 | ) | $ | (33.3 | ) | ||||
See accompanying notes to consolidated financial statements.
OM Group, Inc. and Subsidiaries
Statements of Consolidated Cash Flows
See accompanying notes to consolidated financial statements
Year Ended December 31 | ||||||||||||
(In millions) | 2014 | 2013 | 2012 | |||||||||
Operating activities | ||||||||||||
Consolidated net loss | $ | (172.6 | ) | $ | (85.8 | ) | $ | (45.8 | ) | |||
Adjustments to reconcile consolidated net loss to net cash provided by operating activities: | ||||||||||||
Loss from discontinued operations | 0.3 | 12.3 | 0.4 | |||||||||
Depreciation and amortization | 67.5 | 73.9 | 84.3 | |||||||||
Goodwill and intangible asset impairment charges | 195.4 | — | — | |||||||||
Share-based compensation expense | 7.6 | 6.2 | 5.8 | |||||||||
Foreign exchange loss (gain) | 6.5 | (8.0 | ) | 0.8 | ||||||||
Deferred income tax benefit | (17.2 | ) | (7.3 | ) | (30.2 | ) | ||||||
VAC lower of cost or market ("LCM") charges | — | — | 78.4 | |||||||||
(Gain) loss on divestiture of Advanced Materials business | (1.7 | ) | 111.6 | — | ||||||||
Adjustment to contingent consideration | — | (13.0 | ) | — | ||||||||
Other non-cash items | 9.0 | 5.5 | 0.1 | |||||||||
Changes in operating assets and liabilities, excluding the effect of business acquisitions: | ||||||||||||
Accounts receivable | 11.5 | (22.3 | ) | 39.4 | ||||||||
Inventories (includes $18.4 million of step-up amortization in 2012) | 3.8 | 25.0 | 75.7 | |||||||||
Accounts payable | (15.5 | ) | 12.5 | (43.0 | ) | |||||||
Refundable, prepaid and accrued income taxes | 1.8 | (21.1 | ) | 41.2 | ||||||||
Other, net | (11.0 | ) | (26.6 | ) | 2.4 | |||||||
Net cash provided by operating activities | 85.4 | 62.9 | 209.5 | |||||||||
Investing activities | ||||||||||||
Expenditures for property, plant and equipment | (34.5 | ) | (53.1 | ) | (67.6 | ) | ||||||
Proceeds from divestiture of Advanced Materials business | — | 328.7 | — | |||||||||
Proceeds from divestiture of UPC business | — | 63.3 | — | |||||||||
Cash (paid) for acquisitions or received from purchase adjustments | (24.6 | ) | — | 6.0 | ||||||||
Other, net | 1.0 | (5.0 | ) | 5.1 | ||||||||
Net cash provided by (used for) investing activities | (58.1 | ) | 333.9 | (56.5 | ) | |||||||
Financing activities | ||||||||||||
Dividends paid | (9.3 | ) | — | — | ||||||||
Payments on long-term debt | — | (466.5 | ) | (213.5 | ) | |||||||
Proceeds from revolving line of credit | 14.5 | — | — | |||||||||
Payments on revolving line of credit | (2.0 | ) | — | — | ||||||||
Payments related to VAC purchase price payable | (16.2 | ) | (23.0 | ) | — | |||||||
Debt issuance costs | (0.1 | ) | (2.3 | ) | — | |||||||
Payment related to surrendered shares | (0.7 | ) | (0.6 | ) | (0.3 | ) | ||||||
Share repurchases | (35.2 | ) | (14.1 | ) | — | |||||||
Proceeds from exercise of stock options | 0.5 | 2.8 | — | |||||||||
Net cash used for financing activities | (48.5 | ) | (503.7 | ) | (213.8 | ) | ||||||
Effect of exchange rate changes on cash | (4.7 | ) | 0.6 | 1.4 | ||||||||
Cash and cash equivalents | ||||||||||||
Decrease from continuing operations | (25.9 | ) | (106.3 | ) | (59.4 | ) | ||||||
Discontinued operations — net cash provided by (used) for operating activities | (0.8 | ) | (0.5 | ) | (1.0 | ) | ||||||
Discontinued operations — net cash used for investing activities | — | (2.4 | ) | (4.1 | ) | |||||||
Balance at the beginning of the year | 118.4 | 227.6 | 292.1 | |||||||||
Balance at the end of the year | $ | 91.7 | $ | 118.4 | $ | 227.6 | ||||||
30
OM Group, Inc. and Subsidiaries
Statements of Consolidated Total Stockholders' Equity
Year Ended December 31 | ||||||||||||
2014 | 2013 | 2012 | ||||||||||
(In millions, except share data) | ||||||||||||
Common Stock — Shares Outstanding, net of Treasury Shares (000's) | ||||||||||||
Beginning balance | 31,479 | 31,906 | 31,865 | |||||||||
Shares repurchased | (1,310 | ) | (609 | ) | (9 | ) | ||||||
Shares issued under share-based compensation plans | 103 | 182 | 50 | |||||||||
30,272 | 31,479 | 31,906 | ||||||||||
Common Stock — Dollars | ||||||||||||
Beginning balance | $ | 0.3 | $ | 0.3 | $ | 0.3 | ||||||
Shares issued (rounds to less than $0.1) | — | — | — | |||||||||
0.3 | 0.3 | 0.3 | ||||||||||
Capital in Excess of Par Value | ||||||||||||
Beginning balance | 639.8 | 631.1 | 625.5 | |||||||||
Shares issued under share-based compensation plans | 0.5 | 2.8 | — | |||||||||
Share-based compensation — employees | 6.5 | 5.4 | 5.0 | |||||||||
Share-based compensation — non-employee directors | 0.5 | 0.5 | 0.5 | |||||||||
647.3 | 639.8 | 631.1 | ||||||||||
Retained Earnings | ||||||||||||
Beginning balance | 587.2 | 671.2 | 709.9 | |||||||||
Net loss attributable to OM Group, Inc. | (172.6 | ) | (84.0 | ) | (38.7 | ) | ||||||
Common stock cash dividends | (9.3 | ) | — | — | ||||||||
405.3 | 587.2 | 671.2 | ||||||||||
Treasury Stock | ||||||||||||
Beginning balance | (22.3 | ) | (7.7 | ) | (7.4 | ) | ||||||
Reacquired shares | (35.9 | ) | (14.6 | ) | (0.3 | ) | ||||||
(58.2 | ) | (22.3 | ) | (7.7 | ) | |||||||
Accumulated Other Comprehensive Loss | ||||||||||||
Beginning balance | (45.2 | ) | (88.0 | ) | (93.4 | ) | ||||||
Foreign currency translation | (81.7 | ) | 25.0 | 20.7 | ||||||||
Reclassification of hedging into earnings, net of tax | 0.2 | 0.2 | (1.9 | ) | ||||||||
Unrealized (loss) gain on cash flow hedges, net of tax | — | (0.3 | ) | 5.9 | ||||||||
Pension and post-retirement obligation, net of tax | (31.1 | ) | 17.9 | (19.3 | ) | |||||||
(157.8 | ) | (45.2 | ) | (88.0 | ) | |||||||
Total OM Group Inc. Stockholders’ Equity | 836.9 | 1,159.8 | 1,206.9 | |||||||||
Noncontrolling interests | ||||||||||||
Beginning balance | — | 37.4 | 44.5 | |||||||||
Loss attributable to the noncontrolling interest | — | — | (7.1 | ) | ||||||||
Sale of noncontrolling interest | — | (37.4 | ) | — | ||||||||
— | — | 37.4 | ||||||||||
Total Equity | $ | 836.9 | $ | 1,159.8 | $ | 1,244.3 | ||||||
See accompanying notes to consolidated financial statements
Notes to Consolidated Financial Statements
OM Group, Inc. and Subsidiaries
(In millions, except as noted and share and per share amounts)
Note 1 — Significant Accounting Policies
Principles of Consolidation — OM Group, Inc. (the “Company”, “we”, “our”, “us”) is a technology-driven industrial company serving attractive global markets, including automotive systems, electronic devices, aerospace and defense, industrial and medical. We use innovative technologies to address customers' complex applications and demanding requirements. Our strategy is to grow organically through product and application innovation and new market and customer development, to grow strategically through complementary acquisitions to build-out our growth platforms, and to maximize total stockholder returns through a combination of business growth, financial discipline, optimal deployment of capital and continued operational excellence. Our objective is to deliver sustainable, profitable growth and create long-term stockholder value. The consolidated financial statements include the accounts of OM Group and its consolidated subsidiaries. We were formed in 1991 as a Delaware Corporation. Intercompany accounts and transactions have been eliminated in consolidation.
Certain financial data may have been rounded. As a result of such rounding, the totals of data presented in this document may vary slightly from the actual arithmetical totals of such data.
On November 24, 2014, we completed the acquisition of Ener-Tek International, Inc., which operates under the brand name Yardney Technical Products ("Yardney"), and now operates as a part of our Battery Technologies business. Based in East Greenwich, Rhode Island, Yardney is a designer, developer and manufacturer of high-performance lithium-ion and silver-zinc cells and batteries for niche applications in the defense and aerospace markets. We funded the $24.6 million acquisition price through existing cash balances.
On May 31, 2013, we completed the sale of our Ultra Pure Chemicals business. The results of our Ultra Pure Chemicals business are reported as discontinued operations in the accompanying unaudited condensed consolidated financial statements and Notes to Consolidated Financial Statements for all periods presented. See note 5 - Acquisitions and Divestitures.
On March 29, 2013, we completed the divestiture of our cobalt-based business. The transaction comprised the sale of the downstream portion of the business, (including its cobalt refinery assets in Kokkola, Finland) and the transfer of our 55% equity interests in the DRC-based joint venture known as GTL to the joint venture partners, subject to a security interest in our favor with respect to the joint venture's performance related to certain supply agreements. Until March 29, 2013, we consolidated the GTL joint venture because we had a controlling interest. Non-controlling interest was recorded for the remaining 45% interest. See note 5 - Acquisitions and Divestitures.
The financial position, results of operations and cash flows of acquisitions are included in the Consolidated Financial Statements from the dates of acquisition.
Unless otherwise indicated, all disclosures and amounts in the Notes to Consolidated Financial Statements relate to the Company's continuing operations.
Use of Estimates - The preparation of financial statements, in conformity with US generally accepted accounting policies ("US GAAP"), requires management to make estimates and assumptions in certain circumstances that affect the amounts reported in the accompanying consolidated financial statements and notes. Actual results could differ from these estimates.
Cash Equivalents - All highly-liquid investments, with a maturity of three months or less when purchased, are considered to be cash equivalents.
Allowance for Doubtful Accounts - We have recorded an allowance for doubtful accounts to record accounts receivable at their estimated net realizable value. The allowance is based upon an analysis of historical bad debts, a review of the aging of accounts receivable and the current creditworthiness of customers. Accounts are written off against the allowance when it becomes probable that collections will not occur. Trade credit is generally extended on a short-term basis and accounts receivable generally do not bear interest.
Inventories - Magnetic Technologies' inventories are valued using the average cost method. Cost of sales under the average cost method represents the weighted average cost of the items sold. We believe the average cost method provides for a better matching of inventory costs with related sales based on Magnetic Technologies' manufacturing process. Our remaining inventory is valued using First in, First out (FIFO). Inventory costs include raw materials, labor and manufacturing overhead. Inventory accounted for under the percentage-of-completion method is included in work-in-process inventory and represents accumulated contract costs less the portion of such costs allocated to delivered units. The costs attributed to units delivered are based on the estimated average cost of all units expected to be produced on a contract-by-contract basis.
Changes in the price of rare earth and other materials can have a significant impact on inventory valuation. We evaluate the need for a lower of cost or market (“LCM”) adjustment to inventories based on the selling prices of our finished products generally at the end of the period. To the extent raw material prices increase subsequent to the balance sheet date, we consider these price movements in our LCM evaluation. Declines in the selling prices of our finished goods, which can result from decreases in the market price of raw materials or other factors, can result in our inventory carrying value being written down to a lower market value.
Property, Plant and Equipment - Property, plant and equipment is recorded at historical cost less accumulated depreciation. Depreciation of plant and equipment, including assets recorded under capital leases, is provided by the straight-line method over the useful lives of 5 to 25 years for land improvements, 5 to 40 years for buildings and improvements, 5 to 15 years for machinery and equipment (with the majority in the range of 5 to 10 years), 5 to 10 years for furniture and fixtures and 3 to 5 years for vehicles and computers and related equipment. Leasehold improvements are depreciated over the shorter of the estimated useful life or the term of the lease.
Long-lived Assets other than Goodwill - Long-lived assets are reviewed for impairment whenever events or changes in circumstances indicate the carrying amount may not be recoverable. Events or circumstances that would result in an impairment review primarily include operating losses, a significant change in the use of an asset, or the planned disposal or sale of the asset. The asset would be considered impaired when the future net undiscounted cash flows generated by the asset are less than its carrying value. An impairment loss would be recognized based on the amount by which the carrying value of the asset exceeds its estimated fair value.
Goodwill and Intangible Assets - We evaluate the carrying value of goodwill and indefinite-lived intangible assets for impairment annually as of October 1 and between annual evaluations if changes in circumstances or the occurrence of certain events indicate potential impairment. If the carrying value of goodwill or an indefinite-lived intangible asset exceeds its fair value, an impairment loss is recognized.
Intangible assets consist of (i) definite-lived assets subject to amortization and (ii) indefinite-lived intangible assets not subject to amortization. Definite-lived intangible assets consist principally of customer relationships, developed technology, know-how, capitalized software and license agreements and are being amortized using the straight-line or other appropriate method, if applicable. Indefinite-lived intangible assets consist of tradenames.
Retained Liabilities of Businesses Sold - Retained liabilities of businesses sold include obligations related to our former Precious Metals Group (“PMG”), which was sold in 2003. Under terms of the sale agreement, we will reimburse the buyer of this business for certain items that become due and payable by the buyer subsequent to the sale date. Such items are principally comprised of taxes payable related to periods during which we owned PMG. The liability was $11.3 million and $12.3 million as of December 31, 2014 and 2013, respectively. Corresponding receivables related to the indemnification of the liabilities of $8.2 million and $9.1 million at December 31, 2014 and 2013, respectively, were recorded in Other non-current assets.
Revenue Recognition — Except for revenue recognized under the percentage of completion method of accounting in Battery Technologies (see discussion below), we recognize revenue when persuasive evidence of an arrangement exists, unaffiliated customers take title and assume risk of loss, the sales price is fixed or determinable and collection of the related receivable is reasonably assured. Revenue recognition generally occurs upon shipment of product or usage of inventory consigned to customers. All amounts in a sales transaction billed to a customer related to shipping and handling are reported as sales.
The Battery Technologies segment uses the percentage of completion method to recognize most of its revenue. Most defense contracts use the units-of-delivery method while most space contracts use the cost-to-cost method as the basis to measure progress toward completing a contract. Under the units-of-delivery method, revenues are recognized based on the contract price of units delivered. Under the cost-to-cost method, revenue is recognized based on the ratio of cost incurred compared to management's estimate of total costs expected to be incurred under the contract. The percentage of completion method requires substantial judgment on the part of management due to the duration of the contracts as well as the technical nature of the products involved. Contract revenues and cost estimates are reviewed at least quarterly and adjustments are reflected in the accounting period such amounts are determined. Billings in excess of amounts earned are deferred. Anticipated losses on contracts are recorded in full in the period in which the loss becomes evident.
Cost of Goods Sold — Cost of goods sold is comprised of raw material costs, direct production, maintenance and utility costs, depreciation, other overhead costs and shipping and handling costs.
Research and Development — Research and development costs are charged to expense when incurred, are included in selling, general and administrative expenses and amounted to $26.0 million, $26.3 million and $32.2 million in 2014, 2013 and 2012, respectively. These amounts do not include development and application engineering costs incurred in conjunction with fulfilling customer orders and executing projects.
Accounting for Operating Leases — Lease expense is recorded on a straight-line basis. The noncancellable lease term used to calculate the amount of the straight-line expense is generally determined to be the initial lease term, including any optional renewal terms that are reasonably assured. Certain leases include escalating rent provisions and lease incentives which are recognized as lease expense on a straight-line basis over the lease term. Lease payments that depend on an existing index or rate are included in our minimum lease payments that are recognized as lease expense on a straight-line basis over the minimum lease term.
Income Taxes — Deferred income taxes are provided to recognize the effect of temporary differences between financial and tax reporting. Deferred income taxes are not provided for undistributed earnings of foreign consolidated subsidiaries, to the extent such earnings are determined to be reinvested for an indefinite period of time.
Foreign Currency Translation — The functional currency for most of our operating subsidiaries outside of the United States is the applicable local currency. For those operations, assets and liabilities are translated into U.S. dollars at period-ending exchange rates and revenues and expenses are translated into U.S. dollars using average exchange rates. The resulting translation adjustments are recorded as a component of Accumulated other comprehensive income (loss) in stockholders’ equity. Accordingly, foreign currency exchange gains and losses related to assets, liabilities and transactions denominated in other currencies (principally the Euro) are included in the Statements of Consolidated Operations.
Derivative Instruments — We enter into derivative instruments and hedging activities to manage, where possible and economically efficient, commodity price risk, foreign currency exchange rate risk and interest rate risk related to borrowings. It is our policy to execute such instruments with creditworthy banks and not enter into derivative instruments for speculative purposes. All derivatives are reflected at their fair value and recorded in other current assets and other current liabilities as of December 31, 2013. There were no outstanding derivatives as of December 31, 2014. The accounting for the fair value of a derivative depends upon whether it has been designated as a hedge and on the type of hedging relationship. To qualify for designation in a hedging relationship, specific criteria must be met and appropriate documentation prepared. Changes in the fair values of derivatives not designated in a hedging relationship are recognized in earnings.
From time to time we employ derivative instruments in connection with purchases and sales of inventory in order to establish a fixed margin and mitigate the risk of price volatility. Some customers request fixed pricing and we may use a derivative to mitigate price risk. While this hedging may limit our ability to participate in gains from favorable commodity price fluctuations, it eliminates the risk of loss from adverse commodity price fluctuations.
Periodically, we enter into certain derivative instruments designated as cash flow hedges. For these hedges, the effective portion of the gain or loss from the financial instrument is initially reported as a component of Accumulated other comprehensive income (loss) in stockholders’ equity and subsequently reclassified into earnings in the same line as the hedged item in the same period or periods during which the hedged item affects earnings.
Note 2 — Recently Issued Accounting Guidance
In May 2014, the FASB issued ASU No. 2014-09, “Revenue from Contracts with Customers (Topic 606)” (“ASU 2014-09”). The update amends the guidance for revenue recognition to replace numerous, industry-specific requirements and converges areas under this topic with those of the International Financial Reporting Standards. The amendments are effective for reporting periods beginning after December 15, 2016, and early adoption is prohibited. Entities can transition to the standard either retrospectively or as a cumulative-effect adjustment as of the date of adoption. We are currently assessing the impact the adoption of ASU 2014-09 may have on our results of operations or financial position.
In July 2013, the FASB issued ASU 2013-11 Presentation of Unrecognized Tax Benefit When a Net Operating Loss Carryforward, a Similar Tax Loss, or a Tax Credit Carryforward exists. The update requires companies to offset a liability recorded for an unrecognized tax benefit against a related deferred tax asset of a net operating loss carryforward, a similar tax loss or a tax credit carryforward if such settlement is required or expected in the event the uncertain tax position is disallowed. The amendments are effective for fiscal years, and interim periods within those years, beginning after December 15, 2013. We adopted this guidance as of March 31, 2014 and reclassified a portion of our uncertain tax position accrual to net against the related deferred tax assets. Such adoption did not have an effect on our results of operations or financial position.
Note 3 — Inventories
Inventories consist of the following as of December 31,
2014 | 2013 | |||||||
Raw materials and supplies | $ | 73.6 | $ | 83.3 | ||||
Work-in-process | 118.1 | 122.2 | ||||||
Finished goods | 36.7 | 35.4 | ||||||
$ | 228.4 | $ | 240.9 | |||||
Note 4 — Property, Plant and Equipment, net
Property, plant and equipment, net consists of the following as of December 31,
2014 | 2013 | |||||||
Land and improvements | $ | 37.6 | $ | 39.6 | ||||
Buildings and improvements | 138.0 | 145.8 | ||||||
Machinery and equipment | 346.4 | 350.4 | ||||||
Furniture and fixtures | 8.2 | 7.6 | ||||||
Property, plant and equipment, at cost | 530.2 | 543.4 | ||||||
Less accumulated depreciation | (221.9 | ) | (197.8 | ) | ||||
$ | 308.3 | $ | 345.6 | |||||
Total depreciation expense on property, plant and equipment was $42.5 million in 2014, $47.7 million in 2013 and $58.7 million in 2012.
Note 5 — Acquisitions and Divestitures
(a) Acquisitions
Yardney
On November 24, 2014. we completed the acquisition of Ener-Tek International, Inc., which operates under the brand name Yardney Technical Products ("Yardney"). Based in East Greenwich, Rhode Island, Yardney is a designer, developer and manufacturer of high-performance lithium-ion and silver-zinc cells and batteries for niche applications in the defense and aerospace markets. We funded the $24.6 million acquisition price through existing cash balances. The balance sheet as the acquisition date is based on preliminary estimated purchase accounting. The purchase price was allocated to $10.1 million of net assets, including $5.5 million of identifiable intangibles. The remaining $14.5 million was recorded as goodwill, which is not expected to be deductible for tax purposes.
VAC
Our Magnetic Technologies segment consists of VAC Holding GmbH ("VAC"), which we acquired in 2011. The total purchase price of $812.2 million included cash consideration of $686.2 million, withheld consideration of $86.3 million, and the issuance of Company shares valued at $39.7 million. The withheld consideration relates to potential indemnification claims made by OM Group and accepted by the seller, if any, within two years of the closing date of the acquisition with certain exceptions related to tax matters. In August 2013 we remitted a payment of $23.0 million to the seller of VAC. In December 2014, we remitted a payment of $16.2 million to the seller of VAC and charged certain tax assessments related to pre-acquisition tax years of $1.6 million against the outstanding withholding liability.
31
We now expect matters relating to the withheld consideration to be resolved in 2015. Due to the length of time over which these payments are being made, these payments are classified as financing activities within the Statement of Consolidated Cash Flows. The 2013 payment was previously classified in investing activities, and we have now correctly classified this payment in financing activities.
We are engaged in arbitration with the seller regarding the remainder of the withheld consideration which covers unresolved claims.
(b) Divestitures
Advanced Materials
On March 29, 2013, we completed the divestiture of our cobalt-based business. The transaction comprised the sale of the downstream portion of the business (including our cobalt refinery assets in Kokkola, Finland), and the transfer of equity interests in the DRC-based joint venture, known as GTL, to the joint venture partners, subject to a security interest in our favor with respect to the joint venture's performance related to certain supply arrangements.
In connection with this transaction we received cash proceeds of $328.7 million. At closing, net proceeds of $302.1 million were received, and we received additional proceeds of $26.6 million as an adjustment to the purchase price based on a post-closing analysis of the closing balance sheet in July 2013. Including the adjustment to the purchase price, a loss of $111.6 million was recorded on the divestiture in 2013, which included a $10.3 million write-off of deferred financing fees related to the required debt pre-payment, a reserve for a note receivable from joint venture partner of $16.0 million and transaction expenses of $9.0 million.
The sale agreement for the downstream portion of the business also provides for potential future additional cash consideration of up to $110.0 million based on the business achieving certain revenue targets over a period of three years. Using our projected trends of cobalt prices and volumes, it is not probable that the business will meet the revenue targets, and no value was assigned to the potential future cash consideration while calculating the loss on the divestiture or at December 31, 2013 and 2014.
Following the sale, to assist in the transition of the downstream business, we entered into two agreements with the buyer pursuant to which: (1) We act as intermediary in a supply agreement between GTL and the buyer, in back-to-back arrangements for a period of at least two years. We met the cobalt feed supply target under that agreement in October 2014 and the supply agreement will terminate in March 2015. (2) We also served as the U.S. distributor for refined cobalt products in primarily back-to-back arrangements until December 31, 2013.
Ultra Pure Chemicals
On May 31, 2013, we completed the sale of our Ultra Pure Chemicals (UPC) business. In connection with this transaction we received cash proceeds of $63.3 million, which included an estimated $3.0 million for excess working capital. A loss of $9.8 million, net of tax, was recorded on the divestiture, which included a gain of $1.5 million on the sale of net assets offset by the realization of a loss in accumulated other comprehensive income of $8.8 million, a $1.5 million write-off of deferred financing fees related to the required debt pre-payment and transaction expenses of $1.0 million. In the second quarter 2014, we settled the outstanding working capital items and recorded an additional loss of $0.2 million.
The results of our UPC business are reported in discontinued operations in the accompanying consolidated financial statements and notes to the consolidated financial statements for all periods prior to the UPC sale. As required, annual interest expense of $1.0 million and $2.5 million for the periods ending December 31, 2013 and 2012, respectively, related to the debt repaid with the proceeds from the sale of the business was allocated to discontinued operations for all periods prior to the UPC sale. A summary of our discontinued operations activity is as follows:
32
Twelve Months Ended December 31 | ||||||||||||
(In millions except per share data) | 2014 | 2013 | 2012 | |||||||||
Net Sales | $ | — | $ | 38.3 | $ | 93.4 | ||||||
Loss from operations of divested business (net of tax) | $ | (0.1 | ) | $ | (2.5 | ) | $ | (0.4 | ) | |||
Loss on disposal of business (net of tax) | (0.2 | ) | (9.8 | ) | — | |||||||
Loss from discontinued operations (net of tax) | $ | (0.3 | ) | $ | (12.3 | ) | $ | (0.4 | ) | |||
Loss per share from discontinued operations (net of tax) | ||||||||||||
Basic and diluted | $ | (0.01 | ) | $ | (0.39 | ) | $ | (0.01 | ) | |||
Note 6 — Goodwill and Other Intangible Assets
Goodwill is tested for our reporting units on an annual basis, or more frequently as impairment indicators arise. We have the option to perform a qualitative evaluation about the likelihood of goodwill and indefinite lived intangible impairment to determine whether we should quantitatively calculate the fair value of each of our reporting units. If, after considering all events and circumstances that support a qualitative evaluation, we determine that it is not more-likely-than-not that the fair value of our reporting units is less than the respective carrying value, then performing the two-step quantitative approach would be considered unnecessary. Conversely, if applying the qualitative evaluation indicates that it is more-likely-than-not that the fair value is less than the carrying value, then we would proceed with the first step of the two-step quantitative approach and continue with the quantitative analysis to determine if in fact the reporting unit or units' carrying value exceeds its fair value.
We estimate the fair value of a reporting unit (including goodwill) and compare that amount to the carrying value of that reporting unit. If the estimated fair value of the reporting unit is less than its carrying value, a second step would be undertaken to determine the implied fair value of goodwill of the reporting unit, which is then compared with the carrying value of the goodwill of the reporting unit. This second step would include valuing all of the tangible and intangible assets and liabilities of the reporting unit as if they had been acquired in a business combination on the testing date. We have developed a model to estimate the fair value of the reporting units utilizing a discounted cash flow valuation technique (“DCF model”). We selected the DCF model as we believe it is comparable to what would be used by market participants to estimate fair value of our reporting units. The DCF model incorporates our estimates of future cash flows; future growth rates; terminal value amounts; allocations of certain assets, liabilities and cash flows among reporting units; and the applicable weighted-average cost of capital (the “WACC”) used to discount those estimated cash flows. These estimates require significant judgment and are consistent with our forecast and long-range plans and are considered level 3 inputs under the fair value hierarchy.
We conduct our annual goodwill impairment test as of October 1. The results of testing as of October 1, 2014 for all reporting units except Magnetic Technologies confirmed that the estimated fair value of each of the reporting units substantially exceeded its carrying value and no impairment loss was required to be recognized. During a strategic evaluation by the management team, led by the new business leader, of the business and of various opportunities to optimize performance, we noted indicators of potential impairment in the Magnetic Technologies business, including deteriorating European macroeconomic conditions and increasing competition. The resulting test confirmed that the carrying value of the Magnetic Technologies business exceeded its fair value for goodwill. In the fourth quarter of 2014, we performed the second step as discussed above and a non-cash goodwill impairment charge of $168.7 million was recognized.
The results of testing as of October 1, 2013 and 2012 for all reporting units except Magnetic Technologies in 2012 confirmed that the estimated fair value of each of the reporting units substantially exceeded its carrying value and no impairment loss was required to be recognized. The October 1, 2012 estimated fair value of the Magnetic Technologies reporting unit exceeded its carrying value by 4%.
We believe the assumptions used in our impairment testing were consistent with the risk inherent in the business models of the reporting unit at the time the impairment test was performed. Although we believe the forecasts, assumptions, judgments and estimates used are reasonable and appropriate, different forecasts, assumptions, judgments and estimates could materially affect the goodwill test and, potentially, our results of operations and financial position. The change in the carrying amount of goodwill is as follows:
33
Magnetic Technologies | Advanced Materials | Specialty Chemicals | Battery Technologies | Continuing Operations | Discontinued Operations | Consolidated | ||||||||||||||||||||||
Balance at January 1, 2013 | $ | 205.2 | $ | 103.3 | $ | 154.4 | $ | 65.4 | $ | 528.4 | $ | 15.0 | $ | 543.4 | ||||||||||||||
Divestitures and adjustments | — | (103.3 | ) | — | — | (103.3 | ) | (15.0 | ) | (118.3 | ) | |||||||||||||||||
Foreign currency translation adjustments | 9.3 | — | (1.3 | ) | (0.3 | ) | 7.7 | — | 7.7 | |||||||||||||||||||
Balance at December 31, 2013 | 214.5 | — | 153.1 | 65.1 | 432.7 | — | 432.7 | |||||||||||||||||||||
Impairment | (168.7 | ) | — | — | — | (168.7 | ) | — | (168.7 | ) | ||||||||||||||||||
Acquisition | — | — | — | 14.5 | 14.5 | — | 14.5 | |||||||||||||||||||||
Foreign currency translation adjustments | (19.3 | ) | — | (6.3 | ) | (0.3 | ) | (25.9 | ) | — | (25.9 | ) | ||||||||||||||||
Balance at December 31, 2014 | $ | 26.5 | $ | — | $ | 146.8 | $ | 79.3 | $ | 252.6 | $ | — | $ | 252.6 | ||||||||||||||
Intangible assets consist of (i) definite-lived assets subject to amortization and (ii) indefinite-lived intangible assets not subject to amortization. All intangible assets subject to amortization are amortized on a straight-line basis over the estimated useful lives or other appropriate methods if applicable. During a strategic evaluation by the management team we noted indicators of potential impairment at the Magnetic Technologies business as discussed above. In the fourth quarter of 2014, we performed the DCF calculation based on relief of royalty method and determined that the fair value for the Magnetic Technologies tradename was less than the carrying value and a non-cash impairment charge of $26.7 million was recognized.
A summary of intangible assets follows:
2014 | 2013 | |||||||||||||||||||||||||||
Carrying Value | Accumulated Amortization (a) | Impairment | Net | Carrying Value | Accumulated Amortization (a) | Net | ||||||||||||||||||||||
Tradenames | $ | 114.1 | $ | (9.6 | ) | $ | (26.7 | ) | $ | 77.8 | $ | 117.0 | $ | (2.9 | ) | $ | 114.1 | |||||||||||
Customer relationships | 218.2 | (90.1 | ) | — | 128.1 | 234.5 | (82.4 | ) | 152.1 | |||||||||||||||||||
Developed technology | 135.5 | (36.1 | ) | — | 99.4 | 136.5 | (19.9 | ) | 116.6 | |||||||||||||||||||
Know-how | 20.1 | (4.6 | ) | — | 15.5 | 18.6 | (3.6 | ) | 15.0 | |||||||||||||||||||
Capitalized software | 22.3 | (18.6 | ) | — | 3.7 | 22.0 | (17.4 | ) | 4.6 | |||||||||||||||||||
Other intangibles | 2.9 | (2.6 | ) | — | 0.3 | 4.2 | (3.6 | ) | 0.6 | |||||||||||||||||||
Total | $ | 513.1 | $ | (161.6 | ) | $ | (26.7 | ) | $ | 324.8 | $ | 532.8 | $ | (129.8 | ) | $ | 403.0 | |||||||||||
(a) - Actual amounts of amortization expense may differ from the estimated amounts due to changes in foreign currency exchange rates, impairment of intangible assets, intangible assets additions, accelerated amortization of intangible assets, acquisitions and divestitures and other factors.
The weighted average amortization period is 10 years for customer relationships, 12 years for developed technology, 16 years for know-how and 3 year for capitalized software. Indefinite-lived intangible assets are tested for impairment annually and between annual evaluations if changes in circumstances or the occurrence of certain events indicate potential impairment.
Amortization expense related to intangible assets for the years ended December 31, 2014, 2013 and 2012 was $25.0 million, $26.1 million and $25.5 million, respectively. In 2013 we divested the UPC business which had intangible assets with a carrying value of $17.2 million.
We estimate that the annual pre-tax amortization expense will be approximately $25.2 million for 2015, $24.9 million for 2016, $24.8 million for 2017, $20.7 million for 2018 and $21.1 million for 2019.
The goodwill and intangible asset impairment led to an impairment review of the Magnetic Technologies long-lived assets other than goodwill and indefinite lived intangibles. The future net undiscounted cash flows generated by the assets were greater than the carrying value, indicating no impairment of long-lived assets.
Note 7 — Debt
34
On September 4, 2013 we entered into a new five-year Senior Secured Revolving Credit Facility (“the Facility”), and terminated our previous credit facility dated August 2, 2011 that was scheduled to expire in August 2016. The Facility provides for $350 million of revolving borrowing capacity and includes an expansion option of up to an additional $150 million, subject to certain conditions. The borrowers under the agreement are the Company, Harko C.V. (“Harko”), a limited partnership organized under the laws of the Netherlands, and VAC Germany GmbH (“VAC”), a limited liability company under the laws of Germany. Harko and VAC are wholly-owned subsidiaries of the Company. The Facility matures on September 4, 2018.
In the first six months of 2013 we repaid the Term A and Term B loans under the previous credit facility with the proceeds from the divestitures of the Advanced Materials and UPC businesses, as required, and cash on hand. Related to these required pre-payments, we included the write-off of $10.3 million and $1.5 million of deferred financing fees in the losses on divestitures of the Advanced Materials and UPC businesses, respectively.
The obligations of the Company under the Facility are guaranteed by certain of the Company’s material U.S. subsidiaries. The obligations of Harko and VAC under the Facility are guaranteed by the Company and certain of the Company’s material subsidiaries, subject to certain exceptions including financial assistance limitations in certain foreign jurisdictions. In addition, the obligations of the Company under the Facility are secured by a first priority security interest in substantially all of the existing and future personal property of the Company and certain of the Company’s material U.S. subsidiaries, including 65% of the voting capital stock of certain of the Company’s direct foreign subsidiaries. The obligations of Harko and VAC under the Facility are secured by a first priority security interest in certain of the existing and future personal property of Harko, VAC and certain of the Company’s subsidiaries and a 100% pledge of the voting capital stock of certain of the Company’s subsidiaries, subject to certain exceptions, including financial assistance limitations in certain foreign jurisdictions.
The interest rates applicable to loans under the Facility will be at our option and equal to either a base rate or a LIBOR rate, in each case plus an applicable margin percentage. The base rate will be the highest of (i) the federal funds rate plus 0.50%, (ii) the prime rate or (iii) the LIBOR rate with a maturity of one month plus 1.00%. The applicable margin percentage is based on the leverage ratio of the Company. The range of the applicable margin percentage is 1.125% to 2.000% in the case of LIBOR advances and 0.125% to 1.000% in the case of base rate advances.
The Facility contains customary representations and warranties and certain covenants that limit the ability of the Company and its restricted subsidiaries to, among other things: (i) incur or guarantee additional indebtedness; (ii) redeem, repurchase or pay distributions on capital stock or redeem or repurchase subordinated debt; (iii) make investments; (iv) sell assets; (v) enter into agreements that restrict distributions or other payments from restricted subsidiaries to the Company; (vi) incur or suffer to exist liens securing indebtedness; (vii) consolidate, merge or transfer all or substantially all of their assets; and (viii) engage in transactions with affiliates. In addition, the Facility contains financial covenants that limit capital expenditures in any fiscal year and that measure (i) the ratio of the Company’s total funded indebtedness net of certain cash to the amount of the Company’s consolidated EBITDA and (ii) the ratio of the amount of the Company’s consolidated EBITDA to the Company’s cash interest expense, as defined in the agreement.
As of December 31, 2014, we had $12.5 million outstanding under the Facility which was repaid with available cash in January 2015. We are in compliance with all Facility covenants.
Interest paid on long-term debt was $0.0 million, $6.9 million and $38.4 million in 2014, 2013 and 2012, respectively. As required, interest expense of $1.0 million and $2.5 million has been allocated to discontinued operations for 2013 and 2012, respectively. No interest was capitalized in 2014, 2013 or 2012.
Note 8 — Derivative Instruments
All derivatives are reflected on the balance sheet at fair value and recorded in other current assets and other current liabilities in the Consolidated Balance Sheets. The accounting for the fair value of a derivative depends upon whether it has been designated as a hedge and on the type of hedging relationship. Changes in the fair value of derivative instruments are recognized immediately in earnings, unless the derivative is designated as a hedge and qualifies for hedge accounting. Under hedge accounting, recognition of derivative gains and losses can be matched in the same period with that of the hedged exposure and thereby minimize earnings volatility.
For a fair value hedge, the change in fair value of the hedging instrument and the change in fair value of the hedged item attributable to the risk being hedged are both recognized currently in earnings. For a cash flow hedge, the effective portion of the change in fair value of a hedging instrument is initially recognized in Accumulated other comprehensive income (loss) (“AOCI(L)”) in stockholders’ equity and subsequently reclassified to earnings when the hedged item affects income. Any ineffective portion of the change in fair value of a cash flow hedge is recognized immediately in earnings.
Commodity Price Risk
From time to time we employ derivative instruments in connection with certain purchases of certain commodities in order to establish a fixed margin and mitigate the risk of price volatility. This hedging limits our ability to participate in gains from favorable commodity price fluctuations and it limits the risk of loss from adverse commodity price fluctuations.
Derivative instruments employed to manage commodity price risk include some contracts designated as cash flow hedges as well as some other contracts that are not designated as hedges for accounting purposes.
In May 2013, we entered into nickel forward derivative contracts to establish a fixed margin and mitigate the risk of price volatility related to certain sales expected in 2013 and 2014 of nickel-containing finished products that were priced on a formula that included a fixed nickel price component. These forward derivative contracts were designated
as cash flow hedges for accounting purposes and were settled during the second quarter 2014. In October 2012, we entered into nickel forward derivative contracts to establish a fixed margin and mitigate the risk of price volatility related to certain sales expected in 2013 of nickel-containing finished products that were priced based on a formula that included a fixed nickel price component and were settled in 2013. These forward derivative contracts have been designated as cash flow hedges for accounting purposes.
Foreign Currency Exchange Rate Risk
Our primary Finnish operating subsidiary was included in the divestiture of our cobalt-based business on March 29, 2013. The functional currency for this subsidiary was the U.S. dollar since a majority of its purchases and sales were denominated in U.S. dollars. While a majority of the subsidiary’s raw material purchases were in U.S. dollars, it had some Euro-denominated operating expenses. From time to time, we entered into foreign currency forward contracts to mitigate a portion of the earnings volatility in those Euro-denominated cash flows due to changes in the Euro/U.S. dollar exchange rate. As of December 31, 2014, 2013, and 2012 we had no Euro forward contracts outstanding. In 2012 we reclassified the previous cumulative loss from the 2011 contracts into earnings. We designated these foreign currency derivatives as cash flow hedges of the subsidiary's forecasted Euro-denominated expenses.
Interest Rate Risk
From time to time we utilized interest rate swap agreements to partially reduce risks related to variable rate financing agreements that are subject to changes in the market rate of interest.
We had interest rate swaps with notional values that totaled $114.5 million at December 31, 2012 and AOCI(L) included a cumulative loss of $0.1 million related to these contracts. Following the full repayment of the Term B facility at the end of March 2013, we elected in April 2013 to terminate all the remaining interest swaps contracts. The AOCI at the time of the termination represented an immaterial cumulative loss related to these contracts which was reclassified to earnings in the second quarter 2013.
There was no hedge ineffectiveness in 2014, 2013 or 2012 for hedges.
There were no outstanding hedge contracts in the Consolidated Balance Sheet as of December 31, 2014.
The following table summarizes the effect of derivative instruments as recorded in the Statement of Consolidated Operations:
Derivatives in Cash Flow Hedging Relationships | ||||||||||||
Amount of Gain (Loss) on Derivative Recognized in AOCI(L) (Effective Portion) for the Year Ended December 31, | ||||||||||||
2014 | 2013 | 2012 | ||||||||||
Euro forward contracts | $ | — | $ | — | $ | 6.0 | ||||||
Commodity contracts | — | (0.3 | ) | — | ||||||||
Interest rate swap agreements | — | — | (0.1 | ) | ||||||||
Total | $ | — | $ | (0.3 | ) | $ | 5.9 | |||||
Location of Gain (Loss) Reclassified from AOCI(L) into Income | Amount of Gain (Loss) Reclassified from AOCI(L) into Income (Effective Portion) for the Year Ended December 31, | |||||||||||||
(Effective Portion) | 2014 | 2013 | 2012 | |||||||||||
Euro forward contracts | Cost of goods sold | $ | — | $ | — | $ | 2.3 | |||||||
Commodity contracts | Cost of goods sold | (0.2 | ) | (0.2 | ) | — | ||||||||
Interest rate swap agreements | Interest expense | — | — | (0.4 | ) | |||||||||
Total | $ | (0.2 | ) | $ | (0.2 | ) | $ | 1.9 | ||||||
Note 9 — Fair Value Disclosures
The following table shows the Company’s assets and liabilities accounted for at fair value on a recurring basis:
Fair Value Measurements at Reporting Date Using | |||||||||||||
Quoted Prices in Active Markets for Identical Assets | Significant Other Observable Inputs | Significant Unobservable Inputs | |||||||||||
Description | December 31, 2014 | (Level 1) | (Level 2) | (Level 3) | |||||||||
Liabilities: | |||||||||||||
Contingent consideration payable | $ | 1.4 | — | — | 1.4 | ||||||||
The fair value of the derivative instruments have been determined based on the market equivalents at the balance sheet date, taking into account current commodity forward rates, therefore, they are classified within Level 2 of the valuation hierarchy. Our valuation techniques and Level 3 inputs used to estimate the fair value of the contingent consideration payable in connection with our acquisition of Rahu Catalytics Limited ("Rahu") are described below. There were no transfers into or out of Levels 1, 2 or 3 in 2014 or 2013.
The following table summarizes changes in Level 3 liabilities measure at fair value on a recurring basis:
Contingent Consideration | ||||
Fair Value at December 31, 2013 | $ | 1.4 | ||
Accretion expense | 0.2 | |||
Foreign exchange | (0.2 | ) | ||
Fair Value at December 31, 2014 | $ | 1.4 | ||
We acquired Rahu on December 22, 2011. The purchase price included contingent consideration of up to an additional €20.0 million ($24.3 million at December 31, 2014) based on achieving certain volume targets over a fifteen year period ending on December 31, 2026. We estimated the fair value of the contingent consideration liability using probability-weighted expected future cash flows and applied a discount rate that appropriately captured a market participant's view of the risk associated with the liability. The liability for contingent consideration is included in Other non-current liabilities in the Consolidated Balance Sheet. The valuation of contingent consideration is classified utilizing Level 3 inputs consistent with reasonably available assumptions which would be made by other market participants. There are many factors that could impact the likelihood that we will pay the contingent consideration, and therefore, affect its value. Such factors include the overall economic conditions and our ability to drive sales volumes as planned. Subsequent to the date of acquisition the estimated fair value of the contingent consideration was reduced to €1.0 million ($1.4 million)after an evaluation of new information available in the fourth quarter of 2013. The change was reflected within Other income in the 2013 Consolidated Statement of Operations. A change in a market participant view of risks could also impact the value of the contingent consideration.
We also hold financial instruments consisting of cash, accounts receivable, and accounts payable. The carrying amounts of cash, accounts receivable and accounts payable approximate fair value due to the short-term maturities of these instruments. Revolver debt had a carrying value of $12.5 million at December 31, 2014 and is the approximate fair value due to the the short-term nature of the instrument. There was no long-term debt outstanding as of December 31, 2014 or 2013. Derivative instruments are recorded at fair value as indicated above.
We utilize a “relief from royalty” methodology in estimating fair values for indefinite-lived tradenames. The methodology estimates the fair value of each trade name by determining the present value of the royalty payments that are avoided as a result of owning the tradename and includes judgmental assumptions about sales growth that are consistent with the assumptions used to determine the fair value of reporting units in our goodwill testing. The fair value measurements were calculated using unobservable inputs, classified as Level 3, requiring significant management judgment due to the absence of quoted market prices or observable inputs for assets of a similar nature.
Accounts receivable potentially subjects us to a concentration of credit risk. We maintain significant accounts receivable balances with several large customers. At December 31, 2014 and 2013 the accounts receivable balance from our largest customer represented 2% of the Company’s net accounts receivable, respectively. Generally, we do not obtain security from our customers in support of accounts receivable.
Sales to the top three customers in the Battery Technologies segment represented approximately 49%, 48% and 52% of Battery Technologies’ net sales in 2014, 2013 and 2012, respectively. The loss of one or more of these customers could have a material adverse effect on Battery Technologies’ business, results of operations or financial position.
Note 10 — Income Taxes
Loss from continuing operations before income tax expense consists of the following:
Year Ended December 31 | ||||||||||||
2014 | 2013 | 2012 | ||||||||||
United States | $ | (9.0 | ) | $ | (13.6 | ) | $ | (12.3 | ) | |||
Outside the United States | (163.8 | ) | (49.2 | ) | (36.3 | ) | ||||||
$ | (172.8 | ) | $ | (62.8 | ) | $ | (48.6 | ) | ||||
Income tax (benefit) expense is summarized as follows:
Year Ended December 31 | ||||||||||||
2014 | 2013 | 2012 | ||||||||||
Current tax provision (benefit): | ||||||||||||
United States: | ||||||||||||
Federal | $ | 1.4 | $ | 0.6 | $ | (3.1 | ) | |||||
State and local | 0.2 | — | — | |||||||||
Outside the United States | 15.1 | 17.4 | 30.1 | |||||||||
Total current | 16.7 | 18.0 | 27.0 | |||||||||
Deferred tax provision (benefit): | ||||||||||||
United States | (1.4 | ) | 0.6 | 2.4 | ||||||||
Outside the United States | (15.8 | ) | (7.9 | ) | (32.6 | ) | ||||||
Total deferred | (17.2 | ) | (7.3 | ) | (30.2 | ) | ||||||
$ | (0.5 | ) | $ | 10.7 | $ | (3.2 | ) | |||||
A reconciliation of income taxes computed using the United States statutory rate to income taxes computed using our effective income tax rate is as follows:
Year Ended December 31 | ||||||||||||
2014 | 2013 | 2012 | ||||||||||
Loss from continuing operations before income tax expense | $ | (172.8 | ) | $ | (62.8 | ) | $ | (48.6 | ) | |||
Income taxes at the United States statutory rate (35)% | (60.5 | ) | (21.9 | ) | (17.1 | ) | ||||||
Increase (decrease) in taxes resulting from: | ||||||||||||
Effective tax rate differential on income outside of the United States | — | 19.3 | (3.3 | ) | ||||||||
Repatriation of foreign earnings | 2.3 | (1.7 | ) | 7.4 | ||||||||
Goodwill impairment | 52.1 | — | — | |||||||||
Valuation allowance | 6.7 | 13.2 | 3.7 | |||||||||
Uncertain tax positions | (1.1 | ) | 0.1 | (1.9 | ) | |||||||
Allowance on GTL prepaid tax asset | — | 0.4 | 5.6 | |||||||||
Other, net | — | 1.3 | 2.4 | |||||||||
Income tax expense (benefit) | $ | (0.5 | ) | $ | 10.7 | $ | (3.2 | ) | ||||
Effective income tax rate | (a) | (a) | 6.5 | % | ||||||||
(a) | not meaningful |
The effective income tax rate for the year ended December 31, 2014 is impacted by the VAC intangible asset impairment charges of $195.4 million and other cost reduction charges (see Note 6 for further discussion on the intangible asset impairment charges). There is no tax benefit for the $168.7 million goodwill portion of the impairment charges due to its permanent nature.
Excluding the impact of the VAC goodwill and intangible asset impairment charges of $195.4 million and other business improvement and cost reduction charges of $10.0 million, the effective tax rate for the year ended December 31, 2014 would have been 27.4%. This rate is lower than the U.S. statutory tax rate primarily due to income earned in tax jurisdictions with lower statutory rates than the U.S., and our financing structure, partially offset by losses and carry-forwards in certain jurisdictions (including the U.S. and Germany) with no corresponding tax benefit.
The effective income tax rate for the year ended December 31, 2013 is impacted by the loss of $111.6 million related to the divestiture of the Advanced Materials business. There was no tax benefit on the loss on divestiture of the Advanced Materials business due to our legal entity and tax structure.
Excluding the impact of loss on sale of advanced materials business of $111.6 million, the effective tax rate for the year ended December 31, 2013 would have been 22.1%. This rate is lower than the U.S. statutory tax rate primarily due to income earned in tax jurisdictions with lower statutory rates than the U.S., and our financing structure, partially offset by losses and carry-forwards in certain jurisdictions (including the U.S. and Germany) with no corresponding tax benefit.
The effective income tax rate for the year ended December 31, 2012 was impacted by VAC purchase accounting related inventory charges of $55.9 million and GTL. During 2012, we recorded a tax expense of $10.4 million related to GTL. This includes a $5.6 million tax expense related to GTL prepaid tax asset impairment and $6.6 million related to other GTL permanent differences, of which our share was 55%, or $6.7 million.
Excluding the impact of VAC purchase accounting related inventory charges and GTL discrete and permanent items, the effective tax rate for the year ended December 31, 2012 would have been 31.8%. This rate is lower than the U.S. statutory tax rate primarily due to income earned in tax jurisdictions with lower statutory rates than the U.S., and our internal financing structure, partially offset by losses and carry-forwards in certain jurisdictions (including the U.S. and Germany) with no corresponding tax benefit.
During fourth quarter of 2012, the Company received a $37.9 million income tax refund which was included in the Refundable, prepaid and accrued income taxes in the Statement of Consolidated Cash Flows for December 31, 2012.
We intend to repatriate only future earnings and therefore have not provided additional United States income taxes on approximately $402 million of undistributed earnings of consolidated foreign subsidiaries. Such earnings could become taxable upon the sale or liquidation of these foreign subsidiaries or upon dividend repatriation. Our intent is for such earnings to be permanently reinvested by the foreign subsidiaries. It is not practicable to estimate the amount of unrecognized withholding taxes and tax liability on such earnings.
We file income tax returns in the U.S. federal jurisdiction, and various state and foreign jurisdictions. Our major tax jurisdictions include the U.S. and Germany. With few exceptions, we are no longer subject to U.S. federal, state and local, or non-U.S. income tax examinations by tax authorities for years before 2006. The Internal Revenue Service completed the examination of our 2010 U.S. federal income tax return, and Finnish tax authorities completed the examination of our Finnish tax returns for the years 2007-2011. VAC's German tax returns have been audited through 2005. We are indemnified, subject to certain limitations, for any pre-acquisition income tax liabilities of VAC. German tax authorities are currently examining VAC's income tax returns for the years 2006-2011.
Income tax payments were $18.8 million, $47.2 million and $33.9 million in 2014, 2013 and 2012, respectively.
Significant components of our deferred income taxes are as follows:
December 31 | ||||||||
2014 | 2013 | |||||||
Employee benefit accruals | $ | 58.6 | $ | 44.7 | ||||
Foreign operating loss carryforwards | 6.5 | 8.3 | ||||||
Foreign tax credit carryforwards | 17.3 | 23.1 | ||||||
State operating loss carryforwards | 7.8 | 7.6 | ||||||
Operating accruals | 48.4 | 42.3 | ||||||
Investment credit carryforwards | 2.6 | 3.3 | ||||||
Valuation allowance | (91.9 | ) | (83.6 | ) | ||||
Deferred tax assets | 49.3 | 45.7 | ||||||
Depreciation | (31.2 | ) | (37.5 | ) | ||||
Amortization | (88.5 | ) | (107.7 | ) | ||||
Other | (0.2 | ) | (1.0 | ) | ||||
Deferred tax liabilities | (119.9 | ) | (146.2 | ) | ||||
Net deferred tax liabilities | $ | (70.6 | ) | $ | (100.5 | ) | ||
Deferred income taxes are recorded in the Consolidated Balance Sheets in the following accounts:
December 31 | ||||||||
2014 | 2013 | |||||||
Other current assets | $ | 2.1 | $ | 2.4 | ||||
Other non-current assets | 5.3 | 6.4 | ||||||
Other current liabilities | (3.2 | ) | (6.8 | ) | ||||
Deferred income taxes — non-current liabilities | (74.8 | ) | (102.5 | ) | ||||
$ | (70.6 | ) | $ | (100.5 | ) | |||
We have a U.S. net deferred tax asset of $1.4 million which is expected to be recovered based on temporary differences that will reverse in 2015-2016. At December 31, 2014 and 2013, we had U.S state net operating loss carryforwards representing a potential future tax benefit of $7.8 million and $7.7 million, respectively. These carryforwards expire at various dates from 2015 through 2034. We have recorded a full valuation allowance against the U.S state net operating loss carryforwards. We have foreign net operating loss carryforwards of $30.6 million, representing a potential future tax benefit of $6.5 million in various jurisdictions, some of which expire in 2018 through 2033, and some of which have no expiration. We have established a $1.8 million valuation allowance against the foreign net operating loss carryforwards as we believe that some of these assets will more likely than not be realized. We have foreign investment tax credit and allowance carryforwards of $2.6 million, of which $1.9 million expire in 2028, while the remaining $0.7 million have no expiration. We have recorded a $1.9 million valuation allowance against the foreign investment tax credit and allowance carryforwards as we believe that a portion of these assets will not be realized.
For the year ended December 31, 2014, our valuation allowance increased primarily due to the increase in foreign carryforwards.
A reconciliation of the beginning and ending amount of uncertain tax positions is as follows:
Balance at January 1, 2013 | $ | 18.0 | ||
Additions for tax positions related to the current year | 0.6 | |||
Reductions for tax positions of prior years | (3.4 | ) | ||
Foreign currency translation | 0.3 | |||
Balance at December 31, 2013 | 15.5 | |||
Additions for tax positions related to the current year | 0.4 | |||
Addition of receivable for prior year tax position | (0.7 | ) | ||
Reductions for tax positions of prior years | (0.6 | ) | ||
Reductions for lapses of statute of limitations | (0.1 | ) | ||
Foreign currency translation | (0.8 | ) | ||
Balance at December 31, 2014 | $ | 13.7 | ||
With the exception of those relating to the VAC acquisition, all uncertain tax positions would affect the effective tax rate if recognized. However, $6.1 million of the uncertain tax positions could be offset by tax credit carryforwards, which, if recognized, would be offset by an adjustment to the deferred tax assets. The decrease in uncertain tax positions in 2014 primarily results from effective settlements during 2014 in various tax jurisdictions. The decrease in uncertain tax positions in 2013 primarily results from the effective settlements during 2013 in various tax jurisdictions and the transfer of our equity interests in GTL as part of the divestiture of the Advanced Materials business. At December 31, 2014, the liability for uncertain tax positions includes $5.9 million for which it is reasonably possible that the uncertain tax position will decrease within the next twelve months. These uncertain tax positions primarily relate to acquired businesses and may decrease upon effective settlement.
We recognize interest accrued related to uncertain tax positions and penalties as a component of income tax expense. During 2014 and 2013 we recognized an immaterial benefit related to interest and penalties. At December 31, 2014 and 2013, we had $0.6 million and $0.8 million, respectively, accrued for interest and penalties.
Note 11 — Pension and Other Post-Retirement Benefit Plans
We have defined contribution plans covering substantially all eligible U.S. employees. Contributions are directed by the employee into various investment options. These defined contribution plans do not have any direct ownership of the Company’s common stock. Under these plans, we match participants’ contributions based on plan provisions. Certain plans provide for a discretionary Company contribution based on employee compensation. We maintain additional defined contribution plans in certain locations outside the United States. Aggregate defined contribution plan expenses were $3.3 million, $4.7 million and $4.9 million in 2014, 2013 and 2012, respectively.
We have defined benefit pension obligations at VAC, substantially all of which are unfunded. VAC sponsors various defined benefits plans for its employees, including pension, early retirement benefits and anniversary benefits, mainly in Germany.
The EaglePicher Technologies ("EPT") pension plans consist of four, non-contributory, defined benefit pension plans. The Technologies Salaried Plan is a defined benefit, cash balance plan that covers EaglePicher Technologies salaried employees hired prior to January 1, 2007. The Technologies Hourly Plan is a defined benefit plan that covers EaglePicher Technologies non-union hourly employees hired prior to January 1, 2007 and union hourly employees hired prior to May 3, 2008. We also hold the liabilities of two frozen defined benefit pension plans. Pension benefits are paid to plan participants directly from pension plan assets. In 2014 we offered lump-sum payments to terminated vested participants in the EPT pension plans. $29.6 million was paid out of plan assets to participants who elected the lump sum payment, and we recorded a $3.2 million pre-tax pension settlement expense.
In addition to the pension liabilities for VAC and EPT, we have a non-contributory, defined benefit pension plan for certain retired employees in the United States related to a divested business. Pension benefits under this plan are paid to plan participants directly from pension plan assets.
Certain other non-U.S. employees are covered under other defined benefit plans. These other non-U.S. plans are not material.
We also have an obligation to our former chief executive officer in settlement of an unfunded supplemental executive retirement plan (“SERP”). Payments under the SERP are made directly from the Company.
The following table sets forth the changes in the benefit obligation and the plan assets during the year and reconciles the funded status of the defined benefit plans with the amounts recognized in the Consolidated Balance Sheet at December 31:
Pension Benefits | ||||||||||||||||
U.S. Plans | Non-U.S. Plans | |||||||||||||||
2014 | 2013 | 2014 | 2013 | |||||||||||||
Change in benefit obligation | ||||||||||||||||
Projected benefit obligation at beginning of year | $ | (220.5 | ) | $ | (245.0 | ) | $ | (191.1 | ) | $ | (181.4 | ) | ||||
Service cost | (1.0 | ) | (1.2 | ) | (6.8 | ) | (5.1 | ) | ||||||||
Interest cost | (9.2 | ) | (8.4 | ) | (6.1 | ) | (6.1 | ) | ||||||||
Actuarial (loss) gain | (29.4 | ) | 20.2 | (25.8 | ) | (0.4 | ) | |||||||||
Benefits paid | 14.4 | 13.9 | 10.3 | 10.2 | ||||||||||||
Settlement | 29.6 | — | — | — | ||||||||||||
Foreign currency exchange rate changes | — | — | 25.3 | (8.3 | ) | |||||||||||
Projected benefit obligation at end of year | (216.1 | ) | (220.5 | ) | (194.2 | ) | (191.1 | ) | ||||||||
Change in plan assets | ||||||||||||||||
Fair value of plan assets at beginning of year | 177.4 | 180.5 | 4.2 | 4.0 | ||||||||||||
Actual return on plan assets | 17.2 | 5.7 | — | — | ||||||||||||
Employer contributions | 1.5 | 5.1 | 11.9 | 10.1 | ||||||||||||
Settlement | (29.6 | ) | — | — | — | |||||||||||
Foreign currency exchange rate changes | — | — | (0.7 | ) | 0.3 | |||||||||||
Benefits paid | (14.4 | ) | (13.9 | ) | (10.3 | ) | (10.2 | ) | ||||||||
Fair value of plan assets at end of year | 152.1 | 177.4 | 5.1 | 4.2 | ||||||||||||
Funded status — plan assets less than benefit obligations | (64.0 | ) | (43.1 | ) | (189.1 | ) | (186.9 | ) | ||||||||
Recognized in accumulated other comprehensive income: | ||||||||||||||||
Net actuarial loss (gain) | 18.4 | (16.9 | ) | 18.4 | (0.1 | ) | ||||||||||
Amounts not yet recognized as a component of net postretirement benefit cost | $ | 36.3 | $ | 17.9 | $ | 49.6 | $ | 31.2 | ||||||||
Amounts recorded in the balance sheet: | ||||||||||||||||
Accrued benefit liability — current | $ | (0.6 | ) | $ | (0.7 | ) | $ | (8.1 | ) | $ | (8.8 | ) | ||||
Accrued benefit liability — long-term | (63.4 | ) | (42.4 | ) | (181.0 | ) | (178.1 | ) | ||||||||
Accumulated other comprehensive loss | 36.3 | 17.9 | 49.6 | 31.2 | ||||||||||||
Net amount recognized | $ | (27.7 | ) | $ | (25.2 | ) | $ | (139.5 | ) | $ | (155.7 | ) | ||||
The accumulated benefit obligation of the U.S. plans was $215.6 million and $220.1 million as of December 31, 2014 and 2013, respectively. The accumulated benefit obligation of the non-U.S. plans was $182.7 million and $189.8 million as of December 31, 2014 and 2013, respectively.
Set forth below is a detail of the net periodic pension and other post-retirement benefit expense for the defined benefit plans for the years ended December 31:
Pension Benefits | ||||||||||||
U.S. Plans | ||||||||||||
2014 | 2013 | 2012 | ||||||||||
Service cost | $ | 1.0 | $ | 1.2 | $ | 1.1 | ||||||
Interest cost | 9.2 | 8.4 | 9.3 | |||||||||
Amortization of unrecognized net loss | 1.4 | 0.3 | 1.5 | |||||||||
Expected return on plan assets | (10.7 | ) | (9.4 | ) | (10.4 | ) | ||||||
Settlement charge | 3.2 | — | — | |||||||||
Net periodic benefit cost | 4.1 | 0.5 | 1.5 | |||||||||
Net loss (gain) arising during the year | 22.1 | (16.1 | ) | 1.3 | ||||||||
Net gain recognized during the year | (3.6 | ) | (0.8 | ) | (3.4 | ) | ||||||
Total recognized in other comprehensive loss | 18.5 | (16.9 | ) | (2.1 | ) | |||||||
Total recognized in net periodic benefit cost and other comprehensive loss | $ | 22.6 | $ | (16.4 | ) | $ | (0.6 | ) | ||||
Set forth below is a detail of the net periodic pension and other post-retirement benefit expense for the defined benefit plans for the years ended December 31:
Pension Benefits | ||||||||||||
Non-U.S. Plans | ||||||||||||
2014 | 2013 | 2012 | ||||||||||
Service cost | $ | 6.8 | $ | 5.1 | $ | 4.0 | ||||||
Interest cost | 6.1 | 6.1 | 7.6 | |||||||||
Amortization of unrecognized net loss | 1.6 | 1.8 | 0.8 | |||||||||
Net periodic benefit cost | 14.5 | 13.0 | 12.4 | |||||||||
Net loss arising during the year | 25.8 | 0.3 | 29.8 | |||||||||
Net gain recognized during the year | (1.6 | ) | (1.8 | ) | (0.8 | ) | ||||||
Exchange rate gain (loss) gain | (5.8 | ) | 1.4 | 0.8 | ||||||||
Total recognized in other comprehensive loss | 18.4 | (0.1 | ) | 29.8 | ||||||||
Total recognized in net periodic benefit cost and other comprehensive loss | $ | 32.9 | $ | 12.9 | $ | 42.2 | ||||||
Future pension benefit payments expected to be paid are as follows:
Pension | ||||||||
Expected benefit payments | U.S. Plans | Non-U.S. Plans | ||||||
2015 | $ | 14.4 | $ | 10.7 | ||||
2016 | $ | 14.1 | $ | 12.1 | ||||
2017 | $ | 14.0 | $ | 12.3 | ||||
2018 | $ | 13.9 | $ | 12.0 | ||||
2019 | $ | 13.8 | $ | 10.4 | ||||
2020-2024 | $ | 67.6 | $ | 51.4 | ||||
The amounts in Accumulated other comprehensive income (loss) that are expected to be recognized as components of net periodic benefit cost during 2015 are as follows:
U.S. Plans | Non-U.S. Plans | Total | ||||||||||
Net actuarial loss | $ | 0.9 | $ | 2.6 | $ | 3.5 | ||||||
The following weighted-average assumptions were used to determine the Company’s pension benefit obligations for the year ended December 31:
2014 | 2013 | |||
U.S. Plans | ||||
Discount rate — EPT Active Plans | 3.7% | 4.6% | ||
Discount rate — EPT Inactive Plans | 3.5% | 4.4% | ||
Discount rate — Divested Business Plans | 3.5% | 4.3% | ||
Expected return on pension plan assets — EPT Active Plans | 6.3% | 6.5% | ||
Expected return on pension plan assets — EPT Inactive Plans | 6.3% | 6.5% | ||
Expected return on pension plan assets — Divested Business Plans | 6.3% | 6.5% | ||
Rate of increases in compensation — EPT Active Plans | 3.5% | 3.5% | ||
Non U.S. Plans | ||||
Discount rate | 2.0% | 3.5% | ||
Rate of increases in compensation | 2.5% – 3.0% | 2.5% – 3.0% | ||
The following weighted-average assumptions were used to determine the Company’s net periodic pension benefit costs for the year ended December 31:
2014 | 2013 | |||
U.S. Plans | ||||
Discount rate — EPT Active Plans | 4.6% | 3.7% | ||
Discount rate — EPT Inactive Plans | 4.4% | 3.5% | ||
Discount rate — Divested Business Plans | 4.3% | 3.4% | ||
Expected return on pension plan assets — EPT Active Plans | 6.5% | 7.0% | ||
Expected return on pension plan assets — EPT Inactive Plans | 6.5% | 4.7% | ||
Expected return on pension plan assets — Divested Business Plans | 6.5% | 6.0% | ||
Non U.S. Plans | ||||
Discount rate | 3.5% | 3.5% | ||
Expected return on pension plan assets | 3.5% | 3.7% | ||
Our investment objective for defined benefit plan assets is to meet the plan’s benefit obligations, without undue exposure to risk. The investment strategy focuses on asset class diversification, liquidity to meet benefit payments and an appropriate balance of long-term investment return and risk. The Investment Committee oversees the investment allocation process, which includes the selection and evaluation of the investment manager, the determination of investment objectives and risk guidelines, and the monitoring of actual investment performance. In determining the expected long-term rate of return on defined benefit pension plan assets, management considers the historical rates of return over a period of time that is consistent with the long-term nature of the underlying obligations of these plans, the nature of investments and an expectation of future investment strategies.
We utilize the services of independent third-party investment managers to oversee the management of U.S. pension plan assets. The investment managers are allowed to exercise investment discretion, subject to limitations established by the Company.
Below are our actual and established target allocations for the EPT pension plans, representing 93% of U.S. pension plan assets:
Actual Allocation | Target Allocation | |||||
U.S. equity securities | 11 | % | 11 | % | ||
Non-U.S. equity securities | 11 | % | 11 | % | ||
Fixed income | 62 | % | 62 | % | ||
High yield | 5 | % | 5 | % | ||
TIPS | 5 | % | 5 | % | ||
Global REITS | 5 | % | 5 | % | ||
Cash | 1 | % | 1 | % | ||
Total assets | 100 | % | 100 | % | ||
Active plan investments include U.S. equity securities which are invested broadly in U.S. companies in various industries using the Wilshire 5000 Index as the asset class benchmark. Non-U.S. equity securities are invested broadly in non-U.S. companies in various industries using the MSCI ACWI ex-U.S. Index as the asset class benchmark. Long duration fixed income consists primarily of investment grade corporate fixed income bonds benchmarked against the Barclays Capital Long Credit Index. Intermediate government fixed income consists of U.S. government bonds using the Barclays Capital Intermediate Government Index as the asset class benchmark. U.S. Treasury Inflation Protected Fixed Income (“TIPS”) invests in the U.S. Treasury inflation protected securities market using the Barclays U.S. TIPS Index as the asset class benchmark. Global REITS investments are invested in the broad global real estate securities market with the FTSE EPRA/NAREIT Developed RE Index (or other comparable index) as the asset class benchmark. High Yield Fixed Income (“High yield”) invests in broad U.S. non-investment grade fixed income bonds using the Merrill Lynch U.S. High Yield Master II as the asset class benchmark.
Our asset allocations by asset category for the Divested business and non-U.S. plans are as follows:
December 31, | ||||||
2014 | 2013 | |||||
U.S. equity securities | 33 | % | 38 | % | ||
Corporate bonds | 8 | % | 10 | % | ||
Government bonds | 11 | % | 10 | % | ||
Other fixed income | 15 | % | 13 | % | ||
Non-U.S. assets | 31 | % | 27 | % | ||
Cash | 2 | % | 2 | % | ||
Total assets | 100 | % | 100 | % | ||
Equity securities are invested broadly in U.S. companies in various industries. Non-U.S. assets consist of equity securities of non-U.S. companies in various industries as well as foreign mutual funds.
The fair value measurements of defined benefit pension plan assets by category at December 31, 2014 are as follows:
December 31, | Quoted Prices in Active Markets for Identical | Significant Other Observable | Significant Unobservable | |||||||||||||
Category | 2014 | Assets (Level 1) | Inputs (Level 2) | Inputs (Level 3) | ||||||||||||
Equity securities — US | $ | 21.2 | $ | 3.9 | $ | 17.3 | $ | — | ||||||||
Equity securities — Non US | 15.4 | — | 15.4 | — | ||||||||||||
Fixed income: | ||||||||||||||||
Bonds | 88.6 | — | 88.6 | — | ||||||||||||
Other fixed income | 4.3 | — | 4.3 | — | ||||||||||||
High yield | 7.2 | — | 7.2 | — | ||||||||||||
TIPS | 6.7 | — | 6.7 | — | ||||||||||||
Global REITS | 7.0 | — | 7.0 | — | ||||||||||||
Non-U.S. assets | 5.1 | — | 5.1 | — | ||||||||||||
Cash and cash equivalents | 1.7 | 1.7 | — | — | ||||||||||||
Total | $ | 157.2 | $ | 5.6 | $ | 151.6 | $ | — | ||||||||
Equity securities and fixed income, high-yield, TIPS and Global REITS investments are primarily comprised of mutual funds and common/collective trust funds. Investments in mutual funds and common/collective trust funds are valued at the net asset value per share or unit multiplied by the number of shares or units held as of the measurement date.
The defined benefit pension plans do not have any direct ownership of the Company’s common stock.
Note 12 — Accumulated Other Comprehensive Income (Loss)
(a) Changes in Accumulated Comprehensive Income (Loss) by Component
Foreign Currency Translation Loss | Unrealized Gains and Losses on Cash Flow Hedging Derivatives | Pension and Post-Retirement Obligation | Pension and Post-Retirement Obligation Tax Impact | Accumulated Other Comprehensive Income (Loss) | ||||||||||||||||
Beginning balance at January 1, 2014 | $ | (5.5 | ) | $ | (0.2 | ) | $ | (49.1 | ) | $ | 9.6 | $ | (45.2 | ) | ||||||
Other comprehensive (loss) income before reclassifications | (81.7 | ) | — | (42.0 | ) | 5.7 | (118.0 | ) | ||||||||||||
Amounts reclassified from accumulated other comprehensive income (loss) | — | 0.2 | 5.2 | — | 5.4 | |||||||||||||||
Net current-period other comprehensive (loss) income | (81.7 | ) | 0.2 | (36.8 | ) | 5.7 | (112.6 | ) | ||||||||||||
Ending balance at December 31, 2014 | $ | (87.2 | ) | $ | — | $ | (85.9 | ) | $ | 15.3 | $ | (157.8 | ) | |||||||
(b) Reclassifications out of Accumulated Other Comprehensive Income (loss)
Details about Accumulated Other Comprehensive Income (loss) Components | Amounts Reclassified from Accumulated Other Comprehensive Income (loss) | Affected Line Item in the Statement Where Net Income is Presented | |||
Unrealized gains and losses on cash flow hedging derivatives | 0.2 | Cost of goods sold | |||
Pension and post-retirement obligation | 5.2 | Cost of goods sold | |||
Note 13 — Earnings Per Share
The following table sets forth the computation of basic and dilutive loss per common share from continuing operations attributable to OM Group, Inc. common stockholders for the years ended December 31:
2014 | 2013 | 2012 | ||||||||||
Amounts attributable to OM Group, Inc. common stockholders: | ||||||||||||
(in millions, except per share amounts) | ||||||||||||
Loss from continuing operations, net of tax | $ | (172.3 | ) | $ | (71.7 | ) | $ | (38.3 | ) | |||
Loss per common share - basic: | ||||||||||||
Loss from continuing operations | $ | (5.54 | ) | $ | (2.27 | ) | $ | (1.21 | ) | |||
Loss per common share - assuming dilution: | ||||||||||||
Loss from continuing operations | $ | (5.54 | ) | $ | (2.27 | ) | $ | (1.21 | ) | |||
Weighted average shares outstanding — basic | 31.1 | 31.6 | 31.9 | |||||||||
Dilutive effect of stock options and restricted stock | — | — | — | |||||||||
Weighted average shares outstanding — assuming dilution | 31.1 | 31.6 | 31.9 | |||||||||
The following table sets forth the computation of basic and diluted net loss per common share attributable to OM Group, Inc. common stockholders for the years ended December 31:
2014 | 2013 | 2012 | ||||||||||
Amounts attributable to OM Group, Inc. common stockholders: | ||||||||||||
(in millions, except per share amounts) | ||||||||||||
Net loss | $ | (172.6 | ) | (84.0 | ) | $ | (38.7 | ) | ||||
Loss per common share - basic: | ||||||||||||
Net loss | $ | (5.55 | ) | $ | (2.66 | ) | $ | (1.22 | ) | |||
Loss per common share - assuming dilution: | ||||||||||||
Net loss | $ | (5.55 | ) | $ | (2.66 | ) | $ | (1.22 | ) | |||
Weighted average shares outstanding — basic | 31.1 | 31.6 | 31.9 | |||||||||
Dilutive effect of stock options and restricted stock | — | — | — | |||||||||
Weighted average shares outstanding — assuming dilution | 31.1 | 31.6 | 31.9 | |||||||||
We use the treasury stock method to calculate the effect of outstanding share-based compensation awards, which requires the computation of total employee proceeds as the sum of (a) the amount the employee must pay upon exercise of the award, (b) the amount of unearned share-based compensation costs attributed to future services and (c) the amount of tax benefits, if any, that would be credited to additional paid-in capital assuming exercise of the award. Shares, under share-based compensation awards, for which the total employee proceeds exceed the average market price over the applicable period have an anti-dilutive effect on earnings per share, and accordingly, are excluded from the calculation of diluted earnings per share.
In the years ended December 31, 2014 and 2013, stock options to purchase 0.1 million shares and 0.1 million shares, respectively, of common stock were excluded from the calculation of dilutive earnings per share because the options’ exercise prices were greater than the average market price of the common shares and, therefore, the effect would have been anti-dilutive. As we had a loss from continuing operations for the years presented above, the effect of including dilutive securities in the earnings per share calculation would have been anti-dilutive. Accordingly, all shares under share-based compensation awards were excluded from the calculation of loss from continuing operations attributable to OM Group, Inc. common stockholders assuming dilution and net loss attributable to OM Group, Inc. common stockholders assuming dilution.
Note 14 — Share-Based Compensation
On May 13, 2014, our stockholders approved the 2014 Equity and Incentive Compensation Plan (the “2014 Plan”). The 2014 Plan supersedes and replaces the 2007 Incentive Compensation Plan (the “2007 Plan”), which terminated upon the approval of the 2014 Plan. No further grants may be made under the 2007 plan. The termination of the 2007 Plan will not impact outstanding awards issued as part of the 2007 Plan.
Under the 2014 Plan, we may provide equity-based compensation in the form of stock options, stock appreciation rights (or SARs), restricted stock, restricted stock units (or RSUs), performance shares, performance units, dividend equivalents and other stock or stock-based awards to selected employees and non-employee directors. The 2014 Plan also provides for the issuance of common stock to non-employee directors as all or part of their annual compensation for serving as directors, as may be determined by the board of directors.
The total number of shares of common stock available for awards under the 2014 Plan (including any annual stock issuances made to non-employee directors) is 2,550,000. Awards other than stock options and SARs will be counted against the aggregate share limit as 1.79 shares of common stock. Under the 2014 Plan, no more than 1,424,581 shares of common stock could be issued in settlement of restricted stock unit (“RSU”) awards. In addition, no person will be granted (i) stock options or SARs, in the aggregate, for more than 400,000 shares of common stock during any calendar year or (ii) awards of restricted stock, RSUs, performance shares or other stock-based awards intended to qualify as “qualified performance-based compensation” under Section 162(m) of the Internal Revenue Code, in the aggregate, for more than 400,000 shares of common stock during any calendar year.
The 2014 Plan and the 2007 Plan provide that all options granted must have an exercise price of not less than the per share fair market value on the date of grant and that no option may have a term of more than ten years. We satisfy stock option exercises and restricted stock awards through the issuance of authorized but unissued shares or treasury shares.
Set forth below is a summary of share-based compensation expense for option grants, restricted stock awards and restricted stock unit awards included as a component of Selling, general and administrative expenses in the Statements of Consolidated Operations for the year ended December 31:
2014 | 2013 | 2012 | |||||||||
Stock options and restricted stock awards | $ | 6.5 | $ | 5.4 | $ | 5.0 | |||||
Restricted stock unit awards | 0.6 | 0.3 | 0.2 | ||||||||
Share-based compensation expense - employees | $ | 7.1 | $ | 5.7 | $ | 5.2 | |||||
Share-based compensation expense - non-employee directors | $ | 0.5 | $ | 0.5 | $ | 0.5 | |||||
No tax benefit for share-based compensation was realized during 2014, 2013 or 2012 as a result of the valuation allowance against U.S. deferred tax assets.
At December 31, 2014, there was $6.3 million of unrecognized compensation expense related to unvested share-based awards. That cost is expected to be recognized as follows: $4.6 million in 2015, $1.6 million in 2016 and $0.1 million in 2017 as a component of Selling, general and administrative expenses. Unearned compensation expense is recognized over the vesting period for the particular grant. Total unrecognized compensation cost will be adjusted for future changes in actual and estimated forfeitures, updated vesting assumptions for the performance awards, and fluctuations in the fair value of restricted stock unit awards.
Our non-employee directors are paid a portion of their annual retainer in unrestricted shares of common stock which are valued as of the last trading date of the quarter. For purposes of determining the number of shares of common stock to be issued prior to May 13, 2014, the 2007 plan provides that shares are to be valued at the average of the high and low sale price of the Company’s common stock on the New York Stock Exchange ("NYSE"). Pursuant to the 2007 plan we issued 7,084 shares in the six months ended June 30, 2014 and 18,069 shares and 23,752 shares in the 12 months ended December 31, 2013 and 2012, respectively, to non-employee directors. For purposes of determining the number of shares of common stock to be issued subsequent to May 13, 2014, the 2014 plan provides that shares are to be valued at the closing sale price of the Company’s common stock on the NYSE. Pursuant to the 2014 plan, we issued 8,795 shares in the 12 months ended December 31, 2014.
Stock Options
Options granted generally vest in equal increments over a three-year period from the grant date. Upon any change in control of the Company, as defined in the applicable plan, or upon death, disability or retirement, the stock options become 100% vested and exercisable. We account for options that vest over more than one year as one award and recognize expense related to those awards on a straight-line basis over the vesting period.
During 2014, 2013 and 2012, we granted stock options to purchase 230,300, 273,200 and 238,319 shares of common stock, respectively. Included in the 2012 grants are stock options to purchase 4,419 shares of common stock with a vesting period of one year, which were granted to our Chief Executive Officer (“CEO”) in connection with achievement of financial performance criteria in 2011 under our then high-performance incentive plan.
The fair value of options was estimated at the date of grant using a Black-Scholes options pricing model with the following weighted-average assumptions:
2014 | 2013 | 2012 | ||||||||||
Risk-free interest rate | 1.9 | % | 1.1 | % | 1.1 | % | ||||||
Dividend yield | 0.9 | % | — | — | ||||||||
Volatility factor of Company common stock | 56 | % | 54 | % | 55 | % | ||||||
Weighted-average expected option term (years) | 6 | 6 | 6 | |||||||||
Weighted-average grant-date fair value | $ | 15.03 | $ | 13.49 | $ | 15.29 | ||||||
The risk-free interest rate assumption is based upon the U.S. Treasury yield curve appropriate for the term of the options being valued. The dividend yield assumption was ninety-four hundredths for the awards in 2014 due to the initiation of a dividend by the Company. The dividend assumption was previously zero based on the historical expectation of retaining earnings for use in operations at the time of the award issuances in 2013 and 2012. Expected volatilities are based on historical volatility of our common stock. The expected term of options granted is determined using the simplified method allowed by Staff Accounting Bulletin (“SAB”) No. 110 as historical data was not sufficient to provide a reasonable estimate. Under this approach, the expected term is presumed to be the mid-point between the vesting date and the end of the contractual term.
The following table sets forth the number of option shares and weighted-average grant-date fair value:
Shares | Weighted-Average Fair Value at Grant Date | ||||||
Non-vested at December 31, 2012 | 442,626 | $ | 17.20 | ||||
Granted during 2013 | 273,200 | 13.49 | |||||
Vested during 2013 | (214,816 | ) | 17.37 | ||||
Forfeited during 2013 | (64,983 | ) | 16.02 | ||||
Non-vested at December 31, 2013 | 436,027 | 14.78 | |||||
Granted during 2014 | 230,300 | 15.03 | |||||
Vested during 2014 | (218,532 | ) | 15.18 | ||||
Forfeited during 2014 | (26,581 | ) | 14.74 | ||||
Non-vested at December 31, 2014 | 421,214 | $ | 14.36 | ||||
A summary of our stock option activity for 2014 is as follows:
Shares | Weighted Average Exercise Price | Weighted Average Remaining Contractual Term | Aggregate Intrinsic Value | ||||||||||
Outstanding at January 1, 2014 | 1,308,573 | $ | 34.81 | ||||||||||
Granted | 230,300 | 32.06 | |||||||||||
Exercised | (18,764 | ) | 28.03 | ||||||||||
Expired unexercised | (36,201 | ) | 38.91 | ||||||||||
Forfeited | (26,581 | ) | 29.96 | ||||||||||
Outstanding at December 31, 2014 | 1,457,327 | $ | 32.97 | 5.4 | $ | 7.9 | |||||||
Vested or expected to vest at December 31, 2014 | 1,431,451 | $ | 33.04 | 5.4 | $ | 7.7 | |||||||
Exercisable at December 31, 2014 | 1,042,314 | $ | 34.30 | 4.2 | $ | 4.4 | |||||||
The fair value of options that vested during 2014, 2013 and 2012 was $3.3 million, $3.7 million and $3.5 million, respectively. The intrinsic value of options exercised in 2014 and 2013 was $0.1 million and $1.2 million, respectively. No stock options were exercised in 2012. The intrinsic value of an option represents the amount by which the market value of the stock exceeds the exercise price of the option.
We received cash payments of $0.5 million and $2.8 million in 2014 and 2013, respectively, in connection with the exercise of stock options previously granted. The Company does not settle stock options for cash.
Restricted Stock
We issue restricted stock and, beginning in 2012, issue stock-settled restricted stock units to our employees in the U.S (“Restricted Stock," and "US-Based RSUs," respectively). We issue restricted stock units to employees outside the U.S. ("International RSUs"). Certain of the Restricted Stock, US-Based RSUs, and International RSU awards contain time-based vesting conditions and certain of the awards contain performance-based vesting conditions.
The Restricted Stock and US-Based RSU awards are in all cases settled in our common stock. The value of the Restricted Stock and US-Based RSU awards are based upon the market price of an unrestricted share of our common stock at the date of grant. We recognize compensation expense ratably over the requisite performance period based upon the number of awards that are anticipated to vest. The number of awards anticipated to vest is evaluated quarterly and compensation expense is adjusted accordingly. We may withhold shares issued upon vesting if directed by individual employees as a means of meeting minimum statutory tax withholding requirements. We hold the surrendered shares as treasury stock.
The International RSUs are settled in a cash payment that is based on the market price of an unrestricted share of our common stock at the vesting date. Since the awards will be settled in cash, they are treated as a liability award in accordance with the “Stock Compensation” topic of the ASC and are presented as a component of Other non-current liabilities on the Consolidated Balance Sheets. During the vesting period we remeasure the fair value of the International RSUs at each reporting date until the award is settled. Fluctuations in the fair value of the International RSUs are recorded as increases or decreases to compensation expense. Over the life of these awards, the cumulative amount of compensation expense recognized will match the actual cash paid.
Performance-Based Awards
During 2014, 2013 and 2012, we awarded 206,225, 245,950 and 130,500 shares, respectively, of performance-based Restricted stock to U.S. employees and 24,175, 35,150, and 33,450 performance-based International RSUs, respectively, to employees outside the U.S. (collectively "Performance-Based Awards").
The number of Performance-Based Awards that ultimately vest is based upon our achievement of specific measurable financial performance criteria. A recipient of Performance-Based Awards may earn a total award ranging from 0% to 100% of the initial grant, with the target being 50% of the initial grant. The Performance-Based Awards granted during 2013 and 2014 will vest upon the satisfaction of established performance criteria based on average return on net assets and the performance of our share price as compared to the performance of the Russell 2000 unweighted index over a three-year performance period ending December 31, 2015 and 2016, respectively.
The performance period for Performance-Based Awards granted during 2012 ended on December 31, 2014. The vesting of these awards was based on the achievement of consolidated EBITDA margin percentage measured against a predetermined peer group, and average return on net assets, in each case over three-year performance periods ending December 31, 2014. Based upon our performance against the stated performance objectives, 4% of the Performance-Based Awards granted in 2012 remain available to vest, or roughly 3,927 shares of Restricted Stock and 548 International RSUs. Vesting is conditional on approval from the Compensation Committee that the performance objectives were satisfied. The Compensation Committee makes this determination in the first quarter of 2015.
The performance period for Performance-Based Awards granted during 2011 ended on December 31, 2013. The vesting of these awards was based on the achievement of consolidated EBITDA margin percentage (as defined above) measured against a predetermined peer group, and average return on net assets, in each case over three-year performance periods ending December 31, 2013. Based upon our performance against the stated performance objectives, 20% of the Performance-Based Awards granted in 2011 vested, or roughly 18,194 shares of Restricted Stock and 850 International RSUs. The Compensation Committee approved this vesting in the first quarter of 2014.
Upon any change in control of the Company, as defined in the plan, the Performance-Based Awards under the terms of the award agreements vest at the target level. In the event of retirement, death, or disability, a pro rata number of Performance-Based Awards shall remain eligible for vesting at the end of the performance period.
A summary of our Performance-Based Awards for 2014 is as follows:
International Restricted Stock Units | US Shares of Restricted Stock | Weighted Average Grant Date Fair Value | ||||||||
Non-vested at January 1, 2014 | 61,250 | 435,090 | $ | 29.56 | ||||||
Granted | 24,175 | 206,225 | 32.20 | |||||||
Vested | (850 | ) | (18,194 | ) | 36.51 | |||||
Forfeited | (12,183 | ) | (125,617 | ) | 33.63 | |||||
Non-vested at December 31, 2014 | 72,392 | 497,504 | $ | 29.37 | ||||||
Expected to vest as of December 31, 2014 | 9,516 | 57,189 | ||||||||
For awards granted prior to 2011, no performance-based shares vested and were issued in 2014, 2013 or 2012.
Time-Based Awards
In 2014, 2013 and 2012 we awarded 18,525, 60,000 and 69,327 time-based restricted stock units (RSUs); in 2012 we issued 20,000 shares of time-based restricted stock, respectively (collectively "US Time-Based Awards"). Included in the 2012 grant are 2,177 units of time-based awards with a vesting period of one year, which were granted to our Chief Executive Officer ("CEO") in connection with achievement of financial performance criteria under our then high performance annual incentive program. The value of the restricted stock units and restricted stock awarded in 2014, 2013 and 2012, based upon the market price of an unrestricted share of our common stock at the date of grant, was $0.6 million, $1.5 million and $2.6 million, respectively. During 2014, 2013 and 2012, we also awarded 6,050, 7,950, and 17,060 Time-Based International RSUs, respectively.
The US Time-Based Awards and Time-Based International RSUs have similar terms and vest three years from the date of grant, subject to the recipient remaining employed by the Company on that date. Upon any change in control of the Company, as defined in the plan, or upon retirement, the Time-Based Awards become 100% vested. A pro rata number of Time-Based Awards will vest in the event of death or disability prior to the stated vesting date.
A summary of our Time-Based awards for 2014 is as follows:
Time-Based International RSUs | Shares of US Time-Based Awards | Weighted Average Grant Date Fair Value - US Time-Based Awards | ||||||||
Non-vested at January 1, 2014 | 16,330 | 180,560 | $ | 29.26 | ||||||
Granted - three year vesting | 6,050 | 18,525 | 32.17 | |||||||
Vested | (6,220 | ) | (50,895 | ) | 35.99 | |||||
Forfeitures | (1,085 | ) | (13,020 | ) | 29.63 | |||||
Non-vested at December 31, 2014 | 15,075 | 135,170 | $ | 27.08 | ||||||
Expected to vest as of December 31, 2014 | 13,967 | 130,174 | ||||||||
The following US Time-Based Awards vested and were issued in the respective years ended December 31:
2014 | 2013 | 2012 | |||||||
Vested - three year vesting period | 50,895 | 54,300 | 22,100 | ||||||
Vested -one year vesting period | — | 2,177 | 2,767 | ||||||
Shares surrendered to pay withholding taxes | (18,069 | ) | (19,645 | ) | (8,538 | ) | |||
Net shares issued | 32,826 | 36,832 | 16,329 | ||||||
Note 15 — Commitments and Contingencies
We have potential contingent liabilities with respect to environmental matters related to our former operations in Brazil which were sold in 2003. Environmental cost-sharing arrangements are in place between the original owner and operator of these operations and between the Company and the subsequent purchaser of these operations. We have reviewed the limited information made available to us on the environmental conditions and are awaiting more detailed information from the purchaser. We cannot currently evaluate whether or not, or to what extent, we will be responsible for any remediation costs until more detailed information is received and validated.
From time to time, we are subject to various legal and regulatory proceedings, claims and assessments that arise in the normal course of business. The ultimate resolution of such proceedings, claims and assessments is inherently unpredictable and, as a result, our estimates of liability, if any, are subject to change and actual results may materially differ from such estimates. Our estimate of any costs to be incurred as a result of these proceedings, claims and assessments are accrued when the liability is considered probable and the amount can be reasonably estimated. We believe the amount of any current potential liability with respect to legal and regulatory proceedings, claims and assessments will not have a material adverse effect upon our financial condition, results of operations, or cash flows.
Note 16 — Lease Obligations
We rent office space, equipment, and land under long-term operating leases. Our operating lease expense was $8.0 million in 2014, $8.8 million in 2013 and $9.6 million in 2012.
Future minimum payments under noncancellable operating leases at December 31, 2014 are as follows for the years ending December 31:
2015 | $ | 6.6 | |
2016 | 6.0 | ||
2017 | 5.1 | ||
2018 | 3.4 | ||
2019 | 2.1 | ||
Thereafter | 8.2 | ||
Total minimum lease payments | $ | 31.4 | |
Note 17 — Reportable Segments and Geographic Information
We determine our segments based on how the chief operating decision maker makes decisions about allocating resources to segments and measuring their performance. We operate and report our results in four operating segments: Magnetic Technologies, Battery Technologies, Specialty Chemicals and Advanced Materials. Intersegment transactions are immaterial and generally recognized based on current market prices and are eliminated in consolidation. Corporate is comprised of general and administrative expenses not allocated to the operating segments.
The Magnetic Technologies segment develops, manufactures and distributes differentiated, high-performance industrial-use magnetic materials and related products and systems with exceptional magnetic and/or physical properties for a wide array of end markets, including automotive systems, electrical installation technology, energy conversion and distribution, industrial, retail and renewable energy.
The Specialty Chemicals segment develops, produces and supplies chemicals for electronic applications; industrial applications including coatings, composites and tire; and photomasks used by customers to produce semiconductors and related products.
The Battery Technologies segment provides advanced batteries, battery management systems, battery-related research and energetic devices for defense, space, medical and commercial markets.
The Advanced Materials segment manufactured inorganic products using unrefined cobalt and other metals and served the mobile energy storage, renewable energy, automotive systems, construction and mining, and industrial end markets.
The following table reflects the results of our reportable segments:
2014 | 2013 | 2012 | ||||||||||
Net sales | ||||||||||||
Magnetic Technologies | $ | 495.0 | $ | 522.6 | $ | 631.6 | ||||||
Specialty Chemicals (e) | 316.1 | 318.6 | 323.6 | |||||||||
Battery Technologies | 153.8 | 150.3 | 143.0 | |||||||||
Advanced Materials | 102.6 | 166.3 | 447.0 | |||||||||
Intersegment items | — | (0.3 | ) | (0.8 | ) | |||||||
$ | 1,067.5 | $ | 1,157.5 | $ | 1,544.4 | |||||||
Operating profit (loss) | ||||||||||||
Magnetic Technologies (a)(b)(c) | $ | (177.1 | ) | $ | 22.4 | $ | (22.3 | ) | ||||
Specialty Chemicals (a)(b)(d)(e) | 31.3 | 35.8 | 34.5 | |||||||||
Battery Technologies (a)(b) | 19.9 | 21.8 | 19.6 | |||||||||
Advanced Materials | (5.6 | ) | (0.4 | ) | 6.4 | |||||||
Corporate(a)(b)(f) | (33.6 | ) | (38.5 | ) | (42.9 | ) | ||||||
(165.1 | ) | 41.1 | (4.7 | ) | ||||||||
Interest expense | $ | (2.6 | ) | $ | (12.3 | ) | $ | (49.7 | ) | |||
Foreign exchange gain (loss) | (6.5 | ) | 8.0 | (0.8 | ) | |||||||
Gain (loss) on divestiture of Advance Materials business | 1.7 | (111.6 | ) | — | ||||||||
Other income (expense), net | (0.3 | ) | 12.0 | 6.6 | ||||||||
(7.7 | ) | (103.9 | ) | (43.9 | ) | |||||||
Loss from continuing operations before income taxes | (172.8 | ) | (62.8 | ) | (48.6 | ) | ||||||
Expenditures for property, plant & equipment | ||||||||||||
Magnetic Technologies | $ | 26.5 | $ | 30.8 | $ | 27.3 | ||||||
Specialty Chemicals (e) | 3.1 | 7.6 | 4.9 | |||||||||
Battery Technologies | 4.5 | 5.3 | 5.8 | |||||||||
Advanced Materials | — | 6.3 | 29.6 | |||||||||
Corporate | 0.4 | 3.1 | — | |||||||||
$ | 34.5 | $ | 53.1 | $ | 67.6 | |||||||
Depreciation and amortization | ||||||||||||
Magnetic Technologies | $ | 42.2 | $ | 44.2 | $ | 40.8 | ||||||
Specialty Chemicals (e) | 14.0 | 14.8 | 15.7 | |||||||||
Battery Technologies | 10.5 | 10.1 | 10.1 | |||||||||
Advanced Materials | — | 3.9 | 16.9 | |||||||||
Corporate | 0.8 | 0.9 | 0.8 | |||||||||
$ | 67.5 | $ | 73.9 | $ | 84.3 | |||||||
Total assets | ||||||||||||
Magnetic Technologies | $ | 675.0 | $ | 1,020.6 | ||||||||
Specialty Chemicals (e) | 396.3 | 416.5 | ||||||||||
Battery Technologies | 265.9 | 237.4 | ||||||||||
Advanced Materials | 10.6 | 17.9 | ||||||||||
Corporate | 71.7 | 90.7 | ||||||||||
$ | 1,419.5 | $ | 1,783.1 | |||||||||
(a) | The year ended December 31, 2014 includes a $195.4 million goodwill and intangible asset non-cash impairment charge in Magnetic Technologies. The results also include costs related to cost optimization and other business improvement initiatives of $1.9 million in Magnetic Technologies, $2.6 million in Battery Technologies, $2.1 million in Specialty Chemicals, and $0.2 million in Corporate, respectively. Cost reduction initiatives include headcount reductions, minor facility consolidation, supply chain optimization, corporate cost reductions, and other structural changes. There was also a $3.2 million non-cash pension settlement charge in Battery Technologies during the fourth quarter. |
(b) | The year ended December 31, 2013 includes charges related to cost reduction initiatives of $5.4 million in Magnetic Technologies, $0.8 million in Battery Technologies, $1.1 million in Specialty Chemicals and $2.4 million in Corporate, respectively. |
(c) | Includes $55.9 million of charges related to the VAC inventory purchase accounting step-up and LCM charges in 2012. |
(d) | Includes property sale gains of $2.9 million in 2012. |
(e) | All results related to the UPC business are excluded from the Specialty Chemicals segment for all periods presented. |
(f) | Includes a $2.5 million non-cash pension settlement charge to certain participants in one of our U.S. defined benefit pension plans in 2012. |
Net Sales(a)(c) | Long-Lived Assets(b)(c) | |||||||
Geographic Region Information | ||||||||
2014 | ||||||||
Germany | 544.3 | 217.5 | ||||||
United States | 263.3 | 76.1 | ||||||
Finland | 102.6 | — | ||||||
Other | 157.3 | 14.7 | ||||||
$ | 1,067.5 | $ | 308.3 | |||||
2013 | ||||||||
Germany | $ | 571.9 | $ | 247.9 | ||||
United States | 296.2 | 79.5 | ||||||
Finland | 102.6 | — | ||||||
Japan | 29.3 | — | ||||||
Other | 157.5 | 18.2 | ||||||
$ | 1,157.5 | $ | 345.6 | |||||
2012 | ||||||||
Germany | $ | 681.4 | ||||||
United States | 324.9 | |||||||
Finland | 229.7 | |||||||
Japan | 161.7 | |||||||
Other | 146.7 | |||||||
$ | 1,544.4 | |||||||
(a) | Net sales attributed to the geographic area are based on the location of the manufacturing facility, except for Japan, which was a sales office and included in the divestiture of the Advance Materials business. |
(b) | Long-lived assets consists of property, plant and equipment, net. |
(c) | All results and balances related to the UPC business are excluded for all periods presented. |
Note 18 — Quarterly Results of Operations (Unaudited)
The sum of the quarter income (loss) per common share does not agree to the full year information due to the difference in weighted average share values between quarter to date and year to date calculations.
2014 | ||||||||||||||||||||
First Quarter | Second Quarter | Third Quarter | Fourth Quarter | Full Year | ||||||||||||||||
Net sales | $ | 261.7 | $ | 297.5 | $ | 262.9 | $ | 245.4 | $ | 1,067.5 | ||||||||||
Gross profit | $ | 61.9 | $ | 63.1 | $ | 62.6 | $ | 50.6 | $ | 238.2 | ||||||||||
Amounts attributable to OM Group, Inc. common stockholders: | ||||||||||||||||||||
Income (loss) from continuing operations, net of tax | $ | 5.3 | $ | 5.1 | $ | 6.3 | $ | (189.0 | ) | $ | (172.3 | ) | ||||||||
Income (loss) from discontinued operations, net of tax | (0.1 | ) | (0.3 | ) | 0.1 | — | $ | (0.3 | ) | |||||||||||
Net income (loss) | $ | 5.2 | $ | 4.8 | $ | 6.4 | $ | (189.0 | ) | $ | (172.6 | ) | ||||||||
Net income (loss) per common share — basic | ||||||||||||||||||||
Continuing operations | $ | 0.17 | $ | 0.16 | $ | 0.20 | $ | (6.24 | ) | $ | (5.54 | ) | ||||||||
Discontinued operations | — | (0.01 | ) | 0.01 | — | (0.01 | ) | |||||||||||||
Net income (loss) | $ | 0.17 | $ | 0.15 | $ | 0.21 | $ | (6.24 | ) | $ | (5.55 | ) | ||||||||
Net income (loss) per common share — assuming dilution | ||||||||||||||||||||
Continuing operations | $ | 0.16 | $ | 0.16 | $ | 0.20 | $ | (6.24 | ) | $ | (5.54 | ) | ||||||||
Discontinued operations | — | (0.01 | ) | — | — | (0.01 | ) | |||||||||||||
Net income (loss) | $ | 0.16 | $ | 0.15 | $ | 0.20 | $ | (6.24 | ) | $ | (5.55 | ) | ||||||||
The second quarter 2014 includes costs related to cost reduction initiatives of $0.4 million in Specialty Chemicals.
The third quarter 2014 includes costs related to cost optimization and other business improvement initiatives of $0.3 million in Magnetic Technologies, $2.6 million in Battery Technologies, $1.0 million in Specialty Chemicals, and $0.1 million in Corporate, respectively.
The fourth quarter 2014 includes a $195.4 million goodwill and intangible asset non-cash impairment charge in Magnetic Technologies. The fourth quarter 2014 also includes costs related to cost optimization and other business improvement initiatives of $1.6 million in Magnetic Technologies, $0.7 million in Specialty Chemicals, and $0.1 million in Corporate, respectively. There was also a $3.2 million non-cash pension settlement charge in Battery Technologies during the fourth quarter.
2013 | ||||||||||||||||||||
First Quarter | Second Quarter | Third Quarter | Fourth Quarter | Full Year | ||||||||||||||||
Net sales | $ | 341.8 | $ | 279.5 | $ | 265.7 | $ | 270.5 | $ | 1,157.5 | ||||||||||
Gross profit | $ | 74.2 | $ | 63.8 | $ | 65.9 | $ | 54.6 | $ | 258.4 | ||||||||||
Amounts attributable to OM Group, Inc. common stockholders: | ||||||||||||||||||||
Income (loss) from continuing operations, net of tax | $ | (109.5 | ) | $ | 8.1 | $ | 12.4 | $ | 17.3 | $ | (71.7 | ) | ||||||||
Income (loss) from discontinued operations, net of tax | (0.5 | ) | (11.4 | ) | (0.3 | ) | (0.1 | ) | (12.3 | ) | ||||||||||
Net income (loss) | $ | (110.0 | ) | $ | (3.3 | ) | $ | 12.1 | $ | 17.2 | $ | (84.0 | ) | |||||||
Net income (loss) per common share — basic | ||||||||||||||||||||
Continuing operations | $ | (3.47 | ) | $ | 0.26 | $ | 0.40 | $ | 0.54 | $ | (2.27 | ) | ||||||||
Discontinued operations | (0.02 | ) | (0.36 | ) | (0.01 | ) | — | (0.39 | ) | |||||||||||
Net income (loss) | $ | (3.49 | ) | $ | (0.10 | ) | $ | 0.39 | $ | 0.54 | $ | (2.66 | ) | |||||||
Net income (loss) per common share — assuming dilution | ||||||||||||||||||||
Continuing operations | $ | (3.46 | ) | $ | 0.26 | $ | 0.39 | $ | 0.54 | $ | (2.27 | ) | ||||||||
Discontinued operations | (0.02 | ) | (0.36 | ) | (0.01 | ) | — | (0.39 | ) | |||||||||||
Net income (loss) | $ | (3.48 | ) | $ | (0.10 | ) | $ | 0.38 | $ | 0.54 | $ | (2.66 | ) | |||||||
2013 results related to the UPC business are excluded from the Special Chemicals segment for all periods presented.
The first quarter 2013 includes a $111.6 million loss on the divestiture of the Advanced Materials business. The first quarter of 2013 also includes costs related to cost reduction initiatives of $3.8 million in Magnetic Technologies and $0.2 million in Battery Technologies.
The second quarter of 2013 includes a $9.8 million loss on the disposal of the UPC business recorded within Income (loss) from discontinued operations. The second quarter of 2013 also includes costs related to cost reduction initiatives of $0.4 million in Magnetic Technologies, $0.5 million in Battery Technologies, and $1.1 million in Specialty Chemicals.
The third quarter of 2013 includes costs related to cost reduction initiatives of $0.7 million in Magnetic Technologies, $0.1 million in Battery Technologies and $1.0 million in Corporate.
The fourth quarter of 2013 includes a $13.0 million reduction of contingent consideration related to Rahu. The fourth quarter of 2013 includes costs related to cost reduction initiatives of $0.4 million in Magnetic Technologies and $1.4 million in Corporate.
Note 19 - Subsequent Events
On February 18, 2015, we announced a wide-ranging set of competitive repositioning and cost optimization opportunities throughout the enterprise that are expected to improve our ability to serve customers, better compete in global markets and deliver stronger financial performance. The opportunities include headcount reductions across the enterprise; site consolidations; relocation of certain operations to improve our cost structure and better serve customers; better alignment of various research and development, marketing and technical activities with customers’ next generation products and applications; and further corporate cost reductions.
Over the next three years, we expect to incur total cash expenses related to these opportunities of approximately $50.0 - $65.0 million. We also anticipate annualized savings of $30.0 - $40.0 million by the end of 2017, which are expected to ramp up starting in late 2015. Certain of these opportunities will take place in Europe and are subject to negotiations with employee works councils and unions, which could impact the timing and scope of the expected expenses and savings. We expect that the cost of these opportunities will not have a material impact on our financial position or liquidity and will be funded by operating cash flows and borrowing on our revolving line of credit when necessary.
35
Item 9. Changes in and Disagreements with Accountants on Accounting and Financial Disclosure
There are no such changes or disagreements.
Item 9A. Controls and Procedures
Evaluation of Disclosure Controls and Procedures
Our management, with the participation of the Chief Executive Officer and the Chief Financial Officer, evaluated the effectiveness of the design and operation of our disclosure controls and procedures as of December 31, 2014. As defined in Rule 13a-15(e) under the Securities Exchange Act of 1934 (the “Exchange Act”), disclosure controls and procedures are controls and procedures designed to provide reasonable assurance that information required to be disclosed in reports filed or submitted under the Exchange Act is recorded, processed, summarized and reported on a timely basis, and that such information is accumulated and communicated to management, including our Chief Executive Officer and Chief Financial Officer, as appropriate, to allow timely decisions regarding required disclosure. Our disclosure controls and procedures include components of our internal control over financial reporting.
Based upon this evaluation, the Chief Executive Officer and Chief Financial Officer have concluded that our disclosure controls and procedures were effective as of December 31, 2014.
Management’s Report on Internal Control over Financial Reporting
Our management is responsible for establishing and maintaining adequate internal control over financial reporting, as such term is defined in Exchange Act Rules 13a-15(f ) and 15d-15(f ). Under the supervision of the Chief Executive Officer and Chief Financial Officer, management conducted an evaluation of the effectiveness of our internal control over financial reporting as of December 31, 2014 based on the framework set forth in 2013 by the Committee of Sponsoring Organizations of the Treadway Commission (COSO) in “Internal Control-Integrated Framework”. Based on that evaluation, management has concluded that our internal control over financial reporting was effective as of December 31, 2014.
The Company's independent registered public accounting firm, Ernst & Young LLP, audited the Company's internal control over financial reporting and, based on that audit, issued an attestation report regarding the Company's internal control over financial reporting, which is included in this Annual Report.
Changes in Internal Controls
There were no changes in the Company's internal control over financial reporting, identified in connection with management's evaluation of internal control over financial reporting, that occurred during the three months ended December 31, 2014 and materially affected, or are reasonably likely to materially affect, the Company's internal control over financial reporting.
Item 9B. Other Information
None.
PART III
Item 10. Directors, Executive Officers of the Registrant and Corporate Governance
Information with respect to our directors will be set forth under the heading “Proposal 1. Election of Directors” in the Company’s proxy statement to be filed pursuant to Regulation 14A under the Exchange Act in connection with the 2015 Annual Meeting of Stockholders of the Company (the “2015 Proxy Statement”) and is incorporated herein by reference. For information with respect to our executive officers, see “Executive Officers of the Registrant” in Part I of this Form 10-K.
Information with respect to the our audit committee, nominating and governance committee, compensation committee and the audit committee financial experts will be set forth in the 2015 Proxy Statement under the heading “Corporate Governance and Board Matters” and is incorporated herein by reference.
Information with respect to compliance with Section 16(a) of the Exchange Act will be set forth in the 2014 Proxy Statement under the heading “Section 16(a) Beneficial Ownership Reporting Compliance” and is incorporated herein by reference.
We have adopted a Code of Conduct and Ethics that applies to all of our employees, including the principal executive officer, the principal financial officer and the principal accounting officer. The Code of Conduct and Ethics, our corporate governance principles and all committee charters are posted on the “Corporate Governance” portion of the our website (www.omgi.com). A copy of any of these documents is available in print free of charge to any stockholder who requests a copy, by writing to OM Group, Inc., 950 Main Avenue, Suite 1300, Cleveland, Ohio 44113 USA, Attention: Rob Pierce, Vice President, Finance.
On June 6, 2014, we filed the annual certification by our CEO that, as of the date of the certification, he was unaware of any violation by the Company of the corporate governance listing standards of the New York Stock Exchange.
Item 11. Executive Compensation
Information with respect to executive and director compensation and compensation committee interlocks and insider participation, together with the report of the compensation committee regarding the compensation discussion and analysis will be set forth in the 2015 Proxy Statement under the headings “Executive Compensation,” “Corporate Governance and Board Matters — Compensation Committee Interlocks and Insider Participation” and “Compensation Committee Report” and is incorporated herein by reference.
Item 12. Security Ownership of Certain Beneficial Owners and Management and Related Stockholder Matters
Information with respect to security ownership of certain beneficial owners and management will be set forth in the 2015 Proxy Statement under the heading “Security Ownership of Directors, Executive Officers and Certain Beneficial Owners — Beneficial Ownership” and is incorporated herein by reference.
Equity Compensation Plan Information
The following table sets forth information concerning common stock issuable pursuant to our equity compensation plans as of December 31, 2014.
Number of securities to be issued upon exercise of outstanding options | Weighted-average exercise price of outstanding options | Number of securities remaining available for future issuance under equity compensation plans (excluding securities issuable under outstanding options) | ||||||||
Equity Compensation Plans Approved by the Stockholders | 1,368,391 | $ | 32.93 | 2,884,763 | ||||||
Equity Compensation Plans Not Approved by the Stockholders(a) | 88,934 | $ | 33.67 | — | ||||||
Total | 1,457,325 | $ | 32.97 | 2,884,763 | ||||||
__________________________________
(a) | As an inducement to join the Company, on June 13, 2005, the Chief Executive Officer was granted options to purchase 88,934 shares of common stock that are not covered by the equity compensation plans approved by our stockholders. These options have an exercise price of $33.67 per share (the market price of our stock on the grant date was $24.89) and became exercisable on May 31, 2008. The options have an expiration date of June 13, 2015. |
Item 13. Certain Relationships and Related Transactions, Director Independence
Information with respect to certain relationships and related transactions, as well as director independence, will be set forth in the 2015 Proxy Statement under the heading “Corporate Governance and Board Matters” and is incorporated herein by reference.
Item 14. Principal Accountant Fees and Services
Information with respect to principal accounting fees and services will be set forth in the 2015 Proxy Statement under the heading “Description of Principal Accountant Fees and Services” and is incorporated herein by reference.
36
PART IV
Item 15. Exhibits and Financial Statement Schedules
The following Consolidated Financial Statements of OM Group, Inc. are included in Part II, Item 8:
(1) Consolidated Balance Sheets at December 31, 2014 and 2013
Statements of Consolidated Operations for the years ended December 31, 2014, 2013 and 2012
Statements of Consolidated Comprehensive Income (Loss) for the years ended December 31, 2014, 2013 and 2012
Statements of Consolidated Cash Flows for the years ended December 31, 2014, 2013 and 2012
Statements of Consolidated Total Equity for the years ended December 31, 2014, 2013 and 2012
Notes to Consolidated Financial Statements
(2) | Schedule II — Valuation and Qualifying Accounts for the years ended December 31, 2014, 2013 and 2012 |
All other schedules are omitted because they are not applicable or because the information required is included in the consolidated financial statements or the notes thereto.
(3) | Exhibits |
The following exhibits are included in this Annual Report on Form 10-K:
(3) Articles of Incorporation and By-laws | |||
3.1 | Restated Certificate of Incorporation of OM Group, Inc. (incorporated by reference to Exhibit 3.1 of the Company’s Quarterly Report on Form 10-Q (No. 001-12515) filed on November 6, 2008). | ||
3.2 | Amended and Restated By-Laws of OM Group, Inc. (incorporated by reference to Exhibit 3.2 of the Company's Annual Report on Form 10-K filed February 24, 2011). | ||
(4) Instruments defining rights of security holders including indentures. | |||
4.1 | Form of Common Stock Certificate of the Company. ‡ | ||
(10) Material Contracts | |||
*10.1 | OM Group, Inc. Benefit Restoration Plan, effective January 1, 1995 (incorporated by reference to Exhibit 10.9 to the Company's Registration Statement on Form S-4 (No. 333-84128) filed on March 11, 2002). | ||
*10.2 | Trust under OM Group, Inc. Benefit Restoration Plan, effective January 1, 1995 (incorporated by reference to Exhibit 10.10 to the Company's Registration Statement on Form S-4 (No. 333-84128) filed on March 11, 2002). | ||
*10.3 | Amendment to OM Group, Inc. Benefit Restoration Plan (frozen Post-2004/Pre-2008 Terms) (incorporated by reference to Exhibit 10.4 of the Company's Annual Report filed on Form 10-K (No. 001-12515) on February 28, 2008). | ||
10.4 | Credit Agreement, dated as of August 2, 2011, among OM Group, Inc. and Harko C.V., as borrowers, Bank of America, N.A., as Administrative Agent, Swing Line Lender and L/C Issuer, and the Other Lenders Party Thereto Merrill Lynch, Pierce, Fenner & Smith Incorporated, PNC Capital Markets LLC and BNP Securities Corp., as Joint Lead Arrangers and Joint Bookrunning Managers (incorporated by reference to Exhibit 10.1 to the Company's Current Report on form 8-K filed August 4, 2011). | ||
10.5 | Sale and Purchase Agreement, dated December 23, 2009, by and among EaglePicher Corporation, as guarantor of the Seller, EaglePicher Technologies Holdings, LLC, as the Seller, EaglePicher Technologies, LLC, as the Company, OM Group, Inc., as limited guarantor of the Buyer, and OMG Energy Holdings, Inc., as the Buyer (incorporated by reference to Exhibit 10.8 to the Company's Annual Report on Form 10-K (No. 001-12515) filed on February 25, 2010). | ||
*10.6 | OM Group, Inc., 1998 Long-Term Incentive Compensation Plan (incorporated by reference to Exhibit 10.12 to the Company's Annual Report on Form 10-K filed February 24, 2011). | |
*10.7 | Separation Agreement dated October 17, 2003, by and between OM Group, Inc. and Thomas R. Miklich (incorporated by reference to Exhibit 10.13 to the Company's Annual Report on Form 10-K filed February 24, 2011). | |
*10.8 | Form of Stock Option Agreement between OM Group, Inc. and Joseph M. Scaminace (incorporated by reference to Exhibit 10.14 to the Company's Annual Report on Form 10-K filed February 24, 2011). | |
*10.9 | Share Purchase Agreement dated July 3, 2011, by and among VAC Luxembourg S.á.r.l., OMG Germany Holding GmbH and OM Group, Inc. (incorporated by reference to Exhibit 2.1 to the Company's Current Report on Form 8-K filed July 7, 2011). | |
10.10 | Stockholder Agreement, dated July 3, 2011, by and among OM Group, Inc., VAC Luxembourg S.á.r.1, and One Equity Partners II, L.P. (incorporated by reference to Exhibit 10.1 to the Company's Current Report on Form 8-K filed July 7, 2011). | |
*10.11 | Form of Indemnification Agreement between OM Group, Inc. and its directors and certain officers (incorporated by reference to Exhibit 10 to the Company's Current Report on Form 8-K filed on January 25, 2011). | |
*10.12 | Form of Non-Incentive Stock Option Agreement under the 1998 Long-Term Incentive Compensation Plan (incorporated by reference to Exhibit 10.20 to the Company's Annual Report on Form 10-K filed February 24, 2011). | |
*10.13 | OM Group, Inc. 2002 Stock Incentive Plan (incorporated by reference to Exhibit 99 to the Company's Current Report on Form 8-K (No. 001-12515) filed May 5, 2006). | |
*10.14 | Form of Stock Option Agreement (2010) under the 2007 Incentive Compensation Plan (incorporated by reference to Exhibit 10.1 to the Company's Quarterly Report on Form 10-Q filed on November 4, 2010). | |
*10.15 | Form of Restricted Stock Agreement (2010 time-based) under the 2007 Incentive Compensation Plan (incorporated by reference to Exhibit 10.2 to the Company's Quarterly Report on Form 10-Q filed on November 4, 2010). | |
*10.16 | Form of Restricted Stock Agreement (2010 performance-based) under the 2007 Incentive Compensation Plan (incorporated by reference to Exhibit 10.3 to the Company's Quarterly Report on Form 10-Q filed on November 4, 2010). | |
*10.17 | Form of OM Group, Inc. Executive Severance Plan, effective May 31, 2011, for the benefit of certain employees (incorporated by reference to Exhibit 10.1 to the Company's Current Report on Form 8-K filed May 27, 2011). | |
*10.18 | Form of Amended and Restated Change in Control Agreement between OM Group, Inc. and certain executive officers (incorporated by reference to Exhibit 99.2 to the Company's Current Report on Form 8-K (No. 001-12515) filed on November 14, 2006). | |
*10.19 | Amended and Restated Change in Control Agreement dated as of November 13, 2006 between OM Group, Inc. and Joseph M. Scaminace (incorporated by reference to Exhibit 99.4 to the Company's Current Report on Form 8-K (No. 001-12515) filed on November 14, 2006). | |
*10.20 | OM Group, Inc. 2007 Amended and Restated Incentive Compensation Plan (incorporated by reference to Exhibit 10.1 to the Company's Current Report on Form 8-K filed on March 21, 2012). | |
*10.21 | Form of Amended and Restated Change in Control Agreement between OM Group, Inc. and certain executive officers (incorporated by reference to Exhibit 10.33 to the Company's Annual Report on Form 10-K filed February 24, 2011). | |
*10.22 | Form of Stock Option Agreement under the 2007 Incentive Compensation Plan (incorporated by reference to Exhibit 10.1 to the Company's Quarterly Report on Form 10-Q (No. 001-12515) filed on November 2, 2007). | |
*10.23 | Form of Restricted Stock Agreement (time-based) under the 2007 Incentive Compensation Plan (incorporated by reference to Exhibit 10.2 to the Company's Quarterly Report on Form 10-Q (No. 001-12515) filed on November 2, 2007). | |
*10.24 | Form of Restricted Stock Agreement (performance-based) under the 2007 Incentive Compensation Plan (incorporated by reference to Exhibit 10.3 to the Company's Quarterly Report on Form 10-Q (No. 001-12515) filed on November 2, 2007). | |
*10.25 | OM Group, Inc. Deferred Compensation Plan (incorporated by reference to Exhibit 10 to the Company's Current Report on Form 8-K (No. 001-12515) filed July 2, 2008). | |
*10.26 | Form of Change in Control Agreement between OM Group, Inc. and certain executive officers (incorporated by reference to Exhibit 10.38 to the Company's Annual Report on Form 10-K filed on February 28, 2012). | ||
10.27 | Amendment No. 1, dated as of August 1, 2012, to the Credit Agreement, dated as of August 2, 2011, among OM Group, Inc. and Harko C.V., as borrowers, and Bank of America, N.A., as Administrative Agent, Swing Line Lender and L/C Issuer (incorporated by reference to Exhibit 10.1 to the Company's Quarterly Report on Form 10-Q filed on November 9, 2012). | ||
*10.28 | Form of Stock Option Agreement (2012) under the Amended and Restated 2007 Incentive Compensation Plan (incorporated by reference to Exhibit 10.2 to the Company's Current Report on Form 8-K filed March 21, 2012). | ||
*10.29 | Form of Stock Option Agreement (2012 International) under the Amended and Restated 2007 Incentive Compensation Plan (incorporated by reference to Exhibit 10.3 to the Company's Current Report on Form 8-K filed March 21, 2012). | ||
*10.30 | Form of Restricted Stock Agreement (2012 Performance-Based) under the Amended and Restated 2007 Incentive Compensation Plan (incorporated by reference to Exhibit 10.4 to the Company's Current Report on Form 8-K filed March 21, 2012). | ||
*10.31 | Form of Restricted Stock Unit Agreement (2012 Performance-Based International) under the Amended and Restated 2007 Incentive Compensation Plan (incorporated by reference to Exhibit 10.5 the Company's Current Report on Form 8-K filed March 21, 2012). | ||
*10.32 | Form of Restricted Stock Unit Agreement (2012 Time-Based) under the Amended and Restated 2007 Incentive Compensation Plan (incorporated by reference to Exhibit 10.6 to the Company's Current Report on Form 8-K filed March 21, 2012). | ||
*10.33 | Form of Restricted Stock Unit Agreement (2012 Time-Based International) under the Amended and Restated 2007 Incentive Compensation Plan (incorporated by reference to Exhibit 10.7 to the Company's Current Report on Form 8-K filed on March 21, 2012). | ||
10.34 | Asset and Stock Purchase Agreement Among OMG Harjavalta Chemicals Holding BV, OMG Americas, Inc., OM Group, Inc., Koboltti Chemicals Holdings Limited and, Freeport-McMoran Corporation Dated as of January 21, 2013 (incorporated by reference to Exhibit 10.39 to the Company's Annual report on Form 10-K filed February 28, 2013) . | ||
10.35 | Amendment No.2 and Waiver to Credit Agreement dated as of July 1, 2013 to the Credit Agreement dated as of August 2, 2011, among OM Group, Inc., Harko C.V., and Bank of America, as administrative agent, swing line lender, and l/c issuer, and other lenders party thereto (incorporated by reference to Exhibit 10.2 to the Company's Quarterly Report on Form 10-Q filed on November 1, 2013). | ||
10.36 | Credit Agreement, dated as of September 4, 2013 among OM Group, Inc., Harko C.V., and VAC Germany GmbH, as borrowers, PNC Bank, National Association, as administrative agent, and the other agents and lenders party thereto (incorporated by reference to Exhibit 10.1 to the Company's Current Report on Form 8-K filed September 6, 2013). | ||
10.37 | Amendment No.1 to Credit Agreement dated as of November 12, 2013 to the Credit Agreement dated as of September 4, 2013, among OM Group, Inc., Harko C.V., and VAC Germany GmbH, as borrowers, PNC Bank, National Association, as administrative agent, and the other agents and lenders party thereto (incorporated by reference to Exhibit 10.37 to the Company's Annual report on Form 10-K filed February 26, 2014) . . | ||
10.38 | Amendment No.2 to Credit Agreement dated as of February 7, 2014 to the Credit Agreement dated as of September 4, 2013, among OM Group, Inc., Harko C.V., and VAC Germany GmbH, as borrowers, PNC Bank, National Association, as administrative agent, and the other agents and lenders party thereto (incorporated by reference to Exhibit 10.38 to the Company's Annual report on Form 10-K filed February 26, 2014). . | ||
*10.39 | OM Group, Inc. 2014 Equity and Incentive Compensation Plan (incorporated by reference to Exhibit 4.4 to the Company's Current Report on Form S-8 (333-197835) filed August 4, 2014). | ||
*10.40 | Form of International Non-Qualified Stock Option Agreement under the 2014 Equity and Incentive Compensation Plan (incorporated by reference to Exhibits 10.1 to the Company's Current Report on Form 8-K filed August 27, 2014). | ||
*10.41 | Form of International Performance Based-Restricted Stock Units Agreement under the 2014 Equity and Incentive Compensation Plan (incorporated by reference to Exhibits 10.2 to the Company's Current Report on Form 8-K filed August 27, 2014). | ||
*10.42 | Form of International Time-Based Restricted Stock Units Agreement under the 2014 Equity and Incentive Compensation Plan (incorporated by reference to Exhibits 10.3 to the Company's Current Report on Form 8-K filed August 27, 2014). | ||
*10.43 | Form of U.S. Non-Qualified Stock Option Agreement under the 2014 Equity and Incentive Compensation Plan (incorporated by reference to Exhibits 10.4 to the Company's Current Report on Form 8-K filed August 27, 2014). | ||
*10.44 | Form of U.S. Performance-Based Restricted Stock Agreement under the 2014 Equity and Incentive Compensation Plan (incorporated by reference to Exhibits 10.5 to the Company's Current Report on Form 8-K filed August 27, 2014). | ||
*10.45 | Form of U.S. Time-Based Restricted Stock Units Agreement under the 2014 Equity and Incentive Compensation Plan (incorporated by reference to Exhibits 10.6 to the Company's Current Report on Form 8-K filed August 27, 2014). | ||
*10.46 | Form of US Performance Based Restricted Stock Unit under the 2014 Equity and Incentive Compensation Plan | ||
21 | List of Subsidiaries | ||
23 | Consent of Ernst & Young LLP | ||
24 | Powers of Attorney | ||
31.1 | Certification of Principal Executive Officer Pursuant to Rule 13a-14(a) | ||
31.2 | Certification of Principal Financial Officer Pursuant to Rule 13a-14(a) | ||
32 | Certification of Principal Executive Officer and Principal Financial Officer Pursuant to 18 U.S.C. 1350 | ||
101.1 | Instance Document | ||
101.2 | Schema Document | ||
101.3 | Calculation Linkbase Document | ||
101.4 | Labels Linkbase Document | ||
101.5 | Presentation Linkbase Document | ||
101.6 | Definition Linkbase Document | ||
_______________________________________
* | Indicates a management contract, executive compensation plan or arrangement. | |
+ | Portions of Exhibit have been omitted and filed separately with the Securities and Exchange Commission in reliance on Rule 24b-2 and an Order from the Commission granting the Company’s request for confidential treatment dated June 26, 1998. | |
‡ | These documents were filed as exhibits to the Company’s Form S-1 Registration Statement (Registration No. 33-60444) which became effective on October 12, 1993, and are incorporated herein by reference. | |
OM Group, Inc.
Schedule II — Valuation and Qualifying Accounts
Years Ended December 31, 2014, 2013 and 2012
Balance at Beginning of Year | Acquisition / Divestitures | Charged (Credited) to Costs and Expenses | Charged (Credited) to Other Accounts | Deductions | Balance at End of Year | |||||||||||||||||||
Classifications | ||||||||||||||||||||||||
2014 | ||||||||||||||||||||||||
Allowance for doubtful accounts | $ | 3.9 | — | $ | 0.3 | (1) | $ | (1.2 | ) | (9) | $ | (0.5 | ) | (4) | $ | 2.5 | ||||||||
Allowance for note receivable | 19.1 | — | — | (1) | (16.7 | ) | (8) | — | 2.4 | |||||||||||||||
Environmental reserve | 2.3 | — | 0.2 | (3) | — | (0.7 | ) | (5) | 1.8 | |||||||||||||||
$ | 25.3 | $ | — | $ | 0.5 | $ | (17.9 | ) | $ | (1.2 | ) | $ | 6.7 | |||||||||||
2013 | ||||||||||||||||||||||||
Allowance for doubtful accounts | $ | 5.2 | $ | (1.0 | ) | (7) | $ | 0.2 | (1) | $ | (0.2 | ) | (6) | $ | (0.3 | ) | (4) | $ | 3.9 | |||||
Allowance for note receivable | 3.1 | — | 16.0 | (2) | — | — | 19.1 | |||||||||||||||||
Environmental reserve | 2.4 | — | 0.3 | (3) | — | (6) | (0.4 | ) | (5) | 2.3 | ||||||||||||||
$ | 10.7 | $ | (1.0 | ) | $ | 16.5 | $ | (0.2 | ) | $ | (0.7 | ) | $ | 25.3 | ||||||||||
2012 | ||||||||||||||||||||||||
Allowance for doubtful accounts | $ | 4.8 | $ | — | $ | 0.7 | (1) | $ | 0.1 | (6) | $ | (0.4 | ) | (4) | $ | 5.2 | ||||||||
Allowance for note receivable | 3.1 | — | — | (1) | — | — | 3.1 | |||||||||||||||||
Environmental reserve | 2.6 | — | 0.3 | (3) | — | (6) | (0.5 | ) | (5) | 2.4 | ||||||||||||||
$ | 10.5 | $ | — | $ | 1.0 | $ | 0.1 | $ | (0.9 | ) | $ | 10.7 | ||||||||||||
_______________________________________
(1) | Provision for uncollectible accounts and notes receivable included in selling, general and administrative expenses. |
(2) | Note receivable fully reserved at time of sale of cobalt business on March 29, 2013. |
(3) | Provision for environmental costs included in selling, general and administrative expenses. |
(4) | Actual accounts written-off against the allowance. |
(5) | Actual cash expenditures charged against the accrual. |
(6) | Foreign currency translation adjustment. |
(7) | Resulting from sale of AM and UPC businesses during 2013. |
(8) | Relief of note receivable obligation in accordance with compliance on the cobalt supply agreement. |
(9) | Foreign currency translation adjustment and minor balance sheet reclassification. |
Signatures
Pursuant to the requirements of Section 13 or 15(d) of the Securities Exchange Act of 1934, the Registrant has duly caused this Annual Report on Form 10-K to be signed on its behalf by the undersigned, thereunto duly authorized, on March 2, 2015.
OM GROUP, INC.
By: | /s/ Christopher M. Hix | |
Christopher M. Hix
Vice President and Chief Financial Officer
Pursuant to the requirements of the Securities Exchange Act of 1934, this Annual Report on Form 10-K has been signed below on March 2, 2015 by the following persons on behalf of the registrant and in the capacities indicated.
Signature | Title | |||
/s/ Joseph Scaminace Joseph Scaminace | Chairman and Chief Executive Officer (Principal Executive Officer) | |||
/s/ Christopher M. Hix Christopher M. Hix | Vice President and Chief Financial Officer (Principal Financial Officer) | |||
/s/ Carol A. Benton Carol A. Benton | Corporate Controller (Principal Accounting Officer) | |||
/s/ Hans-Georg Betz Hans-Georg Betz | Director | |||
/s/ Richard W. Blackburn Richard W. Blackburn | Director | |||
/s/ Carl R. Christenson Carl R. Christenson | Director | |||
/s/ Steven J. Demetriou Steven J. Demetriou | Director | |||
/s/ Patrick S. Mullin Patrick S. Mullin | Director | |||
/s/ Katharine L. Plourde Katharine L. Plourde | Director | |||
/s/ John A. McFarland John A. McFarland | Director | |||
/s/ Christopher M. Hix Christopher M. Hix Attorney-in-Fact | ||||
37