Attached files
| file | filename |
|---|---|
| 8-K - FORM 8-K - Prologis, Inc. | d82830e8vk.htm |
Exhibit 99.1

| NAREIT June 7-9, 2011 New York |

| Forward-Looking Statements Some of the information included in this press release contains forward-looking statements, such as future opportunities for the combined company, improved cost of capital, increased revenue opportunities, the pending retirement of any of the individual's mentioned, operational, capital deployment, private capital, earnings guidance, personnel, strategies and the approximate cost savings, which are made pursuant to the safe-harbor provisions of Section 21E of the Securities Exchange Act of 1934, as amended, and Section 27A of the Securities Act of 1933, as amended. Because these forward-looking statements involve risks and uncertainties, there are important factors that could cause our actual results to differ materially from those in the forward-looking statements, and you should not rely on the forward-looking statements as predictions of future events. The events or circumstances reflected in forward-looking statements might not occur. You can identify forward-looking statements by the use of forward-looking terminology such as "believes," "expects," "may," "will," "should," "seeks," "approximately," "intends," "plans," "pro forma," "estimates" or "anticipates" or the negative of these words and phrases or similar words or phrases. You can also identify forward-looking statements by discussions of strategy, plans or intentions. Forward-looking statements are necessarily dependent on assumptions, data or methods that may be incorrect or imprecise and we may not be able to realize them. We caution you not to place undue reliance on forward-looking statements, which reflect our analysis only and speak only as of the date of this report or the dates indicated in the statements. We assume no obligation to update or supplement forward-looking statements. The following factors, among others, could cause actual results and future events to differ materially from those set forth or contemplated in the forward-looking statements: changes in general economic conditions in California, the U.S. or globally (including financial market fluctuations), global trade or in the real estate sector (including risks relating to decreasing real estate valuations and impairment charges); risks associated with using debt to fund the company's business activities, including refinancing and interest rate risks; the company's failure to obtain, renew, or extend necessary financing or access the debt or equity markets; the company's failure to maintain its current credit agency ratings or comply with its debt covenants; risks related to the merger with Prologis, including litigation related to the merger, and the risk that the merger may not achieve its intended results, including that the expected synergies will not be realized, or will not be realized during the expected time period; the risks that the businesses will not be integrated successfully; disruption from the merger making it more difficult to maintain business and operational relationships; risks related to the company's obligations in the event of certain defaults under co-investment venture and other debt; defaults on or non-renewal of leases by customers, lease renewals at lower than expected rent or failure to lease properties at all or on favorable rents and terms; difficulties in identifying properties, portfolios of properties, or interests in real-estate related entities or platforms to acquire and in effecting acquisitions on advantageous terms and the failure of acquisitions to perform as the company expects; unknown liabilities acquired in connection with the acquired properties, portfolios of properties, or interests in real-estate related entities; the company's failure to successfully integrate acquired properties and operations; risks and uncertainties affecting property development, redevelopment and value-added conversion (including construction delays, cost overruns, the company's inability to obtain necessary permits and financing, the company's inability to lease properties at all or at favorable rents and terms, and public opposition to these activities); the company's failure to set up additional funds, attract additional investment in existing funds or to contribute properties to its co-investment ventures due to such factors as its inability to acquire, develop, or lease properties that meet the investment criteria of such ventures, or the co- investment ventures' inability to access debt and equity capital to pay for property contributions or their allocation of available capital to cover other capital requirements; risks and uncertainties relating to the disposition of properties to third parties and the company's ability to effect such transactions on advantageous terms and to timely reinvest proceeds from any such dispositions; risks of doing business internationally and global expansion, including unfamiliarity with the new markets and currency risks; risks of changing personnel and roles; losses in excess of the company's insurance coverage; changes in local, state and federal regulatory requirements, including changes in real estate and zoning laws; increases in real property tax rates; risks associated with the company's tax structuring; increases in interest rates and operating costs or greater than expected capital expenditures; environmental uncertainties and risks related to natural disasters; and our failure to qualify and maintain our status as a real estate investment trust. Our success also depends upon economic trends generally, various market conditions and fluctuations and those other risk factors discussed under the heading "Risk Factors" and elsewhere in our most recent annual report on Form 10-K for the year ended December 31, 2010 and our other public reports. 1 |

| 2 The undisputed leader in the industrial sector The best customer franchise in the real estate industry The world's leading industrial real estate private capital franchise The world's leading industrial property developer The best and most diverse real estate talent pool in the industry Vision for Success |
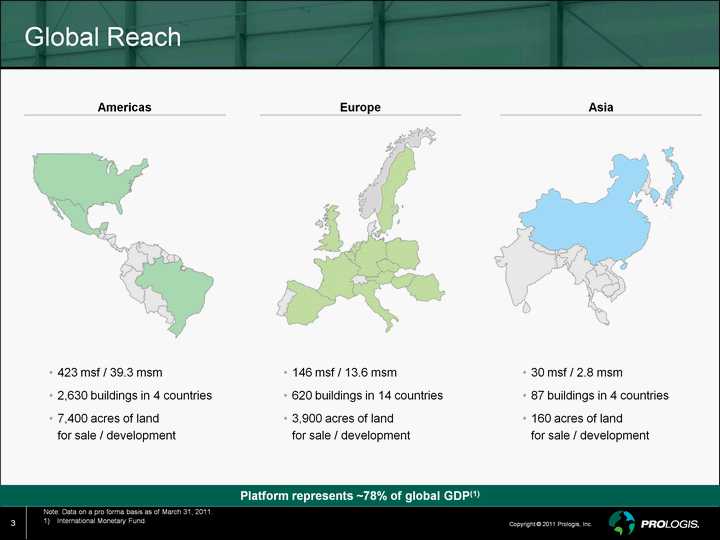
| Note: Data on a pro forma basis as of March 31, 2011. International Monetary Fund. 3 Global Reach Platform represents ~78% of global GDP(1) Americas Europe Asia 423 msf / 39.3 msm 2,630 buildings in 4 countries 7,400 acres of land for sale / development 146 msf / 13.6 msm 620 buildings in 14 countries 3,900 acres of land for sale / development 30 msf / 2.8 msm 87 buildings in 4 countries 160 acres of land for sale / development |
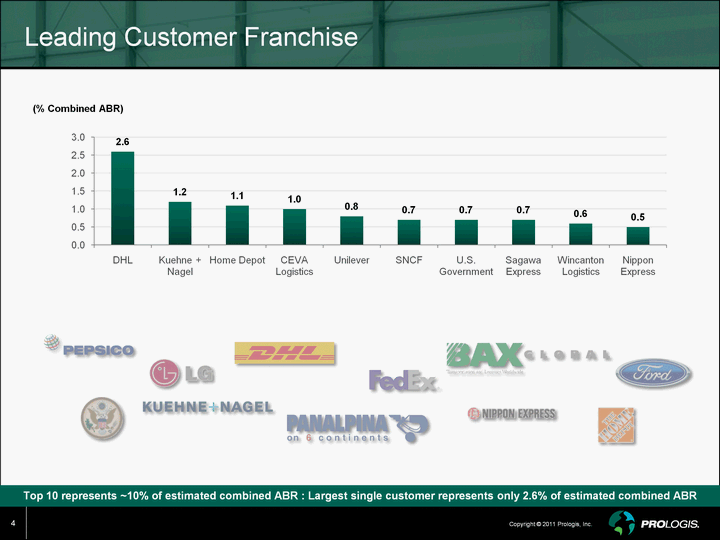
| Top 10 represents ~10% of estimated combined ABR : Largest single customer represents only 2.6% of estimated combined ABR Leading Customer Franchise 4 (% Combined ABR) (CHART) |
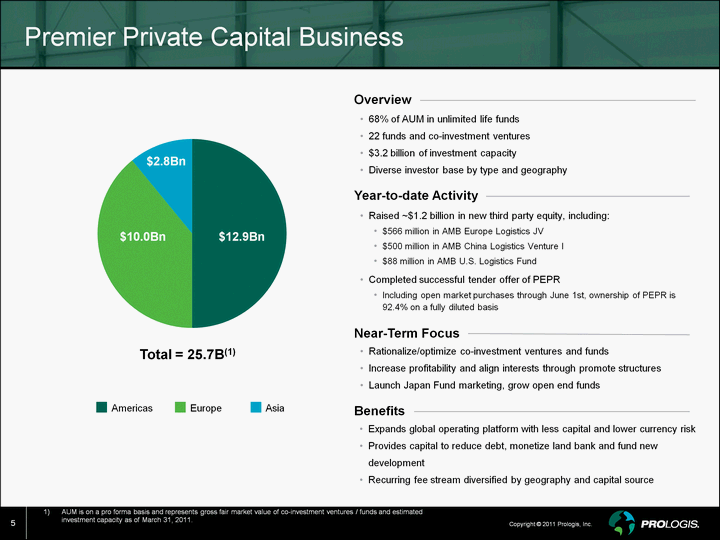
| 5 Premier Private Capital Business AUM is on a pro forma basis and represents gross fair market value of co-investment ventures / funds and estimated investment capacity as of March 31, 2011. (CHART) $12.9Bn $10.0Bn $2.8Bn 68% of AUM in unlimited life funds 22 funds and co-investment ventures $3.2 billion of investment capacity Diverse investor base by type and geography Benefits Rationalize/optimize co-investment ventures and funds Increase profitability and align interests through promote structures Launch Japan Fund marketing, grow open end funds Expands global operating platform with less capital and lower currency risk Provides capital to reduce debt, monetize land bank and fund new development Recurring fee stream diversified by geography and capital source Near-Term Focus Overview Americas Europe Total = 25.7B(1) Year-to-date Activity Raised ~$1.2 billion in new third party equity, including: $566 million in AMB Europe Logistics JV $500 million in AMB China Logistics Venture I $88 million in AMB U.S. Logistics Fund Completed successful tender offer of PEPR Including open market purchases through June 1st, ownership of PEPR is 92.4% on a fully diluted basis |
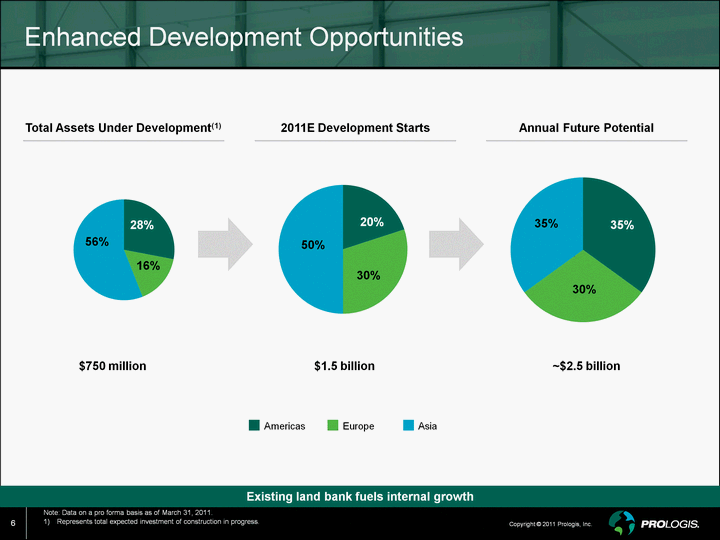
| Existing land bank fuels internal growth Enhanced Development Opportunities (CHART) (CHART) (CHART) $750 million $1.5 billion Total Assets Under Development(1) 2011E Development Starts Annual Future Potential ~$2.5 billion Americas Europe 30% 50% 20% 30% 35% 35% 16% 56% 28% 6 Note: Data on a pro forma basis as of March 31, 2011. Represents total expected investment of construction in progress. |
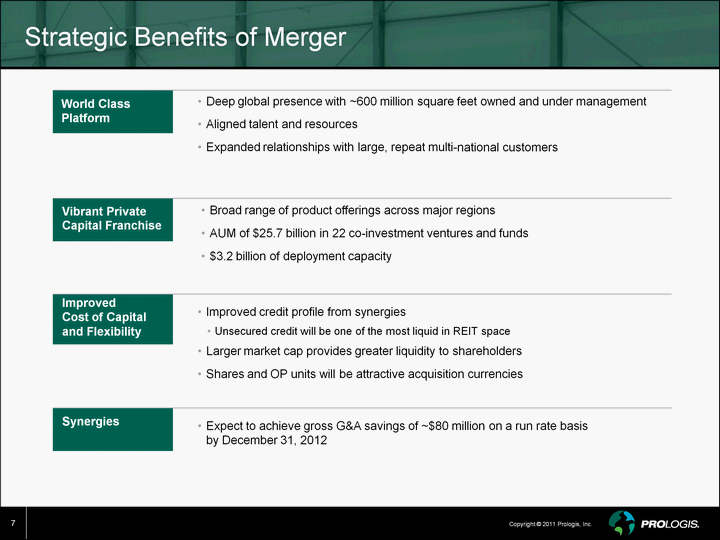
| Strategic Benefits of Merger Improved credit profile from synergies Unsecured credit will be one of the most liquid in REIT space Larger market cap provides greater liquidity to shareholders Shares and OP units will be attractive acquisition currencies Deep global presence with ~600 million square feet owned and under management Aligned talent and resources Expanded relationships with large, repeat multi-national customers Expect to achieve gross G&A savings of ~$80 million on a run rate basis by December 31, 2012 Broad range of product offerings across major regions AUM of $25.7 billion in 22 co-investment ventures and funds $3.2 billion of deployment capacity World Class Platform Vibrant Private Capital Franchise Improved Cost of Capital and Flexibility Synergies 7 |
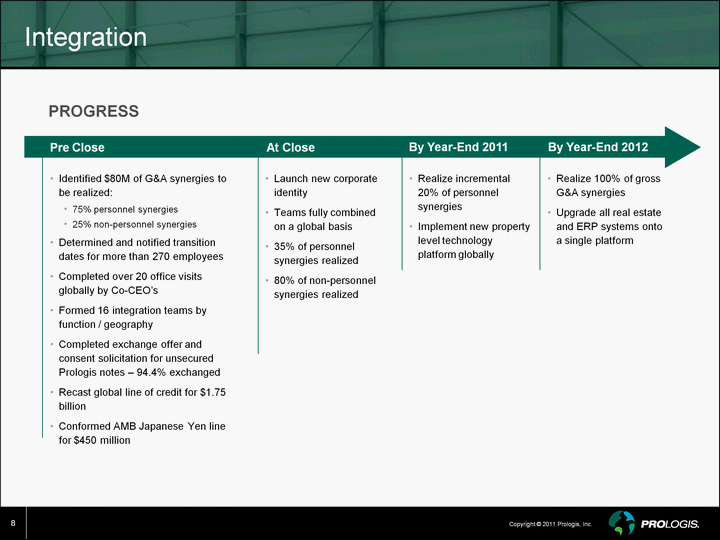
| Integration 8 By Year-End 2011 At Close Pre Close Realize 100% of gross G&A synergies Upgrade all real estate and ERP systems onto a single platform Identified $80M of G&A synergies to be realized: 75% personnel synergies 25% non-personnel synergies Determined and notified transition dates for more than 270 employees Completed over 20 office visits globally by Co-CEO's Formed 16 integration teams by function / geography Completed exchange offer and consent solicitation for unsecured Prologis notes - 94.4% exchanged Recast global line of credit for $1.75 billion Conformed AMB Japanese Yen line for $450 million Realize incremental 20% of personnel synergies Implement new property level technology platform globally Launch new corporate identity Teams fully combined on a global basis 35% of personnel synergies realized 80% of non-personnel synergies realized By Year-End 2012 PROGRESS |
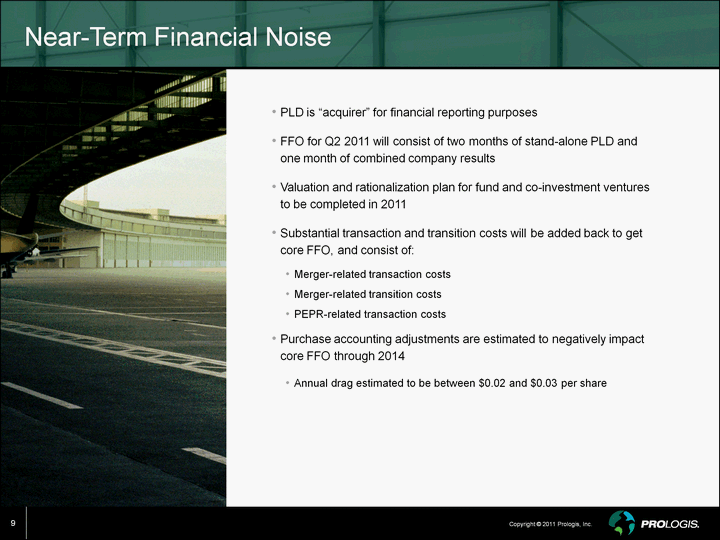
| 9 PLD is "acquirer" for financial reporting purposes FFO for Q2 2011 will consist of two months of stand-alone PLD and one month of combined company results Valuation and rationalization plan for fund and co-investment ventures to be completed in 2011 Substantial transaction and transition costs will be added back to get core FFO, and consist of: Merger-related transaction costs Merger-related transition costs PEPR-related transaction costs Purchase accounting adjustments are estimated to negatively impact core FFO through 2014 Annual drag estimated to be between $0.02 and $0.03 per share Near-Term Financial Noise |
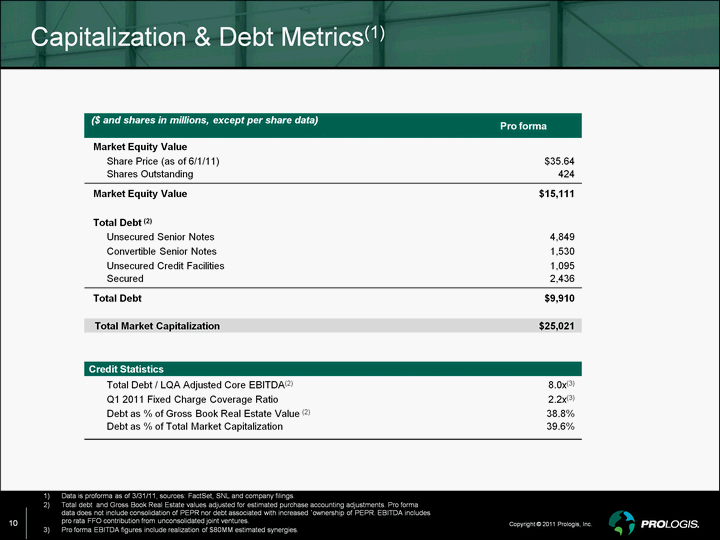
| ($ and shares in millions, except per share data) Pro forma Market Equity Value Share Price (as of 6/1/11) $35.64 Shares Outstanding 424 Market Equity Value $15,111 Total Debt (2) Unsecured Senior Notes 4,849 Convertible Senior Notes 1,530 Unsecured Credit Facilities 1,095 Secured 2,436 Total Debt $9,910 Total Market Capitalization $25,021 Credit Statistics Total Debt / LQA Adjusted Core EBITDA(2) 8.0x(3) Q1 2011 Fixed Charge Coverage Ratio 2.2x(3) Debt as % of Gross Book Real Estate Value (2) 38.8% Debt as % of Total Market Capitalization 39.6% Capitalization & Debt Metrics(1) 10 Data is proforma as of 3/31/11, sources: FactSet, SNL and company filings. Total debt and Gross Book Real Estate values adjusted for estimated purchase accounting adjustments. Pro forma data does not include consolidation of PEPR nor debt associated with increased 'ownership of PEPR. EBITDA includes pro rata FFO contribution from unconsolidated joint ventures. Pro forma EBITDA figures include realization of $80MM estimated synergies. |
| 11 Re-gain Baa1/BBB+/BBB+ credit rating, positive outlook A-eligible credit rating Target balance sheet leverage of < 35% Achieve strong fixed charge coverage ratio of > 2.5x Maintain a large, stable pool of wholly-owned unencumbered properties, predominately U.S. focused Maintain staggered debt maturity profile Strategically access capital to fund development activities hedge currency risk, and reduce debt through: Disposition of non-strategic asset sales Fund contributions Equity, as needed Unsecured bond issuances Financial Goals 2011-2013 |
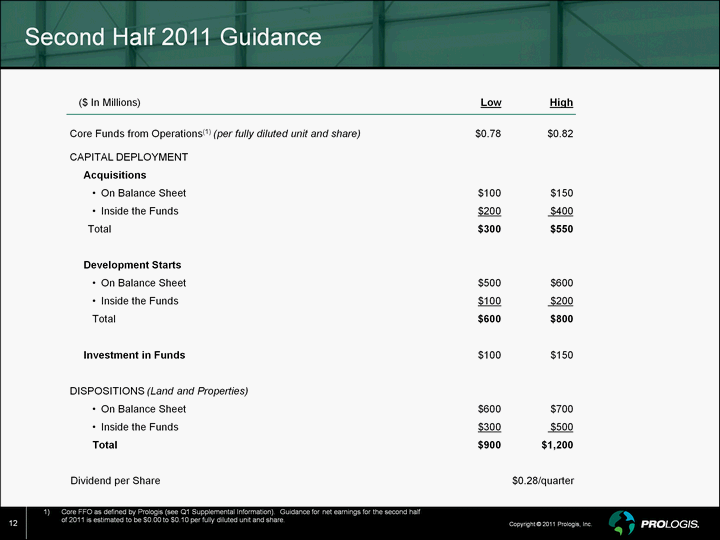
| 12 Second Half 2011 Guidance Core FFO as defined by Prologis (see Q1 Supplemental Information). Guidance for net earnings for the second half of 2011 is estimated to be $0.00 to $0.10 per fully diluted unit and share. ($ In Millions) Low High Core Funds from Operations(1) (per fully diluted unit and share) $0.78 $0.82 CAPITAL DEPLOYMENT Acquisitions On Balance Sheet $100 $150 Inside the Funds $200 $400 Total $300 $550 Development Starts On Balance Sheet $500 $600 Inside the Funds $100 $200 Total $600 $800 Investment in Funds $100 $150 DISPOSITIONS (Land and Properties) On Balance Sheet $600 $700 Inside the Funds $300 $500 Total $900 $1,200 Dividend per Share $0.28/quarter |
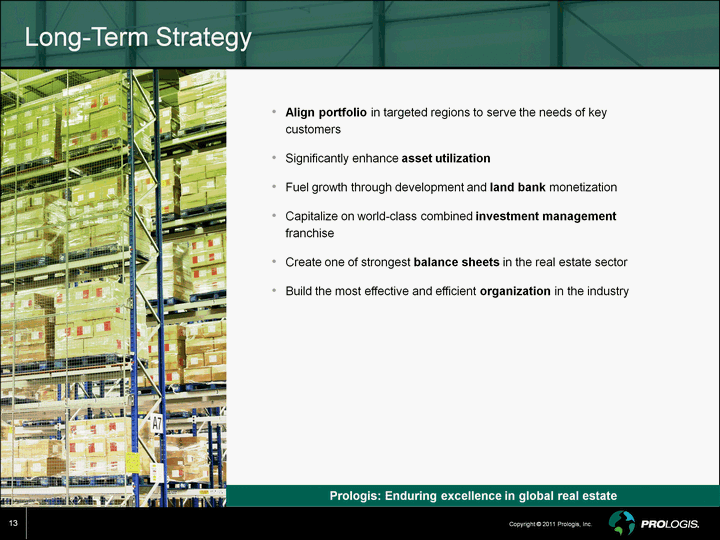
| 13 Align portfolio in targeted regions to serve the needs of key customers Significantly enhance asset utilization Fuel growth through development and land bank monetization Capitalize on world-class combined investment management franchise Create one of strongest balance sheets in the real estate sector Build the most effective and efficient organization in the industry Long-Term Strategy Prologis: Enduring excellence in global real estate |

| Appendix 14 |
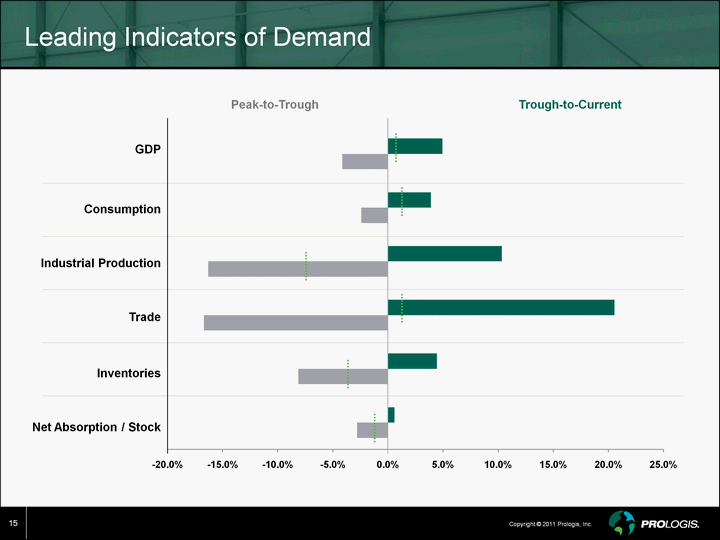
| Leading Indicators of Demand 15 (CHART) Peak-to-Trough Trough-to-Current Industrial Production GDP Consumption Inventories Net Absorption / Stock Trade |
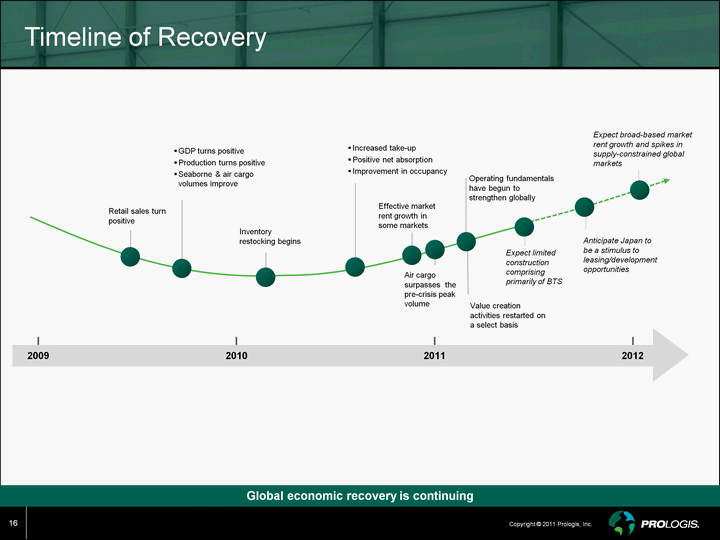
| Timeline of Recovery Global economic recovery is continuing 16 Expect broad-based market rent growth and spikes in supply-constrained global markets Retail sales turn positive Increased take-up Positive net absorption Improvement in occupancy GDP turns positive Production turns positive Seaborne & air cargo volumes improve Inventory restocking begins Effective market rent growth in some markets 2009 2010 2011 2012 Operating fundamentals have begun to strengthen globally Expect limited construction comprising primarily of BTS Anticipate Japan to be a stimulus to leasing/development opportunities Air cargo surpasses the pre-crisis peak volume Value creation activities restarted on a select basis |
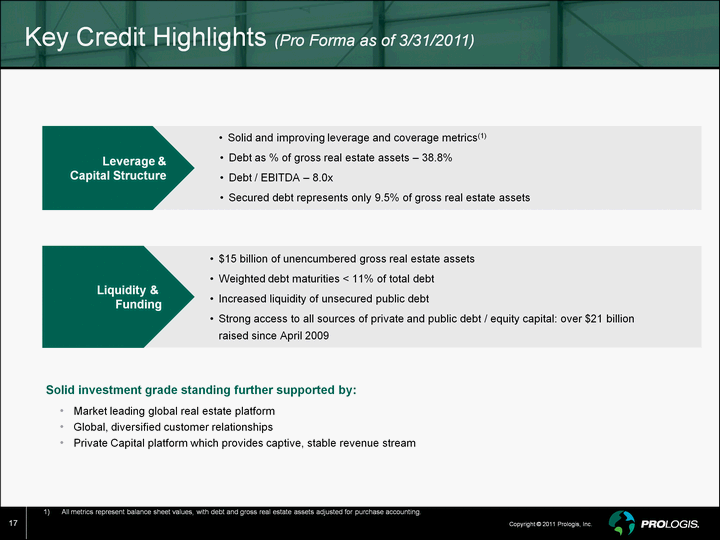
| Key Credit Highlights (Pro Forma as of 3/31/2011) $15 billion of unencumbered gross real estate assets Weighted debt maturities < 11% of total debt Increased liquidity of unsecured public debt Strong access to all sources of private and public debt / equity capital: over $21 billion raised since April 2009 Liquidity & Funding Solid and improving leverage and coverage metrics(1) Debt as % of gross real estate assets - 38.8% Debt / EBITDA - 8.0x Secured debt represents only 9.5% of gross real estate assets Leverage & Capital Structure Solid investment grade standing further supported by: Market leading global real estate platform Global, diversified customer relationships Private Capital platform which provides captive, stable revenue stream (1) All metrics represent balance sheet values, with debt and gross real estate assets adjusted for purchase accounting 17 All metrics represent balance sheet values, with debt and gross real estate assets adjusted for purchase accounting. |
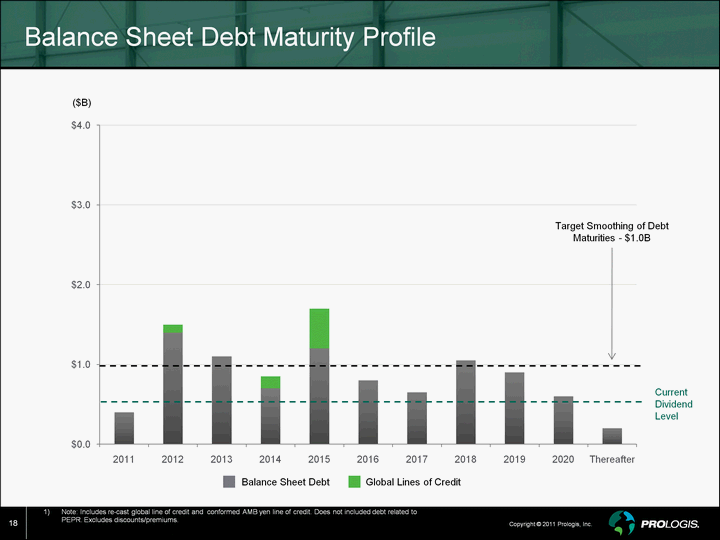
| Note: Includes re-cast global line of credit and conformed AMB yen line of credit. Does not included debt related to PEPR. Excludes discounts/premiums. 18 Balance Sheet Debt Maturity Profile (CHART) ($B) Target Smoothing of Debt Maturities - $1.0B Balance Sheet Debt Global Lines of Credit Current Dividend Level |
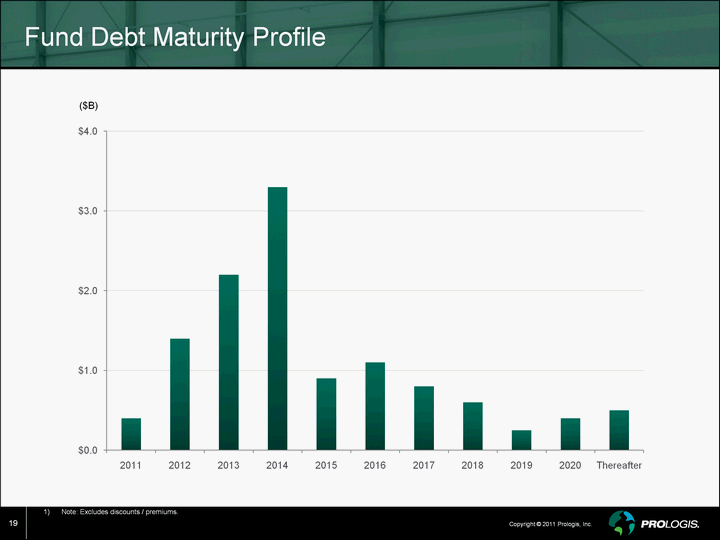
| Note: Excludes discounts / premiums. 19 Fund Debt Maturity Profile ($B) (CHART) |
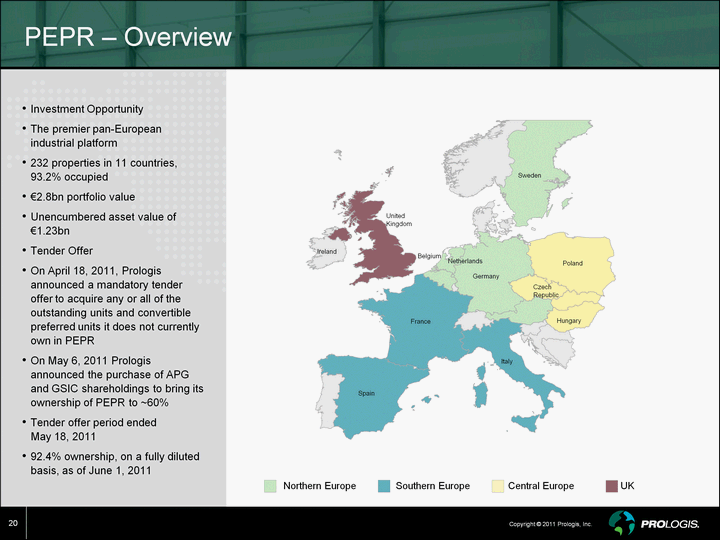
| Investment Opportunity The premier pan-European industrial platform 232 properties in 11 countries, 93.2% occupied €2.8bn portfolio value Unencumbered asset value of €1.23bn Tender Offer On April 18, 2011, Prologis announced a mandatory tender offer to acquire any or all of the outstanding units and convertible preferred units it does not currently own in PEPR On May 6, 2011 Prologis announced the purchase of APG and GSIC shareholdings to bring its ownership of PEPR to ~60% Tender offer period ended May 18, 2011 92.4% ownership, on a fully diluted basis, as of June 1, 2011 20 PEPR - Overview Spain France Italy Germany Czech Republic Hungary Poland Sweden Netherlands Ireland United Kingdom Belgium Northern Europe Southern Europe Central Europe UK |
| Core EBITDA, as Adjusted: The companies use core adjusted earnings before interest, tax, depreciation and amortization, impairment charges, gains or losses from the disposition of real estate investments, losses on early extinguishment of debt and derivatives contracts (including cash charges), and other non-cash charges (such as stock based compensation amortization, unrealized gains or losses on foreign currency and derivative activity) , including the companies share of these items (other than interest and current taxes) from their unconsolidated investees or ("Core EBITDA, as adjusted"), to measure both their operating performance and liquidity. The companies consider Core EBITDA, as adjusted to provide investors relevant and useful information because it permits investors to view income from operations on an unleveraged basis before the effects of tax, non-cash depreciation and amortization expense and other items(including stock-based compensation amortization and certain unrealized gains and losses), gains from the disposition of real estate investments, and other significant non-cash items. By excluding interest expense, adjusted EBITDA allows investors to measure the company's operating performance independent of their capital structure and indebtedness and, therefore, allows for a more meaningful comparison of its operating performance to that of other companies, both in the real estate industry and in other industries. The impairment charges were principally a result of the companies' changed intent with respect to the holding period of certain of its real estate properties and decreases in fair value due to increases in capitalization rates and deterioration in market conditions that adversely impacted values. Losses on the early extinguishment of debt and derivatives contracts generally included the costs of repurchasing debt securities. Although difficult to predict, these items may be recurring given the uncertainty of the current economic climate and its adverse effects on the real estate and financial markets. While not infrequent or unusual in nature, these items result from market fluctuations that can have inconsistent effects on each company's results of operations. The economics underlying these items reflect market and financing conditions in the short-term but can obscure each company's performance and the value of each company's long-term investment decisions and strategies. As a liquidity measure, the companies believe that Core EBITDA, as adjusted helps investors to analyze their ability to meet interest payment obligations and to make quarterly preferred share dividends and unit distributions. The companies believe that investors should consider Core EBITDA, as adjusted , in conjunction with net income (the primary measure of each company's performance) and the other required Generally Accepted Accounting Principles ("GAAP") measures of its performance and liquidity, to improve their understanding of each company's operating results and liquidity, and to make more meaningful comparisons of their performance against other companies. By using Core EBITDA, as adjusted, an investor is assessing the earnings generated by each company's operations, but not taking into account the eliminated expenses or gains incurred in connection with such operations. As a result, adjusted EBITDA has limitations as an analytical tool and should be used in conjunction with each company's required GAAP presentations. Core EBITDA, as adjusted does not reflect each company's historical cash expenditures or future cash requirements for working capital, capital expenditures distribution requirements or contractual commitments. Core EBITDA, as adjusted also does not reflect the cash required to make interest and principal payments on each company's outstanding debt. While Core EBITDA, as adjusted is a relevant and widely used measure of operating performance and liquidity, it does not represent net income or cash flow from operations as defined by GAAP and it should not be considered as an alternative to those indicators in evaluating operating performance or liquidity. Further, the companies' computation of Core EBITDA, as adjusted may not be comparable to EBITDA reported by other companies. The companies compensate for the limitations of Core EBITDA, as adjusted by providing investors with financial statements prepared according to U.S. GAAP, along with this detailed discussion of Core EBITDA, as adjusted and a reconciliation of Core EBITDA, as adjusted to net income (or loss), a U.S. GAAP measurement. Reporting Definitions 21 |
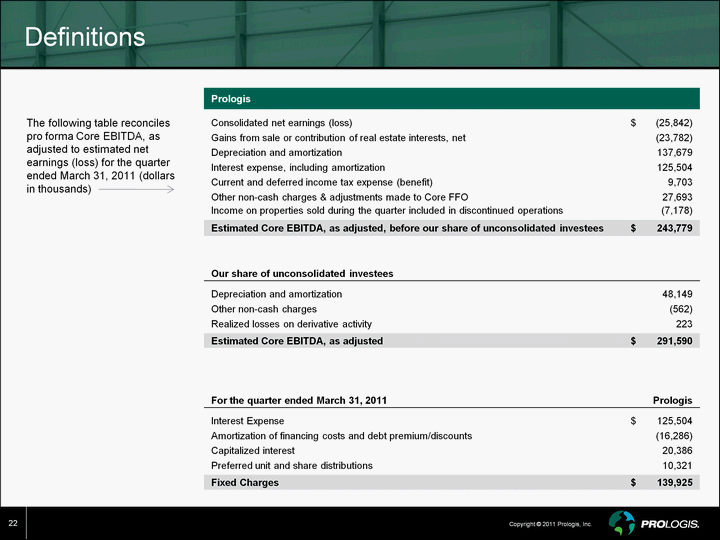
| Definitions The following table reconciles pro forma Core EBITDA, as adjusted to estimated net earnings (loss) for the quarter ended March 31, 2011 (dollars in thousands) 22 Prologis Prologis Prologis Consolidated net earnings (loss) $ (25,842) Gains from sale or contribution of real estate interests, net (23,782) Depreciation and amortization 137,679 Interest expense, including amortization 125,504 Current and deferred income tax expense (benefit) 9,703 Other non-cash charges & adjustments made to Core FFO 27,693 Income on properties sold during the quarter included in discontinued operations (7,178) Estimated Core EBITDA, as adjusted, before our share of unconsolidated investees $ 243,779 Our share of unconsolidated investees Depreciation and amortization 48,149 Other non-cash charges (562) Realized losses on derivative activity 223 Estimated Core EBITDA, as adjusted $ 291,590 For the quarter ended March 31, 2011 Prologis Interest Expense $ 125,504 Amortization of financing costs and debt premium/discounts (16,286) Capitalized interest 20,386 Preferred unit and share distributions 10,321 Fixed Charges $ 139,925 |
