Attached files
| file | filename |
|---|---|
| 8-K - FORM 8-K - TOWER BANCORP INC | d8k.htm |
 Tower Bancorp, Inc.
Annual Meeting
May 24, 2011
Exhibit 99.1 |
 ABOUT
THIS PRESENTATION 2
Safe
Harbor
Regarding
Forward-Looking
Statements
This
presentation
contains
forward-looking
statements
that
are
intended
to
be
covered
by
the
safe
harbor
for
forward-
looking
statements
provided
by
the
Private
Securities
Litigation
Reform
Act
of
1995.
Forward-looking
statements
are
not
statements
of
historical
fact,
and
can
be
identified
by
the
use
of
forward-looking
terminology
such
as
“believe,”
“expect,”
“may,”
“will,”
“should,”
“project,”
“plan,”
“seek,”
“target,”
“intend”
or
“anticipate”
or
the
negative
thereof
or
comparable
terminology.
Forward-looking
statements
include
discussions
of
strategy,
financial
projections
and
estimates
and
their
underlying
assumptions,
statements
regarding
plans,
objectives,
expectations
or
consequences
of
various
transactions,
and
statements
about
the
future
performance,
operations,
products
and
services
of
Tower
and
our
subsidiaries.
These
forward-looking
statements
are
subject
to
various
assumptions,
risks,
uncertainties
and
other
factors
including,
but
not
limited
to:
a
continuation
or
worsening
of
the
current
disruption
in
credit
and
other
markets;
the
ineffectiveness
of
Tower’s
business
strategy
due
to
changes
in
current
or
future
market
conditions;
the
effects
of
competition,
and
of
changes
in
laws
and
regulations
on
competition,
including
industry
consolidation
and
development
of
competing
financial
products
and
services;
interest
rate
movements;
the
performance
of
Tower’s
investment
portfolio;
changes
in
rates
of
deposit
and
loan
growth;
asset
quality
and
the
impact
on
assets
from
adverse
changes
in the
economy
and
in
credit
or
other
markets
and
resulting
effects
on
credit
risk
and
asset
values;
inability
to
achieve
merger-
related
synergies;
difficulties
in
integrating
distinct
business
operations,
including
information
technology;
capital
and
liquidity
strategies;
and
deteriorating
economic
conditions.
The
foregoing
review
of
important
factors
should
be
read
in
conjunction
with
the
risk
factors
and
other
cautionary
statements
included
in
documents
filed
by
Tower
Bancorp,
Inc.
with
the
Securities
and
Exchange
Commission,
including
Tower’s
Quarterly
Report
on
Form
10-Q, Annual
Report
on
Form
10-K
and
other
required
filings.
Because
of
these
uncertainties,
risks
and
the
possibility
of
changes
in
these
assumptions,
actual
results
could
differ
materially
from
those
expressed
in
any
forward-looking
statements.
Investors
are
cautioned
not
to
place
undue
reliance
on
these
statements.
Tower
Bancorp,
Inc.
assumes
no
duty
or
obligation
to
update
any
forward-looking
statements
made
in
this
presentation.
Non-GAAP
Financial
Measures
This
presentation
contains
the
non-GAAP
financial
measure,
ratio
of
tangible
common
equity
to
tangible
assets.
In
order
to
calculate
tangible
common
equity
and
tangible
assets,
Tower’s
management
subtracts
intangible
assets
from
both
common
equity
and
assets.
Reconciliations
of
these
non-GAAP
measures
to
the
most
directly
comparable
GAAP
measures
are
set
forth
in
the
Appendix. |
 CORPORATE PROFILE
3
Corporate Overview
•
High growth community bank headquartered in
Harrisburg, PA
•
49 banking offices located primarily in central and
southeastern Pennsylvania
•
Major Business Lines
•
Small Business Banking
•
Retail Banking
•
Wealth Management
•
Not-for-profit Banking
Financial Highlights 12/31/2010 (unaudited)
Assets:
Deposits:
Loans:
TCE/TA (1)
Market Capitalization(2)
$2.7 billion
$2.3 billion
$2.2 billion
8.53%
$263 million
Source: Company Documents as of 12/31/2010
(1) This
measure is considered to be a Non-GAAP measure. Management uses
this ratio to assess the strength of the Tower Bancorp,
Inc.'s capital position. See the reconciliation of GAAP to Non-GAAP
measures in the appendix to this presentation. (2) Source: SNL Financial as
of January 28, 2011 |
   CONFIRMED GROWTH MODEL
Tower Bancorp Inc.
$2.7 Billion Assets
49 Branches as of 12/31/2010
“Creating Central/Southeastern
Pennsylvania’s Premier Community Bank”
November
2005-Opened
De Novo
Graystone
Bank
Graystone Bank
reached over $600
million in assets in less
than 3 years
March 31
st
2009 -
Completed Merger of
Graystone Financial
Corp. and Tower
Bancorp, Inc.
December 10
th
2010 –Completed
Merger of First
Chester County
Corporation |
 5
Potentially attractive growth and expansion opportunities
FOOTPRINT AND CURRENT GROWTH POTENTIAL
Note: Tower believes that a growth opportunity exists for the counties appropriately marked
above based on Tower’s close proximity to those counties, management’s
familiarity with the demographics and businesses and business leaders in those counties and Tower’s reputation in those counties.
1N Bank Division
Graystone Bank and Tower Bank Divisions
Growth Markets |
 6
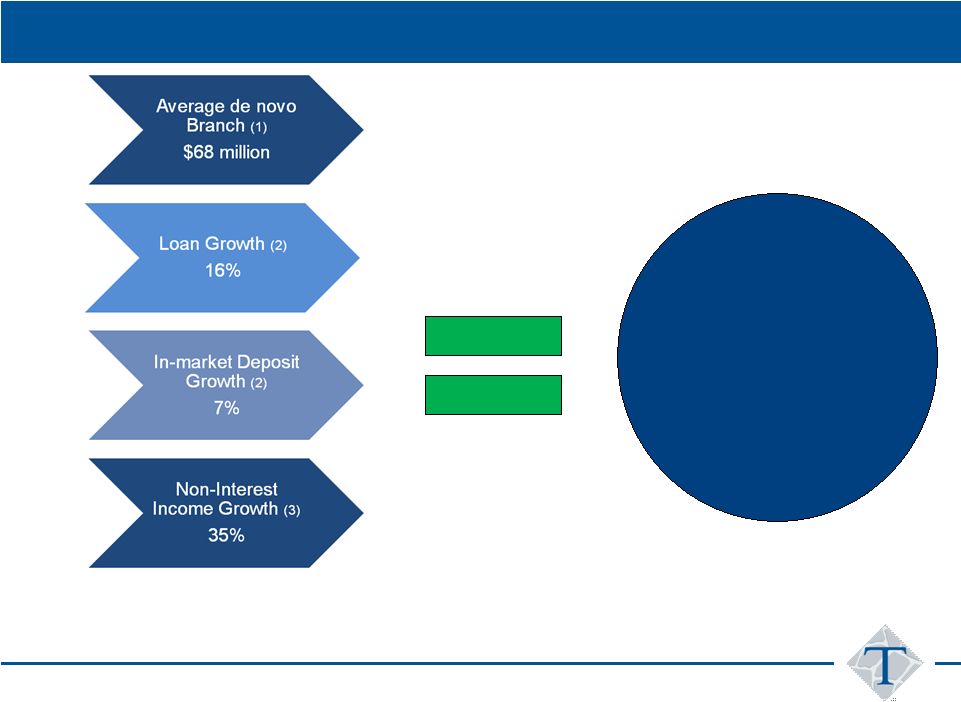
2010 ORGANIC GROWTH
(1)
Source: FDIC Deposit Data as of 6/30/2010
(2)
Source: Company Documents-
Growth % Year Ended 12/31/2010
Excludes
$51.5
million
participation
purchased
from
First
Chester
and
$24
million
loan
to
First
Chester
(both
in
4
th
quarter
of
2009).
Also
excludes
loans
and
deposits
acquired
from
First
Chester
County
Corporation.
(3)
Source:
Company
Documents–
Non-Interest
Income
Growth
year
ended
12/31/2010
vs.
12/31/2009
Compelling
Organic
Growth |
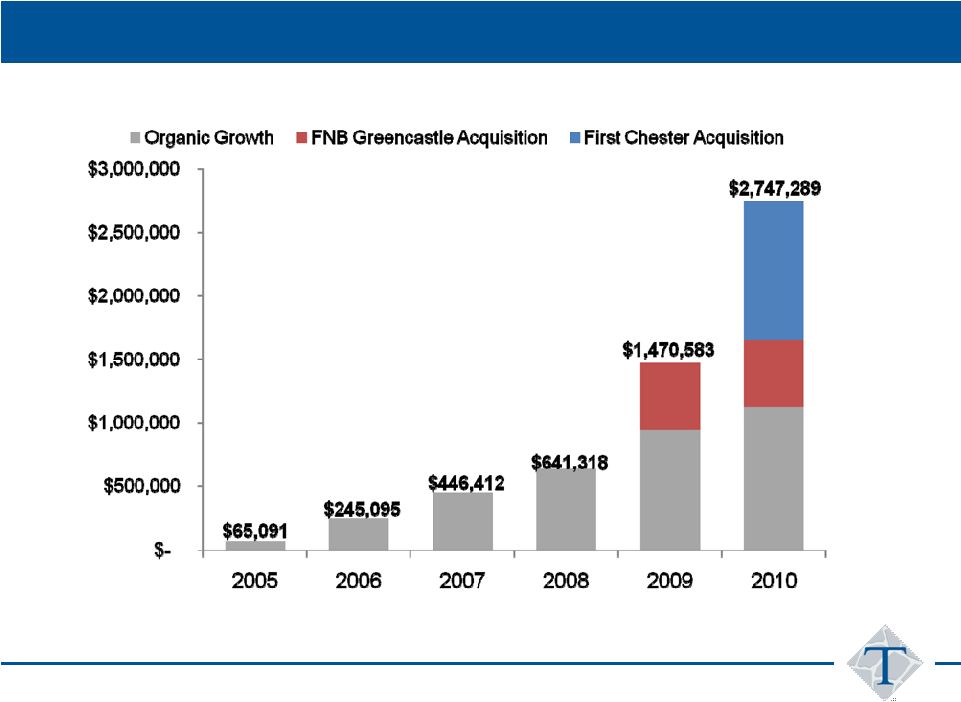 7
ASSET GROWTH ($000) (1) (2)
Source: Company Documents as of 12/31/2010
(1)
All
financial
information
for
periods
prior
to
March
31,
2009
represents
historical
financials
for
Graystone
Financial
Corp.,
as
the
accounting
acquirer
in
the
reverse
merger
with
Tower
Bancorp
Inc.
(2)
2005
financial
data
reflects
the
period
from
September
2,
2005
(inception
date)
to
December
31,
2005 |
 8
DEPOSIT GROWTH ($000) (1) (2)
Source: Company Documents as of 12/31/2010
(1) All financial information for periods prior to March 31, 2009 represents
historical financials for Graystone Financial Corp., as the accounting
acquirer in the reverse merger with Tower Bancorp Inc.
(2) 2005 financial data reflects the period from September 2, 2005 (inception date)
to December 31, 2005 |
 9
LOAN GROWTH ($000) (1) (2)
Source: Company Documents as of 12/31/2010
(1) All financial information for periods prior to March 31, 2009 represents
historical financials for Graystone Financial Corp., as the accounting
acquirer in the reverse merger with Tower Bancorp Inc.
(2) 2005 financial data reflects the period from September 2, 2005 (inception date)
to December 31, 2005 |
 10
STRONG CREDIT METRICS
Source: Company Documents as of 12/31/2010 and SNL Financial
Note:
Peer
Group
LTM
ended
9/30/2010
and
Tower
Bancorp
LTM
ended
12/31/2010
(unaudited).
Peer
group
companies
are
set
forth
in
the Appendix to this presentation
NCOs/Average Loans |
 11
STRONG CREDIT METRICS
Source: Company Documents as of 12/31/2010 and SNL Financial
Note:
Peer
Group
LTM
ended
9/30/2010
and
Tower
Bancorp
LTM
ended
12/31/2010
(unaudited).
Peer
group
companies
are
set
forth
in
the Appendix to this presentation |
 12
NON-INTEREST INCOME
($000) (1) (2)
Source: Company Documents as of 12/31/2010
(1) All financial information for periods prior to March 31, 2009 represents
historical financials for Graystone Financial Corp., as the accounting
acquirer in the reverse merger with Tower Bancorp Inc.
(2) 2005 financial data reflects the period from September 2, 2005 (inception date)
to December 31, 2005 |
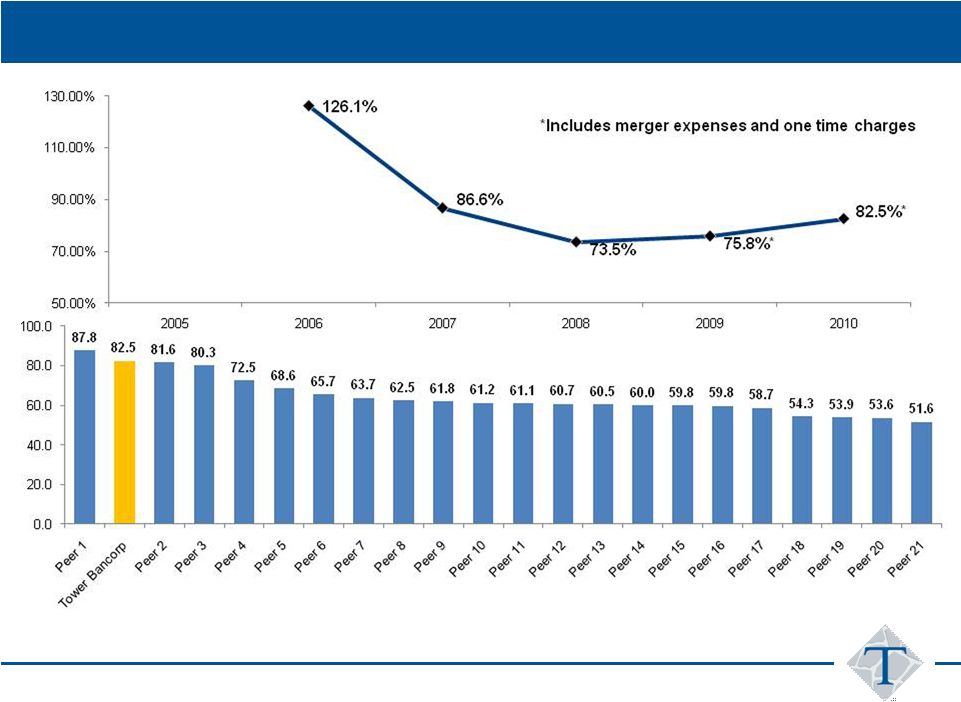 13
FUTURE EFFICIENCY IMPROVEMENT
Source: Company Documents as of 12/31/2010 and SNL Financial
(1) All financial information for periods prior to March 31, 2009 represents
historical financials for Graystone Financial Corp., as the accounting acquirer in the reverse merger
(2)
Efficiency
ratio
is
calculated
as
total
non-interest
expense
divided
by
the
total
of
net
interest
income
and
non-interest
income.
Note:
Peer
Group
LTM
ended
9/30/2010
and
Tower
Bancorp
LTM
ended
12/31/2010
(unaudited).
Peer
group
companies
are
set
forth
in
the
Appendix
to
this
presentation |
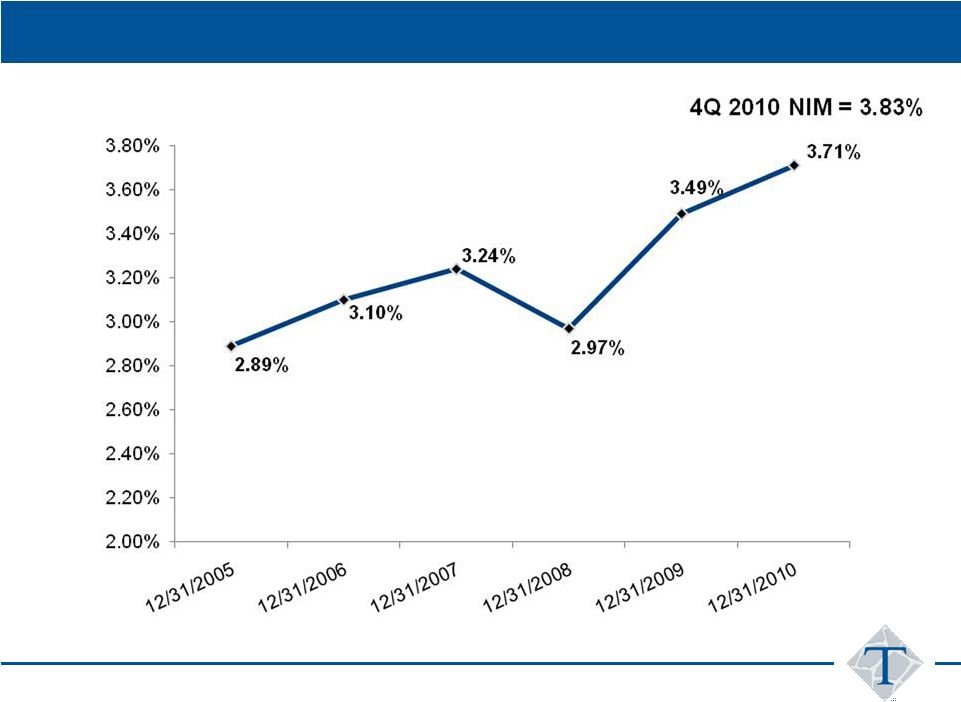 14
NET INTEREST MARGIN (1) (2)
Source: Company Documents as of 12/31/2010
(1) All financial information for periods prior to March 31, 2009 represents
historical financials for Graystone Financial Corp., as the accounting
acquirer in the reverse merger
(2) 2005 financial data reflects the period from September 2, 2005 (inception date)
to December 31, 2005 |
 STRONG CAPITAL STRUCTURE
No TARP Funding
15
Source: Company Documents as of 12/31/2010 |
 16
1
st
Quarter 2011 Highlights |
 THANK YOU! |
 APPENDIX |
 19
REGIONAL PEER GROUP COMPANIES
First Financial Bancorp
First Commonwealth Financial Corporation
NBT Bancorp Inc.
Community Bank System, Inc.
S&T Bancorp, Inc.
Sandy Spring Bancorp, Inc.
TowneBank
Sun Bancorp, Inc.
Carter Bank & Trust
Tompkins Financial Corporation
StellarOne Corporation
Hampton Roads Bankshares, Inc.
Virginia Commerce Bancorp, Inc.
Lakeland Bancorp, Inc.
Hudson Valley Holding Corp.
Union First Market Bankshares Corporation
First Community Bancshares, Inc.
Sterling Bancorp
Metro Bancorp, Inc.
Univest Corporation of Pennsylvania
Financial Institutions, Inc. |
 20
NON-GAAP FINANCIAL RECONCILIATION
Tower believes the presentation of these non-GAAP financial measures provide
useful supplemental information that is essential to an investor’s
proper understanding of the operating results of Tower’s core businesses. Our management
uses these non-GAAP financial measures in their analysis of our
performance. These non-GAAP disclosures should not be viewed as a
substitute for financial measures determined in accordance with GAAP, nor are they necessarily
comparable to non-GAAP performance measures that may be presented by other
companies. Reconciliations of GAAP to non-GAAP measures are included in
the table below. Source: Company Documents as of 12/31/2010
Tower Bancorp, Inc. and Subsidiary
Reconciliation of GAAP to Non-GAAP Measures
(Dollars in thousands, except share data and ratios)
December 31,
2010
Reconciliation of Non-GAAP Balance Sheet Data:
Total assets - GAAP
2,747,289
$
Less: Goodwill and other intangible assets
24,243
Total tangible assets - Non-GAAP
2,723,046
$
Total Stockholders' equity - GAAP
256,640
$
Less: Goodwill and other intangible assets
24,243
Tangible equity - Non-GAAP
232,397
$
December 31,
2010
Capital Ratios:
Total equity to total assets - GAAP
9.34%
Effect of intangible assets
-0.81%
Tangible common equity to tangible assets -Non-GAAP
8.53% |