Attached files
Table of Contents
UNITED STATES
SECURITIES AND EXCHANGE COMMISSION
WASHINGTON, DC 20549
FORM 10-K
| x | ANNUAL REPORT PURSUANT TO SECTION 13 OR 15(d) OF THE SECURITIES EXCHANGE ACT OF 1934 |
For the fiscal year ended December 31, 2010,
or
| ¨ | TRANSITION REPORT PURSUANT TO SECTION 13 OR 15(d) OF THE SECURITIES EXCHANGE ACT OF 1934 |
Commission File Number: 001-34277

(Exact name of registrant as specified in its charter)
| Pennsylvania | 25-1445946 | |
| (State or other jurisdiction of incorporation) |
(IRS Employer Identification Number) | |
| 112 Market Street, Harrisburg, Pennsylvania | 17101 | |
| (Address of principal executive office) | (Zip Code) |
(717) 231-2700
(Registrant’s telephone number, including area code)
Securities registered pursuant to Section 12(b) of the Act:
| Title of each class |
Name of exchange on which registered | |
| Common Stock, No Par Value | The NASDAQ Stock Market, LLC |
Securities registered pursuant to Section 12(g) of the Act: None
Indicate by check mark whether the registrant is a well-known seasoned issuer, as defined in Rule 405 of the Securities Act. Yes ¨ No x
Indicate by check mark whether the registrant is not required to file reports pursuant to Section 13 or Section 15(d) of the Act. Yes ¨ No x
Indicate by check mark whether the registrant (1) has filed all reports required to be filed by Section 13 or 15(d) of the Securities Exchange Act of 1934 during the preceding 12 months (or for such shorter period that the registrant was required to file such reports), and (2) has been subject to such filing requirements for the past 90 days. Yes x No ¨
Indicate by check mark whether the registrant has submitted electronically and posted on its corporate Web site, if any, every Interactive Data File required to be submitted and posted pursuant to Rule 405 of Regulation S-T (§232.405 of this chapter) during the preceding 12 months (or for such shorter period that the registrant was required to submit and post such files). Yes ¨ No ¨
Indicate by check mark if disclosure of delinquent filers pursuant to Item 405 of Regulation S-K is not contained herein, and will not be contained, to the best of registrant’s knowledge, in definitive proxy or information statements incorporated by reference in Part III of this Form 10-K or any amendment to this Form 10-K. ¨
Indicate by check mark whether the registrant is a large accelerated filer, an accelerated filer, a non-accelerated filer, or a smaller reporting company. See the definitions of “large accelerated filer,” and “smaller reporting company” in Rule 12b-2 of the Exchange Act. (Check One):
| Large accelerated filed | ¨ | Accelerated filer | x | |||
| Non-accelerated filer | ¨ | Smaller reporting company | ¨ |
Indicate by check mark whether the registrant is a shell company (as defined in Rule 12b-2 of the Act). Yes ¨ No x
Aggregate market value of the Common Stock held by non-affiliates computed by reference to the price at which the common equity was last sold on June 30, 2010, determined using a per share closing price on that date of $21.89, as quoted on the NASDAQ Stock Market, was $156,299,569.
Number of shares outstanding of the registrant’s common stock as of February 28, 2011: 11,983,576.
DOCUMENTS INCORPORATED BY REFERENCE
Portions of the registrant’s Definitive Proxy Statement for the 2011 Annual Meeting of Shareholders are incorporated by reference in Part III of this Report.
Table of Contents
| Description |
Page | |||||
| PART I | ||||||
| Item 1. | 1 | |||||
| Item 1A. | 11 | |||||
| Item 1B. | 23 | |||||
| Item 2. | 23 | |||||
| Item 3. | 23 | |||||
| Item 4. | 23 | |||||
| PART II | ||||||
| Item 5. | 24 | |||||
| Item 6. | 27 | |||||
| Item 7. | Management’s Discussion and Analysis of Financial Condition and Results of Operations |
29 | ||||
| 53 | ||||||
| Item 7A. | 58 | |||||
| Item 8. | ||||||
| 65 | ||||||
| 67 | ||||||
| 68 | ||||||
| Consolidated Statements of Shareholders’ Equity and Comprehensive Income (Loss) |
69 | |||||
| 70 | ||||||
| 72 | ||||||
| Management Report On Internal Control Over Financial Reporting |
118 | |||||
| Item 9. | Changes in and Disagreements with Accountants on Accounting and Financial Disclosure |
120 | ||||
| Item 9A. | 120 | |||||
| Item 9B. | 120 | |||||
| PART III | ||||||
| Item 10. | 121 | |||||
| Item 11. | 121 | |||||
| Item 12. | Security Ownership of Certain Beneficial Owners and Management and Related Stockholder Matters |
121 | ||||
| Item 13. | Certain Relationships and Related Transactions, and Director Independence |
121 | ||||
| Item 14. | 121 | |||||
| PART IV | ||||||
| Item 15. | 122 | |||||
| 126 | ||||||
| 128 | ||||||
Table of Contents
PART I
The information in this Form 10-K includes certain forward-looking statements, including statements relating to Tower’s financial condition, results of operations, asset quality and trends in its business that involve risks and uncertainties. Tower’s actual results may differ materially from the results discussed in these forward looking statements. Factors that might cause such a difference include those discussed in Item 1. “Business,” Item 1A. “Risk Factors,” Item 7. “Management’s Discussion and Analysis of Financial Condition and Results of Operations,” as well as those discussed elsewhere in this Form 10-K. Unless the context otherwise requires, the terms “we”, “us” and “our” refer to Tower Bancorp, Inc. and its subsidiaries on a consolidated basis.
| ITEM 1. | BUSINESS |
History and Business
Tower Bancorp, Inc. (the “Company” or “Tower”) is a Pennsylvania business corporation with principal executive offices at 112 Market Street, Harrisburg, Pennsylvania. The Company was incorporated in 1983 and is registered as a financial holding company under the Bank Holding Company Act of 1956, as amended. As a financial holding company, the Company is subject to regulation and supervision by the Board of Governors of the Federal Reserve System.
On March 31, 2009, the Company merged with Graystone Financial Corp. (“Graystone”), a privately held, non-reporting corporation and a registered bank holding company under the Bank Holding Company Act of 1956, as amended. Pursuant to a merger agreement between the Company and Graystone (“Graystone Merger Agreement”), the Company remained the surviving holding company and the First National Bank of Greencastle, the wholly-owned bank subsidiary of the Company, merged with and into Graystone Bank, the wholly-owned subsidiary of Graystone, with Graystone Bank as the surviving institution under the name “Graystone Tower Bank” (the “Bank”)
On December 10, 2010, the Company acquired First Chester County Corporation (“First Chester”), a publicly held corporation and a registered financial holding company under the Bank Holding Company Act of 1956, as amended (the “FCEC Merger”). Pursuant to the merger agreement between the Company and First Chester (the “FCEC Merger Agreement”), the Company remains the surviving holding company and the First National Bank of Chester County (“FNB”), the wholly-owned subsidiary of First Chester, merged with and into the Bank, with the Bank as the surviving institution.
On December 30, 2010, the Board of Directors of the Bank authorized its management to implement a plan to discontinue the mortgage banking activities associated with its American Home Bank division (the “AHB Division”). The AHB Division was acquired by the Company as a result of the FCEC Merger, and its multi-state residential mortgage banking business operation was determined to be incompatible with the Company’s relationship-based community banking business model. Management’s current plan is to have the majority of all operations cease at the AHB division by the end of the first quarter of 2011 with the completion of wind down occurring by the end of the second quarter of 2011.
The Bank was originally incorporated on September 2, 2005, as a Pennsylvania-chartered bank and commenced operations on November 10, 2005. As a state chartered bank, the Bank is subject to regulation by the Federal Deposit Insurance Corporation (“FDIC”) and the Pennsylvania Department of Banking and undergoes periodic examinations by these regulatory authorities.
The Bank is a full-service community bank operating forty-nine branches throughout southeastern and central Pennsylvania and Washington County, Maryland. The Bank operates under a single charter through three division brands – “Graystone Bank”, “Tower Bank,” and “1N Bank”.
1
Table of Contents
The principal component of earnings for the Bank is net interest income, which is the difference between the yield on interest-earning assets and the cost of interest-bearing liabilities. The net interest margin, which is the ratio of net interest income to average earning assets, is affected by several factors including market interest rates, economic conditions, loan and lease demand, deposit activity and funding mix. The Bank seeks to maintain a steady net interest margin and consistent growth of net interest income.
The Bank offers residential mortgage services through its mortgage banking subsidiary, Graystone Mortgage, LLC, in which the Bank holds a 90% membership interest as well as American Home Bank (“AHB Division”), a division of the Bank, acquired through the FCEC Merger.
The Bank also provides a broad range of trust and investment management services and provides services for estates, trust, agency accounts and individual and employer sponsored retirement plans through the Bank’s Wealth Management Division, which is comprised primarily of the former FNB Wealth Management Division. Revenue from the Wealth Management Division consists primarily of annually recurring asset based fee as well as commissions for brokerage services. As of December 31, 2010, the Bank’s Wealth Management division administered or provided investment management services to accounts that held assets with an aggregate market value of approximately $539.7 million.
In addition to retail and commercial banking and wealth management services, the Bank offers an array of investment opportunities, including mutual funds, annuities, retirement planning and insurance through Graystone Insurances Services, LLC, a wholly-owned subsidiary of the Bank. . Through these banking divisions and subsidiaries, the Bank offers a complete range of financial products to consumers, businesses and not-for-profit customers.
In addition to acquisition growth, the Bank’s growth strategy focuses on organic loan and deposit growth through branch office expansion and investment in technology and teams of experienced community bankers. The Bank has opened fourteen de-novo branch offices since the Bank was incorporated in September 2005. During 2010, the Bank opened three branch offices in Centre and York Counties, Pennsylvania. During 2011, the Bank anticipates opening new branch offices in Cumberland County and Lebanon County, Pennsylvania. The Bank is committed to investing in the latest technology to support continued growth and attracting and retaining experienced commercial and retail bankers that are passionate about the Bank’s community banking relationship model.
Employees
As of December 31, 2010, we had 846 full-time and 66 part-time employees.
Competition
The Bank’s principal market area consists of Centre, Chester, Cumberland, Dauphin, Delaware, Fulton, Franklin, Lancaster, Lebanon and York Counties of Pennsylvania and Washington County of Maryland. It services a substantial number of depositors in this market area, with the greatest concentration within a radius of Greencastle, Harrisburg, Lancaster, and West Chester, Pennsylvania.
The Bank, like other depository institutions, is subject to competition from less intensively regulated entities such as credit unions, brokerage firms, money market funds, consumer finance and credit card companies, and other commercial banks, many of which are larger than the Bank. The principal methods of competing effectively in the financial services industry include improving customer service through the quality and range of services provided, improving efficiencies and pricing services competitively. The Bank is competitive with the financial institutions in its service areas with respect to interest rates paid on time and savings deposits, service charges on deposit accounts and interest rates charges and fees on loans.
2
Table of Contents
The Bank continues to implement strategic initiatives focused on expanding the core businesses and to explore, on an ongoing basis, acquisition, divestiture, and joint venture opportunities. The Bank analyzes each of its products and businesses in the context of customer demands, competitive advantages, industry dynamics, and growth potential.
Supervision and Regulation
We are subject to extensive regulation under federal and Pennsylvania banking laws, regulations and policies, including prescribed standards relating to capital, earnings, dividends, the repurchase or redemption of shares, loans or extensions of credit to affiliates and insiders, internal controls, information systems, internal audit systems, loan documentation, credit underwriting, asset growth, impaired assets and loan-to-value ratios. The bank regulatory framework is intended primarily for the protection of depositors, federal deposit insurance funds and the banking systems as a whole, and not for the protection of security holders.
The following summary sets forth certain material elements of the regulatory framework applicable to bank holding companies and their subsidiaries. It also provides specific information about our company and our subsidiaries. It does not describe all of the provisions of the statutes, regulations and policies that are identified. To the extent that the following information describes statutory and regulatory provisions, it is qualified in its entirety by express reference to each of the particular statutory and regulatory provisions. A change in applicable statutes, regulations or regulatory policy may have a material effect on our business.
Dodd-Frank Wall Street Reform and Consumer Protection Act
On July 21, 2010, the Dodd-Frank Wall Street Reform and Consumer Protection Act, or the Dodd-Frank Act, was signed into law. Over time, the Dodd-Frank Act will implement significant changes to the U.S. financial system, including among others, (i) the creation of a new Bureau of Consumer Financial Protection with supervisory authority, including the power to conduct examinations and take enforcement actions with respect to financial institutions with assets of $10.0 billion or more, (ii) the creation of a Financial Stability Oversight Council with authority to identify institutions and practices that might pose a systemic risk, (iii) provisions affecting corporate governance and executive compensation of all companies subject to the reporting requirements of the Securities and Exchange Act of 1934, as amended, (iv) a provision that would broaden the base for FDIC insurance assessments, and (v) a provision that would require bank regulators to set minimum capital levels for bank holding companies that are as strong as those required for their insured depository subsidiaries, subject to a grandfather clause for holding companies with less than $15.0 billion in assets as of December 31, 2009.
The Dodd-Frank Act contains numerous other provisions affecting financial institutions of all types, many of which may have an impact on our operating environment in substantial and unpredictable ways. While some of the Dodd-Frank Act’s provisions will be effective immediately, many are to be implemented by rules promulgated within six to eighteen months of signing.
The Dodd-Frank Act and the regulations to be adopted are expected to subject financial institutions to additional restrictions, oversight and costs that may have an adverse impact on their business, financial condition, results of operations or the price of the common stock. The Dodd-Frank Act substantially increases regulation of the financial services industry and imposes restrictions on the operations and general ability of firms within the industry to conduct business consistent with historical practices. However, the ultimate effect of the Dodd-Frank Act on the financial services industry in general, and us in particular, is uncertain at this time.
Holding Company Regulation
As a bank holding company and financial holding company, we are subject to regulation and examination by the Pennsylvania Department of Banking and the Federal Reserve Board. We are required to file with the Federal
3
Table of Contents
Reserve Board an annual report and such additional information as the Federal Reserve Board may require pursuant to the Bank Holding Company Act of 1956, as amended (the “BHC Act”). The BHC Act requires each bank holding company to obtain the approval of the Federal Reserve Board before it may acquire substantially all the assets of any bank, or before it may acquire ownership or control of any voting shares of any bank if, after such acquisition, it would own or control, directly or indirectly, more than five percent of the voting shares of such bank. This transaction may also require approval of the Pennsylvania Department of Banking. Pennsylvania law permits Pennsylvania bank holding companies to control an unlimited number of banks.
As a financial holding company, we may engage in, and acquire companies engaged in, activities that are considered “financial in nature”, as defined by the Gramm-Leach-Bliley Act and Federal Reserve Board interpretations. These activities include, among other things, securities underwriting, dealing and market-making, sponsoring mutual funds and investment companies, insurance underwriting and agency activities, and merchant banking. If any banking subsidiary ceases to be “well capitalized” or “well managed” under applicable regulatory standards, the Federal Reserve Board may, among other things, place limitations on our ability to conduct the broader financial activities permissible for financial holding companies or, if the deficiencies persist, require us to divest the banking subsidiary. In addition, if any banking subsidiary receives a Community Reinvestment Act rating of less than satisfactory, we would be prohibited from engaging in any additional activities other than those permissible for bank holding companies that are not financial holding companies. We may engage directly or indirectly in activities considered financial in nature, either de novo or by acquisition, as long as it gives the Federal Reserve Board after-the-fact notice of the new activities.
A bank holding company and its subsidiaries are subject to certain restrictions imposed by the BHC Act on any extensions of credit to any of its subsidiaries, investments in the stock or securities thereof, and on the taking of stock or securities as collateral for loans to any borrower. A bank holding company and its subsidiaries are also prevented from engaging in certain tie-in arrangements in connection with any extension of credit, lease or sale of property or furnishing of services.
Under the Dodd-Frank Act and Federal Reserve Board regulations, a bank holding company is required to serve as a source of financial and managerial strength to its subsidiary banks and may not conduct its operations in an unsafe or unsound manner. In addition, in serving as a source of strength to its subsidiary banks, a bank holding company should stand ready to use available resources to provide adequate capital funds to its subsidiary banks during periods of financial stress or adversity and should maintain the financial flexibility and capital-raising capacity to obtain additional resources for assisting its subsidiary banks. A bank holding company’s failure to meet its obligations to serve as a source of strength to its subsidiary banks will generally be considered by the Federal Reserve Board to be an unsafe and unsound banking practice or a violation of the Federal Reserve Board regulations or both. This doctrine is commonly known as the “source of strength” doctrine.
The Federal banking regulators have adopted risk-based capital guidelines for bank holding companies. Currently, the required minimum ratio of total capital to risk-weighted assets (including off-balance sheet activities, such as standby letters of credit) is 8%. At least half of the total capital is required to be Tier 1 capital, consisting principally of common shareholders’ equity, non-cumulative perpetual preferred stock, a limited amount of cumulative perpetual preferred stock and minority interests in the equity accounts of consolidated subsidiaries, less goodwill. The remainder (Tier 2 capital) may consist of a limited amount of subordinated debt and intermediate-term preferred stock, certain hybrid capital instruments and other debt securities, perpetual preferred stock and a limited amount of the general loan loss allowance.
In addition to the risk-based capital guidelines, the federal banking regulators established minimum leverage ratio (Tier 1 capital to total assets) guidelines for bank holding companies. These guidelines provide for a minimum leverage ratio of 3% for those bank holding companies which have the highest regulatory examination ratings and are not contemplating or experiencing significant growth or expansion. All other bank holding companies are required to maintain a leverage ratio of at least 4%.
4
Table of Contents
Regulation of Graystone Tower Bank
The Bank is a Pennsylvania-chartered banking institution and is subject to regulation, supervision and regular examination by the Pennsylvania Department of Banking and the Federal Deposit Insurance Corporation (“FDIC”). Federal and state banking laws and regulations govern, among other things, the scope of a bank’s business, the investments a bank may make, the reserves against deposits a bank must maintain, the loans a bank makes and collateral it takes, the maximum interest rates a bank may pay on deposits, the activities of a bank with respect to mergers and consolidations, and the establishment of branches, and management practices and other aspects of banking operations.
Dividend Restrictions
We are a legal entity separate and distinct from the Bank. Declaration and payment of cash dividends by us depends upon cash dividend payments to us by the Bank and our cash reserves. Dividend payments by the Bank and cash balances are our primary source of revenue and cash flow. Accordingly, our right, and consequently the right of our creditors and shareholders, to participate in any distribution of the assets or earnings from the Bank is necessarily subject to the prior claims of creditors of the Bank, except to the extent that our claims in the capacity of a creditor may be recognized. Additionally, under guidance issued by the Federal Reserve Board, as a bank holding company, we are required to consult with the Federal Reserve Board before declaring dividends and are to strongly consider eliminating, deferring, or reducing dividends we pay to our shareholders if (1) our net income available to shareholders for the past four quarters net of dividends previously paid during that period, is not sufficient to fully fund the dividends, (2) our prospective rate of earnings retention is not consistent with our capital needs and overall current and prospective financial condition, or (3) we will not meet, or are in danger of not meeting, our minimum regulatory capital adequacy ratios.
As a state chartered bank, the Bank is subject to regulatory restrictions on the payment and amounts of dividends under the Pennsylvania Banking Code. Further, the ability of banking subsidiaries to pay dividends is also subject to their profitability, financial condition, capital expenditures and other cash flow requirements. See Note 20 of the Notes to Consolidated Financial Statements included at Item 8 of this Report.
The payment of dividends by us or the Bank may also be affected by other factors, such as the requirement to maintain adequate capital above regulatory guidelines. The federal banking agencies have indicated that paying dividends that deplete a depository institution’s capital base to an inadequate level would be an unsafe and unsound banking practice. Under the Federal Deposit Insurance Corporation Improvement Act of 1991, a depository institution may not pay any dividend if payment would cause it to become undercapitalized or if it already is undercapitalized. Moreover, the federal agencies have issued policy statements that provide that bank holding companies and insured banks should generally only pay dividends out of current operating earnings. Federal banking regulators have the authority to prohibit banks and bank holding companies from paying a dividend if the regulators deem such payment to be an unsafe or unsound practice.
Capital Adequacy and Operations
In December 1991, the Federal Deposit Insurance Corporation Improvement Act of 1991 (“FDICIA”) was enacted. FDICIA contains provisions limiting activities and business methods of depository institutions. FDICIA requires the primary federal banking regulators to promulgate regulations setting forth standards relating to, among other things, internal controls and audit systems; credit underwriting and loan documentation; interest rate exposure and other off-balance sheet assets and liabilities; and compensation of directors and officers. FDICIA also provides for expanded regulation of depository institutions and their affiliates, including parent holding companies, by such institutions’ primary federal banking regulator. Each primary federal banking regulator is required to specify, by regulation, capital standards for measuring the capital adequacy of the depository institutions it supervises and, depending upon the extent to which a depository institution does not meet such capital adequacy measures, the primary federal banking regulator may prohibit such institution from paying dividends or may require such institution to take other steps to become adequately capitalized.
5
Table of Contents
FDICIA establishes five capital tiers, ranging from “well capitalized” to “critically undercapitalized”. A depository institution is well capitalized if it significantly exceeds the minimum level required by regulation for each relevant capital measure. Under FDICIA, an institution that is not well capitalized is generally prohibited from accepting brokered deposits and offering interest rates on deposits higher than the prevailing rate in its market; in addition, “pass through” insurance coverage may not be available for certain employee benefit accounts. FDICIA also requires an undercapitalized depository institution to submit an acceptable capital restoration plan to the appropriate federal bank regulatory agency. One requisite element of such a plan is that the institution’s parent holding company must guarantee compliance by the institution with the plan, subject to certain limitations. In the event of the parent holding company’s bankruptcy, the guarantee, and any other commitments that the parent holding company has made to federal bank regulators to maintain the capital of its depository institution subsidiaries, would be assumed by the bankruptcy trustee and entitled to priority in payment.
At December 31, 2010, the Bank qualified as “well capitalized” under these regulatory capital standards. See Note 20 of the Notes to Consolidated Financial Statements included at Item 8 of this Report.
Deposit Insurance and Premiums
The deposits of the Bank are insured up to applicable limits per insured depositor by the FDIC. In October 2008, the FDIC increased FDIC deposit insurance coverage per separately insured depositor for all account types to $250,000. While initially stipulated to be in effect through December 31, 2009, this increase has been subsequently extended permanently through the Dodd-Frank Act.
In November 2010, as required by the Dodd-Frank Act, the FDIC issued a Final Rule that provides for unlimited insurance coverage of noninterest-bearing demand transaction accounts, regardless of the balance of the account, until January 1, 2013. On January 18, 2011, the FDIC issued a Final Rule to include Interest on Lawyer Trust Accounts (“IOLTAs”) in the temporary unlimited insurance coverage for non-interest bearing demand transaction accounts. This temporary unlimited insurance coverage replaces the Transaction Account Guarantee Program, which expired on December 31, 2010. Unlike the TAGP, there is no special assessment associated with the temporary unlimited insurance coverage, nor may institutions opt-out of the unlimited coverage.
As an FDIC-insured bank, the Bank is also subject to FDIC insurance assessments, which are imposed based upon the risk the institution poses to the Deposit Insurance Fund (“DIF”). Under this assessment system, risk is defined and measured using an institution’s supervisory ratings with certain other risk measures, including certain financial ratios. The annual rates for institutions in 2010 ranged from 12 basis points for “well managed,” “well capitalized” banks with the highest ratings, to 45 basis points for institutions posing the most risk to the DIF. The FDIC may raise or lower these assessment rates on a quarterly basis based on various factors to achieve a reserve ratio, which the FDIC currently has set at 1.35 percent of insured deposits. Due to recent bank failures and contingent loss reserves established by the FDIC against potential future bank failures, the reserve ratio is currently significantly below its target balance. In February 2009, the FDIC adopted a Final Rule on Assessments under which the quarterly initial base assessment rates increased substantially beginning in the second quarter of 2009. The FDIC then adopted a Final Rule on Special Assessment in May 2009, which imposed a 5 basis point special assessment on each institution’s assets minus Tier 1 capital as reported on the report of condition as of June 30, 2009, but capped the special assessment at 10 basis points times the institution’s assessment base for the second quarter 2009 risk-based assessment. On November 12, 2009, the FDIC adopted a final rule that required insured depository institutions to prepay their estimated quarterly risk-based assessments for the fourth quarter of 2009 and for all of 2010, 2011, and 2012. The continued decline in the DIF balance may convince the FDIC to impose additional special emergency assessments in the future that could have a significant impact on the Bank’s capital levels and earnings. During 2009, the increase in FDIC annual rates, insured deposit growth and the special assessment, at 10 basis points, impacted the pretax earnings. The special assessment totaled $580 thousand. No special assessment was issued during 2010. In 2009, the estimated prepayment for the Bank’s quarterly assessments amounted to $6.3 million. In 2010, the Bank adjusted its estimated quarterly assessment to include the FCEC Merger in December 2010. The estimated prepayment was $8.2 million as of December 31, 2010.
6
Table of Contents
In February 2011, as required by the Dodd-Frank Act, the FDIC issued a Final Rule that revised the assessment base to consist of average consolidated total assets during the assessment period minus the average tangible equity during the assessment period. In addition, the final revisions eliminate the adjustment for secured borrowings, including Federal Home Loan Bank advances, and make certain other changes to the impact of unsecured borrowings and brokered deposits on an institution’s deposit insurance assessment. The rule also revises the assessment rate schedule to provide assessments ranging from 2.5 to 45 basis points. The changes will go into effect beginning April 1, 2011 and the first new assessment will be payable as a reduction to our prepaid FDIC assessment fees in the third quarter of 2011. We are currently evaluating the final rule’s impact on the level of the Bank’s FDIC assessment fees and can provide no assurance that such fees will not materially increase in the future.
In addition to DIF assessments, the FDIC assesses all insured deposits a special assessment to fund the repayment of debt obligations of the Financing Corporation (“FICO”). FICO is a government-sponsored entity that was formed to borrow the money necessary to carry out the closing and ultimate disposition of failed thrift institutions by the Resolution Trust Corporation in the 1990s. As of January 1, 2011, the annualized rate established by the FDIC for the FICO assessment was 1.02 basis points per $100 of insured deposits.
Community Reinvestment Act
Under the Community Reinvestment Act of 1977 (“CRA”), the FDIC is required to assess the record of all financial institutions regulated by it to determine if these institutions are meeting the credit needs of the community (including low and moderate income neighborhoods) which they serve. CRA performance evaluations are based on a four-tiered rating system: Outstanding, Satisfactory, Needs to Improve and Substantial Noncompliance. CRA performance evaluations are considered in evaluating applications for such things as mergers, acquisitions and applications to open branches. The Bank has a CRA rating of “Satisfactory.”
Restrictions on Transactions with Affiliates and Insiders
The Bank is subject to the restrictions of Sections 23A, 23B, 22(g) and 22(h) of the Federal Reserve Act and Regulation O adopted by the Federal Reserve Board. Section 23A requires that loans or extensions of credit to an affiliate, purchases of securities issued by an affiliate, purchases of assets from an affiliate (except as may be exempted by order or regulation), the acceptance of securities issued by an affiliate as collateral and the issuance of a guarantee, acceptance of letters of credit on behalf of an affiliate (collectively, “Covered Transactions”) be on terms and conditions consistent with safe and sound banking practices. Section 23A also imposes quantitative restrictions on the amount of and collateralization requirements on such transactions. Section 23B requires that all Covered Transactions and certain other transactions, including the sale of securities or other assets to an affiliate and the payment of money or the furnishing of services to an affiliate, be on terms comparable to those prevailing for similar transactions with non-affiliates.
Section 22(g) and 22(h) of the Federal Reserve Act impose similar limitations on loans and extensions of credit from the bank to its executive officers, directors and principal shareholders and any of their related interests. The limitations restrict the terms and aggregate amount of such transactions. Regulation O implements the provisions of Sections 22(g) and 22(h) and requires maintenance of records of such transactions by the bank and regular reporting of such transactions by insiders. The FDIC also requires the bank, upon request, to disclose publicly loans and extensions of credit to insiders in excess of certain amounts.
Emergency Economic Stabilization Act of 2008
In response to the financial crises affecting the banking system and financial markets and going concern threats to investment banks and other financial institutions, on October 3, 2008, the Emergency Economic Stabilization Act of 2008 (the “EESA”) was signed into law. Pursuant to the EESA, the U.S. Treasury announced a program, known as the Troubled Asset Relief (“TARP”) Capital Purchase Program, pursuant to which it would purchase equity stakes in a wide variety of financial institutions. We decided not to participate in the TARP Capital Purchase Program.
7
Table of Contents
Consumer Financial Services
There are numerous developments in federal and state laws regarding consumer financial products and services that impact the Bank’s business. Importantly, the current structure of federal consumer protection regulation applicable to all providers of consumer financial products and services will change on July 21, 2011. In this regard, the Dodd-Frank Act creates a new Consumer Financial Protection Bureau (the “Bureau”) with extensive powers to supervise and enforce consumer protection laws. The Bureau has broad rule-making authority for a wide range of consumer protection laws that apply to all providers of consumer products and services, including the Bank, as well as the authority to prohibit “unfair, deceptive or abusive” acts and practices. The Bureau has examination and enforcement authority over providers with more than $10.0 billion in assets. Banks and savings institutions with $10.0 billion or less in assets, like the Bank, will continue to be examined by their applicable bank regulators. The Dodd-Frank Act also generally weakens the federal preemption available for national banks and federal savings associations, and gives state attorneys general the ability to enforce applicable federal consumer protection laws. It is unclear what changes will be promulgated by the Bureau and what effect, if any, such changes would have on the Bank.
The Dodd-Frank Act contains additional provisions that affect consumer mortgage lending. First, the new law significantly expands underwriting requirements applicable to loans secured by 1-4 residential real property and augments federal law combating predatory lending practices. Furthermore, in addition to numerous new disclosure requirements, the Dodd-Frank Act imposes new standards for mortgage loan originations on all lenders, including banks and thrifts, in an effort to strongly encourage lenders to verify a borrower’s ability to repay. Also, the Dodd-Frank Act, in conjunction with the Federal Reserve’s final rule on loan originator compensation effective April 1, 2011, prohibits certain compensation payments to loan originators and prohibits steering consumers to loans not in their interest because it will result in greater compensation for a loan originator. These standards may result in a myriad of new system; pricing and compensation controls in order to ensure compliance and to decrease repurchase requests and foreclosure defenses.
Other Federal Laws and Regulations
State usury and credit laws limit the amount of interest and various other charges collected or contracted by a bank on loans. The Bank’s loans are also subject to federal laws applicable to credit transactions, such as the following:
| • | Federal Truth-In-Lending Act, which governs disclosures of credit terms to consumer borrowers; |
| • | Home Mortgage Disclosure Act, requiring financial institutions to provide information to enable public officials to determine whether a financial institution is fulfilling its obligations to meet the housing needs of the community it serves; |
| • | Equal Credit Opportunity Act prohibiting discrimination on the basis of race, creed or other prohibitive factors in extending credit; |
| • | Real Estate Settlement Procedures Act, which requires lenders to disclose certain information regarding the nature and cost of real estate settlements, and prohibits certain lending practices, as well as limits escrow account amounts in real estate transactions; |
| • | Fair Credit Reporting Act governing the manner in which consumer debts may be collected by collection agencies; and |
| • | Various rules and regulations of various federal agencies charged with the implementation of such federal laws. |
Additionally, the Bank’s operations are subject to additional federal laws and regulations applicable to financial institutions, including, without limitation:
| • | Privacy provisions of the Gramm-Leach-Bliley Act and related regulations, which require the Bank to maintain privacy policies intended to safeguard customer financial information, to disclose the policies |
8
Table of Contents
| to customers and to allow customers to “opt out” of having their financial service providers disclose their confidential financial information to non-affiliated third parties, subject to certain exceptions; |
| • | Right to Financial Privacy Act, which imposes a duty to maintain confidentiality of consumer financial records and prescribes procedures for complying with administrative subpoenas of financial records; |
| • | Consumer protection rules for the sale of insurance products by depository institutions, adopted pursuant to the requirements of the Gramm-Leach-Bliley Act; and |
| • | USA Patriot Act, which requires financial institutions to take certain actions to help prevent, detect and prosecute international money laundering and the financing of terrorism. |
Beginning on July 1, 2010, a new federal banking rule under the Electronic Fund Transfer Act prohibits financial institutions from charging consumers fees for paying overdrafts on automated teller machines (“ATM”) and one-time debit card transactions, unless a consumer consents, or opts in, to the overdraft service for those type of transactions. If a consumer does not opt in, any ATM transaction or debit that overdraws the consumer’s account will be denied. Overdrafts on the payment of checks and regular electronic bill payments are not covered by this new rule. Before opting in, the consumer must be provided a notice that explains the financial institution’s overdraft services, including the fees associated with the service, and the consumer’s choices. Financial institutions must provide consumers who do not opt in with the same account terms, conditions and features (including pricing) that they provide to consumers who do opt in.
Sarbanes-Oxley Act of 2002
Enacted in 2002, the Sarbanes-Oxley Act represented a comprehensive revision of laws affecting corporate governance, accounting obligations and corporate reporting. The Sarbanes-Oxley Act is applicable to all companies with equity securities registered or that file reports under the Securities Exchange Act of 1934, including publicly held bank holding companies. In particular, the Sarbanes-Oxley Act establishes: (i) requirements for audit committees, including independence, expertise, and responsibilities; (ii) additional responsibilities regarding financial statements for the Chief Executive Officer and Chief Financial Officer of the reporting company; (iii) standards for auditors and regulation of audits; (iv) increased disclosure and reporting obligations for the reporting company and its directors and executive officers; and (v) new and increased civil and criminal penalties for violations of the securities laws. Many of the provisions were effective immediately while other provisions become effective over a period of time and are subject to rulemaking by the SEC.
Governmental Policies
Our earnings are significantly affected by the monetary and fiscal policies of governmental authorities, including the Federal Reserve Board. Among the instruments of monetary policy used by the Federal Reserve Board to implement these objectives are open-market operations in U.S. Government securities and federal funds, changes in the discount rate on member bank borrowings and changes in reserve requirements against member bank deposits. These instruments of monetary policy are used in varying combinations to influence the overall level of bank loans, investments and deposits, and the interest rates charged on loans and paid for deposits. The Federal Reserve Board frequently uses these instruments of monetary policy, especially its open-market operations and the discount rate, to influence the level of interest rates and to affect the strength of the economy, the level of inflation or the price of the dollar in foreign exchange markets. The monetary policies of the Federal Reserve Board have had a significant effect on the operating results of banking institutions in the past and are expected to continue to do so in the future. It is not possible to predict the nature of future changes in monetary and fiscal policies, or the effect which they may have on our business and earnings.
Basel III
In December 2010, the Basel Committee released its final framework for strengthening international capital and liquidity regulation, now officially identified by the Basel Committee as “Basel III”. Basel III, when
9
Table of Contents
implemented by the U.S. banking agencies and fully phased-in, will require bank holding companies and their bank subsidiaries to maintain substantially more capital, with a greater emphasis on common equity. Basel III increases the minimum Tier 1 common equity ratio to 4.5%, net of regulatory deductions, and introduces a capital conservation buffer of an additional 2.5% of common equity to risk-weighted assets, raising the target minimum common equity ratio to 7%. This capital conservation buffer also increases the minimum Tier 1 capital ratio from 6% to 8.5% and the minimum total capital ratio from 8% to 10.5%. In addition, Basel III introduces a countercyclical capital buffer of up to 2.5% of common equity or other fully loss absorbing capital for periods of excess credit growth. Basel III also introduces a non-risk adjusted Tier 1 leverage ratio of 3%, based on a measure of total exposure rather than total assets, and new liquidity standards.
U.S. banking agencies have informally indicated that they expect to propose regulations implementing Basel III in mid-2011 with final adoption of implementing regulations in mid-2012. The Basel Committee is considering further amendments to Basel III, including the imposition of additional capital surcharges on globally systemically important financial institutions. Additionally, the Dodd-Frank Act requires or permits the Federal banking agencies to adopt regulations affecting banking institutions’ capital requirements in a number of respects, including potentially more stringent capital requirements for systemically important financial institutions. Accordingly, the regulations ultimately applicable to us and our subsidiary may be substantially different from the Basel III final framework as published in December 2010. The requirements to maintain higher levels of capital or to maintain higher levels of liquid assets could adversely impact our financial results.
Other Legislative Initiatives
Proposals may be introduced in the United States Congress and in the Pennsylvania Legislature and before various bank regulatory authorities which would alter the powers of, and restrictions on, different types of banking organizations and which would restructure part or all of the existing regulatory framework for banks, bank holding companies and other providers of financial services. Moreover, other bills may be introduced in Congress which would further regulate, deregulate or restructure the financial services industry, including proposals to substantially reform the regulatory framework. It is not possible to predict whether these or any other proposals will be enacted into law or, even if enacted, the effect which they may have on the our business and earnings.
Additional Information
Our common stock is listed for quotation on the Global Select Market of The NASDAQ Stock Market under the symbol “TOBC.” Additional information can be found through our website at www.towerbancorp.com. Electronic copies of our 2010 Annual Report on Form 10-K are available free of charge by visiting the “SEC Filings” section of www.towerbancorp.com. Electronic copies of quarterly reports on Form 10-Q and current reports on Form 8-K are also available. These reports are posted as soon as reasonably practicable after they are electronically filed with the Securities and Exchange Commission (SEC).
Where we have included web addresses in this Report, such as our web address, we have included those web addresses as inactive textual references only. Except as specifically incorporated by reference into this Report, information on those websites is not part hereof.
Forward-Looking Statements
We have made, and may continue to make, certain forward-looking statements in this Report, including information incorporated by reference in this Report. These forward-looking statements are intended to be covered by the safe harbor for forward-looking statements provided by the Private Securities Litigation Reform Act of 1995. Forward-looking statements are not statements of historical fact, and can be identified by the use of forward-looking terminology such as “believe,” “expect,” “may,” “will,” “should,” “project,” “plan,” “seek,” “target,” “intend” or “anticipate” or the negative thereof or comparable terminology. Forward-looking statements
10
Table of Contents
include discussions of our strategy, financial projections and estimates and the underlying assumptions, statements regarding plans, objectives, expectations or consequences of various transactions, and statements about the future performance, operations, products and services. These forward-looking statements are subject to various assumptions, risks, uncertainties and other factors discussed in this Report under Item 1A. “Risk Factors,” Item 7. “Management’s Discussion and Analysis of Financial Condition and Results of Operations”, as well as those discussed elsewhere in this Form 10-K. These factors include, but are not limited to the following: market risk; changes or adverse developments in economic, political, or regulatory conditions; a continuation or worsening of the current disruption in credit and other markets; the effect of competition and interest rates on net interest margin and net interest income; investment strategy and income growth; investment securities gains; declines in the value of securities which may result in charges to earnings; changes in rates of deposit and loan growth; asset quality and the impact on assets from adverse changes in the economy and in credit or other markets and resulting effects on credit risk and asset values; balances of risk-sensitive assets to risk-sensitive liabilities; salaries and employee benefits and other expenses; amortization of intangible assets; capital and liquidity strategies and other financial and business matters for future periods.
Because of the possibility of changes in these assumptions, actual results could differ materially from those contained in any forward-looking statements. We encourage readers of this Report to understand forward-looking statements to be strategic objectives rather than absolute targets of future performance. Forward-looking statements are qualified in their entirety by the risk factors and cautionary statements contained in this Report and speak only as of the date they are made. We do not undertake any obligation to update publicly any forward-looking statements to reflect circumstances or events that occur after the date the forward-looking statements are made or to reflect the occurrence of unanticipated events except as required by law.
| Item 1A. | Risk Factors |
An investment in our common stock is subject to risks inherent to our business. The material risks and uncertainties that we believe affects our business and earnings are described below. Before making an investment decision, you should carefully consider the risks and uncertainties described below together with all of the other information included or incorporated by reference in this report. The risks and uncertainties described below are not the only ones facing our business. Additional risks and uncertainties that we are not aware of or focused on, or that we currently deem immaterial may also impair our business operations. This report is qualified in its entirety by these risk factors.
If any of the following risks actually occur, our financial condition and results of operations could be materially and adversely affected. If this were to happen, the value of our common stock could decline significantly, and you could lose all or part of your investment.
Risks Related to the Company’s Business
Growing By Acquisition Entails Certain Risks.
On March 31, 2009, we completed a merger with Graystone Financial Corp. and on December 10, 2010, we completed the acquisition of First Chester County Corporation (“First Chester”). We regularly evaluate opportunities to grow through acquisition.
Growth by acquisition involves risks. The success of the acquisitions may depend on, among other things, the ability to realize anticipated cost savings and to combine the businesses of the acquired company with businesses in a manner that does not result in decreased revenues resulting from disruption of existing customer relationships of the acquired company. If we are not able to achieve these objectives, the anticipated benefits of an acquisition may not be realized fully or at all or may take longer to realize than planned.
Further, the asset quality or other financial characteristics of a company we plan to acquire may deteriorate between the dates a merger or other acquisition agreement is entered into and when the transaction is completed.
11
Table of Contents
Depending upon the terms we negotiate in the related merger or acquisition agreement, the deterioration may not allow us to terminate the proposed transaction, such that we may be required to close the proposed transaction with such a company to the detriment of our future financial condition.
Additionally, if a pending acquisition is not completed due to the failure to satisfy certain conditions or otherwise, expenses incurred in connection therewith could have a material adverse impact on our financial condition because we would not have realized the expected benefits.
A continuation of recent turmoil in the financial markets, particularly if economic conditions worsen more than expected, could have an adverse effect on our financial position or results of operations.
In recent periods, United States and global markets, as well as general economic conditions, have been disrupted and are volatile. This situation is continuing. The impact of this situation, together with concerns regarding the financial strength of financial institutions, has led to distress in credit markets and liquidity issues for financial institutions. Some financial institutions around the world have failed; others have been forced to seek acquisition partners. The United States and other governments have taken unprecedented steps to try to stabilize the financial system, including investing in financial institutions. Our business and our financial condition and results of operations could be adversely affected by (1) continued or accelerated disruption and volatility in financial markets, (2) continued capital and liquidity concerns regarding financial institutions generally and our counterparties specifically, (3) limitations resulting from further governmental action in an effort to stabilize or provide additional regulation of the financial system, or (4) recessionary conditions that are deeper or last longer than currently anticipated.
Economic conditions and the composition of our loan portfolio could impact the level of loan charge-offs and the provision for loan losses and may affect our results of operations.
National and regional economic conditions could impact the loan portfolio of the Bank. For example, an increase in unemployment, a decrease in real estate values or increases in interest rates, as well as other factors, could further weaken the economies of the communities we serve. Weakness in the market areas we serve could depress our earnings and, consequently, our financial condition because:
| • | borrowers may not be able to repay their loans; |
| • | the value of the collateral securing our loans to borrowers may decline; and |
| • | the overall quality of our loan portfolio may decline. |
Any of these scenarios could require that we charge-off a higher percentage of our loans and/or increase our provision for loan losses, which would negatively impact our results of operations.
In this regard, in establishing the size of our allowance for loan losses, we make various general assumptions and judgments about the quality and collectability of our loan portfolio, including the creditworthiness of borrowers and the value of the real estate and other assets serving as collateral for the repayment of loans. The amount of our provision for loan losses and the percentage of loans we are required to charge-off may be impacted by adverse developments in and the overall risk composition of the loan portfolio. While we believe that our allowance for loan losses as of December 31, 2010 is sufficient to cover losses inherent in the loan portfolio on that date, we may be required to increase our loan loss provision or charge-off a higher percentage of loans due to adverse developments in or changes in the risk characteristics of the loan portfolio, thereby negatively impacting our results of operations. For example, a decrease in real estate values could cause higher loan losses and require higher loan loss provisions for loans that are secured by real estate.
We have recorded all loans acquired in the FCEC Merger at their fair market value as of the acquisition date in accordance with applicable accounting guidance. The fair market value assigned to the acquired loans is based on
12
Table of Contents
management’s review and assessment of the portfolio as of the acquisition date and we may be required to increase our loan loss provision for or charge-off a higher percentage of the acquired loans due to adverse developments in or changes in the risk characteristics of the portfolio, which would have a negative impact on our earnings.
We operate in a highly regulated environment and may be adversely affected by changes in laws and regulations.
We are subject to extensive regulation, supervision and examination by certain state and federal agencies including the Federal Deposit Insurance Corporation, or FDIC, as insurer of the Bank’s deposits, the Board of Governors of the Federal Reserve System, as regulator of the holding company, and the Pennsylvania Department of Banking, as regulator of Pennsylvania chartered banks. Such regulation and supervision govern the activities in which an institution and its holding company may engage and are intended primarily to ensure the safety and soundness of financial institutions. Regulatory authorities have extensive discretion in their supervisory and enforcement activities, including the imposition of restrictions on operations, the classification of assets and determination of the level of the allowance for loan losses. Decisions of regulatory authorities could adversely impact us.
As an employer, our business is subject to federal and state employment laws, the failure to comply with which could adversely affect our financial condition and results of operations.
The Fair Labor Standards Act and wage and hour laws of the various states in which we conduct business govern the treatment of our employees with respect to various employment related issues, including the payment of overtime wages to non-exempt employees, which may include certain mortgage loan originators. The failure to comply with such laws could subject us to, among other things, administrative fines, class action lawsuits, damages awards and injunctions, any of which could adversely affect our financial condition and results of operations.
Significant legal actions could subject us to substantial liabilities or litigation costs, which could adversely affect our financial condition and results of operations.
We are currently involved in various claims and legal actions relating to the prior operations of the American Home Bank division (the “AHB Division”), acquired in the FCEC Merger. In general, such matters are believed to be ordinary routine litigation incidental to the conduct of business. Nonetheless, the costs to pursue and defend these legal matters may be significant, and if the claims are determined against us, could adversely affect our financial condition, results of operations, reputation and prospects. Additional matters may arise in connection with the winding down of operations of the AHB Division.
Legislative and regulatory actions taken now or in the future to address the current liquidity and credit crisis in the financial industry may significantly affect our financial condition, results of operations, liquidity or stock price.
Current economic conditions, particularly in the financial markets, have resulted in government regulatory agencies and political bodies placing increased focus and scrutiny on the financial services industry. The U.S. Government has intervened on an unprecedented scale, enacting and implementing numerous programs and actions targeted at the financial markets generally and the financial services industry in particular.
On July 21, 2010, the Dodd-Frank Wall Street Reform and Consumer Protection Act, or the Dodd-Frank Act, was signed into law. The Dodd-Frank Act will implement significant changes to the U.S. financial system, including among others, (i) the creation of a new Bureau of Consumer Financial Protection with supervisory authority, including the power to conduct bank examinations and take enforcement actions with respect to financial institutions with assets of $10.0 billion or more, (ii) the creation of a Financial Stability Oversight
13
Table of Contents
Council with authority to identify institutions and practices that might pose a systemic risk, (iii) provisions affecting corporate governance and executive compensation of all companies subject to the reporting requirements of the Exchange Act, (iv) a provision that would broaden the base for FDIC insurance assessments, and (v) a provision that would require bank regulators to set minimum capital levels for bank holding companies that are as strong as those required for their insured depository subsidiaries, subject to a grandfather clause for holding companies with less than $15.0 billion in assets as of December 31, 2009.
The Dodd-Frank Act contains numerous other provisions affecting financial institutions of all types, many of which may have an impact on our operating environment in substantial and unpredictable ways. While some of the Dodd-Frank Act’s provisions will be effective immediately, many are to be implemented by rules promulgated within six to eighteen months of signing.
The Dodd-Frank Act and the regulations to be adopted are expected to subject us and other financial institutions to additional restrictions, oversight and costs that may have an adverse impact on its business, financial condition, results of operations or the price of our common stock. The Dodd-Frank Act substantially increases regulation of the financial services industry and imposes restrictions on the operations and general ability of firms within the industry to conduct business consistent with historical practices. However, the ultimate effect of the Dodd-Frank Act on the financial services industry in general, and our organization in particular, is uncertain at this time.
Federal and state regulatory agencies also frequently adopt changes to their regulations or change the manner in which existing regulations are applied or enforced. We cannot predict the substance or impact of the Dodd-Frank Act or other pending or future legislation, regulation or the application thereof. Compliance with such current and potential regulation and scrutiny may significantly increase our costs, impede the efficiency of our internal business processes, require us to increase our regulatory capital and limit our ability to pursue business opportunities in an efficient manner.
A substantial decline in the value of our Federal Home Loan Bank of Pittsburgh common stock may adversely affect our financial condition.
We own common stock of the Federal Home Loan Bank of Pittsburgh, or the FHLB, in order to qualify for membership in the Federal Home Loan Bank system, which enables us to borrow funds under the Federal Home Loan Bank advance program. The carrying value and fair market value of our FHLB common stock, including stock acquired in the FCEC Merger, was approximately $14.5 million as of December 31, 2010.
Published reports indicate that certain member banks of the Federal Home Loan Bank system may be subject to asset quality risks that could result in materially lower regulatory capital levels. In December 2008, the FHLB had notified its member banks that it had suspended dividend payments and the repurchase of capital stock until further notice is provided. In an extreme situation, it is possible that the capitalization of a Federal Home Loan Bank, including the FHLB, could be substantially diminished or reduced to zero. Consequently, given that there is no market for our FHLB common stock, we believe that there is a risk that our investment could be deemed other than temporarily impaired at some time in the future. If this occurs, it may adversely affect our results of operations and financial condition.
Increases in FDIC insurance premiums may have a material adverse effect on our results of operations.
During 2008 through 2010, higher levels of bank failures have dramatically increased resolution costs of the FDIC and depleted the deposit insurance fund. In addition, the FDIC and the U.S. Congress have taken action to increase federal deposit insurance coverage, placing additional stress on the deposit insurance fund. In order to maintain a strong funding position and restore reserve ratios of the deposit insurance fund, the FDIC increased assessment rates of insured institutions uniformly by seven cents for every $100 of deposits beginning with the first quarter of 2009, with additional changes beginning April 1, 2009, which require riskier institutions to pay a larger share of premiums by factoring in rate adjustments based on secured liabilities and unsecured debt levels.
14
Table of Contents
To further support the rebuilding of the deposit insurance fund, the FDIC imposed a special assessment on each insured institution, equal to five basis points of the institution’s total assets minus Tier 1 capital as of June 30, 2009. For the Bank, this represented a charge of approximately $580 thousand, which was recorded as a pre-tax charge during the second quarter of 2009. The FDIC has indicated that future special assessments are possible, although it has not determined the magnitude or timing of any future assessments.
Additionally, on November 12, 2009, the FDIC adopted a final rule that required insured depository institutions to prepay, on December 30, 2009, their estimated quarterly risk-based assessments for the fourth quarter of 2009 and for all of 2010, 2011, and 2012, along with their quarterly risk-based assessment for the third quarter of 2009. The amount of the prepayment attributable to the fourth quarter of 2009 and all of 2010 is based upon a bank’s total base assessment rate in effect on September 30, 2009, which would be increased by 3 basis points for 2011 and 2012. In order to determine the amount of the prepayment, the assessment rate (as adjusted) is applied to the assessment base for the third quarter of 2009, increased quarterly to reflect an estimated 5 percent annual growth rate through 2012. Upon the closing of the FCEC Merger, the Bank increased its prepaid assessment by $3.8 million.
Under GAAP accounting rules, prepaid assessments, unlike special assessments, do not immediately affect bank earnings, although the prepayment reduced the Bank’s liquid assets by approximately $6.3 million. Banks record the entire amount of its prepaid assessment as a prepaid expense (asset) as of December 30, 2009 (the date of payment), and will record an expense (charge to earnings) for its regular quarterly assessment and an offsetting credit to the prepaid assessment until the asset is exhausted.
We are generally unable to control the amount of premiums that we are required to pay for FDIC insurance. If there is additional bank or financial institution failures, we may be required to pay even higher FDIC premiums. Our expenses for the year ended December 31, 2009 were significantly and adversely affected by these increased and prepaid premiums and the special assessment. These increases and assessment and any future increases in insurance premiums or additional special assessments may materially adversely affect our results of operations.
The soundness of other financial services institutions may adversely affect our credit risk.
We rely on other financial services institutions through trading, clearing, counterparty, and other relationships. We maintain limits and monitor concentration levels of our counterparties as specified in our internal policies. Our reliance on other financial services institutions exposes us to credit risk in the event of default by these institutions or counterparties. These losses could adversely affect our results of operations and financial condition.
Changes in interest rates could adversely impact our financial condition and results of operations.
Our ability to make a profit, like that of most financial institutions, substantially depends upon our net interest income, which is the difference between the interest income earned on interest earning assets, such as loans and investment securities, and the interest expense paid on interest-bearing liabilities, such as deposits and borrowings. Changes in interest rates can increase or reduce net interest income and net income.
Different types of assets and liabilities may react differently, and at different times, to changes in market interest rates. When interest-bearing liabilities mature or reprice more quickly than interest-earning assets in a period, an increase in market rates of interest could reduce net interest income. When interest-earning assets mature or reprice more quickly than interest-bearing liabilities, falling interest rates could reduce net interest income. Changes in market interest rates are affected by many factors beyond our control, including inflation, unemployment, money supply, international events, and events in the United States and other financial markets.
We attempt to manage risk from changes in market interest rates, in part, by controlling the mix of interest rate sensitive assets and interest rate sensitive liabilities. However, interest rate risk management techniques are not exact and a rapid increase or decrease in interest rates could adversely affect our financial performance.
15
Table of Contents
Our loan portfolio includes a large number and amount of commercial and industrial loans, and commercial real estate related loans, which have a higher degree of risk than other types of loans.
We provide lending services to various types of small businesses, their owners, professionals and other individuals. Commercial loans are generally considered to have a higher degree of risk of default or loss than other types of loans, such as residential real estate loans, because repayment may be affected by general economic conditions, interest rates, the quality of management of the business, and other factors that may cause a borrower to be unable to repay its obligations. The current economic downturn may increase this risk of default or loss, which may adversely impact our results of operations and financial condition.
We are required to make a number of judgments in applying accounting policies and different estimates and assumptions in the application of these policies could result in a decrease in capital and/or other material changes to our reports of financial condition and results of operations.
Material estimates that are particularly susceptible to significant change relate to the determination of the allowance for loan losses and reserve for unfunded lending commitments, the effectiveness of derivatives and other hedging activities, the fair value of certain financial instruments (securities, derivatives, and privately held investments), income tax assets or liabilities (including deferred tax assets and any related valuation allowance), share-based compensation, and accounting for acquisitions, including the fair value determinations and the analysis of goodwill impairment. While we have identified those accounting policies that are considered critical and have procedures in place to facilitate the associated judgments, different assumptions in the application of these policies could result in a decrease to net income and, possibly, capital and may have a material adverse effect on our financial condition and results of operations.
Difficulties in integrating past or future acquisitions could adversely affect our business.
We have spent and may continue to spend significant resources identifying businesses to acquire. The efficient and effective integration of any businesses we acquires into our organization is critical to our growth. The Graystone Merger, the FCEC Merger, and any future mergers or acquisitions, involve numerous risks including difficulties in integrating the culture, operations, technologies and personnel of the acquired companies, the diversion of management’s attention from other business concerns and the potential loss of customers. Failure to successfully integrate the operations of Graystone and First Chester could also harm our business, results of operations and cash flows.
We plan to pursue a growth strategy and there are risks associated with rapid growth.
Prior to the merger of the Company and Graystone, Graystone had experienced rapid growth since opening in November 2005. We intend to pursue a growth plan consistent with Graystone’s prior business strategy, including growth by acquisition, as well as leveraging our existing branch network and adding new branch locations in current and adjacent markets we choose to serve. The FCEC Merger was part of our growth strategy.
Our ability to manage growth successfully will depend on our ability to attract qualified personnel and maintain cost controls and asset quality while attracting additional loans and deposits on favorable terms, as well as on factors beyond our control, such as economic conditions and competition. If we grow too quickly and are not able to attract qualified personnel, control costs and maintain asset quality, this continued rapid growth could materially adversely affect our financial performance.
We may elect or need to seek additional capital in the future, but that capital may not be available when needed.
We are required by federal and state regulatory authorities to maintain adequate levels of capital to support our operations. In the future, we may elect or need to raise additional capital. Our ability to raise additional capital, if
16
Table of Contents
needed, will depend on conditions in the capital markets at that time, which are outside our control, and on our financial performance. Accordingly, we cannot assure you of our ability to raise additional capital if needed on acceptable terms. If we cannot raise additional capital when needed, our ability to expand our operations through internal growth or acquisitions could be materially impaired.
Future acquisitions could dilute your ownership of our common stock and may cause us to become more susceptible to adverse economic events.
We may issue shares of our common stock in connection with future acquisitions and other investments, which would dilute your ownership interest in us. While there is no assurance that these transactions will occur, or that they will occur on terms favorable to us, future business acquisitions could be material to us, and the degree of success achieved in acquiring and integrating these businesses into us could have a material effect on the value of our common stock. In addition, these acquisitions could require us to expend substantial cash or other liquid assets or to incur debt, which could cause us to become more susceptible to economic downturns and competitive pressures.
Our controls and procedures may fail or could be circumvented.
We have implemented a series of internal controls, disclosure controls and procedures, and corporate governance policies and procedures in order to ensure accurate financial control and reporting. However, any system of controls, no matter how well designed and operated, can only provide reasonable, not absolute assurance that the objectives of the system are met. Any failure or circumvention of our controls and/or procedures could have a material adverse effect on our business and results of operation and financial condition. The weaknesses in First Chester’s internal control and disclosure controls and procedures prior to the FCEC Merger, as described in First Chester’s filings with the SEC, may pose additional risks to us should we be unable to adequately integrate First Chester.
Loss of our senior executive officers or other key employees could impair our relationship with our customers and adversely affect our business.
We have assembled a senior management team which has substantial background and experience in banking and financial services in the markets we serve. Loss of these key personnel could negatively impact our earnings because of their skills, customer relationships and/or the potential difficulty of promptly replacing them.
An interruption or breach in security with respect to our information systems, as well as information systems of our outsourced service providers, could damage our reputation, result in a loss of customer business, subject us to additional regulatory scrutiny, or expose us to civil litigation, any of which could have a material adverse effect on our financial condition and results of operations.
We rely heavily on communications and information systems to conduct our business. Any failure, interruption or breach in security of these systems could result in failures or disruptions in our customer relationship management, general ledger, deposit, loan and other systems.
Strong competition within our market area may limit our growth and profitability.
Competition in the banking and financial services industry is intense. We compete actively with other Pennsylvania and Maryland financial institutions, many larger than us, as well as with financial and non-financial institutions headquartered elsewhere. Commercial banks, savings banks, savings and loan associations, credit unions, and money market funds actively compete for deposits and loans. Such institutions, as well as consumer finance, insurance companies and brokerage firms, may be considered competitors with respect to one or more services they render. We will likely be generally competitive with all institutions in our service areas with respect to interest rates paid on time and savings deposits, service charges on deposit accounts, interest rates charged on
17
Table of Contents
loans and fees for trust and investment advisory services. Many of the institutions with which we compete have substantially greater resources and lending limits and may offer certain services that we do not or cannot provide. Our profitability depends upon our ability to successfully compete in our market area.
We continually encounter technological change.
Our future success depends, in part, on our ability to effectively embrace technology efficiencies to better serve customers and reduce costs. Failure to keep pace with technological change could potentially have an adverse effect on our business operations and financial condition.
Risks Related to the FCEC Merger
We may fail to realize the anticipated benefits of the FCEC Merger.
The success of the FCEC Merger will depend on, among other things, our ability to realize anticipated cost savings and to combine the businesses of the Bank and the First National Bank of Chester County (“FNB”) in a manner that permits growth opportunities and does not materially disrupt the existing customer relationships of FNB nor result in decreased revenues resulting from any loss of customers. If we are not able to successfully achieve these objectives, the anticipated benefits of the merger may not be realized fully or at all, or may take longer to realize than expected.
At the time the FCEC Merger was announced, we estimated upon the completion of the merger of the companies’ bank subsidiaries that we would expect to achieve annual total cost savings of approximately $12 million, pre-tax, through the reduction of administrative and operational redundancies. While we believe these cost savings estimates are achievable as of the date of this report, it is possible that the potential cost savings could turn out to be more difficult to achieve than originally anticipated. The cost savings estimates depend on the ability to combine the businesses in a manner that permits those cost savings to be realized.
Certain employees of First Chester have not been or will not be employed by us. Further, employees of First Chester that we wish to retain may elect to terminate their employment as a result of the FCEC Merger, which could delay or disrupt the integration process. It is possible that the integration process could result in the disruption of First Chester’s ongoing business or inconsistencies in standards, controls, procedures and policies that adversely affect our ability to maintain relationships with customers and employees or to achieve the anticipated benefits of the merger.
The First Chester loan portfolio could adversely affect our earnings.
We have recorded all loans acquired in the FCEC Merger at their fair market value as of the closing date of the FCEC Merger in accordance with applicable accounting guidance. The fair market value assigned to the acquired loans is based on our review and assessment of the portfolio as of the acquisition date and we may be required to increase our loan loss provision for or charge-off a higher percentage of the acquired loans due to adverse developments in or changes in the risk characteristics of the portfolio, which would have a negative impact on our earnings.
We could record future impairment losses on First Chester’s holdings of investment securities available for sale.
First Chester’s investment portfolio of securities available for sale included corporate bonds securities, collateralized mortgage obligations and collateralized debt obligations. First Chester recognized an other than temporary impairment charge totaling approximately $1.6 million during the quarter ended September 30, 2009 as a result of impairment charges related to four bank equity securities, which were subsequently sold during the fourth quarter of 2009. As a result of the FCEC Merger, we assumed ownership of remaining investment portfolio securities and recorded them at their fair value as of the closing date of the FCEC Merger. A number of factors or combinations of factors could cause us to conclude in one or more future reporting periods that an
18
Table of Contents
unrealized loss that exists with respect to these securities constitutes an additional impairment that is other than temporary, which could result in material losses to us. These factors include, but are not limited to, failure to make scheduled principal and interest payments, an increase in the severity of the unrealized loss on a particular security, an increase in the continuous duration of the unrealized loss without an improvement in value or changes in market conditions and/or industry or issuer specific factors that would render us unable to forecast a full recovery in value. In addition, the fair values of these investment securities could decline if the overall economy and the financial condition of some of the issuers continue to deteriorate and there remains limited liquidity for these securities.
After the FCEC Merger and prior to December 31, 2010, we sold a significant portion of the First Chester investment portfolio. We believe the maximum potential loss on the remaining securities from the First Chester investment portfolio will not exceed $169 thousand.
Costs associated with discontinuing the AHB Division’s mortgage-banking activities and contingent liabilities relating to this business may adversely affect our financial condition and results of operations.
Prior to the FCEC Merger, our management and board of directors concluded that the multi-state residential mortgage banking business of First Chester’s AHB Division was incompatible with our relationship-based community banking business model. Accordingly, the FCEC Merger Agreement required First Chester to use its best efforts to sell the AHB Division at or prior to the effective date of the FCEC Merger, which efforts were ultimately unsuccessful.
Thereafter, during the fourth quarter of 2010, we initiated a plan to wind down the operations of the AHB Division. Our current plan is to have the majority of all operations cease at the AHB Division by the end of the first quarter of 2011, with the completion of the wind down occurring by the end of the second quarter of 2011.
We recognized $1.4 million of restructuring charges relating to the AHB Division through restructuring expense during the fourth quarter of 2010 and anticipate recognizing up to an additional $2.6 million of restructuring costs related to the AHB Division in the first quarter of 2011. Moreover, the AHB Division incurred a pre-tax operating loss of approximately $2.1 million from the merger date of December 10, 2010 to December 31, 2010. We expect operating losses will continue during the first and second quarter of 2011, which may be significant.
Actual restructuring expenses and operating losses associated with winding down the operations of the AHB Division may exceed our estimates. Additionally, we continue to retain contingent liabilities relating to the prior operations of the AHB Division as well as actions undertaken in connection with the wind down. These matters could adversely affect our financial condition, results of operations, reputation and prospects.
The Bank, as successor to FNB, could be required to repurchase mortgage loans or indemnify mortgage loan purchasers as a result of breaches of representations and warranties, borrower fraud, or certain borrower defaults, which could have a material adverse impact on liquidity, results of operations and financial condition.
When FNB prior to the FCEC Merger sold, or the Bank after the FCEC Merger sells, mortgage loans, whether as whole loans or pursuant to a securitization, it is required to make customary representations and warranties to the purchasers about the mortgage loans and the manner in which they were originated. FNB’s whole loan sale agreements assumed by the Bank require Graystone Tower Bank to repurchase or substitute mortgage loans in the event FNB or the Bank breaches any of these representations or warranties. In addition, the Bank may be required to repurchase mortgage loans as a result of borrower fraud or in the event of early payment default of the borrower on a mortgage loan. Likewise, the Bank is required to repurchase or substitute mortgage loans if it breaches a representation or warranty in connection with a securitization. The remedies available to the Bank against the originating broker or correspondent may not be as broad as the remedies available to a purchaser of mortgage loans against the Bank, and the Bank faces the further risk that the originating broker or correspondent may not have the financial capacity to perform remedies that otherwise may be available to it. Therefore, if a
19
Table of Contents
purchaser enforces its remedies, the Bank may not be able to recover its losses from the originating broker or correspondent. If repurchase and indemnity demands increase, the Bank’s liquidity, results of operations and financial condition will be adversely affected.
Due to the complexity of acquisition accounting, certain amounts included in our consolidated balance sheets and consolidated statements of operations are based on preliminary estimates of value and our actual financial position and results of operations after the FCEC Merger may differ materially from the estimates included in our financial statements.
Under the acquisition method of accounting required by U.S. Generally Accepted Accounting Principles (GAAP), we are required to record First Chester’s identifiable assets acquired and liabilities at their fair value as of the acquisition date of December 10, 2010. Fair values are subject to refinement for up to one year after the closing date of an acquisition as information relative to closing date fair values becomes available.
In preparing the acquisition accounting adjustments for our financial statements, we have engaged independent third-party valuation experts to assist in valuing certain assets, particularly intangibles. Other assets and liabilities are generally valued using our internal asset/liability modeling system.
If additional information becomes available prior to December 10, 2011 regarding the fair value of First Chester’s assets and liabilities as of the acquisition date, we may be required to modify the acquisition accounting adjustments relating to the acquisition, which could materially affect the amount of goodwill recorded in connection with the FCEC Merger.
The integration of First Chester into the Company may distract our management from their other responsibilities.
The FCEC Merger could cause our management to focus their time and energies on matters related to the FCEC Merger that otherwise would be directed to our business and operations. Any such distraction on the part of management, if significant, could affect management’s ability to service existing business and develop new business and otherwise adversely affect us following the FCEC Merger.
Our lack of extensive experience in the Chester and Delaware Counties, Pennsylvania market area may adversely impact our ability to successfully compete.
The FCEC Merger expands our market area into Chester County and Delaware County, Pennsylvania. While this new market area is contiguous to our existing market area, it is outside of the markets in which our senior management has more extensive knowledge and experience. Accordingly, there is a risk that we will lose customers in this new market area, may not adequately address this new market in terms of the products and services we propose to offer, or may be unable to successfully compete with institutions already established within this market area.
Risks Related to Our Common Stock
The price of our common stock may fluctuate significantly, and this may make it difficult for you to resell shares of common stock owned by you at times or at prices you find attractive.
The price of our common stock on the NASDAQ Global Select Market constantly changes. We expect that the market price of our common stock will continue to fluctuate and there can be no assurance about the market prices for our common stock.
Our stock price may fluctuate as a result of a variety of factors, many of which are beyond our control. These factors include:
| • | our financial condition, performance, creditworthiness and prospects; |
20
Table of Contents
| • | quarterly variations in our operating results or the quality of our assets; |
| • | operating results that vary from the expectations of management, securities analysts and investors; |
| • | changes in expectations as to our future financial performance; |
| • | announcements of innovations, new products, strategic developments, significant contracts, acquisitions and other material events by us or our competitors; |
| • | the operating and securities price performance of other companies that investors believe are comparable to us; |
| • | future sales of our equity or equity-related securities; |
| • | the credit, mortgage and housing markets, the markets for securities relating to mortgages or housing, and developments with respect to financial institutions generally; |
| • | changes in global financial markets and global economies and general market conditions, such as interest or foreign exchange rates, stock, commodity or real estate valuations or volatility and other geopolitical, regulatory or judicial events; |
| • | our ability to integrate successfully First Chester’s assets, liabilities, customers, systems and management personnel into our operations, and to realize expected cost savings and revenue enhancements within expected timeframes or at all; |
| • | the possibility that expected First Chester merger-related charges will be materially greater than forecasted or that final purchase price allocations based on fair value of the acquired assets and liabilities as of the closing date of the FCEC Merger and related adjustments to yield and/or amortization of the acquired assets and liabilities will be materially different from those forecasted; and |
| • | the relatively low trading volume of our common stock. |
The trading volume in our common stock is less than that of larger financial services companies.
Our common stock has been listed under the symbol “TOBC” on the NASDAQ Global Select Market since January 2011 and on the NASDAQ Global Market since April 2009. The average daily trading volume for shares of our common stock is less than larger financial services companies. Given the lower trading volume of our common stock, the sale of a significant number of these shares, or the expectation of such sales, could adversely affect the market price of our stock.
We may issue additional common stock or other equity securities in the future which could dilute the ownership interest of existing shareholders.
In order to maintain our capital at desired or regulatory-required levels or to replace existing capital, we may be required to issue additional shares of common stock, or securities convertible into, exchangeable for or representing rights to acquire shares of common stock. We are generally not restricted from issuing such additional shares. We may sell any shares that we issue at prices below the current market price of our common stock, and the sale of these shares may significantly dilute shareholder ownership. We could also issue additional shares in connection with acquisitions of other financial institutions or in connection with our equity compensation plans.
Offerings of debt, which would be senior to our common stock upon liquidation, and/or preferred equity securities which may be senior to our common stock for purposes of dividend distributions or upon liquidation, may adversely affect the market price of our common stock.
We may attempt to increase our capital resources or, if our or the Bank’s capital ratios fall below the required minimums, we or the bank could be forced to raise additional capital by making additional offerings of debt or
21
Table of Contents
preferred equity securities, including medium-term notes, trust preferred securities, senior or subordinated notes and preferred stock. Upon liquidation, holders of our debt securities and shares of preferred stock and lenders with respect to other borrowings are likely to receive distributions of our available assets prior to the holders of our common stock. Additional equity offerings may dilute the holdings of our existing shareholders or reduce the market price of our common stock, or both. Holders of our common stock are not entitled to preemptive rights or other protections against dilution.
Our board of directors is authorized to issue one or more classes or series of preferred stock from time to time without any action on the part of the shareholders. Our board of directors also has the power, without shareholder approval, to set the terms of any such classes or series of preferred stock that may be issued, including voting rights, dividend rights, and preferences over our common stock with respect to dividends or upon our dissolution, winding up and liquidation and other terms. If we issue preferred stock in the future that has a preference over our common stock with respect to the payment of dividends or upon our liquidation, dissolution or winding up, or if we issue preferred stock with voting rights that dilute the voting power of our common stock, the rights of holders of our common stock or the market price of our common stock could be adversely affected.
Our ability to pay dividends is subject to limitations.
Declaration of future dividends by our board of directors will depend on a number of factors, including capital requirements, regulatory limitations, our operating results and financial condition and general economic conditions. Future dividends may be subject to prior regulatory review and approval by the Federal Reserve. There can be no assurance that our Board of Directors will seek approval, or that the Federal Reserve will grant approval, of any specific level of dividends. Under guidance issued by the Federal Reserve, as a bank holding company, we are to consult the Federal Reserve before declaring dividends and are to strongly consider eliminating, deferring, or reducing dividends we pay to our shareholders if, among other things, our net income available to shareholders for the past four quarters, net of dividends previously paid during that period, is not sufficient to fully fund the dividends. In addition, the Company is a bank holding company and its operations are principally conducted by its bank subsidiary, the Bank. Accordingly, our ability to pay dividends depends on the receipt of dividends from the Bank. As a state chartered bank, the Bank is subject to regulatory restrictions on the payment and amounts of dividends under the Pennsylvania Banking Code. Further, the ability of banking subsidiaries to pay dividends is also subject to their profitability, financial condition, capital expenditures and other cash flow requirements. There is no assurance that our subsidiaries will be able to pay dividends in the future or that we will generate adequate cash flow to pay dividends in the future. The failure to pay dividends on our common stock could have a material adverse effect on the market price of our common stock.
Our management controls a substantial percentage of our stock and therefore has the ability to exercise significant control over our affairs.
Our directors and executive officers beneficially own in excess of 10% of our issued and outstanding common stock on a fully diluted basis. Such persons, as a group, will have sufficient votes to strongly influence the outcome of matters submitted to our shareholders, including the election of directors. This concentration of ownership might also have the effect of delaying or preventing a change in control of the Company.
Anti-takeover provisions and restrictions on ownership could negatively impact our shareholders.
Provisions of Pennsylvania law and our amended and restated articles of incorporation and bylaws could make it more difficult for a third party to acquire control of us or have the effect of discouraging a third party from attempting to acquire control of us. These provisions could make it more difficult for a third party to acquire us even if an acquisition might be in the best interest of our shareholders. In addition, the Bank Holding Company Act of 1956, as amended, or the BHCA, requires any bank holding company to obtain the approval of the Federal Reserve Board prior to acquiring more than 5% of our outstanding common stock. Any person other than a bank holding company is required to obtain prior approval of the Federal Reserve Board to acquire 10% or more of our
22
Table of Contents
outstanding common stock under the Change in Bank Control Act. Any holder of 25% or more of our outstanding common stock, other than an individual, is subject to regulation as a bank holding company under the BHCA.
| Item 1B. | Unresolved Staff Comments |
None.
| Item 2. | Properties |
The following table summarizes our branch and office properties, by county, as of December 31, 2010.
| County |
State | Owned | Leased | Total | ||||||||||||
| Bank Branches |
||||||||||||||||
| Centre |
PA | — | 2 | 2 | ||||||||||||
| Chester |
PA | 9 | 10 | 19 | ||||||||||||
| Cumberland |
PA | — | 3 | 3 | ||||||||||||
| Dauphin |
PA | — | 2 | 2 | ||||||||||||
| Delaware |
PA | — | 2 | 2 | ||||||||||||
| Franklin |
PA | 6 | — | 6 | ||||||||||||
| Fulton |
PA | 2 | 1 | 3 | ||||||||||||
| Lancaster |
PA | — | 5 | 5 | ||||||||||||
| Lebanon |
PA | — | 1 | 1 | ||||||||||||
| York |
PA | — | 3 | 3 | ||||||||||||
| Washington |
MD | 2 | 1 | 3 | ||||||||||||
| Total |
19 | 30 | 49 | |||||||||||||
| Administrative Office Locations |
||||||||||||||||
| Berks |
PA | — | 1 | 1 | ||||||||||||
| Cumberland |
PA | — | 3 | 3 | ||||||||||||
| Chester |
PA | — | 1 | 1 | ||||||||||||
| Dauphin |
PA | — | 2 | 2 | ||||||||||||
| Lebanon |
PA | — | 1 | 1 | ||||||||||||
| Lancaster |
PA | — | 1 | 1 | ||||||||||||
| Total |
— | 9 | 9 | |||||||||||||
Included in the Administrative Office Locations section of the above table, are the corporate operations centers for the Company and the Bank, located at 1826 and 1828 Good Hope Road, Enola, Cumberland County, Pennsylvania and our principal executive office located at 112 Market Street, Harrisburg, Dauphin County, Pennsylvania.
| Item 3. | Legal Proceedings |
The nature of our business generates a certain amount of legal proceedings involving matters arising in the ordinary course of business. Based on current knowledge, advice of counsel, available insurance coverage and established reserves, management does not anticipate, at the present time, that the aggregate liability, if any, arising out of such legal proceedings will have a material adverse effect on our consolidated financial position or liquidity. However, given the inherent uncertainties involved in these matters, some of which are beyond our control, and the amount or indeterminate damages sought in some of these matters, there can be no assurance that an adverse outcome in one or more of these matters would not be material to our results of operations or cash flows for any particular future reporting period.
| Item 4. | Removed and Reserved |
23
Table of Contents
PART II
| Item 5. | Market for Registrant’s Common Equity, Related Stockholder Matters and Issuer Purchases of Equity Securities |
Common Stock
As of December 31, 2010, we had 11,971,399 shares of no-par value common stock outstanding held by approximately 2,368 holders of record. Since April 2009, our common stock has been traded on the Global Market and since January 2011, the Global Select Market of the NASDAQ Stock Market under the symbol “TOBC”. Prior to that, our common stock was traded on the Over-the-Counter Bulletin Board (“OTCBB”).
The following table presents, for the calendar quarters indicated, per share cash dividends declared and the high and low bid prices for our common stock as reported on the OTCBB, and since April 6, 2009, the high and low sales prices reported on the NASDAQ Global Market, in U.S. dollars. OTCBB quotations reflect inter-dealer prices, without markup, markdown or commissions, and may not represent actual transactions.
Dividends paid by us primarily provided from the Bank’s dividends to us. Our payment of dividends and the payment of dividends by the Bank to us are each subject to the restrictions described under the heading “Dividend Restrictions” in Item 1. “Business” on page 5 of this Report, under the heading “Regulatory Capital” in Item 7. “Management’s Discussion and Analysis of Financial Condition and Results of Operations” on page 51 of this Report and Note 20 to the Consolidated Financial Statements included in Item 8 of this Report, which information is incorporated by reference in this Item 5. In the Graystone Merger Agreement, we committed to maintain the annual dividend rate of at least $1.12 per share for two years after the Graystone Merger, which was consummated on March 31, 2009, subject to there being sufficient funds legally available to pay the dividend and further provided that we continue to be “well capitalized” on a consolidated basis in accordance with applicable regulatory guidelines following the payment of the dividend. We did not repurchase any shares of our common stock during the year ended December 31, 2010.
| Price Range | Cash Dividend | |||||||||||
| Low | High | Paid Per Share | ||||||||||
| 2010 |
||||||||||||
| First Quarter |
$ | 22.57 | $ | 27.95 | $ | 0.28 | ||||||
| Second Quarter |
21.16 | 27.60 | 0.28 | |||||||||
| Third Quarter |
17.74 | 23.60 | 0.28 | |||||||||
| Fourth Quarter |
20.19 | 25.40 | 0.28 | |||||||||
| 2009 |
||||||||||||
| First Quarter(1) (2) |
$ | 19.00 | $ | 26.50 | $ | 1.40 | ||||||
| Second Quarter |
22.50 | 37.50 | 0.28 | |||||||||
| Third Quarter |
25.26 | 37.00 | 0.28 | |||||||||
| Fourth Quarter |
19.06 | 26.75 | 0.28 | |||||||||
(1) The cash dividend information included in this table for period prior to March 31, 2009 relates to dividends declared and paid by us prior to the Graystone Merger. Since our historical information is that of Graystone Financial Corp, resulting from the Graystone Merger being accounted for as a reverse merger, these dividends are not reflected within the historical financial statements or associated footnotes.
(2) The cash dividend declared and paid by us during the first quarter of 2009 includes a special dividend of $1.12 per share as prescribed by the Graystone Merger Agreement.
24
Table of Contents
Securities Authorized for Issuance under Equity Compensation Plans
The following table provides information about options outstanding under our 2010 Stock Incentive Plan, 2007 Stock Incentive Plan, 1995 Non-Qualified Stock Option Plan, and the Stock Option Plan for Outside Directors as of December 31, 2010:
| Plan Category |
Number of securities to be issued upon exercise of outstanding options, warrants and rights |
Weighted-average exercise price of outstanding options, warrants and rights |
Number of securities remaining available for future issuance under equity compensation plans (excluding securities reflected in first column) |
|||||||||
| Equity compensation plans approved by security holders |
254,408 | $ | 31.57 | 547,236 | ||||||||
| Equity compensation plans not approved by security holders |
— | — | — | |||||||||
| Total |
254,408 | $ | 31.57 | 547,236 | ||||||||
25
Table of Contents
Performance Graph
The graph below shows cumulative total investment returns to shareholders (i.e. changes in price plus reinvestment of dividends) based on the assumptions that an investment of $100.00 was made on December 31, 2005, in each of the following: (i) Tower Bancorp, Inc common stock; (ii) the stock of all companies included in the SNL Bank Index; (iii) the stock of all companies traded on the broad-market Russell 3000 Index; and (iv) a peer group consisting of banking and financial holding companies with total assets between $1.0 billion - $5.0 billion that are included and tracked within the SNL Bank $1.0 billion -$5.0 billion Index. The graph assumes that dividends paid on the initial investment were reinvested.
The graph below is furnished under this Part II Item 5 of this Form 10-K and shall not be deemed to be “soliciting material” or to be “filed” with the Commission or subject to Regulation 14A or 14C, or to the liabilities of Section 18 of the Exchange Act of 1934, as amended.
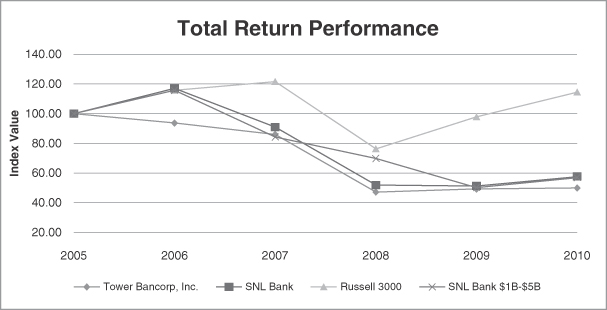
| Period Ending | ||||||||||||||||||||||||
| Index |
2005 | 2006 | 2007 | 2008 | 2009 | 2010 | ||||||||||||||||||
| Tower Bancorp, Inc. |
$ | 100.00 | $ | 93.72 | $ | 86.07 | $ | 47.12 | $ | 49.39 | $ | 49.95 | ||||||||||||
| SNL Bank |
$ | 100.00 | $ | 116.98 | $ | 90.90 | $ | 51.87 | $ | 51.33 | $ | 57.52 | ||||||||||||
| Russell 3000 |
$ | 100.00 | $ | 115.71 | $ | 121.66 | $ | 76.27 | $ | 97.89 | $ | 114.46 | ||||||||||||
| SNL Bank $1B-$5B |
$ | 100.00 | $ | 115.72 | $ | 84.29 | $ | 69.91 | $ | 50.11 | $ | 56.81 | ||||||||||||
Issuer Purchases of Equity Securities
Not Applicable.
26
Table of Contents
| Item 6. | Selected Financial Data |
5-Year Consolidated Summary of Financial Results
(dollars in thousands, except per-share data)
| For the Years Ended December 31, | ||||||||||||||||||||
| 2010 | 2009 | 2008 | 2007 | 2006 | ||||||||||||||||
| Summary of Operations: | ||||||||||||||||||||
| Interest income |
$ | 76,823 | $ | 56,383 | $ | 32,157 | $ | 24,313 | $ | 10,618 | ||||||||||
| Interest expense |
22,154 | 20,428 | 16,481 | 13,586 | 5,899 | |||||||||||||||
| Net interest income |
54,669 | 35,955 | 15,676 | 10,727 | 4,719 | |||||||||||||||
| Provision for loan losses |
9,050 | 5,216 | 2,550 | 1,997 | 1,756 | |||||||||||||||
| Noninterest income |
11,692 | 8,643 | 3,089 | 1,592 | 367 | |||||||||||||||
| Noninterest expenses |
49,172 | 31,727 | 13,803 | 10,692 | 6,413 | |||||||||||||||
| Merger related expenses and restructuring charges |
5,597 | 2,080 | — | — | — | |||||||||||||||
| Income (loss) from before income taxes |
2,542 | 5,575 | 2,412 | (370 | ) | (3,083 | ) | |||||||||||||
| Income taxes expense (benefit) |
1,223 | 1,829 | 333 | (6 | ) | — | ||||||||||||||
| Less: Income (loss) from noncontrolling interest |
161 | 37 | (3 | ) | (18 | ) | — | |||||||||||||
| Net income (loss) |
1,158 | 3,709 | 2,082 | (346 | ) | (3,083 | ) | |||||||||||||
| Per Common Share: |
||||||||||||||||||||
| Net income (loss) per share |
||||||||||||||||||||
| Basic |
$ | 0.16 | $ | 0.72 | $ | 0.76 | $ | (0.19 | ) | $ | (2.88 | ) | ||||||||
| Diluted |
$ | 0.16 | $ | 0.72 | $ | 0.76 | $ | (0.19 | ) | $ | (2.88 | ) | ||||||||
| Cash dividends declared |
$ | 1.12 | $ | 0.84 | $ | — | $ | — | $ | — | ||||||||||
| Weighted average common shares outstanding: |
||||||||||||||||||||
| Basic |
7,359,478 | 5,156,078 | 2,734,027 | 1,867,767 | 1,070,519 | |||||||||||||||
| Diluted |
7,361,774 | 5,161,325 | 2,734,027 | 1,867,767 | 1,070,519 | |||||||||||||||
| Common shares outstanding at period end |
11,971,399 | 7,122,683 | 2,740,325 | 2,733,663 | 1,246,700 | |||||||||||||||
| Book value per share |
$ | 21.44 | $ | 23.02 | $ | 19.99 | $ | 19.05 | $ | 11.21 | ||||||||||
| Tangible book value per share – Non-GAAP(1) |
$ | 19.47 | $ | 20.86 | $ | 19.99 | $ | 19.05 | $ | 11.21 | ||||||||||
| Performance Ratios: |
||||||||||||||||||||
| Return on average assets |
0.07 | % | 0.32 | % | 0.38 | % | -0.10 | % | -1.98 | % | ||||||||||
| Return on average equity |
0.65 | % | 3.24 | % | 3.90 | % | -1.15 | % | -21.96 | % | ||||||||||
| Net interest margin |
3.71 | % | 3.49 | % | 2.97 | % | 3.24 | % | 3.10 | % | ||||||||||
| Efficiency ratio |
82.53 | % | 75.80 | % | 73.54 | % | 86.64 | % | 126.09 | % | ||||||||||
| Capital Ratios |
||||||||||||||||||||
| Total capital (to risk-weighted assets) |
13.24 | % | 14.43 | % | 10.10 | % | 13.32 | % | 8.14 | % | ||||||||||
| Tier 1 capital (to risk-weighted assets) |
11.83 | % | 13.58 | % | 9.10 | % | 12.34 | % | 7.06 | % | ||||||||||
| Tier 1 capital (to average total assets) |
13.45 | % | 11.13 | % | 8.50 | % | 12.54 | % | 6.36 | % | ||||||||||
| Tangible equity to tangible assets – Non-GAAP(1) |
8.56 | % | 10.21 | % | 8.54 | % | 11.67 | % | 5.70 | % | ||||||||||
27
Table of Contents
| For the Years Ended December 31, | ||||||||||||||||||||
| 2010 | 2009 | 2008 | 2007 | 2006 | ||||||||||||||||
| Period End Balance |
||||||||||||||||||||
| Total assets |
$ | 2,747,289 | $ | 1,470,583 | $ | 641,318 | $ | 446,412 | $ | 245,095 | ||||||||||
| Securities available for sale |
102,695 | 189,853 | 19,904 | 27,931 | 63,734 | |||||||||||||||
| Loans, net of unearned income |
2,219,525 | 1,146,305 | 571,046 | 390,274 | 172,519 | |||||||||||||||
| Allowance for loan losses |
14,053 | 9,695 | 6,017 | 4,148 | 2,516 | |||||||||||||||
| Goodwill and intangible assets |
24,243 | 15,302 | — | — | — | |||||||||||||||
| Deposits and securities sold under repurchased agreements |
2,306,503 | 1,223,361 | 533,854 | 385,391 | 223,622 | |||||||||||||||
| Borrowings |
142,839 | 70,981 | 43,614 | 4,430 | 6,200 | |||||||||||||||
| Stockholders’ equity |
256,640 | 163,877 | 54,785 | 52,085 | 13,971 | |||||||||||||||
| Reconciliation of Non-GAAP Balance Sheet Data |
||||||||||||||||||||
| Total assets—GAAP |
$ | 2,747,289 | $ | 1,470,583 | $ | 641,318 | $ | 446,412 | $ | 245,095 | ||||||||||
| Less: Goodwill and other intangible assets |
24,243 | 15,302 | — | — | — | |||||||||||||||
| Total tangible assets—Non-GAAP |
$ | 2,723,046 | $ | 1,455,281 | $ | 641,318 | $ | 446,412 | $ | 245,095 | ||||||||||
| Stockholders’ equity—GAAP |
$ | 256,640 | $ | 163,892 | $ | 54,785 | $ | 52,085 | $ | 13,971 | ||||||||||
| Less: Goodwill and other intangible assets |
24,243 | 15,302 | — | — | — | |||||||||||||||
| Plus: Leasehold intangible liabilities |
643 | — | — | — | — | |||||||||||||||
| Tangible equity—Non-GAAP |
$ | 233,040 | $ | 148,590 | $ | 54,785 | $ | 52,085 | $ | 13,971 | ||||||||||
(1) Tangible assets and tangible equity and the ratios derived from these numbers are non-GAAP financial measures. Tangible assets and tangible equity are derived by reducing the balance of assets and equity, respectively, by the amount of GAAP reported goodwill and other intangible assets and liabilities. In order to calculate tangible book value per share, we divide tangible equity by the number of common shares outstanding. In order to calculate tangible equity to tangible assets, we divide tangible equity by the tangible assets. We believe the presentation of these non-GAAP financial measures provide useful supplemental information that is essential to an investor’s proper understanding of the operating results of the our core businesses. We use these non-GAAP financial measures in our analysis of our performance. These non-GAAP disclosures should not be viewed as a substitute for financial measures determined in accordance with GAAP, nor are they necessarily comparable to non-GAAP performance measures that may be presented by other companies.
28
Table of Contents
| Item 7. | Management’s Discussion and Analysis of Financial Condition and Results of Operations |
OVERVIEW
Our discussion and analysis of the changes in the consolidated results of operations, financial condition, and cash flows is set forth below for the periods indicated. Through the Bank, we provide banking and banking related services to our customers within our principal market areas consisting of Centre, Chester, Cumberland, Dauphin, Delaware, Franklin, Fulton, Lancaster, Lebanon, and York Counties of Pennsylvania and Washington County, Maryland. The purpose of the following discussion and analysis is to provide investors and others with information that we believe to be necessary in understanding the financial condition, changes in financial condition, and results of operations of our company. Our discussion and analysis should be read in conjunction with the consolidated financial statements, notes, and other information contained in this report.
Mergers and Acquisitions
On March 31, 2009, the Company completed the merger with Graystone Financial Corp., (“Graystone”) in an all stock transaction valued at approximately $57.9 million (the “Graystone Merger”). The Graystone Merger, while considered a merger of equals, is accounted for as a reverse merger by Graystone of the Company using the acquisition method of accounting and, accordingly, the assets and liabilities of the Company being recorded at their respective fair values on the date the Graystone Merger was completed. Furthermore, the historical financial information included in the Company’s consolidated financial statements and related footnotes as reported in this Form 10-K is that of Graystone. The Graystone Merger was affected by the issuance of shares of the Company’s common stock to Graystone shareholders. Each share of Graystone common stock was exchanged for 0.42 shares of the Company’s common stock, with any fractional shares as a result of the exchange, paid to Graystone shareholders in cash based on $19.78 per share of the Company’s common stock.
Pursuant to the merger agreement with Graystone (“Graystone Merger Agreement”), the Company is the surviving bank holding company and its wholly-owned subsidiary, The First National Bank of Greencastle, merged with and into Graystone’s wholly owned subsidiary, Graystone Bank, with Graystone Bank as the surviving institution, under the name “Graystone Tower Bank” (the “Bank”).
On December 10, 2010, the Company completed its acquisition of First Chester County Corporation (“First Chester”) in an all-stock transaction valued at approximately $49.8 million or $22.14 per share based on the closing price of the Company’s common stock (the “FCEC Merger”). As part of the FCEC Merger, First Chester shareholders received 0.356 shares of the Company’s common stock for each share of First Chester common stock.
Pursuant to the merger agreement with First Chester (the “FCEC Merger Agreement”), the Company is the surviving bank holding company and First Chester’s wholly-owned subsidiary, The First National Bank of Chester County (“FNB”), merged with and into the Bank, with the Bank as the surviving institution.
Prior to the FCEC Merger, FNB conducted certain mortgage banking activities through its American Home Bank Division (“AHB Division”). Pursuant to the FCEC Merger Agreement, First Chester and FNB initiated efforts to sell the AHB Division, including, without limitation, the interests of FNB in certain mortgage-banking related joint ventures and activities related thereto. No sale agreement related to the AHB Division was executed prior to consummation of the FCEC Merger. On December 30, 2010, the Company announced that it will commence winding down the operations of the AHB Division in an orderly fashion. The Company expects to recognize a total restructuring charge of $4.0 million in connection with this action, of which approximately $1.4 million was recognized in 2010. The restructuring charge recognized in 2010 relates to the accrual for employee termination benefits. In addition, the AHB Division incurred a pre-tax operating loss of approximately $2.1 million from the merger date of December 10, 2010 to December 31, 2010. We expect operating losses will continue during the first quarter of 2011, which may be significant. Actual restructuring expenses and operating losses associated with winding down the operations of the AHB Division may exceed our estimates. Additionally, we continue to retain contingent liabilities relating to the prior operations of the AHB Division as well as actions undertaken in connection with the wind down. These matters could adversely affect our financial condition, results of operations, reputation and prospects.
29
Table of Contents
In connection with the FCEC Merger, on December 10, 2010, the Company terminated the Bank’s relationship and relinquished the investment interest in Dellinger, Dolan, McCurdy and Phillips Investment Advisors, LLC, (“DDMP Advisors, LLC”) through which the Bank previously offered investment advisory services to certain customers. The Company recognized an expense of approximately $1.5 million, pre-tax, in connection with the termination of this relationship in the fourth quarter of 2010.
As a result of these transactions, the Bank now serves ten counties in Central and Southeastern Pennsylvania and one county in Maryland. The Bank operates as the subsidiary of the Company through three divisions – “Graystone Bank, a division of Graystone Tower Bank”, consisting of the former Graystone Bank branches, and “Tower Bank, a division of Graystone Tower Bank,” consisting of the former branches of The First National Bank of Greencastle and “1N Bank, a Division of Graystone Tower Bank” consisting of the former branches of FNB. The operating philosophy will continue to be a community-oriented financial services company with a strong customer focus. These transactions have enhanced our business opportunities due to the Bank having a greater market share, market presence and the ability to offer more diverse and more profitable products, as well as a broader based and geographically diversified branch system to enhance deposit collection and the funding costs, and a higher legal lending limit to originate larger and more profitable commercial loans. We believe that the merger of the banks into one surviving bank will provide greater efficiency, customer service, and product delivery than it would achieve by operating under a multi-bank holding company structure.
RESULTS FROM OPERATIONS
Summary Financial Results
For the year ended December 31, 2010, we recognized a net income of $1.2 million or $0.16 per diluted share, compared to net income of $3.7 million or $0.72 per diluted share 2009. The decrease was the result of $2.1 million in after-tax merger related expenses, $2.2 million in after-tax restructuring charges and a land impairment charge of $607 thousand on an after-tax basis for the year ended December 31, 2010. After-tax restructuring charges in 2010 included $1.3 million related to the termination of an agreement with DDMP Advisors LLC, an investment advisory firm in which we maintained a 20% equity interest and $939 thousand related to the decision to winding down the operations of the AHB Division acquired in the FCEC Merger. The restructuring charge related to the winding down of operations of the AHB Division relates to the accrual for employee termination benefits. Included in net income for the year ended December 31, 2010 is the results of operations for the 1N Bank Division and AHB Division for the period December 10, 2010 to December 31, 2010.
Net interest income before loan loss provision increased $18.7 million or 52.0% during 2010 compared to 2009. In addition to the net interest income contributed by the inclusion of the 1N Bank Division and AHB Division, which added $2.4 million, the growth was also driven by organic growth of net interest-earning assets. The provision for loan losses totaled $9.1 million, an increase of $3.8 million, compared to 2009. The recorded provision for loan losses is based upon our evaluation of risk of losses over the entire loan portfolio. Included in the provision recorded for 2010 is a $2.5 million specific reserve related to one troubled credit within the commercial construction portfolio which was identified and disclosed during the first quarter of 2010. Noninterest income increased by $3.0 million due to increased service charges on deposit accounts, commissions and fees, gains on sales of mortgage loans originated for sale, and income generated from bank owned life insurance policies. Noninterest expense, excluding merger related expenses, restructuring charges and land impairment, increased by $16.5 million primarily due to increases in compensation costs, occupancy expenses, FDIC insurance premiums and professional service expenses incurred in order to support our continued growth.
Net Interest Income
Net interest income is the most significant component of our net income. Net interest income increased $18.7 million or 52.0% to approximately $54.7 million for the year ended December 31, 2010, as compared to approximately $36.0 million for 2009 and $15.7 million for 2008. The $18.7 million increase in net interest income includes $3.6 million as a result of the net contribution from interest-earning assets and interest-bearing liabilities from the Tower Bank Division for the first three months of 2010 and $2.4 million contributed to
30
Table of Contents
interest-earning assets and interest-bearing liabilities from the 1N Bank Division and AHB Division acquired on December 10, 2010.
The following table provides a comparative average balance sheet and net interest income analysis for 2010 compared to 2009 and 2008. Interest income and yields are presented on a fully taxable-equivalent (FTE) basis, using a 34% Federal tax rate. The discussion following this table is based on these tax-equivalent amounts. We manage the risk associated with changes in interest rates through the techniques described in this Report under Item 7A. Quantitative and Qualitative Disclosures About Market Risk. All dollar amounts are in thousands.
| For the Year Ended December 31, | ||||||||||||||||||||||||||||||||||||
| 2010 | 2009 | 2008 | ||||||||||||||||||||||||||||||||||
| Average Balance |
Interest | Average Rate |
Average Balance |
Interest | Average Rate |
Average Balance |
Interest | Average Rate |
||||||||||||||||||||||||||||
| Interest-earning assets: |
||||||||||||||||||||||||||||||||||||
| Federal funds sold and others |
$ | 20,131 | $ | 122 | 0.61 | % | $ | 32,565 | $ | 123 | 0.38 | % | $ | 8,764 | $ | 247 | 2.82 | % | ||||||||||||||||||
| Investment securities (1) |
167,878 | 4,171 | 2.48 | % | 88,961 | 2,024 | 2.28 | % | 27,780 | 925 | 3.33 | % | ||||||||||||||||||||||||
| Loans (2) |
1,289,625 | 72,713 | 5.64 | % | 909,476 | 54,304 | 5.97 | % | 492,106 | 31,026 | 6.30 | % | ||||||||||||||||||||||||
| Total interest-earning assets |
1,477,634 | $ | 77,006 | 5.21 | % | 1,031,002 | $ | 56,451 | 5.48 | % | 528,650 | $ | 32,198 | 6.09 | % | |||||||||||||||||||||
| Other assets |
154,162 | 128,214 | 20,367 | |||||||||||||||||||||||||||||||||
| Total assets |
$ | 1,631,796 | $ | 1,159,216 | $ | 549,017 | ||||||||||||||||||||||||||||||
| Interest-bearing liabilities: |
||||||||||||||||||||||||||||||||||||
| Interest-bearing non-maturity deposits |
$ | 779,115 | $ | 8,017 | 1.03 | % | $ | 503,998 | $ | 7,640 | 1.52 | % | $ | 130,038 | $ | 3,165 | 2.43 | % | ||||||||||||||||||
| Time deposits |
453,069 | 10,039 | 2.22 | % | 365,623 | 10,323 | 2.82 | % | 276,821 | 11,941 | 4.31 | % | ||||||||||||||||||||||||
| Borrowings |
86,078 | 4,098 | 4.76 | % | 68,053 | 2,465 | 3.62 | % | 46,198 | 1,375 | 2.98 | % | ||||||||||||||||||||||||
| Total interest-bearing liabilities |
1,318,262 | $ | 22,154 | 1.68 | % | 937,674 | $ | 20,428 | 2.18 | % | 453,057 | $ | 16,481 | 3.64 | % | |||||||||||||||||||||
| Demand deposits |
128,360 | 83,362 | 32,610 | |||||||||||||||||||||||||||||||||
| Other liabilities |
6,772 | 23,143 | 9,952 | |||||||||||||||||||||||||||||||||
| Stockholders’ equity |
178,402 | 115,037 | 53,398 | |||||||||||||||||||||||||||||||||
| Total liabilities and stockholders’ equity |
$ | 1,631,796 | $ | 1,159,216 | $ | 549,017 | ||||||||||||||||||||||||||||||
| Net interest spread |
3.53 | % | 3.30 | % | 2.45 | % | ||||||||||||||||||||||||||||||
| Net interest income and interest rate margin FTE |
$ | 54,852 | 3.71 | % | $ | 36,023 | 3.49 | % | $ | 15,717 | 2.97 | % | ||||||||||||||||||||||||
| Tax equivalent adjustment |
(183 | ) | (68 | ) | (41 | ) | ||||||||||||||||||||||||||||||
| Net interest income |
$ | 54,669 | $ | 35,955 | $ | 15,676 | ||||||||||||||||||||||||||||||
| Ratio of average interest-earning assets to average interest-bearing liabilities |
112.1 | % | 110.0 | % | 116.7 | % | ||||||||||||||||||||||||||||||
(1) The average yields for investment securities available for sale are reported on a fully taxable-equivalent basis at a rate of 34% for 2010, 2009 and 2008.
(2) Average loan balances include non-accrual loans.
31
Table of Contents
The following table sets forth a summary of changes in FTE interest income and expense resulting from changes in average balances (volumes) and changes in rates:
| Year Ended | Year Ended | |||||||||||||||||||||||
| December 31, 2010 vs. December 31, 2009 |
December 31, 2009 vs. December 31, 2008 |
|||||||||||||||||||||||
| Increase (Decrease) Due to | Increase (Decrease) Due to | |||||||||||||||||||||||
| Volume | Rate | Total | Volume | Rate | Total | |||||||||||||||||||
| (dollars in thousands) | ||||||||||||||||||||||||
| Interest income: |
||||||||||||||||||||||||
| Federal funds sold |
$ | (58 | ) | $ | 57 | $ | (1 | ) | $ | 230 | $ | (354 | ) | $ | (124 | ) | ||||||||
| Investment securities |
1,945 | 202 | 2,147 | 1,473 | (374 | ) | 1,099 | |||||||||||||||||
| Loans |
21,583 | (3,174 | ) | 18,409 | 25,003 | (1,725 | ) | 23,278 | ||||||||||||||||
| Total interest income |
23,470 | (2,915 | ) | 20,555 | 26,706 | (2,453 | ) | 24,253 | ||||||||||||||||
| Interest expense: |
||||||||||||||||||||||||
| Interest-bearing non-maturity deposits |
3,327 | (2,950 | ) | 377 | 6,067 | (1,592 | ) | 4,475 | ||||||||||||||||
| Time deposits |
2,190 | (2,474 | ) | (284 | ) | 3,193 | (4,811 | ) | (1,618 | ) | ||||||||||||||
| Borrowings |
747 | 886 | 1,633 | 747 | 343 | 1,090 | ||||||||||||||||||
| Total interest expenses |
6,264 | (4,538 | ) | 1,726 | 10,007 | (6,060 | ) | 3,947 | ||||||||||||||||
| Net interest income |
$ | 17,206 | $ | 1,623 | $ | 18,829 | $ | 16,699 | $ | 3,607 | $ | 20,306 | ||||||||||||
2010 vs. 2009
Interest income increased approximately $20.6 million, or 36.4%. This increase was caused by an approximate $446.6 million or 43.3% increase in the average balance of interest-earning assets, which resulted in an approximately $23.5 million increase to interest income. This increase was partially offset by a 27 basis point reduction in average rates that resulted in a reduction of interest income of approximately $2.9 million.
Interest income on investment securities increased approximately $2.1 million or 106.1%. The average balance of investments held by the Bank increased from $89.0 million in 2009 to $167.9 million, which resulted in an increase of approximately $1.9 million in interest income. The increase in the average balance of investment securities relates primarily to the addition of securities purchased towards the end of 2009 and held throughout most of 2010. The securities purchased included U.S. agency bonds, U.S. agency mortgage-backed securities and U.S. agency collateralized mortgage obligation securities, municipal bonds and SBA pooled loan securitizations. These investments served as an initial way for us to deploy the excess capital acquired in our 2009 common stock offering into interest earning assets until the proceeds were required to fund loan growth. These higher-yielding investments increased the average yield on investments by 20 basis points from 2.28% during 2009 to 2.48% during 2010.
Average yields on loans decreased 33 basis points from 5.97% during 2009 to 5.64% during 2010. As mentioned above, the decrease is reflective of the continued reduction in the interest rate environment through 2010. During 2010, the intended federal funds target rate saw very little change as the rate remained below 0.25%. Intended federal funds target rate continued to have downward pressure on the prime rate and all other lending rates, which prolonged the reduced interest rate environment throughout 2010. Average yields did not decrease as severely as the reduction in the aforementioned rates since fixed rate loans, which represent approximately 24% of total loans held at December 31, 2010, do not reprice when short-term rates decline. Additionally, the total effect of downward loan repricing on variable rate loans will not coincide with the decrease in the aforementioned rates due to the fact that approximately 73% of the variable rate loans at December 31, 2010 contain interest rate floors. Conversely, any benefit associated with an increase in interest rates in the future might not be immediately realized due to the use of interest rate floors. Presumably, an increase in future interest rates would cause repricing in all assets and liabilities linked to variable rate indices; however, as deposit
32
Table of Contents
products would experience any increase on a relatively immediate basis, loan products with floors in place would require a rate increase such that the resulting rate earned on the loan would exceed the floor. Currently, we are committed to improving the average rate on loans through the use of interest rate floors, where possible, in the existing and new variable rate commercial loan portfolios.
Interest expense increased $1.7 million or 8.4% during 2010 compared to 2009. This increase was caused by approximately $380.6 million or 40.6% increase in the average balance of interest-bearing liabilities, which resulted in approximately $6.3 million increase to interest expense. This increase was predominately offset by a 50 basis point reduction in the average rate paid on interest-bearing liabilities, which resulted in a reduction of interest expense of approximately $4.5 million. This reduction in average rates paid on interest-bearing liabilities was the result of the reduced rates paid on interest-bearing non-maturity deposit accounts and time deposits compared to 2009.
In future periods, assuming a continuing flat or declining rate environment, we expect an increase in the total amount of net interest income driven by continued growth in average interest-earning assets, the continued use of floors in the variable rate commercial loan portfolio, and the continued repricing of a portion of the interest-bearing deposit portfolio. Any significant changes such as rapid movement in interest rates set by the Federal Reserve, changes in the performance of the interest earning assets, the continued repricing of assets, and the inability to move deposit rates in similar increments as earning asset rates may mitigate this benefit in the future.
The benefit associated with an increase in interest rates in the future might not be immediately realized due to the use of interest rate floors. Presumably, an increase in future interest rates would cause repricing in all assets and liabilities linked to variable rate indices; however, as deposit products would experience any increase on a relatively immediate basis, loan products with floors in place would require a rate increase such that the resulting rate earned on the loan would exceed the floor. Refer to Item 7A Quantitative and Qualitative Disclosures About Market Risk for a more detailed discussion of interest rate risk.
2009 vs. 2008
Interest income in 2009 increased approximately $24.3 million, or 75.3% over 2008. This increase was caused by an approximate $502.4 million or 95.0% increase in the average balance of interest-earning assets, which resulted in an approximately $26.7 million increase to interest income. This increase was partially offset by a 61 basis point reduction in average rates that resulted in a reduction of interest income of approximately $2.4 million.
Interest income on investment securities increased approximately $1.1 million or 118.8%. The average balance of investments held by the Bank increased from $27.8 million in 2008 to $89.0 million, which resulted in an increase of approximately $1.5 million in interest income. The increase in the average balance of investment securities relates primarily to the addition of securities acquired through the Graystone Merger as well as additional investments purchased following the common stock offering in September 2009. The capital raised through the common stock offering was used to purchase higher-yielding collateralized mortgage obligation securities and SBA pooled loan securitizations as well as other lower risk debt securities. These investments served as an initial way for us to deploy the acquired capital into interest earning assets until the proceeds were required to fund future loan growth. This increase is offset by the reduction in the interest rates earned on securities primarily due to the overall reduced interest rate environment as compared to 2008. The reduction of 105 basis points on the average rate resulted in a reduction of interest income of $374 thousand.
Average yields on loans decreased 33 basis points from 6.30% during 2008 to 5.97% during 2009. As mentioned above, the decrease is reflective of the lower interest rate environment. During 2008, the Federal Reserve reduced the intended federal funds target rate from 4.11% at January 2, 2008 to 2.47% at June 30, 2008 and drastically cutting the rate to less than 1.00% during the middle of October 2008. During 2009, the intended federal funds target rate saw very little change as the rate remained below 0.25%. Due to the nominal levels of the intended federal funds target rate downward pressure was placed on the prime rate and all other lending rates, further
33
Table of Contents
adding to the reduced interest rate environment in 2009 as compared to 2008. Average yields did not decrease as severely as the reduction in the aforementioned rates since fixed rate loans, which represent approximately 25% of total loans held at December 31, 2009, do not reprice when short-term rates decline. Additionally, the total effect of downward loan repricing on variable rate loans will not coincide with the decrease in the aforementioned rates due to the fact that approximately 86% of the variable rate loans at December 31, 2009 contain interest rate floors.
Interest expense increased $3.9 million or 24.0% during 2009 compared to 2008. This increase was caused by an approximately $484.6 million or 107.0% increase in the average balance of interest-bearing liabilities, which resulted in approximately $10.0 million increase to interest expense. This increase was predominately offset by a 146 basis point reduction in the average rate paid on interest-bearing liabilities, which resulted in a reduction of interest expense of approximately $6.1 million. This reduction in average rates paid on interest-bearing liabilities was the result of lower rates paid on interest-bearing non-maturity deposit accounts and time deposits and borrowings.
Provision and Allowance for Loan Losses
The Bank accounts for the credit risk associated with lending activities through the allowance for credit losses and provision for loan losses. The provision is the expense recognized on the consolidated statements of operations to adjust the allowance to its proper balance, as determined through the application of the allowance methodology procedures. These procedures include the evaluation of the risk characteristics of the portfolio and documentation in accordance with the U.S. GAAP, “Selected Loan Loss Allowance Methodology and Documentation Issues”. See the “Critical Accounting Policies” section of Management’s Discussion for a discussion of the allowance for credit losses evaluation methodology.
34
Table of Contents
The following tables present a summary of the provision and allowance for loan losses as well as the credit fair value adjustment on purchased loans:
Allowance for Loan Losses
| As of or for the Years Ended December 31, | ||||||||||||||||||||
| 2010 | 2009 | 2008 | 2007 | 2006 | ||||||||||||||||
| (dollars in thousands) | ||||||||||||||||||||
| Total loans outstanding at period end, net of unearned income |
$ | 2,219,525 | $ | 1,146,305 | $ | 571,046 | $ | 390,274 | $ | 172,519 | ||||||||||
| Daily average balance of loans |
$ | 1,289,625 | $ | 909,476 | $ | 492,106 | $ | 276,252 | $ | 105,995 | ||||||||||
| Balance at beginning of period |
$ | 9,695 | $ | 6,017 | $ | 4,148 | $ | 2,156 | $ | 400 | ||||||||||
| Provision for loan losses |
9,050 | 5,216 | 2,550 | 1,997 | 1,756 | |||||||||||||||
| Charge-offs: |
||||||||||||||||||||
| Commercial: |
||||||||||||||||||||
| Industrial |
(2,375 | ) | (1,220 | ) | (681 | ) | — | — | ||||||||||||
| Real estate |
(840 | ) | (65 | ) | — | — | — | |||||||||||||
| Construction |
(431 | ) | (150 | ) | — | — | — | |||||||||||||
| Consumer: |
||||||||||||||||||||
| Home equity line |
(320 | ) | (7 | ) | — | — | — | |||||||||||||
| Other |
(292 | ) | (149 | ) | — | (5 | ) | — | ||||||||||||
| Residential mortgages |
(525 | ) | (7 | ) | — | — | — | |||||||||||||
| Total charge-offs |
(4,783 | ) | (1,598 | ) | (681 | ) | (5 | ) | — | |||||||||||
| Recoveries: |
||||||||||||||||||||
| Commercial: |
||||||||||||||||||||
| Industrial |
83 | 41 | — | — | — | |||||||||||||||
| Real estate |
— | 6 | — | — | — | |||||||||||||||
| Construction |
2 | 6 | — | — | — | |||||||||||||||
| Consumer: |
||||||||||||||||||||
| Home equity line |
— | 7 | — | — | — | |||||||||||||||
| Other |
4 | — | — | — | — | |||||||||||||||
| Residential mortgages |
2 | — | — | — | — | |||||||||||||||
| Total recoveries |
91 | 60 | — | — | — | |||||||||||||||
| Net charge-offs |
(4,692 | ) | (1,538 | ) | (681 | ) | (5 | ) | — | |||||||||||
| Balance at end of period |
$ | 14,053 | $ | 9,695 | $ | 6,017 | $ | 4,148 | $ | 2,156 | ||||||||||
35
Table of Contents
Credit Fair Value Adjustment on Purchased Loans (Non-GAAP)
| For the Years Ended December 31, | ||||||||||||||||||||
| 2010 | 2009 | 2008 | 2007 | 2006 | ||||||||||||||||
| (dollars in thousands) | ||||||||||||||||||||
| Balance at beginning of period |
$ | 2,942 | $ | — | $ | — | $ | — | $ | — | ||||||||||
| Credit fair value adjustment mark |
20,510 | 4,044 | — | — | — | |||||||||||||||
| Amortization |
(574 | ) | (756 | ) | — | — | — | |||||||||||||
| Charge-offs: |
||||||||||||||||||||
| Commercial: |
||||||||||||||||||||
| Industrial |
(477 | ) | (30 | ) | — | — | — | |||||||||||||
| Real estate |
(239 | ) | (30 | ) | — | — | — | |||||||||||||
| Construction |
— | — | — | — | — | |||||||||||||||
| Consumer: |
||||||||||||||||||||
| Home equity line |
(21 | ) | (34 | ) | — | — | — | |||||||||||||
| Other |
(294 | ) | (226 | ) | — | — | — | |||||||||||||
| Residential mortgages |
(263 | ) | (236 | ) | — | — | — | |||||||||||||
| Total charge-offs |
(1,294 | ) | (556 | ) | — | — | — | |||||||||||||
| Recoveries: |
||||||||||||||||||||
| Commercial: |
||||||||||||||||||||
| Industrial |
28 | 89 | — | — | — | |||||||||||||||
| Real estate |
— | — | — | — | — | |||||||||||||||
| Construction |
— | — | — | — | — | |||||||||||||||
| Consumer: |
||||||||||||||||||||
| Home equity line |
2 | 1 | — | — | — | |||||||||||||||
| Other |
77 | 117 | — | — | — | |||||||||||||||
| Residential mortgages |
2 | 3 | — | — | — | |||||||||||||||
| Total recoveries |
109 | 210 | — | — | — | |||||||||||||||
| Net charge-offs |
(1,185 | ) | (346 | ) | — | — | — | |||||||||||||
| Balance at end of period |
$ | 21,693 | $ | 2,942 | $ | — | $ | — | $ | — | ||||||||||
36
Table of Contents
The allocation of the allowance for loan losses is made for analytical purposes and it is not necessarily indicative of the categories in which future loan losses may occur. The total allowance is available to absorb losses from any segment of loans. The allocations in the table below were determined by a combination of the following factors: specific allocations made on loans considered impaired as determined by our management and our loan review committee, a general allocation on certain other impaired loans, and historical losses in each loan type category combined with a weighting of the current loan composition. The following table details the allocation of the allowance for loan losses to the various categories:
The following table summarizes the allocation of the allowance for loan losses by loan type:
| As of December 31, | ||||||||||||||||||||||||||||||||||||||||
| 2010 | 2009 | 2008 | 2007 | 2006 | ||||||||||||||||||||||||||||||||||||
| (dollars in thousands) | ||||||||||||||||||||||||||||||||||||||||
| Allowance | % of Loans In Each Category |
Allowance | % of Loans In Each Category |
Allowance | % of Loans in Each Category |
Allowance | % of Loans in Each Category |
Allowance | % of Loans in Each Category |
|||||||||||||||||||||||||||||||
| Commercial: |
||||||||||||||||||||||||||||||||||||||||
| Industrial |
$ | 7,127 | 44.48 | % | $ | 6,262 | 52.68 | % | $ | 4,021 | 64.64 | % | $ | 2,793 | 70.35 | % | $ | 1,641 | 76.12 | % | ||||||||||||||||||||
| Real estate |
1,159 | 21.31 | % | 1,597 | 14.05 | % | 643 | 11.32 | % | 417 | 9.81 | % | 244 | 11.30 | % | |||||||||||||||||||||||||
| Construction |
4,138 | 8.68 | % | 1,389 | 8.96 | % | 1,008 | 13.62 | % | 707 | 11.36 | % | 115 | 5.35 | % | |||||||||||||||||||||||||
| Consumer: |
||||||||||||||||||||||||||||||||||||||||
| Home equity line |
242 | 9.48 | % | 97 | 4.32 | % | 166 | 4.91 | % | 112 | 3.80 | % | 145 | 6.72 | % | |||||||||||||||||||||||||
| Other |
53 | 2.53 | % | 32 | 3.19 | % | 123 | 4.61 | % | 93 | 4.20 | % | 8 | 0.38 | % | |||||||||||||||||||||||||
| Residential mortgages |
1,334 | 13.52 | % | 318 | 16.80 | % | 56 | 0.90 | % | 26 | 0.48 | % | 3 | 0.13 | % | |||||||||||||||||||||||||
| Total |
$ | 14,053 | 100.00 | % | $ | 9,695 | 100.00 | % | $ | 6,017 | 100.00 | % | $ | 4,148 | 100.00 | % | $ | 2,156 | 100.00 | % | ||||||||||||||||||||
Asset Quality Ratios
| As of or for the Years Ended December 31, | ||||||||||||||||||||
| 2010 | 2009 | 2008 | 2007 | 2006 | ||||||||||||||||
| Allowance for loan losses to total loans (1) |
0.65 | % | 0.85 | % | 1.05 | % | 1.06 | % | 1.25 | % | ||||||||||
| Adjusted (Non-GAAP) allowance for loan losses to total loans (1)(2) |
1.66 | % | 1.11 | % | 1.05 | % | 1.06 | % | 1.25 | % | ||||||||||
| Non-accrual loans to total loans (1) |
0.82 | % | 0.41 | % | 0.24 | % | 0.02 | % | n/m | |||||||||||
| Net charge-offs to average loans |
0.36 | % | 0.17 | % | 0.14 | % | 0.00 | % | n/m | |||||||||||
| Non-performing assets to total assets |
0.87 | % | 0.53 | % | 0.23 | % | 0.02 | % | n/m | |||||||||||
| Non-performing loans to total loans (1) |
0.89 | % | 0.60 | % | 0.26 | % | 0.02 | % | n/m | |||||||||||
| Allowance for loan losses to non-performing loans |
73.40 | % | 142.07 | % | 409.32 | % | n/m | n/m | ||||||||||||
| Adjusted (Non-GAAP) allowance for loan losses to non-performing loans (1)(2) |
186.69 | % | 185.18 | % | 409.32 | % | n/m | n/m | ||||||||||||
n/m - not meaningful
(1) Total loans excludes purchased impaired loans accounted for under ASC 310-30 acquired as part of the Graystone Merger and FCEC Merger. The total balance of these loans, net of fair value mark, is $61.6 million as of December 31, 2010, and $6.2 million as of December 31, 2009.
(2) Adjusted (Non-GAAP) allowance for loan losses includes the allowance for loan losses and the credit fair value adjustment to the risk of credit loss related to the non-impaired portfolio of purchased loans acquired through the Graystone Merger and the FCEC Merger, as per table below:
| As of the Year Ended December 31, | ||||||||||||||||||||
| 2010 | 2009 | 2008 | 2007 | 2006 | ||||||||||||||||
| Allowance for loan losses |
$ | 14,053 | $ | 9,695 | $ | 6,017 | $ | 4,148 | $ | 2,156 | ||||||||||
| Credit fair value adjustment on loans purchased |
21,693 | 2,942 | — | — | — | |||||||||||||||
| Adjusted (Non-GAAP) allowance for loan losses |
$ | 35,746 | $ | 12,637 | $ | 6,017 | $ | 4,148 | $ | 2,156 | ||||||||||
37
Table of Contents
The accounting estimates for loan losses are subject to changing economic conditions. GAAP requires that expected credit losses associated with loans obtained in a merger or acquisition to be reflected at fair value as of each respective acquisition date and prohibits the carryover of the acquired entity’s allowance for loan losses. Accordingly, we believe that presentation of the adjusted (Non-GAAP) allowance for loan losses, consisting of the allowance for loan losses plus the credit fair value adjustment on loans purchased in merger and acquisition transactions, is useful for investors to understand the complete allowance that is recorded as a representation of future expected losses over the loan portfolio.
The following table presents the aggregate amount of non-accrual and past due loans and other real estate owned:
| As of December 31, | ||||||||||||||||||||
| 2010 | 2009 | 2008 | 2007 | 2006 | ||||||||||||||||
| (dollars in thousands) | ||||||||||||||||||||
| Non-accrual loans: |
||||||||||||||||||||
| Commercial: |
||||||||||||||||||||
| Industrial |
$ | 6,320 | $ | 2,646 | $ | 1,189 | $ | — | $ | — | ||||||||||
| Real estate |
2,426 | 464 | 85 | — | — | |||||||||||||||
| Construction |
6,011 | 298 | — | — | — | |||||||||||||||
| Consumer: |
||||||||||||||||||||
| Home equity line |
115 | — | 89 | — | — | |||||||||||||||
| Other |
66 | 242 | 3 | — | — | |||||||||||||||
| Residential mortgages |
2,784 | 1,068 | — | 87 | — | |||||||||||||||
| Total non-accrual loans |
17,722 | 4,718 | 1,366 | 87 | — | |||||||||||||||
| Accruing loans greater than 90 days past due: |
||||||||||||||||||||
| Commercial: |
— | |||||||||||||||||||
| Industrial |
— | 356 | — | — | ||||||||||||||||
| Real estate |
5 | 277 | — | — | ||||||||||||||||
| Construction |
— | — | — | — | ||||||||||||||||
| Consumer: |
— | |||||||||||||||||||
| Home equity line |
351 | 303 | — | — | ||||||||||||||||
| Other |
251 | 51 | 104 | — | ||||||||||||||||
| Residential mortgages |
818 | 1,119 | — | — | — | |||||||||||||||
| Total accruing loans greater than 90 days past due |
1,425 | 2,106 | 104 | — | — | |||||||||||||||
| Non-performing loans |
19,147 | 6,824 | 1,470 | 87 | — | |||||||||||||||
| Other real estate owned |
4,647 | 927 | — | — | — | |||||||||||||||
| Non-performing assets |
$ | 23,794 | $ | 7,751 | $ | 1,470 | $ | 87 | $ | — | ||||||||||
At December 31, 2010, the non-accrual loans totaled $17.7 million compared to $4.7 million at December 31, 2009. Excluding the non-accrual loans purchased through the FCEC Merger of $4.3 million, non-accrual loans equaled $13.4 million at December 31, 2010 compared to $4.7 million at December 31, 2009. When analyzing the non-accrual loans on an individual basis, the majority of this increase was due to one commercial relationship filing for Chapter 11 bankruptcy protection during the first quarter of 2010. The total loan relationship to this customer is $5.0 million as of December 31, 2010. The loan relationship was to be secured by pledges of loans and mortgages securing the loans extended by the customer to third parties; however, the customer is taking the position that the loan is unsecured because the security interest was not perfected. We have included this credit in our specific reserve analysis as described in the paragraph below and believe this specific reserve recorded is adequate based on current available information. The remaining increase is due to smaller commercial and mortgage loan relationships that have shown signs of possible impairment during the year, due to the current economic environment.
As of December 31, 2010, total impaired loans were $77.0 million. Included in impaired loans are loans on which we have stopped accruing interest in accordance with the loan accounting policy and impaired loans
38
Table of Contents
purchased as a result of the Graystone Merger, and the FCEC Merger. The Bank discontinues the accrual of interest on a loan when the contractual payment of principal or interest has become 90 days past due or we have serious doubts about further collectability of principal or interest, even though the loan is currently performing. The impaired loan balance includes $4.3 million of impaired loans acquired as part of the Graystone Merger and $55.0 million of impaired loans as part of the FCEC Merger, which were recorded at their individual fair values as determined based on our estimate of future cash flows. In order to reflect these purchased loans at fair value, the carrying value of these loans was reduced at the time of the FCEC Merger. The fair value mark for these impaired loans was $32.2 million at December 31, 2010.
For the remaining impaired loans, we performed an evaluation of expected future cash flows, including the anticipated cash flow from the sale of collateral. Based on these evaluations, we have determined that a reserve of $2.5 million is required against the impaired loans at December 31, 2010. This reserve relates to the loan relationship previously mentioned.
The Bank performed a detailed review of the non-performing loans and of their related collateral and believes the allowance for loan losses remains adequate for the level of risk inherent in the loan portfolio. It is the Bank’s policy that non-performing loans will remain classified as non-performing until such time that the loan becomes current on all principal and interest payments and remains current for a period of six months. Loans where the original terms have been modified are not considered to be performing until the borrower demonstrates their performance under the modified terms for a period of at least six months.
During 2009 and 2010, the banking industry experienced increasing defaults in mortgage loans coupled with decreasing values of real estate values as a result of an economic downturn. In addition, the prolonged economic downturn present throughout 2009 and continuing into 2010 has resulted in increased delinquencies in the loan portfolio. Through the loan approval process and diligent loan monitoring, the Bank has experienced a relatively low percentage of non-performing loans when compared to the total amount of loans.
Other real estate owned consists of twenty-two properties totaling $4.6 million at December 31, 2010. These properties have been through the foreclosure process and are currently in the process of being sold. These properties are recorded at their lower of cost or market value. Market value is based on the anticipated sales price less costs to sell for each respective property.
Noninterest Income and Expenses
2010 vs. 2009
Noninterest Income
In addition to our focus on increasing net interest income through growth of interest-earning assets and expansion in the net interest spread, we remain committed to increasing noninterest income as a way to improve profitability and diversify our sources of revenue. Net interest income as a percentage of net interest income plus noninterest income was 82.4% for the year ended December 31, 2010, compared to 80.6% for the year ended December 31, 2009.
The following table presents the components of noninterest income for the years ended December 31, 2010 and 2009. All dollar amounts are in thousands:
| December 31, 2010 |
December 31, 2009 |
Increase (Decrease) | ||||||||||||||
| $ | % | |||||||||||||||
| Service charges on deposit accounts |
$ | 3,232 | $ | 2,156 | $ | 1,076 | 49.9 | % | ||||||||
| Other service charges, commissions and fees |
2,920 | 2,131 | 789 | 37.0 | % | |||||||||||
| Gain on sale of mortgage loans originated for sale |
2,544 | 1,521 | 1,023 | 67.3 | % | |||||||||||
| Gain on sale of other interest earnings assets |
587 | 364 | 223 | 61.3 | % | |||||||||||
| Impairment losses on securities available for sale |
(206 | ) | (185 | ) | (21 | ) | 11.4 | % | ||||||||
| Income from bank owned life insurance |
1,524 | 1,034 | 490 | 47.4 | % | |||||||||||
| Other income |
1,091 | 1,622 | (531 | ) | (32.7 | )% | ||||||||||
| Total noninterest income |
$ | 11,692 | $ | 8,643 | $ | 3,049 | 35.3 | % | ||||||||
39
Table of Contents
The $3.0 million or 35.3% increase in total non-interest income is attributable to increases in service charges on deposit accounts, other service charges and fees, and income recognized on the cash surrender value of bank owned life insurance. The increase in services charges on deposit accounts and other services charges is due in part to a 42.8% increase in average deposits from 2009 to 2010. Income from bank owned life insurance increased as a result of the increase in the cash surrender value of life insurance contracts, which was positively impacted by the purchase of $12.0 million in bank owned life insurance during the second quarter of 2010.
Noninterest Expenses
The following table presents the components of noninterest expenses for the years ended December 31, 2010 and 2009. All dollar amounts are in thousands:
| December
31, 2010 |
December
31, 2009 |
Increase (Decrease) | ||||||||||||||
| $ | % | |||||||||||||||
| Salaries and employee benefits |
$ | 24,819 | $ | 15,841 | $ | 8,978 | 56.7 | % | ||||||||
| Occupancy and equipment |
7,883 | 5,479 | 2,404 | 43.9 | % | |||||||||||
| Amortization of intangible assets |
656 | 532 | 124 | 23.3 | % | |||||||||||
| FDIC insurance premiums |
2,652 | 1,747 | 905 | 51.8 | % | |||||||||||
| Advertising and promotion |
1,087 | 972 | 115 | 11.8 | % | |||||||||||
| Data processing |
2,518 | 2,050 | 468 | 22.8 | % | |||||||||||
| Communication |
1,137 | 709 | 428 | 60.4 | % | |||||||||||
| Professional service fees |
2,021 | 1,155 | 866 | 75.0 | % | |||||||||||
| Impairment on long-lived assets |
920 | — | 920 | n/a | ||||||||||||
| Other operating expenses |
5,479 | 3,242 | 2,237 | 69.0 | % | |||||||||||
| Restructuring charges |
2,920 | — | 2,920 | n/a | ||||||||||||
| Merger related expenses |
2,677 | 2,080 | 597 | 28.7 | % | |||||||||||
| Total noninterest expenses |
$ | 54,769 | $ | 33,807 | $ | 20,962 | 62.0 | % | ||||||||
Salary and employee benefits increased $9.0 million or 56.7%. Salaries increased by $7.0 million while employee benefits increased by $2.0 million. Salaries and employee benefits directly related to the Tower Bank Division branches acquired in the Graystone Merger contributed approximately $1.1 million to the increase in salary and benefit expenses for the first three months of 2010, while the salaries and employee benefits directly related to the 1N Bank Division branches acquired in the FCEC Merger contributed an additional $2.5 million in salary and benefit expenses from December 10, 2010 to December 31, 2010. Additionally, we continued to add additional personnel to our operations, finance, credit, and lending departments to support our growth. During 2010, we adopted a deferred compensation plan for certain executive officers in which we incurred approximately $368 thousand in additional benefit expenses. We also incurred general merit increases for all eligible employees between 2009 and 2010.
Occupancy and equipment expense increased $2.4 million or 43.9%. The increase was partially related to the additional expense attributable to the Tower Bank Division’s branches and 1N Bank Division branches which contributed $579 thousand and $635 thousand to occupancy and equipment expense, respectively. The remaining building and equipment expense increase related to the addition of branch offices opened in 2010 and the second corporate center building which we occupied during the fourth quarter of 2010.
On February 27, 2009, the FDIC announced that it was increasing federal deposit insurance premiums, beginning the second quarter of 2009, for all well managed, well capitalized banks to a range between 12 and 16 cents per $100 of insured deposits on an annual basis. At December 31, 2010, the Bank had approximately $1.875 billion in FDIC-insured deposits compared to $936.8 million at December 31, 2009.
Professional service expenses increased $866 thousand or 75.0% and data processing expense increased $468 thousand or 22.8%. These increases are directly related to increased audit, consulting and legal services, along with increased data processing costs given the rapid growth in the Bank, between December 31, 2009 and December 31, 2010.
40
Table of Contents
The impairment of fixed asset expense relates to undeveloped land that was acquired as part of the Graystone Merger. The impairment charge was based on a significant change in the fair value of the land between the time of the Graystone Merger at March 31, 2009 and the date of our evaluation during June 2010. We reviewed the property as of December 31, 2010 and determined no additional impairment had occurred.
Other operating expenses increased $2.2 million or 69.0%. The portion of the increase that can be attributed directly to the Tower Bank Division for the first three month of 2010 and the 1N Bank Division since the FCEC Merger on December 10, 2010 equaled $113 thousands and $273 thousand, respectively. The remaining increase was primarily due to increases in Pennsylvania bank shares taxes, credit report and appraisal fees, ATM/Debit fees, Pennsylvania uses/sales tax, and other real estate owned expenses of $614 thousand, $337 thousand, $145 thousand, $57 thousand, and $113 thousand, respectively, offset by decline in other expenses related to the early retirement of debt of $119 thousand during 2009.
Restructuring charges of $2.9 million included $1.5 million related to the termination of an agreement with DDMP Advisors LLC, an investment advisory firm in which the Bank maintained a 20% equity interest and $1.4 million related to costs incurred as part of the wind down of the operations of the AHB Division acquired in the FCEC Merger.
Merger related expenses increased $597 thousand or 28.7% from $2.1 million in 2009 to $2.7 million in 2010. This increase in expenses was primarily due to additional outside service provider costs, including legal, consulting and audit services, required to complete the FCEC Merger.
2009 vs. 2008
Noninterest Income
The following table presents the components of noninterest income for the years ended December 31, 2009 and 2008. All dollar amounts are in thousands:
| December
31, 2009 |
December
31, 2008 |
Increase (Decrease) | ||||||||||||||
| $ | % | |||||||||||||||
| Service charges on deposit accounts |
$ | 2,156 | $ | 809 | $ | 1,347 | 166.5 | % | ||||||||
| Other service charges, commissions and fees |
2,131 | 792 | 1,339 | 169.1 | % | |||||||||||
| Gain on sale of mortgage loans originated for sale |
1,521 | 528 | 993 | 188.1 | % | |||||||||||
| Gain on sale of other interest earnings assets |
364 | 240 | 124 | 51.7 | % | |||||||||||
| Impairment losses on securities available for sale |
(185 | ) | — | (185 | ) | n/a | ||||||||||
| Income from bank owned life insurance |
1,034 | 305 | 729 | 239.0 | % | |||||||||||
| Other income |
1,622 | 415 | 1,207 | 290.8 | % | |||||||||||
| Total noninterest income |
$ | 8,643 | $ | 3,089 | $ | 5,554 | 179.8 | % | ||||||||
As a result of the Graystone Merger, service charges on deposit accounts directly related to the Tower Bank Division’s branches contributed $1.3 million to the overall change in service charges on deposit accounts. The majority of the increase in the other service charges, commissions and fees relates to debit card fees and trust services income which grew by $736 thousand and $424 thousand, respectively, during 2009 when compared to 2008. The increase in gains on sale of mortgage loans is the direct result of increased volume of loans sold into the secondary market at the Graystone Mortgage, LLC, which has benefited from the increased residential refinancing that occurred during 2009. The increase in income from bank owned life insurance (“BOLI”) is partially due to the addition of bank owned life insurance as a result of the Graystone Merger which added $377 thousand. The remaining increase in BOLI income can be attributed to BOLI contracts only held for two full quarters during 2008 compared to 2009 when the BOLI contracts were outstanding for the entire year. Finally,
41
Table of Contents
the increase in other income of $1.2 million relates to gains recognized in connection with the satisfaction of purchased impaired loans of approximately $681 thousand and other miscellaneous items. At the time of the Graystone Merger, the Bank discounted the carrying value of loans considered impaired to fair value based on anticipated future cash flow projections. During the fourth quarter of 2009, the Bank realized nearly the full carrying value of two purchased impaired loans due to a refinancing with a third party institution and a sale of collateral by the borrower in an amount to satisfy their obligation with the Bank.
Noninterest Expenses
The following table presents the components of noninterest expenses for the years December 31, 2009 and 2008. All dollar amounts are in thousands:
| December
31, 2009 |
December
31, 2008 |
Increase (Decrease) | ||||||||||||||
| $ | % | |||||||||||||||
| Salaries and employee benefits |
$ | 15,841 | $ | 8,100 | $ | 7,741 | 95.6 | % | ||||||||
| Occupancy and equipment |
5,479 | 2,356 | 3,123 | 132.6 | % | |||||||||||
| Amortization of intangible assets |
532 | — | 532 | n/a | ||||||||||||
| FDIC insurance premiums |
1,747 | 278 | 1,469 | 528.4 | % | |||||||||||
| Advertising and promotion |
972 | 369 | 603 | 163.4 | % | |||||||||||
| Data processing |
2,050 | 654 | 1,396 | 213.5 | % | |||||||||||
| Communication |
709 | 249 | 460 | 184.7 | % | |||||||||||
| Professional service fees |
1,155 | 518 | 637 | 123.0 | % | |||||||||||
| Other operating expenses |
3,242 | 1,279 | 1,963 | 153.5 | % | |||||||||||
| Merger related expenses |
2,080 | — | 2,080 | n/a | ||||||||||||
| Total noninterest expenses |
$ | 33,807 | $ | 13,803 | $ | 20,004 | 144.9 | % | ||||||||
Salary and employee benefits increased $7.7 million or 95.6%. Salaries increased by $6.4 million while employee benefits increased by $1.3 million. As a result of the Graystone Merger, salaries and employee benefits directly related to Tower Bank Division’s branches for 2009 contributed approximately $2.8 million to the increase in salary and benefit expenses. The remaining increased level of salary expense was driven by personnel costs in connection with the opening of 5 branches throughout Central Pennsylvania during the second half of 2008 and 2009. In addition, we continued to add experienced commercial lending personnel and deepen the back office operations staffing to support growth. We also incurred general merit increases for all eligible employees during March 2009.
Occupancy and equipment expense increased $3.1 million or 132.6%. The increase was partially related to the additional expense attributable to the Tower Bank Division’s branches which contributed $1.3 million to occupancy and equipment expense. The remaining building and equipment expense increase related to the additional branch offices opened and the lease of the corporate operations center office space during the third quarter of 2009.
The amortization of intangible assets relates to the amortization of the core deposit intangible asset recognized as a result of the Graystone Merger.
The FDIC imposed a special assessment on all FDIC-insured banks based on total assets and Tier 1 capital as of June 30, 2009. FDIC-insured institutions that were subject to the special assessment accrued the liability in their second quarter results (i.e. the quarter ending June 30, 2009 for calendar year end companies). The Bank expensed $580 thousand for the special FDIC assessment during 2009. The FDIC had and continues to have the authority to impose additional emergency assessments on all FDIC-insured banks if it estimates the reserve ratio of the Deposit Insurance Fund will fall to a level that it believes would adversely affect public confidence or a level which would be close to zero or negative at the end of a calendar quarter. At this time, we cannot estimate the probability of this event; however, any additional FDIC assessment and/or premium would be adverse to
42
Table of Contents
future earnings. This special assessment accounts for a portion of the change in the FDIC insurance premiums expense for 2009 compared to 2008 with the remaining increase due to increases in regular quarterly premiums and growth on our FDIC-insured deposits. On February 27, 2009, the FDIC announced that it was increasing federal deposit insurance premiums, beginning the second quarter of 2009, for all well managed, well capitalized banks to a range between 12 and 16 cents per $100 of insured deposits on an annual basis. At December 31, 2009, the Bank had approximately $936.9 million in FDIC-insured deposits.
Data processing expense increased $1.4 million or 213.5%. This increase is directly related to increased data processing costs given the rapid growth in the Bank between December 31, 2008 and December 31, 2009.
Other operating expenses increased $2.0 million or 153.5%. The portion of the increase that can be attributed directly to the Tower Bank Division’s branches equaled $359 thousand for 2009. The remaining increase was primarily due to increases in supplies, directors’ fees, travel expenses, other state taxes and fees, and debt extinguishment charges of $290 thousand, $288 thousand, $237 thousand, $252 thousand and $119 thousand, respectively. The debt extinguishment charge relates to the debt fair value discount recognized on the FHLB borrowings obtained through the Graystone Merger that had subsequently been paid-off during the second quarter of 2009. Additionally, we recognized $158 thousand of expenses and losses related to the maintenance and sales of properties classified as other real estate owned compared to no such related expenses in 2008.
The merger related expenses recognized during 2009 consist of $1.8 million associated with the Graystone Merger and $244 thousand associated with the FCEC Merger. We recognized no merger related expenses during 2008 as the prevailing accounting literature permitted the deferral and capitalization of these expenses. During 2009, the authoritative accounting literature changed, requiring that all expenses incurred in association with merger and acquisition related activities be expensed as incurred.
Income Taxes
Income tax expense was $1.2 million, $1.8 million, and $333 thousand for the years ended December 31, 2010, 2009 and 2008, respectively. The effective tax rate for the year ended December 31, 2010 was 48.1%. The effective tax rate was negatively impacted by non-deductible expenses incurred as a result of the FCEC Merger and the increase in the deferred tax asset valuation allowance to recognize our expected inability to offset the capital loss generated by the write-off of our investment in DDMP Advisors, LLC with future capital gains. The effective tax rate was 33.0% for the year ended December 31, 2009. The statutory tax rate was 34% for 2010, 2009 and 2008.
For additional information regarding income taxes, see Note 14, “Income Taxes”, in the Notes to Consolidated Financial Statements.
FINANCIAL CONDITION
Total Assets
Total assets increased by $1.276 billion, or 86.8%, to $2.747 billion at December 31, 2010 as compared to $1.471 billion at December 31, 2009. The increase includes $1.137 billion of assets received in connection with the FCEC Merger on December 10, 2010. Excluding the assets acquired in the FCEC Merger, the total assets grew by approximately $198.4 million or 13.5% between December 31, 2009 and December 31, 2010.
Loans
Our total gross loans grew by $1.073 billion, or 93.6%, to $2.219 billion at December 31, 2010. The increase includes $890.5 million of loans acquired as part of the FCEC Merger on December 10, 2010. Excluding the fair value of loans acquired in the FCEC Merger, gross loans grew by approximately $181.9 million or 15.7% since December 31, 2009. Loans are divided into two portfolios, loans held as investment and loans held for sale.
43
Table of Contents
Loans held as investment
Total gross loans held as investment increased by $934.0 million or 82.1% during 2010. The increase includes $715.0 million acquired as part of the FCEC Merger. Excluding the loans acquired, gross loans held as investment grew $218.7 million or 19.2%. This increase in gross loans includes new loan originations and loan participations totaling $355.0 million. These increases were partially offset by a net decrease in existing loan balances of $147.0 million and the elimination of the First Chester loan of $26.0 million on the date of acquisition. We believe that there continues to be strong demand for commercial and consumer loans to credit qualified businesses and individuals within the Bank’s market areas, which we anticipate will result in continued loan growth during 2011.
The table below is the detail of the loans, held as investment balances, net of unearned income and allowance for loan losses, for the past five years.
| At December 31, | ||||||||||||||||||||
| 2010 | 2009 | 2008 | 2007 | 2006 | ||||||||||||||||
| (dollars in thousands) | ||||||||||||||||||||
| Commercial |
||||||||||||||||||||
| Industrial |
$ | 921,603 | $ | 599,708 | $ | 367,107 | $ | 274,320 | $ | 131,313 | ||||||||||
| Real estate |
441,532 | 159,947 | 64,301 | 38,263 | 19,498 | |||||||||||||||
| Construction |
179,983 | 102,018 | 77,336 | 44,297 | 9,234 | |||||||||||||||
| Consumer |
||||||||||||||||||||
| Home equity line |
196,498 | 49,239 | 27,906 | 14,815 | 11,585 | |||||||||||||||
| Other |
52,412 | 36,271 | 26,178 | 16,400 | 664 | |||||||||||||||
| Residential mortgages |
280,154 | 191,277 | 5,124 | 1,857 | 220 | |||||||||||||||
| Total Loans |
2,072,182 | 1,138,460 | 567,952 | 389,952 | 172,514 | |||||||||||||||
| Deferred costs (fees) |
62 | (189 | ) | (229 | ) | (24 | ) | 5 | ||||||||||||
| Allowance for loan losses |
(14,053 | ) | (9,695 | ) | (6,017 | ) | (4,148 | ) | (2,156 | ) | ||||||||||
| Net Loans |
$ | 2,058,191 | $ | 1,128,576 | $ | 561,706 | $ | 385,780 | $ | 170,363 | ||||||||||
The commercial loan portfolio continues to be the largest component of loan portfolio, representing 74.5% and 75.7% of total loans at December 31, 2010 and 2009, respectively. In addition, the Bank has $216.9 million in loan participations without recourse sold to unaffiliated banks through December 31, 2010, where the Bank maintains the servicing rights with these relationships. In total, the Bank is participating in 44 loans purchased from unaffiliated banks, totaling $42.1 million as of December 31, 2010. The borrowers on these loans are in-market customers. The Bank has not experienced any losses due to nonperformance of purchased loan participations. Additionally, we have not participated in any shared national credit programs and we do not have any shared national credits in the loan portfolio. We expect to recognize continued loan growth as we focus on serving the credit needs of the market areas, while exercising prudent underwriting standards considering the economic uncertainties that are expected to continue. However, due to continued uncertain economic conditions resulting in lower levels of loan demand, loan growth may be slower than historically experienced.
Loans, held for sale
Loans originated and intended for sale in the secondary market are primarily residential mortgage loans originated through the Bank’s residential mortgage company subsidiaries, Graystone Mortgage, LLC and the acquired AHB Division. Loans held for sale increased $139.3 million from $8.0 million at December 31, 2009 to $147.3 million at December 31, 2010. The increase is primarily the result of the loans acquired from the AHB Division. Excluding loans from the AHB Division, total loans held for sale increased $2.4 million or 30.5%. The balance of loans held for sale is expected to decrease over the year as we wind down the operations of the AHB Division.
44
Table of Contents
The following is a summary of the lending activities based on the Bank’s current loan portfolio
Lending Activities
The Bank’s principal lending activity has been the origination of business and commercial real estate loans, commercial and industrial loans, and personal consumer loans to customers located within the primary market areas. The Bank generally releases the servicing rights on residential mortgage loans that it sells which results in additional gains on sale. The Bank also originates and retains various types of home equity and consumer loan products in its loan portfolio.
Commercial Lending
The Bank’s commercial loan portfolio includes business term loans and lines of credit issued to small and medium size companies in the market areas, some of which are secured in part by additional owner occupied real estate. Additionally, the Bank makes secured and unsecured commercial loans and extends lines of credit for the purpose of financing equipment purchases, inventory, business expansion, working capital, and other general business purposes. The terms of these loans generally range from less than 1 year to 7 years with a maximum interest rate term to not exceed 10 years and amortization periods not to exceed 25 years, carrying a fixed interest rate or a variable interest rate indexed to LIBOR or prime rate. It is the Bank’s standard practice to issue lines of credit due on demand, accruing interest at a variable interest rate indexed to either LIBOR or prime rate.
The Bank originates commercial real estate loans secured predominantly by first liens on apartment complexes, office buildings, lodging facilities and industrial and warehouse properties. The maximum term that the Bank offers for commercial real estate loans is generally not more than 10 years, with a payment schedule based on not more than a 25-year amortization schedule and a maximum loan-to-value of 80%. The current policy with regard to these loans is to minimize the risk by emphasizing diversification of these property types.
Additionally, the Bank offers construction and land development financing secured by the corresponding real estate and other collateral as necessary to meet the underwriting standards. Terms for construction and land development financing vary based on the depth of the project usually requiring a maximum loan-to-value ratio of 65% to 80% and a term typically ranging from 12 to 36 months. The construction/development loan application process includes the same criteria which are required for the permanent commercial mortgage loans, as well as a submission of completed plans, specifications, and cost estimates related to the proposed construction. The Bank uses these items in addition to an independent outside appraisal ordered from our approved appraisal list to determine the value of the subject property. The appraisal is an important component because construction loans involve additional risks related to advancing loan funds upon the security of the project under construction, which is of uncertain value prior to the completion of construction and subsequent pro-forma lease-up. Additional underwriting considerations for these projects include but are not limited to, market analysis, the borrower’s debt service capacity during the project, environmental evaluations, and pre-sale activity.
Residential Real Estate Lending
The majority of the residential mortgage loans on our balance sheet have been acquired through the Graystone Merger and the FCEC Merger. The Bank originates mortgage loans through its subsidiary, Graystone Mortgage, LLC (“Mortgage Company”) and the acquired AHB Division, to enable the Bank’s customers to finance residential real estate, both owner occupied and non-owner occupied, in the primary market areas. The Bank generally offers traditional fixed-rate and adjustable-rate mortgage (“ARM”) products, with monthly payment options, that have maturities up to 30 years, and maximum loan amounts generally up to $750 thousand.
The Mortgage Company and AHB Division generally sell newly originated conventional 15 to 30 year fixed-rate loans as well as FHA and VA loans in the secondary market to wholesale lenders. The LTV requirements for residential real estate loans vary depending on the secondary market investor. Loans with LTVs in excess of 80%
45
Table of Contents
are required to carry private mortgage insurance. The Mortgage Company and AHB Division generally originate loans that meet accepted secondary market underwriting standards.
Home Equity Lending
The Bank offers fixed-rate, fixed-term, monthly home equity loans, and prime-based home equity lines of credit (“HELOCs”) in the Bank’s market areas. The Bank offers both fixed-rate and floating-rate home equity products in amounts up to 85% of the appraised value of the property (including the first mortgage) with a maximum loan amount generally up to $1 million. The Bank offers monthly fixed-rate home equity loans and HELOCs with repayment terms generally up to 15 years. The minimum line of credit is $10 thousand and the maximum generally up to $1 million with exceptions as approved.
Consumer Loans
The Bank offers a variety of fixed-rate installment and variable rate line-of-credit consumer loans, including direct automobile loans as well as personal secured and unsecured loans. Terms of these loans range from 6 months to 72 months and generally do not exceed $50 thousand. Secured loans are collateralized by vehicles, savings accounts, or certificates of deposit.
Securities Available for Sale
The following table presents the amortized cost and fair value of investment securities for the past three years.
| December 31, 2010 | December 31, 2009 | December 31, 2008 | ||||||||||||||||||||||
| (dollars in thousands) | ||||||||||||||||||||||||
| Amortized Cost |
Fair Value |
Amortized Cost |
Fair Value |
Amortized Cost |
Fair Value |
|||||||||||||||||||
| Equity securities |
$ | 195 | $ | 195 | $ | 1,156 | $ | 1,132 | $ | — | $ | — | ||||||||||||
| U.S Treasury securities |
5,000 | 5,002 | — | — | — | — | ||||||||||||||||||
| U.S Government sponsored agency securities |
7,771 | 7,780 | 56,437 | 56,384 | 18,402 | 18,605 | ||||||||||||||||||
| U.S. Government sponsored agency mortgage-backed securities |
10,787 | 10,754 | 9,109 | 9,116 | — | — | ||||||||||||||||||
| U.S. Government sponsored agency collateralized mortgage obligations |
48,018 | 48,587 | 93,058 | 92,485 | — | — | ||||||||||||||||||
| Municipal bonds |
10,641 | 10,654 | 7,093 | 7,188 | 1,279 | 1,299 | ||||||||||||||||||
| Municipal bonds - taxable |
10,341 | 10,014 | 12,917 | 12,910 | — | — | ||||||||||||||||||
| SBA pool loan investments |
9,557 | 9,709 | 10,710 | 10,638 | — | — | ||||||||||||||||||
| Total securities available for sale |
$ | 102,310 | $ | 102,695 | $ | 190,480 | $ | 189,853 | $ | 19,681 | $ | 19,904 | ||||||||||||
At December 31, 2010, total available for sale securities were $102.7 million, a decrease of $87.2 million from total available for sale securities of $189.9 million at December 31, 2009. As a result of the FCEC Merger, we acquired available for sale securities with a fair value balance of $44.7 million. These securities included $44.5 million of debt securities and $169 thousand of equities, with the equities consisting of investments in other financial institutions. Upon completion of the FCEC Merger, we sold a majority of the securities to realign the holdings with our overall investment strategy and investment policies.
We recorded the sale, maturity or call of securities valued at approximately $167.5 million from the investment portfolio resulting in a net gain on sale of securities of $578 thousand for the year ended December 31, 2010. During 2010, we identified equity securities with unrealized losses that were deemed to be other than temporary in nature and, as a result recognized an impairment charge of $206 thousand.
46
Table of Contents
Bank-owned Life Insurance
At December 31, 2010, the total cash surrender value of the bank-owned life insurance (“BOLI”) was $39.7 million. We purchased an additional $12.0 million of BOLI during the second quarter of 2010 and acquired $1.5 million as a result of the FCEC Merger. The BOLI was purchased as a means to offset a portion of current and future employee benefit costs. The Bank’s deposits and proceeds from the sale of investment securities were used to fund the BOLI. Earnings from the BOLI are recognized as other income and are treated as tax-exempt earnings. The BOLI is profitable from the appreciation of the cash surrender value of the pool of insurance, and its tax advantage.
Deposits
Total deposits at December 31, 2010 were $2.3 billion, an increase of $1.1 billion from total deposits of $1.2 billion at December 31, 2009. The increase includes $987.3 million of deposits assumed as part of the FCEC Merger. Excluding the deposits assumed in the FCEC Merger, the total deposits grew by approximately $96.2 million or 7.9% between December 31, 2009 and December 31, 2010.
The table below displays the increases in deposits by type at December 31, 2010 as compared to December 31, 2009.
| December 30, 2010 | December 31, 2009 | Increase/Decrease | ||||||||||||||||||||||
| Amount | % | Amount | % | Amount | % | |||||||||||||||||||
| Non-interest bearing transaction accounts |
$ | 301,210 | 13.1 | % | $ | 119,116 | 9.8 | % | $ | 182,094 | 152.9 | % | ||||||||||||
| Interest checking accounts |
305,701 | 13.3 | % | 110,356 | 9.1 | % | 195,345 | 177.0 | % | |||||||||||||||
| Money market accounts |
651,760 | 28.3 | % | 477,292 | 39.2 | % | 174,468 | 36.6 | % | |||||||||||||||
| Savings accounts |
160,305 | 7.0 | % | 87,117 | 7.1 | % | 73,188 | 84.0 | % | |||||||||||||||
| Time deposits of $100,000 or greater |
354,028 | 15.4 | % | 130,938 | 10.8 | % | 223,090 | 170.4 | % | |||||||||||||||
| Time deposits, other |
526,894 | 22.9 | % | 291,650 | 24.0 | % | 235,244 | 80.7 | % | |||||||||||||||
| Total deposits |
$ | 2,299,898 | 100.0 | % | $ | 1,216,469 | 100.0 | % | $ | 1,083,429 | 89.1 | % | ||||||||||||
The Bank continues to manage the size, mix, and cost of the deposit portfolio with the goal of lowering current deposit costs and positioning the cost of the portfolio in the future. In-market non-maturity deposits have increased by $579.2 million between December 31, 2009 and December 31, 2010. In-market time deposits increased $406.5 million between December 31, 2009 and December 31, 2010. Excluding those deposits assumed in the FCEC Merger, in-market non-maturity deposits and in-market time deposit increased $28.0 million and $7.1 million, respectively. We realized a decrease of 60 basis points in the weighted average rate of in-market deposits between December 31, 2009 and December 31, 2010.
The Bank uses various brokered deposit products as tools to manage deposit costs, interest rate risk, and the mix of deposits. The In-market non-maturity deposit accounts include $69.0 million and $23.1 million of brokered deposits at December 31, 2010 and 2009, respectively. The brokered money market products are indexed to the one-month LIBOR and provide an effective funding source for LIBOR-indexed lending. The time deposits include $125.4 million and $38.0 million of brokered certificates of deposit at December 31, 2010 and 2009, respectively. The increase in brokered certificates of deposits includes $43.6 million that were acquired as part of the FCEC Merger. The total brokered time deposits include reciprocal brokered time deposits of $49.9 million and $15.1 million at December 31, 2010 and 2009, respectively. Reciprocal brokered time deposits are deposits that have been placed into a deposit placement service which allows us to place our customers’ funds in FDIC-insured time deposits at other banks and at the same time, receive an equal sum of funds from customers of other banks within the deposit placement service. Overall, total brokered deposits increased to $194.4 million or approximately 8.5 % of the total deposits at December 31, 2010 as compared to $61.1 million or 5.0% of total deposits at December 31, 2009. Total brokered deposits, exclusive of reciprocal deposits, represented 6.3% and 3.8% of total deposits at December 31, 2010 and 2009, respectively. Though brokered deposits exclusive of
47
Table of Contents
reciprocal deposits are currently less than 10.0% of total deposit, any significant unforeseen changes to the deposit portfolio could cause the brokered deposits to exceed 10.0%, exposing us to additional FDIC assessment fees.
Money market deposits at December 31, 2010 increased by $174.5 million or 36.6% from December 31, 2009 as a result of an increase in in-market growth of $15.7 million, brokered money market deposits of $47.8 million and accounts assumed in the FCEC Merger of $110.9 million. Time deposit balances at December 31, 2010 increased by $458.3 million or 108.5% from December 31, 2009. This net increase reflected $436.1 million assumed in the FCEC Merger, an increase of $43.8 million of out-of-market brokered deposits, and an increase of $7.1 million of in-market time deposit in the Bank’s portfolio. We realized a decrease of 60 basis points in the weighted average rate of time deposits between December 31, 2009 and December 31, 2010. Time deposits represent 38.3% of total deposits at December 31, 2010 compared to 34.8% of total deposits at December 31, 2009.
During 2010, the Bank reduced the interest rate paid on certain savings products to better align the pricing strategies of non-maturity deposit products. As a result of the pricing changes, a portion of the balances in the savings product shifted to the money market products.
The following table presents the maturity of time deposits in denominations of $100 thousand or greater as of December 31, 2010.
| December 31, 2010 | ||||
| (dollars in thousands) | ||||
| Less than three months |
$ | 71,294 | ||
| Over three months to six months |
56,157 | |||
| Over six months to twelve months |
57,376 | |||
| Over twelve months |
169,201 | |||
| Total |
$ | 354,028 | ||
The average balances and weighted average rates paid on deposits for the years ended December 31, 2010, 2009 and 2008 are presented in the table below:
| December 31, 2010 | December 31, 2009 | December 31, 2008 | ||||||||||||||||||||||
| (dollars in thousands) | ||||||||||||||||||||||||
| Average Balance |
Average Rate |
Average Balance |
Average Rate |
Average Balance |
Average Rate |
|||||||||||||||||||
| Non-interest bearing transaction accounts |
$ | 128,360 | N/A | $ | 83,362 | N/A | $ | 32,610 | N/A | |||||||||||||||
| Interest checking accounts |
127,291 | 0.39 | % | 71,722 | 0.55 | % | 23,415 | 1.31 | % | |||||||||||||||
| Money market accounts |
567,296 | 1.25 | % | 341,585 | 1.73 | % | 77,364 | 2.63 | % | |||||||||||||||
| Savings accounts |
84,528 | 0.49 | % | 90,691 | 1.50 | % | 29,259 | 2.82 | % | |||||||||||||||
| Time deposits, other |
453,069 | 2.22 | % | 365,623 | 2.82 | % | 276,821 | 4.31 | % | |||||||||||||||
| Total |
$ | 1,360,544 | 1.33 | % | $ | 952,983 | 1.88 | % | $ | 439,469 | 3.44 | % | ||||||||||||
As reflected above, we have decreased the average rate on the total deposits by 55 basis points between the 2009 and 2010. Although we operate in a very competitive environment for deposits, we have been able to grow the deposits from an average of $953.0 million to $1.4 billion between December 31, 2009 and December 31, 2010 as a result of both organic and acquisition-related growth.
48
Table of Contents
Short-Term Borrowings and Long-Term Debt
| As of or for the Year ended December 31, |
||||||||||||
| (dollars in thousands) | ||||||||||||
| 2010 | 2009 | 2008 | ||||||||||
| Period-end balance: |
||||||||||||
| Federal Home Loan Bank borrowings (1) |
$ | 103,702 | $ | 59,251 | $ | 39,000 | ||||||
| Securities sold under agreement of repurchase |
6,605 | 6,892 | 8,384 | |||||||||
| Lines of credit |
— | — | 4,614 | |||||||||
| Subordinated notes |
21,000 | 9,000 | — | |||||||||
| Federal funds purchased |
— | — | — | |||||||||
| Capital lease obligation |
2,685 | 2,729 | — | |||||||||
| Junior subordinated debentures (1) |
15,452 | — | — | |||||||||
| Total borrowings |
$ | 149,444 | $ | 77,872 | $ | 51,998 | ||||||
| Maximum balance at any month end: |
||||||||||||
| Federal Home Loan Bank borrowings |
$ | 103,702 | $ | 60,914 | $ | 39,000 | ||||||
| Securities sold under agreement of repurchase |
7,102 | 9,698 | 33,575 | |||||||||
| Lines of credit |
— | 11,064 | 4,614 | |||||||||
| Subordinated notes |
21,000 | 9,000 | — | |||||||||
| Federal funds purchased |
— | — | — | |||||||||
| Capital lease obligation |
2,729 | 2,729 | — | |||||||||
| Junior subordinated notes |
15,452 | — | — | |||||||||
| Average balance for the year ended: |
||||||||||||
| Federal Home Loan Bank borrowings |
$ | 57,366 | $ | 52,823 | $ | 26,075 | ||||||
| Securities sold under agreement of repurchase |
5,483 | 7,486 | 20,123 | |||||||||
| Lines of credit |
— | 2,879 | 4,507 | |||||||||
| Subordinated notes |
19,586 | 4,875 | — | |||||||||
| Federal funds purchased |
64 | 120 | 451 | |||||||||
| Capital lease obligation |
2,704 | 227 | — | |||||||||
| Junior subordinated debentures |
889 | — | — | |||||||||
| Weighted average interest rate for the year ended: |
||||||||||||
| Federal Home Loan Bank borrowings |
3.88 | % | 3.80 | % | 3.17 | % | ||||||
| Securities sold under agreement of repurchase |
0.51 | % | 0.52 | % | 1.70 | % | ||||||
| Lines of credit |
— | 7.61 | % | 4.62 | % | |||||||
| Subordinated notes |
9.23 | % | 9.52 | % | — | |||||||
| Federal funds purchased |
1.00 | % | 1.66 | % | 2.35 | % | ||||||
| Capital lease obligation |
8.99 | % | 4.84 | % | — | |||||||
| Junior subordinated debentures |
9.22 | % | — | — | ||||||||
(1) The balance of Federal Home Loan Bank (FHLB) borrowings and junior subordinated debentures includes the fair value mark on borrowing acquired as part of the Graystone Merger and the FCEC Merger. The fair value mark on the FHLB borrowing as of December 31, 2010 and 2009 was $(383) thousand and $94 thousand, respectively. The fair value mark on the junior subordinated debentures as of December 31, 2010 was $(5.3) million.
Short-term borrowings increased by $49.7 million to $55.0 million at December 31, 2010 from $5.3 million at December 31, 2009. The increase in short-term borrowings was due to an advance of $50.0 million from the FHLB and the reclassification of FHLB advances from long-term debt to short-term borrowings of $5.0 million offset by the maturity of FHLB advances of $5.3 million during the third quarter of 2010. The advance of $50.0 million from FHLB was used to repay the FHLB advance assumed as part of the FCEC Merger. This advance
49
Table of Contents
was scheduled to mature in January 2011. At December 31, 2009 and December 31, 2010, short-term borrowings consisted of advances from the Federal Home Loan Bank of Pittsburgh and current obligations under capital leases. Advances from the Federal Home Loan Bank of Pittsburgh totaled $55.0 million and $5.3 million as of December 31, 2010 and 2009, respectively. The current obligation under capital leases was $39 thousand and $42 thousand as of December 31, 2010 and 2009, respectively.
Long-term debt increased by $22.1 million to $87.8 million at December 31, 2010 compared to $65.7 million at December 31, 2009. The increase in long-term debt was caused by the issuance of $12.0 million in subordinated debt during February 2010, and long-term debt assumed as part of the FCEC Merger of $15.5 million offset by the reclassification of FHLB Advances to short-term borrowings. Debt assumed as part of the FCEC Merger consists of junior subordinated debentures held by unconsolidated trust entities of $20.8 million, offset by a purchase discount of $5.3 million. At December 31, 2010, long-term debt consisted of $48.7 million in advances from the FHLB that had a maturity of greater than one year, $21.0 million of subordinated debt, $15.5 million of junior subordinated debentures held in trusts and $2.6 million in obligations under capital leases. The total average rate incurred on borrowings and securities sold under agreement to repurchase during the 2010 was 4.76% compared to an average rate of 3.62% during 2009.
Contractual Obligations and Other Commitments
The following table indicates certain of the funding obligations by time remaining until maturity as of December 31, 2010 as follows:
| (dollars in thousands) | ||||||||||||||||||||
| Less than 1 year |
Over 1 to 3 years |
Over 3 to 5 years |
Over 5 years |
Total | ||||||||||||||||
| Time deposits |
$ | 418,926 | $ | 258,152 | $ | 186,079 | $ | 13,013 | $ | 876,170 | ||||||||||
| Securities sold under agreement to repurchase |
6,605 | — | — | — | 6,605 | |||||||||||||||
| FHLB borrowings |
55,000 | 5,000 | — | 44,085 | 104,085 | |||||||||||||||
| Subordinated debt |
— | 9,000 | 12,000 | — | 21,000 | |||||||||||||||
| Commitments to grant loans (1) |
58,969 | — | — | — | 58,969 | |||||||||||||||
| Unfunded commitments on lines of credit (1) |
399,647 | — | — | — | 399,647 | |||||||||||||||
| Letters of credit (1) |
58,200 | — | — | — | 58,200 | |||||||||||||||
| Junior subordinated debt |
— | — | — | 20,795 | 20,795 | |||||||||||||||
| Operating leases |
3,835 | 7,804 | 6,570 | 21,109 | 39,318 | |||||||||||||||
| Capital leases |
279 | 587 | 620 | 3,798 | 5,284 | |||||||||||||||
| Total contractual obligations |
$ | 1,001,461 | $ | 280,543 | $ | 205,269 | $ | 102,800 | $ | 1,590,073 | ||||||||||
(1) - We do not expect all of the commitments and letters of credit to be fully funded. The total commitment amount related to these contractual obligations does not necessarily represent to the future cash requirements.
Stockholders’ Equity
Total stockholders’ equity increased $92.7 million or 56.6%, from $163.9 million at December 31, 2009 to $256.6 million at December 31, 2010. The increase was due to equity received in the FCEC Merger of $49.8 million, and a common stock offering in which we received net proceeds of $48.1 million offset by increases in the accumulated deficit of $6.8 million. The increase of $49.8 million related to the FCEC Merger included the addition of approximately $45.1 million in net assets and $4.7 million of goodwill. We contributed $21.0 million in additional capital to the Bank out of the net proceeds received from a common stock offering and issuance of subordinated debt. The remaining net proceeds were used to pay other operating expenses. The increase in accumulated comprehensive income is attributed to the unrealized gains on available for sales securities. The increase in the accumulated deficit is due to the declaration of dividends of $8.0 million offset by the net income of $1.2 million.
50
Table of Contents
Regulatory Capital
We are subject to various regulatory capital requirements administered by banking regulators. Failure to meet minimum capital requirements can initiate certain actions by regulators that could have a material effect on the consolidated financial statements. The regulations require that banks maintain minimum amounts and ratios of total and Tier I capital (as defined in the regulations) to risk weighted assets (as defined), and Tier I capital to average assets (as defined). As of December 31, 2010, we met the minimum requirements. In addition, our capital ratios exceeded the amounts required to be considered “well capitalized” as defined in the regulations.
On June 12, 2009, we issued, to private investors, $9 million of subordinated notes bearing an annual interest rate of 9.00%. On February 5, 2010, we issued an additional $12.0 million in subordinated notes bearing annual interest of 9.00%. Each note may be redeemed at our discretion and contains a maturity date of July 1, 2014. We contributed the net proceeds of $17.0 million from the sale of the notes to the Bank, as Tier 1 capital to support the Bank’s continued growth, including ongoing lending activities in its local markets. The Notes are intended to qualify as Tier 2 capital for regulatory purposes, to the extent permitted. In accordance with applicable regulatory treatment one-fifth of the original principal amount of the Notes will be excluded each year from Tier 2 capital during the last five years prior to maturity.
The following table summarizes the Bank and the Company’s regulatory capital ratios in comparison to regulatory requirements:
| December 31, 2010 |
December 31, 2009 |
Minimum Capital Adequacy |
||||||||||
| Graystone Tower Bank |
||||||||||||
| Total Capital (to Risk Weighted Assets) |
11.79 | % | 14.43 | % | 8.00 | % | ||||||
| Tier I Capital (to Risk Weighted Assets) |
11.10 | % | 13.58 | % | 4.00 | % | ||||||
| Tier I Capital (to Average Total Assets) |
12.57 | % | 11.13 | % | 4.00 | % | ||||||
| December 31, 2010 |
December 31, 2009 |
Minimum Capital Adequacy |
||||||||||
| Tower Bancorp, Inc. |
||||||||||||
| Total Capital (to Risk Weighted Assets) |
13.24 | % | 14.53 | % | 8.00 | % | ||||||
| Tier I Capital (to Risk Weighted Assets) |
11.83 | % | 13.05 | % | 4.00 | % | ||||||
| Tier I Capital (to Average Total Assets) |
13.45 | % | 10.70 | % | 4.00 | % | ||||||
The Bank is subject to certain restrictions on the amount of dividends that it may declare due to regulatory considerations. The Pennsylvania Banking Code provides that cash dividends may be declared and paid only out of accumulated net earnings. As a result of the merger and acquisition, $37.9 million of accumulated earnings related to the pre-merger retained earnings of First National Bank of Greencastle and $21.8 million of accumulated earnings related to the pre-merger retained earnings of First National Bank of Chester County, were transferred and reclassified into additional paid-in capital of the Bank. Based on approval received from the Pennsylvania Department of Banking, these amounts are available for cash dividends and may be declared and paid in future periods. During 2010, we declared dividends of $1.12 per share which totaled $8.0 million.
During the second quarter of 2009, the Board of Directors approved a Dividend Reinvestment and Stock Purchase Plan (“Plan”) to provide the shareholders with the opportunity to use cash dividends, as well as optional cash payments up to $50 thousand per quarter, to purchase additional shares of the our common stock. We have reserved 1,000,000 shares of common stock, no par value, for issuance under the Plan. At our discretion, shares may be purchased under the Plan directly from us or in open market purchases from others by the plan agent. The purchase price for shares purchased from us with reinvested dividends is 95% of the fair market value of the common stock on the investment date. The purchase price for shares purchased with voluntary cash payments or any open market purchases is 100% of the fair market value of the common stock on the investment date. During 2010, approximately $717 thousand in capital has been raised under the Plan. Since the Plan’s inception, the Plan has raised approximately $1.1 million.
51
Table of Contents
Also during the second quarter of 2009, the Board of Directors and shareholders approved an Employee Stock Purchase Plan (“Employee Plan”) to provide the our employees with the opportunity to purchase shares of our common stock directly. The purchase price for shares purchased under the Employee Plan is 95% of the fair market value of the common stock on the purchase date. During 2010, approximately $142 thousand in capital has been raised under the Employee Plan. Since the Employee Plan’s inception, the Employee Plan has raised approximately $207 thousand.
In connection with the Emergency Economic Stabilization Act of 2009 and the Troubled Asset Recovery Program (TARP), the U.S. Department of the Treasury (UST) has initiated a Capital Purchase Program. Through this program, qualifying financial institutions are eligible to participate in the sale of senior preferred stock to the UST in an amount not less than 1% of total risk-weighted assets and not more than 3% of total risk-weighted assets. The senior preferred stock will pay cumulative dividends at a rate of 5% per year for the first five years and 9% thereafter. The UST would also receive warrants to purchase a number of shares of common stock of the financial institution having an aggregate market value equal to 15% of the senior preferred stock on the date of the investment, subject to certain reductions.
In January 2009, Graystone received preliminary approval from the U.S. Treasury Department for the placement of up to $17.3 million in senior preferred stock. In March 2009, Graystone announced that it would not be participating in the U.S. Treasury Department’s Troubled Asset Relief Program Capital Purchase Program. Tower Bancorp, Inc. did not apply to participate in the Capital Purchase Program.
52
Table of Contents
Quarterly Consolidated Results of Operations
(in thousands, except share and per share data)
(unaudited)
| Three Months Ended | ||||||||||||||||
| Dec. 31, | Sept. 30, | June 30, | Mar. 31, | |||||||||||||
| For the Year 2010 |
||||||||||||||||
| Interest income |
$ | 21,870 | $ | 18,896 | $ | 18,482 | $ | 17,575 | ||||||||
| Interest expense |
5,524 | 5,525 | 5,579 | 5,526 | ||||||||||||
| Net interest income |
16,346 | 13,371 | 12,903 | 12,049 | ||||||||||||
| Provision for loan losses |
4,100 | 1,600 | 1,900 | 1,450 | ||||||||||||
| Noninterest income |
4,254 | 3,011 | 2,423 | 2,004 | ||||||||||||
| Noninterest expenses |
22,215 | 10,983 | 11,737 | 9,834 | ||||||||||||
| Income before income taxes |
(5,715 | ) | 3,799 | 1,689 | 2,769 | |||||||||||
| Income tax expense |
(1,424 | ) | 1,275 | 508 | 864 | |||||||||||
| Net income including noncontrolling interest |
$ | (4,291 | ) | $ | 2,524 | $ | 1,181 | $ | 1,905 | |||||||
| Less: income from noncontrolling interest |
135 | 22 | 4 | — | ||||||||||||
| Net Income |
$ | (4,426 | ) | $ | 2,502 | $ | 1,177 | $ | 1,905 | |||||||
| Net income per common share |
||||||||||||||||
| Basic |
$ | (0.53 | ) | $ | 0.35 | $ | 0.17 | $ | 0.27 | |||||||
| Diluted |
(0.53 | ) | 0.35 | 0.17 | 0.27 | |||||||||||
| Dividends declared |
0.28 | 0.28 | 0.28 | 0.28 | ||||||||||||
| Weighted average common shares outstanding |
||||||||||||||||
| Basic |
8,026,746 | 7,144,685 | 7,133,681 | 7,125,253 | ||||||||||||
| Diluted |
8,026,746 | 7,144,721 | 7,137,256 | 7,130,335 | ||||||||||||
| For the Year 2009 |
||||||||||||||||
| Interest income |
$ | 16,576 | $ | 15,724 | $ | 15,660 | $ | 8,423 | ||||||||
| Interest expense |
5,312 | 5,520 | 5,547 | 4,049 | ||||||||||||
| Net interest income |
11,264 | 10,204 | 10,113 | 4,374 | ||||||||||||
| Provision for loan losses |
1,400 | 800 | 650 | 2,366 | ||||||||||||
| Noninterest income |
3,168 | 1,810 | 2,717 | 948 | ||||||||||||
| Noninterest expenses |
9,719 | 8,694 | 9,626 | 5,768 | ||||||||||||
| Income before income taxes |
3,313 | 2,520 | 2,554 | (2,812 | ) | |||||||||||
| Income tax expense |
1,252 | 820 | 690 | (933 | ) | |||||||||||
| Net income including noncontrolling interest |
$ | 2,061 | $ | 1,700 | $ | 1,864 | $ | (1,879 | ) | |||||||
| Less: income from noncontrolling interest |
5 | — | 26 | 6 | ||||||||||||
| Net Income |
$ | 2,056 | $ | 1,700 | $ | 1,838 | $ | (1,885 | ) | |||||||
| Net income per common share |
||||||||||||||||
| Basic |
$ | 0.29 | $ | 0.30 | $ | 0.36 | $ | (0.68 | ) | |||||||
| Diluted |
0.29 | 0.30 | 0.36 | (0.68 | ) | |||||||||||
| Dividends declared |
0.28 | 0.28 | 0.28 | — | ||||||||||||
| Weighted average common shares outstanding |
||||||||||||||||
| Basic |
7,114,900 | 5,638,851 | 5,058,119 | 2,765,717 | ||||||||||||
| Diluted |
7,115,386 | 5,652,292 | 5,065,180 | 2,765,717 | ||||||||||||
53
Table of Contents
CRITICAL ACCOUNTING POLICIES
The following is a summary of those accounting policies that we consider to be most important to the portrayal of our financial condition and results of operations, as they require our judgment as a result of the need to make estimates about the effect of matters that are inherently uncertain.
Allowance for loan losses
The Bank accounts for the credit risk associated with its lending activities through the adjusted allowance for loan losses. The adjusted allowance for loan losses is a Non-GAAP measure that consists of the allowance for loan losses and the credit risk fair value adjustment. The allowance for loan losses represents the estimate of losses inherent in the existing loan portfolio. The credit risk fair value adjustment represents the estimated fair value of cash flows for loan purchased as part of merger and acquisitions. The provision for loan losses is the periodic charge to earnings, which is necessary to adjust the allowance for loan losses to its proper balance. The Bank assesses the adequacy of its allowance through a methodology that consists of the following:
| • | Identifying loans that require individual review. In general, these consist of large balance commercial loans and commercial mortgages that are rated less than “satisfactory” based upon the Bank’s internal credit-rating process. |
| • | Assessing whether the loans identified for review are “impaired”. That is, whether it is probable that all amounts will not be collected according to the contractual terms of the loan agreement. |
| • | For loans reviewed, calculating the estimated fair value, using observable market prices, discounted cash flows or the value of the underlying collateral. |
| • | Classifying all non-impaired large balance loans based on credit risk ratings and allocating an allowance for loan losses based on appropriate factors, including recent loss history for similar loans. |
| • | Identifying all smaller balance homogeneous loans for evaluation collectively. In general, these loans include residential mortgages, consumer loans, installment loans, commercial loans and commercial mortgages rated “satisfactory” or better, smaller balance commercial loans and mortgages and lease receivables. |
| • | Homogeneous loans are segmented into groups with similar characteristics and an allowance for loan losses is allocated to each segment based on recent loss history and other relevant information. |
| • | Reviewing the results to determine the appropriate balance of the allowance for loan losses. This review gives additional consideration to factors such as the mix of loans in the portfolio, the balance of the allowance relative to total loans and non-performing assets, trends in the overall risk profile of the portfolio, trends in delinquencies and non-accrual loans and local and national economic conditions. |
| • | Documenting the results of its review. |
The allowance review methodology is based on information known at the time of the review. Changes in factors underlying the assessment could have a material impact on the amount of the allowance that is necessary and the amount of provision to be charged against earnings. Such changes could impact future results.
In July 2010, the Financial Accounting Standards Board (“FASB”) issued Accounting Standard Codification (“ASC”) Update No. 2010-20 concerning disclosures about the credit quality of financing receivables and the allowance for credit losses. Update No. 2010-20 is intended to provide additional information to assist financial statement users in assessing an entity’s credit risk exposures and evaluating the adequacy of its allowance for credit losses. Update No. 2010-20 requires companies to (1) provide enhanced disclosures around the nature of credit risk inherent in the entity’s portfolio of financing receivables; (2) explain how that risk is analyzed and assessed in arriving at the allowance for credit losses; and (3) explain the changes and reasons for changes in the allowance for credit losses. The provisions of Update No. 2010-20 concerning disclosures for the end of a period are effective for interim and annual periods ending on or after December 15, 2010. The provisions of Update No. 2010-20 concerning disclosures about activity that occurs during a reporting period are applicable to us for
54
Table of Contents
interim and annual periods beginning on or after December 15, 2010, or the interim period ending on March 31, 2011. The adoption of Update No. 2010-20 provides the reader of our financial statements with expanded and enhanced disclosure surrounding the allowance for credit losses.
Accounting for Business Combinations
We account for all business acquisitions using the acquisition method of accounting as required by U.S. GAAP. FASB guidance establishes principles and requirements for how an acquirer: recognizes and measures in its financial statement the identifiable assets acquired, the liabilities assumed, and any noncontrolling interest in the acquiree; recognizes and measures the goodwill acquired in the business combination or a gain from a bargain purchase; and determines what information to disclose to enable users of the financial statements to evaluate the nature and financial effects of the business combination.
The purchase price is established as the value of securities issued for the acquisition, and cash consideration paid. The fair values of assets acquired and liabilities assumed are typically established through appraisals, observable market values or discounted cash flows. We have engaged independent third-party valuation experts to assist in valuing certain assets, particularly intangibles. Other assets and liabilities are generally valued using our internal asset/liability modeling system. The assumptions used and the final valuations, whether prepared internally or by a third-party, are reviewed. Due to the complexity of purchase accounting, final determinations of values can be time consuming and, occasionally, amounts included in our consolidated balance sheets and consolidated statements of operations are based on preliminary estimates of value.
On April 1, 2009, FASB issued guidance that clarifies that assets acquired and liabilities assumed in a business combination arising from contingencies be initially measured and recognized at its acquisition date fair value so long as the fair value can be determined during the measurement period. For any asset or liability whose acquisition date fair value cannot be determined, an asset or liability shall be recognized at its estimated fair value provided that there is both evidence that either the asset or liability existed as of the acquisition date and the amount can be reasonably estimated. This guidance is effective for assets or liabilities arising from contingencies in business combinations for which the acquisition date is on or after the beginning of the first annual reporting period beginning on or after December 15, 2008. We have adopted this guidance effective for the interim period ending March 31, 2009 and utilized the guidance to recognize liabilities assumed in relation to the Graystone Merger and the FCEC Merger.
Goodwill and Intangible Assets
Intangible assets are amortized over their estimated lives. Some intangible assets have indefinite lives and are, therefore, not amortized. All intangible assets must be evaluated for impairment if certain events occur. Any impairment write-downs are recognized as expense on the consolidated statements of operations.
Goodwill is not amortized to expense, but is evaluated at least annually for impairment. We test for impairment by first allocating its goodwill and other assets and liabilities, as necessary, to defined reporting units. A fair value is then determined for each reporting unit. If the fair values of the reporting units exceed their book values, no write-down of the recorded goodwill is necessary. If the fair values are less than the book values, an additional valuation procedure is necessary to assess the proper carrying value of the goodwill.
Business unit valuation is inherently subjective, with a number of factors based on assumptions and our judgments. Among these are future growth rates for the reporting units, selection of comparable market transactions, discount rates and earnings capitalization rates. Changes in assumptions and results due to economic conditions, industry factors and reporting unit performance and cash flow projections could result in different assessments of the fair values of reporting units and could result in impairment charges. If an event occurs or circumstances change that would more likely than not reduce the fair value of a reporting unit below its carrying amount, an impairment test between annual tests is necessary. Such events may include adverse changes in legal factors or in the business climate, adverse actions by a regulator, unauthorized competition, the loss of key employees, or similar events.
55
Table of Contents
Income Taxes
The provision for income taxes is based upon income before income taxes, adjusted for the effect of certain tax-exempt income and non-deductible expenses. In addition, certain items of income and expense are reported in different periods for financial reporting and tax return purposes. The tax effects of these temporary differences are recognized currently in the deferred income tax provision or benefit. Deferred tax assets or liabilities are computed based on the difference between the financial statement and income tax bases of assets and liabilities using the applicable enacted marginal tax rate.
We must also evaluate the likelihood that deferred tax assets will be recovered from future taxable income. If any such assets are more likely than not to not be recovered, a valuation allowance must be recognized. The assessment of the carrying value of deferred tax assets is based on certain assumptions, changes in which could have a material impact on our consolidated financial statements.
We also adopted FASB guidance that clarifies the accounting for uncertainty in income taxes recognized in an enterprise’s financial statements. Specifically, the interpretation prescribes a recognition threshold and measurement attribute for the financial statement recognition and measurement of a tax position taken or expected to be taken in a tax return.
See also Note 14, “Income Taxes”, in the Notes to Consolidated Financial Statements.
Fair Value Measurements
On January 1, 2008, we adopted the FASB issued statement of fair value measurement as required by U.S. GAAP for all assets and liabilities required to be measured at fair value on a recurring basis and all financial assets and liabilities measured at fair value on a nonrecurring basis. The statement establishes a fair value hierarchy that prioritizes the inputs to valuation techniques used to measure fair value into the following three categories (from highest to lowest priority):
| • | Level 1 – Inputs that represent quoted prices for identical instruments in active markets. |
| • | Level 2 – Inputs that represent quoted prices for similar instruments in active markets, or quoted prices for identical instruments in non-active markets. Also includes valuation techniques whose inputs are derived principally from observable market data other than quoted prices, such as interest rates or other market-corroborated means. |
| • | Level 3 – Inputs that are largely unobservable, as little or no market data exists for the instrument being valued. |
As required by the statement, we have categorized all financial assets and liabilities and all nonfinancial assets and liabilities required to be measured at fair value on a recurring basis into the above three levels. In addition, we have categorized all financial assets and liabilities measured at fair value on a nonrecurring basis into the above three levels. See Note 17, “Fair Value Measurements” in the Notes to Consolidated Financial Statements for the disclosures required by statement.
The determination of fair value for assets and liabilities categorized as Level 3 assets requires a great deal of subjectivity due to the use of unobservable inputs. In addition, determining when a market is no longer active and placing little or no reliance on distressed market prices requires the use of our judgment. The need for greater judgment in determining fair values for Level 3 assets and liabilities has further been heightened by the current challenging economic conditions, which have resulted in a great deal of volatility in the fair values of investment securities.
We engage third-party valuation experts to assist in valuing most of the assets and liabilities measured at fair value on a recurring basis which are classified as Level 2 or Level 3 items.
In January 2010, the FASB issued ASC Update No. 2010-06 for improving disclosures about fair value measurements. Update No. 2010-06 requires companies to disclose, and provide the reasons for, all transfers of
56
Table of Contents
assets and liabilities between the Level 1 and 2 fair value categories. It also clarifies that companies should provide fair value measurement disclosures for classes of assets and liabilities which are subsets of line items within the balance sheet, if necessary. In addition, Update No. 2010-06 clarifies that companies provide disclosures about the fair value techniques and inputs for assets and liabilities classified within Level 2 or 3 categories. The disclosure requirements prescribed by Update No. 2010-06 are effective for fiscal years beginning after December 15, 2009, and for interim periods within those fiscal years, or March 31, 2010. We have implemented the disclosure requirements of Update No. 2010-06 within this Form 10-K which can be found in Note 18 of the Notes to the Consolidated Financial Statements. Update No. 2010-06 also requires companies to reconcile changes in Level 3 assets and liabilities by separately providing information about Level 3 purchases, sales, issuances and settlements on a gross basis. This provision of Update No. 2010-06 is effective for fiscal years beginning after December 15, 2010, and for interim periods within those fiscal years, or March 31, 2011. The adoption of Update No. 2010-06 is not expected to materially impact our fair value measurement disclosures.
Fair Value Option
In February 2007, the FASB issued ASC 825-10, “The Fair Value Option for Financial Assets and Financial Liabilities—Including an Amendment of FASB Statement No. 115” (“ASC 825-10”). ASC 825-10 permits entities to choose to measure many financial instruments and certain other items at fair value and requires certain disclosures for amounts for which the fair value option is applied. ASC 825-10 became effective on January 1, 2008.
Prior to the election, loans held for sale were measured at the lower of aggregate cost or market. We elected to adopt ASC 825-10 on December 10, 2010 as part of the FCEC Merger for loans held for sale originated to more accurately reflect the financial performance of our mortgage banking activities in our consolidated financial statements. Fair value is the price that secondary market investors would pay for loans with similar characteristics, including interest rate and term, as of the date fair value is measured. We classify the fair value adjustments on loans held for sale as a component of gains on sale of mortgage loans.
Derivatives
As part of our mortgage banking operations, we use derivative instruments to manage a portion of our exposure to market risks primarily associated with fluctuations in interest rates. As a matter of policy, we did not use derivatives for speculative purposes. All of our derivative instruments that are measured at fair value on a recurring basis are included in other assets or other liabilities in the consolidated balance sheets.
Generally, the fair value of our derivative instruments are measured at fair value determined by utilizing quoted prices from dealers in such securities or third-party models utilizing observable market inputs.
Derivative Loan Commitments. Mortgage loan commitments that relate to the origination of a mortgage that will be held for sale upon funding are considered derivative instruments under the derivative and hedging accounting guidance (ASC 815, “Derivative and Hedging”). Loan commitments that are derivatives are recognized at fair value on the consolidated balance sheet in other assets or other liabilities with changes in their fair values recorded in non-interest income. We follow the Securities and Exchange Commission’s (SEC) guidance regarding written loan commitments recorded at fair value through earnings. This guidance requires that the expected net future cash flows related to servicing of a loan be included in the measurement of all written commitments that are accounted for at fair value through earnings. The fair value of the loan commitments is based upon the estimated fair value of the underlying mortgage loans (determined consistent with “Mortgage Loans Held for Sale” above), with an adjustment to reflect the estimated percentage of commitments that will result in a closed mortgage loan. The valuation of loan commitments approximates a whole-loan price, which includes the value of the related mortgage servicing rights (“MSRs”).
Forward Transaction Agreements. We acquired the AHB Division as part of the FCEC Merger. The AHB Division uses forward transaction agreement to mitigate a portion of its interest rate risk. We evaluated forward
57
Table of Contents
transaction agreements to determine whether they meet the definition of a derivative under the derivatives and hedging accounting guidance (ASC 815) as facts and circumstances may differ. If agreements qualify, to protect against the price risk inherent in derivative loan commitments, we uses both “mandatory delivery” and “best efforts” forward transaction agreements to mitigate the risk of potential decreases in the values of loans that would result from the exercise of derivative loan commitments. Both contracts are accounted for as derivatives. Accordingly, forward transaction agreements are recognized at fair value on the consolidated balance sheet in other assets and liabilities with changes in their fair values recorded in other non-interest income. We estimate the fair value of our forward transaction agreements using a methodology similar to that used for derivative loan commitments.
See also Note 12, “Derivatives”, in the Notes to Consolidated Financial Statements.
Recent Accounting Pronouncements
For information regarding recent accounting pronouncements, refer to Note 1, “Summary of Significant Accounting Policies” of this Form 10-K.
| Item 7A. | Quantitative and Qualitative Disclosures About Market Risk |
Our exposure to market risk principally includes liquidity risk, interest rate risk, and market price risk which are discussed below.
Liquidity Risk
We manage our liquidity position on a daily basis as part of the daily settlement function and continuously as part of the formal asset liability management process. Our liquidity is maintained by managing several variables including, but not limited to:
| • | Pricing and dollar amount of core deposit products; |
| • | Pricing and dollar amount of in-market time deposits; |
| • | Growth rate of the loan portfolio (including the sale of loans on a participation basis); |
| • | Purchase and sale of federal funds; |
| • | Purchase and sale of investment securities; |
| • | Use of wholesale funding such as brokered deposits; and |
| • | Use of borrowing capacity at the FHLB. |
We maintain a detailed liquidity contingency plan designed to respond to an overall decline in the condition of the banking industry or a problem specific to our company. On a quarterly basis, the Asset Liability Committee (“ALCO”) of the board of directors reviews a comprehensive liquidity analysis along with any changes to the liquidity contingency plan.
As of December 31, 2010, we had a maximum borrowing capacity at the Federal Home Loan Bank of Pittsburgh (“FHLB”) of approximately $648.7 million, of which, approximately $104.1 million was used in the form of borrowings. Accordingly, we had unused borrowing capacity of $544.6 million at the FHLB. Based on the FHLB capital stock owned by the Bank as of December 31, 2010, we can access approximately $107.0 million of funding without the need to purchase additional FHLB stock. As of December 31, 2010, we had unsecured federal fund lines availability at three correspondent banks totaling $27.5 million. There were no funds drawn upon these facilities as of December 31, 2010.
We participate in obtaining wholesale funding sources in addition to core demand deposits. As of December 31, 2010, we had Certificate of Deposit Account Registry Service (“CDARS”) reciprocal deposits as an alternative source of funds in the amount of $49.9 million. We participate in a brokerage sweep program that provides for
58
Table of Contents
the deposit of funds with the benefit of insurance from the FDIC. The balance of this funding as of December 31, 2010 was approximately $69.0 million. We also issue brokered time deposits. As of December 31, 2010, the dollar amount of brokered time deposits, other than CDARS, was $75.4 million. Brokered deposits, exclusive of CDARS reciprocal deposits accounted for approximately 6.3% and 3.8% of total deposits as of December 31, 2010 and December 31, 2009, respectively. Time deposits comprise approximately $880.9 million or 38.3% of our deposit liabilities.
At December 31, 2010, liquid assets (defined as cash and cash equivalents, loans held for sale, and securities available for sale exclusive of securities pledged as collateral or used in connection with customer repurchase agreements) totaled approximately $411.6 million or 17.9% of total deposits. This compares to $204.3 million, or 16.8%, of total deposits, at December 31, 2009.
It is our opinion that its liquidity position at December 31, 2010, is adequate to respond to fluctuations “on” and “off” balance sheet. In addition, we know of no trends, demands, commitments, events or uncertainties that may result in, or that are reasonably likely to result in our inability to meet anticipated or unexpected liquidity needs.
Interest Rate Risk
We actively manage our interest rate sensitivity position. Interest rate sensitivity is the matching or mismatching of the repricing and rate structure of the interest-bearing assets and liabilities. Our primary objectives of interest rate risk management are to neutralize adverse impacts to net interest income arising from interest rate movements and to attain sustainable growth in net interest income. The Management Asset Liability Committee (“MALCO”) is primarily responsible for developing and implementing asset liability management strategies in accordance with the Asset and Liability Management Policy and Procedures (the “ALCO Policy”) approved by the board of directors. The MALCO generally meets on a monthly basis and is comprised of members of our senior management team. The ALCO of the board of directors meets on a quarterly basis to review the guidelines established by MALCO and the results of our interest rate risk analysis.
We manage interest rate sensitivity by changing the volume, mix, pricing and repricing characteristics of our assets and liabilities. We have not entered into separate derivative contracts such as interest rate swaps, caps, and floors.
The interest rate characteristics and interest repricing characteristics of the loan portfolio at December 31, 2010 are set forth in the tables below. Adjustable-rate loans represent loans that are currently in a fixed-rate, but are subject to repricing to either a fixed or variable rate at the related next repricing date.
| Interest Rate Characteristics |
Percentage of Portfolio |
|||
| Fixed-rate loans |
23.9 | % | ||
| Adjustable-rate loans |
40.8 | % | ||
| Variable-rate loans |
35.3 | % | ||
| Total |
100.0 | % | ||
| Repricing Structure |
Percentage of Portfolio |
|||
| One month or less |
35.6 | % | ||
| Two to six months |
5.1 | % | ||
| Six to twelve months |
6.0 | % | ||
| One to two years |
7.4 | % | ||
| Two to three years |
12.5 | % | ||
| Three to five years |
20.5 | % | ||
| Greater than five years |
12.9 | % | ||
| Total |
100.0 | % | ||
59
Table of Contents
As of December 31, 2010, the loan portfolio contained $750.6 million of loans in the variable-rate interest mode. Of these loans, 72.9% had interest rate floors. Prior to the FCEC Merger, approximately 82.4% of the variable loans had interest rate floors. The majority of these loans are indexed to prime, 1-Month LIBOR, and 3-Month LIBOR (i.e. the index plus a spread). While the interest rate floors provide us with interest rate protection given that the prime rate and LIBOR rates, plus the applicable spread, are substantially below these floors, these loans will not generate incremental income in an upward rising environment until the floors have been pierced. The compression on net interest margin related to these relationships will be influenced by a number of variables including, but not limited to, the volatility of the respective indices, the speed at which rates rise, and the interest rate sensitivity of deposit costs. To date, we have elected to manage this risk without the use of separate derivative contracts.
As of December 31, 2010, the residential mortgage loan portfolio, exclusive of the loans held for sale, contained $280.2 million of mortgages of which $106.4 million will reprice over the next twelve months. The residential mortgage loan portfolio, exclusive of the loans held for sale that will reprice over the next twelve months have a current weighted average interest rate of approximately 4.1%. A majority of these mortgage loans are indexed to the one-year Treasury rate. In the current rate environment, these loans will reprice to new rates that are below the current contractual rates thereby putting pressure on net interest margin. In the event that the one-year Treasury rate rises, the loss of interest income from repricing will be lessened. We have been actively encouraging customers to refinance these loans into fixed-rate loans through our mortgage company subsidiary as a means of locking in historically low interest rates. Furthermore, we expect that newly originated mortgage loan volume will principally be underwritten and sold into the secondary market through our mortgage subsidiary. To date, we have elected to manage this risk without the use of separate derivative contracts.
As of December 31, 2010, we reported deposit liabilities of approximately $2.3 billion and securities sold under agreements to repurchase of approximately $6.6 million. Comparatively, we reported deposit liabilities of approximately $1.2 billion and securities sold under repurchase agreements of approximately $6.9 million at December 31, 2009. Approximately $987.3 million of deposit growth during calendar year 2010 was attributed to the FCEC Merger. We increased brokered deposits, exclusive of reciprocal in-market deposits, by $98.4 million between December 31, 2009 and December 31, 2010. The balance includes $43.6 million in brokered deposits acquired as part of the FCEC Merger. The remaining growth was attributed to deposit origination within markets we serve.
The maturity structure of the time deposit portfolio as of December 31, 2010, is summarized below.
| Certificates of Deposits Maturity Structure |
Dollars (millions) |
Percentage | ||||||
| One months or less |
$ | 38.0 | 4.3 | % | ||||
| Over one month through one year |
384.3 | 43.6 | % | |||||
| Over one year through two years |
230.1 | 26.1 | % | |||||
| Over two years |
228.5 | 26.0 | % | |||||
| Total |
$ | 880.9 | 100.0 | % | ||||
As noted above, approximately $422.3 million of time deposits will mature over the next year. Given existing market conditions, we expect to retain a significant portion of the maturing time deposit portfolio in the form of new time deposits or money market accounts at interest rates that are generally comparable to the current rates of the time deposits maturing over the next year except for that portion of the time deposit portfolio that we target for longer maturities. We are actively seeking to extend the weighted average life of the time deposit portfolio which may result in renewing a portion of the time deposit portfolio at rates that are higher than the rates of time deposits maturing over the next year.
We use several tools to assess and measure interest rate risk including interest rate simulation analysis that is prepared on a quarterly basis. Each analysis is largely dependent on many assumptions and variables with past behaviors that may not prove to be effective predictors of future outcomes. These assumptions are reviewed on at least a quarterly basis.
60
Table of Contents
Gap Analysis
We use gap analysis to compare the relationship of assets that are expected to reprice during a specific time frame (“Rate Sensitive Assets” or “RSA”) as compared to liabilities that are scheduled to reprice during an identical time period (“Rate Sensitive Liabilities” or “RSL”). When the ratio is greater than one, RSA exceed RSL and potentially exposes the bank to a risk of a decline in interest rates by virtue of a larger amount of assets repricing at lower interest rates than rate sensitive liabilities. The converse would be true of a RSA/RSL ratio less than 1.0. While gap analysis can be useful in evaluating the relationship of RSA to RSL, it does not capture other critical interest rate risk variables such as the extent of change that will take place when a RSA or RSL reprices, prepayment considerations, and other factors. Under the ALCO Policy, the interest rate simulation report measures the ratio of rate sensitive assets to rate sensitive liabilities at a one-year time frame. The ALCO Policy has established an acceptable relationship of RSA to RSL to a range of 80% to 120%.
We use the following methodology in computing repricing gap. This methodology is noteworthy given the current interest rate environment. First, we classify variable-rate loans with current interest rates below loan floors as rate sensitive assets. As of December 31, 2010, we have $546.9 million of loans that are currently in the variable rate mode with interest rates indexed to the prime rate, the one-month LIBOR, and the three-month LIBOR that are subject to contractual floors. The majority of these loans have current interest rates determined by the contractual floors. To the extent that these loans will not reprice until the floor has been pierced (approximately 175 basis points), these loans are technically not rate sensitive. However, for purposes of computing repricing gap, we have treated these loans as rate-sensitive to capture their behavior in more traditional interest rate environments. Second, we have classified all interest-bearing non-maturity deposits as repricing immediately. Lastly, we have classified the balance of cash on deposit at the Federal Reserve Bank as an asset that will re-price in the first quarter of 2011. We believe that this methodology is more conservative in comparison to other methodologies that assume non-maturity deposits reprice across time. We recognize that this methodology has the potential to highlight the inherent weaknesses of repricing gap analysis. For this reason, we emphasize the metrics of net interest income at risk and economic value of equity at risk when evaluating interest rate risk.
At December 31, 2010, our balance sheet was liability sensitive with a cumulative gap ratio at one year of approximately 88.8%. The gap ratio is within policy guidelines. In large part, the liability sensitive position of the balance sheet is due to the increase in transaction, and money market in the deposit portfolio. This is an intentional strategy designed to strengthen on-balance sheet liquidity, acquire lower cost in-market deposits, and address consumer demand for FDIC-insured liquid deposits. We believe the interest rate sensitivity of our non-maturity deposit portfolio is less than that of the general market. Accordingly, the lower level of interest rate sensitivity will partially mitigate the general effects of liability sensitivity. As of December 31, 2010, 86.7% of liability funding was originated within markets we serve.
The table below summarizes the repricing gap as of December 31, 2010.
| Repricing Gap Report as of December 31, 2010 | ||||||||||||||||||||||||||||||||
| (dollars in thousands) | ||||||||||||||||||||||||||||||||
| 1 to 3 Months |
3 to 6 Months |
6 to 12 Months |
12-24 Months |
24 to 36 Months |
36 to 60 Months |
Greater than 60 Months/ non-rate sensitive |
Total | |||||||||||||||||||||||||
| Assets |
||||||||||||||||||||||||||||||||
| Cash, due from banks, and federal funds sold |
$ | 211,457 | $ | — | $ | — | $ | — | $ | — | $ | — | $ | 37,022 | $ | 248,479 | ||||||||||||||||
| Securities (1) |
22,507 | 14,937 | 11,391 | 16,480 | 10,993 | 8,994 | 32,090 | 117,392 | ||||||||||||||||||||||||
| Loans |
866,674 | 106,899 | 198,804 | 259,099 | 259,186 | 247,448 | 267,362 | 2,205,472 | ||||||||||||||||||||||||
| Other assets |
— | — | — | — | — | — | 175,946 | 175,946 | ||||||||||||||||||||||||
| Total assets |
$ | 1,100,638 | $ | 121,836 | $ | 210,195 | $ | 275,579 | $ | 270,179 | $ | 256,442 | $ | 512,420 | $ | 2,747,289 | ||||||||||||||||
61
Table of Contents
| Repricing Gap Report as of December 31, 2010 | ||||||||||||||||||||||||||||||||
| (dollars in thousands) | ||||||||||||||||||||||||||||||||
| 1 to 3 Months |
3 to 6 Months |
6 to 12 Months |
12-24 Months |
24 to 36 Months |
36 to 60 Months |
Greater than 60 Months/ non-rate sensitive |
Total | |||||||||||||||||||||||||
| Liabilities |
||||||||||||||||||||||||||||||||
| Non-interest bearing deposits |
$ | — | $ | — | $ | — | $ | — | $ | — | $ | — | $ | 301,210 | $ | 301,210 | ||||||||||||||||
| Interest-bearing transaction and savings deposits |
1,117,767 | — | — | — | — | — | — | 1,117,767 | ||||||||||||||||||||||||
| Time deposits |
136,120 | 137,703 | 149,786 | 229,178 | 28,982 | 186,087 | 13,066 | 880,922 | ||||||||||||||||||||||||
| Total deposits |
1,253,886 | 137,703 | 149,786 | 229,178 | 28,982 | 186,087 | 314,276 | 2,299,898 | ||||||||||||||||||||||||
| Borrowings, including repurchase agreements |
66,292 | 5,025 | 51 | 5,108 | 21,118 | 35,062 | 16,788 | 149,444 | ||||||||||||||||||||||||
| Other liabilities |
— | — | — | — | — | — | 40,061 | 40,061 | ||||||||||||||||||||||||
| Total liabilities |
$ | 1,320,178 | $ | 142,728 | $ | 149,837 | $ | 234,286 | $ | 50,100 | $ | 221,149 | $ | 371,125 | $ | 2,489,403 | ||||||||||||||||
| Equity |
— | — | — | — | — | — | — | 257,886 | ||||||||||||||||||||||||
| Total liabilities and equity |
$ | 1,320,178 | $ | 142,728 | $ | 149,837 | $ | 234,286 | $ | 50,100 | $ | 221,149 | $ | 371,125 | $ | 2,747,289 | ||||||||||||||||
| Repricing Assets |
1,100,638 | 121,836 | 210,195 | 275,579 | 270,179 | 256,442 | 512,438 | 2,747,289 | ||||||||||||||||||||||||
| Repricing Liabilities |
1,320,178 | 142,728 | 149,837 | 234,286 | 50,100 | 221,149 | 371,125 | 2,489,403 | ||||||||||||||||||||||||
| Period Repricing Gap |
(219,540 | ) | (20,892 | ) | 60,358 | 41,293 | 220,079 | 35,293 | 141,313 | 257,886 | ||||||||||||||||||||||
| Period Repricing Gap Percentage |
83.4 | % | 85.4 | % | 140.3 | % | 117.6 | % | 539.3 | % | 116.0 | % | 138.1 | % | 110.4 | % | ||||||||||||||||
| Cumulative Repricing Gap Percentage |
83.4 | % | 83.6 | % | 88.8 | % | 92.5 | % | 104.3 | % | 105.5 | % | 138.4 | % | 110.4 | % | ||||||||||||||||
| (1) | Includes equity investments available for sale and restricted investments |
Net Interest Income at Risk
We assess the percentage change in net interest income assuming interest rate shocks (upward and downward) of 100, 200, and 300 basis points. Given the current rate environment, we limited the downward shock to 100 basis points, but included an upward shock of 400 basis points. This analysis captures the timing of the repricing of RSA and RSL as well as the degree of change (“beta”) in the interest rates of particular asset and liability products that occurs as interest rates move upward or downward. Under the Asset and Liability Management Policy and Procedures, the interest rate simulation report measures the percentage change in net interest income for one year assuming interest rate shocks of 100, 200, and 300 basis points. The ALCO Policy has established an acceptable negative percentage change in net interest income under 100, 200, and 300 basis point shocks of 20%.
The table below summarizes the Net Interest Income at Risk modeling results as of December 31, 2010.
| Actual | Policy | |||||||
| Net Interest Income: Up 100 Bps (%) |
0.82 | % | 20.0 | % | ||||
| Net Interest Income: Up 200 Bps (%) |
4.42 | % | 20.0 | % | ||||
| Net Interest Income: Up 300 Bps (%) |
8.78 | % | 20.0 | % | ||||
| Net Interest Income: Up 400 Bps (%) |
12.93 | % | 20.0 | % | ||||
| Net Interest Income: Down 100 Bps (%) |
(0.53 | )% | 20.0 | % | ||||
62
Table of Contents
Economic Value of Equity at Risk.
We assess the present value of cash inflows of cash, investments, loans, bank-owned life insurance policies, when applicable, netted against the present value of cash outflows from deposits, repurchase agreements, borrowings, and other interest-bearing liabilities, all discounted to a measurement date. This measure is expressed as the percentage change in the present value of such cash flows when interest rates are shocked (upward and downward) at 100, 200, and 300 basis points. Under the Asset and Liability Management Policy and Procedures, the interest rate simulation reports measures the percentage change in economic value of equity at risk assuming interest rate shocks of 100, 200, and 300 basis points. Given the current rate environment, we limited the downward shock to 100 basis points, but included an upward shock of 400 basis points. The ALCO Policy has established an acceptable negative percentage change in economic value of equity at risk under 100, 200, and 300 basis point shocks of 20%.
The table below summarizes the Economic Value of Equity at Risk as of December 31, 2010.
| Actual | Policy | |||||||
| Economic Value of Equity: Up 100 Bps (%) |
(7.96 | )% | 20.0 | % | ||||
| Economic Value of Equity: Up 200 Bps (%) |
(10.62 | )% | 20.0 | % | ||||
| Economic Value of Equity: Up 300 Bps (%) |
(9.84 | )% | 20.0 | % | ||||
| Economic Value of Equity: Up 400 Bps (%) |
(7.76 | )% | N/A | |||||
| Economic Value of Equity: Down 100 Bps (%) |
15.55 | % | 20.0 | % | ||||
Market Price Risk
As of December 31, 2010, our investment portfolio had a market value of approximately $102.7 million. The investment portfolio is comprised of two separate components each of which is managed pursuant to a board approved investment policy. At the holding company level, we have a portfolio of equity securities of financial institutions (the “Equity Portfolio”) with a market value of approximately $195 thousand. At the bank level, the Bank has a portfolio with a market value of approximately $102.5 million comprised of debt securities summarized below and certain restricted investments related to business relationships with the Federal Home Loan Bank of Pittsburgh and a correspondent bank. As of December 31, 2009, we had an investment portfolio with a market value of approximately $196.1 million of which $195.0 million was that was held at the bank level and $1.1 million was held at the holding company level.
The investment portfolio held by the Bank decreased $86.2 million during 2010. The decrease was related to $84.6 million of U.S. Government Agency step-up bonds that were called. The maturities and cash flows from these investments were structured to coincide with the lending activities of the Bank. The weighted average life of the bank investment portfolio is 3.56 years. The weighted average life of the bank investment portfolio has extended 0.82 years between December 31, 2009 and December 31, 2010. This extension is largely related to the redemption of investments that were designed to return cash flow to provide a source of funding for our lending activity in 2010. We believe that the off balance sheet liquidity sources of the bank and the ability to raise in-market deposits at reasonable prices adequately mitigates the cash flow variability of the investment portfolio.
The securities available for sale in the bank portfolio at December 31, 2010 consisted of U.S. Treasury securities, U.S. Government agency securities, U.S. Government agency mortgage-backed securities; U.S. Government Agency collateralized mortgage obligations, Small Business Administration loan pools, and municipal bonds. The Government National Mortgage Association collateralized mortgage obligations and Small Business Administration loan pool securities are secured by the full, faith, credit and taxing power of the United States of America and carry a zero risk weighting for regulatory capital purposes.
Debt security market price risk is the risk that changes in the values of debt security investments could have a material impact on our financial position or results of operations.
63
Table of Contents
The table below summarizes the maturity structure of the portfolio as of December 31, 2010.
| Within 1 year | After 1 year but within 5 years |
After 5 years but within 10 years |
After 10 years | Total | ||||||||||||||||||||||||||||||||||||
| (dollars in thousands) | ||||||||||||||||||||||||||||||||||||||||
| Fair Value |
W/A yield |
Fair Value |
W/A yield |
Fair Value |
W/A yield |
Fair Value |
W/A yield |
Fair Value |
W/A yield |
|||||||||||||||||||||||||||||||
| U.S. Treasury securities |
$ | 5,002 | 0.82 | % | $ | — | — | $ | — | — | $ | — | — | $ | 5,002 | 0.82 | % | |||||||||||||||||||||||
| U.S Government sponsored agency securities |
— | — | 7,780 | 1.36 | % | — | — | — | — | 7,780 | 1.36 | % | ||||||||||||||||||||||||||||
| Municipal bonds (1) |
573 | 2.40 | % | 4,163 | 3.26 | % | 7,529 | 4.13 | % | 8,403 | 3.92 | % | 20,668 | 3.83 | % | |||||||||||||||||||||||||
| Asset-backed |
— | — | — | — | — | — | — | — | 69,050 | 2.95 | % | |||||||||||||||||||||||||||||
| Other securities (3) |
— | — | — | — | — | — | — | — | 14,696 | — | ||||||||||||||||||||||||||||||
| Graystone Tower Bank Portfolio |
$ | 5,575 | $ | 11,943 | $ | 7,529 | $ | 8,403 | $ | 117,196 | 2.89 | % | ||||||||||||||||||||||||||||
| Investment portfolio of equity securities held at the holding company |
195 | |||||||||||||||||||||||||||||||||||||||
| Total investment securities |
$ | 117,391 | ||||||||||||||||||||||||||||||||||||||
| (1): | Municipal securities include both non-taxable and taxable municipal bonds. |
| (2): | Asset-backed securities include U.S. Government sponsored agency mortgage-backed securities; U.S. Government sponsored agency collateralized mortgage obligations, and Small Business Administration (SBA) pool loan investments. |
| (3): | Equity investments in business relationship banks such as the Federal Home Loan Bank and correspondent banks. |
64
Table of Contents
Report of Independent Registered Public Accounting Firm
The Board of Directors and Stockholders
Tower Bancorp, Inc. and subsidiaries:
We have audited the accompanying consolidated balance sheets of Tower Bancorp, Inc. and subsidiaries as of December 31, 2010 and 2009, and the related consolidated statements of operations, changes in equity and comprehensive income, and cash flows for each of the years in the two-year period ended December 31, 2010. These consolidated financial statements are the responsibility of the Company’s management. Our responsibility is to express an opinion on these consolidated financial statements based on our audits. The accompanying consolidated financial statements of Tower Bancorp, Inc. and subsidiaries as of December 31, 2008 and for the year ended December 31, 2008, were audited by other auditors whose report thereon dated February 20, 2009, expressed an unqualified opinion on those statements.
We conducted our audits in accordance with the standards of the Public Company Accounting Oversight Board (United States). Those standards require that we plan and perform the audit to obtain reasonable assurance about whether the financial statements are free of material misstatement. An audit includes examining, on a test basis, evidence supporting the amounts and disclosures in the financial statements. An audit also includes assessing the accounting principles used and significant estimates made by management, as well as evaluating the overall financial statement presentation. We believe that our audits provide a reasonable basis for our opinions.
In our opinion, the consolidated financial statements referred to above present fairly, in all material respects, the financial position of Tower Bancorp, Inc. and subsidiaries as of December 31, 2010 and 2009 and the results of their operations and their cash flows for each of the years in the two-year period ended December 31, 2010, in conformity with U.S. generally accepted accounting principles.
We also have audited, in accordance with the standards of the Public Company Accounting Oversight Board (United States), Tower Bancorp, Inc. and subsidiaries’ internal control over financial reporting as of December 31, 2010, based on criteria established in Internal Control—Integrated Framework issued by the Committee of Sponsoring Organizations of the Treadway Commission (COSO), and our report dated March 16, 2011 expressed an unqualified opinion on the effectiveness of the Company’s internal control over financial reporting.
(signed) KPMG LLP
Harrisburg, Pennsylvania
March 16, 2011
65
Table of Contents
Report of Independent Registered Public Accounting Firm
To the Board of Directors and Shareholders
Tower Bancorp, Inc.
We have audited the accompanying consolidated statements of operations, stockholders’ equity and cash flows of Graystone Financial Corp. for the year ended December 31, 2008. Graystone Financial Corp.’s management is responsible for these financial statements. Our responsibility is to express an opinion on these financial statements based on our audit.
We conducted our audit in accordance with the standards of the Public Company Accounting Oversight Board (United States). Those standards require that we plan and perform the audit to obtain reasonable assurance about whether the financial statements are free of material misstatement. The Company is not required to have, nor were we engaged to perform, an audit of its internal control over financial reporting. Our audit included consideration of internal control over financial reporting as a basis for designing audit procedures that are appropriate in the circumstances, but not for the purpose of expressing an opinion on the effectiveness of the Company’s internal control over financial reporting. Accordingly, we express no such opinion. An audit also includes examining, on a test basis, evidence supporting the amounts and disclosures in the consolidated financial statements, assessing the accounting principles used and significant estimates made by management, as well as evaluating the overall financial statement presentation. We believe that our audit provides a reasonable basis for our opinion.
In our opinion, the financial statements referred to above present fairly, in all material respects, the consolidated results of operations and cash flows of Graystone Financial Corp. for the year ended December 31, 2008, in conformity with accounting principles generally accepted in the United States of America.
| /s/ ParenteBeard LLC |
| Lancaster, Pennsylvania |
| May 29, 2009 |
66
Table of Contents
| Item 8. | Financial Statements and Supplementary Data |
Tower Bancorp, Inc. and Subsidiaries
Consolidated Balance Sheets
December 31, 2010 and 2009
(Amounts in thousands, except share data)
| December 31, 2010 |
December 31, 2009 |
|||||||
| Assets |
||||||||
| Cash and due from banks |
$ | 219,741 | $ | 33,955 | ||||
| Federal funds sold |
28,738 | 16,645 | ||||||
| Cash and cash equivalents |
248,479 | 50,600 | ||||||
| Securities available for sale |
102,695 | 189,853 | ||||||
| Restricted investments |
14,696 | 6,254 | ||||||
| Loans held for sale |
147,281 | 8,034 | ||||||
| Loans, net of allowance for loan losses of $14,053 and $9,695 |
2,058,191 | 1,128,576 | ||||||
| Premises and equipment, net of accumulated depreciation of $6,118 and $3,324 |
56,388 | 29,810 | ||||||
| Accrued interest receivable |
7,856 | 4,974 | ||||||
| Deferred tax asset, net |
19,526 | 1,742 | ||||||
| Bank owned life insurance |
39,670 | 24,606 | ||||||
| Goodwill |
16,750 | 11,935 | ||||||
| Other intangible assets, net of accumulated amortization of $1,188 and $532 |
7,493 | 3,367 | ||||||
| Other real estate owned |
4,647 | 927 | ||||||
| Other assets |
23,617 | 9,905 | ||||||
| Total assets |
$ | 2,747,289 | $ | 1,470,583 | ||||
| Liabilities and equity |
||||||||
| Liabilities |
||||||||
| Deposits: |
||||||||
| Non-interest bearing |
$ | 301,210 | $ | 119,116 | ||||
| Interest bearing |
1,998,688 | 1,097,353 | ||||||
| Total Deposits |
2,299,898 | 1,216,469 | ||||||
| Securities sold under agreements to repurchase |
6,605 | 6,892 | ||||||
| Short-term borrowings |
55,039 | 5,292 | ||||||
| Long-term debt |
87,800 | 65,689 | ||||||
| Accrued interest payable |
1,950 | 1,090 | ||||||
| Other liabilities |
38,111 | 11,258 | ||||||
| Total liabilities |
2,489,403 | 1,306,690 | ||||||
| Equity |
||||||||
| Common stock, no par value; 50,000,000 shares authorized; 12,074,757 issued and 11,971,399 outstanding at December 31, 2010, and 7,226,041 shares issued and 7,122,683 outstanding at December 31, 2009 |
— | — | ||||||
| Additional paid-in capital |
271,350 | 172,409 | ||||||
| Accumulated deficit |
(10,868 | ) | (4,025 | ) | ||||
| Accumulated other comprehensive income (loss) |
251 | (414 | ) | |||||
| Less: cost of treasury stock, 103,358 shares at December 31, 2010 and 2009 |
(4,093 | ) | (4,093 | ) | ||||
| Total stockholders’ equity |
256,640 | 163,877 | ||||||
| Noncontrolling interests |
1,246 | 16 | ||||||
| Total equity |
257,886 | 163,893 | ||||||
| Total liabilities and equity |
$ | 2,747,289 | $ | 1,470,583 | ||||
See Notes to the Consolidated Financial Statements
67
Table of Contents
Tower Bancorp, Inc. and Subsidiaries
Consolidated Statements of Operations
Years Ended December 31, 2010, 2009, and 2008
(Amounts in thousands, except share and per share data)
| For the Year Ended December 31, | ||||||||||||
| 2010 | 2009 | 2008 | ||||||||||
| Interest income |
||||||||||||
| Loans, including fees |
$ | 72,713 | $ | 54,304 | $ | 31,026 | ||||||
| Securities |
3,988 | 1,956 | 916 | |||||||||
| Federal funds sold and other |
122 | 123 | 215 | |||||||||
| Total interest income |
76,823 | 56,383 | 32,157 | |||||||||
| Interest expense |
||||||||||||
| Deposits |
18,056 | 17,963 | 15,106 | |||||||||
| Short-term borrowings |
559 | 398 | 559 | |||||||||
| Long-term debt |
3,539 | 2,067 | 816 | |||||||||
| Total interest expense |
22,154 | 20,428 | 16,481 | |||||||||
| Net interest income |
54,669 | 35,955 | 15,676 | |||||||||
| Provision for loan losses |
9,050 | 5,216 | 2,550 | |||||||||
| Net interest income after provision for loan losses |
45,619 | 30,739 | 13,126 | |||||||||
| Noninterest income |
||||||||||||
| Service charges on deposit accounts |
3,232 | 2,156 | 809 | |||||||||
| Other service charges, commissions and fees |
2,920 | 2,131 | 792 | |||||||||
| Gain on sale of mortgage loans originated for sale |
2,544 | 1,521 | 528 | |||||||||
| Gain on sale of other assets |
587 | 364 | 240 | |||||||||
| Impairment losses on securities available for sale |
(206 | ) | (185 | ) | — | |||||||
| Increase in cash surrender value of bank owned life insurance |
1,524 | 1,034 | 305 | |||||||||
| Other income |
1,091 | 1,622 | 415 | |||||||||
| Total noninterest income |
11,692 | 8,643 | 3,089 | |||||||||
| Noninterest expenses |
||||||||||||
| Salaries and employee benefits |
24,819 | 15,841 | 8,100 | |||||||||
| Occupancy and equipment |
7,883 | 5,479 | 2,356 | |||||||||
| Amortization of intangible assets |
656 | 532 | — | |||||||||
| FDIC insurance premiums |
2,652 | 1,747 | 278 | |||||||||
| Advertising and promotion |
1,087 | 972 | 369 | |||||||||
| Data processing |
2,518 | 2,050 | 654 | |||||||||
| Communication |
1,137 | 709 | 249 | |||||||||
| Professional service fees |
2,021 | 1,155 | 518 | |||||||||
| Impairment of long-lived assets |
920 | — | — | |||||||||
| Other operating expenses |
5,479 | 3,242 | 1,279 | |||||||||
| Restructuring charges |
2,920 | — | — | |||||||||
| Merger related expenses |
2,677 | 2,080 | — | |||||||||
| Total noninterest expenses |
54,769 | 33,807 | 13,803 | |||||||||
| Income before income taxes |
2,542 | 5,575 | 2,412 | |||||||||
| Income tax expense |
1,223 | 1,829 | 333 | |||||||||
| Net income including noncontrolling interests |
1,319 | 3,746 | 2,079 | |||||||||
| Less: income (loss) from noncontrolling interests |
161 | 37 | (3 | ) | ||||||||
| Net income for Tower Bancorp, Inc. |
$ | 1,158 | $ | 3,709 | $ | 2,082 | ||||||
| Per share data |
||||||||||||
| Net income per share |
||||||||||||
| Basic |
$ | 0.16 | $ | 0.72 | $ | 0.76 | ||||||
| Diluted |
$ | 0.16 | $ | 0.72 | $ | 0.76 | ||||||
| Dividends declared |
$ | 1.12 | $ | 0.84 | $ | — | ||||||
| Weighted Average Common Shares Outstanding |
||||||||||||
| Basic |
7,359,478 | 5,156,078 | 2,734,027 | |||||||||
| Diluted |
7,361,774 | 5,161,325 | 2,734,027 | |||||||||
See Notes to the Consolidated Financial Statements
68
Table of Contents
Tower Bancorp, Inc. and Subsidiary
Consolidated Statement of Changes in Equity and Comprehensive Income
Years Ended December 31, 2010, 2009 and 2008
(Amounts in thousands, except share and per share data)
| Shares Outstanding |
Common Stock |
Additional Paid-in Capital |
Accu- mulated Deficit |
Accumulated Other Compre- hensive Income (Loss) |
Treasury Stock |
Non- controlling Interest |
Total | |||||||||||||||||||||||||
| Balance—January 1, 2008 |
2,420,481 | $ | — | $ | 57,037 | $ | (4,991 | ) | $ | 39 | $ | — | $ | (18 | ) | $ | 52,067 | |||||||||||||||
| Restricted common stock awards earned |
333 | 333 | ||||||||||||||||||||||||||||||
| Stock option expense |
177 | 177 | ||||||||||||||||||||||||||||||
| Comprehensive income: |
||||||||||||||||||||||||||||||||
| Net income |
2,082 | (3 | ) | 2,079 | ||||||||||||||||||||||||||||
| Unrealized gain on securities available for sale, net of taxes of $76 |
108 | 108 | ||||||||||||||||||||||||||||||
| Total comprehensive income |
2,187 | |||||||||||||||||||||||||||||||
| Balance—December 31, 2008 |
2,420,481 | $ | — | $ | 57,547 | $ | (2,909 | ) | $ | 147 | $ | — | $ | (21 | ) | $ | 54,764 | |||||||||||||||
| Restricted common stock awards earned |
1,902 | 295 | 295 | |||||||||||||||||||||||||||||
| Stock option expense |
569 | 569 | ||||||||||||||||||||||||||||||
| Fair value of consideration exchanged in merger with Graystone Financial Corp. |
2,636,453 | 61,946 | (4,093 | ) | 57,853 | |||||||||||||||||||||||||||
| Dividends declared ($0.84 per share) |
(4,825 | ) | (4,825 | ) | ||||||||||||||||||||||||||||
| Proceeds from stock purchase plans |
21,347 | 469 | 469 | |||||||||||||||||||||||||||||
| Proceeds from common stock offering, net of expenses |
2,042,500 | 51,583 | 51,583 | |||||||||||||||||||||||||||||
| Comprehensive income: |
||||||||||||||||||||||||||||||||
| Net Income |
3,709 | 37 | 3,746 | |||||||||||||||||||||||||||||
| Unrealized loss on securities available for sale, net of taxes of $228 |
(444 | ) | (444 | ) | ||||||||||||||||||||||||||||
| Reclassification of realized gain on sale of securities, net of taxes of $61 |
(117 | ) | (117 | ) | ||||||||||||||||||||||||||||
| Total Comprehensive Income |
3,185 | |||||||||||||||||||||||||||||||
| Balance—December 31, 2009 |
7,122,683 | $ | — | $ | 172,409 | $ | (4,025 | ) | $ | (414 | ) | $ | (4,093 | ) | $ | 16 | $ | 163,893 | ||||||||||||||
| Stock issued as investment in Dellinger, Dolan, McCurdy and Phillips Investment Advisors, LLC (“DDMP”) |
51 | 51 | ||||||||||||||||||||||||||||||
| Restricted common stock awards earned |
31,340 | 86 | 86 | |||||||||||||||||||||||||||||
| Stock option expense |
111 | 111 | ||||||||||||||||||||||||||||||
| Fair value of consideration exchanged in merger with First Chester County Corporation |
2,248,438 | 49,780 | 1,069 | 50,849 | ||||||||||||||||||||||||||||
| Dividends declared ($1.12 per share) |
(8,001 | ) | (8,001 | ) | ||||||||||||||||||||||||||||
| Proceeds from stock purchase plans |
40,272 | 859 | 859 | |||||||||||||||||||||||||||||
| Proceeds from common stock offering, net of expenses |
2,528,666 | 48,054 | 48,054 | |||||||||||||||||||||||||||||
| Comprehensive Income: |
— | |||||||||||||||||||||||||||||||
| Net Income |
1,158 | 161 | 1,319 | |||||||||||||||||||||||||||||
| Unrealized gain on securities available for sale, net of taxes of $347 |
665 | 665 | ||||||||||||||||||||||||||||||
| Total Comprehensive Income |
2,055 | |||||||||||||||||||||||||||||||
| Balance—December 31, 2010 |
11,971,399 | $ | — | $ | 271,350 | $ | (10,868 | ) | $ | 251 | $ | (4,093 | ) | $ | 1,246 | $ | 257,886 | |||||||||||||||
See Notes to the Consolidated Financial Statements
69
Table of Contents
Tower Bancorp, Inc. and Subsidiaries
Consolidated Statements of Cash Flows
Years Ended December 31, 2010, 2009, and 2008
(Amounts in thousands, except share and per share data)
| 2010 | 2009 | 2008 | ||||||||||
| Cash flows from operating activities |
||||||||||||
| Net income including noncontrolling interest |
$ | 1,319 | $ | 3,746 | $ | 2,079 | ||||||
| Adjustments to reconcile net income to net cash provided by (used in) operating activities: |
||||||||||||
| Provision for loan losses |
9,050 | 5,216 | 2,550 | |||||||||
| Net amortization and (accretion) |
1,508 | 738 | (49 | ) | ||||||||
| Depreciation |
2,920 | 1,751 | 761 | |||||||||
| Amortization of intangible assets |
656 | 532 | — | |||||||||
| Amortization of unearned compensation on restricted stock |
86 | 295 | 333 | |||||||||
| Stock options expense |
111 | 569 | 177 | |||||||||
| Deferred income tax (benefit) expense |
(2,466 | ) | 417 | (1,040 | ) | |||||||
| Increase in accrued interest receivable |
(206 | ) | (786 | ) | (341 | ) | ||||||
| (Decrease) increase in accrued interest payable |
(120 | ) | (496 | ) | 323 | |||||||
| Net increase in the cash surrender value of life insurance |
(1,524 | ) | (1,034 | ) | (305 | ) | ||||||
| Decrease (increase) in other assets |
6,146 | (8,329 | ) | (536 | ) | |||||||
| Increase (decrease) in other liabilities |
4,560 | (2,677 | ) | 4,239 | ||||||||
| Impairment of premises and equipment |
920 | — | — | |||||||||
| Gain on sale of deposits |
— | — | (250 | ) | ||||||||
| Gain on sale of assets |
(2,925 | ) | (1,729 | ) | (768 | ) | ||||||
| Loans originated for sale |
(239,070 | ) | (136,710 | ) | (96,182 | ) | ||||||
| Sale of loans |
277,842 | 138,520 | 93,732 | |||||||||
| Net cash provided by operating activities |
58,807 | 23 | 4,723 | |||||||||
| Cash flows from investing activities |
||||||||||||
| Proceeds from sales and maturities of securities available for sale |
205,629 | 108,080 | 53,134 | |||||||||
| Purchases of securities available for sale |
(73,801 | ) | (221,419 | ) | (44,875 | ) | ||||||
| Purchases of bank owned life insurance |
(12,000 | ) | — | (12,000 | ) | |||||||
| Net increase in loans |
(201,795 | ) | (159,065 | ) | (188,465 | ) | ||||||
| Decrease (increase) of investment in restricted investments |
2,127 | 1,024 | (1,762 | ) | ||||||||
| Purchases of premises and equipment |
(3,659 | ) | (4,382 | ) | (1,143 | ) | ||||||
| Net proceeds from sale of premises and equipment |
29 | 11 | 1,470 | |||||||||
| Net cash received in merger/ acquisition |
67,176 | 9,017 | — | |||||||||
| Net cash used in investing activities |
(16,294 | ) | (266,734 | ) | (193,641 | ) | ||||||
70
Table of Contents
| 2010 | 2009 | 2008 | ||||||||||
| Cash flows from financing activities |
||||||||||||
| Proceeds from the issuance of subordinated debt |
12,000 | 9,000 | — | |||||||||
| Proceeds from other borrowings |
50,000 | 6,450 | 39,184 | |||||||||
| Repayment of other borrowings |
(43,902 | ) | (57,408 | ) | — | |||||||
| Net decrease in securities sold under agreements to repurchase |
(287 | ) | (1,492 | ) | (17,956 | ) | ||||||
| Net increase in deposits |
96,643 | 281,512 | 176,572 | |||||||||
| Proceeds from the issuance of common stock |
48,913 | 52,052 | — | |||||||||
| Dividends paid on common stock |
(8,001 | ) | (4,825 | ) | — | |||||||
| Net cash provided by financing activities |
155,366 | 285,289 | 197,800 | |||||||||
| Net increase in cash and cash equivalents |
197,879 | 18,578 | 8,882 | |||||||||
| Cash and cash equivalents - beginning |
50,600 | 32,022 | 23,140 | |||||||||
| Cash and cash equivalents - ending |
$ | 248,479 | $ | 50,600 | $ | 32,022 | ||||||
| Supplemental disclosure of information: |
||||||||||||
| Interest paid |
$ | 21,294 | $ | 20,924 | $ | 16,139 | ||||||
| Income taxes paid |
$ | 4,750 | $ | 1,335 | $ | 1,597 | ||||||
| Supplemental schedule of noncash investing and financing activities |
||||||||||||
| Transfer of long-term debt to short-term borrowings |
$ | 5,039 | $ | 5,250 | $ | — | ||||||
| Common stock issued for acquisition |
49,780 | 57,853 | — | |||||||||
| Other real estate acquired in settlement of loan |
3,720 | 927 | — | |||||||||
| Unrealized gain (loss) on investments securities available for sale (net of tax effects) |
665 | (561 | ) | 108 | ||||||||
| Other-than-temporary impairment of investments |
(206 | ) | (156 | ) | — | |||||||
See Notes to the Consolidated Financial Statements
71
Table of Contents
NOTES TO CONSOLIDATED FINANCIAL STATEMENTS
(amounts in thousands except for share and per share data)
Note 1 – Summary of Significant Accounting Policies
Organization and Nature of Operations
Tower Bancorp, Inc. (the “Company”) is a registered bank holding company that was incorporated in 1983 under the Bank Holding Company Act of 1956, as amended. On March 31, 2009, the Company merged with Graystone Financial Corp. (“Graystone”), a privately held, non-reporting corporation and a registered bank holding company under the Bank Holding Company Act of 1956, as amended (the “Graystone Merger”). Pursuant to an Agreement and Plan of Merger between the Company and Graystone (the “Graystone Merger Agreement”), the Company remains the surviving bank holding company and the First National Bank of Greencastle has merged with and into Graystone Bank, the wholly-owned subsidiary of Graystone, with Graystone Bank as the surviving institution under the name “Graystone Tower Bank”(the “Bank”).
On December 10, 2010, the Company acquired First Chester County Corporation (“First Chester”), a publicly held corporation and a registered bank holding company under the Bank Holding Company Act of 1956, as amended (the “FCEC Merger”). Pursuant to an Agreement and Plan of Merger between the Company and First Chester (the “FCEC Merger Agreement”), the Company remains the surviving bank holding company and the First National Bank of Chester County (“FNB”) merged with and into the Bank, with the Bank as the surviving institution.
The Bank was originally incorporated on September 2, 2005, as a Pennsylvania-chartered bank and commenced operations on November 10, 2005. As a state chartered bank, the Bank is subject to regulation by the Federal Deposit Insurance Corporation (“FDIC”) and the Pennsylvania Department of Banking and undergoes periodic examinations by these regulatory authorities.
The Bank is a full-service community bank operating forty-nine offices in Centre, Chester, Cumberland, Dauphin, Delaware, Fulton, Franklin, Lancaster, Lebanon and York Counties of Pennsylvania and Washington County of Maryland. The Bank operates through three divisions – “Graystone Bank, a division of Graystone Tower Bank”, consisting of the former Graystone Bank branches, “Tower Bank, a division of Graystone Tower Bank,” consisting of the former branches of The First National Bank of Greencastle and “1N Bank, a division of Graystone Tower Bank” consisting of the former branches of The First National Bank of Chester County.
In January 2007, Graystone Mortgage, LLC commenced business as a mortgage banking subsidiary of the Bank, which holds a ninety percent (90%) interest in the mortgage subsidiary. Graystone Mortgage, LLC offers residential mortgage banking services within the Bank’s market areas.
Basis of Presentation
The accompanying consolidated financial statements include the accounts of Tower Bancorp, Inc. and its wholly-owned subsidiaries. All intercompany accounts and transactions are eliminated from the consolidated financial statements.
Our accounting and reporting policies conform to general practices within the banking industry and to U.S. generally accepted accounting principles (“U.S. GAAP”). Reclassifications of prior years’ amounts are made whenever necessary to conform to the current year’s presentation.
The aforementioned Graystone Merger was considered a “merger of equals” and is accounted for as a reverse merger using the acquisition method of accounting with Graystone as the accounting acquirer. As a result, the historical financial information prior to the Graystone Merger included in our financial statements and related notes as reported in this Form 10-K is that of Graystone. The Graystone audited financial statements and footnotes for the year ended December 31, 2008 have been filed with the Securities and Exchange Commission (“SEC”) within Form 8-K/A on June 1, 2009.
72
Table of Contents
Correction of an Immaterial Error
During the fourth quarter of 2010, management recorded an increase to FDIC insurance expense of $549, of which a portion related to periods previously reported within quarterly financial statements on Form 10-Q during 2010 and 2009 and the 2009 annual report as filed on Form 10-K. We have completed an analysis of the impact to previously reported periods and have determined that there is no material effect on any period currently or previously presented.
Use of Estimates
The preparation of financial statements in conformity with U.S. GAAP requires us to make estimates and assumptions that affect the reported amounts of assets and liabilities and disclosure of contingent assets and liabilities at the date of the financial statements and the reported amounts of revenues and expenses during the reporting period. Actual results could differ from those estimates. Material estimates that are particularly susceptible to significant change in the near term relate to the determination of the allowance for loan losses, the potential other-than-temporary impairment of investments, and the valuation of deferred tax assets.
Segment Information
We do not have any operating segments which require disclosure of additional information. While the Bank operates as three divisions, each engages in similar activities, provides similar products and services, and operates in the same general geographical area and as such, meets the aggregation criteria to be disclosed as one reportable segment. Our non-banking activities are immaterial and, therefore, separate information has not been disclosed.
Significant Group Concentrations of Credit Risk
Most of our activities are with customers located within central and southeastern Pennsylvania and Washington County, Maryland. Note 3 discusses the types of securities in which we invest. Note 4 discusses the types of lending in which we engage. We do not have any significant concentrations to any one industry or customer.
Cash and Cash Equivalents
For purposes of reporting cash flows, cash and cash equivalents include cash on hand, amounts due from banks, and federal funds sold, all of which mature within 90 days. Federal funds are purchased and sold for one-day periods.
We are required under Federal Reserve Board regulations to maintain reserves against its transaction accounts. These reserves are generally held in the form of cash or noninterest earning accounts at our wholly-owned subsidiary, the Bank. Based on the nature of our transaction account deposits and the amount of vault cash on hand, we were not required to maintain a reserve balance with the Federal Reserve Board at December 31, 2010 and 2009.
Securities Available for Sale
We determine the appropriate classification of debt and equity securities at the time of purchase and re-evaluate such designation as of each balance sheet date. Purchases and sales of investment securities are accounted for on a trade date basis.
All investment securities are classified as available for sale as we intend to hold such securities for an indefinite period of time but not necessarily to maturity. Securities available for sale are carried at fair value. Any decision
73
Table of Contents
to sell a security classified as available for sale would be based on various factors, including movement in interest rates, changes in maturity mix of our assets and liabilities, liquidity needs, regulatory capital considerations and other similar factors. Unrealized gains and losses are excluded from earnings and reported as increases or decreases in other comprehensive income or loss. Realized gains or losses, determined on the basis of the cost of the specific securities sold, are included in earnings. Premiums and discounts are recognized in interest income using the interest method over the terms of the securities.
Declines in the fair value of available for sale equity securities below their cost that are deemed to be other than temporary are reflected in earnings as realized losses. In estimating other-than-temporary impairment losses, we considers (1) the length of time and the extent to which the fair value has been less than cost, (2) the financial condition and near-term prospects of the issuer, and (3) our intent and ability to retain the investment in the issuer for a period of time sufficient to allow for any anticipated recovery in fair value.
In regard to debt securities, if we do not intend to sell the securities and it is more likely than not that we will not be required to sell the debt security prior to recovery, we will then evaluate whether a credit loss has occurred. To determine whether a credit loss has occurred, we compare the amortized cost of the debt security to the present value of the cash flows we expect to be collected. If we expect a cash flow shortfall, we will consider a credit loss to have occurred and will then consider the impairment to be other than temporary. We will recognize the amount of the impairment loss related to the credit loss in the results of operations, with the remaining portion of the loss recorded through comprehensive income, net of applicable taxes.
Restricted Investment in Bank Stocks
Restricted investment in bank stocks includes Atlantic Central Bankers Bank and Federal Home Loan Bank (FHLB) stocks. The stocks are carried at cost as these stocks are not actively traded and have no readily determinable market value.
As of December 31, 2010 and 2009, we had a restricted investment in the Federal Home Loan Bank of Pittsburgh “(FHLB)” of $14,496 and $6,124, respectively. In December 2008, the FHLB notified member banks that it was suspending dividend payments and the repurchase of capital stock, which has continued during 2009 and 2010.
We determine whether these investments are impaired based on an assessment of the ultimate recoverability of their cost rather than by recognizing temporary declines in value. The determination of whether a decline affects the ultimate recoverability of their cost is influenced by criteria such as (1) the significance of the decline in net assets of the FHLB as compared to the capital stock amount for the FHLB and the length of time this situation has persisted, (2) commitments by the FHLB to make payments required by law or regulation and the level of such payments in relation to the operating performance of the FHLB, and (3) the impact of legislative and regulatory changes on institutions and, accordingly, on the customer base of the FHLB.
We believe no impairment charge is necessary related to the investment in FHLB stock as of December 31, 2010.
Loans Held for Sale
Loans originated and intended for sale in the secondary market are carried at the lower of aggregate cost or fair value, as determined by aggregate outstanding commitments from investors or current investor yield requirements. Net unrealized gains and losses are recognized through a valuation allowance by charges to income.
Mortgage loans held for sale are sold with the mortgage servicing rights released to another financial institution through a correspondent relationship. The correspondent financial institution absorbs all of the risk related to rate lock commitments. Gains or losses on sales of mortgage loans are recognized based on the difference between the selling price and the carrying value of the related mortgage loans sold.
74
Table of Contents
Loans Receivable
Loans receivable that we have the intent and ability to hold for the foreseeable future or until maturity or payoff are stated at their outstanding unpaid principal balances, net of an allowance for loan losses and any deferred fees or costs. Interest income is accrued on the unpaid principal balance. Loan origination fees, net of certain direct origination costs, are deferred and recognized as an adjustment of the yield (interest income) of the related loans. We are amortizing these amounts over the contractual life of the loan.
The accrual of interest is discontinued when the contractual payment of principal or interest has become 90 days past due or we have serious doubts about further collectability of principal or interest, even though the loan is currently performing. A loan may remain on accrual status if it is in the process of collection and is either guaranteed or well secured. When a loan is placed on nonaccrual status, unpaid interest credited to income in the current year is reversed and unpaid interest accrued in prior years is charged against the allowance for loan losses. Interest received on nonaccrual loans generally is either applied against principal or reported as interest income, according to our judgment as to the collectability of principal. Generally, loans are restored to accrual status when the obligation is brought current, has performed in accordance with the contractual terms for a reasonable period of time and the ultimate collectability of the total contractual principal and interest is no longer in doubt.
Acquired Loans
Loans that we acquire in connection with acquisitions subsequent to January 1, 2009 are recorded at fair value with no carryover of the related allowance for credit losses. Fair value of the loans involves estimating the amount and timing of principal and interest cash flows expected to be collected on the loans and discounting those cash flows at a market rate of interest.
The excess of cash flows expected at acquisition over the estimated fair value is referred to as the accretable discount and is recognized into interest income over the remaining life of the loan. The difference between contractually required payments at acquisition and the cash flows expected to be collected at acquisition is referred to as the nonaccretable discount. The nonaccretable discount includes estimated future credit losses expected to be incurred over the life of the loan. Subsequent decreases to the expected cash flows will require us to evaluate the need for an additional allowance for credit losses. Subsequent improvement in expected cash flows will result in the reversal of a corresponding amount of the nonaccretable discount which we will then reclassify as accretable discount that will be recognized into interest income over the remaining life of the loan.
Acquired loans that met the criteria for nonaccrual of interest prior to the acquisition may be considered performing upon acquisition, regardless of whether the customer is contractually delinquent. We expect to fully collect the new carrying value (i.e. fair value) of the loans. As such, we may no longer consider the loan to be nonaccrual or nonperforming and may accrue interest on these loans, including the impact of any accretable discount. In addition, charge-offs on such loans would be first applied to the nonaccretable difference portion of the fair value adjustment.
Allowance for Loan Losses
The allowance for loan losses represents our estimate of losses inherent in the loan portfolio as of the balance sheet date and is recorded as a reduction to loans. The allowance for loan losses is established through provisions for loan losses charged against income as losses are estimated to have occurred. Loans deemed to be uncollectible are charged against the allowance for loan losses, and subsequent recoveries, if any, are credited to the allowance.
The allowance for loan losses is maintained at a level considered adequate to provide for losses that can be reasonably estimated. Our periodic evaluation of the adequacy of the allowance is based on known and inherent risks in the portfolio, adverse situations that may affect the borrower’s ability to repay, the estimated value of any
75
Table of Contents
underlying collateral, composition of the loan portfolio, current economic conditions and other relevant factors. This evaluation is inherently subjective as it requires material estimates that may be susceptible to significant change.
For commercial loans, we utilize an internal risk rating process. Loans are rated using a scale of 1 through 9 in determining the overall risk of loss on the loan. Risk ratings are initially assigned to loans by loan officers and are reviewed on a regular basis. Ratings will change based on ongoing monitoring process that analyzes the deterioration or the improvement of the borrowers’ current and future ability to repay the outstanding loan balances. Loans relationships that continue to show signs of deterioration are evaluated through specific loan review. While assigning risk ratings involves judgment, the risk rating process allows us to identify potential risks in a timely manner and to allocate resources to managing troubled accounts.
The risk rating process is not practical for consumer and residential mortgages because these portfolios consist of a larger number of loans with smaller balances. Instead, these portfolios are evaluated for risk based on the payment history performance.
Our credit department conducts quarterly reviews of all criticized loans and lending relationships. These reviews include an analysis of loan to value ratios, debt service coverage ratios, reviews of financial statements and tax returns of the borrower and any guarantors, and updates provided by lenders, relationship managers and collection personnel, including, as appropriate, collateral and/or property inspections.
Our allowance for loan losses consists of two components: (1) specific allowance allocated to loans identified and evaluated for impairment and (2) general allowance calculated for pools of loans. The specific allowance competent relates to commercial loans that are classified as doubtful, substandard, or special mention through the risk rating process or consumer and residential mortgage loans that have been classified as nonperforming. For such loans, an allowance is established when the discounted cash flows (or collateral value or observable market price) of the loan is lower than the carrying value of that loan. The general allowance component covers non-classified loans that have been segmented into groups with similar characteristics and is based on historical loss experience adjusted for qualitative factors. Historical loss factors are based on the loss activity from the previous eight quarters. Qualitative factors include trends in volume of loans, changes in lending policies and review and National and Local economic trends.
A loan is considered impaired when, based on current information and events, it is probable that we will be unable to collect the scheduled payments of principal or interest when due according to the contractual terms of the loan agreement. Factors considered in determining impairment include payment status, collateral value and the probability of collecting scheduled principal and interest payments when due. Loans that experience insignificant payment delays and payment shortfalls generally are not classified as impaired. We determine the significance of payment delays and payment shortfalls on a case-by-case basis, taking into consideration all of the circumstances surrounding the loan and the borrower, including the length of the delay, the reasons for the delay, the borrower’s prior payment record and the amount of the shortfall in relation to the principal and interest owed. Impairment is evaluated on a loan by loan basis for commercial and construction loans and is measured as the difference between a loan’s carried value on the balance sheet and its fair market value. Based on the nature of the loan, its fair value reflects one of the following three measures: (i) the fair market value of collateral; (ii) the present value of the expected future cash flows; or (iii) the loan’s value as observable in the secondary market. Estimated fair values for collateral dependent loans (other than loans recorded in accordance with ASC 310-30) are derived from appraisals obtained from third party valuation experts. We do not use automated valuation methodologies when valuing these collateral dependent loans. At a minimum, we receive annual appraisals on real estate collateral for all loans classified as substandard. These appraisals are reviewed on a quarterly basis by our credit department as part of our quarterly review of all criticized assets. Downward adjustments to the appraised values are made on a loan by loan basis should the quarterly credit quality review indicate circumstances warranting a reduction in this value. It is not typical for appraised values to be increased; rather if we believe that an increase in collateral value has occurred, a new appraisal will be obtained.
Large groups of smaller balance homogeneous loans are collectively evaluated for impairment. Accordingly, we do not separately identify individual consumer loans for impairment disclosures.
76
Table of Contents
Other Real Estate Owned
Foreclosed properties are those properties for which we have taken physical possession in connection with loan foreclosure proceedings.
At the time of foreclosure, foreclosed real estate is presumed to be held for sale and therefore recorded at its fair value less costs to sell. Any write-downs based on the asset’s fair value at date of acquisition are charged to the allowance for loan losses. After foreclosure, these assets are carried at lower cost or fair value less cost to sell. Improvements to the property are added to the basis of the assets. Costs incurred in maintaining foreclosed real estate and subsequent adjustments to the carrying amount of the property are classified as “other expenses.”
Business Combinations and Intangible Assets
We account for our merger and acquisitions using the acquisition accounting method. Acquisition accounting requires the total purchase price to be allocated to the estimated fair values of assets acquired and liabilities assumed, including certain intangible assets that must be recognized. Typically, this allocation results in the purchase price exceeding the fair value of net assets acquired, which is recorded as goodwill. Core deposit intangibles are a measure of the value of checking, money market and savings deposits acquired in business combinations accounted for under the purchase method. Core deposit intangibles are being amortized over their average estimated useful lives of ten years. Other identified intangibles with finite useful lives are amortized over their estimated useful lives. We complete an annual impairment test for goodwill and other intangible assets. Identifiable intangible assets are evaluated for impairment if events and circumstances indicate a possible impairment. There can be no assurance that future goodwill impairment tests will not result in a charge to earnings.
Mortgage servicing rights (MSRs) are recognized as separate assets when mortgage loans are sold and the servicing rights are retained. Capitalized residential MSRs are reported in other assets and are amortized into noninterest income in proportion to, and over the period of, the estimated future net servicing period of the underlying mortgage loans. Capitalized commercial MSRs are reported in other assets and are remeasured at fair value each reporting period. MSRs are evaluated for impairment based upon the fair value of the rights as compared to amortized cost. We engage a third party service provider who estimates the fair value of MSRs using discounted cash flow models that calculate the present value of estimated future net servicing income. The model uses readily available prepayment speed assumptions for the current interest rates of the portfolios serviced. MSRs are carried at the lower of amortized cost or estimated fair value. Impairment is recognized through a valuation allowance, to the extent that fair value is less than the unamortized capitalized amount.
Goodwill
Goodwill represents the excess of the purchase price over the underlying fair value of merged entities. We assess goodwill for impairment annually as of October 31st of each year. If certain events occur which indicate goodwill might be impaired between annual tests, goodwill must be tested when such events occur. In making this assessment, we consider a number of factors including operating results, business plans, economic projections, anticipated futures cash flows, current market data, etc. There are inherent uncertainties related to these factors and our judgment in applying them to the analysis of goodwill impairment. Changes in economic and operating conditions could result in goodwill impairment in future periods. We tested goodwill for impairment as of October 31, 2010 and determined that no impairment had occurred.
Transfers of Financial Assets
We sell interests in loans receivable through loan participation sales. We account for these transactions as sales, when control over the assets is surrendered. Control over transferred assets is deemed to be surrendered when (1) the assets are isolated, (2) the transferee obtains the right (free of conditions that constrain it from taking advantage of that right) to pledge or exchange the transferred assets, and (3) we do not maintain effective control over the transferred assets through an agreement to repurchase them before their maturity.
77
Table of Contents
Premises and Equipment
Premises and equipment are stated at cost less accumulated depreciation. Depreciation is computed on the straight-line method over the shorter of the remaining lease term, if applicable, or the economic life which is reflected in the following average lives:
| Years | ||
| Automobiles |
3 - 5 | |
| Building and leasehold improvements |
10 - 39 | |
| Furniture, fixtures, and equipment |
3 - 10 | |
| Software and computer equipment |
2 - 5 |
Bank Owned Life Insurance
We have purchased bank owned life insurance (“BOLI”) policies on certain employees as a means to generate tax-exempt income which is used to offset a portion of current and future employee benefit costs. The BOLI policies profit from the appreciation of the cash surrender value of the pool of insurance and are recorded as part of “Noninterest Income.”
Net Income Per Share
Our basic net income per share is calculated as net income divided by the weighted average number of shares outstanding. For diluted net income per share, net income is divided by the weighted average number of shares outstanding plus the incremental number of shares added as a result of converting common stock equivalents, calculated using the treasury stock method. Our common stock and equivalents consist solely of outstanding stock options and restricted stock. The effects of options to issue common stock and restricted stock are excluded from the computation of diluted earnings per share in periods in which the effect would be antidilutive.
A reconciliation of the weighted average shares outstanding used to calculate basic net income per share and diluted net income per share follows:
| For the Year Ended December 31, | ||||||||||||
| 2010 | 2009 | 2008 | ||||||||||
| Weighted average shares outstanding |
7,359,478 | 5,156,078 | 2,734,027 | |||||||||
| Impact of common stock equivalents |
2,296 | 5,247 | — | |||||||||
| Weighted average shares outstanding |
7,361,774 | 5,161,325 | 2,734,027 | |||||||||
| Common stock equivalents excluded |
||||||||||||
| 121,357 | 68,150 | 83,895 | ||||||||||
Stock-Based Compensation
We recognize all share-based payments to employees in the consolidated statement of operations based on their fair values. The fair value of such equity instruments is recognized as an expense in the historical financial statements as services are performed. We use the Black-Scholes Model to estimate the fair value of each option on the date of grant. The Black-Scholes Model estimates the fair value of employee stock options using a pricing model which takes into consideration the exercise price of the option, the expected life of the option, the current market price and its expected volatility, the expected dividends on the stock and the current risk-free interest rate for the expected life of the option. We typically grant stock options to employees with an exercise price equal to the fair value of the shares at the date of grant. The fair value of restricted stock is equivalent to the fair value on the date of grant and is amortized over the vesting period.
Dividend Reinvestment and Employee Stock Purchase Plans
The Dividend Reinvestment and Stock Purchase Plan (the “Reinvestment Plan”) was adopted in June 2009 and allows for the issuance of 1,000,000 shares of common stock. As of December 31, 2010, 52,123 have been issued under the Reinvestment Plan, with 947,877 shares available for future purchase.
78
Table of Contents
The Employee Stock Purchase Plan (the “Purchase Plan”) was adopted by shareholders in May 2009 and allows for the issuance of 250,000 shares of common stock. Employees may elect to make contributions to the Purchase Plan in an aggregate amount not less than 1% or more than 10% of such employee’s total compensation. These contributions are then used to purchase stock during an offering period as defined by the Purchase Plan. The purchase price of the stock is based solely on the market price of the shares at the date of purchase. No compensation expense is recognized since the Purchase Plan qualifies as a non-compensatory plan. As of December 31, 2010, 9,496 shares were issued under the Purchase Plan, with 240,504 shares available for future purchase.
Advertising Costs
We charge advertising costs to expense as incurred.
Income Taxes
Deferred income taxes are provided on the liability method whereby deferred tax assets are recognized for deductible temporary differences and deferred tax liabilities are recognized for taxable temporary differences. Temporary differences are the differences between the reported amounts of assets and liabilities and their tax basis and any net operating loss carryforwards. Deferred tax assets are reduced by a valuation allowance when, in our opinion, it is more likely than not that some portion of the deferred tax assets will not be realized. Deferred tax assets and liabilities are adjusted for the effects of changes in tax laws and rates on the date of enactment.
We recognize the financial statement benefit of a tax position only after determining that the relevant tax authority would more likely than not sustain the position following an audit. For tax positions meeting the more-likely-than-not threshold, the amount recognized in the financial statements is the largest benefit that has a greater than 50 percent likelihood of being realized upon ultimate settlement with the relevant tax authority.
Comprehensive Income
Comprehensive income is defined as the change in equity from transactions and other events from non-owner sources. It includes all changes in equity except those resulting from investments by stockholders and distributions to stockholders. Comprehensive income includes net income and accounting for certain investments in debt and equity securities.
We have elected to report our comprehensive income in the statement of changes in equity. The components of the change in net unrealized gains (losses) on securities for the year ended December 31, 2010, 2009 and 2008 are as follows:
| For the Year Ended December 31, | ||||||||||||
| 2010 | 2009 | 2008 | ||||||||||
| Gross unrealized holding gains (losses) arising during the year |
$ | 1,384 | $ | (672 | ) | $ | 184 | |||||
| Reclassification adjustment for impairment losses recognized in net income |
206 | 185 | — | |||||||||
| Reclassification adjustment for gains realized in net income |
(578 | ) | (363 | ) | — | |||||||
| Net unrealized holding gains (losses) before taxes |
1,012 | (850 | ) | 184 | ||||||||
| Tax effect |
(347 | ) | 289 | (76 | ) | |||||||
| Net change |
$ | 665 | $ | (561 | ) | $ | 108 | |||||
Financial Instruments with Off-Balance Sheet Risk
In the ordinary course of business, we have entered into off-balance sheet financial instruments consisting of commitments to extend credit and letters of credit. Such financial instruments are recorded in the consolidated balance sheet when they are funded. See Note 15 for further discussion.
79
Table of Contents
Variable Interest Entities
As a result of the FCEC Merger, we acquired Issuer Trusts that have issued guaranteed preferred beneficial interests in our junior subordinated debentures. These Issuer Trusts are variable interest entities under ASC 810-10. In accordance with ASC 810-10, Consolidation, all the Issuer Trusts outstanding at December 31, 2010 and 2009 are not consolidated. The junior subordinated debentures issued to the Issuer Trusts at December 31, 2010 and 2009 are reflected in our Consolidated Balance Sheets in the liabilities section under the caption “Long-term debt.” We record interest expense on the corresponding debentures in our Consolidated Statements of Operations. We also recorded the common capital securities issued by the Issuer Trusts in other assets in its consolidated balance sheets at December 31, 2010 and 2009.
The Bank has partial ownership in certain affiliated business arrangements. These entities serve as a source for retail mortgage business through the entity’s relations with builders, realtors and other businesses. We evaluated these entities for consolidation under the requirements of ASC 810-10 Consolidation and determined that the Bank is the primary beneficiary of these variable interest entities. Accordingly, the assets and liabilities of these entities that were consolidated under the requirements of ASC 810-10 as of December 31, 2010 and 2009 are listed below. This table includes those entities in which the Bank has a non-majority ownership interest.
| December 31, 2010 |
December 31, 2009 |
|||||||
| Cash |
$ | 556 | $ | — | ||||
| Other assets |
146 | — | ||||||
| Total assets |
$ | 702 | $ | — | ||||
| Other liabilities |
$ | 133 | $ | — | ||||
| Total liabilities |
$ | 133 | $ | — | ||||
Non-controlling interests
In December 2007, the FASB updated ASC 810, Consolidation, which establishes accounting and reporting standards for the non-controlling interest in a subsidiary and for the deconsolidation of a subsidiary. Specifically, ASC 810 requires a non-controlling interest in a subsidiary to be reported as equity, separate from the parent’s equity, in the consolidated balance sheet and the amount of net income or loss and comprehensive income or loss attributable to the parent and non-controlling interest to be presented separately on the face of the consolidated financial statements. Changes in a parent’s ownership interest in its subsidiary in which a controlling financial interest is retained are accounted for as equity transactions. If a controlling financial interest in the subsidiary is not retained, the subsidiary is deconsolidated and any retained non-controlling equity interest is initially measured at fair value. We adopted the updates to ASC 810 effective December 10, 2010, including retrospective application for the presentation of periods prior to December 10, 2010. The adoption of the updates to ASC 810 did not have a significant impact on our Consolidated Financial Statements.
Recent Accounting Pronouncements
In December 2010, the FASB issued ASC Update No. 2010-29 for disclosures of supplementary pro forma information for business combinations. Update No. 2010-29 requires that pro forma information be presented as if the business combination occurred at the beginning of the prior annual reporting period for purposes of calculating both the current reporting period and the prior reporting period pro forma financial information. Update No. 2010-29 also requires that this disclosure be accompanied by a narrative description of the amount and nature of any material nonrecurring pro forma adjustments. This provision of Update No. 2010-29 is effective for the annual and interim periods beginning after December 15, 2010, or January 1, 2011 for us. The adoption of Update No. 2010-29 is not expected to impact our consolidated financial statements.
80
Table of Contents
In December 2010, the FASB issued ASC Update No. 2010-28 for all entities that have recognized goodwill and have one or more reporting units whose carrying amount for purposes of Step 1 of the goodwill impairment test is zero or negative. Update No. 2010-28 modifies Step 1 of the goodwill impairment test under FASB ASC Topic 350, Intangibles – Goodwill and Other, requiring the entity to perform Step 2 of the goodwill impairment test if it is more likely than not that a goodwill impairment exists. The entity should consider whether there are adverse qualitative factors in determining whether an interim impairment test between annual testing is necessary. The Update allows an entity to use either the equity or enterprise valuation premise to determine the carrying amount of the reporting unit. On adoption of the Update, the goodwill impairment that results from this requirement to perform Step 2 of the goodwill impairment test would be recognized as a cumulative effect adjustment to the beginning retained earnings in the period of adoption. This provision of Update No. 2010-28 is effective for the annual and interim periods beginning after December 15, 2010, or January 1, 2011 for us. Early adoption is prohibited. The adoption of Update No. 2010-28 is not expected to materially impact our consolidated financial statements.
In July 2010, the FASB issued ASC Update No. 2010-20 concerning disclosures about the credit quality of financing receivables and the allowance for credit losses. Update No. 2010-20 is intended to provide additional information to assist financial statement users in assessing an entity’s credit risk exposures and evaluating the adequacy of its allowance for credit losses. Update No. 2010-20 requires companies to (1) provide enhanced disclosures around the nature of credit risk inherent in the entity’s portfolio of financing receivables; (2) explain how that risk is analyzed and assessed in arriving at the allowance for credit losses; and (3) explain the changes and reasons for changes in the allowance for credit losses. The provisions of Update No. 2010-20 concerning disclosures for the end of a period are effective for interim and annual periods ending on or after December 15, 2010, or December 31, 2010 for us. The provisions of Update No. 2010-20 concerning disclosures about activity that occurs during a reporting period are applicable to us for interim and annual periods beginning on or after December 15, 2010, or the interim period ending on March 31, 2011. The adoption of Update No. 2010-20 provides the reader of our financial statements with expanded and enhanced disclosure surrounding the allowance for credit losses.
In January 2010, the FASB issued ASC Update No. 2010-06 for improving disclosures about fair value measurements. Update No. 2010-06 requires companies to disclose, and provide the reasons for, all transfers of assets and liabilities between the Level 1 and 2 fair value categories. It also clarifies that companies should provide fair value measurement disclosures for classes of assets and liabilities which are subsets of line items within the balance sheet, if necessary. In addition, Update No. 2010-06 clarifies that companies provide disclosures about the fair value techniques and inputs for assets and liabilities classified within Level 2 or 3 categories. The disclosure requirements prescribed by Update No. 2010-06 are effective for fiscal years beginning after December 15, 2009, and for interim periods within those fiscal years. We have implemented the disclosure requirements of Update No. 2010-06 which can be found in Note 18 of the Notes to the Consolidated Financial Statements. Update No. 2010-06 also requires companies to reconcile changes in Level 3 assets and liabilities by separately providing information about Level 3 purchases, sales, issuances and settlements on a gross basis. This provision of Update No. 2010-06 is effective for fiscal years beginning after December 15, 2010, and for interim periods within those fiscal years, or March 31, 2011 for us. The adoption of Update No. 2010-06 is not expected to materially impact our fair value measurement disclosures.
In June 2009, the FASB issued a pronouncement, which amends the consolidation guidance applicable to variable interest entities (“VIE”s). An entity would consolidate a VIE, as the primary beneficiary, when the entity has both of the following characteristics: (a) the power to direct the activities of a VIE that most significantly impact the entity’s economic performance and (b) the obligation to absorb losses of the entity that could potentially be significant to the VIE or the right to receive benefits from the entity that could potentially be significant to the VIE. Ongoing reassessment of whether an enterprise is the primary beneficiary of a VIE is required. This pronouncement eliminates the quantitative approach previously required for determining the primary beneficiary of a VIE. The pronouncement was effective for fiscal years and interim periods beginning after November 15, 2009. The updated guidance was adopted on January 1, 2010, which did not have an impact on our consolidated financial statements.
81
Table of Contents
In December 2007, the FASB issued a pronouncement that establishes accounting and reporting standards for the noncontrolling interest in a subsidiary and for the deconsolidation of a subsidiary. The guidance became effective as of January 1, 2009. The adoption of this pronouncement did not have a material impact to the consolidated financial statements. In January 2010, the FASB issued updated guidance relating to the decrease in ownership of a subsidiary. The updated guidance is effective at the beginning of the first interim or annual reporting period ending on or after December 15, 2009 and should be applied retrospectively. The updated guidance did not have a material impact on our consolidated financial statements.
Note 2 – Merger Accounting
FCEC Merger
On December 28, 2009, we announced the execution of FCEC Merger Agreement. The FCEC Merger became effective on December 10, 2010. Immediately following the holding company acquisition, the First Chester’s wholly-owned subsidiary, FNB, merged with and into the Bank, our wholly-owned subsidiary. The former offices of FNB are now operating under the title “1N Bank, a Division of Graystone Tower Bank” (the “1N Bank Division”). For the period since the effective date of the FCEC Merger, First Chester and its subsidiaries have contributed total net interest income of $2,345. This income was offset by expenses resulting in a net loss of $289.
Pursuant to the terms of the FCEC Merger Agreement, First Chester shareholders received, for each share of First Chester common stock held, 0.356 shares of our common stock (the “Exchange Ratio”). The Exchange Ratio was calculated in accordance with the terms of the FCEC Merger Agreement, and was determined based on First Chester delinquent loans (as defined in the Merger Agreement) calculated as of November 30, 2010. We paid cash to First Chester shareholders in lieu of any fractional shares. We utilized the closing price of our common stock on December 10, 2010 of $22.14 to determine the fair value of our stock issued as consideration for the FCEC Merger.
The tables below illustrate the reconciliation of shares outstanding and the calculation of the consideration effectively transferred.
| Reconciliation of Shares Outstanding |
| |||
| First Chester shares outstanding at December 10, 2010 (less treasury shares cancelled) |
6,317,096 | |||
| Exchange ratio |
0.356 | |||
| Tower shares issued to First Chester owners (excludes fractional shares) |
2,248,438 | |||
| Tower shares outstanding at December 10, 2010 |
7,192,174 | |||
| Total Tower shares at December 10, 2010 |
9,440,612 | |||
| Ownership % held by First Chester stockholders |
23.82 | % | ||
| Ownership % held by legacy Tower stockholders |
76.18 | % | ||
| Purchase Price Consideration (dollars in thousands, expect per share data) |
||||
| First Chester shares outstanding at December 10, 2010 (less treasury shares cancelled) |
6,317,096 | |||
| Exchange ratio |
0.356 | |||
| Tower shares issued to First Chester owners |
2,248,438 | |||
| Purchase price per Tower common share |
$ | 22.14 | ||
| Total stock consideration paid |
$ | 49,780 | ||
| Consideration paid for fractional shares |
11 | |||
| Total consideration paid |
$ | 49,791 | ||
82
Table of Contents
As a result of the FCEC Merger, we recognized assets acquired and liabilities assumed at their acquisition date fair value as presented below. Note that the fair value adjustments made to the balances of loans, premises and equipment, other real estate owned, deferred taxes, and other liabilities are preliminary in nature and are subject to change as we obtain further data to complete valuations based on information present at the closing date. These adjustments may also include liabilities related to legal proceedings, claims and liabilities involving First Chester and its subsidiaries that existed at the time of the FCEC Merger. Based upon the current information related to these legal proceedings and the conditions established in FASB ASC 450, “Accounting for Contingencies,” we cannot reasonably estimate any potential liability for loss on certain of these legal proceedings at this time.
| Total Purchase Price |
$ | 49,791 | ||||||
| Net Assets Acquired: |
||||||||
| Cash |
$ | 67,176 | ||||||
| Securities available for sale |
44,694 | |||||||
| Restricted Investments |
10,569 | |||||||
| Loans |
939,246 | |||||||
| Accrued interest receivable |
2,676 | |||||||
| Premises and Equipment |
26,774 | |||||||
| Core deposit intangible |
4,440 | |||||||
| Leasehold intangible assets |
342 | |||||||
| Deferred tax asset |
15,673 | |||||||
| Other assets |
25,059 | |||||||
| Time deposits |
(436,126 | ) | ||||||
| Deposits other than time deposits |
(551,148 | ) | ||||||
| Borrowings |
(80,049 | ) | ||||||
| Accrued interest payable |
(980 | ) | ||||||
| Leasehold intangible liabilities |
(643 | ) | ||||||
| Other liabilities |
(21,658 | ) | ||||||
| Noncontrolling Interest |
(1,069 | ) | ||||||
| 44,976 | ||||||||
| Goodwill resulting from FCEC Merger |
$ | 4,815 | ||||||
The goodwill generated by the FCEC Merger consists of synergies and increased economies of scale such as the ability to offer more diverse and more profitable products, added diversity to the branch system to achieve lower cost deposits, an increased legal lending limit, etc. We expect that no goodwill recognized as a result of the FCEC Merger will be deductible for income tax purposes. Since the combined entity will operate as a single business unit, there is no segment impact of the FCEC Merger.
The fair value of the financial assets acquired included loans receivable with a gross amortized cost basis of $987,747. The table below illustrates the fair value adjustments made to the amortized costs basis in order to present a fair value of the loans acquired.
| Gross amortized costs basis at December 10, 2010 |
$ | 987,747 | ||
| Market rate adjustment |
2,280 | |||
| Credit fair value adjustment on pools of homogeneous loans |
(20,510 | ) | ||
| Credit fair value adjustment on distressed loans |
(30,271 | ) | ||
| Fair value of purchased loans at December 10, 2010 |
$ | 939,246 | ||
The market rate adjustment represents the movement in market interest rates, irrespective of credit adjustments, compared to the stated rates of the acquired loans. The credit adjustment made on pools of homogeneous loans represents the changes in credit quality of the underlying borrowers from the loan inception to the acquisition
83
Table of Contents
date. The credit adjustment on distressed loans is derived in accordance with Accounting Standard Codification 310-30-30, previously known as Statement of Position (SOP) 03-3, “Accounting for Certain Loans Acquired in a Transfer,” and represents the portion of the loan balance that has been deemed uncollectible based on our expectations of future cash flows for each respective loan.
Information about the acquired FNB distressed loan portfolio as of December 10, 2010 is as follows:
| Contractually required principal and interest at acquisition |
$109,339 | |||
| Contractual cash flows not expected to be collected (nonaccretable discount) |
(36,755 | ) | ||
| Expected cash flows at acquisition |
72,584 | |||
| Interest component of expected cash flows |
17,573 | |||
| Fair value of acquired loans |
$ | 55,011 | ||
Graystone Merger
On November 13, 2008, we announced the execution of the Graystone Merger Agreement. The Graystone Merger became effective prior to the start of business on March 31, 2009. The Graystone Merger has been accounted for as a reverse merger using the acquisition method of accounting. For accounting purposes, Graystone was considered to be the acquirer in this transaction with the surviving legal entity operating under our articles of incorporation. Immediately following the holding company merger, our wholly-owned subsidiary, The First National Bank of Greencastle, merged with and into Graystone Bank, the wholly-owned subsidiary of Graystone, under the name “Graystone Tower Bank” (the “Bank”). The Bank, therefore, became our wholly owned subsidiary and operates under the prior Graystone Bank charter.
To determine the accounting treatment of the Graystone Merger, we utilized the following facts in concluding that the transaction would be treated as a reverse merger, with Graystone as the accounting acquirer:
| • | The roles of Chief Executive Officer, Chief Operating Officer, Chief Financial Officer, Chief Credit Officer, and General Counsel of the post-combination entity have been assumed by the executives of Graystone. |
| • | Upon the effective date of the Graystone Merger, the Tower Board of Directors consists of twenty members, of which half of the members have been appointed from the historical Tower Board of Directors with the remaining ten directors having been appointed from the Graystone Board of Directors. |
| • | After the closing of the Graystone Merger and as a result of the fixed share exchange ratio of .42 shares of Tower common stock for each Graystone common share, the former Graystone shareholders, as a group, held approximately fifty-four percent of the outstanding shares of Tower stock. |
| • | Graystone contributed greater than fifty percent of the total assets and tangible equity to the combined entity, while Tower contributed greater than fifty percent of the net income to the combined entity. |
The acquisition-date fair value of the consideration transferred by the accounting acquirer (Graystone) for its interest in Tower is based on the number of equity interests Graystone would have to issue (measured on the transaction closing date) to give the owners of Tower the same percentage equity interest in the combined Tower entity that results from the reverse merger. We have utilized the closing price of Tower’s common stock on March 30, 2009 (since the Graystone Merger was effective prior to the open of business on March 31, 2009) to determine the fair value of Tower stock to be utilized in the purchase price calculation which was determined to be $24.97.
84
Table of Contents
The table below illustrates the calculation of the consideration effectively transferred.
Purchase Price Calculation
| Graystone shares outstanding at March 30, 2009 |
6,523,584 | |||
| Exchange ratio |
0.42 | |||
| Tower shares issued to Graystone owners (excludes fractional shares) |
2,739,811 | |||
| Tower shares outstanding at March 30, 2009 |
2,316,823 | |||
| Total Tower shares at March 30, 2009 |
5,056,634 | |||
| Ownership % held by Graystone stockholders |
54.18 | % | ||
| Ownership % held by legacy Tower stockholders |
45.82 | % | ||
| Theoretical Graystone Share to be Issued as Consideration |
||||
| Graystone shares outstanding at March 30, 2009 |
6,523,584 | |||
| Ownership % held by Graystone stockholders |
54.18 | % | ||
| Theoretical total Graystone shares after consideration paid |
12,040,019 | |||
| Ownership % held by legacy Tower stockholders |
45.82 | % | ||
| Theoretical Graystone shares to be issued to Tower as consideration |
5,516,435 | |||
| Fair value of Graystone shares at March 30, 2009 (Tower share price * .42) |
$ | 10.49 | ||
| Fair value of theoretical Graystone shares issued as consideration |
$ | 57,853 | ||
| Cash paid for fractional shares |
2 | |||
| Total consideration paid |
$ | 57,855 | ||
As a result of the Graystone Merger, we recognized assets acquired and liabilities assumed at their acquisition date fair value as presented below.
| Total Purchase Price |
$ | 57,855 | ||||||
| Net Assets Acquired: |
||||||||
| Cash |
$ | 9,017 | ||||||
| Securities available for sale |
58,256 | |||||||
| Restricted Investments |
5,210 | |||||||
| Loans |
418,747 | |||||||
| Accrued interest receivable |
1,786 | |||||||
| Premises and Equipment |
22,644 | |||||||
| Core deposit intangible |
3,899 | |||||||
| Deferred tax asset |
143 | |||||||
| Other assets |
12,457 | |||||||
| Time deposits |
(160,806 | ) | ||||||
| Deposits other than time deposits |
(249,397 | ) | ||||||
| Borrowings |
(69,601 | ) | ||||||
| Accrued interest payable |
(698 | ) | ||||||
| Other liabilities |
(5,737 | ) | ||||||
| 45,920 | ||||||||
| Goodwill resulting from Graystone Merger |
$ | 11,935 | ||||||
The goodwill generated by the Graystone Merger consists of synergies and increased economies of scale such as the ability to offer more diverse and more profitable products, added diversity to the branch system to achieve
85
Table of Contents
lower cost deposits, an increased legal lending limit, etc. We expect that no goodwill recognized as a result of the Graystone Merger will be deductible for income tax purposes. Since the combined entity will operate as a single business unit, there is no segment impact of the Graystone Merger.
The fair value of the financial assets acquired included loans receivable with a gross amortized cost basis of $426,177. The table below illustrates the fair value adjustments made to the amortized costs basis in order to present a fair value of the loans acquired.
| Gross amortized costs basis at March 30, 2009 |
$ | 426,177 | ||
| Market rate adjustment |
1,323 | |||
| Credit fair value adjustment on pools of homogeneous loans |
(4,044 | ) | ||
| Credit fair value adjustment on distressed loans |
(4,709 | ) | ||
| Fair value of purchased loans at March 30, 2009 |
$ | 418,747 | ||
The market rate adjustment represents the movement in market interest rates, irrespective of credit adjustments, compared to the stated rates of the acquired loans. The credit adjustment made on pools of homogeneous loans represents the changes in credit quality of the underlying borrowers from the loan inception to the acquisition date. The credit adjustment on distressed loans is derived in accordance with Accounting Standard Codification 310-30-30, previously known as Statement of Position (SOP) 03-3, “Accounting for Certain Loans Acquired in a Transfer,” and represents the portion of the loan balance that has been deemed uncollectible based on the management’s expectations of future cash flows for each respective loan.
Pro-forma Presentation
The following table shows the combined pro forma financial results for the years ended December 31, 2010 and 2009, assuming that the FCEC Merger and the Graystone Merger occurred on January 1, 2009:
| Pro-forma December 31, 2010 |
Pro-forma December 31, 2009 |
|||||||
| (unaudited) | (unaudited) | |||||||
| Statement of Operations | ||||||||
| Net interest income |
$ | 91,221 | $ | 90,608 | ||||
| Pre-tax net loss |
(2,641 | ) | (19,593 | ) | ||||
| Income tax expense |
4,350 | 3,030 | ||||||
| Net loss |
(6,991 | ) | (22,623 | ) | ||||
| Pro-forma net loss per share: |
||||||||
| Basic |
$ | (0.73 | ) | $ | (3.06 | ) | ||
| Diluted |
$ | (0.73 | ) | $ | (3.06 | ) | ||
86
Table of Contents
Note 3 – Securities Available for Sale
The amortized cost of securities and their approximate fair values at December 31, 2010 and 2009 are as follows:
| Amortized Cost |
Gross Unrealized Gains |
Gross Unrealized Losses |
Fair Value |
|||||||||||||
| December 31, 2010 | ||||||||||||||||
| Equity securities |
$ | 195 | $ | — | $ | — | $ | 195 | ||||||||
| U.S Treasury securities |
5,000 | 2 | — | 5,002 | ||||||||||||
| U.S. Government sponsored agency securities |
7,771 | 9 | — | 7,780 | ||||||||||||
| U.S. Government sponsored agency mortgage-backed securities |
10,787 | 90 | (123 | ) | 10,754 | |||||||||||
| U.S. Government sponsored agency Collateralized mortgage obligations |
48,018 | 569 | — | 48,587 | ||||||||||||
| Municipal bonds |
10,641 | 74 | (61 | ) | 10,654 | |||||||||||
| Municipal bonds – taxable |
10,341 | 2 | (329 | ) | 10,014 | |||||||||||
| SBA pool loan investments |
9,557 | 152 | — | 9,709 | ||||||||||||
| Total securities available for sale |
$ | 102,310 | $ | 898 | $ | (513 | ) | $ | 102,695 | |||||||
| December 31, 2009 | ||||||||||||||||
| Equity securities |
$ | 1,156 | $ | 20 | $ | (44 | ) | $ | 1,132 | |||||||
| U.S. Government sponsored agency securities |
56,437 | 12 | (65 | ) | 56,384 | |||||||||||
| U.S. Government sponsored agency mortgage-backed securities |
9,109 | 37 | (30 | ) | 9,116 | |||||||||||
| U.S. Government sponsored agency Collateralized mortgage obligations |
93,058 | 81 | (654 | ) | 92,485 | |||||||||||
| Municipal bonds |
7,093 | 95 | — | 7,188 | ||||||||||||
| Municipal bonds – taxable |
12,917 | 64 | (71 | ) | 12,910 | |||||||||||
| SBA pool loan investments |
10,710 | — | (72 | ) | 10,638 | |||||||||||
| Total securities available for sale |
$ | 190,480 | $ | 309 | $ | (936 | ) | $ | 189,853 | |||||||
Included with our securities available for sale are pledged securities with a fair value of $86,838 and $34,999 at December 31, 2010 and 2009, respectively. The securities were pledged to secure public deposits and securities sold under agreements to repurchase.
87
Table of Contents
The amortized cost and fair value of available for sale securities as of December 31, 2010 by contractual maturity are shown below. Expected maturities may differ from contractual maturities due to the issuer’s rights to call or prepay the obligation without penalty.
| December 31, 2010 | ||||||||
| Amortized Cost | Fair Value | |||||||
| Due in one year or less |
$ | 5,568 | $ | 5,575 | ||||
| Due after one year through five years |
11,927 | 11,943 | ||||||
| Due after five years through ten years |
7,759 | 7,529 | ||||||
| Due after ten years |
8,499 | 8,403 | ||||||
| 33,753 | 33,450 | |||||||
| Mortgage-backed securities (1) |
68,362 | 69,050 | ||||||
| Equity securities |
195 | 195 | ||||||
| $ | 102,310 | $ | 102,695 | |||||
(1) Mortgage-backed securities include agency mortgage-backed securities, Government National Mortgage Association collateralized mortgage and Small Business Agency Loan Pool obligations.
The following table presents information related to our gains and losses on the sales of equity and debt securities, and losses recognized for other-than-temporary impairment of investments.
| Year Ended December 31, | ||||||||||||||||
| Gross Realized Gains |
Gross Realized Losses |
Other-than- temporary Impairment Losses |
Net Gains (Losses) |
|||||||||||||
| 2010 |
||||||||||||||||
| Equity securities |
$ | 56 | $ | (3 | ) | $ | (206 | ) | $ | (153 | ) | |||||
| Debt securities |
526 | (1 | ) | — | 525 | |||||||||||
| Total |
$ | 582 | $ | (4 | ) | $ | (206 | ) | $ | 372 | ||||||
| 2009 |
||||||||||||||||
| Equity securities |
$ | 814 | $ | (697 | ) | $ | (185 | ) | $ | (68 | ) | |||||
| Debt securities |
254 | (8 | ) | — | 246 | |||||||||||
| Total |
$ | 1068 | $ | (705 | ) | $ | (185 | ) | $ | 178 | ||||||
88
Table of Contents
The following table shows gross unrealized losses and fair value, aggregated by investment category and length of time that individual securities have been in a continuous unrealized loss position, at December 31 2010 and 2009:
| Less Than 12 Months | 12 Months or More | Total | ||||||||||||||||||||||
| Fair Value |
Unrealized Losses |
Fair Value |
Unrealized Losses |
Fair Value |
Unrealized Losses |
|||||||||||||||||||
| December 31, 2010 | ||||||||||||||||||||||||
| Equity securities |
$ | — | $ | — | $ | — | $ | — | $ | — | $ | — | ||||||||||||
| U.S. Treasury securities |
— | — | — | — | — | — | ||||||||||||||||||
| U.S. Government sponsored agency securities |
— | — | — | — | — | — | ||||||||||||||||||
| U.S. Government sponsored agency mortgage-backed securities |
6,084 | (123 | ) | — | — | 6,084 | (123 | ) | ||||||||||||||||
| U.S. Government sponsored agency collateralized mortgage obligations |
— | — | — | — | — | — | ||||||||||||||||||
| Municipal bonds |
5,415 | (61 | ) | — | — | 5,415 | (61 | ) | ||||||||||||||||
| Municipal bonds – taxable |
8,897 | (329 | ) | — | — | 8,897 | (329 | ) | ||||||||||||||||
| SBA loan pool investments |
— | — | — | — | — | — | ||||||||||||||||||
| Total |
$ | 20,396 | $ | (513 | ) | $ | — | $ | — | $ | 20,396 | $ | (513 | ) | ||||||||||
| December 31, 2009 | ||||||||||||||||||||||||
| Equity securities |
$ | 417 | $ | 44 | $ | — | $ | — | $ | 417 | $ | 44 | ||||||||||||
| U.S. Government sponsored agency securities |
47,101 | 65 | — | — | 47,101 | 65 | ||||||||||||||||||
| U.S. Government sponsored agency mortgage-backed securities |
7,275 | 30 | — | — | 7,275 | 30 | ||||||||||||||||||
| U.S. Government sponsored agency collateralized mortgage obligations |
70,991 | 654 | — | — | 70,991 | 654 | ||||||||||||||||||
| Municipal bonds |
— | — | — | — | — | — | ||||||||||||||||||
| Municipal bonds – taxable |
6,955 | 71 | — | — | 6,955 | 71 | ||||||||||||||||||
| SBA pool loan investments |
10,710 | 72 | — | — | 10,710 | 72 | ||||||||||||||||||
| Total |
$ | 143,449 | $ | 936 | $ | — | $ | — | $ | 143,449 | $ | 936 | ||||||||||||
The previous table includes 15 investment securities at December 31, 2010 where the current fair value is less than the related amortized cost. There were 36 investment securities at December 31, 2009 that had a current fair value less than the related amortized cost. We evaluate all securities for other-than-temporary impairment on at least a quarterly basis. Consideration is given to (1) the length of time and the extent to which the fair value has been less than cost, (2) the financial condition and near-term prospects of the issuer, and (3) the intent and ability to retain the investment for a period of time sufficient to allow for any anticipated recovery in fair value. It is not our intent to sell the investments available for sale carrying an unrealized loss and believe it is more likely than not, that it will not be necessary to sell these securities prior to the recovery of their cost basis or maturity. At December 31, 2010, we identified equity securities with unrealized losses that were deemed to be other-than-temporary in nature and resulting in an impairment charge for the years ending December 31, 2010 and 2009 of $206 and $185, respectively. Excluding the securities related to the impairment charge, no investments trading below cost had declined on an other-than-temporary basis during the years ending December 31, 2010 and 2009.
89
Table of Contents
Note 4 – Loans
The following table presents a summary of the loan portfolio at December 31, 2010 and 2009:
| December 31, 2010 |
December 31, 2009 |
|||||||
| Commercial: |
||||||||
| Industrial |
$ | 921,603 | $ | 599,708 | ||||
| Real estate |
441,532 | 159,947 | ||||||
| Construction |
179,983 | 102,018 | ||||||
| Consumer: |
||||||||
| Home equity line |
196,498 | 49,239 | ||||||
| Other |
52,412 | 36,271 | ||||||
| Residential mortgage |
280,154 | 191,277 | ||||||
| Total loans |
2,072,182 | 1,138,460 | ||||||
| Deferred costs (fees) |
62 | (189 | ) | |||||
| Allowance for loan losses |
(14,053 | ) | (9,695 | ) | ||||
| Net loans |
$ | 2,058,191 | $ | 1,128,576 | ||||
Overdraft deposits are reclassified as loans and are included in the “Consumer: Other” loans on the consolidated balance sheet. At December 31, 2010 and 2009, total overdraft deposits were $1,284 and $397, respectively.
We had total net purchased loans from unaffiliated banks of $42,124 and $59,268 at December 31, 2010 and 2009, respectively.
We serviced $216,939 and $111,649 of participation loans for unrelated parties at December 31, 2010 and 2009, respectively.
We sold $277,842, $133,521 and $48,283 of residential mortgage loans into the secondary market during the years ended December 31, 2010, 2009 and 2008, respectively. A gain of $2,544, $1,521, and $528 was recognized on the sale of these loans for the years ended December 31, 2010, 2009 and 2008, respectively.
The following table presents the credit quality table as of December 31, 2010. Commercial loans are based on an internally assigned grade system which are assigned at the loan origination and review on an annual or on an “as needed” basis. Consumer and residential mortgage loans are evaluated based the payment activity of the loan.
| Commercial Industrial |
Commercial Real Estate |
Commercial Construction |
||||||||||
| Pass |
$ | 776,075 | $ | 408,778 | $ | 140,144 | ||||||
| Special Mention |
47,720 | 4,370 | 1,524 | |||||||||
| Substandard |
68,908 | 18,182 | 14,822 | |||||||||
| Doubtful |
— | 187 | 5,001 | |||||||||
| Acquired distressed loans (1) |
28,900 | 10,015 | 18,492 | |||||||||
| Total |
$ | 921,603 | $ | 441,532 | $ | 179,983 | ||||||
| Consumer HELOC |
Consumer Other |
Residential Mortgage |
||||||||||
| Performing |
$ | 195,026 | $ | 51,941 | $ | 273,936 | ||||||
| Nonperforming |
466 | 317 | 3,602 | |||||||||
| Acquired distressed loans (1) |
1,006 | 154 | 2,616 | |||||||||
| Total |
$ | 196,498 | $ | 52,412 | $ | 280,154 | ||||||
| (1) | Acquired distressed loans include all acquired loans in which a specific credit adjustment was taken upon acquisition, in accordance with Accounting Standards Codification 310-30-30. |
90
Table of Contents
The following table presents the aging analysis of the loan portfolio as of December 31, 2010 and 2009:
| 30-89 Days Past Due(1) |
Greater Than 90 Days(1) |
Total Past Due(1) |
Non- Accrual |
Current(1) | Total Loans | |||||||||||||||||||
| December 31, 2010 | ||||||||||||||||||||||||
| Commercial: |
||||||||||||||||||||||||
| Industrial |
$ | 21,217 | $ | — | $ | 21,217 | $ | 6,320 | $ | 894,066 | $ | 921,603 | ||||||||||||
| Real estate |
1,712 | 5 | 1,717 | 2,426 | 437,389 | 441,532 | ||||||||||||||||||
| Construction |
615 | — | 615 | 6,011 | 173,357 | 179,983 | ||||||||||||||||||
| Consumer |
||||||||||||||||||||||||
| Home equity line |
478 | 351 | 829 | 115 | 195,554 | 196,498 | ||||||||||||||||||
| Other |
1,094 | 251 | 1,345 | 66 | 51,001 | 52,412 | ||||||||||||||||||
| Residential mortgage |
5,749 | 818 | 6,567 | 2,784 | 270,803 | 280,154 | ||||||||||||||||||
| Total |
$ | 30,865 | $ | 1,425 | $ | 32,290 | $ | 17,722 | $ | 2,022,170 | $ | 2,072,182 | ||||||||||||
| December 31, 2009 | ||||||||||||||||||||||||
| Commercial: |
||||||||||||||||||||||||
| Industrial |
$ | 2,137 | $ | 356 | $ | 2,493 | $ | 2,646 | $ | 594,569 | $ | 599,708 | ||||||||||||
| Real estate |
1,713 | 277 | 1,990 | 464 | 157,494 | 159,948 | ||||||||||||||||||
| Construction |
— | — | — | 298 | 101,719 | 102,017 | ||||||||||||||||||
| Consumer: |
||||||||||||||||||||||||
| Home equity line |
777 | 303 | 1,080 | — | 48,159 | 49,239 | ||||||||||||||||||
| Other |
378 | 51 | 429 | 242 | 35,600 | 36,271 | ||||||||||||||||||
| Residential mortgage |
7,223 | 1,119 | 8,342 | 1,068 | 181,867 | 191,277 | ||||||||||||||||||
| Total |
$ | 12,228 | $ | 2,106 | $ | 14,334 | $ | 4,718 | $ | 1,119,408 | $ | 1,138,460 | ||||||||||||
(1) Loan balances do not include non-accrual loans
Total non-performing assets were $23,794 and $7,751 for the years ended December 31, 2010 and 2009, respectively. Non-performing assets include those loans which are classified as non-accrual, loans accruing interest that are 90 days past due and other real estate owned. Total other real estate owned was $4,647 and $927 as of December 31, 2010 and 2009, respectively.
91
Table of Contents
We had total impaired loans of $76,982 and $10,917 as of December 31, 2010 and 2009, respectively. The following table presents a summary of the impaired loans.
| Recorded Investment |
Unpaid Principal Balance |
Related Allowance |
Average Recorded Investment |
Interest Income Recognized |
||||||||||||||||
| December 31, 2010 | ||||||||||||||||||||
| With no related allowance recorded: |
||||||||||||||||||||
| Commercial: |
||||||||||||||||||||
| Industrial |
$ | 35,220 | $ | 53,892 | $ | — | $ | 5,897 | $ | 119 | ||||||||||
| Real estate |
12,815 | 16,368 | — | 6,021 | 346 | |||||||||||||||
| Construction |
17,201 | 26,256 | — | 1,810 | 182 | |||||||||||||||
| Consumer: |
||||||||||||||||||||
| Home equity line |
1,121 | 1,255 | — | 110 | 1 | |||||||||||||||
| Other |
224 | 322 | — | 147 | 3 | |||||||||||||||
| Residential mortgage |
5,400 | 6,061 | — | 1,891 | — | |||||||||||||||
| With an allowance recorded: |
||||||||||||||||||||
| Commercial: |
||||||||||||||||||||
| Industrial |
$ | — | $ | — | $ | — | $ | 271 | $ | — | ||||||||||
| Real estate |
— | — | — | 63 | — | |||||||||||||||
| Construction |
5,001 | 5,001 | 2,500 | 4,167 | — | |||||||||||||||
| Consumer: |
||||||||||||||||||||
| Home equity line |
— | — | — | — | — | |||||||||||||||
| Other |
— | — | — | — | — | |||||||||||||||
| Residential mortgage |
— | — | — | — | — | |||||||||||||||
| Total: |
||||||||||||||||||||
| Commercial: |
||||||||||||||||||||
| Industrial |
$ | 35,220 | $ | 53,892 | $ | — | $ | 6,168 | $ | 119 | ||||||||||
| Real estate |
12,815 | 16,368 | — | 6,084 | 346 | |||||||||||||||
| Construction |
22,202 | 31,257 | 2,500 | 5,977 | 182 | |||||||||||||||
| Consumer: |
||||||||||||||||||||
| Home equity line |
1,121 | 1,255 | — | 110 | 1 | |||||||||||||||
| Other |
224 | 322 | — | 147 | 3 | |||||||||||||||
| Residential mortgage |
5,400 | 6,061 | — | 1,891 | — | |||||||||||||||
| Total |
$ | 76,982 | $ | 109,155 | $ | 2,500 | $ | 20,377 | $ | 651 | ||||||||||
92
Table of Contents
| December 31, 2009 | ||||||||||||||||||||
| With no related allowance recorded: |
||||||||||||||||||||
| Commercial: |
||||||||||||||||||||
| Industrial |
$ | 1,243 | $ | 1,776 | $ | — | $ | 2,264 | $ | 17 | ||||||||||
| Real estate |
4,675 | 6,007 | — | 3,818 | 302 | |||||||||||||||
| Construction |
2,461 | 3,530 | — | 2,248 | 87 | |||||||||||||||
| Consumer: |
||||||||||||||||||||
| Home equity line |
— | 4 | — | 28 | — | |||||||||||||||
| Other |
204 | 269 | — | 102 | 1 | |||||||||||||||
| Residential mortgage |
982 | 984 | — | 526 | — | |||||||||||||||
| With an allowance recorded: |
||||||||||||||||||||
| Commercial: |
||||||||||||||||||||
| Industrial |
$ | 924 | $ | 924 | $ | 310 | $ | 556 | $ | — | ||||||||||
| Real estate |
334 | 334 | 114 | 195 | — | |||||||||||||||
| Construction |
— | — | — | — | — | |||||||||||||||
| Consumer: |
||||||||||||||||||||
| Home equity line |
— | — | — | — | — | |||||||||||||||
| Other |
10 | 10 | 10 | 10 | — | |||||||||||||||
| Residential mortgage |
84 | 84 | 17 | 73 | — | |||||||||||||||
| Total |
||||||||||||||||||||
| Commercial: |
||||||||||||||||||||
| Industrial |
$ | 2,167 | $ | 2,700 | $ | 310 | $ | 2,820 | $ | 17 | ||||||||||
| Real estate |
5,009 | 6,341 | 114 | 4,013 | 302 | |||||||||||||||
| Construction |
2,461 | 3,530 | — | 2,248 | 87 | |||||||||||||||
| Consumer: |
||||||||||||||||||||
| Home equity line |
— | 4 | — | 28 | — | |||||||||||||||
| Other |
214 | 279 | 10 | 112 | 1 | |||||||||||||||
| Residential mortgage |
1,066 | 1,068 | 17 | 599 | — | |||||||||||||||
| Total |
$ | 10,917 | $ | 13,922 | $ | 451 | $ | 9,820 | $ | 407 | ||||||||||
We performed an evaluation of expected future cash flows, including the anticipated cash flow from the sale of collateral, and compared that to the carrying amount of the impaired loans. Impaired loans considered to be collateral dependent totaled approximately 92.1% and 99.4% of total impaired loans as of December 31, 2010 and 2009, respectively. As of December 31, 2010, we determined that impaired loans with a carrying principal balance of $6,116 required a reserve of $2,500. The remaining $70,866 of impaired loans did not require a specific reserve allocation as the future anticipated cash flow, including the collateral values, is expected to be sufficient to fully recover the amounts due on these loans. As of December 31, 2009, we had determined that impaired loans with a carrying principal balance of $1,353 required a reserve of $451 with the remaining $9,564 of impaired loans not requiring a specific reserve allocation as the future anticipated cash flow, including the collateral values, is expected to be sufficient to fully recover all amounts due on these loans. During 2010, we had total loan net charge-offs of $5,878. These charges have been applied against both the allowance for loans losses, as well as against the fair value credit adjustment/discount recorded on performing loans acquired.
Acquired loans deemed to be impaired at the time of purchase in accordance with Accounting Standard Codification 310-30-30, previously known as Statement of Position (SOP) 03-3, “Accounting for Certain Loans Acquired in a Transfer” are included in the balance of impaired loans. However, these purchased impaired loans have been recorded at their fair value based on anticipated future cash flows at the time of acquisition and are considered to be performing loans as we expect to fully collect the new carrying value (i.e. fair value) of the loans.
93
Table of Contents
The following table provides activity for the accretable yield of these purchased impaired loans for December 31, 2010 and 2009.
| December 31, 2010 | December 31, 2009 | |||||||
| Accretable yield, beginning balance |
$ | 178 | $ | — | ||||
| Acquisition of impaired loans |
17,573 | 423 | ||||||
| Accretable yield amortized to interest income |
(799 | ) | (774 | ) | ||||
| Reclassification from non-accretable difference (1) |
1,532 | 529 | ||||||
| Accretable yield, end of period |
$ | 18,484 | $ | 178 | ||||
(1) Reclassification from non-accretable difference represents an increase to the estimated cash flows to be collected on the underlying portfolio.
Note 5 – Allowance for Loan Losses
Changes in the allowance for loan losses were as follows for the years ended December 31, 2010, 2009 and 2008:
| Commercial: Industrial |
Commercial: Real estate |
Commercial: Construction |
Consumer: Home equity line |
Consumer: Other |
Residential Mortgage |
Total | ||||||||||||||||||||||
| December 31, 2010 | ||||||||||||||||||||||||||||
| Beginning balance |
$ | 6,262 | $ | 1,597 | $ | 1,389 | $ | 97 | $ | 32 | $ | 318 | $ | 9,695 | ||||||||||||||
| Provision |
3,157 | 402 | 3,178 | 465 | 309 | 1,539 | 9,050 | |||||||||||||||||||||
| Charge-offs |
(2,375 | ) | (840 | ) | (431 | ) | (320 | ) | (292 | ) | (525 | ) | (4,783 | ) | ||||||||||||||
| Recoveries |
83 | — | 2 | — | 4 | 2 | 91 | |||||||||||||||||||||
| Ending balance |
$ | 7,127 | $ | 1,159 | $ | 4,138 | $ | 242 | $ | 53 | $ | 1,334 | $ | 14,053 | ||||||||||||||
| December 31, 2009 | ||||||||||||||||||||||||||||
| Beginning balance |
$ | 4,021 | $ | 643 | $ | 1,008 | $ | 166 | $ | 123 | $ | 56 | $ | 6,017 | ||||||||||||||
| Provision |
3,420 | 1,013 | 525 | — | 58 | 200 | 5,216 | |||||||||||||||||||||
| Reallocation |
— | — | — | (69 | ) | — | 69 | — | ||||||||||||||||||||
| Charge-offs |
(1,220 | ) | (65 | ) | (150 | ) | (7 | ) | (149 | ) | (7 | ) | (1,598 | ) | ||||||||||||||
| Recoveries |
41 | 6 | 6 | 7 | — | — | 60 | |||||||||||||||||||||
| Ending balance |
$ | 6,262 | $ | 1,597 | $ | 1,389 | $ | 97 | $ | 32 | $ | 318 | $ | 9,695 | ||||||||||||||
| December 31, 2008 | ||||||||||||||||||||||||||||
| Beginning balance |
$ | 2,793 | $ | 417 | $ | 707 | $ | 112 | $ | 93 | $ | 26 | $ | 4,148 | ||||||||||||||
| Provision |
1,909 | 226 | 301 | 54 | 30 | 30 | 2,550 | |||||||||||||||||||||
| Charge-offs |
(681 | ) | — | — | — | — | — | (681 | ) | |||||||||||||||||||
| Recoveries |
— | — | — | — | — | — | — | |||||||||||||||||||||
| Ending balance |
$ | 4,021 | $ | 643 | $ | 1,008 | $ | 166 | $ | 123 | $ | 56 | $ | 6,017 | ||||||||||||||
94
Table of Contents
Note 6 – Premises and Equipment
| December 31, 2010 | December 31, 2009 | |||||||
| Land |
$ | 10,834 | $ | 5,394 | ||||
| Building |
29,611 | 13,684 | ||||||
| Leasehold improvements |
4,885 | 3,703 | ||||||
| Furniture, fixtures and equipment |
12,798 | 6,918 | ||||||
| Other |
4,448 | 3,435 | ||||||
| Total premises and equipment |
62,576 | 33,134 | ||||||
| Accumulated depreciation and amortization |
(6,188 | ) | (3,324 | ) | ||||
| Net premises and equipment |
$ | 56,388 | $ | 29,810 | ||||
We lease two branch offices that qualify as capital leases and, as such, have a net carrying amount of $2,564 and $2,734 as of December 31, 2010 and 2009, respectively, which is included in the balance of premise and equipment.
Depreciation expenses amounted to $2,920 during 2010, $1,751 during 2009 and $761 during 2008.
During the second quarter of 2010, we had explored the potential sale of a parcel of undeveloped land that was acquired as part of the Graystone Merger. As a result, we determine that the recorded cost basis of the land may not be recoverable. Accordingly, we determined the estimated fair value of the land to be less than its recorded value, resulting in an impairment charge of $920. We reviewed the property as of December 31, 2010 and determined no additional impairment had occurred.
Note 7 – Other Intangibles
Information concerning total amortizable other intangible assets and liabilities at December 31, 2010 and 2009 is as follows:
| 2010 | 2009 | |||||||||||||||||||||||
| Gross Carrying Amount |
Accumulated Amortization |
Net Carrying Amount |
Gross Carrying Amount |
Accumulated Amortization |
Net Carrying Amount |
|||||||||||||||||||
| Asset: |
||||||||||||||||||||||||
| Core deposits |
$ | 8,339 | $ | 1,188 | $ | 7,151 | $ | 3,899 | $ | 532 | $ | 3,367 | ||||||||||||
| Leasehold intangible assets |
342 | — | 342 | — | — | — | ||||||||||||||||||
| Total |
$ | 8,681 | $ | 1,188 | $ | 7,493 | $ | 3,899 | $ | 532 | $ | 3,367 | ||||||||||||
| Liabilities: |
||||||||||||||||||||||||
| Leasehold intangible liabilities |
$ | 643 | $ | — | $ | 643 | $ | — | $ | — | $ | — | ||||||||||||
| Total |
$ | 643 | $ | — | $ | 643 | $ | — | $ | — | $ | — | ||||||||||||
Total amortization of intangible expenses amounted to $656 during 2010, $532 during 2009 and $0 during 2008.
95
Table of Contents
The estimated amortization for the next five years and thereafter is as follows:
| 2011 |
$ | 1,365 | ||
| 2012 |
1,174 | |||
| 2013 |
1,022 | |||
| 2014 |
818 | |||
| 2015 |
732 | |||
| Thereafter |
1,740 | |||
| Total |
$ | 6,851 | ||
Note 8 – Other Assets
The following is a detail of items that comprise other assets at December 31, 2010 and 2009:
| December 31, 2010 |
December 31, 2009 |
|||||||
| Prepaid FDIC insurance assessment |
$ | 8,219 | $ | 6,290 | ||||
| Income tax receivable |
4,171 | 760 | ||||||
| Other prepaid expenses |
2,755 | 908 | ||||||
| Mortgage banking derivatives (1) |
2,147 | — | ||||||
| Mortgage banking receivables |
1,661 | — | ||||||
| Miscellaneous receivables |
1,299 | — | ||||||
| Mortgage servicing rights |
1,305 | 637 | ||||||
| Investment in subsidiary |
— | 790 | ||||||
| Low income housing investment |
376 | — | ||||||
| Other |
1,684 | 520 | ||||||
| Total |
$ | 23,617 | $ | 9,905 | ||||
(1) Mortgage banking derivatives balance includes the interest rate lock commitments and forward transaction agreements. Derivatives related to loans held for sale interest rate locks are included in the loans held for sale balance.
Note 9 – Deposits
The following is a summary of deposits at December 31, 2010 and 2009:
| December 31, 2010 |
December 31, 2009 |
|||||||
| Non-interest bearing transaction accounts |
$ | 301,210 | $ | 119,116 | ||||
| Interest checking accounts |
305,701 | 110,356 | ||||||
| Money market accounts |
651,760 | 477,292 | ||||||
| Savings accounts |
160,305 | 87,117 | ||||||
| Time deposits of $100,000 or greater |
354,028 | 130,938 | ||||||
| Time deposits, other |
526,894 | 291,650 | ||||||
| Total deposit |
$ | 2,299,898 | $ | 1,216,469 | ||||
Brokered deposits totaled $194,417 and $61,114 at December 31, 2010 and 2009, respectively. Brokered deposits, exclusive of in-market reciprocal brokered deposits, totaled $144,506 and $46,018 at December 31, 2010 and 2009, respectively.
96
Table of Contents
At December 31, 2010, the scheduled maturities of time deposits are as follows:
| 2011 |
$ | 422,374 | ||
| 2012 |
230,090 | |||
| 2013 |
29,174 | |||
| 2014 |
99,296 | |||
| 2015 |
86,939 | |||
| Thereafter |
13,049 | |||
| Total time deposits |
$ | 880,922 | ||
Note 10 – Securities Sold Under Agreements to Repurchase
Securities sold under agreements to repurchase generally mature within one to four days from the transition date. Securities sold under agreements to repurchase are reflected at the amount of cash received in connection with the transaction. We may be required to provide additional collateral based on the fair value of the underlying securities. We had securities sold under agreements to repurchase of $6,605 and $6,892 at December 31, 2010 and 2009, respectively. The average blended rate on these borrowings was 0.52% and 0.52% at December 31, 2010 and 2009, respectively, and the borrowings mature in one-day periods. The borrowings are secured by U.S. Government sponsored agency securities and municipal bonds.
Note 11 – Borrowings
The following is a summary of borrowings at December 31, 2010 and 2009:
| December 31, 2010 |
December 31, 2009 |
|||||||
| Federal Home Loan Bank borrowings |
$ | 103,702 | $ | 59,252 | ||||
| Subordinated notes |
21,000 | 9,000 | ||||||
| Junior subordinated debentures held by trusts |
15,452 | — | ||||||
| Capital lease obligation |
2,685 | 2,729 | ||||||
| Total borrowings |
$ | 142,839 | $ | 70,981 | ||||
Federal Home Loan Bank Borrowings
We have a maximum borrowing capacity under an agreement with the Federal Home Loan Bank (“FHLB”) of approximately $648,720 and $482,024 at December 31, 2010 and 2009, respectively. The available amount of borrowing capacity for December 31, 2010 and 2009 was approximately $544,635 and $422,679, respectively. The total outstanding borrowings at December 31, 2010 equaled $103,702, of which $55,000 has a maturity of less than one year and is classified as short-term borrowing. The remaining borrowings of $48,702 have a maturity greater than one year and are, therefore, classified as long-term debt at December 31, 2010. The average interest rate on FHLB borrowings at December 31, 2010 equaled 2.13%. At December 31, 2010, the unamortized fair value adjustment to FHLB borrowings assumed in the merger totaled $(383). The total outstanding borrowings at December 31, 2009 equaled $59,346, of which, $54,096 have a stated maturity greater than one year and are, therefore, classified as long-term debt at December 31, 2009. The remaining $5,250 in FHLB borrowings are classified as short-term borrowings at December 31, 2009 as they matured within one year. The average interest rate on FHLB borrowings at December 31, 2009 equaled 3.94%.
97
Table of Contents
The following table summarizes the scheduled maturities of FHLB borrowings as of December 31, 2010:
| 2011 |
$ | 55,000 | ||
| 2012 |
5,000 | |||
| 2013 |
— | |||
| 2014 |
— | |||
| 2015 |
— | |||
| Thereafter |
43,702 | |||
| Total |
$ | 103,702 | ||
Other Borrowings
On June 12, 2009, we issued, to private investors, $9,000 of subordinated notes bearing an annual interest rate of 9.00%. Each note may be redeemed at our discretion and contains a maturity date of July 1, 2014. Interest only payments are due on a quarterly basis with the unpaid principal balance due at maturity.
On February 5, 2010, we issued to private investors an aggregate of $12,000 of subordinated notes bearing an annual interest rate of 9.00%. Each note may be redeemed at our discretion and contains a maturity date of July 15, 2015. Interest only payments are due on a quarterly basis with the unpaid principal balance due at maturity.
Federal funds are reported on a gross basis. Federal funds sold are stated as assets and federal funds purchased are stated as liabilities. Federal funds purchased are considered short-term borrowings and are subject to restrictions limiting the frequency and terms of advances. Generally, federal funds are purchased or sold for one day periods and bear interest based upon the daily federal funds rate. We did not have any federal funds purchased at December 31, 2010 or 2009.
Junior Subordinated Debentures Held by Trusts That Issued Capital Debt
As part of the FCEC Merger, we acquired three trusts that issued subordinated debt and securities. The total balance outstanding on these debentures at December 31, 2010 was $20,795. These debentures were subject to fair value based on anticipated future cash flows at the time of acquisition. At December 31, 2010, the unamortized fair value adjustment totaled $(5,343).
Based on current interpretations of the banking regulators, these subordinated debentures qualify under the risk-based capital guidelines of the OCC and Federal Reserve as Tier 1 capital, subject to limitations. The aggregate amount of trust preferred securities and certain other capital elements are limited to 25% of Tier I Capital elements, net of goodwill. The amount of trust preferred securities and certain other elements in excess of the limit could be included in Tier II Capital, subject to restriction. As of December 31, 2010, we include all of the trust preferred securities in Tier I Capital.
First Chester County Capital Trust IV (“Trust IV”), a special purpose statutory trust was created expressly for the issuance of $5,175 of preferred capital securities and $155 of common shares and invested the proceeds in junior subordinated debentures in a pooled institutional placement transaction. These subordinated debentures and securities are subject to mandatory redemption in the year 2039. The debentures and securities will each be callable by us or Trust IV, as applicable, at their option, five years after the date of issuance. The rate on the subordinated debentures and securities is 12.00%. On the date of acquisition, the Trust IV had a value of $5,330 and a fair value adjustment of $462.
First Chester County Capital Trust III (“Trust III”) issued $5,000 of preferred capital securities and $155 of common shares in a pooled institutional placement transaction. These securities were issued through Trust III, a special purpose statutory
98
Table of Contents
trust created expressly for the issuance of these securities and investing the proceeds in junior subordinated debentures. These subordinated debentures are subject to mandatory redemption in the year 2037. The debentures and securities will each be callable by us or Trust III, as applicable, at their option, five years after the date of issuance. At December 31, 2010, the rate on these subordinated debentures, based on three-month London Inter-bank offering rate (“LIBOR”) plus 140 basis points, was 1.70%. On the date of acquisition, the Trust III had a value of $5,155 and a fair value adjustment of $(2,427).
First Chester County Capital Trust II (“Trust II”) issued $10,000 of preferred capital securities and $310 common shares in a pooled institutional placement transaction. These securities were issued through Trust II, a special purpose statutory trust created expressly for the issuance of these securities and investing the proceeds in subordinated debentures. These subordinated debentures are subject to mandatory redemption in the year 2033. The debentures and securities will each be callable by us or Trust II, as applicable, at their option. At December 31, 2010, the rate on the subordinated debentures, based on three-month LIBOR plus 295 basis points, was 3.25%. On the date of acquisition, the Trust II had a value of $10,310 and a fair value adjustment of $(3,378).
Capital Lease Obligations
Included in short-term borrowings and long-term debt are two capital lease agreements, which relate to two of the Bank’s branches. The following is a schedule by years of future minimum lease payments under capital leases together with the present value of the net minimum lease payments as of December 31, 2010.
| 2011 |
$ | 279 | ||
| 2012 |
286 | |||
| 2013 |
301 | |||
| 2014 |
306 | |||
| 2015 |
314 | |||
| Thereafter |
3,799 | |||
| Total minimum lease payments |
$ | 5,285 | ||
| Less: Amount representing interest |
2,600 | |||
| Present value of net minimum lease payments |
$ | 2,685 | ||
Note 12 – Derivative Instruments
As part of our mortgage banking operations, AHB Division and Graystone Mortgage originates fixed-rate 1-4 unit residential loans for sale in the secondary market and to investors in mortgage loans. These loans have been classified as loans held for sale. These loans expose us to variability in their fair value due to changes in interest rates. If interest rates increase, the value of the loans decreases. Conversely, if interest rates decrease, the value of the loans increases.
Loan commitments related to the origination of loans held for sale are accounted for as derivative instruments. Such commitments are recorded at fair value as derivative assets or liabilities, with changes in fair value recorded as gains or losses.
To mitigate the effect of interest rate risk on both the held for sale loans and interest rate lock commitments, AHB enters into offsetting derivative contracts, primarily forward transaction agreements. These forward transaction agreements lock in the price for the sale of specific loans or loans to be funded under specific interest rate lock commitments or for a generic group of loans with similar characteristics. A portion of the forward transaction agreements offset previously hedged positions as interest rates change and as the percentage of loans expected to close change. Forward transaction agreements are agreements to sell a certain notional amount of loans at a specified future time period at a specified price. AHB may incur a loss when pairing out of previously hedged positions. Best efforts forward transaction agreement also result in direct or indirect financial penalties
99
Table of Contents
for failure to follow through if the related loans close. The fair value of forward loan sales commitments that hedge warehouse loans and interest rate lock commitments, as well as interest rate lock commitments themselves, are summarized as follows at December 31, 2010. The fair values of all of these items are recorded on the balance sheet within other assets and liabilities as these items are financial derivatives. Changes in the fair value of these items are recorded through the statement of operations as a component of net gain on sale of mortgage loans.
Although the purpose of these derivative instruments is to economically hedge certain risks, there are no hedge designations under ASC 815-10.
The fair value of derivative instruments not designated as hedging instruments under ASC 815-10 at December 31, 2010 are presented in the following table:
| Asset Derivative | Liability Derivative | |||||||||||||||
| Fair Value | Notional Value | Fair Value | Notional Value | |||||||||||||
| Forward transaction agreements |
$ | 930 | $ | 82,250 | $ | — | $ | — | ||||||||
| Interest rate lock commitments |
$ | 1,217 | $ | 60,298 | $ | — | $ | — | ||||||||
During 2010, forward transaction agreements and interest rate lock commitments contributed to a net loss of $738 and a net gain of $275, respectively.
Note 13 – Related Party Transactions
We have had, and may be expected to have in the future, transactions in the ordinary course of business with executive officers and directors and their immediate families and affiliated companies (commonly referred to as related parties), on the same terms, including interest rates and collateral, as those prevailing at the time for comparable transactions with others. All loans to executive officers and directors or their related interests are submitted to the Bank’s Board of Directors for approval. The aggregate dollar amount of these loans was $73,284 at December 31, 2010 and $51,946 at December 31, 2009.
Deposits from related parties held at the Bank as of December 31, 2010 and 2009 amounted to $8,865 and $9,948, respectively.
In December 2007, we entered into a lease agreement with a related party consisting of a branch and regional administrative office under a fifteen-year renewable lease. The lease was negotiated on an “arms-length basis” and an independent valuation was performed confirming that the terms in the lease are reflective of market terms. Total rental expense related to this property was $271, $271 and $125 for the years ended December 31, 2010, 2009 and 2008, respectively.
On June 12, 2009, we issued, to private investors, $9,000 of subordinated notes bearing an annual interest rate of 9.00%. The investors included a director who invested $500 in principal amount of the notes. This transaction has been reviewed and approved by the Audit Committee.
On February 5, 2010, we issued, to private investors, $12,000 of subordinated notes bearing an annual interest rate of 9.00%. The investors included a director and their spouse who invested $1,000 in principal amount of the notes. This transaction has been reviewed and approved by the Audit Committee.
We have entered into employment or change of control agreements with several executive officers. The agreements include minimum annual salary commitments and/or change of control provisions. Upon termination, resignation or change in control, these individuals may receive monetary compensation as set forth in the agreements.
100
Table of Contents
Note 14 – Income Taxes
The provision for income tax expense (benefit) for the year ended December 31, 2010, 2009 and 2008 consisted of the following components:
| 2010 | 2009 | 2008 | ||||||||||
| Federal: |
||||||||||||
| Current |
$ | 3,701 | $ | 1,390 | $ | 1,353 | ||||||
| Deferred |
(2,466 | ) | 417 | (1,040 | ) | |||||||
| 1,235 | 1,807 | 313 | ||||||||||
| State: |
||||||||||||
| Current |
(12 | ) | 22 | 20 | ||||||||
| Deferred |
— | — | — | |||||||||
| (12 | ) | 22 | 20 | |||||||||
| Total |
$ | 1,223 | $ | 1,829 | $ | 333 | ||||||
A reconciliation of the statutory income tax to the income tax expense included in the statements of operations is as follows for the year ended December 31, 2010, 2009 and 2008. The statutory income tax rate for December 31, 2010, 2009 and 2008 was 34%.
| 2010 | 2009 | 2008 | ||||||||||
| Federal income tax at statutory rate |
34.0 | % | 34.0 | % | 34.0 | % | ||||||
| Incentive Stock Options |
— | 0.5 | 1.7 | |||||||||
| Bank Owned Life Insurance |
(18.7 | ) | (4.9 | ) | (4.6 | ) | ||||||
| State tax expense, net of federal benefit |
(0.5 | ) | 0.3 | 0.5 | ||||||||
| Valuation allowance |
8.5 | 0.4 | (18.0 | ) | ||||||||
| Tax exempt interest |
(4.8 | ) | (1.1 | ) | — | |||||||
| Non-deductible expenses |
13.0 | 2.7 | — | |||||||||
| Change in deferred tax rate |
(4.3 | ) | — | — | ||||||||
| Deferred tax write-off |
15.5 | — | — | |||||||||
| Other |
5.4 | 1.1 | 0.2 | |||||||||
| Effective income tax rate |
48.1 | % | 33.0 | % | 13.8 | % | ||||||
101
Table of Contents
The components of the net deferred tax asset at December 31, 2010 and 2009 are as follows:
| December 31, 2010 |
December 31, 2009 |
|||||||
| Deferred tax assets: |
||||||||
| Allowance for loan losses |
$ | 4,918 | $ | 3,296 | ||||
| Organization and start-up costs |
133 | 142 | ||||||
| Nonqualified stock options |
277 | 231 | ||||||
| Other than temporary impairments |
809 | 53 | ||||||
| Capital loss carryover |
3,923 | 3,166 | ||||||
| Deferred compensation |
1,538 | 806 | ||||||
| Nonaccrual interest |
432 | 212 | ||||||
| Straight-line rents |
287 | 145 | ||||||
| Unrealized loss on available for sale securities |
— | 213 | ||||||
| Partnership income |
945 | — | ||||||
| Net operating loss carryforward |
3,371 | — | ||||||
| Contribution carryforward |
223 | — | ||||||
| Tax credit carryforward |
793 | — | ||||||
| Purchase accounting fair value adjustments |
10,550 | — | ||||||
| Other |
406 | 431 | ||||||
| Total deferred tax assets |
28,605 | 8,695 | ||||||
| Valuation Allowance |
(3,974 | ) | (3,644 | ) | ||||
| Total deferred tax assets, net of valuation allowance |
24,631 | 5,051 | ||||||
| Deferred tax liabilities: |
||||||||
| Premises and equipment |
(1,627 | ) | (1,016 | ) | ||||
| Restricted stock plan |
(68 | ) | — | |||||
| Deferred loan costs |
(1,265 | ) | (404 | ) | ||||
| Cash basis conversion |
(15 | ) | (51 | ) | ||||
| Prepaid expenses |
(671 | ) | (283 | ) | ||||
| Partnership income |
— | (42 | ) | |||||
| Gain on derivative instruments |
(1,324 | ) | — | |||||
| Unrealized gain on available for sale securities |
(135 | ) | — | |||||
| Purchase accounting fair value adjustments |
— | (1,513 | ) | |||||
| Total deferred tax liabilities |
(5,105 | ) | (3,309 | ) | ||||
| Net deferred tax asset |
$ | 19,526 | $ | 1,742 | ||||
Included above is $15,673 of deferred tax assets recorded in conjunction with the FCEC Merger.
A tax expense of $216 and $23 was recognized in the statement of operations in 2010 and 2009, respectively, related to changes in the valuation allowance. In addition, for 2010, $114 of the increase in the valuation allowance relates to adjustments in the deferred tax rate from 34% to 35% for gross deferred tax assets where realization is not more likely than not, as well as deferred tax assets for capital loss assets acquired from First Chester that are not considered realizable.
The valuation allowance as of December 31, 2010 relates to capital loss carryforwards and other than temporary impairments for which it is more likely than not that we will not be able to realize the tax benefit of these items prior to legal expiration. We had capital loss carryovers of $11,208 which will expire in 2014 and 2015. In addition to the capital loss carryforwards, we have acquired, net operating loss, charitable contribution, low income housing credits and alternative minimum tax credit carryforwards of $9,632, $637, $591, and $202, respectively through the FCEC Merger. The net operating loss carryforwards will expire between 2023 and 2027, the charitable contribution carryforwards will expire in 2015, the low income housing credits carryforwards will expire between 2027-2029, and the alternative minimum tax credit carryforwards have no expiration. All of the FCEC Merger carryforward tax attributes are subject to limitations as to the maximum amount of benefit that can be used in the years following the merger. In assessing the realizability of deferred tax assets, we consider whether it is more likely than not that some portion or all of the deferred tax assets will not be realized.
102
Table of Contents
The ultimate realization of deferred tax assets is dependent upon the generation of future taxable income during periods in which those temporary differences become deductible. We consider the scheduled reversal of deferred tax liabilities, projected future taxable income and tax planning strategies in making this assessment. Based on the level of historical taxable income and projections for future taxable income over the periods in which the deferred tax assets are deductible, we believe it is more likely than not that we will realize the benefits of these deferred tax assets, net of the valuation allowance at December 31, 2010.
As of December 31, 2010, we had no material unrecognized tax benefits or accrued interest and penalties. It is the our policy to account for interest and penalties accrued relative to unrecognized tax benefits as a component of income tax expense. Federal and state tax returns for the years 2007 through 2010 were open for examination as of December 31, 2010.
Note 15 – Financial Instruments with Off-Balance Sheet Risk
We are a party to financial instruments with off-balance sheet risk in the normal course of business to meet the financing needs of its customers. These financial instruments include commitments to extend credit and letters of credit. Such commitments involve, to varying degrees, elements of credit and interest rate risk in excess of the amount recognized in the consolidated balance sheet.
Our exposure to credit loss in the event of nonperformance by the other party to the financial instrument for commitments to extend credit is represented by the contractual amount of those instruments. We use the same credit policies in making commitments and conditional obligations as we do for on-balance sheet instruments.
The outstanding financial instruments represent credit risk in the following amounts at December 31, 2010 and 2009:
| December 31, 2010 |
December 31, 2009 |
|||||||
| Commitments to grant loans |
$ | 57,469 | $ | 12,350 | ||||
| Unfunded commitments under lines of credit |
399,647 | 267,683 | ||||||
| Letters of credit |
58,555 | 25,524 | ||||||
Commitments to extend credit, which include commitments to grant loans and unfunded commitments under lines of credit, are agreements to lend to a customer as long as there is no violation of any condition established in the contract. Since many of the commitments are expected to expire without being drawn upon, the total commitment amounts do not necessarily represent future cash requirements. Commitments generally have fixed expiration dates or other termination clauses and may require payment of a fee. We evaluate each customer’s credit worthiness on a case-by-case basis. The amount of collateral obtained, if deemed necessary, upon extension of credit, is based on our credit evaluation. Collateral held varies but may include personal or commercial real estate, accounts receivable, inventory and equipment.
Outstanding letters of credit are conditional commitments issued by the Bank to guarantee the performance of a customer to a third party. The credit risk involved in issuing letters of credit is essentially the same as that involved in extending loan facilities to customers. The Bank typically requires collateral supporting these letters of credit. We believe that the proceeds obtained through a liquidation of such collateral would be sufficient to cover the maximum potential amount of future payments required under the corresponding guarantees. The amount of the liability as of December 31, 2010 and 2009 for guarantees under standby letters of credit issued is not material to the consolidated financial statements.
Note 16 – Employee Benefit Plans
We purchased bank owned life insurance (“BOLI”) policies on certain employees as a means to generate tax-exempt income which is used to offset a portion of current and future employee benefit costs. Additionally,
103
Table of Contents
we acquired BOLI policies as a result of the FCEC Merger and Graystone Merger. The BOLI policies profit from the appreciation of the cash surrender value of the pool of insurance and are recorded as part of “Non-interest Income.” For the years ended 2010, 2009 and 2008, we recorded income of $1,524, $1,034, and $305, respectively, related to the appreciation in the cash surrender value of the insurance policies. The service costs associated with post retirement benefits of the insurance policies vested with the ongoing costs relating to interest expense incurred. We recorded expenses related to the cost of maintaining post retirement insurance of $269 and $368 for the years ended December 31, 2010 and 2009, respectively. As of December 31, 2010, and 2009, the estimated present value of the cost of post retirement life insurance totaled $1,757, and $1,623, respectively.
As part of the Graystone Merger, we acquired the Supplemental Executive Retirement Plan (“SERP”), implemented during 2002, which calls for a defined annual benefit to be paid to the former Chief Executive Officer of Tower. In connection with the Graystone Merger, all service related vesting was accelerated with the ongoing costs relating to interest expense. During 2010 and 2009, we recorded $28 and $18 of expense related to the SERP. The post retirement benefit liability for the SERP was $482 and $452 as of December 31, 2010 and 2009, respectively.
Also as part of the Graystone Merger, we acquired a Supplemental Insurance Plan (“SIP”) which provides certain current and former executives and directors with a post retirement benefit equal to annual deferred compensation amounts including annual interest earned on these amounts compounded monthly at a 10% annual interest rate. We hold life insurance contracts on the participating individuals as a means to offset the cost of the post retirement benefit. During 2010 and 2009, we recorded $70 and $51 in expense related to the cost of the post retirement benefit. The liability for the SIP as of December 31, 2010 and 2009 was $705 and $674, respectively.
Note 17 – Stock-Based Compensation
At December 31, 2010, we had five equity compensation plans, the 2010 Stock Incentive Plan (the “2010 Plan”), the 2006 Restricted Stock Plan (the “2006 Plan”), the 2007 Stock Incentive Plan (the “2007 Plan”), the 1995 Non-Qualified Stock Option Plan (the “1995 Plan”) and the Stock Option Plan for Outside Directors (the “Director Plan”). We also acquired the stock options of First Chester as of December 10, 2010.
2006 Restricted Stock Plan
During 2006, the shareholders of Graystone approved the 2006 Restricted Stock Plan (the “2006 Plan”), as amended, that provides for the issuance of up to 375,000 shares of restricted stock awards subject to a three year vesting period to key employees and directors. The recipient shall receive all dividends or other distributions and shall have the right to vote with respect to issued but unvested shares. On March 31, 2009, as a result of the Graystone Merger, we have adopted the provisions of this plan. As of March 31, 2009, we had issued all of the available awards under the plan and all of the awards are completely vested as a result of the vesting acceleration in association with the Graystone Merger. We recognized $0, $295, and $333 of compensation expense during the year ending December 31, 2010, 2009 and 2008, respectively, related to the vesting of the restricted stock awards.
2007 Stock Incentive Plan
In May 2007, the shareholders of Graystone approved the 2007 Stock Incentive Plan (the “2007 Plan”). Under the Plan, we may grant incentive stock options, nonqualified stock options, stock appreciation rights, restricted stock, and deferred stock for up to 600,000 shares of common stock to key employees and directors. On March 31, 2009, as a result of the Graystone Merger, we have adopted the provisions of this plan.
Subsequent to the Graystone Merger and as a result of the conversion factor, the total number of shares authorized to be issued under the 2007 Plan equaled 252,000. At December 31, 2010, 49,415 shares were available for issuance under the 2007 Plan.
104
Table of Contents
The following table summarizes the outstanding stock options and restricted stock under the 2007 Plan at December 31, 2010 and 2009:
Stock Options
| Date of Issuance |
Options Issued |
Exercise Price |
Expiration Date |
Options Vested | Unearned Compensation (in 000’s) |
|||||||||||||||||||||||
| December 31, 2010 |
December 31, 2009 |
December 31, 2010 |
December 31, 2009 |
|||||||||||||||||||||||||
| June 26, 2007 |
26,145 | $ | 22.22 | June 26, 2017 | 26,145 | 26,145 | $ | — | $ | — | ||||||||||||||||||
| January 22, 2008 |
1,050 | $ | 30.96 | January 22, 2018 | 1,050 | 1,050 | — | — | ||||||||||||||||||||
| July 17, 2008 |
56,700 | $ | 30.96 | July 17, 2018 | 56,700 | 56,700 | — | — | ||||||||||||||||||||
| September 22, 2009 |
52,400 | $ | 26.77 | |
September 22, 2019 |
|
10,480 | — | 251 | 318 | ||||||||||||||||||
| November 24, 2009 |
36,000 | $ | 19.80 | |
November 24, 2019 |
|
7,200 | — | 145 | 182 | ||||||||||||||||||
| 172,295 | 101,575 | 83,895 | $ | 396 | $ | 500 | ||||||||||||||||||||||
Restricted Stock
| Date of Issuance |
Shares Issued |
Fair Value Per Share |
Expiration Date |
Shares Vested | Unearned Compensation (in 000’s) |
|||||||||||||||||||||||
| December 31, 2010 |
December 31, 2009 |
December 31, 2010 |
December 31, 2009 |
|||||||||||||||||||||||||
| September 28, 2010 |
30,290 | $ | 20.92 | N/A | — | — | $ | 549 | $ | — | ||||||||||||||||||
| 30,290 | — | — | $ | 549 | $ | — | ||||||||||||||||||||||
The stock options normally vest over a three to five year vesting period and are expensed over the vesting period. The restricted stocks have a vesting period of 1 to 5 years and are expensed over the vesting period. As a result of the Graystone Merger, all of the outstanding options at March 30, 2009 became fully vested and exercisable. No options issued under this plan were exercised during 2010 and 2009. The aggregate intrinsic value of outstanding unvested stock options at December 31, 2010 and 2009 was $68 and $116, respectively. Options and restricted stock granted resulted in compensation expense of $189, $569 and $177 during 2010, 2009 and 2008, respectively. As of December 31, 2010, a total of 101,575 options have vested with an intrinsic value of $17. These vested options can be exercised at an average price of $27.46 and have an average remaining life of approximately 7.5 years. The fair values of the options awarded under the 2007 Plan are estimated on the date of grant using the Black-Scholes valuation methodology. During 2010, a total of 2,000 options were forfeited.
Upon the closing of the Graystone Merger, all of the issued and outstanding stock options originally issued by Graystone converted to options exercisable for our common stock. Additionally, all options became fully vested at the time of conversion. As a result and in accordance with U.S. GAAP, we revalued the converted options as of the conversion date. The re-valuation of the converted options did not result in any incremental costs. The table below shows the assumptions utilized to value all stock options:
| Date of Issuance |
Dividend Yield |
Expected Volatility |
Risk Free Interest Rate |
Estimated Forfeitures |
Expected Life |
Issue-Date Fair Value |
||||||||||||||||||
| June 26, 2007 |
4.49 | % | 32.17 | % | 2.31 | % | 0.00 | % | 6 years | $ | 5.75 | |||||||||||||
| January 22, 2008 |
4.49 | % | 32.17 | % | 2.31 | % | 0.00 | % | 6 years | $ | 3.70 | |||||||||||||
| July 17, 2008 |
4.49 | % | 32.17 | % | 2.31 | % | 1% – 3 | % | 6.5 years | $ | 3.80 | |||||||||||||
| September 22, 2009 |
4.00 | % | 31.84 | % | 3.50 | % | (1 | ) | (2 | ) | $ | 6.63 | ||||||||||||
| November 24, 2009 |
4.00 | % | 32.63 | % | 3.39 | % | 2 | % | 9 years | $ | 5.00 | |||||||||||||
(1) Estimated forfeitures for stock options issued to executives are 2.00% while the estimated forfeiture for stock options issued to employees is 5.00%.
105
Table of Contents
(2) Expected life for stock options issued to executives is 9 years while estimated expected life for stock options issued to employees is 7 years.
The dividend yield assumption is based on dividend history and the expectation of future dividend yields. The expected volatility is based on historical volatility using our stock price. The risk-free rate is the U.S. Treasury zero-coupon rate commensurate with the expected life of the options on the date of the grant.
2010 Stock Incentive Plan
In May 2010, the shareholders approved the 2010 Stock Incentive Plan (the “2010 Plan”). The 2010 Plan permits grants of stock options, stock appreciation rights, restricted stock, deferred stock and performance awards (collectively, “Awards”) for up to 400,000 shares of our common stock to key employees and directors. At December 31, 2010, 398,950 shares were available for issuance under the 2010 Plan.
The following table summarizes the restricted stock issued under the 2010 Plan at December 31, 2010 and 2009:
Restricted Stock
| Date of Issuance |
Shares Issued |
Fair Value Per Share |
Expiration Date |
Shares Vested | Unearned Compensation (in 000’s) |
|||||||||||||||||||||||
| December 31, 2010 |
December 31, 2009 |
December 31, 2010 |
December 31, 2009 |
|||||||||||||||||||||||||
| September 28, 2010 |
1,050 | $ | 20.92 | N/A | — | — | $ | 21 | $ | — | ||||||||||||||||||
| 1,050 | — | — | $ | 21 | $ | — | ||||||||||||||||||||||
The restricted stock option grant has a vesting period of five years and is expensed over the vesting period. The restricted stock granted resulted in compensation expense of $1 as of December 31, 2010.
1995 Non-Qualified Stock Option Plan
At December 31, 2010, there were 5,700 options outstanding under the 1995 Plan and we recognized $7 and $2 in compensation expense related to the 1995 Plan during 2010 and 2009, respectively. There are a total of 27,719 options available to be issued under this plan at December 31, 2010.
The following table summarizes the outstanding non-qualified stock options under the 1995 Plan at December 31, 2010 and 2009:
| Date of Issuance |
Options Issued |
Exercise Price |
Expiration Date | Options Vested | Unearned Compensation (in 000’s) |
|||||||||||||||||||||||
| December 31, 2010 |
December 31, 2009 |
December 31, 2010 |
December 31, 2009 |
|||||||||||||||||||||||||
| September 22, 2009 |
5,700 | $ | 26.77 | |
September 22, 2019 |
|
1,140 | — | $ | 27 | $ | 34 | ||||||||||||||||
| 5,700 | 1,140 | — | $ | 27 | $ | 34 | ||||||||||||||||||||||
The assumptions utilized to calculate the issue date fair value of $6.63 are the same as the assumptions used for shares issued under the 2007 Plan.
Stock Option Plan for Outside Directors
At December 31, 2010, there were a total of 11,926 options outstanding under the Director Plan. The options outstanding are all fully vested, have a weighted average exercise price of $38.06 per share, and have a weighted
106
Table of Contents
average life to maturity of 6.1 years. We recognized $0 in compensation expense related to the Director Plan during 2010 and 2009. There are a total of 71,152 options available to be issued under this plan at December 31, 2010.
First Chester Stock Option Plans
As part of the FCEC Merger, 181,142 outstanding stock options exercisable in First Chester common shares were converted to 64,487 fully vested stock options exercisable in Tower Bancorp common stock. Following conversion there were a total of 64,487 options outstanding with a weighted average exercise price of $45.61 and a weighted average life to maturity of 2.8 years. No additional options are available to be issued under these plans.
Stock Purchase Plans
During the second quarter of 2009, the Board of Directors approved a Dividend Reinvestment and Stock Purchase Plan (“Plan”) to provide the shareholders with the opportunity to use cash dividends, as well as optional cash payments up to $50 per quarter, to purchase additional shares of the our common stock. We have reserved 1,000,000 shares of common stock, no par value, for issuance under the Plan. At our discretion, shares may be purchased under the Plan directly from us or in open market purchases from others by the plan agent. The purchase price for shares purchased from us with reinvested dividends is 95% of the fair market value of the common stock on the investment date. The purchase price for shares purchased with voluntary cash payments or any open market purchases is 100% of the fair market value of the common stock on the investment date. During 2010, approximately $717 in capital has been raised under the Plan. Since the Plan’s inception, the Plan has raised approximately $1,121.
Also during the second quarter of 2009, the Board of Directors and shareholders approved an Employee Stock Purchase Plan (“Employee Plan”) to provide the our employees with the opportunity to purchase shares of our common stock directly. The purchase price for shares purchased under the Employee Plan is 95% of the fair market value of the common stock on the purchase date. During 2010, approximately $142 in capital has been raised under the Employee Plan. Since the Employee Plan’s inception, the Employee Plan has raised approximately $207.
Note 18 – Fair Value Measurements
Fair value is the price that would be received to sell an asset or paid to transfer a liability (an exit price) in an orderly transaction between market participants on the measurement date. We determine the fair value of the financial instruments based on the fair value hierarchy. We maximize the use of observable inputs and minimize the use of unobservable inputs when measuring fair value. Observable inputs are inputs that market participants would use in pricing the asset or liability developed based on market data obtained from outside independent sources. Unobservable inputs are inputs that reflect the assumptions that market participants would use in pricing the asset or liability based on the best information available in the circumstances. Three levels of inputs are used to measure fair value. A financial instrument’s level within the fair value hierarchy is based on the lowest level of input significant to the fair value measurement.
| Level 1: | Unadjusted quoted prices in active markets that are accessible at the measurement date for identical, unrestricted assets or liabilities. | |
| Level 2: | Quoted prices in markets that are not active, or inputs that are observable either directly or indirectly, for substantially the full term of the asset or liability. | |
| Level 3: | Prices or valuation techniques that require inputs that are both significant to the fair value measurement and unobservable (i.e., supported with little or no market activity). | |
An asset’s or liability’s level within the fair value hierarchy is based on the lowest level of input that is significant to the fair value measurement.
107
Table of Contents
For financial assets measured at fair value on a recurring basis, the fair value measurements by level within the fair value hierarchy used at December 31, 2010 and 2009, respectively, are as follows:
| December 31, 2010 |
Quoted Prices (Level 1) |
Significant Other Observable Inputs (Level 2) |
Significant Unobservable Inputs (Level 3) |
|||||||||||||
| Equity securities |
$ | 195 | $ | — | $ | — | $ | 195 | ||||||||
| U.S. Treasury securities |
5,002 | 5,002 | — | — | ||||||||||||
| U.S. Government sponsored agency securities |
7,780 | — | 7,780 | — | ||||||||||||
| U.S. Government sponsored agency mortgage-backed securities |
10,754 | — | 10,754 | — | ||||||||||||
| Collateralized mortgage obligations |
48,587 | — | 48,587 | — | ||||||||||||
| Municipal bonds |
10,654 | — | 10,654 | — | ||||||||||||
| Municipal bonds – taxable |
10,014 | — | 10,014 | — | ||||||||||||
| SBA pool loan investments |
9,709 | — | 9,709 | — | ||||||||||||
| Commercial servicing rights |
520 | — | — | 520 | ||||||||||||
| Derivative instruments |
2,147 | — | — | 2,147 | ||||||||||||
| $ | 105,362 | $ | 5,002 | $ | 97,498 | $ | 2,862 | |||||||||
| December 31, 2009 |
Quoted Prices (Level 1) |
Significant Other Observable Inputs (Level 2) |
Significant Unobservable Inputs (Level 3) |
|||||||||||||
| Equity securities |
$ | 1,132 | $ | 300 | $ | 783 | $ | 49 | ||||||||
| U.S Government sponsored agency securities |
56,384 | — | 56,384 | — | ||||||||||||
| U.S. Government sponsored agency mortgage-backed securities |
9,116 | — | 9,116 | — | ||||||||||||
| Collateralized mortgage obligations |
92,485 | — | 92,485 | — | ||||||||||||
| Municipal bonds |
7,188 | — | 7,188 | — | ||||||||||||
| Municipal bonds – taxable |
12,910 | — | 12,910 | — | ||||||||||||
| SBA pool loan investments |
10,638 | — | 10,638 | — | ||||||||||||
| Commercial servicing rights |
473 | — | 473 | — | ||||||||||||
| $ | 190,326 | $ | 300 | $ | 189,977 | $ | 49 | |||||||||
The valuation technique to measure the fair values for the items in the tables above are as follows:
Securities available for sale
As quoted market prices for the investments in securities available for sale held at the Bank, such as government agency bonds, corporate bonds, municipal bonds, etc, are not readily available, a matrix pricing model is used to value these investments. The matrix pricing model takes into consideration yields/prices of securities with similar characteristics, including credit quality, industry, and maturity to determine a fair value measure.
For equity securities held, we have determined which securities are traded in active markets versus inactive markets. For those securities traded in active markets, we have recorded the securities at quoted market prices. In cases where the securities are deemed to trade in inactive markets, we have adjusted quoted market prices for factors such as indicative bids received from brokers.
108
Table of Contents
Commercial servicing rights
The fair value of commercial servicing rights (“MSRs”) was estimated using Level 3 inputs. MSRs do not trade in an active, open market with readily observable prices. As such, we determine the fair value of the MSRs using a projected cash flow model that considers loan rates and maturities, discount rate assumptions, estimated servicing revenue and expenses, and estimated prepayment speeds.
Derivative instruments
The fair value of interest rate lock commitments (derivative loan commitments) and forward sales commitments are estimated using a process similar to mortgage loans held for sale. Interest rate lock commitments are recorded as a recurring Level 3. Loan commitments and best efforts commitments are assigned a probability that the related loan will be funded and the commitment will be exercised. We rely on historical “pull-through” percentages in establishing probability. Forward sale commitments are recorded as a recurring Level 2.
The following table presents reconciliations of our assets measured at fair value on a recurring basis using unobservable inputs (Level 3) for the year ended December 31, 2010 and 2009, respectively:
| 2010 |
Equity Securities | Commercial Servicing Rights |
Derivative Instruments |
|||||||||
| Balance, December 31, 2009 |
$ | 49 | $ | — | $ | — | ||||||
| Purchase through FCEC Merger |
169 | — | 3,590 | |||||||||
| Transfers In from level 2 |
177 | 473 | — | |||||||||
| Sale of asset |
(60 | ) | — | — | ||||||||
| Change in fair value |
(140 | ) | 47 | (1,443 | ) | |||||||
| Balance, December 31, 2010 |
$ | 195 | $ | 520 | $ | 2,147 | ||||||
| 2009 |
Equity Securities | |||||||||||
| Balance, December 31, 2008 |
$ | — | ||||||||||
| Purchase through Graystone Merger |
230 | |||||||||||
| Transfers in from level 2 |
44 | |||||||||||
| Transfers out to level 2 |
(3 | ) | ||||||||||
| Sale of asset |
(177 | ) | ||||||||||
| Change in fair value |
(45 | ) | ||||||||||
| Balance, December 31, 2009 |
$ | 49 | ||||||||||
109
Table of Contents
For financial assets and liabilities measured at fair value on a nonrecurring basis, the fair value measurements by level within the fair value hierarchy used at December 31, 2010 and 2009 are as follows:
| December 31, 2010 |
Quoted Prices (Level 1) |
Significant Other Observable Inputs (Level 2) |
Significant Unobservable Inputs (Level 3) |
|||||||||||||
| Loans held for sale |
$ | 147,281 | $ | — | $ | — | $ | 147,281 | ||||||||
| Impaired loans |
17,722 | — | — | 17,722 | ||||||||||||
| Other real estate owned |
4,647 | — | — | 4,647 | ||||||||||||
| Loans purchased (1)(3) |
763,771 | — | — | 763,771 | ||||||||||||
| Core deposit intangible asset (1) |
4,440 | — | — | 4,440 | ||||||||||||
| Leasehold intangible assets (1) |
342 | — | — | 342 | ||||||||||||
| Premises and equipment (1) |
26,724 | — | — | 26,724 | ||||||||||||
| Total assets |
$ | 964,927 | $ | — | $ | — | $ | 964,927 | ||||||||
| Time deposits (1) |
$ | 436,126 | $ | — | $ | 436,126 | $ | — | ||||||||
| Borrowings (1) |
80,049 | — | 80,049 | — | ||||||||||||
| Leasehold intangible liabilities(1) |
643 | — | — | 643 | ||||||||||||
| Total liabilities |
$ | 516,818 | $ | — | $ | 516,175 | $ | 643 | ||||||||
| December 31, 2009 |
Quoted Prices (Level 1) |
Significant Other Observable Inputs (Level 2) |
Significant Unobservable Inputs (Level 3) |
|||||||||||||
| Loans held for sale |
$ | 8,034 | $ | — | $ | — | $ | 8,034 | ||||||||
| Impaired loans |
4,718 | — | — | 4,718 | ||||||||||||
| Other real estate owned |
927 | — | — | 927 | ||||||||||||
| Loans purchased (2) |
418,747 | — | — | 418,747 | ||||||||||||
| Core deposit intangible asset (2) |
3,899 | — | — | 3,899 | ||||||||||||
| Premises and equipment (2) |
22,644 | — | — | 22,644 | ||||||||||||
| Total assets |
$ | 458,969 | $ | — | $ | — | $ | 458,969 | ||||||||
| Time deposits (2) |
$ | 160,806 | $ | — | $ | 160,806 | $ | — | ||||||||
| Borrowings (2) |
69,601 | — | 69,601 | — | ||||||||||||
| Total liabilities |
$ | 230,407 | $ | — | $ | 230,407 | $ | — | ||||||||
| (1) | – Assets and liabilities are presented at fair value as of the date of the FCEC Merger |
| (2) | – Assets and liabilities are presented at fair value as of the date of the Graystone Merger. |
| (3) | – Balance does not include the loans held for sale that were acquired as part of the FCEC Merger. |
The valuation technique to measure the fair values for the items in the tables above are as follows:
Loans held for sale
Loan held for sale include residential mortgage loans which are measured at the lower of aggregate cost or fair value. The fair value is measured as the price that secondary market investors were offering for loans with similar characteristics.
Impaired loans
Under U.S GAAP, a loan is classified as impaired when it is possible that the bank will be unable to collect all or part of the loan balance due based on the contractual agreement, including the interest as well as the principal. Based on this guidance, we consider all loans placed in non-accrual status as being impaired and
110
Table of Contents
subject to an impairment analysis in accordance with ASC 310-10-35. Loans acquired through the FCEC Merger and Graystone Merger that were deemed impaired, were recorded using a discounted cash flow model in accordance with ASC 310-30 at the time of acquisition even though we consider these loans to be collateral dependent. The carrying amounts of these loans at December 31, 2010 and 2009 were $59,260 and $6,199, respectively. These loans are not included in the preceding table.
Impaired loans included in the preceding table are those for which we have measured impairment based on the fair value of underlying collateral. The balance of impaired loans consists of loans deemed impaired in accordance with our accounting policy disclosed within its “Critical Accounting Policies.” Fair value is determined primarily based upon independent third party appraisals of the properties. At December 31, 2010, $11,606 of impaired loans were measured using the fair value of underlying collateral and $6,116 of impaired loans were measured using a discounted cash flow model. At December 31, 2009, $4,650 of impaired loans were measured using the fair value of underlying collateral and $68 of impaired loans were measured using a discounted cash flow model.
Other real estate owned
Other real estate owned consists of twenty-two properties totaling $4,647 at December 31, 2010 and four properties totaling $927 at December 31, 2009. These properties have been through the foreclosure process and are currently in the process of being sold. These properties are recorded at their lower of cost or fair value less costs to sell.
Loans purchased
In conjunction with the FCEC Merger and Graystone Merger, the loans purchased were recorded at their acquisition date fair value. In order to record the loans at fair value, we made three different types of fair value adjustments. A market rate adjustment was made to adjust for the movement in market interest rates, irrespective of credit adjustments, compared to the stated rates of the acquired loans. A credit adjustment was made on pools of homogeneous loans representing the changes in credit quality of the underlying borrowers from the loan inception to the acquisition date. The credit adjustment on distressed loans represents the portion of the loan balance that has been deemed uncollectible based on our expectations of future cash flows for each respective loan.
Core deposit intangible assets
The fair value assigned to the core deposit intangible asset represents the future economic benefit of the potential cost savings from acquiring core deposits in the FCEC Merger and Graystone Merger compared to the cost of obtaining alternative funding such as brokered deposits from market sources. We utilized an income valuation approach to present value the estimated future cash savings in order to determine the fair value of the intangible asset.
Premises and equipment
Premises and equipment acquired through the FCEC Merger and Graystone Merger has been assigned an acquisition date fair value through the use of independent appraisals and internal discounted cash flow models. Both approaches utilized an income based valuation approach to determine the fair value for the premises and equipment based on the highest and best use concept.
Time deposits
Time deposits acquired through the FCEC Merger and Graystone Merger have been recorded at their acquisition date fair value. In order to derive the fair value, we adjusted the amortized cost basis of the deposits to reflect the current interest rates paid on time deposits at the time of acquisition. The fair value adjustment reflects the movement in interest rates from inception of the deposit to the acquisition date.
111
Table of Contents
Borrowings
Borrowings assumed through the FCEC Merger and Graystone Merger were recorded at their acquisition date fair value. The fair value adjustment to the carrying value of the borrowings represents the movement in interest rates from the inception of the individual borrowings to the acquisition date.
The following information should not be interpreted as an estimate of the fair value for the entire company since a fair value calculation is only provided for a limited portion of our assets and liabilities. Due to a wide range of valuation techniques and the degree of subjectivity used in making the estimates, comparisons between our disclosures and those of other companies may not be meaningful.
The estimated fair values of our financial instruments were as follows as of December 31, 2010 and 2009:
| December 31, 2010 | December 31, 2009 | |||||||||||||||
| Carrying Amount |
Fair Value | Carrying Amount |
Fair Value | |||||||||||||
| Financial assets: |
||||||||||||||||
| Cash, due from banks, and federal funds sold |
$ | 248,479 | $ | 248,479 | $ | 50,600 | $ | 50,600 | ||||||||
| Securities available for sale |
102,695 | 102,695 | 189,853 | 189,853 | ||||||||||||
| Restricted investment in bank stock |
14,696 | 14,696 | 6,254 | 6,254 | ||||||||||||
| Loans held for sale |
147,281 | 147,281 | 8,034 | 8,034 | ||||||||||||
| Loans, net of allowance for loan losses |
2,058,191 | 2,072,690 | 1,128,576 | 1,151,368 | ||||||||||||
| Accrued interest receivable |
7,856 | 7,856 | 4,974 | 4,974 | ||||||||||||
| Derivative instruments |
2,147 | 2,147 | — | — | ||||||||||||
| Financial liabilities: |
||||||||||||||||
| Deposits |
2,299,898 | 2,257,753 | 1,216,469 | 1,191,126 | ||||||||||||
| Securities sold under agreements to repurchase |
6,605 | 6,605 | 6,892 | 6,892 | ||||||||||||
| Short-term borrowings |
55,039 | 55,039 | 5,292 | 5,292 | ||||||||||||
| Long-term debt |
87,800 | 83,167 | 65,689 | 65,689 | ||||||||||||
| Accrued interest payable |
1,950 | 1,950 | 1,090 | 1,090 | ||||||||||||
| Notional Amount |
Fair Value | Notional Amount |
Fair Value | |||||||||||||
| Off-balance sheet financial instruments: |
||||||||||||||||
| Commitments to grant loans |
57,469 | — | 12,350 | — | ||||||||||||
| Unfunded commitments under lines of credit |
399,647 | 454 | 267,683 | — | ||||||||||||
| Letters of credit |
58,555 | 149 | 25,524 | — | ||||||||||||
The following methods and assumptions were used to estimate the fair values of our financial instruments at December 31, 2010 and 2009.
Cash and cash equivalents (carried at cost)
The carrying amounts reported in the balance sheet for cash and short-term instruments approximate those assets’ fair values.
Restricted investment in bank stock (carried at cost)
The carrying amount of restricted investment in bank stock approximates fair value, and considers the limited marketability of such securities.
Loans held for sale (carried at lower of cost or fair value)
The carrying amounts of loans held for sale approximate their fair value.
112
Table of Contents
Loans (carried at cost)
The fair values of loans are estimated using discounted cash flow analyses, using market rates at the balance sheet date that reflect the credit and interest rate-risk inherent in the loans. Projected future cash flows are calculated based upon contractual maturity or call dates, projected repayments and prepayments of principal. Generally, for variable rate loans that reprice frequently and with no significant change in credit risk, fair values are based on carrying values. This method of estimating fair value does not incorporate the exit price concept of fair value but is a permitted methodology for purposes of this disclosure.
Accrued interest receivable and payable (carried at cost)
The carrying amount of accrued interest receivable and accrued interest payable approximates its fair value.
Deposits (carried at cost)
The fair values disclosed for demand deposits (e.g., interest and noninterest checking, passbook savings and money market accounts) are, by definition, equal to the amount payable on demand at the reporting date (i.e., their carrying amounts). Fair values for fixed-rate certificates of deposit are estimated using a discounted cash flow calculation that applies interest rates currently being offered in the market on certificates to a schedule of aggregated expected monthly maturities on time deposits.
Short-term borrowings (carried at cost)
The carrying amounts of short-term borrowings approximate their fair values.
Long-term debt (carried at cost)
Fair values of FHLB advances are estimated using discounted cash flow analysis, based on quoted prices for new FHLB advances with similar credit risk characteristics, terms and remaining maturity. These prices obtained from this active market represent a market value that is deemed to represent the transfer price if the liability were assumed by a third party. The carrying amount of the subordinated debt is considered its fair value as these borrowings were only marketed to close related investors.
Off-balance sheet financial instruments (disclosed at cost)
Fair values for the Bank’s off-balance sheet financial instruments (lending commitments and letters of credit) are based on fees currently charged in the market to enter into similar agreements, taking into account, the remaining terms of the agreements and the counterparties’ credit standing as well as reserves for unfunded commitments representing the estimate of losses associated with unused commitments.
113
Table of Contents
Note 19 – Commitments and Contingent Liabilities
Operating Leases
We are obligated under operating leases for most of our banking offices as well as our administrative office space. For the years ended December 31, 2010, 2009 and 2008, rental expense under operating leases was $2,176, $1,858 and $1,016, respectively, which is included in the occupancy and equipment expenses. Office leases generally include renewal options for various additional terms after the expiration of the initial term of each lease, which are not included in the future minimum lease payments below. At December 31, 2010, future minimum lease payments for the fixed, non-cancelable terms of operating leases are as follows:
| 2011 |
$ | 3,835 | ||
| 2012 |
3,926 | |||
| 2013 |
3,878 | |||
| 2014 |
3,600 | |||
| 2015 |
2,970 | |||
| Thereafter |
21,109 | |||
| $ | 39,318 | |||
Reserve for Unfunded Commitments
We maintain a reserve for unfunded loan commitments and letters of credit which is reported in other liabilities in the consolidated balance sheets consistent with ASC 825-10. As of the balance sheet date, we record estimated losses inherent with unfunded loan commitments in accordance with ASC 450-20, and estimated future obligations under letters of credit in accordance with ASC 460-10. The methodology used to determine the adequacy of this reserve is integrated in our process for establishing the allowance for loan losses and considers the probability of future losses and obligations that may be incurred under these off-balance sheet agreements. The reserve for unfunded loan commitments and letters of credit as of December 31, 2010 was approximately $454. We believe this reserve level is sufficient to absorb estimated probable losses related to these commitments.
Contingent Liabilities
We, from time to time, may be involved in legal proceedings relating to the conduct of our banking business. These legal proceedings may include claims and legal actions to which we succeeded as a result of mergers and acquisitions. Currently, we are involved in legal proceedings relating to the operations of the AHB Division prior to the FCEC Merger. Based upon the current information related to these legal proceedings and the conditions established in FASB ASC 450, “Accounting for Contingencies,” we cannot reasonably estimate any potential liability for loss on these legal proceedings at this time.
Based on current knowledge, advice of counsel, available insurance coverage and established reserves, management does not anticipate, at the present time, that the aggregate liability, if any, arising out of such legal proceedings will have a material adverse effect on our consolidated financial position or liquidity. However, given the inherent uncertainties involved in these matters, some of which are beyond the our control, and the amount or indeterminate damages sought in some of these matters, there can be no assurance that an adverse outcome in one or more of these matters would not be material to our results of operations or cash flows for any particular future reporting period.
Note 20 – Regulatory Matters
Dividends paid are generally provided from the subsidiary bank’s dividends. The Federal Reserve Board, which regulates bank holding companies, establishes guidelines which indicate that cash dividends should be covered by current year earnings and the debt to equity ratio of the holding company must be below thirty percent. Additionally, we are required to consult with the Federal Reserve Board before declaring dividends and are to strongly consider eliminating, deferring, or reducing dividends we pay to our shareholders if (1) our net
114
Table of Contents
income available to shareholders for the past four quarters net of dividends previously paid during that period, is not sufficient to fully fund the dividends, (2) our prospective rate of earnings retention is not consistent with our capital needs and overall current and prospective financial condition, or (3) we will not meet, or are in danger of not meeting, our minimum regulatory capital adequacy ratios. The Bank is subject to the dividend restrictions set forth by the Pennsylvania Banking Code. Dividends that the Bank could declare without approval of the Pennsylvania Department of Banking amounted to approximately $55,183 and $21,718 at December 31, 2010 and 2009, respectively. We declared the payment of a dividend in January 2011 in excess of earnings for calendar year-end 2010. We believe that the declaration and payment of the dividend does not jeopardize our ability to operate in a safe and sound manner. The Federal Reserve Bank of Philadelphia issued a no objection letter regarding the payment of the dividend in first quarter 2011. We can give no assurance whether the company will request or receive no objection from the Federal Reserve to declare and pay dividends in the future with respect to which the above described conditions are not met.
We are subject to various regulatory capital requirements administered by federal banking agencies. Failure to meet minimum capital requirements can initiate certain mandatory and possibly additional discretionary actions by regulators that, if undertaken, could have a direct material effect on our financial statements. Under capital adequacy guidelines and the regulatory framework for prompt corrective action, we must meet specific capital guidelines that involve quantitative measures of their assets, liabilities and certain off-balance sheet items as calculated under regulatory accounting practices. The capital amounts and classification are also subject to qualitative judgments by the regulators about components, risk weightings, and other factors.
Quantitative measures established by regulation to ensure capital adequacy require us to maintain minimum amounts and ratios (set forth below) of total and Tier 1 capital (as defined in the regulations) to risk-weighted assets and of Tier 1 capital to average assets. We believe, as of December 31, 2010 and 2009, that we have met all capital adequacy requirements to which we are subject. A comparison of our capital ratios to regulatory minimums at December 31 is as follows:
| Actual | For Capital Adequacy Purposes |
To be Well Capitalized under Prompt Corrective Action Provisions |
||||||||||||||||||||||
| Amount | Ratio | Amount | Ratio | Amount | Ratio | |||||||||||||||||||
| As of December 31, 2010 |
||||||||||||||||||||||||
| Total capital (to risk-weighted assets): |
||||||||||||||||||||||||
| Tower Bancorp, Inc. |
$ | 277,104 | 13.2 | % | 167,428 | 8.0 | % | N/A | N/A | |||||||||||||||
| Graystone Tower Bank |
246,623 | 11.8 | % | 167,287 | 8.0 | % | 209,109 | 10.0 | % | |||||||||||||||
| Tier 1 capital (to risk-weighted assets): |
||||||||||||||||||||||||
| Tower Bancorp, Inc. |
247,598 | 11.8 | % | 83,714 | 4.0 | % | N/A | N/A | ||||||||||||||||
| Graystone Tower Bank |
232,161 | 11.1 | % | 83,643 | 4.0 | % | 125,465 | 6.0 | % | |||||||||||||||
| Tier 1 capital (to average total assets): |
||||||||||||||||||||||||
| Tower Bancorp, Inc. |
247,598 | 13.5 | % | 73,637 | 4.0 | % | N/A | N/A | ||||||||||||||||
| Graystone Tower Bank |
232,161 | 12.6 | % | 73,884 | 4.0 | % | 92,335 | 5.0 | % | |||||||||||||||
| As of December 31, 2009 |
||||||||||||||||||||||||
| Total capital (to risk-weighted assets): |
||||||||||||||||||||||||
| Tower Bancorp, Inc. |
$ | 165,860 | 14.5 | % | 91,305 | 8.0 | % | N/A | N/A | |||||||||||||||
| Graystone Tower Bank |
164,560 | 14.4 | % | 91,212 | 8.0 | % | 114,014 | 10.0 | % | |||||||||||||||
| Tier 1 capital (to risk-weighted assets): |
||||||||||||||||||||||||
| Tower Bancorp, Inc. |
148,965 | 13.1 | % | 45,653 | 4.0 | % | N/A | N/A | ||||||||||||||||
| Graystone Tower Bank |
154,811 | 13.6 | % | 45,606 | 4.0 | % | 68,409 | 6.0 | % | |||||||||||||||
| Tier 1 capital (to average total assets): |
||||||||||||||||||||||||
| Tower Bancorp, Inc. |
148,965 | 10.7 | % | 55,702 | 4.0 | % | N/A | N/A | ||||||||||||||||
| Graystone Tower Bank |
154,811 | 11.1 | % | 55,613 | 4.0 | % | 69,502 | 5.0 | % | |||||||||||||||
115
Table of Contents
Note 21 – Tower Bancorp, Inc. (Parent Company Only) Financial Information
Condensed Balance Sheet (Parent Only)
| December 31, | ||||||||
| 2010 | 2009 | |||||||
| Assets |
||||||||
| Cash and due from banks |
$ | 35,270 | $ | 637 | ||||
| Securities available for sale |
195 | 1,132 | ||||||
| Investment in subsidiary |
256,611 | 169,715 | ||||||
| Other assets |
1,940 | 1,660 | ||||||
| Total assets |
$ | 294,016 | $ | 173,144 | ||||
| Liabilities and stockholders’ equity |
||||||||
| Borrowings |
$ | 36,452 | $ | 9,000 | ||||
| Other liabilities |
923 | 267 | ||||||
| Total liabilities |
37,375 | 9,267 | ||||||
| Stockholders’ equity |
256,641 | 163,877 | ||||||
| Total liabilities and stockholders’ equity |
$ | 294,016 | $ | 173,144 | ||||
Condensed Income Statement (Parent Only)
| Years Ended December 31, | ||||||||||||
| 2010 | 2009 | 2008 | ||||||||||
| Income: |
||||||||||||
| Dividends from subsidiary |
$ | 8,001 | $ | 4,825 | $ | — | ||||||
| Gain on sale of securities |
53 | 88 | — | |||||||||
| Noninterest income |
22 | — | — | |||||||||
| Expenses: |
||||||||||||
| Interest expense |
1,890 | 683 | 208 | |||||||||
| Noninterest expenses |
1,227 | 385 | 19 | |||||||||
| Income before taxes and equity in undistributed net earnings of subsidiary |
4,959 | 3,845 | (227 | ) | ||||||||
| Income tax benefit |
667 | 333 | 105 | |||||||||
| Equity in undistributed (loss) earnings of subsidiary |
(4,468 | ) | (469 | ) | 2,204 | |||||||
| Net Income |
$ | 1,158 | $ | 3,709 | $ | 2,082 | ||||||
116
Table of Contents
Condensed Statement of Cash Flows (Parent Only)
| Years Ended December 31, | ||||||||||||
| 2010 | 2009 | 2008 | ||||||||||
| Cash Flows from Operating Activities: |
||||||||||||
| Net income |
$ | 1,158 | $ | 3,709 | $ | 2,082 | ||||||
| Adjustments to reconcile net income to cash provided by (used in) operating activities: |
||||||||||||
| Equity in undistributed net (earnings) loss of subsidiary |
4,468 | 469 | (2,204 | ) | ||||||||
| Net gain on sale of equity securities |
(53 | ) | (59 | ) | — | |||||||
| Stock option expense |
111 | 569 | — | |||||||||
| Restricted stock expense |
138 | 295 | — | |||||||||
| Other than temporary impairment losses |
206 | (185 | ) | — | ||||||||
| Other, net |
(1,907 | ) | 764 | (211 | ) | |||||||
| Cash Provided by (Used in) operating activities |
4,121 | 5,562 | (333 | ) | ||||||||
| Cash flows from Investing Activities: |
||||||||||||
| Investment in subsidiary |
(21,000 | ) | (53,370 | ) | — | |||||||
| Sale of equity investment |
978 | 10,338 | — | |||||||||
| Cash received from merger/acquisition |
57 | 214 | — | |||||||||
| Cash Used in Investing Activities |
(19,965 | ) | (42,818 | ) | — | |||||||
| Cash Flows from Financing Activities: |
||||||||||||
| Proceeds from sale of common stock, net |
48,913 | 52,052 | — | |||||||||
| Proceeds from issuance of subordinated debt |
12,000 | 9,000 | — | |||||||||
| Repayment of other borrowing |
(2,435 | ) | (24,814 | ) | — | |||||||
| Proceeds from other borrowing |
— | 6,450 | 184 | |||||||||
| Dividends paid |
(8,001 | ) | (4,825 | ) | — | |||||||
| Cash Provided by Financing Activities |
50,477 | 37,863 | 184 | |||||||||
| Net Increase in Cash and Cash Equivalents |
34,633 | 607 | (149 | ) | ||||||||
| Cash and Cash Equivalents - Beginning |
637 | 30 | 179 | |||||||||
| Cash and Cash Equivalents - Ending |
$ | 35,270 | $ | 637 | $ | 30 | ||||||
| Supplemental disclosure of information: |
||||||||||||
| Interest paid |
$ | 1,890 | $ | 683 | $ | 208 | ||||||
117
Table of Contents
Management’s Report on Internal Control Over Financial Reporting
The management of Tower Bancorp Inc. is responsible for establishing and maintaining adequate internal control over financial reporting, as such term is defined in Exchange Act Rule 13a-15(f). Tower Bancorp Inc.’s internal control system is designed to provide reasonable assurance regarding the reliability of financial reporting and the preparation of financial statements for external purposes in accordance with U.S. generally accepted accounting principles.
Because of its inherent limitations, internal control over financial reporting may not prevent or detect misstatements. Also, projections of any evaluation of effectiveness to future periods are subject to the risk that controls may become inadequate because of changes in conditions, or that the degree of compliance with the policies or procedures may deteriorate.
Management assessed the effectiveness of the Company’s internal control over financial reporting as of December 31, 2010, using the criteria set forth by the Committee of Sponsoring Organizations of the Treadway Commission (COSO) in Internal Control – Integrated Framework. Based on this assessment, management concluded that, as of December 31, 2010, the company’s internal control over financial reporting is effective based on those criteria.
Our management’s assessment of the effectiveness of our internal control over financial reporting as of December 31, 2010 included internal controls at all consolidated entities and divisions other than 1N Bank (formerly known as First National Bank of Chester County), which was acquired on December 10, 2010. Our management has not evaluated 1N Bank’s internal controls over financial reporting, and our management’s conclusion regarding the effectiveness of internal controls over financial reporting does not extend to 1N Bank’s internal controls.
The effectiveness of our internal control over financial reporting has been audited by KPMG LLP, an independent registered public accounting firm, as stated in their report which is included herein.
| /S/ ANDREW S. SAMUEL |
| Andrew S. Samuel |
| Chief Executive Officer (Principal Executive Officer) |
| /S/ JOHN D. FINLEY |
| John D. Finley |
| Acting Chief Financial Officer (Principal Financial Officer) |
118
Table of Contents
Report of Independent Registered Public Accounting Firm
The Board of Directors and Stockholders
Tower Bancorp, Inc. and subsidiaries:
We have audited Tower Bancorp, Inc. and subsidiaries’ internal control over financial reporting as of December 31, 2010, based on criteria established in Internal Control – Integrated Framework issued by the Committee of Sponsoring Organizations of the Treadway Commission (COSO). Tower Bancorp, Inc. and subsidiaries’ management is responsible for maintaining effective internal control over financial reporting and for its assessment of the effectiveness of internal control over financial reporting, included in the accompanying Management’s Report on Internal Control Over Financial Reporting. Our responsibility is to express an opinion on the Company’s internal control over financial reporting based on our audit.
We conducted our audit in accordance with the standards of the Public Company Accounting Oversight Board (United States). Those standards require that we plan and perform the audit to obtain reasonable assurance about whether effective internal control over financial reporting was maintained in all material respects. Our audit included obtaining an understanding of internal control over financial reporting, assessing the risk that a material weakness exists, and testing and evaluating the design and operating effectiveness of internal control based on the assessed risk. Our audit also included performing such other procedures as we considered necessary in the circumstances. We believe that our audit provides a reasonable basis for our opinion.
A company’s internal control over financial reporting is a process designed to provide reasonable assurance regarding the reliability of financial reporting and the preparation of financial statements for external purposes in accordance with generally accepted accounting principles. A company’s internal control over financial reporting includes those policies and procedures that (1) pertain to the maintenance of records that, in reasonable detail, accurately and fairly reflect the transactions and dispositions of the assets of the company; (2) provide reasonable assurance that transactions are recorded as necessary to permit preparation of financial statements in accordance with generally accepted accounting principles, and that receipts and expenditures of the company are being made only in accordance with authorizations of management and directors of the company; and (3) provide reasonable assurance regarding prevention or timely detection of unauthorized acquisition, use, or disposition of the company’s assets that could have a material effect on the financial statements.
Because of its inherent limitations, internal control over financial reporting may not prevent or detect misstatements. Also, projections of any evaluation of effectiveness to future periods are subject to the risk that controls may become inadequate because of changes in conditions, or that the degree of compliance with the policies or procedures may deteriorate.
In our opinion, Tower Bancorp, Inc. and subsidiaries maintained, in all material respects, effective internal control over financial reporting as of December 31, 2010, based on criteria established in Internal Control – Integrated Framework issued by the Committee of Sponsoring Organizations of the Treadway Commission.
Tower Bancorp Inc. acquired First Chester County Corporation on December 10, 2010, and management excluded from its assessment of the effectiveness of Tower Bancorp Inc. and subsidiaries’ internal control over financial reporting as of December 31, 2010, First Chester County Corporation internal control over financial reporting associated with total assets of approximately $1.1 billion and net interest income of approximately $2.4 million included in the consolidated financial statements of Tower Bancorp, Inc. and subsidiaries as of and for the year ended December 31, 2010. Our audit of internal control over financial reporting of Tower Bancorp Inc. and subsidiaries also excluded an evaluation of the internal control over financial reporting of First Chester County Corporation.
We also have audited, in accordance with the standards of the Public Company Accounting Oversight Board (United States), the consolidated balance sheets of Tower Bancorp. Inc. and subsidiaries as of December 31, 2010 and 2009, and the related consolidated statements of operations, changes in equity and comprehensive income, and cash flows for each of the years in the two-year period ended December 31, 2010, and our report dated March 16, 2011 expressed an unqualified opinion on those consolidated financial statements.
(signed) KPMG LLP
Harrisburg, PA
March 16, 2011
119
Table of Contents
| Item 9. | Changes in and Disagreements with Accountants on Accounting and Financial Disclosure |
None.
| Item 9A. | Controls and Procedures |
Disclosure Controls and Procedures
The Company carried out an evaluation, under the supervision and with the participation of the Company’s management, including the Company’s Chief Executive Officer and Acting Chief Financial Officer, of the effectiveness of its disclosure controls and procedures, as defined in Exchange Act Rules 13a-15(e) and 15d-15(e). Based upon the evaluation, the Company’s Chief Executive Officer and Acting Chief Financial Officer concluded that as of December 31, 2010, the Company’s disclosure controls and procedures are effective. Disclosure controls and procedures are controls and procedures that are designed to ensure that information required to be disclosed in the Company’s reports filed or submitted under the Exchange Act is recorded, processed, summarized and reported within the time periods specified in the Securities and Exchange Commission’s rules and forms.
Internal Controls Over Financial Reporting
Management’s report on internal control over financial reporting is included in Item 8 of this Report on Form 10-K and incorporated herein by reference.
Changes in Internal Controls
There were no significant changes to the Company’s “internal controls over financial reporting” (as defined in Rule 13a-15(f) under the Exchange Act) during the last fiscal year that has materially affected or is reasonably likely to materially affect, the Company’s internal control over financial reporting.
| Item 9B. | Other Information |
The Company had no other events that should have been disclosed on Form 8-K that were not already disclosed on such form.
120
Table of Contents
PART III
| Item 10. | Directors, Executive Officers and Corporate Governance |
We have adopted a Code of Ethics Policy that applies to all directors and senior managers (including its Chief Executive Officer and Chief Financial Officer). The Company’s Code of Ethics Policy is available on our website at http://www.towerbancorp.com under the “Governance Documents” tab.
All other information required by Item 10 is incorporated by reference to the sections captioned “Election of Directors,” “Executive Officers,” “Section 16(a) Beneficial Ownership Reporting Compliance,” “Code of Ethics Policy,” “Consideration of Director Nominees,” and ”Meetings and Committees of the Board of Directors” of Tower’s definitive proxy statement for the 2011 Annual Meeting of Shareholders to be filed pursuant to Regulation 14A.
| Item 11. | Executive Compensation |
The information required by Item 11 is incorporated by reference to the sections captioned “Executive Compensation,” “Compensation of Directors,” and “Compensation Committee Interlocks and Insider Participation” of Tower’s definitive proxy statement for the 2011 Annual Meeting of Shareholders to be filed pursuant to Regulation 14A.
| Item 12. | Security Ownership of Certain Beneficial Owners and Management and Related Stockholder Matters |
Information required by Item 12 is incorporated by reference to the section captioned “Information Concerning Security Ownership” of Tower’s definitive proxy statement for the 2011 Annual Meeting of Shareholders to be filed pursuant to Regulation 14A and the information appearing under the heading “Securities Authorized for Issuance under Equity Compensation Plans” within Item 5 of this Report.
| Item 13. | Certain Relationships and Related Transactions, and Director Independence |
The information required by Item 13 is incorporated by reference to the sections captioned “Related Person Transactions and Policies” and “Director Independence” of Tower’s definitive proxy statement for the 2011 Annual Meeting of Shareholders to be filed pursuant to Regulation 14A.
| Item 14. | Principal Accounting Fees and Services |
The information required by Item 14 is incorporated by reference to the sections captioned “Fees of Independent Public Accountants” and “Audit Committee Report” of our definitive proxy statement for the 2011 Annual Meeting of Shareholders filed pursuant to Regulation 14A.
121
Table of Contents
PART IV
| Item 15. | Exhibits and Financial Statement Schedules |
| (a) | The following documents are filed as part of this report: |
| 1. | Financial Statements—The following consolidated financial statements of Tower Bancorp, Inc. and subsidiaries are incorporated herein by reference in response to Item 8 above: |
| (i) | Consolidated Balance Sheets—December 31, 2010 and 2009. |
| (ii) | Consolidated Statements of Operations—Years ended December 31, 2010, 2009 and 2008. |
| (iii) | Consolidated Statements of Equity and Comprehensive Income (Loss)—Years ended December 31, 2010, 2009 and 2008. |
| (iv) | Consolidated Statements of Cash Flows—Years ended December 31, 2010, 2009 and 2008. |
| (v) | Notes to Consolidated Financial Statements |
| (vi) | Report of Independent Registered Public Accounting Firm |
| 2. | Financial Statement Schedules—All financial statement schedules for which provision is made in the applicable accounting regulations of the Securities and Exchange Commission are not required under the related instructions or are inapplicable and have therefore been omitted. |
| 3. | Exhibits—A list of the Exhibits required by Item 601 of Regulation S-K and filed as part of this report is provided in subsection (b) below: |
| (b) |
| Exhibit |
Description | |
| 3.1 | Amended and Restated Articles of Incorporation (Incorporated by reference to Exhibit 3.1 to Registrant’s Current Report on Form 8-K filed on September 24, 2009) | |
| 3.2 | Amended and Restated Bylaws of Tower Bancorp, Inc. (Incorporated by reference to Exhibit 3.1 to Registrant’s Current Report on Form 8-K filed on July 28, 2010) | |
| 4.1 | Form of Subordinated Note due July 1, 2014 (Incorporated by reference to Exhibit 4.1 to Registrant’s Current Report on Form 8-K filed on June 12, 2009) | |
| 4.2 | Form of Form of Subordinated Note Due July 1, 2015 (Incorporated by reference to Exhibit 4.1 to Registrant’s Current Report on Form 8-K filed on February 8, 2010) | |
| 10.1 | Tower Bancorp, Inc. Non-Qualified Stock Option Plan (Incorporated by reference to Exhibit 99.1 to Registrant’s Registration Statement on Form S-8 (File No. 333-40661))* | |
| 10.2 | Tower Bancorp, Inc.’s Stock Option Plan for Outside Directors (Incorporated by reference to Exhibit 99.2 to Registrant’s Registration Statement on Form S-8 (File No. 333-40661))* | |
| 10.3 | Supplemental Executive Retirement Agreement of Jeffrey B. Shank dated as of September 25, 2002 (Incorporated by reference to Exhibit 99.3 of Registrant’s Form 10-Q for the quarter ended September 30, 2002)* | |
| 10.4 | Form of Amendment and Restatement of the First National Bank of Greencastle Group Term Replacement Plan A (Incorporated by reference to Exhibit 10.8 of Registrant’s Registration Statement on Form S-4 (File No. 333-130485))* | |
122
Table of Contents
| 10.5 | Form of Amendment and Restatement of the First National Bank of Greencastle Group Term Replacement Plan (Incorporated by reference to Exhibit 10.8 of Registrant’s Registration Statement on Form S-4 (File No. 333-130485))* | |
| 10.6 | Form of Amendment and Restatement of the First National Bank of Greencastle Executive Bonus Agreement (Incorporated by reference to Exhibit 10.8 of Registrant’s Registration Statement on Form S-4 (File No. 333-130485))* | |
| 10.7 | First National Bank of Greencastle Employees’ Stock Ownership Plan (Incorporated by reference to Exhibit 99.3 to Registrant’s Registration Statement on Form S-8 (File No. 333-40661))* | |
| 10.8 | Amendment Number Seven to First National Bank of Greencastle Employees Stock Ownership Plan and Trust, effective August 1, 2009 (Incorporated by reference to Exhibit 10.5 to Registrant’s Quarterly Report on Form 10-Q for the quarter ended September 30, 2009)* | |
| 10.9 | Graystone Financial Corp. 401(k)/Employee Stock Ownership Plan (Incorporated by reference to Exhibit 10.9 to Registrant’s Quarterly Report on Form 10-Q for the quarter ended March 31, 2009)* | |
| 10.10 | Employment Agreement and amendment with Andrew Samuel (Incorporated by reference to Exhibit 3.1 to Registrant’s Current Report on Form 8-K filed on March 31, 2009)* | |
| 10.11 | Employment Agreement and amendment with Jeffrey Renninger (Incorporated by reference to Exhibit 3.1 to Registrant’s Current Report on Form 8-K filed on March 31, 2009)* | |
| 10.12 | Employment Agreement with Jeffrey B. Shank (Incorporated by reference to Exhibit 3 to Annex A of Registrant’s Registration Statement on Form S-4 (No. 333-156535))).* | |
| 10.13 | Employment Agreement and amendment with Janak Amin (Incorporated by reference to Exhibit 10.4 of Registrant’s Quarterly Report on Form 10-Q for the quarter ended March 31, 2009)* | |
| 10.14 | Employment Agreement with Mark Merrill (Incorporated by reference to Exhibit 4 to Annex A of Registrant’s Registration Statement on Form S-4 (File No. 333-156535))* | |
| 10.15 | Employment Agreement with Carl Lundblad (Incorporated by reference to Exhibit 6 to Annex A of Registrant’s Registration Statement on Form S-4 (File No. 333-156535))* | |
| 10.16 | Employment Agreement with Jane Tompkins (Incorporated by reference to Exhibit 5 to Annex A of Registrant’s Registration Statement on Form S-4 (File No. 333-156535))* | |
| 10.17 | Employment Agreement by and among John A. Featherman, III, First National Bank of Chester County, Tower Bancorp, Inc. and First Chester County Corporation dated December 27, 2009 and effective December 10, 2010, as amended by an Amendment of Employment Agreement by and among John A Featherman, III, First National Bank of Chester County, Tower Bancorp, Inc. and First Chester County Corporation dated as of September 1, 2010 (Incorporated by reference to Exhibit 10.1 to Registrant’s Current Report on Form 8-K filed December 13, 2010)* | |
| 10.18 | Separation Benefits Agreement by and between First National Bank of Chester County and Clay T. Henry dated as of October 2, 2006, as amended by an Amendment to Executive Agreement by and between First National Bank of Chester County and Clay T. Henry dated as of December 24, 2008 (Incorporated by reference to Exhibit 10.2 to Registrant’s Current Report on Form 8-K filed December 13, 2010)* | |
| 10.19 | Graystone Financial Corp. 2007 Stock Incentive Plan (Incorporated by reference to Exhibit 10.3 to Registrant’s Current Report on Form 8-K filed on March 31, 2009)* | |
| 10.20 | Form of Non-Qualified Stock Option Agreement under the 1995 Non-Qualified Stock Option Plan (Incorporated by reference to Exhibit 10.1 to Registrant’s Current Report on Form 8-K filed on September 24, 2009)* | |
123
Table of Contents
| 10.21 | Form of Nonqualified Stock Option Agreement under the 2007 Stock Incentive Plan (Incorporated by reference to Exhibit 10.2 to Registrant’s Current Report on Form 8-K filed on September 24, 2009)* | |
| 10.22 | Form of Restricted Stock Agreement under the 2007 Stock Incentive Plan (Incorporated by reference to Exhibit 10.2 to Registrant’s Quarterly Report on Form 10-Q for the quarter ended September 30, 2010)* | |
| 10.23 | Tower Bancorp, Inc. 2010 Stock Incentive Plan (Incorporated by reference to Exhibit 10.1 to Registrant’s Current Report on Form 8-K filed May 25, 2010)* | |
| 10.24 | Form of Restricted Stock Agreement under the Tower Bancorp, Inc. 2010 Stock Incentive Plan (Incorporated by reference to Exhibit 10.3 to Registrant’s Quarterly Report on Form 10-Q for the quarter ended September 30, 2010)* | |
| 10.25 | Tower Bancorp, Inc. Dividend Reinvestment and Stock Purchase Plan (Incorporated by reference to Exhibit 99.1 to Registrant’s Registration Statement on Form S-3 (File No. 333-159647))* | |
| 10.26 | Tower Bancorp, Inc. Employee Stock Purchase Plan (Incorporated by reference to Appendix A of Registrant’s definitive proxy statement filed on April 22, 2009)* | |
| 10.27 | Tower Bancorp, Inc. CEO Incentive Plan (Incorporated by reference to Exhibit 10.1 to Registrant’s Current Report on Form 8-K filed May 3, 2010)* | |
| 10.28 | Tower Bancorp, Inc. Executive Incentive Plan (Incorporated by reference to Exhibit 10.2 to Registrant’s Current Report on Form 8-K filed May 3, 2010)* | |
| 10.29 | Deferred Compensation Agreement between Graystone Tower Bank and Andrew Samuel, dated June 2, 2010 (Incorporated by reference to Exhibit 10.5 to Registrant’s Quarterly Report on Form 10-Q for the quarter ended June 30, 2010)* | |
| 10.30 | Deferred Compensation Agreement between Graystone Tower Bank and Jeffrey Renninger, dated June 2, 2010 (Incorporated by reference to Exhibit 10.6 to Registrant’s Quarterly Report on Form 10-Q for the quarter ended June 30, 2010)* | |
| 10.31 | Deferred Compensation Agreement between Graystone Tower Bank and Janak Amin, dated June 2, 2010 (Incorporated by reference to Exhibit 10.7 to Registrant’s Quarterly Report on Form 10-Q for the quarter ended June 30, 2010)* | |
| 10.32 | Deferred Compensation Agreement between Graystone Tower Bank and Mark Merrill, dated June 2, 2010 (Incorporated by reference to Exhibit 10.8 to Registrant’s Quarterly Report on Form 10-Q for the quarter ended June 30, 2010)* | |
| 10.33 | Deferred Compensation Agreement between Graystone Tower Bank and Jane Tompkins, dated June 2, 2010 (Incorporated by reference to Exhibit 10.9 to Registrant’s Quarterly Report on Form 10-Q for the quarter ended June 30, 2010)* | |
| 10.34 | Deferred Compensation Agreement between Graystone Tower Bank and Carl Lundblad, dated June 2, 2010 (Incorporated by reference to Exhibit 10.10 to Registrant’s Quarterly Report on Form 10-Q for the quarter ended June 30, 2010)* | |
| 10.35 | Summary Schedule of 2011 Outside Director Fees. (Incorporated by reference to Exhibit 10.1 to Registrant’s Current Report on Form 8-K filed on December 8, 2010)* | |
| 10.36 | First Chester County Corporation Amended and Restated 1995 Stock Option Plan.* | |
| 10.37 | First Chester County Corporation Form of Stock Option Agreement for Directors.* | |
| 10.38 | First Chester County Corporation Form of Stock Option Agreement for Executive Officers.* | |
| 21 | Subsidiaries of the Registrant | |
| 23.1 | Consent of KPMG LLP | |
| 23.2 | Consent of ParenteBeard, LLC | |
| 31.1 | Certification of Chief Executive Officer of Tower Bancorp, Inc. Pursuant to Securities and Exchange Commission Rule 13a-14(a) / 15d-14(a). | |
124
Table of Contents
| 31.2 | Certification of Chief Financial Officer of Tower Bancorp, Inc. Pursuant to Securities and Exchange Commission Rule 13a-14(a) / 15d-14(a) | |
| 32.1 | Certification of Chief Executive Officer of Tower Bancorp, Inc. Pursuant to Section 906 of the Sarbanes-Oxley Act of 2002 (Furnished, not filed) | |
| 32.2 | Certification of Chief Financial Officer of Tower Bancorp, Inc. Pursuant to Section 906 of the Sarbanes-Oxley Act of 2002 (Furnished, not filed) | |
* Denotes compensatory plan or arrangement.
125
Table of Contents
Pursuant to the requirements of Section 13 or 15(d) of the Securities Exchange Act of 1934, the Registrant has duly caused this Report to be signed on its behalf by the undersigned, thereunto duly authorized.
| TOWER BANCORP, INC. | ||||||
| (Registrant) | ||||||
| Date: | March 16, 2011 |
/S/ ANDREW S. SAMUEL | ||||
| Andrew S. Samuel | ||||||
| Chief Executive Officer | ||||||
| (Principal Executive Officer) | ||||||
| Date: | March 16, 2011 |
/S/ JOHN D. FINLEY | ||||
| John D. Finley | ||||||
| Acting Chief Financial Officer | ||||||
| (Principal Financial Officer) | ||||||
| Date: | March 16, 2011 |
/S/ KRISTOFER A. PAUL | ||||
| Kristofer A. Paul | ||||||
| Chief Accounting Officer | ||||||
| (Principal Accounting Officer) | ||||||
Pursuant to the requirements of the Securities Exchange Act of 1934, this Report has been executed below by the following persons on behalf of the Registrant and in the capacities and on the dates indicated.
| Signature |
Title |
Date | ||
| /S/ ANDREW S. SAMUEL |
Chief Executive Officer, and Chairman of the Board of Directors |
March 16, 2011 | ||
| Andrew S. Samuel | ||||
|
|
Director |
March 16, 2011 | ||
| Clifford E. DeBaptiste |
||||
|
|
Director |
March 16, 2011 | ||
| Jeffrey F. Lehman | ||||
| /S/ KENNETH R. LEHMAN |
Director |
March 16, 2011 | ||
| Kenneth R. Lehman | ||||
| /S/ EDWARD A. LEO |
Director |
March 16, 2011 | ||
| Edward A. Leo | ||||
| /S/ CHARLES C. PEARSON JR. |
Director |
March 16, 2011 | ||
| Charles C. Pearson Jr. | ||||
| /S/ MICHAEL A. PECK |
Director |
March 16, 2011 | ||
| Michael A. Peck | ||||
| /S/ ROBERT E. POOLE JR. |
Director |
March 16, 2011 | ||
| Robert E. Poole Jr. | ||||
126
Table of Contents
| /S/ WILLIAM E. POMMERENING |
Director |
March 16, 2011 | ||
| William E. Pommerening | ||||
| /S/ TERRY L. RANDALL |
Director |
March 16, 2011 | ||
| Terry L. Randall | ||||
|
|
Director |
March 16, 2011 | ||
| Hasu P. Shah | ||||
| /S/ KLARE S. SUNDERLAND |
Director |
March 16, 2011 | ||
| Klare S. Sunderland | ||||
127
Table of Contents
| Exhibits |
Exhibits Title | |
| 3.1 | Amended and Restated Articles of Incorporation (Incorporated by reference to Exhibit 3.1 to Registrant’s Current Report on Form 8-K filed on September 24, 2009) | |
| 3.2 | Amended and Restated Bylaws of Tower Bancorp, Inc. (Incorporated by reference to Exhibit 3.1 to Registrant’s Current Report on Form 8-K filed on July 28, 2010) | |
| 4.1 | Form of Subordinated Note due July 1, 2014 (Incorporated by reference to Exhibit 4.1 to Registrant’s Current Report on Form 8-K filed on June 12, 2009) | |
| 4.2 | Form of Form of Subordinated Note Due July 1, 2015 (Incorporated by reference to Exhibit 4.1 to Registrant’s Current Report on Form 8-K filed on February 8, 2010) | |
| 10.1 | Tower Bancorp, Inc. Non-Qualified Stock Option Plan (Incorporated by reference to Exhibit 99.1 to Registrant’s Registration Statement on Form S-8 (File No. 333-40661))* | |
| 10.2 | Tower Bancorp, Inc.’s Stock Option Plan for Outside Directors (Incorporated by reference to Exhibit 99.2 to Registrant’s Registration Statement on Form S-8 (File No. 333-40661))* | |
| 10.3 | Supplemental Executive Retirement Agreement of Jeffrey B. Shank dated as of September 25, 2002 (Incorporated by reference to Exhibit 99.3 of Registrant’s Form 10-Q for the quarter ended September 30, 2002)* | |
| 10.4 | Form of Amendment and Restatement of the First National Bank of Greencastle Group Term Replacement Plan A (Incorporated by reference to Exhibit 10.8 of Registrant’s Registration Statement on Form S-4 (File No. 333-130485))* | |
| 10.5 | Form of Amendment and Restatement of the First National Bank of Greencastle Group Term Replacement Plan (Incorporated by reference to Exhibit 10.8 of Registrant’s Registration Statement on Form S-4 (File No. 333-130485))* | |
| 10.6 | Form of Amendment and Restatement of the First National Bank of Greencastle Executive Bonus Agreement (Incorporated by reference to Exhibit 10.8 of Registrant’s Registration Statement on Form S-4 (File No. 333-130485))* | |
| 10.7 | First National Bank of Greencastle Employees’ Stock Ownership Plan (Incorporated by reference to Exhibit 99.3 to Registrant’s Registration Statement on Form S-8 (File No. 333-40661))* | |
| 10.8 | Amendment Number Seven to First National Bank of Greencastle Employees Stock Ownership Plan and Trust, effective August 1, 2009 (Incorporated by reference to Exhibit 10.5 to Registrant’s Quarterly Report on Form 10-Q for the quarter ended September 30, 2009)* | |
| 10.9 | Graystone Financial Corp. 401(k)/Employee Stock Ownership Plan (Incorporated by reference to Exhibit 10.9 to Registrant’s Quarterly Report on Form 10-Q for the quarter ended March 31, 2009)* | |
| 10.10 | Employment Agreement and amendment with Andrew Samuel (Incorporated by reference to Exhibit 3.1 to Registrant’s Current Report on Form 8-K filed on March 31, 2009)* | |
| 10.11 | Employment Agreement and amendment with Jeffrey Renninger (Incorporated by reference to Exhibit 3.1 to Registrant’s Current Report on Form 8-K filed on March 31, 2009)* | |
| 10.12 | Employment Agreement with Jeffrey B. Shank (Incorporated by reference to Exhibit 3 to Annex A of Registrant’s Registration Statement on Form S-4 (No. 333-156535))).* | |
128
Table of Contents
| 10.13 | Employment Agreement and amendment with Janak Amin (Incorporated by reference to Exhibit 10.4 of Registrant’s Quarterly Report on Form 10-Q for the quarter ended March 31, 2009)* | |
| 10.14 | Employment Agreement with Mark Merrill (Incorporated by reference to Exhibit 4 to Annex A of Registrant’s Registration Statement on Form S-4 (File No. 333-156535))* | |
| 10.15 | Employment Agreement with Carl Lundblad (Incorporated by reference to Exhibit 6 to Annex A of Registrant’s Registration Statement on Form S-4 (File No. 333-156535))* | |
| 10.16 | Employment Agreement with Jane Tompkins (Incorporated by reference to Exhibit 5 to Annex A of Registrant’s Registration Statement on Form S-4 (File No. 333-156535))* | |
| 10.17 | Employment Agreement by and among John A. Featherman, III, First National Bank of Chester County, Tower Bancorp, Inc. and First Chester County Corporation dated December 27, 2009 and effective December 10, 2010, as amended by an Amendment of Employment Agreement by and among John A Featherman, III, First National Bank of Chester County, Tower Bancorp, Inc. and First Chester County Corporation dated as of September 1, 2010 (Incorporated by reference to Exhibit 10.1 to Registrant’s Current Report on Form 8-K filed December 13, 2010)* | |
| 10.18 | Separation Benefits Agreement by and between First National Bank of Chester County and Clay T. Henry dated as of October 2, 2006, as amended by an Amendment to Executive Agreement by and between First National Bank of Chester County and Clay T. Henry dated as of December 24, 2008 (Incorporated by reference to Exhibit 10.2 to Registrant’s Current Report on Form 8-K filed December 13, 2010)* | |
| 10.19 | Graystone Financial Corp. 2007 Stock Incentive Plan (Incorporated by reference to Exhibit 10.3 to Registrant’s Current Report on Form 8-K filed on March 31, 2009)* | |
| 10.20 | Form of Non-Qualified Stock Option Agreement under the 1995 Non-Qualified Stock Option Plan (Incorporated by reference to Exhibit 10.1 to Registrant’s Current Report on Form 8-K filed on September 24, 2009)* | |
| 10.21 | Form of Nonqualified Stock Option Agreement under the 2007 Stock Incentive Plan (Incorporated by reference to Exhibit 10.2 to Registrant’s Current Report on Form 8-K filed on September 24, 2009)* | |
| 10.22 | Form of Restricted Stock Agreement under the 2007 Stock Incentive Plan (Incorporated by reference to Exhibit 10.2 to Registrant’s Quarterly Report on Form 10-Q for the quarter ended September 30, 2010)* | |
| 10.23 | Tower Bancorp, Inc. 2010 Stock Incentive Plan (Incorporated by reference to Exhibit 10.1 to Registrant’s Current Report on Form 8-K filed May 25, 2010)* | |
| 10.24 | Form of Restricted Stock Agreement under the Tower Bancorp, Inc. 2010 Stock Incentive Plan (Incorporated by reference to Exhibit 10.3 to Registrant’s Quarterly Report on Form 10-Q for the quarter ended September 30, 2010)* | |
| 10.25 | Tower Bancorp, Inc. Dividend Reinvestment and Stock Purchase Plan (Incorporated by reference to Exhibit 99.1 to Registrant’s Registration Statement on Form S-3 (File No. 333-159647))* | |
| 10.26 | Tower Bancorp, Inc. Employee Stock Purchase Plan (Incorporated by reference to Appendix A of Registrant’s definitive proxy statement filed on April 22, 2009)* | |
| 10.27 | Tower Bancorp, Inc. CEO Incentive Plan (Incorporated by reference to Exhibit 10.1 to Registrant’s Current Report on Form 8-K filed May 3, 2010)* | |
| 10.28 | Tower Bancorp, Inc. Executive Incentive Plan (Incorporated by reference to Exhibit 10.2 to Registrant’s Current Report on Form 8-K filed May 3, 2010)* | |
| 10.29 | Deferred Compensation Agreement between Graystone Tower Bank and Andrew Samuel, dated June 2, 2010 (Incorporated by reference to Exhibit 10.5 to Registrant’s Quarterly Report on Form 10-Q for the quarter ended June 30, 2010)* | |
129
Table of Contents
| 10.30 | Deferred Compensation Agreement between Graystone Tower Bank and Jeffrey Renninger, dated June 2, 2010 (Incorporated by reference to Exhibit 10.6 to Registrant’s Quarterly Report on Form 10-Q for the quarter ended June 30, 2010)* | |
| 10.31 | Deferred Compensation Agreement between Graystone Tower Bank and Janak Amin, dated June 2, 2010 (Incorporated by reference to Exhibit 10.7 to Registrant’s Quarterly Report on Form 10-Q for the quarter ended June 30, 2010)* | |
| 10.32 | Deferred Compensation Agreement between Graystone Tower Bank and Mark Merrill, dated June 2, 2010 (Incorporated by reference to Exhibit 10.8 to Registrant’s Quarterly Report on Form 10-Q for the quarter ended June 30, 2010)* | |
| 10.33 | Deferred Compensation Agreement between Graystone Tower Bank and Jane Tompkins, dated June 2, 2010 (Incorporated by reference to Exhibit 10.9 to Registrant’s Quarterly Report on Form 10-Q for the quarter ended June 30, 2010)* | |
| 10.34 | Deferred Compensation Agreement between Graystone Tower Bank and Carl Lundblad, dated June 2, 2010 (Incorporated by reference to Exhibit 10.10 to Registrant’s Quarterly Report on Form 10-Q for the quarter ended June 30, 2010)* | |
| 10.35 | Summary Schedule of 2011 Outside Director Fees. (Incorporated by reference to Exhibit 10.1 to Registrant’s Current Report on Form 8-K filed on December 8, 2010)* | |
| 10.36 | First Chester County Corporation Amended and Restated 1995 Stock Option Plan.* | |
| 10.37 | First Chester County Corporation Form of Stock Option Agreement for Directors.* | |
| 10.38 | First Chester County Corporation Form of Stock Option Agreement for Executive Officers.* | |
| 21 | Subsidiaries of the Registrant | |
| 23.1 | Consent of KPMG LLP | |
| 23.2 | Consent of ParenteBeard, LLC | |
| 31.1 | Certification of Chief Executive Officer of Tower Bancorp, Inc. Pursuant to Securities and Exchange Commission Rule 13a-14(a) / 15d-14(a). | |
| 31.2 | Certification of Chief Financial Officer of Tower Bancorp, Inc. Pursuant to Securities and Exchange Commission Rule 13a-14(a) / 15d-14(a) | |
| 32.1 | Certification of Chief Executive Officer of Tower Bancorp, Inc. Pursuant to Section 906 of the Sarbanes-Oxley Act of 2002 (Furnished, not filed) | |
| 32.2 | Certification of Chief Financial Officer of Tower Bancorp, Inc. Pursuant to Section 906 of the Sarbanes-Oxley Act of 2002 (Furnished, not filed) | |
* Denotes compensatory plan or arrangement.
130