Attached files
| file | filename |
|---|---|
| 8-K - U.S. CONCRETE, INC. 8-K - U.S. CONCRETE, INC. | usconcrete8k.htm |
Exhibit 99.1
Knight Investor Forum May 9, 2011
Forward-Looking Statement Certain statements provided in this presentation, including those that express a belief, expectation or intention and those that are not of historical fact, are “forward-looking statements” within the meaning of Section 27A of the Securities Act of 1933 and Section 21E of the Securities Exchange Act of 1934. These statements involve a number of risks and uncertainties and are intended to qualify for the safe harbors from liability established by the Private Securities Litigation Reform Act of 1995. These risks and uncertainties may cause actual results to differ materially from expected results and are described in detail in filings made by U.S. Concrete, Inc. (the “Company”) with the Securities and Exchange Commission, including the Company’s Annual Report on Form 10-K for the year ended December 31, 2010 and Form 10-Q for the period ended March 31, 2011. The forward-looking statements speak only as of the date of this presentation. Investors are cautioned not to rely unduly on them. Many of these forward-looking statements are based on expectations and assumptions about future events that may prove to be inaccurate. The Company’s management considers these expectations and assumptions to be reasonable, but they are inherently subject to significant business, economic, competitive, regulatory and other risks, contingencies and uncertainties, most of which are difficult to predict and many of which are beyond the Company’s control. The Company undertakes no obligation to update these statements unless required by applicable securities laws. Also, this presentation will contain various financial measures not in conformity with generally accepted accounting principles (“GAAP”). A reconciliation to the most comparable GAAP financial measure can be found at the end of this presentation.

Company Overview

Company Overview Top 10 Producer of Ready Mixed Concrete in the U.S. Ready mixed concrete 3.8 million cubic yards in 2010 102 fixed concrete and 11 portable plants Leading market position in 4 regions Precast products Seven production facilities Serving 3 states Aggregate business 11 owned and leased aggregate facilities 2 of 11 aggregate facilities leased to third parties
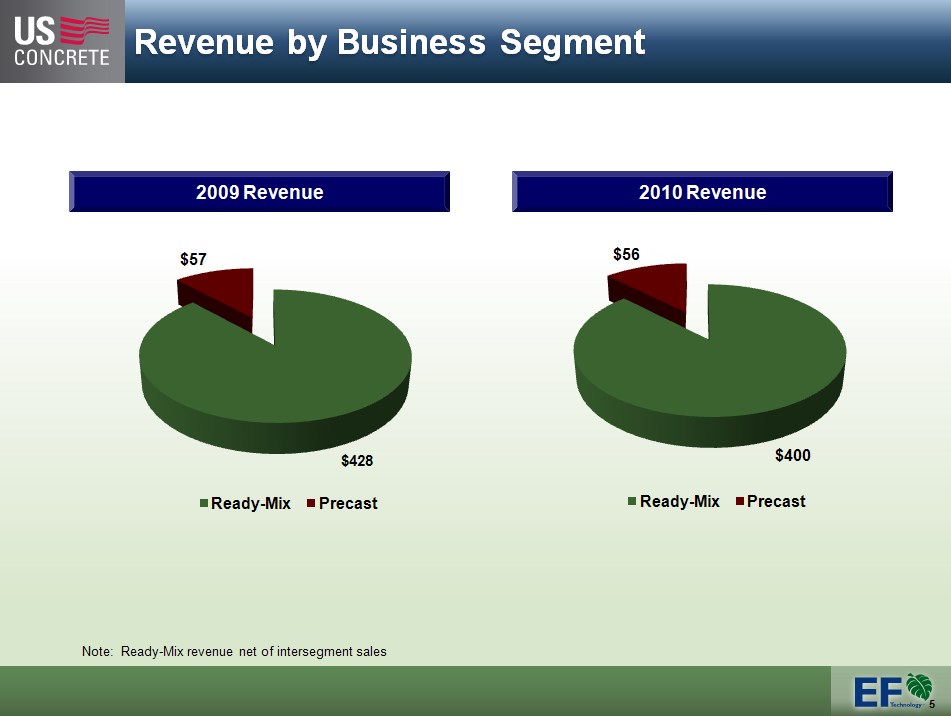
Revenue by Business Segment 2009 Revenue Ready-Mix $428 Precast $57 2010 Revenue Ready-Mix $400 Precast $56 Note: Ready-Mix revenue net of intersegment sales
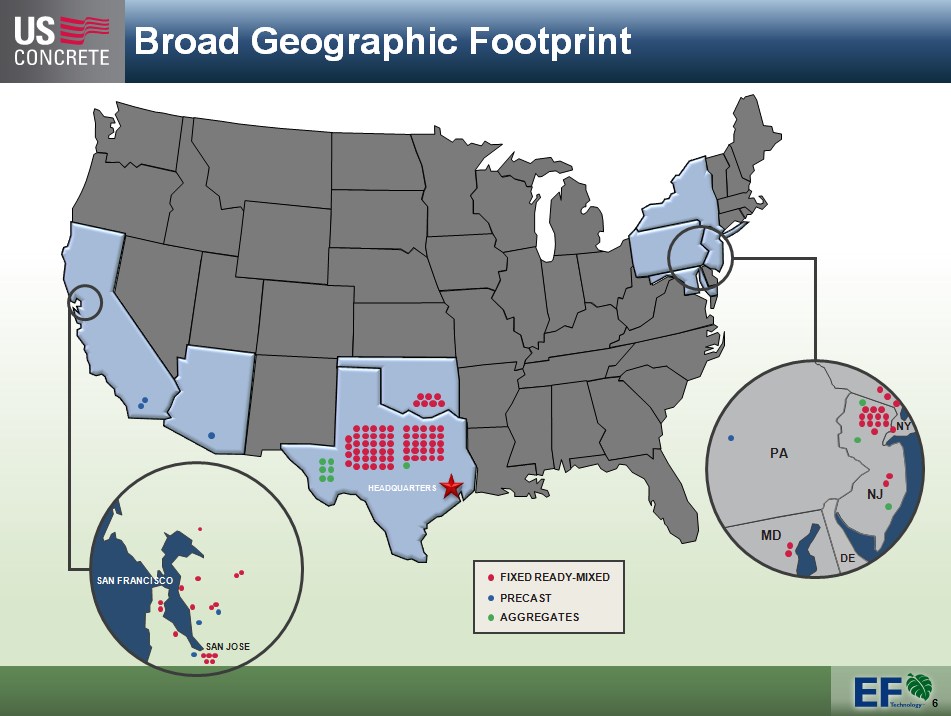
Broad Geographic Footprint San Francisco San Jose Headquarters PA NY NJ MD DE fixed ready-mixed precast aggregates

Quality Asset Base 113 ready mixed concrete plants producing 3.8 million cubic yards of concrete approximately 72 million tons of owned and leased reserves 7 pre-cast concrete plants generating $56 million in annual revenue 800+ ready-mixed concrete trucks 1,232 other vehicles $29 million book value of owned real estate Note: As of December 31, 2010.
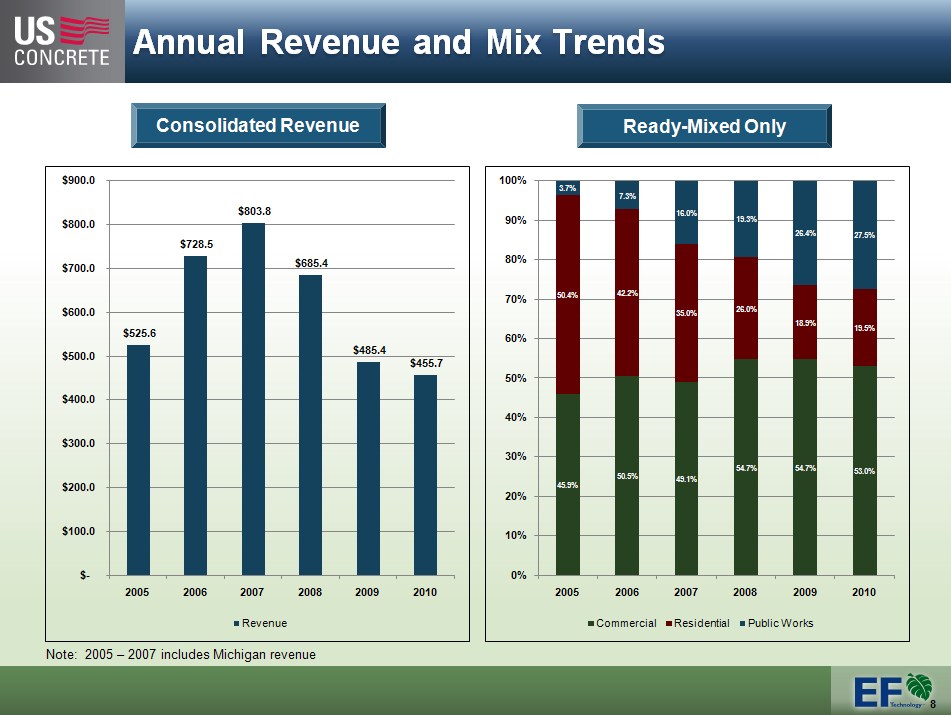
Annual Revenue and Mix Trends Consolidated Revenue $900.00 $800.00 $700.00 $600.00 $500.00 $400.00 $300.00 $200.00 $100.00 $- 2005 2006 2007 2008 2009 2010 $525.6 $728.5 $803.8 $685.4 $485.4 $455.7 Revenue Note: 2005 – 2007 includes Michigan revenue Ready-Mixed Only 100% 90% 80% 70% 60% 50% 40% 30% 20% 10% 0% 3.7% 50.4% 45.9% 7.3% 42.2% 50.5% 16.0% 35.0% 49.1% 19.3% 26.0% 54.7% 26.4% 18.9% 54.7% 27.5% 19.5% 53.0% Commercial Residential Public Works

Industry Overview
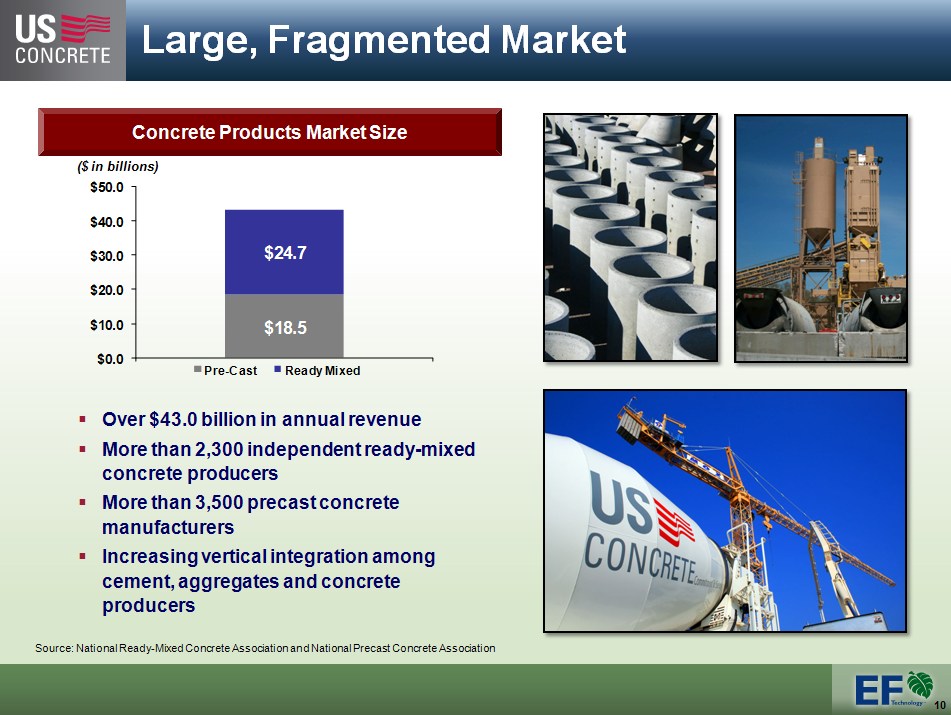
Large, Fragmented Market Concrete Products Market Size ($ in billions) $50.0 $40.0 $30.0 $20.0 $10.0 $0.0 $24.7 $18.5 Pre-Cast Ready Mixed Over $43.0 billion in annual revenue More than 2,300 independent ready-mixed concrete producers More than 3,500 precast concrete manufacturers Increasing vertical integration among cement, aggregates and concrete producers Source: National Ready-Mixed Concrete Association and National Precast Concrete Association
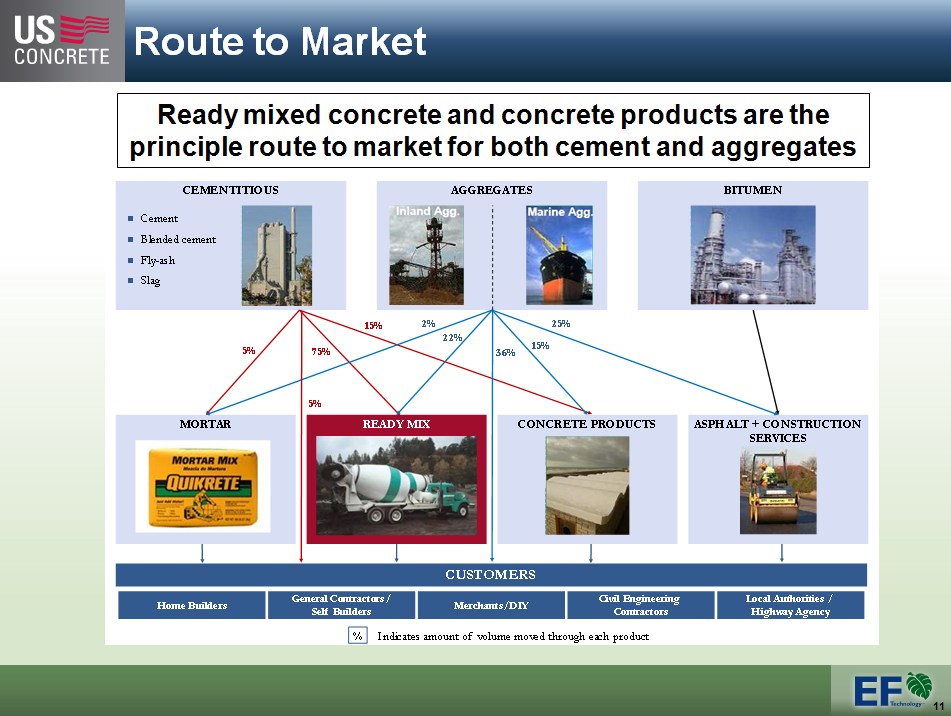
Route to Market Ready mixed concrete and concrete products are the principle route to market for both cement and aggregates Cementitious Cement Blended cement Fly-ash Slag Aggregates Inland Agg. Marine Agg. Bitumen 5% 75% 5% 15% 2% 22% 36% 15% 25% Mortar Ready Mix Concrete Products Asphalt + Construction Services Customers Home Builders General Contractors / Self Builders Merchanges/DIY Civil Engineering Contractors Local Authorities / Highway Agency % Indicates amount of volume moved through each product
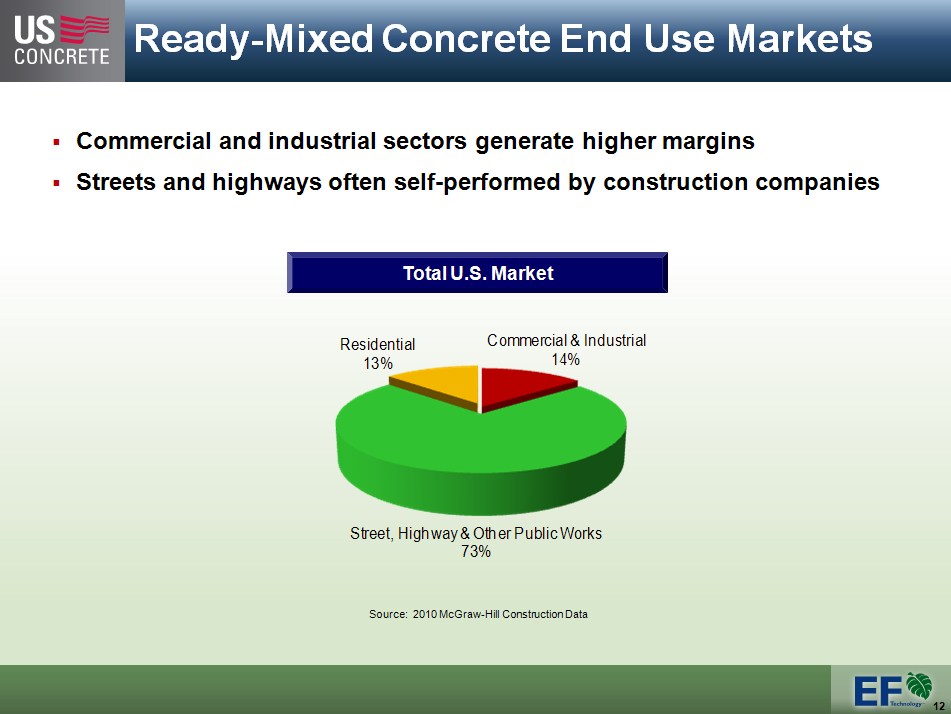
Ready-Mixed Concrete End Use Markets Commercial and industrial sectors generate higher margins Streets and highways often self-performed by construction companies Total U.S. Market Residential 13% Commercial & Industrial 14% Street, Highway & Other Public Works 73% Source: 2010 McGraw-Hill Construction Data

Economic Conditions and Forecast
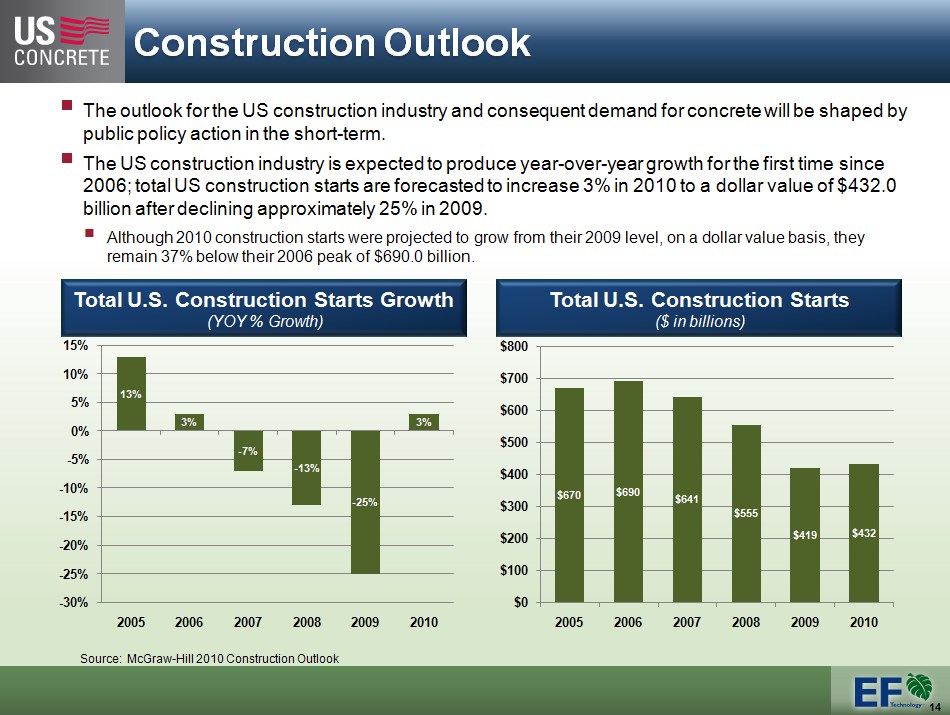
Construction Outlook construction industry and consequent demand for concrete will be shaped by public policy action in the short-term. The US construction industry is expected to produce year-over-year growth for the first time since 2006; total US construction starts are forecasted to increase 3% in 2010 to a dollar value of $432.0 billion after declining approximately 25% in 2009. Although 2010 construction starts were projected to grow from their 2009 level, on a dollar value basis, they remain 37% below their 2006 peak of $690.0 billion. Total U.S. Construction Starts Growth (YOY % Growth) 15% 10% 5% 0% -5% -10% -15% -20% -25% -30% 13% 3% -7% -13% -25% 3% 2005 2006 2007 2008 2009 2010 Total U.S. Construction Starts ($ in billions) $800 $700 $600 $500 $400 $300 $200 $100 $0 $670 $690 $641 $555 $419 $432 2005 2006 2007 2008 2009 2010 Source: McGraw-Hill 2010 Construction Outlook
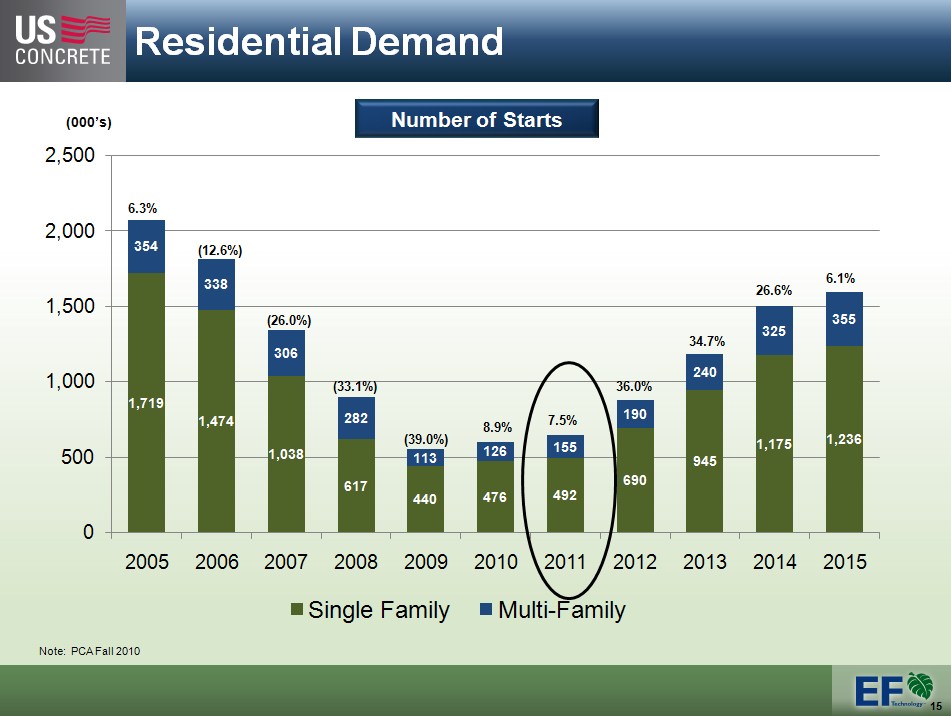
Residential Demand Number of Starts (000's) 2,500 2,000 1,500 1,000 500 0 6.3% 354 1,719 (12.6%) 338 1,474 (26.0%) 306 1,038 (33.1%) 282 617 (39.0%) 113 440 8.9% 126 476 7.5% 155 492 36.0% 190 690 34.7% 240 945 26.6% 325 1,175 6.1% 355 1,236 2005 2006 2007 2008 2009 2010 2011 2012 2013 2014 2015 Single Family Multi-Family Note: PCA Fall 2010
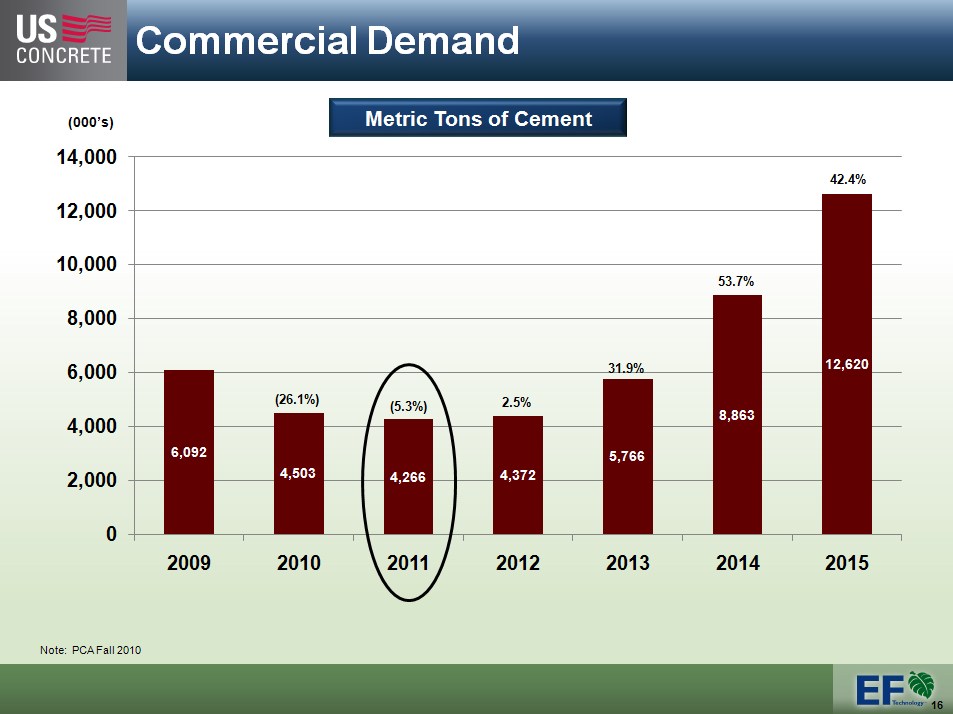
Commercial Demand Metric Tons of Cement (000's) 14,000 12,000 10,000 8,000 6,000 4,000 2,000 0 6,092 (26.1%) 4,503 (5.3%) 4,266 2.5% 4,372 31.9% 5,766 53.7% 8,863 42.4% 12,620 2009 2010 2011 2012 2013 2014 2015 Note: PCA Fall 2010

Public Construction Demand Metric Tons of Cement (000's) 60,000 50,000 40,000 30,000 20,000 10,000 0 35,770 2.0% 36,495 0.3% 36,590 (3.3%) 35,375 10.9% 39,230 15.5% 45,302 11.0% 50,277 2009 2010 2011 2012 2013 2014 2015

Company Strategy and Focus

Strategic Plan - Key Elements Market and Customer Segmentation Reposition existing customer and product mix Promote value-added products Change the "point-of-sale" Pursue sustainable construction market Maximize Operational Excellence Be a low cost operator Provide outstanding customer service Eliminate waste and inefficiencies Exploit systems and technology advantage Evaluate Assets, Business Units and Opportunities Long-term market demand conditions Customer mix versus market demand vertically integrated competition ROI and capital requirements
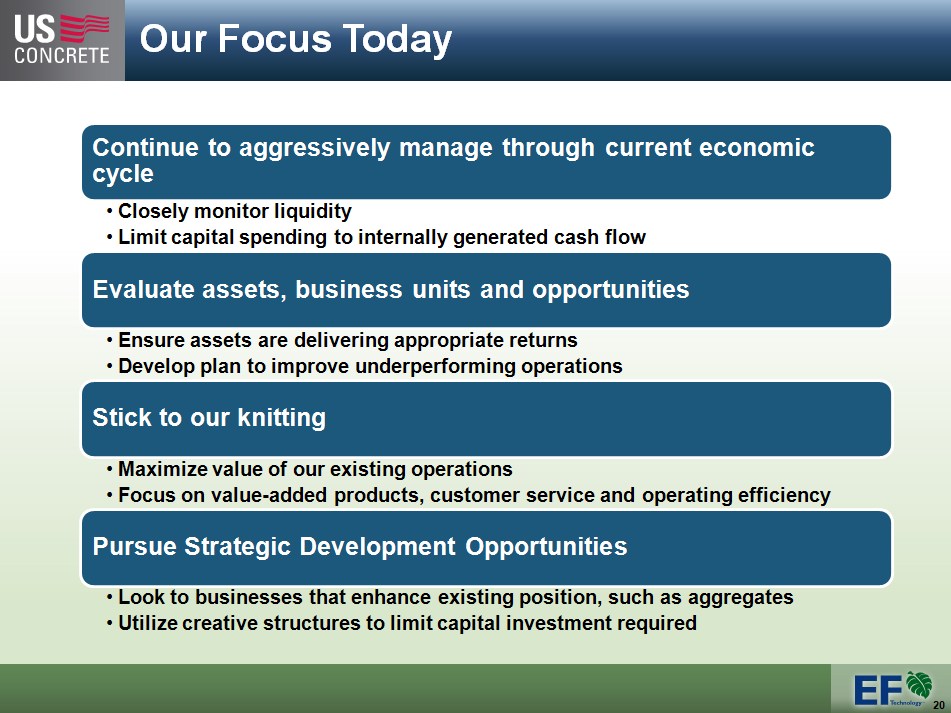
Our Focus Today Continue to aggressively manage through current economic cycle Closely monitor liquidity Limit capital spending to internally generated cash flow Evaluate assets, business units and opportunities Ensure assets are delivering appropriate returns Develop plan to improve underperforming operations Stick to our knitting Maximize value of our existing operations Focus on value-added products, customer service and operating efficiency Pursue Strategic Development Opportunities Look to businesses that enhance existing position, such as aggregates Utilize creative structures to limit capital investment required
Financial Summary
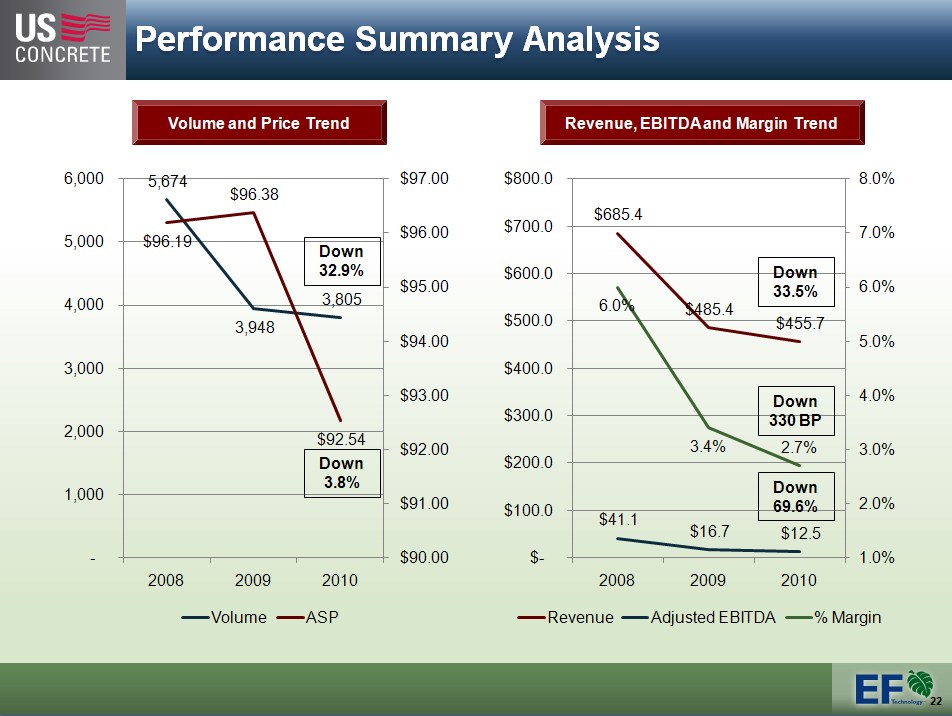
Performance Summary Analysis Volume and Price Trend Revenue, EBITDA and Margin Trend 6,000 5,000 4,000 3,000 2,000 1,000 - 5,674 $96.38 $96.19 Down 32.9% 3,805 3,948 $92.54 Down 3.8% $97.00 $96.00 $95.00 $94.00 $93.00 $92.00 $91.00 $90.00 2008 2009 2010 Volume ASP Revenue, EBITDA and Margin Trend $800.00 $700.00 $600.00 $500.00 $400.00 $300.00 $200.00 $100.00 $- $685.4 Down 33.5% 6.0% $485.4 $455.7 Down 330 BP 3.4% 2.7% Down 69.6% $41.1 $16.7 $12.5 8.0% 7.0% 6.0% 5.0% 4.0% 3.0% 2.0% 1.0% 2008 2009 2010 Revenue Adjusted EBITDA % Margin
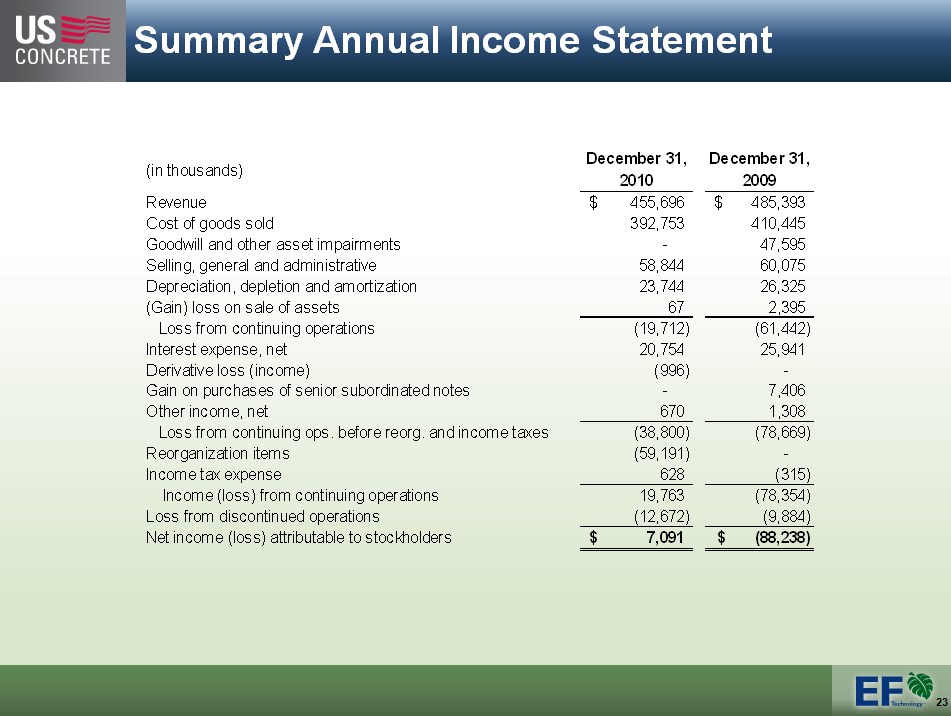
Summary Annual Income Statement (in thousands) December 31, 2010 December 31, 2009 Revenue $ 455,696 $ 485,393 Cost of goods sold 392,753 410,445 Goodwill and other asset impairments - 47,595 Selling, general and administrative 58,844 60,075 Depreciation, depletion and amortization 23,744 26,325 (Gain) loss on sale of assets 67 2,395 Loss from continuing operations (19,712) (61,442) Interest expense, net 20,754 25,941 Derivative loss (income) (996) - Gain on purchases of senior subordinated notes - 7,406 Other income, net 670 1,308 Loss from continuing ops. before reorg. and income taxes (38,800) (78,669) Reorganization items (59,191) - Income tax expense 628 (315) Income (loss) from continuing operations 19,763 (78,354) Loss from discontinued operations (12,672) (9,884) Net income (loss) attributable to stockholders $ 7,091 $ (88,238)

Summary Quarterly Income Statement (in thousands) March 31, 2011 March 31, 2010 (Unaudited) Revenue $ 87,049 $ 86,128 Cost of goods sold 82,809 80,772 Selling, general and administrative 14,964 15,384 Depreciation, depletion and amortization 5,093 6,155 (Gain) loss on sale of assets (72) 51 Loss from continuing operations (15,745) (16,234) Interest expense, net 2,628 6,685 Derivative loss (income) 6,247 - Other income, net 257 285 Loss from continuing ops. before reorg. and income taxes (24,363) (22,634) Income tax expense 351 324 Income (loss) from continuing operations (24,714) (22,958) Loss from discontinued operations - (2,289) Net income (loss) attributable to stockholders $ (24,714) $ (25,247) Revenue up 1.1% over Q1 2010 ASP down 1.8% over Q1 2010 Volume up 4.2% over Q1 2010

Condensed Consolidated Balance Sheet March 31, 2011 December 31, 2010 December 31, 2009 (in thousands) ASSETS Cash $ 3,198 $ 5,290 $ 4,229 Other current assets 107,650 118,141 124,360 Property, plant and equipment, net 136,999 140,274 239,917 Goodwill and other assets 10,605 11,823 20,654 Total assets $ 258,452 $ 275,528 $ 389,160 LIABILITY Current liabilities $ 84,963 $ 85,200 $ 94,108 Long-term debt, net of current maturities 59,321 52,017 288,669 Other long-term liabilities 12,350 12,178 16,574 Equity and noncontrolling interest 101,818 126,133 (10,191) Total liabilities and equity $ 258,452 $ 275,528 $ 389,160 Liquidity Summary March 31, 2011 December 31, 2010 December 31, 2009 Remaining Revolver Capacity $ 15.6 $ 30.6 $ 33.5 Cash 3.2 5.3 4.6
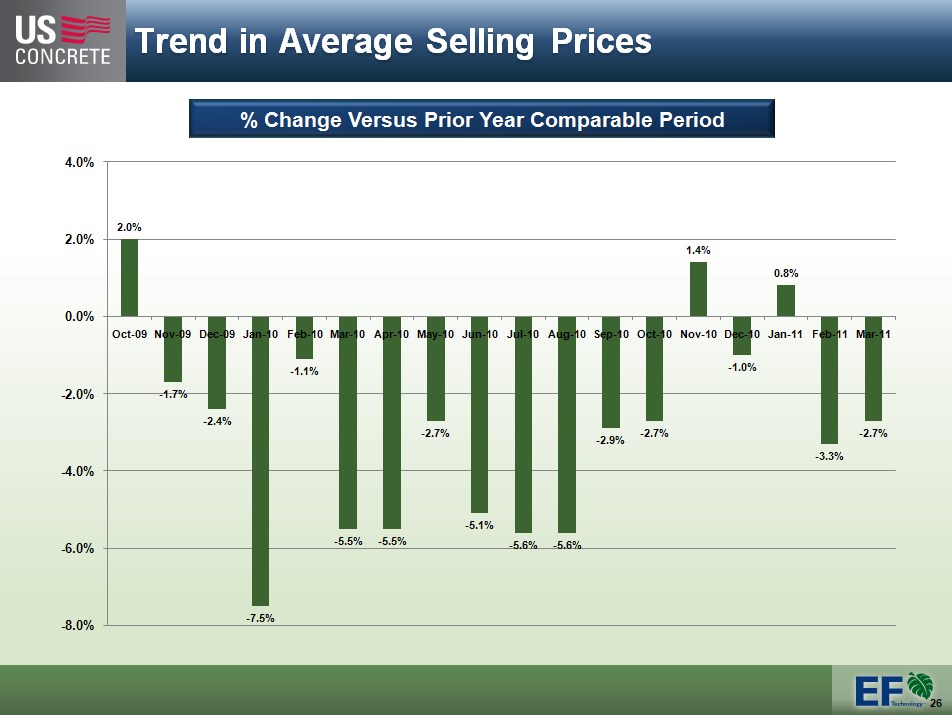
Trend in Average Selling Prices % Change Versus Prior Year Comparable Period 4.0% 2.0% 0.0% -2.0% -4.0% -6.0% -8.0% 2.0% -1.7% -2.4% -7.5% -1.1% -5.5% -5.5% -2.7% -5.1% -5.6% -5.6% -2.9% -2.7% 1.4% -1.0% 0.8% -3.3% -2.7 Oct-09 Nov-09 Dec-09 Jan-10 Feb-10 Mar-10 Apr-10 May-10 Jun-10 Jul-10 Aug-10 Sep-10 Oct-10 Nov-10 Dec-10 Jan-11 Feb-11 Mar-11

Percent Change in Backlog Versus Prior Year Period 40.0% 30.0% 20.0% 10.0% 0.0% -10.0% -20.0% -30.0% -40.0% -28.8% -23.7% -26.2% -30.0% -21.6% -15.5% -20.2% -20.6% -23.4% -23.5% -21.2% -14.9% -10.0% -3.9% 4.5% 28.8% 15.2% 10.3% 10.8% 9.7% 11.8% 15.3% 21.2% 27.6% 13.9% 4.8% 14.6% JAN FEB MAR APR MAY JUN JUL AUG SEP OCT NOV DEC JAN FEB MAR APR MAY JUN JUL AUG SEP OCT NOV DEC JAN FEB MAR

Key Investment Highlights Poised to benefit from rebound in construction activity Experienced management team lead by industry veterans throughout the organization Solid financial condition with recapitalized balance sheet High quality assets with significant market share located in attractive markets Strategic customer of vertically integrated cement producers due to volume

Disclosure of Non-GAAP Financial Measures U.S. CONCRETE, INC. ADDITIONAL STATISTICS (In thousands, unless otherwise noted; unaudited) We report our financial results in accordance with generally accepted accounting principles in the United States (“GAAP”). However, our management believes that certain non-GAAP performance measures and ratios, which our management uses in managing our business, may provide users of this financial information additional meaningful comparisons between current results and results in prior operating periods. See the table below for presentations of our adjusted EBITDA and adjusted EBITDA margin for the years 2008, 2009 and 2010. We define adjusted EBITDA as our net income (loss) from continuing operations plus the provision (benefit) for income taxes, net interest expense, reorganization costs, non-cash impairments, depreciation, depletion and amortization. We define adjusted EBITDA margin as the amount determined by dividing adjusted EBITDA by total revenue. We have included adjusted EBITDA and adjusted EBITDA margin in the accompanying tables because they are often used by investors for valuation and for comparing our financial performance with the performance of other building material companies. We also use adjusted EBITDA to monitor and compare the financial performance of our operations. Adjusted EBITDA does not give effect to the cash we must use to service our debt or pay our income taxes and thus does not reflect the funds actually available for capital expenditures. In addition, our presentation of adjusted EBITDA may not be comparable to similarly titled measures other companies report. Non-GAAP financial measures should be viewed in addition to, and not as an alternative for, our reported operating results or cash flow from operations or any other measure of performance prepared in accordance with GAAP.
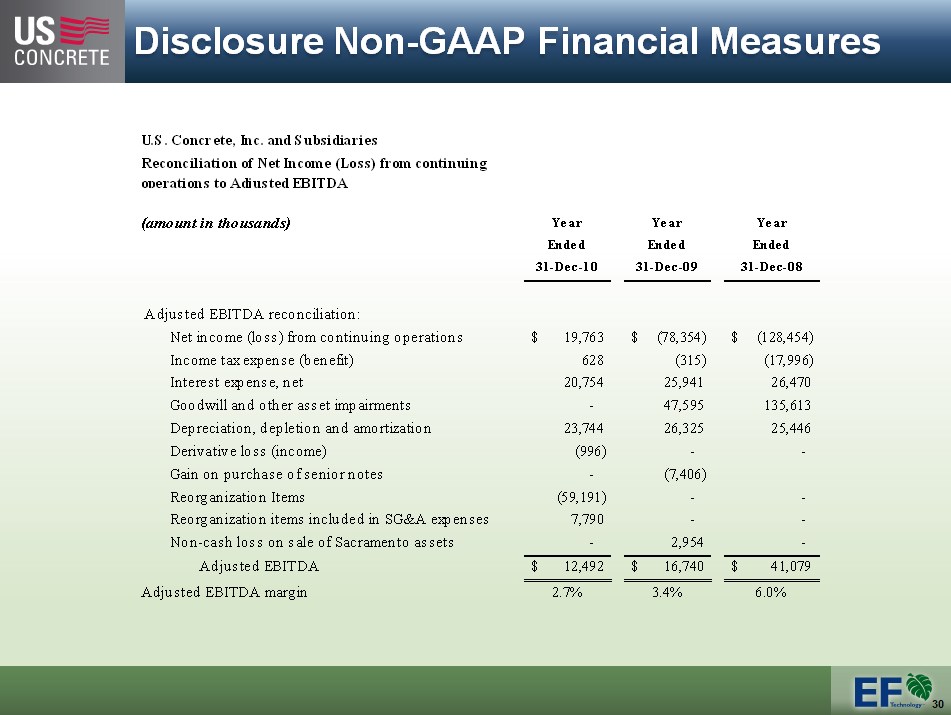
Disclosure of Non-GAAP Financial Measures U.S. Concrete, Inc. and Subsidiaries Reconciliation of Net Income (Loss) from continuing operations to Adjusted EBITDA (amount in thousands) Year Year Year Ended Ended Ended 31-Dec-10 31-Dec-09 31-Dec-08 Adjusted EBITDA reconciliation: Net income (loss) from continuing operations $ 19,763 $ (78,354) $ (128,454) Income tax expense (benefit) 628 (315) (17,996) Interest expense, net 20,754 25,941 26,470 Goodwill and other asset impairments - 47,595 135,613 Depreciation, depletion and amortization 23,744 26,325 25,446 Derivative loss (income) (996) - - Gain on purchase of senior notes - (7,406) Reorganization Items (59,191) - - Reorganization items included in SG&A expenses 7,790 - - Non-cash loss on sale of Sacramento assets - 2,954 - Adjusted EBITDA $ 12,492 $ 16,740 $ 41,079 Adjusted EBITDA margin 2.7% 3.4% 6.0%

Knight Investor Forum May 9, 2011