Attached files
| file | filename |
|---|---|
| 8-K - 8-K - KAPSTONE PAPER & PACKAGING CORP | a11-11073_18k.htm |
| EX-99.1 - EX-99.1 - KAPSTONE PAPER & PACKAGING CORP | a11-11073_1ex99d1.htm |
Exhibit 99.2
|
|
First Quarter 2011 Financial Highlights Roger Stone Chairman and Chief Executive Officer Andrea K. Tarbox Vice President and Chief Financial Officer May 2, 2011
|
|
|
2 Forward-Looking Statements The information in this presentation and statements made during this presentation may contain certain forward-looking statements within the meaning of federal securities laws. These statements reflect management’s expectations regarding future events and operating performance. Risk Factors These forward-looking statements involve a number of risks and uncertainties. A list of the factors that could cause actual results to differ materially from those expressed in, or underlying, any forward-looking statements can be found in the Company’s filings with the Securities and Exchange Commission, such as its annual and quarterly reports. The Company disclaims any obligation to revise or update such statements to reflect the occurrence of events after the date of this presentation. Non-GAAP Financial Measures This presentation refers to non-U.S. GAAP financial information. For a reconciliation to U.S. GAAP financial measures, please refer to the appendix. Forward Looking Statements |
|
|
3 Strong Sales, Earnings and Cash Generation Trailing 12 Month Revenue Growth – Up Over 21% in Past Year TTM Net Sales $813 $ in Millions $783 $748 $711 $668 1Q 10 2Q 10 3Q 10 4Q10 1Q 11 Avg. Revenue per Ton $614 $611 $618 $585 $535 1Q 10 2Q 10 3Q 10 4Q 10 1Q 11 Adjusted EBITDA and Margin Achieve New Highs TTM Adj. EBITDA $ in Millions $133 $95 $68 $37 $11 1Q 10 2Q 10 3Q 10 4Q10 1Q 11 $ in Millions 1Q 10 2Q 10 3Q 10 4Q10 1Q 11 Substantial Cash Generation TTM Adjusted Free Cash Flow $107* $66 $43 $15 $(27) 1Q 10 2Q 10 3Q 10 4Q 10 1Q 11 *Excludes AFTC and $50 million earn-out payment to IP -----See appendix for reconciliations----- Adj. EBITDA Margins 1Q 10 2Q 10 3Q 10 4Q 10 1Q 11 0.8% 12.4% 18.7% 15.0% 19.0% |
|
|
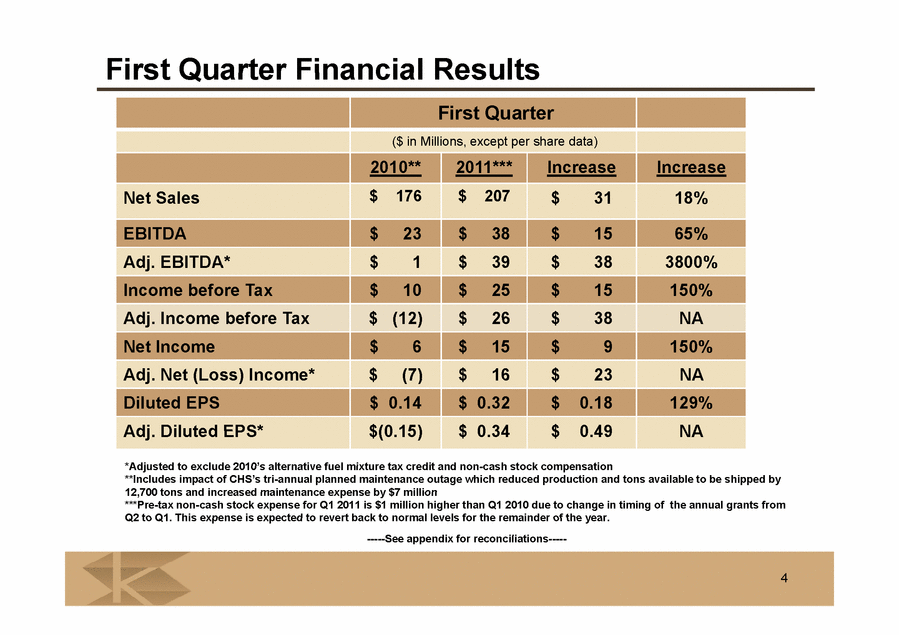
4 First Quarter Financial Results First Quarter ($ in Millions, except per share data) 2010** 2011*** Increase Increase Net Sales $176 $ 207 $ 31 18% EBITDA $ 23 $ 38 $ 15 65% Adj. EBITDA* $ 1 $ 39 $ 38 3800% Income before Tax $10 $ 25 $15 150% Adj. Income before Tax $ (12) $ 26 $ 38 NA Net Income $ 6 $15 $ 9 150% Adj. Net (Loss) Income* $ (7) $16 $ 23 NA Diluted EPS $0.14 $0.32 $0.18 129% Adj. Diluted EPS* $(0.15) $ 0.34 $ 0.49 NA *Adjusted to exclude 2010’s alternative fuel mixture tax credit and non-cash stock compensation **Includes impact of CHS’s tri-annual planned maintenance outage which reduced production and tons available to be shipped by 12,700 tons and increased maintenance expense by $7 million ***Pre-tax non-cash stock expense for Q1 2011 is $1 million higher than Q1 2010 due to change in timing of the annual grants from Q2 to Q1. This expense is expected to revert back to normal levels for the remainder of the year. -----See appendix for reconciliations----- |
|
|
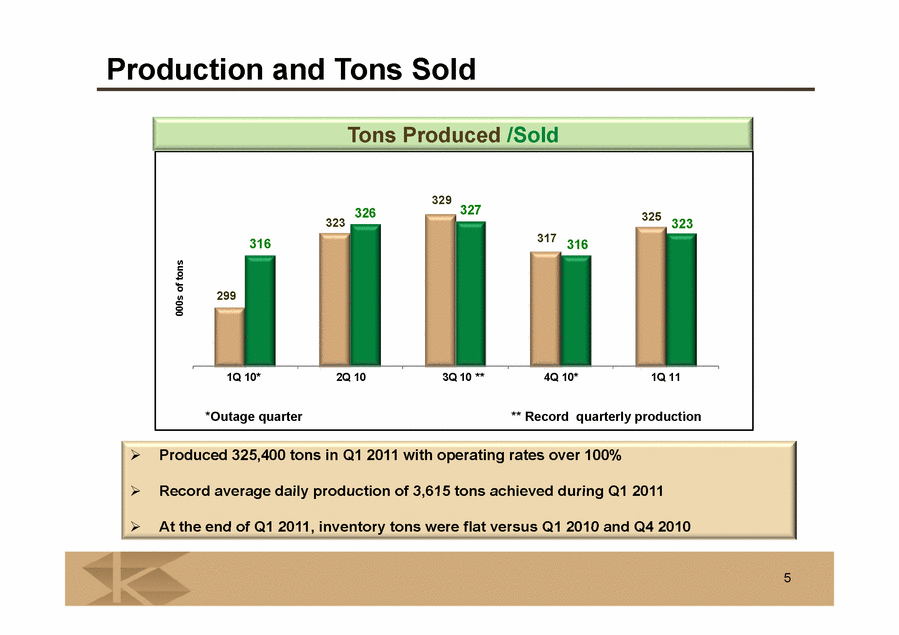
5 Production and Tons Sold Tons Produced/Sold 329 325 326 327 323 323 317 316 316 299 1Q 10* 2Q 10 3Q 10 ** 4Q 10* 1Q 11 *Outage quarter ** Record quarterly production Produced 325,400 tons in Q1 2011 with operating rates over 100% Record average daily production of 3,615 tons achieved during Q1 2011 At the end of Q1 2011, inventory tons were flat versus Q1 2010 and Q4 2010 000s of tons |
|
|
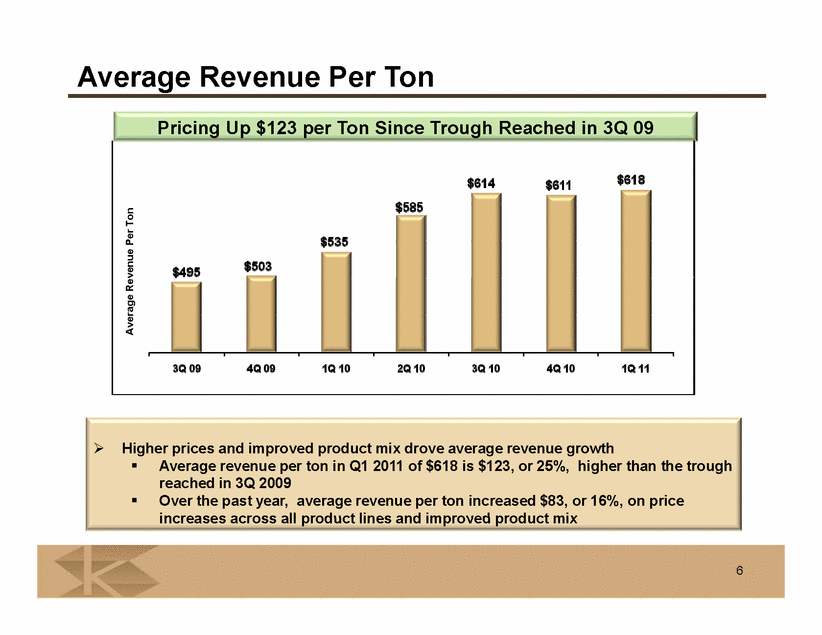
6 Average Revenue Per Ton Pricing Up $123 per Ton Since Trough Reached in 3Q 09 Average Revenue Per Ton $614 $611 $618 $585 $535 $503 $495 3Q 09 4Q 09 1Q 10 2Q 10 3Q 10 4Q 10 1Q 11 Higher prices and improved product mix drove average revenue growth Average revenue per ton in Q1 2011 of $618 is $123, or 25%, higher than the trough reached in 3Q 2009 Over the past year, average revenue per ton increased $83, or 16%, on price increases across all product lines and improved product mix |
|
|
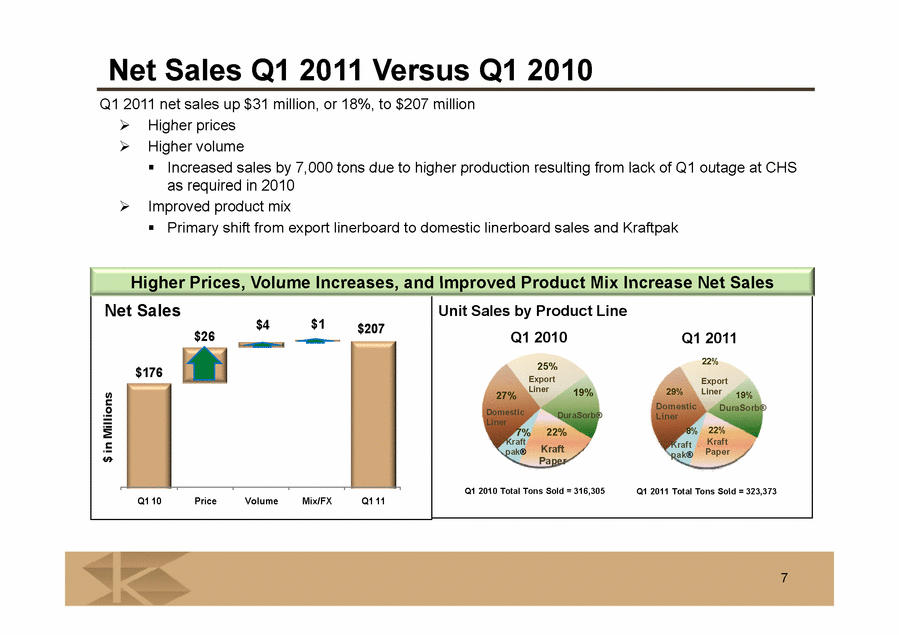
7 Net Sales Q1 2011 Versus Q1 2010 Q1 2011 net sales up $31 million, or 18%, to $207 million Higher prices Higher volume Increased sales by 7,000 tons due to higher production resulting from lack of Q1 outage at CHS as required in 2010 Improved product mix Primary shift from export linerboard to domestic linerboard sales and Kraftpak Higher Prices, Volume Increases, and Improved Product Mix Increase Net Sales Net Sales $207 $26 $176 Q1 10 Price Volume Mix/FX Q1 11 $ in Millions Unit Sales by Product Line Q1 2010 Q1 2011 Q1 2010 Total Tons Sold = 316,305 Q1 2011 Total Tons Sold = 323,373 Export Liner |
|
|
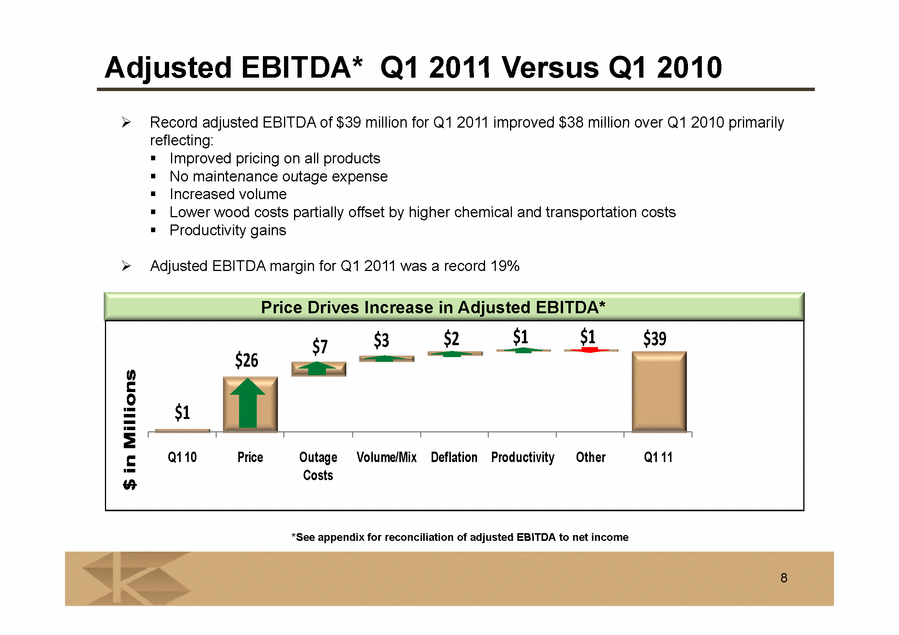
8 Adjusted EBITDA* Q1 2011 Versus Q1 2010 Record adjusted EBITDA of $39 million for Q1 2011 improved $38 million over Q1 2010 primarily reflecting: Improved pricing on all products No maintenance outage expense Increased volume Lower wood costs partially offset by higher chemical and transportation costs Productivity gains Adjusted EBITDA margin for Q1 2011 was a record 19% Price Drives Increase in Adjusted EBITDA* $ in Millions *See appendix for reconciliation of adjusted EBITDA to net income |
|
|
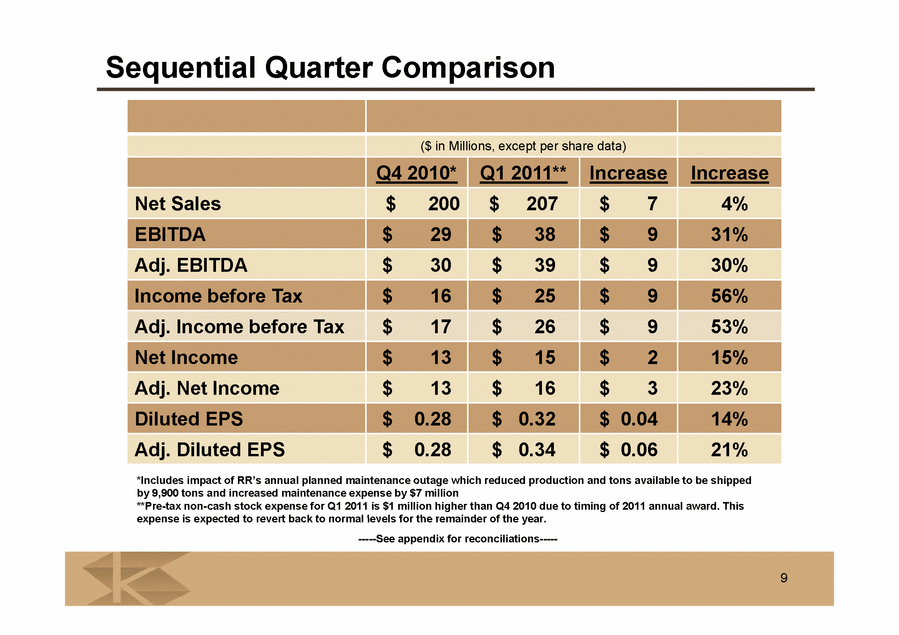
9 Sequential Quarter Comparison ($ in Millions, except per share data) Net Sales EBITDA Adj. EBITDA Income before Tax Adj. Income before Tax Net Income Adj. Net Income Diluted EPS Adj. Diluted EPS Q4 2010* $ 200 $ 29 $ 30 $ 16 $ 17 $ 13 $ 13 $ 0.28 $ 0.28 Q1 2011** $ 207 $ 38 $ 39 $ 25 $ 26 $ 15 $ 16 $ 0.32 $ 0.34 Increase $ 7 $ 9 $ 9 $ 9 $ 9 $ 2 $ 3 $ 0.04 $ 0.06 Increase 4% 31% 30% 56% 53% 15% 23% 14% 21% *Includes impact of RR’s annual planned maintenance outage which reduced production and tons available to be shipped by 9,900 tons and increased maintenance expense by $7 million **Pre-tax non-cash stock expense for Q1 2011 is $1 million higher than Q4 2010 due to timing of 2011 annual award. This expense is expected to revert back to normal levels for the remainder of the year. -----See appendix for reconciliations ----- |
|
|
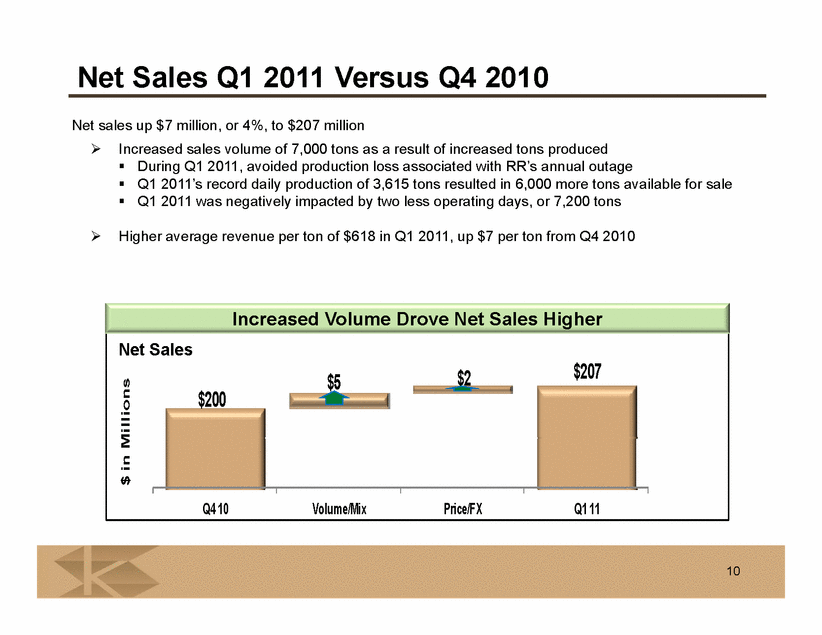
10 N t S l V 2010 Net Sales Q1 2011 Versus Q4 2010 Increased sales volume of 7,000 tons as a result of increased tons produced During Q1 2011, avoided production loss associated with RR’s annual outage Q1 2011’s record daily production of 3,615 tons resulted in 6,000 more tons available for sale Q1 2011 was negatively impacted by two less operating days, or 7,200 tons Higher average revenue per ton of $618 in Q1 2011, up $7 per ton from Q4 2010 Increased Volume Drove Net Sales Higher Net Sales $ in Millions Net sales up $7 million, or 4%, to $207 million |
|
|
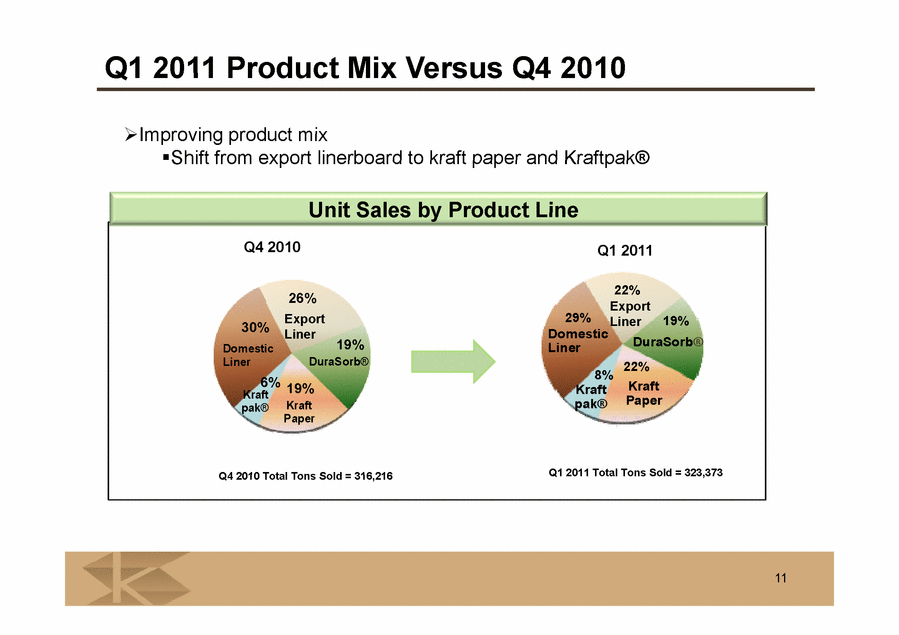
11 Q1 2011 Product Mix Versus Q4 2010 Improving product mix Shift from export linerboard to kraft paper and Kraftpak® Unit Sales by Product Line Q4 2010 Export Liner Q4 2010 Total Tons Sold = 316,216 Q1 2011 Export Liner Q1 2011 Total Tons Sold = 323,373 |
|
|
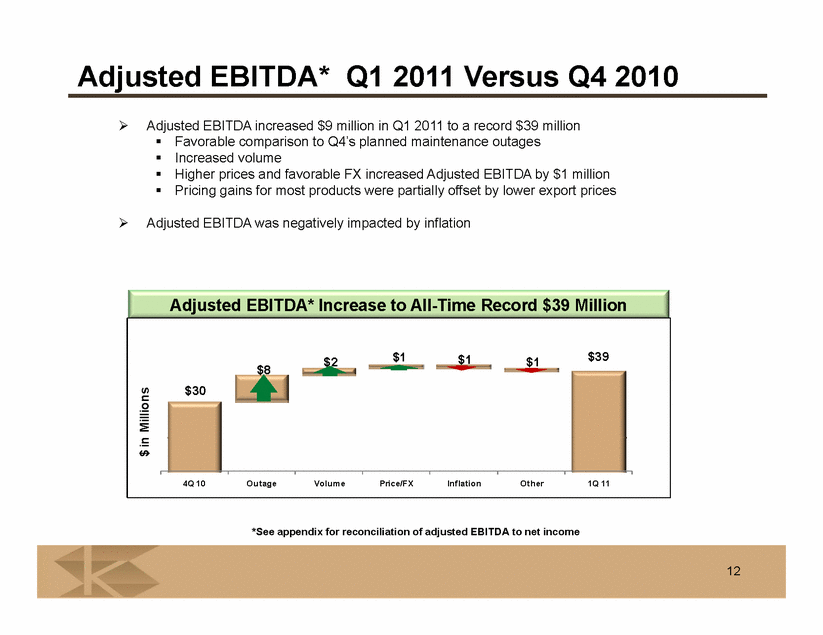
12 Adjusted EBITDA Q1 2011 Versus Q4 2010 Adjusted EBITDA increased $9 million in Q1 2011 to a recor $39 million Favorable comparison to Q4's planned maintenance outages Increased volume Higher prices and favorable FX increased Adjusted EBITDA by $1 million Pricing gains for most products were partially offset by lower export prices Adjusted EBITDA was negatively impacted by inflation Adjusted EBITDA* Increase to All-Time Record $39 Million *See appendix for reconciliation of adjusted EBITDA to net income |
|
|
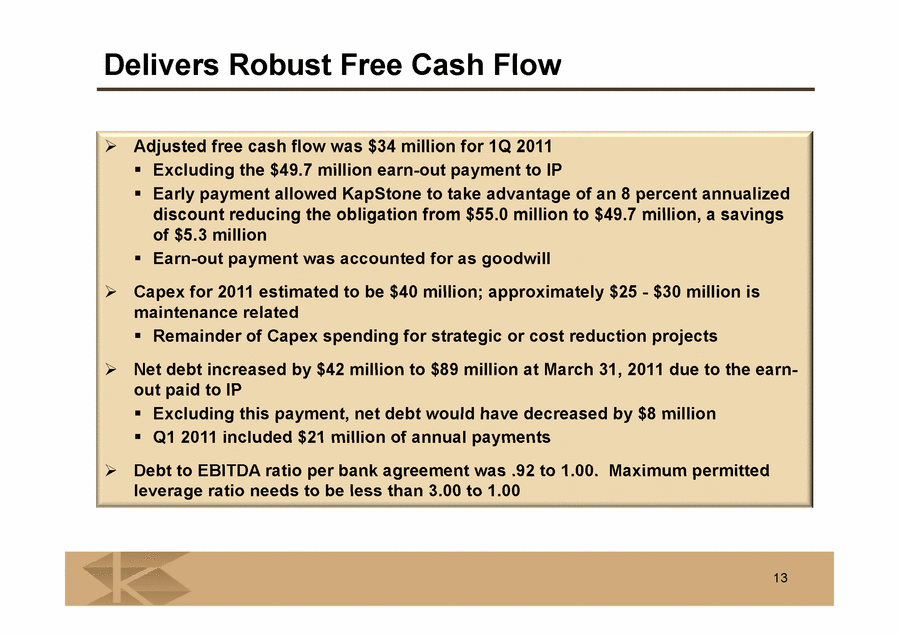
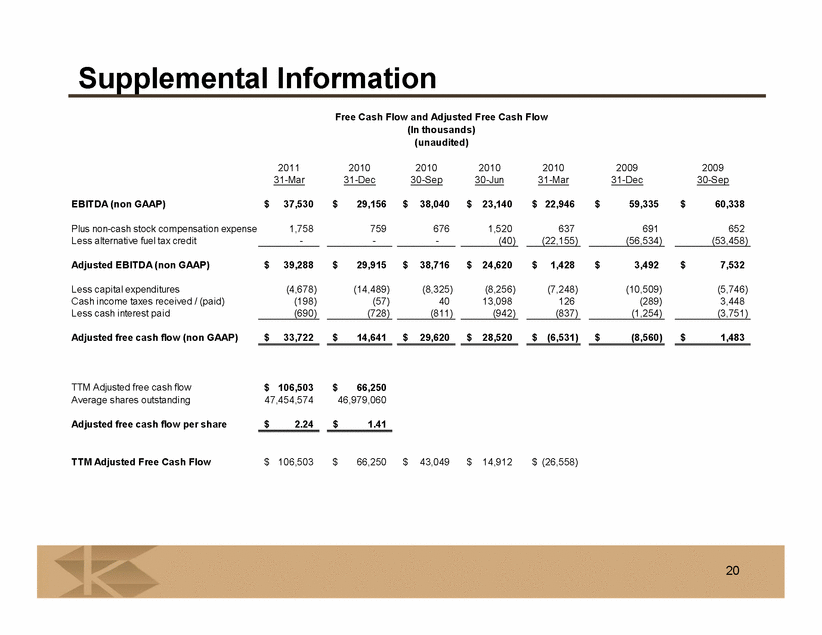
13 Delivers Robust Free Cash Flow Adjusted free cash flow was $34 million for 1Q 2011 Excluding the $49.7 million earn-out payment to IP Early payment allowed KapStone to take advantage of an 8 percent annualized discount reducing the obligation from $55.0 million to $49.7 million, a savings of $5.3 million Earn-out payment was accounted for as goodwill Capex for 2011 estimated to be $40 million; approximately $25 - $30 million is maintenance related Remainder of Capex spending for strategic or cost reduction projects Net debt increased by $42 million to $89 million at March 31, 2011 due to the earn-out paid to IP Excluding this payment, net debt would have decreased by $8 million Q1 2011 included $21 million of annual payments Debt to EBITDA ratio per bank agreement was .92 to 1.00. Maximum permitted leverage ratio needs to be less than 3.00 to 1.00 |
|
|
14 Tax Notes Income tax provision for Q1 2011 was $9 5 million based on a full year estimated rate of 38 6% versus 35 9% a year ago. Primarily reflects: A lower expected benefit from the domestic manufacturing deduction Cash tax rate expected to be less than 2% for 2011 March 31 2011 balance sheet includes $68 million accrued for taxes and interest on AFTC KS has been advised and doesn’t believe AFTC is taxable as it is similar to an excise tax refund No guidance received yet from IRS on the taxability of the AFTC 2009 tax year is currently under examination by the IRS |
|
|
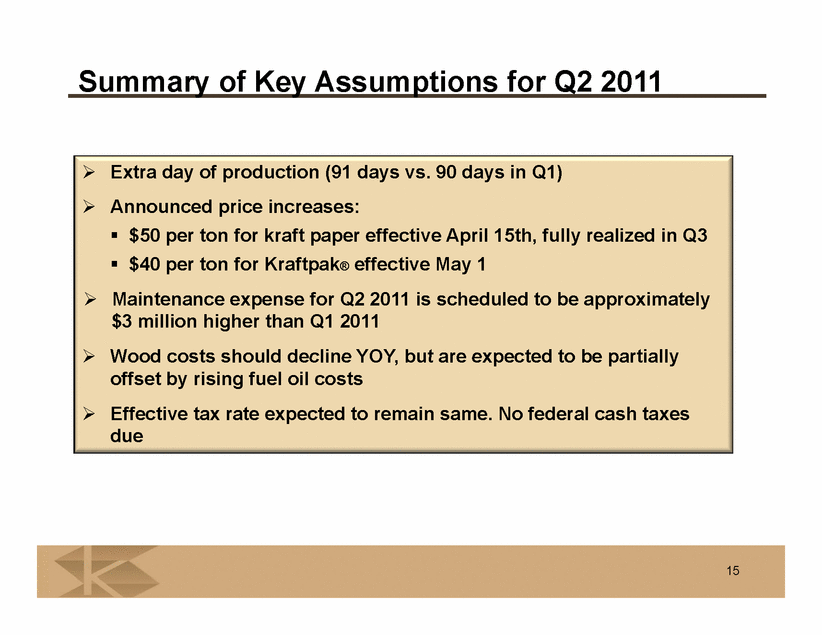
15 Summary of Key Assumptions for Q2 2011 Extra day of production (91 days vs. 90 days in Q1) Announced price increases: $50 per ton for kraft paper effective April 15th, fully realized in Q3 $40 per ton for Kraftpak® effective May 1 Maintenance expense for Q2 2011 is scheduled to be approximately $3 million higher than Q1 2011 Wood costs should decline YOY, but are expected to be partially offset by rising fuel oil costs Effective tax rate expected to remain same. No federal cash taxes due |
|
|
APPENDIX |
|
|
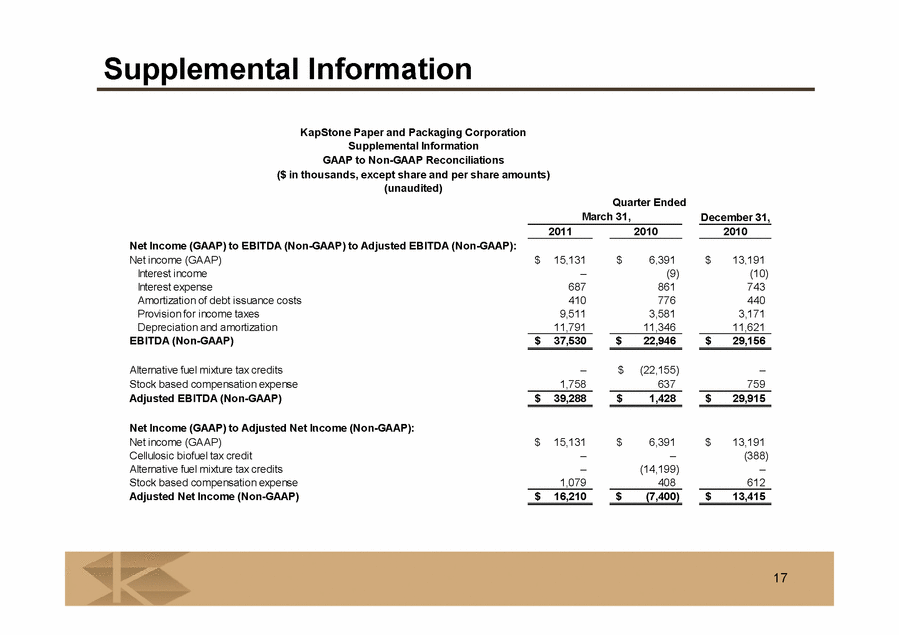
17 Supplemental Information KapStone Paper and Packaging Corporation Supplemental Information GAAP to Non-GAAP Reconciliations ($ in thousands, except share and per share amounts) (unaudited) Net Income (GAAP) to EBITDA (Non-GAAP) to Adjusted EBITDA (Non-GAAP): Net income (GAAP) Interest income Interest expense Amortization of debt issuance costs Provision for income taxes Depreciation and amortization EBITDA (Non-GAAP) Alternative fuel mixture tax credits Stock based compensation expense Adjusted EBITDA (Non-GAAP) Net Income (GAAP) to Adjusted Net Income (Non-GAAP): Net income (GAAP) Cellulosic biofuel tax credit Alternative fuel mixture tax credits Stock based compensation expense Adjusted Net Income (Non-GAAP) Quarter Ended March 31, December 31, 2010 2010 $ 15,131 – 687 410 9,511 11,791 $ 37,530 1,758 $ 39,288 $ 15,131 – – 1,079 $ 16,210 $ 6,391 (9) 861 776 3,581 11,346 $ 22,946 $ (22,155) 637 $ 1,428 $ 6,391 – (14,199) 408 $ (7,400) $ 13,191 (10) 743 440 3,171 11,621 $ 29,156 759 $ 29,915 $ 13,191 (388) – 612 $ 13,415 – – |
|
|
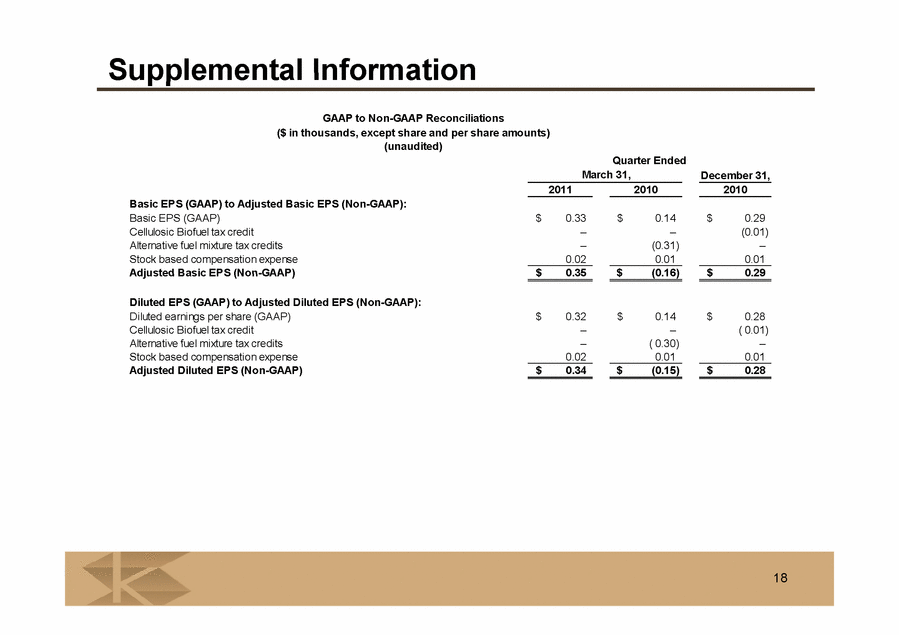
18 Supplemental Information GAAP to Non-GAAP Reconciliations ($ in thousands, except share and per share amounts) (unaudited) Basic EPS (GAAP) to Adjusted Basic EPS (Non-GAAP): Basic EPS (GAAP) Cellulosic Biofuel tax credit Alternative fuel mixture tax credits Stock based compensation expense Adjusted Basic EPS (Non-GAAP) Diluted EPS (GAAP) to Adjusted Diluted EPS (Non-GAAP): Diluted earnings per share (GAAP) Cellulosic Biofuel tax credit Alternative fuel mixture tax credits Stock based compensation expense Adjusted Diluted EPS (Non-GAAP) Quarter Ended March 31, December 31, 2011 $ 0.33 – – 0.02 $ 0.35 $ 0.32 – 0.02 $ 0.34 2010 $ 0.14 – (0.31) 0.01 $ (0.16) $ 0.14 – (0.30) 0.01 $ (0.15) 2010 $ 0.29 (0.01) – 0.01 $ 0.29 $ 0.28 ( 0.01) 0.01 $ 0.28 – – |
|
|
Supplemental Information Net Debt and Debt to Equity Ratio Calculation of Net Debt 3/31/2011 12/31/2010 9/30/2010 6/30/2010 3/31/2010 Quarter Ended (unaudited) (In thousands) Current portion of LT debt 18,835 $ 18,835 $ 18,835 $ 19,229 $ 18,267 $ Other borrowings 1,656 - 644 1,285 1,712 Borrowings on revolving line of credit - - - - 4,500 Long term debt, net 88,331 92,857 97,157 103,570 107,929 Unamortized debt issuance costs 3,020 3,203 3,612 4,112 4,560 111,842 114,895 120,248 128,196 136,968 Less cash and cash equivalents (22,478) (67,358) (41,617) (21,888) (3,851) Total Net Debt ( non GAAP) 89,364 $ 47,537 $ 78,631 $ 106,308 $ 133,117 $ Decrease (increase) during the quarter (41,827) $ 31,094 $ 27,677 $ 26,809 $ 16,740 $ Debt to Equity ratio calculation Net debt 89,364 $ 47,537 $ Equity 435,967 $ 418,634 $ Ratio 19 20.5% 11.4% |
|
|
20 Supplemental Information Free Cash Flow and Adjusted Free Cash Flow (In thousands) (unaudited) EBITDA (non GAAP) Plus non-cash stock compensation expense Less alternative fuel tax credit Adjusted EBITDA (non GAAP) Less capital expenditures Cash income taxes received / (paid) Less cash interest paid Adjusted free cash flow (non GAAP) TTM Adjusted free cash flow Average shares outstanding Adjusted free cash flow per share TTM Adjusted Free Cash Flow 2011 31-Mar $ 37,530 1,758 - $ 39,288 (4,678) (198) (690) $ 33,722 $ 106,503 47,454,574 $ 2.24 $ 106,503 2010 31-Dec $ 29,156 759 - $ 29,915 (14,489) (57) (728) $ 14,641 $ 66,250 46,979,060 $ 1,41 $ 66,250 2010 30-Sep $ 38,040 676 - $ 38,716 (8,325) 40 (811) $ 29,620 $ 43,049 2010 30-Jun $ 23,140 1,520 (40) $ 24,620 (8,256) 13,098 (942) $ 28,520 $ 14,912 2010 31-Mar $ 22,946 637 (22,155) $ 1,428 (7,248) 126 (837) $ (6,531) $ (26,558) 2009 31-Dec $ 59,335 691 (56,534) $ 3,492 (10,509) (289) (1,254) $ (8,560) 2009 30-Sep $ 60,338 652 (53,458) $ 7,532 (5,746) 3,448 (3,751) $ 1,483 2009 30-Jun $ 47,027 528 (48,562) $ (1,007) (6,587) (1,200) (4,156) $ (12,950) |


