Attached files
| file | filename |
|---|---|
| EX-31.2 - EXHIBIT 31.2 - HOT TOPIC INC /CA/ | a6673438ex31_2.htm |
| EX-32.1 - EXHIBIT 32.1 - HOT TOPIC INC /CA/ | a6673438ex32_1.htm |
| EX-23.1 - EXHIBIT 23.1 - HOT TOPIC INC /CA/ | a6673438ex23_1.htm |
| EX-31.1 - EXHIBIT 31.1 - HOT TOPIC INC /CA/ | a6673438ex31_1.htm |
| EX-10.9A - EXHIBIT 10.9A - HOT TOPIC INC /CA/ | a6673438ex10_9a.htm |
| EX-10.22A - EXHIBIT 10.22A - HOT TOPIC INC /CA/ | a6673438ex10_22a.htm |
| EX-10.16A - EXHIBIT 10.16A - HOT TOPIC INC /CA/ | a6673438ex10_16a.htm |
| EX-10.21A - EXHIBIT 10.21A - HOT TOPIC INC /CA/ | a6673438ex10_21a.htm |
| EX-10.14A - EXHIBIT 10.14A - HOT TOPIC INC /CA/ | a6673438ex10_14a.htm |
UNITED STATES
SECURITIES AND EXCHANGE COMMISSION
Washington, D.C. 20549
Form 10-K
|
x
|
ANNUAL REPORT PURSUANT TO SECTION 13 OR 15(D) OF THE SECURITIES EXCHANGE ACT OF 1934
|
For the fiscal year ended January 29, 2011
OR
|
¨
|
TRANSITION REPORT PURSUANT TO SECTION 13 OR 15(D) OF THE SECURITIES EXCHANGE ACT OF 1934
|
For the transition period from to
Commission File 0-28784
_______________
HOT TOPIC, INC.
(Exact name of Registrant as specified in its charter)
_______________
|
California
|
77-0198182
|
|
(State or other jurisdiction of
incorporation or organization)
|
(I.R.S. Employer
Identification No.)
|
|
18305 E. San Jose Ave.
City of Industry, California
|
91748
|
|
(Address of principal executive offices)
|
(Zip Code)
|
Registrant’s telephone number, including area code: (626) 839-4681
Securities registered pursuant to Section 12(b) of the Act:
|
Title of Each Class
|
Name of Exchange on Which Registered
|
|
Common Stock, no par value
|
Nasdaq Stock Market
|
Securities registered pursuant to Section 12(g) of the Act: None
Indicate by check mark if the Registrant is a well-known seasoned issuer, as defined in Rule 405 of the Securities Act. Yes ¨ No x
Indicate by check mark if the Registrant is not required to file reports pursuant to Section 13 or Section 15(d) of the Act. Yes ¨ No x
Indicate by check mark whether the Registrant (1) has filed all reports required to be filed by Section 13 or 15(d) of the Securities Exchange Act of 1934 during the preceding 12 months (or for such shorter period that the Registrant was required to file such reports), and (2) has been subject to such filing requirements for the past 90 days. Yes x No ¨
Indicate by check mark whether the Registrant has submitted electronically and posted on its corporate web site, if any, every Interactive Data File required to be submitted and posted pursuant to Rule 405 of Regulation S-T during the preceding 12 months (or for such shorter period that the registrant was required to submit and post such files). Yes o No o
Indicate by check mark if disclosure of delinquent filers pursuant to Item 405 of Regulation S-K is not contained herein, and will not be contained, to the best of Registrant’s knowledge, in definitive proxy or information statements incorporated by reference in Part III of this Form 10-K or any amendment to this Form 10-K. x
Indicate by check mark whether the registrant is a large accelerated filer, an accelerated filer, a non-accelerated filer or a smaller reporting company. See definitions of “large accelerated filer,” “accelerated filer” and “smaller reporting company” in Rule 12b-2 of the Exchange Act. (Check one):
| Large accelerated filer ¨ | Accelerated filer x |
| Non-accelerated filer ¨ (Do not check if a smaller reporting company) | Smaller reporting company ¨ |
Indicate by check mark whether the registrant is a shell company (as defined in Rule 12b-2 of the Exchange Act.): Yes ¨ No x
The aggregate market value of Common Stock held by non-affiliates of the Registrant as of July 31, 2010, the last business day of the Registrant’s most recently completed second fiscal quarter, was approximately $235,825,169 based on the closing price on that date of the Registrant’s Common Stock on the Nasdaq Stock Market. All outstanding shares of voting stock, except for shares held by executive officers and members of the Board of Directors and their affiliates are deemed to be held by non-affiliates. This determination of affiliate status is not necessarily a conclusive determination for other purposes.
The number of shares outstanding of the Registrant’s Common Stock was 44,648,406 as of April 4, 2011.
Documents Incorporated By Reference
Certain portions of the Registrant’s Definitive Proxy Statement for the Annual Meeting of Shareholders to be held on June 8, 2011 to be filed with the Securities and Exchange Commission (the “SEC”) no later than 120 days after January 29, 2011, are incorporated by reference into Part III of this Form 10-K (Items 10 through 14).
HOT TOPIC, INC.
ANNUAL REPORT ON FORM 10-K
FOR THE
FISCAL YEAR ENDED JANUARY 29, 2011
TABLE OF CONTENTS
|
Page
|
||
|
1
|
||
|
12
|
||
|
22
|
||
|
22
|
||
|
22
|
||
|
22
|
||
|
23
|
||
|
25
|
||
|
25
|
||
|
36
|
||
|
37
|
||
|
37
|
||
|
37
|
||
|
39
|
||
|
41
|
||
|
41
|
||
|
41
|
||
|
41
|
||
|
41
|
||
|
42
|
Cautionary Statement Regarding Forward-Looking Statements From time to time, in both written reports (such as this report) and oral statements, we make “forward-looking statements” within the meaning of Section 27A of the Securities Act of 1933, as amended, or the Securities Act, and Section 21E of the Securities Exchange Act of 1934, as amended, or the Exchange Act. We intend that such forward-looking statements be subject to the “safe harbors” created by these sections. Generally, the words “believes,” “anticipates,” “expects,” “continue,” “intends,” “will,” “may,” “plans” and similar expressions identify such forward-looking statements, although not all forward-looking statements contain these identifying words. These statements include, for example, statements regarding our expectations, beliefs, intentions or strategies regarding the future, such as the extent and timing of future revenues and expenses, economic conditions affecting consumer demand, ability to realize anticipated benefits of cost reduction plans and business changes, ability to grow or maintain comparable store sales, response to new concepts and other expected financial results and information. All forward-looking statements included in this report are based on information available to us as of the date of this report and we assume no obligation to update or revise any forward-looking statements to reflect events or circumstances that occur after such statements are made. Readers are cautioned not to place undue reliance on these forward-looking statements as they involve risks and uncertainties which may cause our actual results, performance or achievements to be materially different from any future results, performance or achievements. These risks, as well as other risks and uncertainties, are located in the company’s reports on Forms 10-K, 10-Q and 8-K filed with or furnished to the Securities and Exchange Commission, or SEC, including in Part I, Item 1A under the caption “Risk Factors” and in Part II, Item 7 under the caption “Management’s Discussion and Analysis of Financial Condition and Results of Operations” of this report.
Available Information Our annual report on Form 10-K, quarterly reports on Form 10-Q, current reports on Form 8-K and amendments to those reports filed with or furnished to the SEC pursuant to Section 13(a) or 15(d) of the Exchange Act, are available free of charge on our investor relations website, investorrelations.hottopic.com, as soon as reasonably practicable after such material is electronically filed with, or furnished to, the SEC. We also make available our Standards of Business Ethics at that website.
Fiscal Year Our fiscal year ends on the Saturday nearest to January 31. References to fiscal 2011, 2010, 2009, 2008 and 2007 refer to the 52-week periods ending January 28, 2012, January 29, 2011, January 30, 2010, January 31, 2009 and February 2, 2008. Fiscal 2006 refers to the 53-week period ended February 3, 2007.
References to Hot Topic, Inc. Throughout this report, the terms “we,” “us,” “our,” “company” and similar references refer to Hot Topic, Inc. and its wholly-owned subsidiaries.
|
BUSINESS
|
General We are a mall and web-based specialty retailer of apparel, accessories, music and gift items for young men and women whose lifestyles reflect a passion for music, fashion and pop culture. We operate under two primary concepts: Hot Topic and Torrid. Music and pop culture are the overriding inspirations at Hot Topic and Torrid is focused on providing the best in fashion to young plus-size women. We generate revenues primarily through our retail stores in the United States of America, Puerto Rico and Canada, and online through our websites. We were incorporated in California in 1988.
Concepts
Hot Topic At our Hot Topic stores and on our website hottopic.com, we sell a selection of licensed and non-licensed apparel, accessories and gift items that are influenced by popular music artists and pop culture trends. We also sell a limited assortment of music CDs and DVDs. Our merchandise is designed to appeal to young men and women primarily between the ages of 12 and 22 who are passionate about and have diverse tastes in music and pop culture.
1
We strive to consistently be the first to expose our customers to new music, pop culture and fashion trends. We believe our ability to quickly identify, source, and oftentimes negotiate exclusivity for, unique and diverse merchandise centered around music and pop culture is one of our competitive strengths. We also believe that our deep-rooted knowledge of music and pop culture, distinctive store design and rich music experiences that we offer (in-store, in-mall and at other venues), are competitive strengths. We opened our first Hot Topic store in California in fiscal 1989 and have since gained a national presence in the Unites States. We also operate in Canada and Puerto Rico.
Torrid At our Torrid stores and on our website torrid.com, we sell fashion forward apparel, lingerie, shoes and accessories for plus-size young women primarily between the ages of 15 and 29. It is designed to appeal to women sized 12 to 26 who are young at heart and in attitude and who want their clothes to be an extension of their lifestyles. We believe that our ability to provide our plus-size customers with easy access to the latest and best in fashion without sacrificing fit or style is a core competitive strength of Torrid. We opened our first Torrid store in fiscal 2001.
ShockHound At shockhound.com, we sell MP3s encompassing multiple music genres as well as a selection of apparel, accessories and gift items that are influenced by multi-genre music artists. Customers also have access to exclusive editorial and video content and a social networking community. Our customers may make MP3 and merchandise purchases in a single transaction. During the first quarter of fiscal 2011, we announced that ShockHound’s operations will be discontinued. Refer to “NOTE 15 – Subsequent Events” contained in the consolidated financial statements and Notes included elsewhere in this annual report on Form 10-K for more information concerning the discontinuation of ShockHound.
Merchandising
Hot Topic Merchandise Hot Topic’s music/pop culture-licensed merchandise includes tee shirts, hats, posters, stickers, patches, books, novelty accessories, CDs and DVDs and the music/pop culture-influenced merchandise includes women’s and men’s apparel and accessories, such as woven and knit tops, skirts, pants, shorts, jackets, shoes, costume jewelry, body jewelry, intimate apparel, sunglasses, cosmetics, leather accessories and gift items. Hot Topic’s diverse and extensive selection of merchandise is regularly tested to stay current with customer demand and new product trends. We have several lines of private label merchandise to complement and supplement our current product offerings.
The following table shows, for the periods indicated, Hot Topic’s major merchandise categories expressed as a percentage of net sales:
|
Fiscal Year
|
||||||||
|
2010
|
2009
|
|||||||
|
Fashion accessories
|
33 | % | 31 | % | ||||
|
Fashion apparel
|
12 | 14 | ||||||
|
License
|
27 | 30 | ||||||
|
Music
|
26 | 23 | ||||||
|
Other
|
2 | 2 | ||||||
| 100 | % | 100 | % | |||||
Torrid Merchandise Torrid sells both branded and private label merchandise that includes casual and dressy jeans and pants, fashion and novelty tops, sweaters, skirts, jackets, dresses, hosiery, shoes, intimate apparel and fashion accessories.
2
The following table shows, for the periods indicated, Torrid’s major merchandise categories expressed as a percentage of net sales:
|
Fiscal Year
|
||||||||
|
2010
|
2009
|
|||||||
|
Apparel
|
75 | % | 76 | % | ||||
|
Accessories
|
25 | 24 | ||||||
| 100 | % | 100 | % | |||||
Merchandising Staff Hot Topic’s team consists of a Chief Music Officer, Divisional Merchandise Managers, a staff of buyers and assistant buyers who manage the various product categories, a Trend Director and an Internet team. Torrid’s team consists of a Chief Merchandising Officer, a buying team, a product development team, a sourcing team, a fit and quality assurance team as well as an Internet team. In determining which Hot Topic merchandise to buy, the merchants spend considerable time viewing music videos, reviewing industry music sales, viewing movie releases that appeal to our teen customers, monitoring music radio station air play, viewing YouTube videos, consulting with sales associates, reviewing customer requests, attending trade shows, nightclubs and concerts, reading music and fashion industry periodicals and monitoring music, pop culture and social media websites. Their goal is not only to identify emerging trends early, but to quickly move on from them before the popularity of the trends wane. At Torrid, in order to remain in tune with reigning trends and preferences, the merchandising team conducts fashion research from a variety of sources within and outside the United States. Such sources include fashion hot spots, customer and store associate feedback, entertainment and pop culture venues and trade shows.
Purchasing Our goal is to provide exclusive, diverse, trend-setting merchandise to our customers early and at the right price. We purchase merchandise from a broad base of domestic and international vendors and only commit to a majority of the merchandise in as little as two weeks and as much as three months in advance of delivery, depending on the category, in order to respond quickly to emerging trends. We regularly monitor sales to determine desirable product types and quantities, emerging or declining trends and the spending patterns of our customers. We solicit input from our vendors and maintain productive relationships with them to support our effort to deliver quality, fashionable merchandise that is reflective of new and emerging trends. No vendor individually accounted for more than 10% of our merchandise purchases during fiscal 2010.
Planning and Allocation Planning and allocation of our inventory is done by merchandise classification and Stock Keeping Unit, or SKU, using integrated third-party software. Most merchandise is ordered in bulk and then allocated to each store based on sales performance and inventory levels. Our buyers, merchandise planners and allocation analysts consider current inventory levels, sales history, projected sales, planned inventories, store demographics, geographic preferences, store openings and planned markdown dates to determine SKU reorder quantities.
Distribution and Fulfillment To facilitate timely and efficient merchandise distribution to our stores and internet customers, we have distribution centers located in California and Tennessee, both of which are sufficient to meet our anticipated needs over the next several years. Substantially all merchandise is delivered to our distribution centers and within one to two business days of receipt, it is inspected, allocated, picked, prepared and boxed for shipment to our stores and internet customers. Merchandise is shipped from the distribution centers daily and minimal back stock is maintained.
3
Location and Site Selection As of the end of fiscal 2010, we operated 657 and 153 primarily mall-based Hot Topic and Torrid stores, respectively, in the United States, Puerto Rico and Canada. Refer to “Item 2 – Properties” for a geographical breakdown of stores by state and country. In selecting a site for a new store, we target high-traffic shopping areas with favorable lease terms and suitable demographics of likely customers.
Design and Environment The look and feel of our Hot Topic and Torrid stores continue to evolve. Our newer Hot Topic stores are designed to have an open, transparent look with all-glass store fronts and smaller, mobile floor fixtures that we believe highlight the merchandise and encourage easy navigation and discovery throughout the store. Our Torrid stores present a youthful atmosphere designed to create a comfortable and fun environment for our customers.
Sales During fiscal 2010, average sales per Hot Topic store was $0.8 million and average sales per square foot of store space was $426. Average sales per Torrid store in fiscal 2010 was $0.8 million and average sales per square foot of store space was $326.
Expansion We have significantly slowed our new store growth and aggressively pursue renegotiating or extending existing leases with more favorable terms. We continue to close stores that do not meet our expectations of profitability and remodel or relocate stores where there is a reasonable expectation of satisfactory sales results after the remodel or relocation.
In fiscal 2010, our capital investment to open a typical new or remodeled Hot Topic store in the United States, including leasehold improvements and furniture and fixtures, was approximately $188,000, while our capital investment to open a new Hot Topic store in Canada was approximately $367,000. These stores have square footage similar to current averages of 1,762 square feet. The average initial gross inventory for a new Hot Topic store opened in fiscal 2010 was approximately $102,000 and the average pre-opening costs for a new Hot Topic store in the United States and Canada were approximately $18,000 and $59,000, respectively. Initial inventory requirements vary at new stores depending on the season and current merchandise trends.
In fiscal 2010, our capital investment to open a new Torrid store, including leasehold improvements and furniture and fixtures, was approximately $264,000. The average initial gross inventory for a new Torrid store opened in fiscal 2010 was approximately $89,000. Initial inventory requirements vary at new stores depending on the season and current merchandise trends. The average pre-opening costs in fiscal 2010 for a new Torrid store were approximately $26,000. The new Torrid stores have square footage similar to current averages of 2,496 square feet.
4
The following table shows our historical store expansion and closure activity for the periods indicated and our planned activity in fiscal 2011. All store expansion and closure activity is evaluated by our real estate committee.
|
Number of Stores
|
||||||||||||||||||||||||
|
Estimate
|
Actual
|
|||||||||||||||||||||||
|
Fiscal Year
|
||||||||||||||||||||||||
|
2011
|
2010
|
2009
|
2008
|
2007
|
2006
|
|||||||||||||||||||
|
Hot Topic
|
||||||||||||||||||||||||
|
Beginning of Period
|
657 | 680 | 681 | 690 | 694 | 663 | ||||||||||||||||||
|
Open *
|
3 | 6 | 2 | 4 | 9 | 34 | ||||||||||||||||||
|
Close **
|
(25 | ) | (29 | ) | (3 | ) | (13 | ) | (13 | ) | (3 | ) | ||||||||||||
|
End of Period
|
635 | 657 | 680 | 681 | 690 | 694 | ||||||||||||||||||
|
Remodeled/relocated
|
30 | 24 | 16 | 14 | 70 | 22 | ||||||||||||||||||
|
Torrid
|
||||||||||||||||||||||||
|
Beginning of Period
|
153 | 156 | 159 | 151 | 131 | 120 | ||||||||||||||||||
|
Open
|
5 | 3 | 1 | 11 | 23 | 12 | ||||||||||||||||||
|
Close **
|
(5 | ) | (6 | ) | (4 | ) | (3 | ) | (3 | ) | (1 | ) | ||||||||||||
|
End of Period
|
153 | 153 | 156 | 159 | 151 | 131 | ||||||||||||||||||
|
Remodeled/relocated
|
5 | - | - | - | 1 | - | ||||||||||||||||||
|
* Includes three new stores opened in Canada during the third quarter of fiscal 2010.
|
||||||||||||||||||||||||
|
** Includes stores impacted by our cost reduction plan.
|
||||||||||||||||||||||||
Operation Teams Hot Topic and Torrid each have a Vice President of Store Operations who leads a divisional operations team. Supporting the Vice President of Store Operations for each division are regional directors who oversee multiple district managers, and district managers who typically oversee approximately ten stores. A typical store has a store manager, two assistant managers, and five to eight part-time sales associates, depending on the season. We believe our distinct culture attracts Hot Topic sales associates that are passionate about music and pop culture and Torrid sales associates that are passionate about fashion for the plus-size customer. Each member of our store operation teams receive comprehensive training that is customized to fit their roles and responsibilities. In addition to base pay and the opportunity to participate in our Employee Stock Purchase Plan and the Hot Topic 401(k) Plan if eligible, we offer incentive programs to some members of our store operations teams based on achieving certain sales levels.
eCommerce Operations
Websites Our hottopic.com and torrid.com websites provide convenient access to a broad selection of merchandise for sale, including some Internet exclusive items, information on upcoming events, promotions, store locations, job postings and community features. Customers may also access our hottopic.com website through touchscreen kiosk terminals located within each Hot Topic store. These kiosks allow customers to access, purchase and ship merchandise from hottopic.com to the store or their homes.
5
The following table shows, for the periods indicated, Internet sales for Hot Topic and Torrid (in thousands, except percent amounts):
|
Fiscal Year
|
||||||||||||
|
2010
|
2009
|
2008
|
||||||||||
|
Hot Topic Internet Sales
|
$ | 40,100 | $ | 35,800 | $ | 30,100 | ||||||
|
Hot Topic Internet Sales as a Percentage of Total Hot Topic Sales
|
7.4 | % | 6.3 | % | 5.0 | % | ||||||
|
Torrid Internet Sales
|
$ | 33,695 | $ | 29,500 | $ | 23,700 | ||||||
|
Torrid Internet Sales as a Percentage of Total Torrid Sales
|
21.6 | % | 19.2 | % | 15.7 | % | ||||||
Marketing
Hot Topic We strive to increase sales and our brand recognition, enhance the customer shopping experience and reach out to new customers using a unique combination of tools including: promotional signage in stores and on our website; viral online marketing; branded gift cards; through our loyalty program; social media; reliance on our customers and associates; compelling store designs; and experiential events. During the fourth quarter of 2009, we launched our loyalty program, HT+1. HT+1 is free to join and is designed to build customer loyalty and encourage repeat sales by allowing members an opportunity to earn points in a variety of ways, including store visits, store purchase and online purchases. In addition, HT+1 allows us to communicate to members about products and events that are relevant to them as well as giving members access to exclusive events that are not available to other customers. Touchscreen kiosk terminals located within each Hot Topic store offer another way that members may access their HT+1 loyalty accounts. Since the launch, over six million people have become HT+1 members.
Torrid We seek to build the Torrid brand with many of the same tools used by Hot Topic, as well as with print media, direct mail, special television promotional segments and national “model search” contests. Our Torrid loyalty program, divastyle®, gives us the chance to regularly communicate with our most loyal Torrid customers. They are rewarded throughout the year with special offers, promotions, information and updates on new products and current trends available at Torrid. Customers may also participate in our private label Torrid credit card program, divastatusSM.
Information Technology Our information systems provide for the integration of store, internet, merchandising, distribution, financial and human resources records and data. Many of these information systems have been customized in varying degrees to fit our business needs and we license a full range of software from different vendors. We regularly upgrade existing systems or replace all or part of an existing system with one that we believe is better suited to our business. In addition, we occasionally implement new technology to support our business.
Trademarks Our trademarks, which constitute our primary intellectual property, have been registered or are the subject of pending applications in the United States Patent and Trademark Office and with the registries of many foreign countries. In addition, we have common law rights to certain trademarks, service marks and trade names used in our business from time to time. We are unaware of the use of any of our marks raising any claims of infringement or other challenges to our right to use our marks in the United States.
Seasonality Our business, particularly at Hot Topic, is subject to seasonal influences, with heavier concentrations of sales during the back-to-school, Halloween and holiday (defined as the week of Thanksgiving through the first few days of January) seasons and other periods when schools are not in session. The holiday season has historically been our single most important selling season. We believe that the importance of the summer vacation and back-to-school seasons (which affect operating results in the second and third quarters, respectively) and to a lesser extent, the spring break season (which affects operating results in the first quarter), as well as Halloween (which affects operating results in the third quarter), all reduce our dependence on the holiday selling season, but this may not always be the case or always affect the company to the same degree. As is the case with many retailers of apparel, accessories and related merchandise, we typically experience lower net sales in the first and second fiscal quarters relative to other quarters.
\
6
Competition The apparel, music and accessory categories within the retail industry in which we operate are highly competitive and are subject to rapidly changing consumer demands and preferences. We compete with numerous retailers for vendors, teenage and young adult customers, suitable store locations and qualified associates and management personnel. We currently compete with street alternative stores located primarily in metropolitan areas; shopping mall-based teenage-focused retailers; big-box discount stores; music stores; mail order catalogs and websites; and with numerous potential competitors who may begin or increase efforts to market and sell products competitive with Hot Topic and Torrid products. Torrid has additional competitors who operate plus-size departments in department stores and discount stores. Increased competition could have a material adverse effect on our business, results of operations and financial condition.
Employees As of the end of fiscal 2010, we employed approximately 2,400 full-time and 6,500 part-time associates. Of our 8,900 associates, approximately 800 were headquarters and distribution center personnel and the remainder were field management and store associates. The number of part-time associates changes based upon seasonal needs. None of our associates are covered by collective bargaining agreements.
Executive Officers Our executive officers and their ages are as follows:
|
Name
|
Age
|
Position
|
|
Lisa Harper
|
51
|
Chief Executive Officer and Director
|
|
Gerald Cook
|
58
|
Chief Operating Officer
|
|
Chris Daniel
|
53
|
President, Torrid
|
|
James McGinty
|
48
|
Chief Financial Officer
|
|
John Kirkpatrick
|
42
|
Senior Vice President, Chief Music Officer, Hot Topic
|
|
George Wehlitz, Jr.
|
50
|
Vice President, Finance
|
Lisa Harper has served as Chief Executive Officer since March 2011, and served on our Board of Directors since June 2008. Prior to joining us, she served as Chairman of the Board of Directors of the Gymboree Corporation, a publicly-traded corporation operating a chain of specialty retail stores for children and women, from June 2002 until her retirement in July 2006. From January 2006 through July 2006, Ms. Harper served as Chief Creative Officer of the Gymboree Corporation. From February 2001 through January 2006, Ms. Harper served as Chief Executive Officer of the Gymboree Corporation and from February 2001 through June 2002, she was Vice Chairman of the Gymboree Corporation’s Board of Directors. From 1995 through 2001, Ms. Harper held various merchandising and design positions at the Gymboree Corporation and before that, held similar positions with several other clothing retailers, including Limited Too, Esprit de Corp., GapKids, Mervyn’s, and Levi Strauss. Ms. Harper also served as a director of Longs Drug Stores Corporation from February 2006 to May 2008. Since 2008, Ms. Harper has developed and operated a hotel in Mexico. Ms. Harper holds a degree from the University of North Carolina at Chapel Hill.
Gerald Cook has served as Chief Operating Officer since June 2008. From November 2005 through June 2008, he served as President, Hot Topic Inc. From September 2003 to October 2005, he was President of the Hot Topic division. From February 2001 to September 2003, he was Chief Operating Officer. From February 1999 until joining us, he was the President and Chief Operating Officer of Travel 2000, Inc. From 1995 to 1998, Mr. Cook was Senior Vice President, Operations for The Bombay Company, Inc. and from 1989 to 1995, Mr. Cook was the Vice President, Stores and the Vice President, General Merchandising Manager of Woman’s World Stores. Prior to 1989, he held management positions with Barnes & Noble/B Dalton, The Gap Stores and the Limited, Inc. Mr. Cook holds a B.S. degree in Business Administration from the University of Minnesota.
7
Chris Daniel has served as President of our Torrid division since November 2006. From September 2006 to November 2006, he was Senior Vice President, Chief Merchandising Officer for Torrid and from October 2004 to August 2006, he was Vice President, General Merchandise Manager for Torrid. Prior to joining Torrid, Mr. Daniel held various design and merchandising positions with national department and specialty retailers. Mr. Daniel holds a B.A. degree in English Literature from the University of Richmond in Richmond, Virginia. Mr. Daniel has tendered his resignation as President of our Torrid division, effective as of April, 29, 2011, but prior to that time he continues to serve as President of our Torrid division and assist in transition matters.
James McGinty has served as Chief Financial Officer since February 2001. Mr. McGinty joined us in August 2000 as Vice President, Finance and was promoted to Chief Financial Officer in February 2001. From July 1996 to July 2000, Mr. McGinty was Vice President-Controller at Victoria’s Secret Stores, the leading brand and largest specialty retailer division of the Limited, Inc. From 1984 to 1996, he held various financial and accounting positions within the Structure and Express divisions of The Limited, Inc. Mr. McGinty holds a B.S. degree in Accounting from Miami University in Oxford, Ohio.
John Kirkpatrick joined us in April 2007 as Senior Vice President, Chief Music Officer of our Hot Topic division. From 2004 to 2007, Mr. Kirkpatrick served as Senior Vice President, Music and Creative Affairs at Paramount Pictures. Prior to that, Mr. Kirkpatrick served as Senior Vice President, A&R / Soundtracks at Elektra Records from 1996 to 2004. From 1990 to 1996, he held various management positions at Laffitte Entertainment Division. Mr. Kirkpatrick attended the University of South Florida.
George Wehlitz Jr. joined us in April 2008 as Vice President, Finance. From November 2005 to January 2008, Mr. Wehlitz was Chief Financial Officer at Cycle Gear, Inc., a specialty retailer of motorcycle apparel and accessories. Mr. Wehlitz previously served Hot Topic, Inc. as Vice President, Controller in February 2002, and then served as Vice President, Finance from August 2003 to November 2005. From August 2000 to February 2002, Mr. Wehlitz was Chief Financial Officer at The Popcorn Factory, a catalog company for gourmet popcorn gifts. From 1987 to 2000, Mr. Wehlitz held various financial-related positions, at the divisional and corporate level, for The Bombay Company, Inc. Mr. Wehlitz holds a B.A. degree in Accounting from Texas Christian University and is a Certified Public Accountant.
|
RISK FACTORS
|
CERTAIN RISKS TO OUR BUSINESS
The statements in this section describe the major risks to our business and should be considered carefully, in connection with all of the other information set forth in this annual report on Form 10-K and our quarterly reports on Form 10-Q and current reports on Form 8-K. The risks described below are not the only risks we face. Additional risks that are not presently known to us or that we currently deem to be immaterial may also affect our business. If any of the events, conditions, occurrences or circumstances identified as a risk, or an additional risk, actually occurs, our business, financial condition, results of operations, stock price, reputation and ability to achieve anticipated results could be affected.
Our success relies on popularity of music, pop culture and fashion trends, and our ability to react to them
Our financial performance is largely dependent upon the continued popularity of apparel, accessories and other merchandise inspired by music, film, television, pop culture, and fashion trends, particularly among teenagers and college-age adults. The popularity of such products is influenced by the Internet; music videos and music television networks; the emergence of new artists; the success of music releases, movies and television shows; and music/pop culture-related products. The popularity of particular types of music, movies, television shows, artists, actors, styles, trends and brands is constantly changing. Our failure to anticipate, identify and react appropriately to changing trends and preferences of our customers could lead to, among other things, excess inventories and higher markdowns. There can be no assurance that the products we sell will be accepted by our customers.
8
We depend on a small number of key licensed products for a portion of our earnings and lower than expected sales of those products or the inability to obtain new licensed products could adversely affect our revenues
We license from others the rights to produce and/or sell certain products that contain a third party’s trademarks, designs and other intellectual property. If the popularity of those licensed products diminishes or if we are unable to obtain new licensed products with comparable consumer demand, our sales could decline. Furthermore, we may not be able to prevent a licensor from choosing not to renew a license with us and/or from licensing a product to one of our competitors.
Our recently announced cost reduction and operational initiatives may not achieve their anticipated benefits and could adversely affect our operations and revenues and our ability to respond to future growth opportunities
We are currently implementing a plan to reduce company overhead and close underperforming stores. In addition, we recently announced certain business changes that involve discontinuing our ShockHound operations, writing down unproductive inventory and writing down fixed assets that are no longer critical to the strategic direction of the company. The estimated costs and charges associated with these initiatives may vary materially based upon a variety of factors, including the timing of the execution of the initiatives, the outcome of negotiations with landlords and other third parties and unexpected costs. Any such factor could result in our not realizing the anticipated benefits from the initiatives. Even if we are successful in implementing these initiatives, the loss of personnel and reduction in the number of stores we operate, among other things, may result in decreased operational efficiencies, unanticipated operational challenges and decreased revenues, or leave us unprepared to take advantage of growth opportunities in the future.
Our access to merchandise could be hurt by changes in vendors’ business condition
Our financial performance depends on our ability to obtain our merchandise in sufficient quantities at competitive prices. We depend on independent contractors and vendors to manufacture our merchandise. Substantially all of our music/pop culture-licensed products are available from vendors that have exclusive license rights. In addition, we rely on small, specialized vendors, some of which create unique products primarily for us who generally have limited resources, production capacities and operating histories. Lack of access to capital, as a result of the current economic conditions or otherwise and changes in vendors’ compliance and certification procedures may cause our vendors to delay, reduce or eliminate shipment of products we otherwise would sell in our stores. We generally do not have long-term purchase contracts or other contractual assurances of continued supply, pricing or access to new products. There can be no assurance that we will be able to acquire desired merchandise in sufficient quantities on acceptable terms in the future.
Remodeling, relocating, closing and opening stores may not achieve the anticipated benefits and could create challenges we may not be able to adequately meet
We depend on our ability to manage our existing store base, ensure that the performance of our remodeled and relocated stores is at acceptable levels, open new stores, and close underperforming stores. In order to open, remodel and relocate stores, among other things, we need to locate suitable store sites, negotiate acceptable lease terms, obtain or maintain adequate capital resources on acceptable terms, source sufficient levels of inventory, hire and train store managers and sales associates, integrate new or relocated stores into our existing operations and maintain adequate distribution center space and information technology systems. Moving or expanding store locations and operating stores in new markets, especially markets outside the continental United States, may present competitive, merchandising and regulatory challenges we do not have experience in or know how to face. There can be no assurance that moving or expanding store locations and operating stores in new markets will not adversely affect the individual financial performance of our existing stores or our overall results of operations. In the event that the number of our stores increases, we may face risks associated with market saturation of our products and concepts. Similarly, there can be no assurance that remodeling or relocating existing stores will not adversely affect either the individual financial performance of the store prior to the change, or our overall results of operations. Furthermore, there can be no assurance that we will successfully achieve our remodel or expansion targets or, if achieved, that planned remodel or expansion will result in profitable operations.
9
Our business strategy requires innovating and improving our operations, and we may not be able to do this sufficiently to effectively prevent a negative impact on our business and financial results
To be successful we must innovate our products, our stores, and the shopping experience for our customers. We recently began offering a print-on-demand product which allows us to print designs on tees and hoodies. Such innovation involves risks, including that we will not properly anticipate the need for or rate of change, that we are not able to successfully bring about such change, that we will not be able to produce anticipated results, and that our customers will not be receptive to the change. Such innovation also involves significant capital expenditures and other costs that we may not be able to recover if the innovation is not favorably received by our customers.
Failure of our vendors to use acceptable ethical business practices could negatively impact our business
We expect our vendors to operate in compliance with applicable laws, rules and regulations regarding working conditions, employment practices, environmental compliance and with intellectual property laws. However, we do not control their labor and other business practices. Further, we do not inspect our manufacturers’ operations and would not be immediately aware of any noncompliance by our vendors with applicable domestic or international laws and standards, including our internal standards. If one of our vendors violates labor or other laws or implements labor or other business practices that are regarded as unethical, the shipment of merchandise to us could be interrupted, orders could be canceled, relationships could be terminated and our reputation could be damaged.
Technology and other risks associated with our Internet sales could hinder our overall financial performance
We sell merchandise over the Internet through websites we control and affiliated websites controlled by others. Our Internet sales encompass a significant portion of our total sales and are dependent on our ability to drive Internet traffic to our websites. Our Internet operations are subject to numerous risks and pose risks to our overall business, including, among other things, the inability to successfully establish partnerships that are instrumental in driving traffic to our websites, diversion of sales from our stores; liability for online content; computer privacy concerns; rapid technological changes and the need to invest in additional computer hardware and software to support sales; hiring, retention and training of personnel to conduct the Internet operations; failure of computer hardware and software, including computer viruses, telecommunication failures, online security breaches and similar disruptions; governmental regulations; and credit card fraud. There can be no assurance that our Internet operations will achieve sales and profitability levels that justify our investment in them.
System security risk issues and system failures could disrupt our internal operations or information technology services provided to customers
Experienced computer programmers and hackers may be able to penetrate our network security and misappropriate our confidential information or that of third parties, create system disruptions or cause shutdowns. As a result, we could incur significant expenses addressing problems created by security breaches of our network. Moreover, we could incur significant expenses in connection with system failures. In addition, hardware and operating system software and applications that we procure from third parties may contain defects in design or manufacture, including “bugs” and other problems that could unexpectedly interfere with the operation of the system. The costs to us to eliminate or alleviate security problems, viruses and bugs could be significant, and the efforts to address these problems could result in interruptions, delays or cessation of service that may impede our sales, distribution or other critical functions. In addition, our systems are not fully redundant and could be subject to failure. Our disaster recovery planning may not be sufficient, and we may not have adequate insurance coverage to compensate us for any significant casualty loss.
10
Loss of key people or an inability to hire necessary and significant personnel could hurt our business
Our ability to achieve and maintain operating efficiency and to anticipate and effectively respond to changing trends and consumer preferences depends in part on our ability to retain and attract senior management and other key personnel in our operations, merchandising, music and other departments. Competition for these personnel is intense, and we cannot be sure that we will be able to retain or attract qualified personnel as needed. The sudden loss of the services of key people could have a material adverse effect on our business, results of operations and financial condition.
Our supply chain has risks and uncertainties that could affect our sales and business
The merchandise we sell is obtained from vendors and manufacturers in the United States and outside of the country. Generally, this product is shipped to our distribution centers in California and Tennessee, and from our distribution centers to our stores or directly to our customers using Federal Express and the United States Postal Service. Certain products we sell are imported and subject to delivery delays based on availability and port capacity. Our reliance on Federal Express and the United States Postal Service for shipments is subject to risks associated with their ability to provide delivery services that meet our shipping needs and our ability to obtain such services at an affordable cost. We are also dependent upon the ability to hire temporary associates to adequately staff our distribution centers, particularly during busy periods such as the holiday season. We may not be able to achieve or maintain operating efficiencies using two distribution centers that are located approximately 2,000 miles apart.
Risks associated with contracting directly with manufacturers for merchandise could hinder our financial performance
Over time, we expect to source an increasingly greater percentage of our merchandise directly from manufacturers. We have limited experience in sourcing and importing merchandise directly from manufacturers. We may encounter administrative challenges and operational difficulties with the manufacturers from which we may source our merchandise. Operational difficulties could include reductions in the availability of production capacity, errors in complying with merchandise specifications, insufficient quality control and failures to meet production deadlines. A manufacturer’s failure to ship merchandise to us on a timely basis or to meet the required quality standards could cause supply shortages that could result in lost sales.
We could acquire merchandise without full rights to sell it, which could inhibit sales and lead to disputes or litigation
We purchase licensed merchandise from vendors who represent that they hold manufacturing and distribution rights to such merchandise. We also contract directly with licensors to obtain the manufacturing and distribution rights. We do not independently verify whether these vendors legally hold adequate rights to the licensed properties they are manufacturing, distributing or licensing. If we license merchandise that we have not legally obtained the rights to sell, we could be obligated to remove such merchandise from our stores, incur costs associated with destruction of merchandise and be subject to liability under various civil and criminal causes of action, including actions to recover unpaid royalties and other damages. As we expand our efforts to contract directly with manufacturers and licensors for licensed merchandise, we may incur difficulties securing the necessary manufacturing and distribution rights. Even when we have secured the rights needed to sell such products in the United States, we may not be able to secure the rights to sell the products outside of the United States.
11
There are litigation and other claims against us from time to time, which could distract management from our business activities and could lead to adverse consequences to our business and financial condition
We are involved from time to time with litigation and other claims against us. Often these cases can raise complex factual and legal issues, which are subject to risks and uncertainties and which could require significant management time. Although we do not currently believe that the outcome of any current litigation and claims against us will have a material adverse effect on our overall financial condition, we have, in the past, incurred unexpected expense in connection with litigation matters. In the future, adverse settlements or resolutions may negatively impact earnings or injunctions against us could have an adverse effect on our business by requiring us to do or prohibiting us from doing certain things. We may in the future be the target of material litigation, including class-action and securities litigation, which could result in substantial costs and divert our management’s attention and resources.
We materially rely on ecommerce, information and other technology systems, including such technology provided by third parties
We believe our dependence on ecommerce, information and other technology systems, including technology provided by third parties will increase in the future, and it is possible we may not be able to obtain, maintain or use such systems as quickly or as effectively as needed. Implementing new systems, modifying existing systems, and restoring such systems and technology following a shut-down could present technological and operational challenges which we are unprepared for. We continue to evaluate the adequacy of the ecommerce, information and other technology systems we use to operate our business. Our failure to adapt to changing technological needs could have a material adverse effect on our results of operations and financial condition. We have agreements with third-party providers to maintain our ecommerce and information technology systems, including content. We would be negatively impacted if such third parties fail to provide such services, including by way of the malfunction of third-party sites, hardware, software and other equipment; service outages of third-party sites; third-party claims of data privacy, security breaches and intellectual property infringement; and poor integration of our technology into their software and services.
Uncertainty in the global capital and credit markets may materially impair the liquidity of a portion of our cash and investment portfolio
We hold cash, cash equivalents and short- and long-term investments, including auction rate securities (discussed in more detail in “NOTE 1 – Organization and Summary of Significant Accounting Policies” contained in the financial statements and Notes included elsewhere in this annual report on Form 10-K). Auctions representing the auction rate securities we hold have continued to fail and will limit our ability to liquidate these investments for some period of time. Although the money market funds and municipal bonds we hold are highly rated and are comprised of high-quality, liquid instruments, if the financial markets trading the underlying assets experience a disruption, we may need to temporarily rely on other forms of liquidity. In addition, a risk exists that our cash and investments may not always be optimally managed and this may affect our profitability and results of operations.
Limitations on the number of shares available for grant could adversely affect our ability to attract and retain employees
We have historically used stock options as a component of our total employee compensation program in order to align employees’ interests with the interests of our shareholders, encourage employee retention and provide competitive compensation and benefit packages. In recent years, we have experienced limitations on the number of shares available for grant under our equity compensation plans. Difficulties relating to obtaining shareholder approval of an increase in the shares available for grant under our equity compensation plans could make it more challenging or impossible for us to grant stock-based payments to employees in the future.
Our charter documents and other circumstances could prevent a takeover or cause dilution of our existing shareholders, which could be detrimental to existing shareholders
Our Articles of Incorporation and Bylaws contain provisions that may have the effect of delaying, deterring or preventing a takeover of Hot Topic, Inc. For instance, our Articles of Incorporation include certain “fair price provisions” generally prohibiting business combinations with controlling or significant shareholders unless certain minimum price or procedural requirements are satisfied, and our Bylaws prohibit shareholder action by written consent. Additionally, our Board of Directors, or Board, has the authority to issue, without shareholder approval, up to 10,000,000 shares of “blank check” preferred stock having such rights, preferences and privileges as designated by the Board. The issuance of these shares could have a dilutive effect on shareholders and potentially prohibit a takeover of Hot Topic, Inc. by requiring the preferred shareholders to approve such a transaction. We also have a significant number of authorized and unissued shares of our common stock available under our Articles of Incorporation. These shares provide us with the flexibility to issue our common stock for future business and financial purposes including stock splits, raising capital and providing equity incentives to employees, officers and directors. The issuance of these shares could result in dilution to our shareholders.
12
We are dependent upon malls remaining popular as shopping destinations, the ability of shopping mall anchor tenants and other attractions to generate customer traffic and maintaining good relationships with shopping mall operators
The global economic downturn and other factors have diminished the ability of shopping mall operators to operate profitably and, in some cases, forced them to declare bankruptcy or cease operations entirely. The ongoing slowdown in the United States economy, uncertain economic outlook, and other factors could continue to curtail shopping mall development, decrease shopping mall traffic, reduce the number of hours shopping mall operators keep their shopping malls open, cause shopping mall operators to lower their operational standards and negatively impact our lease contracts. Consolidation of ownership of shopping malls may give landlords more leverage in negotiations and adversely affect our ability to negotiate favorable lease terms. Such consolidation may result in increased lease related costs to the company. We believe we have generally favorable relationships with shopping mall operators and developers, however if this changed it could inhibit our ability to negotiate with them and may make it more difficult for us to manage our leases, including for us to expand, remodel or relocate to certain sites. If our relations with shopping mall operators or developers become strained, or we otherwise encounter difficulties in leasing store sites, we may not be able to open stores in malls we would otherwise be interested in maintaining stores; we may not be able to negotiate lease terms favorable to the company; and we may be inhibited in our ability to close underperforming stores.
We face intense competition
The apparel, music and accessory categories within the retail industry in which we operate are highly competitive. Increased competition could have a material adverse effect on our business, results of operations and financial condition. Our competitors, particularly big-box retailers, may have the ability to sell merchandise at substantially lower prices than we are able to sell such merchandise. This may cause us to incur greater than anticipated price reductions and unanticipated increases in our inventories for such products. It may also cause us to elect not to sell such products, despite the fact the products would otherwise attract customers and sell well in our stores.
We are responsible for maintaining the privacy of personally identifiable information of our customers
We are highly dependent on the use of credit cards to complete sale transactions in our stores and through our websites. If we fail to comply with Payment Card Industry (PCI) Data Security Standards, we may become subject to fines or limitations on our ability to accept credit cards. Through our sale transactions, loyalty programs and other methods, we obtain information about our customers which is subject to federal and state privacy laws. These laws are constantly changing. If we fail to comply with these laws, we may be subject to fines or penalties.
Timing, seasonal issues and other fluctuations outside of our control could negatively impact our financial performance for given periods
Our business, particularly our Hot Topic division, is subject to seasonal influences that affect our comparable store sales. There are heavier concentrations of sales during the back-to-school, Halloween and holiday (defined as the week of Thanksgiving through the first few days of January) seasons and other periods when schools are not in session. Our results of operations may fluctuate materially depending on, among other things, the timing of store openings and related pre-opening and other startup expenses; net sales contributed by new stores; increases or decreases in comparable store sales; timing, popularity and our ability to obtain, certain pop culture-related licenses, including on an exclusive basis; releases of new music, film and television; releases of new music/pop culture-related products; our ability to efficiently source and distribute products; changes in our merchandise mix and the challenges involved in getting the right mix into stores at the right time; shifts in timing of certain holidays; changes in our merchandise mix; weather conditions; and overall economic conditions.
13
Our profitability could be adversely affected by volatile commodity prices, including petroleum and cotton
The profitability of our business depends to a certain degree upon the price of certain commodities, including petroleum and cotton products. We are affected by changes in such prices to the extent that such commodities are part of the costs of delivery of merchandise to our stores and to the extent that the commodities are used in the production of our merchandise.
Significant fluctuation in the value of the U.S. dollar or foreign exchange rates may affect our profitability
Substantially all of our foreign purchases of merchandise have been negotiated and paid for in U.S. dollars. As a result, our sourcing operations may be adversely affected by significant fluctuation in the value of the U.S. dollar against foreign currencies, restrictions on the transfer of funds and other trade disruptions. A portion of our revenues come from foreign markets. Changes in foreign exchange rates applicable to these markets may adversely affect our revenues, even if the volume of sales remains the same. We may not be able to repatriate revenues earned in foreign markets.
Recording impairment charges for certain underperforming stores may negatively impact our future financial condition or results of operations, and closing stores might not have a positive impact on our operating results
We are required to assess, and where appropriate, record a charge for, the impairment of underperforming assets. This may negatively impact our reported and future financial condition and results of operations. In addition, we continue to close stores that do not meet our expectations of profitability which may cause us to impair or accelerate the depreciation of certain store assets and incur additional amounts for lease termination, severance and other closing costs. There can be no assurance that we will not incur future impairment charges and store closure expenses for underperforming assets or that store closures will have a significant positive impact on our operating results.
Changes in laws, including employment laws and laws related to our merchandise, could make conducting our business more expensive or change the way we do business
Changes in laws and any future changes could make our operations more expensive or require us to change the way we do business. Changes in federal and state minimum wage laws could require us to change our entire wage structure for stores. Other laws related to treatment of employees, including laws related to employee benefits and privacy, could also negatively impact us, such as by increasing medical insurance costs and related expenses. Changes in product safety or other consumer protection laws could lead to increased costs to us for certain merchandise, additional labor costs associated with readying merchandise for sale or serve as the basis for litigation.
A disruption of imports may increase our costs and reduce our supply of merchandise
We receive apparel and other merchandise from foreign sources, both purchased directly in foreign markets and indirectly through domestic vendors with foreign sources. As a result of our reliance on international vendors and manufacturers, we are subject to the risks generally associated with global trade and doing business abroad, which include foreign laws and regulations, political unrest, disruptions or delays in cross-border shipments and changes in economic conditions in countries in which our merchandise is manufactured. In addition, disease outbreaks, terrorist acts and military conflict could increase the risks of doing business with suppliers who rely on foreign markets. Trade restrictions in the form of tariffs or quotas, or both, that are applicable to the merchandise we sell also could affect the importation of the merchandise and increase the cost and reduce the supply of products available to us. Further, changes in tariffs or quotas for merchandise imported from individual foreign countries could lead us to shift our sources of supply among various countries. Any shift we might undertake in the future could result in a disruption of our sources of supply and lead to a reduction in our revenues and earnings. Supply chain security initiatives undertaken by the United States or foreign governments that impede the normal flow of product could also negatively impact our business.
14
We incur costs associated with regulatory compliance, and this cost could be significant
There are numerous regulatory requirements for public companies that we comply with or may be required to comply with in the future associated with our business operations and compliance with these rules could result in the diversion of management’s time and attention, which could be disruptive to normal business operations. These regulations may include more stringent accounting standards, taxation requirements (including changes in applicable income tax rate, new tax laws and revised tax law interpretations), trade restrictions, regulations regarding financial matters, privacy and data security, environmental regulations, advertising, safety and product liability. We may in the future be required to adopt International Financial Reporting Standards, and doing so could be time-consuming and cause us to incur significant expense. If we do not satisfactorily or timely comply with these requirements, possible consequences could include sanction or investigation by regulatory authorities such as the SEC or the Nasdaq Stock Market; fines and penalties; incomplete or late filing of our periodic reports, including our annual report on Form 10-K or quarterly reports on Form 10-Q or civil or criminal liability.
Government or consumer concerns about product safety could result in regulatory actions, recalls or changes to laws, which could harm our reputation, increase costs or reduce sales
We are subject to regulation by the Consumer Product Safety Commission and similar state and international regulatory authorities, and our products could be subject to involuntary recalls and other actions by these authorities. We purchase merchandise from suppliers domestically as well as outside the United States. One or more of our suppliers might not adhere to product safety requirements or our quality control standards, and we might not identify the deficiency before such merchandise is received by our customers. Issues of product safety could result in a recall of products we sell. Additionally, regulatory authorities, including the Consumer Product Safety Commission, have undertaken reviews of product safety and are in the process of enacting or are considering various proposals for more stringent laws and regulations. In particular, the U.S. Congress has enacted the Consumer Product Safety Improvement Act of 2008, which imposes significant new requirements on the sale of consumer products and enhanced penalties for noncompliance. Such regulations contain provisions which have uncertain applicability to products we sell, and such lack of certainty may inhibit our willingness carry products or cause us to carry product we otherwise would not. These regulations could result in delays in getting products to our stores, lost sales, the rejection of our products by consumers, damage to our reputation or material increases in our costs, and may have a material adverse effect on our business. Moreover, individuals and organizations may assert legal claims for our non-compliance with consumer product rules and regulations, and we may be subject to lawsuits relating to these claims. There is a risk that these claims or liabilities may exceed or fall outside of the scope of indemnities provided by third parties or outside the coverages of our insurance policies.
Economic conditions could decrease consumer spending and reduce our sales
Certain economic conditions could affect the level of consumer spending on merchandise we offer, including, among others, employment levels; salary and wage levels, particularly of teens and college-age adults; interest rates; availability of consumer credit; taxation; and consumer confidence in future economic conditions. For example, the global economic downturn has significantly reduced consumer spending levels and mall customer traffic in general. The ongoing slowdown in the United States economy and uncertain economic outlook could continue to cause lower consumer spending levels and mall customer traffic which could adversely affect our sales results and financial performance. In addition, we are highly dependent on a significant level of teenage and college-age spending on music/pop culture-licensed and music/pop culture-influenced products, and we likely would be adversely affected if economic conditions limited such spending.
15
War, terrorism and other catastrophes could negatively impact our customers, places where we do business and our expenses
The continued threat of terrorism, heightened security and military action in response to this threat, any future acts of terrorism, and significant natural disasters or other catastrophic events may cause disruption and create uncertainties that affect our business. To the extent that such disruptions or uncertainties negatively impact shopping patterns and/or shopping mall traffic, or adversely affect consumer confidence or the economy in general, our business, operating results and financial condition could be materially and adversely affected. A significant natural disaster or other catastrophic event affecting our facilities could materially affect our supply chain, our information systems and other aspects of our operations.
Our stock price could fluctuate substantially for reasons outside of our control
Our common stock is quoted on the Nasdaq Stock Market, which has experienced, and is likely to experience in the future, significant price and volume fluctuations, which could adversely affect our stock price without regard to our financial performance. In addition, we believe that factors such as quarterly fluctuations in our financial results and comparable store sales; announcements by other apparel, accessory, music and gift item retailers; the trading volume of our stock; changes in estimates of our performance by securities analysts; litigation; overall economic and political conditions, including the global economic downturn; the condition of the financial markets, including the credit crisis; and other events or factors outside of our control could cause our stock price to fluctuate substantially.
Environmental risks associated with the retail industry may result in significant costs and decreased sales
We are exposed to risks arising out of environmental matters and existing and potential laws relating to the protection of the environment. Adverse and unexpected weather conditions, including such conditions caused by the global climate change phenomena, could affect our supply chain, mall traffic and customer interest in our products. We receive apparel and other merchandise from foreign sources, both purchased directly in foreign markets and indirectly through domestic vendors with foreign sources. Stricter global and domestic greenhouse gas emission requirements may cause our vendors to incur higher costs, including increased transportation costs. There is a risk that we may occupy retail space that may require remediation to comply with environmental laws. In addition to potential liability for remediation costs, the cleanup process may cause our stores to be closed for an extended period of time, resulting in loss of sales.
|
UNRESOLVED STAFF COMMENTS
|
None.
|
PROPERTIES
|
We lease all of our existing store locations, with lease terms expiring between 2011 and 2021. As of the end of fiscal 2010, we had a total of approximately 1,160,000 leased store square feet for Hot Topic and approximately 382,000 leased store square feet for Torrid. The leases for most of the existing stores are for approximately ten-year terms and provide for minimum rent payments as well as contingent rent based upon a percent of sales in excess of the specified minimums.
We lease our headquarters and distribution center facility, located in City of Industry, California, which is approximately 250,000 square feet. Our lease expires in April 2014, with an option to renew for two more five-year terms, and the annual base rent is approximately $1.1 million. We own our distribution center in LaVergne, Tennessee, which is approximately 300,000 square feet.
16
The following chart shows, as of the end of fiscal 2010, the number of Hot Topic and Torrid stores operated within each state in the United States, Puerto Rico and Canada, as well as the aggregate number of Hot Topic and Torrid stores we operated as of the end of fiscal 2009:
|
Hot Topic, Inc. Stores
|
||||||||||||
|
Hot Topic Stores
|
Torrid Stores
|
Total Company
|
||||||||||
|
Alabama
|
7 | - | 7 | |||||||||
|
Alaska
|
3 | 2 | 5 | |||||||||
|
Arizona
|
17 | 7 | 24 | |||||||||
|
Arkansas
|
6 | - | 6 | |||||||||
|
California
|
79 | 48 | 127 | |||||||||
|
Colorado
|
13 | 2 | 15 | |||||||||
|
Connecticut
|
9 | 3 | 12 | |||||||||
|
Delaware
|
2 | - | 2 | |||||||||
|
Florida
|
40 | 5 | 45 | |||||||||
|
Georgia
|
13 | 3 | 16 | |||||||||
|
Hawaii
|
5 | - | 5 | |||||||||
|
Idaho
|
4 | 1 | 5 | |||||||||
|
Illinois
|
20 | 9 | 29 | |||||||||
|
Indiana
|
15 | 1 | 16 | |||||||||
|
Iowa
|
8 | 1 | 9 | |||||||||
|
Kansas
|
6 | - | 6 | |||||||||
|
Kentucky
|
9 | 1 | 10 | |||||||||
|
Louisiana
|
8 | 2 | 10 | |||||||||
|
Maine
|
2 | - | 2 | |||||||||
|
Maryland
|
14 | 4 | 18 | |||||||||
|
Massachusetts
|
18 | 2 | 20 | |||||||||
|
Michigan
|
20 | 2 | 22 | |||||||||
|
Minnesota
|
10 | 1 | 11 | |||||||||
|
Mississippi
|
4 | - | 4 | |||||||||
|
Missouri
|
13 | 3 | 16 | |||||||||
|
Montana
|
4 | - | 4 | |||||||||
|
Nebraska
|
4 | 1 | 5 | |||||||||
|
Nevada
|
7 | 2 | 9 | |||||||||
|
New Hampshire
|
5 | 1 | 6 | |||||||||
|
New Jersey
|
17 | 4 | 21 | |||||||||
|
New Mexico
|
7 | 1 | 8 | |||||||||
|
New York
|
27 | 5 | 32 | |||||||||
|
North Carolina
|
15 | 2 | 17 | |||||||||
|
North Dakota
|
4 | - | 4 | |||||||||
|
Ohio
|
27 | 5 | 32 | |||||||||
|
Oklahoma
|
8 | - | 8 | |||||||||
|
Oregon
|
7 | 3 | 10 | |||||||||
|
Pennsylvania
|
33 | 1 | 34 | |||||||||
|
Rhode Island
|
1 | - | 1 | |||||||||
|
South Carolina
|
7 | - | 7 | |||||||||
|
South Dakota
|
2 | 1 | 3 | |||||||||
|
Tennessee
|
11 | 1 | 12 | |||||||||
|
Texas
|
56 | 14 | 70 | |||||||||
|
Utah
|
7 | 2 | 9 | |||||||||
|
Vermont
|
1 | - | 1 | |||||||||
|
Virginia
|
19 | 3 | 22 | |||||||||
|
Washington
|
18 | 7 | 25 | |||||||||
|
West Virginia
|
5 | - | 5 | |||||||||
|
Wisconsin
|
11 | 2 | 13 | |||||||||
|
Wyoming
|
1 | - | 1 | |||||||||
|
Canada
|
3 | - | 3 | |||||||||
|
Puerto Rico
|
5 | 1 | 6 | |||||||||
|
FY 2010 Total
|
657 | 153 | 810 | |||||||||
|
FY 2009 Total
|
680 | 156 | 836 | |||||||||
17
|
LEGAL PROCEEDINGS
|
Our legal proceedings are discussed in more detail in “NOTE 9 – Commitments and Contingencies” contained in the consolidated financial statements and Notes included elsewhere in this annual report on Form 10-K.
ITEM 4. RESERVED
18
|
MARKET FOR REGISTRANT’S COMMON EQUITY, RELATED SHAREHOLDER MATTERS AND ISSUER PURCHASES OF EQUITY SECURITIES
|
Our common stock is traded on the Nasdaq Stock Market under the symbol “HOTT.” The following table shows, for the periods indicated, the high and low sales prices of our shares of common stock, as reported on the Nasdaq Stock Market. Such quotations represent inter-dealer prices without retail markup, markdown or commission and may not necessarily represent actual transactions.
|
2010 Fiscal Year Quarters
|
High
|
Low
|
||||||
|
First Quarter
|
$ | 9.96 | $ | 5.26 | ||||
|
Second Quarter
|
$ | 7.99 | $ | 4.67 | ||||
|
Third Quarter
|
$ | 6.26 | $ | 4.58 | ||||
|
Fourth Quarter
|
$ | 6.75 | $ | 5.31 | ||||
|
2009 Fiscal Year Quarters
|
High
|
Low
|
||||||
|
First Quarter
|
$ | 13.87 | $ | 8.13 | ||||
|
Second Quarter
|
$ | 12.50 | $ | 6.66 | ||||
|
Third Quarter
|
$ | 8.95 | $ | 6.53 | ||||
|
Fourth Quarter
|
$ | 7.80 | $ | 5.25 | ||||
On April 4, 2011, the last sales price of our common stock as reported on the Nasdaq Stock Market was $5.52 per share. As of April 4, 2011, there were approximately 179 holders of record of our common stock. This number does not reflect the actual number of beneficial holders of our common stock, which we believe is significantly higher.
We began to pay cash dividends during the first quarter of fiscal 2010. Cash dividends are discussed in more detail in “NOTE 4 – Cash Dividends” contained in the consolidated financial statements and Notes included elsewhere in this annual report on Form 10-K.
Please see “Item 12 – Security Ownership of Certain Beneficial Owners and Management and Related Shareholder Matters” included elsewhere in this annual report on Form 10-K for information about our equity compensation plans.
19
PERFORMANCE MEASUREMENT COMPARISON
The material in this section is not “soliciting material,” is not deemed “filed” with the SEC, and is not to be incorporated by reference into any filing of Hot Topic under the Securities Act or the Exchange Act.
The following graph shows a comparison of five-year cumulative total returns to shareholders for Hot Topic, the NASDAQ Composite Index and the NASDAQ Retail Trade Index for the period that commenced January 28, 2006 and ended on January 29, 2011. The graph assumes an initial investment of $100 and that all dividends have been reinvested.
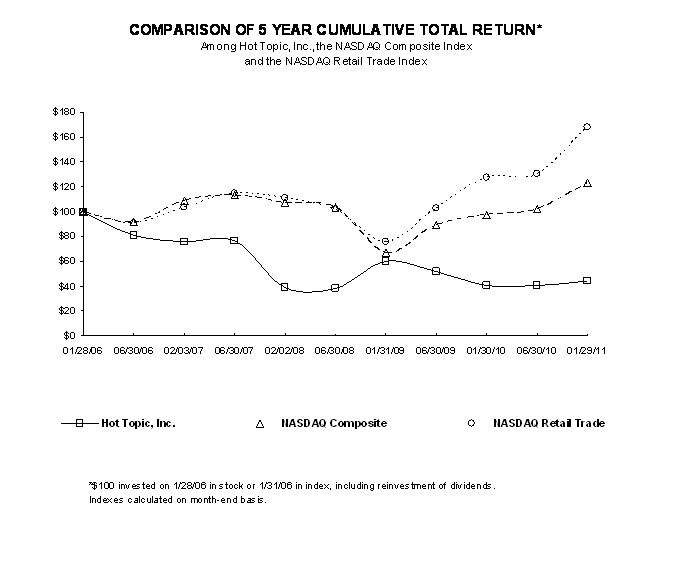
|
SELECTED FINANCIAL DATA
|
The following table summarizes selected financial data for each of the five most recent fiscal years. This data should be read in conjunction with “Management’s Discussion and Analysis of Financial Condition and Results of Operations” and the consolidated financial statements and Notes included elsewhere in this annual report on Form 10-K.
20
|
Fiscal Year
|
||||||||||||||||||||
|
2010
|
2009
|
2008
|
2007
|
2006
|
||||||||||||||||
|
(In thousands, except per share data, number of stores, comparable
store sales and sales per square foot)
|
||||||||||||||||||||
|
Statement of Operations Data:
|
||||||||||||||||||||
|
Net sales
|
$ | 708,244 | $ | 736,710 | $ | 761,074 | $ | 728,121 | $ | 751,558 | ||||||||||
|
Cost of goods sold, including buying, distribution and occupancy costs
|
474,917 | 480,453 | 487,769 | 476,677 | 502,408 | |||||||||||||||
|
Gross margin
|
233,327 | 256,257 | 273,305 | 251,444 | 249,150 | |||||||||||||||
|
Selling, general and administrative expenses
|
247,089 | 237,010 | 242,483 | 227,147 | 227,580 | |||||||||||||||
|
(Loss) income from operations
|
(13,762 | ) | 19,247 | 30,822 | 24,297 | 21,570 | ||||||||||||||
|
Other income and interest, net
|
336 | 519 | 1,670 | 1,934 | 1,450 | |||||||||||||||
|
(Loss) income before (benefit) provision for income taxes
|
(13,426 | ) | 19,766 | 32,492 | 26,231 | 23,020 | ||||||||||||||
|
(Benefit) provision for income taxes
|
(5,191 | ) | 7,886 | 12,750 | 10,219 | 9,394 | ||||||||||||||
|
Net (loss) income
|
$ | (8,235 | ) | $ | 11,880 | $ | 19,742 | $ | 16,012 | $ | 13,626 | |||||||||
|
(Loss) earnings per share:
|
||||||||||||||||||||
|
Basic
|
$ | (0.18 | ) | $ | 0.27 | $ | 0.45 | $ | 0.36 | $ | 0.31 | |||||||||
|
Diluted
|
$ | (0.18 | ) | $ | 0.27 | $ | 0.45 | $ | 0.36 | $ | 0.30 | |||||||||
|
Weighted average shares outstanding:
|
||||||||||||||||||||
|
Basic
|
44,554 | 44,134 | 43,789 | 44,005 | 44,167 | |||||||||||||||
|
Diluted
|
44,554 | 44,409 | 43,913 | 44,132 | 44,752 | |||||||||||||||
|
Selected Operating Data:
|
||||||||||||||||||||
|
Number of stores at year end
|
810 | 836 | 840 | 841 | 825 | |||||||||||||||
|
Comparable stores sales (decrease) increase
|
(5.3 | )% | (5.1 | )% | 1.0 | % | (4.4 | )% | (6.6 | )% | ||||||||||
|
Average store sales per square foot
|
$ | 401 | $ | 422 | $ | 444 | $ | 441 | $ | 477 | ||||||||||
|
Average store sales per store
|
$ | 762 | $ | 801 | $ | 841 | $ | 827 | $ | 887 | ||||||||||
|
Balance Sheet Data:
|
||||||||||||||||||||
|
Cash and short- and long-term investments
|
$ | 79,539 | $ | 131,257 | $ | 105,912 | $ | 53,281 | $ | 55,490 | ||||||||||
|
Working capital
|
113,932 | 158,531 | 125,582 | 97,796 | 91,267 | |||||||||||||||
|
Total assets
|
310,607 | 376,394 | 370,571 | 332,101 | 318,271 | |||||||||||||||
|
Shareholders’ equity
|
$ | 217,497 | $ | 277,047 | $ | 258,426 | $ | 235,153 | $ | 221,457 | ||||||||||
|
MANAGEMENT’S DISCUSSION AND ANALYSIS OF FINANCIAL CONDITION AND RESULTS OF OPERATIONS
|
The following discussion of our results of operations, financial condition and liquidity and other matters should be read in conjunction with the consolidated financial statements and Notes included in “Item 8 – Financial Statements and Supplementary Data” elsewhere in this annual report on Form 10-K. These statements have been prepared in conformity with accounting principles generally accepted in the United States of America and require our management to make estimates and assumptions that affect amounts reported and disclosed in the financial statements and related notes. Actual results could differ from these estimates. Our ability to achieve business objectives in fiscal 2011 and beyond will be dependent on many factors, known and unknown, including those outlined in the sections entitled “Cautionary Statement Regarding Forward Looking Disclosure” before Part I and “Item 1A – Risk Factors” included elsewhere in this annual report on Form 10-K.
21
OVERVIEW
Business We are a mall and web-based specialty retailer of apparel, accessories, music and gift items for young men and women whose lifestyles reflect a passion for music, fashion and pop culture. We operate under two primary concepts: Hot Topic and Torrid. Our business is discussed in more detail in “Item 1 – Business” included elsewhere in this annual report on Form 10-K.
Cost Reduction Plan We are in the process of implementing a cost reduction plan that, beginning in fiscal 2011, is expected to result in an estimated annual income improvement of approximately $13 million, pre-tax. The cost reduction plan, which is designed to meet the challenges of the current environment, involves closing approximately 50 underperforming stores, a majority of which are expected to close by the end of the first quarter of fiscal 2011. These closures will occur as a result of natural lease expirations, exercising lease kick out clauses and other negotiations. The cost reduction plan also includes reducing our home office and field management positions, reducing planned capital expenditures in fiscal 2011 to approximately $25 million from $31 million in fiscal 2010 and implementing other non-payroll overhead expense reduction initiatives. As of the end of fiscal 2010, we had reduced our home office and field management positions, closed 20 Hot Topic stores and two Torrid stores and begun implementing certain non-payroll overhead expense reduction initiatives as part of the cost reduction plan.
In connection with the cost reduction plan, we estimate that we will incur a total pre-tax charge of approximately $10.3 million. Approximately $6.2 million of the $10.3 million pre-tax charge will be non-cash. Of the $10.3 million total charge, we expect that approximately $8.5 million will be incurred for the write down of store assets and inventory, early lease terminations and store severance, partially offset by certain credits and allowances of $1.9 million; $1.9 million for non-store related severance and outplacement; and the remaining $1.8 million will be used to implement non-payroll overhead expense reduction initiatives.
The following table details information related to the cost reduction plan charges recorded during fiscal 2010 (in thousands). We did not incur any cost reduction plan charges in fiscal 2009 or 2008.
|
Non-store Related
|
||||||||||||||||
|
Severance and
|
Other Cost
|
|||||||||||||||
|
Store Related
|
Outplacement
|
Reduction
|
||||||||||||||
|
Closure Costs *
|
Costs
|
Plan Charges **
|
Total
|
|||||||||||||
|
Cost Reduction Plan liability
|
$ | (7,077 | ) | $ | (1,850 | ) | $ | (830 | ) | $ | (9,757 | ) | ||||
|
Cash payments
|
93 | 985 | - | 1,078 | ||||||||||||
|
Non-cash adjustments
|
6,497 | - | 830 | 7,327 | ||||||||||||
|
Balance at January 29, 2011
|
$ | (487 | ) | $ | (865 | ) | $ | - | $ | (1,352 | ) | |||||
* Store related closure costs represent charges related to the closure of approximately 50 underperforming stores. Such charges include the write down and accelerated depreciation of store assets, the write down of inventory, early lease terminations and store severance, partially offset by certain credits and allowances.
** Other cost reduction plan charges represent non-payroll overhead expense reduction initiatives.
We recorded charges related to the write down of store assets; store severance; non-store related severance and outplacement; and the implementation of non-payroll overhead expense reduction initiatives in selling, general and administrative expenses in our consolidated statements of operations. Charges related to the write down of store inventory; accelerated depreciation of store assets; and early lease terminations were recorded in cost of goods sold in our consolidated statements of operations.
22
Third Quarter Fiscal 2010 Non-Cash Impairment Charge and Fiscal 2011 Discontinued Operations During the third quarter of fiscal 2010, we concluded that ShockHound’s assets had become impaired due to its slower than expected revenue growth. Revenues from partnerships entered into in the earlier part of fiscal 2010, as well as other revenues, did not build as much as we had anticipated. In the third quarter of fiscal 2010, we recorded an impairment charge of $3 million to selling, general and administrative expenses in our consolidated statements of operations. The assessment of our long-lived assets for impairment is discussed in more detail in “NOTE 1 – Organization and Summary of Significant Accounting Policies” contained in the financial statements and Notes included elsewhere in this annual report on Form 10-K. In addition, during the first quarter of fiscal 2011, we announced that ShockHound’s operations will be discontinued. See “Fiscal 2011 Business Changes” below for more information concerning the discontinuation of ShockHound’s operations.
Fiscal 2011 Business Changes In March 2011, the Board approved certain business changes to better position us for growth. The business changes will involve discontinuing the operations of ShockHound; writing down unproductive inventory; and writing down fixed assets that are no longer critical to our strategic direction. In connection with the business changes, along with the severance costs related to recent changes in management, we estimate that we will incur a total pre-tax charge of approximately $15 million primarily in the first quarter of fiscal 2011, a portion of which will be a non-cash charge of approximately $9 million. Of the $15 million charge, we expect that approximately $6 million will be incurred for the write down of inventory that, due to an accounting estimate change, we believe is now unproductive; $3 million for severance and discontinuing ShockHound’s operations; $3 million for consulting fees for the review of our business and operations, including implementation of initiatives resulting from the review; and $3 million for the write down of certain fixed assets. The $15 million charge includes $0.6 million of additional charges that we expect to incur in fiscal 2011 related to the cost reduction plan implemented in fiscal 2010.
Comparable Store Sales and Store Count We consider a store comparable after it has been open for 15 full months. If a store is closed during a period, it is included in the computation of comparable store sales for that fiscal month, quarter and year-to-date period, only for the days in which the store was operating as compared to the full month in the comparable period. At the end of fiscal 2010, 631 of the 657 Hot Topic stores were included in the comparable store base, compared to 656 of the 680 stores open at the end of fiscal 2009. At the end of fiscal 2010, 150 of the 153 Torrid stores were included in the comparable store base, compared to 152 of the 156 stores open at the end of fiscal 2009. The following table shows our comparable store sales results by division for fiscal 2010 and other recent periods:
|
Fiscal Year
|
2010
|
2009
|
2008
|
2007
|
2006
|
|||||||||||||||
|
Hot Topic
|
(6.5 | )% | (5.6 | )% | 1.8 | % | (5.7 | )% | (8.0 | )% | ||||||||||
|
Torrid
|
(0.7 | )% | (2.9 | )% | (2.4 | )% | 2.5 | % | 4.1 | % | ||||||||||
|
Total Company
|
(5.3 | )% | (5.1 | )% | 1.0 | % | (4.4 | )% | (6.6 | )% | ||||||||||
In fiscal 2010, the comparable store sales decline in the Hot Topic division resulted from a decrease in fashion apparel, fashion accessories and license categories, partially offset by an increase in the music category. The comparable store sales decline at our Torrid division was due to declines in apparel, primarily skirts and dresses.
Our historical and planned store count is discussed in more detail in “Item 1 – Business” included elsewhere in this annual report on Form 10-K.
Cash Dividends We began to pay cash dividends during the first quarter of fiscal 2010. Cash dividends are discussed in more detail in “NOTE 4 – Cash Dividends” contained in the consolidated financial statements and Notes included elsewhere in this annual report on Form 10-K.
Segment Information We currently have one reportable segment given the similarities of the economic characteristics among the Hot Topic and Torrid concepts, and the relatively insubstantial business operations of our ShockHound concept.
23
Seasonality Our business, particularly at Hot Topic, is subject to seasonal influences. Refer to “Item 1 – Business” included elsewhere in this annual report on Form 10-K for further discussion about the seasonality of our business.
Key Performance Indicators There are several key indicators that we use to help us evaluate the financial condition and operating performance of our business, including:
Store Sales Productivity is used to assess the operational performance of each of our stores. Store productivity metrics include year over year store sales comparisons (or comparable store sales results), net store sales per average square foot, number of transactions per store, dollars per transaction, number of units sold per store and number of units per transaction.
Merchandise Margin is used to allocate a variety of resources to each of our concepts, determine initial mark-ups, mark-downs, inventory reserves, freight costs, etc. for each of the concepts and to measure the general performance of each of our stores. We consider merchandise margin to be the difference between net sales and certain costs associated with our merchandise, such as product costs, markdowns, freight, vendor allowances and inventory reserves.
Gross Margin is considered to be the difference between merchandise margin and buying, distribution and store occupancy costs.
Income from Operations is primarily driven by net sales, gross margin, our ability to control selling, general and administrative expenses, and our level of capital expenditures that affect depreciation expense.
RESULTS OF OPERATIONS
The following table shows, for the periods indicated, certain selected statement of operations data expressed as a percentage of net sales. The discussion that follows should be read in conjunction with this table:
|
Fiscal Year
|
||||||||||||
|
2010
|
2009
|
2008
|
||||||||||
|
Net sales
|
100.0 | % | 100.0 | % | 100.0 | % | ||||||
|
Cost of goods sold, including buying, distribution & occupancy costs
|
67.1 | % | 65.2 | % | 64.1 | % | ||||||
|
Gross margin
|
32.9 | % | 34.8 | % | 35.9 | % | ||||||
|
Selling, general and administrative expenses
|
34.9 | % | 32.2 | % | 31.9 | % | ||||||
|
(Loss) income from operations
|
(2.0 | )% | 2.6 | % | 4.0 | % | ||||||
|
Other income and interest, net
|
0.1 | % | 0.1 | % | 0.3 | % | ||||||
|
(Loss) income before (benefit) provision for income taxes
|
(1.9 | )% | 2.7 | % | 4.3 | % | ||||||
|
(Benefit) provision for income taxes
|
(0.7 | )% | 1.1 | % | 1.7 | % | ||||||
|
Net (loss) income
|
(1.2 | )% | 1.6 | % | 2.6 | % | ||||||
24
Fiscal 2010 Compared to Fiscal 2009
Net sales decreased approximately $28.5 million, or 3.9%, to $708.2 million in fiscal 2010 from $736.7 million in fiscal 2009. The components of this $28.5 million decrease in net sales are as follows:
|
Amount
|
|||
|
(in millions)
|
Description
|
||
| $ | (36.8 | ) |
Decrease in comparable net sales from Hot Topic stores in fiscal 2010 compared to fiscal 2009.
|
| (4.3 | ) |
Decrease in net sales due to the closure of 29 Hot Topic stores and six Torrid stores during fiscal 2010.
|
|
| (0.8 | ) |
Decrease in comparable net sales from Torrid stores in fiscal 2010 compared to fiscal 2009.
|
|
| 1.5 |
Increase in net sales from three new Torrid stores opened in fiscal 2010.
|
||
| 2.6 |
Increase in net sales from Hot Topic stores not yet qualifying as comparable stores (includes six new stores opened in fiscal 2010).
|
||
| 9.3 |
Increase in internet sales.
|
||
| $ | (28.5 | ) |
Total
|
Gross margin decreased approximately $23.0 million, or 9.0%, to $233.3 million in fiscal 2010 from $256.3 million in fiscal 2009. As a percentage of net sales, gross margin decreased to 32.9% in fiscal 2010 from 34.8% in fiscal 2009. The components of this 1.9 percentage point decrease in gross margin as a percentage of net sales are as follows:
25
|
%
|
Description
|
||
| (1.0 | ) |
Decrease in merchandise margin as a result of higher markdowns, partially offset by higher realized markup as a percentage of sales.
|
|
| (0.3 | ) |
Increase in store depreciation expense due to accelerated depreciation for stores closing as part of our cost reduction plan.
|
|
| (0.3 | ) |
Store occupancy percentage increase due to deleveraging on lower store sales.
|
|
| (0.2 | ) |
Distribution percentage increase mainly due to deleveraging on lower store sales and higher depreciation and freight expenses.
|
|
| (0.1 | ) |
Buying payroll percentage increase primarily due to deleveraging on lower store sales.
|
|
| (1.9 | )% |
Total
|
|
Selling, general and administrative expenses increased approximately $10.1 million, or 4.3%, to $247.1 million in fiscal 2010 from $237.0 million in fiscal 2009. As a percentage of net sales, selling, general and administrative expenses were 34.9% in fiscal 2010 compared to 32.2% in fiscal 2009. The components of this 2.7 percentage point increase in selling, general and administrative expenses as a percentage of net sales are as follows:
|
%
|
Description
|
||
| 0.7 |
Increase in store payroll expense primarily due to deleveraging on lower store sales and higher payroll and related costs.
|
||
| 0.6 |
Costs associated with the write-down of store assets, early lease terminations, and severance payments incurred as part of our cost reduction plan.
|
||
| 0.5 |
Increase in asset impairment expenses mainly due to the non-cash asset impairment charge taken for Shockhound.
|
||
| 0.3 |
Increase in general and administrative payroll and related costs and deleveraging on lower store sales, partially offset by a decrease in performance based bonuses.
|
||
| 0.3 |
Increase in marketing expenses primarily due to increased spending on internet and loyalty marketing, partially offset by decreased spending on marketing events.
|
||
| 0.2 |
Increase in depreciation of computer hardware and software.
|
||
| 0.1 |
Other store expense percentage increase primarily due to deleveraging on lower store sales and higher telecommunication costs, partially offset by lower repair and maintenance costs and inventory service costs.
|
||
| 2.7 | % |
Total
|
|
Loss from operations was $13.8 million in fiscal 2010 compared to income of $19.2 million in fiscal 2009. As a percentage of net sales, loss from operations was 2.0% in fiscal 2010 compared to income of 2.6% in fiscal 2009. Operating loss on an average store basis was approximately $17,000 in fiscal 2010 compared to operating income of $23,000 in fiscal 2009. Net loss included net losses from our ShockHound concept of $4.1 million, or $0.09 per share, in fiscal 2010 compared to $3.1 million, or $0.07 per share, in fiscal 2009.
As a percentage of net sales, other interest and income, net, remained the same at 0.1% in fiscal 2010 and 2009.
26
Our effective tax rate was 38.7% and 39.9% in fiscal 2010 and 2009, respectively. The decrease was primarily due to lower effective state income tax rates and a decrease in the liability associated with unrecognized tax benefits.
Fiscal 2009 Compared to Fiscal 2008
Net sales decreased approximately $24.4 million, or 3.2%, to $736.7 million in fiscal 2009 from $761.1 million in fiscal 2008. The components of this $24.4 million decrease in net sales are as follows:
|
Amount
|
|||
|
(millions)
|
Description
|
||
| $ | (30.5 | ) |
Decrease in comparable net sales from Hot Topic stores in fiscal 2009 compared to fiscal 2008.
|
| (6.1 | ) |
Decrease in net sales due to the closure of 3 Hot Topic stores and 4 Torrid stores during fiscal 2009.
|
|
| (3.6 | ) |
Decrease in comparable net sales from Torrid stores in fiscal 2009 compared to fiscal 2008.
|
|
| 1.1 |
Increase in net sales from 2 new Hot Topic stores opened in fiscal 2009 and from 6 Hot Topic stores not yet qualifying as comparable stores.
|
||
| 3.2 |
Increase in net sales from 1 new Torrid stores opened in fiscal 2009 and from 3 Torrid stores not yet qualifying as comparable stores.
|
||
| 11.5 |
Increase in Internet sales.
|
||
| $ | (24.4 | ) |
Total
|
In both fiscal 2009 and 2008, Hot Topic and Torrid each had annual average store volumes, excluding Internet sales, of $0.8 million. Hot Topic sales of apparel category merchandise, as a percentage of total net sales, was 53% in fiscal 2009 compared to 55% in fiscal 2008. Torrid sales of apparel category merchandise, as a percentage of total net sales, was 76% in fiscal 2009 compared to 78% in fiscal 2008.
Gross margin decreased approximately $17.0 million to $256.3 million in fiscal 2009 from $273.3 million in fiscal 2008. As a percentage of net sales, gross margin decreased to 34.8% in fiscal 2009 from 35.9% in fiscal 2008. The components of this 1.1 percentage point decrease in gross margin as a percentage of net sales are as follows:
|
%
|
Description
|
||
| (0.9 | ) |
Decrease in merchandise margin as a result of higher markdowns, partially offset by higher realized markup.
|
|
| (0.2 | ) |
Increase in store depreciation related to higher expenses for computer hardware and software and due to deleveraging on lower store sales.
|
|
| (0.1 | ) |
Increase in buying payroll, primarily due to deleveraging on lower store sales.
|
|
| 0.1 |
Decrease in distribution expenses, primarily due to lower freight and distribution center depreciation, partially offset by deleveraging on lower store sales.
|
||
| (1.1 | )% |
Total
|
|
27
Selling, general and administrative expenses decreased approximately $5.5 million to $237.0 million in fiscal 2009 from $242.5 million in fiscal 2008. As a percentage of net sales, selling, general and administrative expenses were 32.2% in fiscal 2009 compared to 31.9% in fiscal 2008. The components of this 0.3 percentage point increase in selling, general and administrative expenses as a percentage of net sales are as follows:
|
%
|
Description
|
||
| 0.5 |
Deleveraging on store payroll due to lower store sales and higher store payroll and related costs, partially offset by lower store performance based bonuses.
|
||
| 0.2 |
Increase in other store expenses, primarily due to an increase in store repair and maintenance expenses and higher processing fees for sales transactions, partially offset by lower telecommunications costs.
|
||
| (0.1 | ) |
Decrease in preopening costs as a result of fewer new stores and expenses related to launching our online music site in 2008.
|
|
| (0.1 | ) |
Decrease in marketing expenses, primarily due to reduced spending on marketing sponsorships.
|
|
| (0.2 | ) |
Decrease in general and administrative payroll, due to performance based bonuses, partially offset by higher payroll and related costs.
|
|
| 0.3 | % |
Total
|
|
Income from operations decreased to $19.2 million in fiscal 2009 from $30.8 million in fiscal 2008. As a percentage of net sales, income from operations was 2.6% in fiscal 2009 compared to 4.0% in fiscal 2008. Operating income on an average store basis was approximately $23,000 in fiscal 2009 compared to $37,000 in fiscal 2008. Net income included net losses from our ShockHound concept of $3.1 million ($0.07 per share) in fiscal 2009 compared to $2.3 million ($0.05 per share) in fiscal 2008.
As a result of lower interest rate yields, interest income, net of interest expense, and other income as a percentage of sales was 0.1% in fiscal 2009 compared to 0.3% in 2008.
Our effective tax rate was 39.9% and 39.2% in fiscal 2009 and 2008, respectively. The increase was primarily due to a decrease in non-taxable income arising from lower interest rate yields, and an increase in the liability associated with unrecognized tax benefits, partially offset by non-taxable income from deferred compensation investment gains and lower effective state income tax rates.
QUARTERLY RESULTS AND SEASONALITY
Our quarterly results of operations may fluctuate materially depending on, among other things, the timing of store closings, store openings and related pre-opening and other startup expenses, net sales contributed by new stores, increases or decreases in comparable store sales, releases of new music, film, television and music/pop culture-related products, shifts in timing of certain holidays, changes in our merchandise mix and overall economic conditions.
Our business, particularly our Hot Topic division, is also subject to seasonal influences. Refer to “Item 1 – Business” under the caption “Seasonality” included elsewhere in this annual report on Form 10-K for further discussion about the seasonality of our business.
28
The following table shows certain statements of operations and selected operating data for each of our last eight fiscal quarters (13-week periods). The quarterly statements of operations data and selected operating data shown below were derived from our unaudited financial statements, which in the opinion of management contain all adjustments (consisting only of normal recurring adjustments) necessary for fair presentation. Results in any quarter are not necessarily indicative of results that may be achieved for a full year.
|
Fiscal Year 2010
|
Fiscal Year 2009
|
|||||||||||||||||||||||||||||||
|
First
|
Second
|
Third
|
Fourth
|
First
|
Second
|
Third
|
Fourth
|
|||||||||||||||||||||||||
|
Statements of Operations Data:
|
(In thousands, except selected operating and per share data)
|
|||||||||||||||||||||||||||||||
|
Net sales
|
$ | 162,647 | $ | 150,007 | $ | 183,219 | $ | 212,371 | $ | 175,125 | $ | 157,793 | $ | 189,568 | $ | 214,224 | ||||||||||||||||
|
Gross margin
|
54,463 | 46,022 | 64,550 | 68,292 | 60,130 | 49,658 | 69,894 | 76,575 | ||||||||||||||||||||||||
|
(Loss) income from operations
|
(2,993 | ) | (10,359 | ) | 321 | (731 | ) | 1,852 | (5,426 | ) | 9,634 | 13,187 | ||||||||||||||||||||
|
Net (loss) income
|
$ | (1,778 | ) | $ | (6,269 | ) | $ | 390 | $ | (578 | ) | $ | 1,225 | $ | (3,177 | ) | $ | 5,849 | $ | 7,983 | ||||||||||||
|
(Loss) earnings per share:
|
||||||||||||||||||||||||||||||||
|
Basic
|
$ | (0.04 | ) | $ | (0.14 | ) | $ | 0.01 | $ | (0.01 | ) | $ | 0.03 | $ | (0.07 | ) | $ | 0.13 | $ | 0.18 | ||||||||||||
|
Diluted
|
$ | (0.04 | ) | $ | (0.14 | ) | $ | 0.01 | $ | (0.01 | ) | $ | 0.03 | $ | (0.07 | ) | $ | 0.13 | $ | 0.18 | ||||||||||||
|
Weighted average shares outstanding:
|
||||||||||||||||||||||||||||||||
|
Basic
|
44,398 | 44,563 | 44,616 | 44,638 | 44,000 | 44,064 | 44,143 | 44,331 | ||||||||||||||||||||||||
|
Diluted
|
44,398 | 44,563 | 44,662 | 44,638 | 44,679 | 44,064 | 44,497 | 44,395 | ||||||||||||||||||||||||
|
Selected Operating Data:
|
||||||||||||||||||||||||||||||||
|
Comparable store sales
|
(8.7 | )% | (6.4 | )% | (5.0 | )% | (2.1 | )% | 7.1 | % | (7.7 | )% | (5.0 | )% | (11.5 | )% | ||||||||||||||||
|
Stores open at end of period
|
837 | 834 | 835 | 810 | 837 | 835 | 836 | 836 | ||||||||||||||||||||||||
LIQUIDITY AND CAPITAL RESOURCES
During fiscal 2010, our primary use of cash was to fund cash dividend payments totaling $57.0 million, $44.5 million for the $1.00 per share special one-time cash dividend paid in the first quarter of fiscal 2010 and $12.5 million ($3.1 million paid in each quarter of fiscal 2010) for the $0.07 per share regular quarterly cash dividends initiated in the first quarter of fiscal 2010. Our cash dividends are discussed in more detail in “NOTE 4 – Cash Dividends” contained in the consolidated financial statements and Notes included elsewhere in this annual report on Form 10-K. During the fourth quarter of fiscal 2010, we made a total cash outlay of $1.1 million related to the cost reduction plan, which is discussed in more detail in “NOTE 2 – Cost Reduction Plan” contained in the consolidated financial statements and Notes included elsewhere in this annual report on Form 10-K. Other uses of cash during the last three fiscal years have been to purchase merchandise inventories, improve our information technology infrastructure and fund store remodels, relocations and to a lesser extent, new store openings. In the past we have also made periodic repurchases of our common stock (discussed in more detail in “NOTE 12 – Share Repurchase” contained in the consolidated financial statements and Notes included elsewhere in this annual report on Form 10-K. We have typically satisfied our cash requirements principally from cash flows from operations and we also maintain a $5.0 million unsecured credit agreement (discussed in more detail in “NOTE 8 – Bank Credit Agreement” contained in the consolidated financial statements and Notes included elsewhere in this annual report on Form 10-K).
Cash, cash equivalents and short- and long-term investments, including auction rate securities, held by us were $79.5 million and $131.3 million as of the end of fiscal 2010 and 2009, respectively, and are discussed in more detail in “NOTE 1 – Organization and Summary of Significant Accounting Policies” contained in the consolidated financial statements and Notes included elsewhere in this annual report on Form 10-K. We believe our current cash balances and cash generated from operations will be sufficient to fund our operations through at least the next 12 months. Auctions representing the auction rate securities we hold have continued to fail and will limit our ability to liquidate these investments for some period of time. However, we do not believe the auction failures will impact our ability to fund our working capital needs, capital expenditures or other business requirements.
29
Working capital was $113.9 million and $158.5 million for fiscal 2010 and 2009, respectively. The $44.6 million decrease in working capital in fiscal 2010 from 2009 is primarily attributable to the cash dividend payments totaling $57.0 million made in fiscal 2010.
Net cash flows provided by operating activities were $35.0 million and $46.0 million in fiscal 2010 and 2009, respectively. The $11.0 million decrease in net cash provided by operating activities in fiscal 2010 as compared to fiscal 2009 was primarily attributable to decreases in net income and deferred taxes, along with increases in prepaid expenses and other current assets. The decrease in net cash provided by operating activities was partially offset by increases in income taxes payable and fixed asset impairment.
Net cash flows used in investing activities were $45.6 million and $20.6 million in fiscal 2010 and 2009, respectively. The $25.0 million increase in net cash used in investing activities in fiscal 2010 as compared to fiscal 2009 was attributable to an $18.3 million increase in purchases of short- and long-term investments, net of proceeds and a $6.7 million increase in purchases of property and equipment.
Net cash flows used in financing activities were $56.0 million in fiscal 2010 compared to $2.2 million provided by financing activities in fiscal 2009. The increase in cash flows used in financing activities was primarily attributable to the $57.0 million in cash dividends paid in fiscal 2010.
We anticipate we will spend approximately $25 million on capital expenditures in fiscal 2011. Of the $25 million, we plan to spend approximately $17 million for store construction and other improvements to existing stores, including remodeling or relocating them (refer to “Item 1 – Business” included elsewhere in this annual report on Form 10-K for detail on our store expansion activity). We plan to spend the remaining capital expenditures on various improvements in our information technology infrastructure, including technological improvements at the store level, the purchase of new computer hardware and software and the further development and improvement of our Internet sites.
The following table summarizes our contractual obligations as of the end of fiscal 2010, and the timing and effect that such commitments are expected to have on our liquidity and capital requirements in future periods:
|
Payments due by period (in thousands)
|
||||||||||||||||||||
|
Contractual obligations
|
Total
|
Less Than
1 Year
|
1-3 Years
|
3-5 Years
|
More than 5
Years
|
|||||||||||||||
|
Operating leases¹
|
$ | 248,611 | $ | 57,767 | $ | 90,586 | $ | 58,641 | $ | 41,617 | ||||||||||
|
Purchase obligations
|
82,198 | 82,198 | - | - | - | |||||||||||||||
|
Letters of credit and other obligations
|
8,545 | 4,473 | 3,322 | 750 | - | |||||||||||||||
|
Income tax audit settlements ²
|
430 | 430 | - | - | - | |||||||||||||||
|
Total contractual obligations
|
$ | 339,784 | $ | 144,868 | $ | 93,908 | $ | 59,391 | $ | 41,617 | ||||||||||
|
(1)
|
See “NOTE 9 – Commitments and Contingencies” contained in the consolidated financial statements and Notes included elsewhere in this annual report on Form 10-K for additional disclosure related to operating lease obligations.
|
|
(2)
|
The $0.4 million of income tax audit settlements relate to certain open audits we expect to be fully settled in fiscal 2011 and to gross unrecognized tax benefits for which the statutes of limitations are expected to expire in fiscal 2011. Due to the uncertainty regarding the timing of future cash outflows associated with other noncurrent unrecognized tax benefits of $1.6 million, we are unable to make a reliable estimate of the periods of cash settlement with the respective tax authorities and have not included such amount in the contractual obligations table above.
|
30
CRITICAL ACCOUNTING POLICIES AND ESTIMATES
Management’s discussion and analysis of our financial condition and results of operations are based upon our consolidated financial statements, which have been prepared in accordance with accounting principles generally accepted in the United States. The preparation of these financial statements requires us to make estimates and judgments that affect the reported amounts of assets, liabilities, revenues and expenses and related disclosures of contingent assets and liabilities. On an ongoing basis, we evaluate estimates, including those related primarily to inventories, long-lived assets and contingencies. We base our estimates on historical experience and on various other assumptions that we believe to be reasonable under the circumstances, the results of which form the basis for making judgments about the carrying values of assets and liabilities that are not readily apparent from other sources. Actual results may differ from these estimates under different assumptions or conditions.
We believe the following critical accounting policies affect the more significant judgments and estimates used in the preparation of our consolidated financial statements. For a further discussion about the application of these and other accounting policies, refer to “NOTE 1 – Organization and Summary of Significant Accounting Policies” contained in the consolidated financial statements and Notes included elsewhere in this annual report on Form 10-K.
Inventories Inventories are valued at the lower of average cost or market, on a weighted average cost basis, using the retail method. Under the retail method, inventory is stated at its current retail selling value and then is converted to a cost basis by applying an average cost factor that represents the average cost-to-retail ratio based on beginning inventory and the purchase activity for the month. Throughout the year, we review our inventory levels in order to identify slow-moving merchandise and use permanent markdowns to sell through selected merchandise. We record a charge to cost of goods sold for permanent markdowns. Inherent in the retail method are certain significant management judgments and estimates including initial merchandise markup, future sales, markdowns and shrinkage, which significantly impact the ending inventory valuation at cost and the resulting gross margins. To the extent our estimated markdowns at period-end prove to be insufficient, additional future markdowns will need to be recorded. Physical inventories are conducted during the year to determine actual inventory on hand and shrinkage. We accrue our estimated inventory shrinkage for the period between the last physical count and current balance sheet date. Thus, the difference between actual and estimated shrink amounts may cause fluctuations in quarterly results, but not for the full fiscal year results.
Valuation of Long-Lived Assets We assess the impairment of long-lived assets whenever events or changes in circumstances indicate that the carrying value may not be recoverable. For our Hot Topic and Torrid concepts, we group and evaluate long-lived assets for impairment at the individual store level, which is the lowest level at which individual cash flows can be identified. For the purposes of evaluating the impairment of ShockHound, our e-space music concept launched in the third quarter of fiscal 2008, we consider all assets within ShockHound to be one asset group and the lowest level at which individual cash flows can be identified. Factors we consider important that could trigger an impairment review of our stores or online operations include a significant underperformance relative to expected historical or projected future operating results, a significant change in the manner of the use of the asset or a significant negative industry or economic trend. When we determine that the carrying value of long-lived assets may not be recoverable based upon the existence of one or more of the aforementioned factors, impairment is measured based on a projected discounted cash flow method using a discount rate determined by management. These cash flows are calculated by netting future estimated sales against associated merchandise costs and other related expenses such as payroll, occupancy and marketing. The estimated sales, net of the aforementioned costs and expenses, used for this nonrecurring fair value measurement is considered a Level 3 input as defined in “NOTE 7 – Fair Value Measurements” contained in the consolidated financial statements and Notes included elsewhere in this annual report on Form 10-K. We have recorded impairment charges in fiscal 2010 and prior years. In addition, in the event future store performance is lower than forecasted results, future cash flows may be lower than expected, which could result in future impairment charges. While we believe recently opened stores will provide sufficient cash flow, material changes in results could result in future impairment charges.
Revenue Recognition Revenue is generally recognized at our retail store locations at the point at which the customer receives and pays for the merchandise at the register. For online sales, revenue is recognized upon delivery to the customer. Sales are recognized net of merchandise returns, which are reserved for based on historical experience. Revenue from gift cards and store merchandise credits is recognized at the time of redemption. Shipping and handling revenues from our websites are included as a component of net sales.
31
We recognize estimated gift card breakage as a component of net sales in proportion to actual gift card redemptions over the period that remaining gift card values are redeemed. Gift card breakage is income recognized due to the non-redemption of a portion of gift cards sold by us for which liability was recorded in prior periods. While customer redemption patterns result in estimated gift card breakage, which approximates 5 to 6%, changes in our customers’ behavior could impact the amount that ultimately is unused and could affect the amount recognized as a component of net sales.
Vendor Allowances We receive certain allowances from our vendors primarily related to damaged merchandise, markdowns and pricing. Allowances received from vendors related to damaged merchandise and pricing are reflected as a reduction of inventory in the period they are received and allocated to cost of sales during the period in which the items are sold. Markdown allowances received from vendors are reflected as reductions to cost of sales in the period they are received as these allowances are received after goods have been sold or marked down.
Stock-Based Payments We estimate the fair value of stock options granted using the Black-Scholes option-pricing formula and a single option award approach. This fair value is then amortized over the requisite service periods of the awards. This option-pricing model requires the input of highly subjective assumptions, including the option’s expected life, price volatility of the underlying stock, risk free interest rate and expected dividend rate. As stock-based compensation expense is based on awards ultimately expected to vest, it has been reduced for estimated forfeitures. Forfeitures are estimated at the time of grant and revised, if necessary, in subsequent periods if actual forfeitures differ from those estimates. Forfeitures are estimated based on historical experience.
Self-Insurance We are self-insured for certain losses related to medical and workers compensation claims although we maintain stop loss coverage with third party insurers to limit our total liability exposure. The estimate of our liability for these claims involves uncertainty since we must use judgment to estimate the ultimate cost that will be incurred to settle reported claims and unreported claims for incidents incurred but not reported as of the balance sheet date. When estimating our self-insurance liability, we consider a number of factors, which include historical claim experience and valuations provided by independent third party actuaries. As claims develop, the actual ultimate losses may differ from actuarial estimates. Therefore, an analysis is performed quarterly to determine if modifications to the accrual are required.
Rent Expense Rent expense under our operating leases typically provides for fixed non-contingent rent escalations. We recognize rent expense on a straight-line basis over the non-cancelable term of the lease, commencing when we take possession of the property. Construction allowances are recorded as a deferred rent liability, which we amortize as a reduction of rent expense over the non-cancelable term of each lease.
Income Taxes We account for income taxes using the liability method. Under this method, deferred tax assets and liabilities are determined based on differences between financial reporting bases and tax bases of assets and liabilities and are measured using the enacted tax rates expected to apply to taxable income in the periods in which the deferred tax asset or liability is expected to be realized or settled. Deferred tax assets are reduced by valuation allowances if we believe it is more likely than not that some portion or the entire asset will not be realized.
We prescribe a recognition threshold and a measurement attribute for the financial statement recognition and measurement of tax positions taken or expected to be taken in a tax return. For those benefits to be recognized, a tax position must be more likely than not to be sustained upon examination by taxing authorities. The amount recognized is measured as the largest amount of benefit that has a greater than 50% likelihood of being realized upon ultimate settlement. We include interest and penalties related to uncertain tax positions in income tax expense.
INFLATION
We do not believe that inflation has had a material adverse effect on our net sales or results of operations in the past. However, we cannot assure that our business will not be affected by inflation in the future.
32
|
QUANTITATIVE AND QUALITATIVE DISCLOSURES ABOUT MARKET RISK
|
We are not a party to any derivative financial instruments. Our exposure to market risk primarily relates to changes in interest rates on our investments with maturities of less than three months (which are considered to be cash and cash equivalents) and short- and long-term investments with maturities in excess of three months. A 100 basis point change in interest rates over a three month period would not have a material impact on the fair value of our investment portfolio as of the end of fiscal 2010. Cash, cash equivalents and short- and long-term investments, including auction rate securities, are discussed in more detail in “NOTE 1 – Organization and Summary of Significant Accounting Policies” contained in the consolidated financial statements and Notes included elsewhere in this annual report on Form 10-K.
|
FINANCIAL STATEMENTS AND SUPPLEMENTARY DATA
|
Our consolidated financial statements and notes listed in Part IV, Item 15(a)(1) are incorporated herein by reference.
|
CHANGES IN AND DISAGREEMENTS WITH ACCOUNTANTS ON ACCOUNTING AND FINANCIAL DISCLOSURE
|
Not applicable.
|
CONTROLS AND PROCEDURES
|
Conclusion Regarding the Effectiveness of Disclosure Controls and Procedures Our management maintains disclosure controls and procedures that are designed to ensure that the information required to be disclosed in our reports under the Exchange Act is recorded, processed, summarized and reported within the time periods specified in the SEC’s rules and forms, and that such information is accumulated and communicated to management, including the Chief Executive Officer, or CEO, and Chief Financial Officer, or CFO, as appropriate, to allow timely decisions regarding required disclosure.
We have carried out an evaluation, under the supervision and with the participation of our management, including our CEO and CFO, of the effectiveness of the design and operation of our disclosure controls and procedures as of the end of our most recent fiscal quarter. Based upon that evaluation, our CEO and CFO concluded that our disclosure controls and procedures (as defined in Rules 13a-15(e) and 15d-15(e) of the Exchange Act) are effective as of the end of our most recent fiscal quarter.
33
Report of Management on Internal Control Over Financial Reporting Our management is responsible for establishing and maintaining adequate internal control over financial reporting, as such term is defined in Exchange Act Rules 13a-15(f). Our internal control over financial reporting is a process designed to provide reasonable assurance regarding the reliability of financial reporting and the preparation of financial statements for external purposes in accordance with generally accepted accounting principles. Internal control over financial reporting includes those policies and procedures that (1) pertain to the maintenance of records that, in reasonable detail, accurately and fairly reflect the transactions and dispositions of our assets; (2) provide reasonable assurance that transactions are recorded as necessary to permit preparation of financial statements in accordance with generally accepted accounting principles, and that our receipts and expenditures are being made only in accordance with authorizations of our management and directors; and (3) provide reasonable assurance regarding prevention or timely detection of unauthorized acquisition, use, or disposition of our assets that could have a material effect on the financial statements.
Our management assessed the effectiveness of our internal control over financial reporting as of the end of fiscal 2010. In making this assessment, we used the criteria set forth by COSO in Internal Control-Integrated Framework. Our management concluded that, as of the end of fiscal 2010, our internal control over financial reporting was effective based on the criteria set forth by COSO in Internal Control-Integrated Framework.
Changes in Internal Control Over Financial Reporting There has been no change in our internal control over financial reporting in our most recent fiscal quarter that has materially affected, or is reasonably likely to materially affect, our internal control over financial reporting. Ernst & Young LLP, the independent registered public accounting firm that audited the financial statements included in this Annual Report on Form 10-K, has issued an attestation report on our internal control over financial reporting.
34
REPORT OF INDEPENDENT REGISTERED PUBLIC ACCOUNTING FIRM
The Board of Directors and Shareholders of Hot Topic, Inc.
We have audited Hot Topic, Inc.’s internal control over financial reporting as of January 29, 2011, based on criteria established in Internal Control—Integrated Framework issued by the Committee of Sponsoring Organizations of the Treadway Commission (the COSO criteria). Hot Topic, Inc.’s management is responsible for maintaining effective internal control over financial reporting, and for its assessment of the effectiveness of internal control over financial reporting included in the accompanying Report of Management on Internal Control over Financial Reporting. Our responsibility is to express an opinion on the company’s internal control over financial reporting based on our audit.
We conducted our audit in accordance with the standards of the Public Company Accounting Oversight Board (United States). Those standards require that we plan and perform the audit to obtain reasonable assurance about whether effective internal control over financial reporting was maintained in all material respects. Our audit included obtaining an understanding of internal control over financial reporting, assessing the risk that a material weakness exists, testing and evaluating the design and operating effectiveness of internal control based on the assessed risk, and performing such other procedures as we considered necessary in the circumstances. We believe that our audit provides a reasonable basis for our opinion.
A company’s internal control over financial reporting is a process designed to provide reasonable assurance regarding the reliability of financial reporting and the preparation of financial statements for external purposes in accordance with generally accepted accounting principles. A company’s internal control over financial reporting includes those policies and procedures that (1) pertain to the maintenance of records that, in reasonable detail, accurately and fairly reflect the transactions and dispositions of the assets of the company; (2) provide reasonable assurance that transactions are recorded as necessary to permit preparation of financial statements in accordance with generally accepted accounting principles, and that receipts and expenditures of the company are being made only in accordance with authorizations of management and directors of the company; and (3) provide reasonable assurance regarding prevention or timely detection of unauthorized acquisition, use or disposition of the company’s assets that could have a material effect on the financial statements.
Because of its inherent limitations, internal control over financial reporting may not prevent or detect misstatements. Also, projections of any evaluation of effectiveness to future periods are subject to the risk that controls may become inadequate because of changes in conditions, or that the degree of compliance with the policies or procedures may deteriorate.
In our opinion, Hot Topic, Inc. maintained, in all material respects, effective internal control over financial reporting as of January 29, 2011, based on the COSO criteria.
We also have audited, in accordance with the standards of the Public Company Accounting Oversight Board (United States), the consolidated balance sheets of Hot Topic, Inc. as of January 29, 2011 and January, 30, 2010, and the related consolidated statements of operations, shareholders' equity and comprehensive (loss) income, and cash flows for each of the three years in the period ended January 29, 2011, and our report dated April 6, 2011 expressed unqualified opinion thereon.
/s/ ERNST & YOUNG LLP
Los Angeles, California
April 6, 2011
35
ITEM 9B. OTHER INFORMATION
Not applicable.
36
|
DIRECTORS, EXECUTIVE OFFICERS AND CORPORATE GOVERNANCE
|
See the section entitled “Executive Officers” in Part I, Item 1 hereof for information regarding our executive officers.
The information required by this item with respect to directors is incorporated by reference to the information appearing under the caption “Election of Directors,” contained in our Definitive Proxy Statement which will be filed with the SEC within 120 days of January 29, 2011 pursuant to Regulation 14A in connection with the solicitation of proxies for our Annual Meeting of Shareholders to be held on June 7, 2011, or the Proxy Statement.
Certain other information required by this item is incorporated by reference to the information appearing under the caption “Section 16(a) Beneficial Ownership Reporting Compliance” in the Proxy Statement.
We have adopted Standards of Business Ethics that apply to all of our officers, directors and employees. The Standards of Business Ethics is available on our investor relations website at investorrelations.hottopic.com. If we make any substantive amendments to the Standards of Business Ethics or grant any waiver from a provision of the Standards of Business Ethics to any executive officer or director, we will promptly disclose the nature of the amendment or waiver on our website, as well as via any other means then required by Nasdaq listing standards or applicable law.
|
EXECUTIVE COMPENSATION
|
The information required by this item is incorporated by reference to the information appearing under the captions “Executive Compensation,” “Compensation Committee Report” and “Compensation Committee Interlocks and Insider Participation” in the Proxy Statement.
|
SECURITY OWNERSHIP OF CERTAIN BENEFICIAL OWNERS AND MANAGEMENT AND RELATED SHAREHOLDER MATTERS
|
The information required by this item is incorporated by reference to the information appearing under the captions “Security Ownership of Certain Beneficial Owners and Management” and “Equity Compensation Plan Information” in the Proxy Statement.
|
CERTAIN RELATIONSHIPS AND RELATED TRANSACTIONS, AND DIRECTOR INDEPENDENCE
|
The information required by this item is incorporated by reference to the information appearing under the captions “Election of Directors” and “Certain Transactions” in the Proxy Statement.
|
PRINCIPAL ACCOUNTANT FEES AND SERVICES
|
The information required by this item is incorporated by reference to the information appearing under the caption “Ratification of Selection of Independent Auditors” in the Proxy Statement.
37
|
EXHIBITS AND FINANCIAL STATEMENT SCHEDULES
|
(a)(1) Consolidated Financial Statements
The following consolidated financial statements required by this item are submitted in a separate section beginning on page F-1 of this Annual Report on Form 10-K:
| Page | |
|
Report of Independent Registered Public Accounting Firm
|
F-1 |
|
Consolidated Statements of Operations for the years ended January 29, 2011, January 30, 2010 and January 31, 2009
|
F-2 |
|
Consolidated Balance Sheets as of January 29, 2011 and January 30, 2010
|
F-3 |
|
Consolidated Statements of Shareholders’ Equity and Comprehensive (Loss) Income for the years ended January 29, 2011, January 30, 2010, and January 31, 2009
|
F-4 |
|
Consolidated Statements of Cash Flows for the years ended January 29, 2011, January 30, 2010, and January 31, 2009
|
F-5 |
|
Notes to Consolidated Financial Statements
|
F-6 |
(a)(2) Financial Statement Schedules
Schedule II – Valuation and Qualifying Accounts
All schedules for which provision is made in the applicable accounting regulations of the Securities and Exchange Commission other than the one listed above are not required under the related instructions or are not applicable, and therefore, have been omitted.
|
For Fiscal 2010, 2009 and 2008
|
||||||||||||||||
|
Balance at
|
Charged to
|
|||||||||||||||
|
Beginning of
|
Costs and
|
Deductions/
|
Balance at
|
|||||||||||||
|
Year
|
Expenses
|
Write-offs
|
End of Year
|
|||||||||||||
|
Fiscal 2010
|
||||||||||||||||
|
Allowance for sales returns
|
$ | 363 | $ | (76 | ) | $ | - | $ | 287 | |||||||
|
Fiscal 2009
|
||||||||||||||||
|
Allowance for sales returns
|
$ | 393 | $ | (30 | ) | $ | - | $ | 363 | |||||||
|
Fiscal 2008
|
||||||||||||||||
|
Allowance for sales returns
|
$ | 399 | $ | (6 | ) | $ | - | $ | 393 | |||||||
38
(a)(3) Index to Exhibits—See Item 15(b) below.
(b) Exhibits
The exhibits listed under Item 15(b) hereof are filed with, and incorporated by reference into, this Annual Report on Form 10-K. Management contracts or compensatory plans or arrangements required to be filed pursuant to Item 15(b) are so identified therein.
|
Exhibit
Number
|
Description of Document
|
|
|
3.1
|
Amended and Restated Articles of Incorporation. (Filed as an exhibit to Registrant’s Registration Statement on Form SB-2 (333-5054-LA) and incorporated herein by reference.)
|
|
|
3.2
|
Certificate of Amendment of Amended and Restated Articles of Incorporation. (Filed as Exhibit 3.2 to Registrant’s Annual Report on Form 10-K for the year ended January 29, 2005 and incorporated herein by reference.)
|
|
|
3.3
|
Amended and Restated Bylaws, as amended. (Filed as Exhibit 3.3 to Registrant’s Annual Report on Form 10-K for the year ended January 29, 2005 and incorporated herein by reference.)
|
|
|
4.1
|
Reference is made to Exhibits 3.1, 3.2 and 3.3.
|
|
|
4.2
|
Specimen stock certificate. (Filed as an exhibit to Registrant’s Registration Statement on Form SB-2 (333-5054-LA) and incorporated herein by reference.)
|
|
|
10.1a
|
Form of Indemnity Agreement entered into between Registrant and its directors and officers. (Filed as an exhibit to Registrant’s Registration Statement on Form SB-2 (333-5054-LA) and incorporated herein by reference.)
|
|
|
10.2a
|
2006 Equity Incentive Plan (the “2006 Plan”), as amended. (Filed as Exhibit 10.2a to Registrant’s Annual Report on Form 10-K for the year ended February 3, 2007 and incorporated herein by reference.)
|
|
|
10.3a
|
Form of Nonstatutory Stock Option Agreement of Registrant pursuant to the 2006 Plan. (Filed as Exhibit 99.3 to Registrant’s Current Report on Form 8-K filed on June 15, 2006 and incorporated herein by reference.)
|
|
|
10.4a
|
Form of Incentive Stock Option Agreement of Registrant pursuant to the 2006 Plan. (Filed as Exhibit 99.2 to Registrant’s Current Report on Form 8-K filed on June 15, 2006 and incorporated herein by reference.)
|
|
|
10.5a
|
1996 Non-Employee Directors’ Stock Option Plan, as amended. (Filed as Exhibit 10.1 to Registrant’s Current Report on Form 8-K filed on June 13, 2008 and incorporated herein by reference.)
|
|
|
10.6a
|
Employee Stock Purchase Plan, as amended. (Filed as Exhibit 10.6a to Registrant’s Annual Report on Form 10-K for the year ended February 3, 2007 and incorporated herein by reference.)
|
|
|
10.7a
|
Hot Topic 401(k) Plan of Registrant, effective as of August 1, 1995, as amended. (Filed as Exhibit 10.7a to Registrant’s Annual Report on Form 10-K for the year ended January 29, 2005 and incorporated herein by reference.)
|
|
|
10.8a
|
Form of Restricted Stock Bonus Agreement between the Registrant and each of its non-employee directors. (Filed as Exhibit 10.13 to Registrant’s Quarterly Report on Form 10-Q for the quarter ended May 5, 2001 and incorporated herein by reference.)
|
|
39
|
10.9a
|
Form of Restricted Stock Bonus Agreement between Registrant and each of its non-employee directors, under the 2006 Plan.
|
|
|
10.10a
|
Hot Topic, Inc. Deferred Compensation Plan. (Filed as Exhibit 99.1 to Registrant’s Current Report on Form 8-K filed on July 6, 2006 and incorporated herein by reference.)
|
|
|
10.11a
|
Board Compensation Summary. (Filed as Exhibit 10.11a to Registrant’s Annual Report on Form 10-K for the year ended January 30, 2010 and incorporated herein by reference.)
|
|
|
10.12a
|
Performance Share Award Agreement and Program, under the 2006 Plan. (Filed as Exhibit 10.28a to Registrant’s Annual Report on Form 10-K for the year ended February 3, 2007 and incorporated herein by reference.)
|
|
|
10.13a
|
Amended and Restated Employment Letter Agreement dated November 24, 2008 between the Registrant and Gerald Cook. (Filed as Exhibit 10.1a to Registrant’s Quarterly Report on Form 10-Q for the quarter ended November 1, 2008 and incorporated herein by reference.)
|
|
|
10.14a
|
Amendment dated March 21, 2011 to Amended and Restated Employment Letter Agreement dated November 24, 2008 between the Registrant and Gerald Cook.
|
|
|
10.15a
|
Amended and Restated Employment Letter Agreement dated November 24, 2008 between the Registrant and James McGinty. (Filed as Exhibit 10.2a to Registrant’s Quarterly Report on Form 10-Q for the quarter ended November 1, 2008 and incorporated herein by reference.)
|
|
|
10.16a
|
Amendment dated March 21, 2011 to Amended and Restated Employment Letter Agreement dated November 24, 2008 between the Registrant and James McGinty.
|
|
|
10.17a
|
Amended and Restated Employment Letter Agreement dated November 24, 2008 between the Registrant and Christopher Daniel. (Filed as Exhibit 10.3a to Registrant’s Quarterly Report on Form 10-Q for the quarter ended November 1, 2008 and incorporated herein by reference.)
|
|
|
10.18a
|
Amended and Restated Employment Letter Agreement dated December 23, 2008 between the Registrant and John Kirkpatrick. (Filed as Exhibit 10.16a to Registrant’s Annual Report on Form 10-K for the year ended January 30, 2010 and incorporated herein by reference.)
|
|
|
10.19a
|
Employment Letter Agreement dated September 9, 2009 between the Registrant and Amy Kocourek. (Filed as Exhibit 10.1a to Registrant’s Quarterly Report on Form 10-Q for the quarter ended May 1, 2010 and incorporated herein by reference.)
|
|
|
10.20a
|
Mutual Separation Agreement, dated as of January 26, 2011, by and between Registrant and Christopher Daniel. (Filed as Exhibit 10.1 to Registrant’s Current Report on Form 8-K filed on February 1, 2011 and incorporated herein by reference.)
|
|
|
10.21a
|
Employment Agreement, dated as of March 21, 2011, by and between Registrant and Lisa Harper.
|
|
|
10.22a
|
Mutual Separation Agreement, dated as of March 21, 2011, by and between Registrant and Elizabeth McLaughlin.
|
|
|
10.23a
|
Form of Performance Share Award Cancellation Agreement. (Filed as Exhibit 10.1 to Registrant’s Current Report on Form 8-K filed on December 18, 2008 and incorporated herein by reference.)
|
|
|
10.24
|
Industrial Real Estate Lease (Multi-Tenant Facility), dated December 10, 1998, entered into between Registrant’s wholly owned subsidiary, Hot Topic Administration, Inc. and Majestic Realty Co. and Patrician Associates, Inc. (Filed as Exhibit 10.18 to Registrant’s Annual Report on Form 10-K for the year ended January 30, 1999 and incorporated herein by reference.)
|
|
40
|
10.25
|
Guaranty of Lease, dated December 10, 1998, entered into between the Registrant and Majestic Realty Co. and Patrician Associates, Inc. (Filed as Exhibit 10.19 to Registrant’s Annual Report on Form 10-K for the year ended January 30, 1999 and incorporated herein by reference.)
|
|
|
10.26
|
First Amendment to Industrial Real Estate Lease, dated March 19, 2001, by and between Majestic—Fullerton Road, LLC, PFG Fullerton Limited Partnership, and Hot Topic Administration, Inc. (Filed as Exhibit 10.10 to Registrant’s Annual Report on Form 10-K for the year ended February 3, 2001 and incorporated herein by reference.)
|
|
|
10.27
|
Third Amendment to Industrial Real Estate Lease, dated February 25, 2004, by and among Majestic-Fullerton Road, LLC, PFG Fullerton Limited Partnership, and Hot Topic Administration, Inc. (Filed as Exhibit 10.1 to Registrant’s Quarterly Report on Form 10-Q for the quarter ended May 1, 2004 and incorporated herein by reference.)
|
|
|
10.28
|
Centre Pointe Distribution Park Lease, dated June 1, 2004, by and among Crescent Resources, LLC and Hot Topic, Inc. (Filed as Exhibit 10.1 to Registrant’s Quarterly Report on Form 10-Q for the quarter ended July 31, 2004 and incorporated herein by reference.)
|
|
|
10.29
|
Purchase and sale agreement between the Registrant and Crescent Resources, LLC. (Filed as Exhibit 99.1 to Registrant’s Current Report on Form 8-K filed on June 20, 2005 and incorporated herein by reference.)
|
|
|
10.30
|
Union Bank of California Trust Agreement. (Filed as Exhibit 99.2 to Registrant’s Current Report on Form 8-K filed on July 6, 2006 and incorporated herein by reference.)
|
|
|
10.31
|
Agreement, dated as of September 19, 2010, by and among Registrant, Steven R. Becker, Matthew A. Drapkin, Becker Drapkin Management, L.P., Becker Drapkin Partners (QP), L.P., Becker Drapkin Partners, L.P., BD Partners I, L.P. and BC Advisors, LLC. (Filed as Exhibit 10.1 to Registrant’s Current Report on Form 8-K filed on September 20, 2010 and incorporated herein by reference.)
|
|
|
10.32
|
Agreement, dated as of September 19, 2010, by and among Hot Topic, Inc., Clint D. Carlson, Black Diamond Offshore Ltd., Double Black Diamond Offshore Ltd., Carlson Capital L.P. and Asgard Investment Corp. (Filed as Exhibit 10.2 to Registrant’s Current Report on Form 8-K filed on September 20, 2010 and incorporated herein by reference.)
|
|
|
21
|
Hot Topic, Inc. List of Subsidiaries. (Filed as Exhibit 21 to Registrant’s Annual Report on Form 10-K for the year ended January 30, 2010 and incorporated herein by reference.)
|
|
|
23.1
|
Consent of Ernst & Young LLP, Independent Registered Public Accounting Firm.
|
|
|
24.1
|
Power of Attorney is contained on the signature page.
|
|
| 31.1 |
Certification, dated April 6, 2011 of Registrant’s Chief Executive Officer required by Section 302 of the Sarbanes-Oxley Act of 2002.
|
|
| 31.2 |
Certification, dated April 6, 2011, of Registrant’s Chief Financial Officer required by Section 302 of the Sarbanes-Oxley Act of 2002.
|
|
| 32.1 |
Certifications, dated April 6, 2011, of Registrant’s Chief Executive Officer and Chief Financial Officer required by Section 906 of the Sarbanes-Oxley Act of 2002.
|
|
a
|
Denotes management contract or compensatory plan or arrangement.
|
|
|
(c) Financial Statement Schedules
|
Reference is made to Item 15(a)(2).
41
SIGNATURES
Pursuant to the requirements of Section 13 or 15(d) of the Securities Exchange Act of 1934, the Registrant has caused this report to be signed on its behalf by the undersigned, thereunto duly authorized.
|
HOT TOPIC, INC.
|
||
|
By:
|
/S/ LISA HARPER
|
|
|
Lisa Harper
|
||
|
Chief Executive Officer and Director
|
||
April 6, 2011
POWER OF ATTORNEY
KNOW ALL PERSONS BY THESE PRESENTS, that each person whose signature appears below constitutes and appoints Lisa Harper and James McGinty, or either of them, his attorney-in-fact, each with the power of substitution, for him or her in any and all capacities, to sign any amendments to this Report, and to file the same, with exhibits thereto and other documents in connection therewith, with the Securities and Exchange Commission, hereby ratifying and confirming all that each of said attorneys-in-fact, or his substitute or substitutes, may do or cause to be done by virtue hereof.
Pursuant to the requirements of the Securities Exchange Act of 1934, this report has been signed below by the following persons on behalf of the Registrant and in the capacities and on the dates indicated.
42
|
Name
|
Position
|
Date
|
||
|
/s/ LISA HARPER
|
Chief Executive Officer and Director
|
April 6, 2011
|
||
|
Lisa Harper
|
(Principal Executive Officer) | |||
|
/s/ JAMES MCGINTY
|
Chief Financial Officer
|
April 6, 2011
|
||
|
James McGinty
|
(Principal Financial Officer and Principal Accounting Officer) | |||
|
/s/ BRUCE QUINNELL
|
Chairman of the Board
|
April 6, 2011
|
||
|
Bruce Quinnell
|
||||
|
/s/ STEVEN R. BECKER
|
Director
|
April 6, 2011
|
||
|
Steven R. Becker
|
||||
|
/s/ EVELYN D'AN
|
Director
|
April 6, 2011
|
||
|
Evelyn D'An
|
||||
|
/s/ MATTHEW A. DRAPKIN
|
Director
|
April 6, 2011
|
||
|
Matthew A. Drapkin
|
||||
|
/s/ W. SCOTT HEDRICK
|
Director
|
April 6, 2011
|
||
|
W. Scott Hedrick
|
||||
|
/s/ ANDREW SCHUON
|
Director
|
April 6, 2011
|
||
|
Andrew Schuon
|
||||
|
/s/ THOMAS VELLIOS
|
Director
|
April 6, 2011
|
||
|
Thomas Vellios
|
||||
43
The Board of Directors and Shareholders of Hot Topic, Inc.
We have audited the accompanying consolidated balance sheets of Hot Topic, Inc. as of January 29, 2011 and January, 30, 2010, and the related consolidated statements of operations, shareholders' equity and comprehensive (loss) income, and cash flows for each of the three years in the period ended January 29, 2011. Our audits also included the financial statement schedule listed in the Index at Item 15(a)(2). These financial statements are the responsibility of the Company's management. Our responsibility is to express an opinion on these financial statements and schedule based on our audits.
We conducted our audits in accordance with the standards of the Public Company Accounting Oversight Board (United States). Those standards require that we plan and perform the audit to obtain reasonable assurance about whether the financial statements are free of material misstatement. An audit includes examining, on a test basis, evidence supporting the amounts and disclosures in the financial statements. An audit also includes assessing the accounting principles used and significant estimates made by management, as well as evaluating the overall financial statement presentation. We believe that our audits provide a reasonable basis for our opinion.
In our opinion, the financial statements referred to above present fairly, in all material respects, the consolidated financial position of Hot Topic, Inc. at January 29, 2011 and January 30, 2010, and the consolidated results of its operations and its cash flows for each of the three years in the period ended January 29, 2011, in conformity with U.S. generally accepted accounting principles. Also, in our opinion, the related financial statement schedule, when considered in relation to the basic financial statements taken as a whole, presents fairly in all material respects the information set forth therein.
We also have audited, in accordance with the standards of the Public Company Accounting Oversight Board (United States), Hot Topic, Inc.’s internal control over financial reporting as of January 29, 2011, based on criteria established in Internal Control-Integrated Framework issued by the Committee of Sponsoring Organizations of the Treadway Commission and our report dated April 6, 2011 expressed an unqualified opinion thereon.
/s/ ERNST & YOUNG LLP
Los Angeles, California
April 6, 2011
F-1
|
Hot Topic, Inc. and Subsidiaries
|
||||||||||||
|
Consolidated Statements of Operations
|
||||||||||||
|
(In thousands, except per share amounts)
|
||||||||||||
|
Years Ended
|
||||||||||||
|
January 29,
|
January 30,
|
January 31,
|
||||||||||
|
2011
|
2010
|
2009
|
||||||||||
|
Net sales
|
$ | 708,244 | $ | 736,710 | $ | 761,074 | ||||||
|
Cost of goods sold, including buying,
|
||||||||||||
|
distribution and occupancy costs
|
474,917 | 480,453 | 487,769 | |||||||||
|
Gross margin
|
233,327 | 256,257 | 273,305 | |||||||||
|
Selling, general and administrative expenses
|
247,089 | 237,010 | 242,483 | |||||||||
|
(Loss) income from operations
|
(13,762 | ) | 19,247 | 30,822 | ||||||||
|
Other income and interest , net
|
336 | 519 | 1,670 | |||||||||
|
(Loss) income before (benefit) provision for income taxes
|
(13,426 | ) | 19,766 | 32,492 | ||||||||
|
(Benefit) provision for income taxes
|
(5,191 | ) | 7,886 | 12,750 | ||||||||
|
Net (loss) income
|
$ | (8,235 | ) | $ | 11,880 | $ | 19,742 | |||||
|
(Loss) earnings per share:
|
||||||||||||
|
Basic
|
$ | (0.18 | ) | $ | 0.27 | $ | 0.45 | |||||
|
Diluted
|
$ | (0.18 | ) | $ | 0.27 | $ | 0.45 | |||||
|
Cash dividends declared and paid per share:
|
$ | 1.28 | $ | - | $ | - | ||||||
|
Shares used in computing (loss) earnings per share:
|
||||||||||||
|
Basic
|
44,554 | 44,134 | 43,789 | |||||||||
|
Diluted
|
44,554 | 44,409 | 43,913 | |||||||||
|
See accompanying Notes to Consolidated Financial Statements.
|
||||||||||||
F-2
|
Hot Topic, Inc. and Subsidiaries
|
||||||||
|
Consolidated Balance Sheets
|
||||||||
|
(In thousands, except share amounts)
|
||||||||
|
January 29,
2011
|
January 30,
2010
|
|||||||
|
Assets
|
||||||||
|
Current assets:
|
||||||||
|
Cash and cash equivalents
|
$ | 51,316 | $ | 117,764 | ||||
|
Short-term investments
|
25,240 | 5,301 | ||||||
|
Inventory
|
70,267 | 76,483 | ||||||
|
Prepaid expenses and other
|
21,714 | 14,395 | ||||||
|
Deferred tax assets
|
6,050 | 6,192 | ||||||
|
Total current assets
|
174,587 | 220,135 | ||||||
|
Property and equipment, net
|
123,219 | 140,252 | ||||||
|
Deposits and other
|
4,550 | 3,304 | ||||||
|
Long-term investments
|
2,983 | 8,192 | ||||||
|
Deferred tax assets
|
5,268 | 4,511 | ||||||
|
Total assets
|
$ | 310,607 | $ | 376,394 | ||||
|
Liabilities and shareholders’ equity
|
||||||||
|
Current liabilities:
|
||||||||
|
Accounts payable
|
$ | 22,024 | $ | 20,235 | ||||
|
Accrued liabilities
|
37,963 | 40,824 | ||||||
|
Income taxes payable
|
668 | 545 | ||||||
|
Total current liabilities
|
60,655 | 61,604 | ||||||
|
Deferred rent and other
|
26,255 | 32,376 | ||||||
|
Income taxes payable
|
1,911 | 2,380 | ||||||
|
Deferred compensation
|
4,289 | 2,987 | ||||||
|
Commitments and contingencies
|
||||||||
|
Shareholders’ equity:
|
||||||||
|
Preferred shares, no par value; 10,000,000 shares
|
||||||||
|
authorized; no shares issued and outstanding
|
- | - | ||||||
|
Common shares, no par value; 150,000,000 shares authorized;
|
||||||||
|
44,629,656 and 44,339,711 shares issued and outstanding
|
||||||||
|
at January 29, 2011 and January 30, 2010, respectively
|
128,062 | 122,552 | ||||||
|
Retained earnings
|
89,653 | 154,905 | ||||||
|
Accumulated other comprehensive loss
|
(218 | ) | (410 | ) | ||||
|
Total shareholders’ equity
|
217,497 | 277,047 | ||||||
|
Total liabilities and shareholders’ equity
|
$ | 310,607 | $ | 376,394 | ||||
|
See accompanying Notes to Consolidated Financial Statements.
|
||||||||
F-3
|
Hot Topic, Inc. and Subsidiaries
|
|||||||||||||||||||
|
Consolidated Statements of Shareholders’ Equity and Comprehensive (Loss) Income
|
|||||||||||||||||||
|
(In thousands)
|
|||||||||||||||||||
| Accumulated | |||||||||||||||||||
| Other | Total | ||||||||||||||||||
| Common Shares | Retained | Comprehensive |
|
Shareholders’ | |||||||||||||||
| Shares | Amount | Earnings | Loss | Equity | |||||||||||||||
|
Balance at February 2, 2008
|
43,699
|
111,873
|
123,283
|
(3
|
) |
235,153
|
|||||||||||||
|
Exercise of stock options
|
166
|
440
|
-
|
-
|
440
|
||||||||||||||
|
Employee stock purchase plan
|
71
|
329
|
-
|
-
|
329
|
||||||||||||||
|
Restricted stock awards
|
14
|
155
|
-
|
-
|
155
|
||||||||||||||
|
Tax deficiency from exercise of stock
|
|||||||||||||||||||
|
options, net
|
-
|
(16
|
) |
-
|
-
|
(16
|
) | ||||||||||||
|
Stock-based compensation expense
|
-
|
3,959
|
-
|
-
|
3,959
|
||||||||||||||
|
Comprehensive income:
|
|||||||||||||||||||
|
Net income
|
-
|
-
|
19,742
|
-
|
19,742
|
||||||||||||||
|
Unrealized loss on short- and long-term
|
|||||||||||||||||||
|
investments, net
|
-
|
-
|
-
|
(1,336
|
) |
(1,336
|
) | ||||||||||||
|
Total comprehensive income
|
18,406
|
||||||||||||||||||
|
Balance at January 31, 2009
|
43,950
|
116,740
|
143,025
|
(1,339
|
) |
258,426
|
|||||||||||||
|
Exercise of stock options
|
301
|
1,319
|
-
|
-
|
1,319
|
||||||||||||||
|
Employee stock purchase plan
|
63
|
365
|
-
|
-
|
365
|
||||||||||||||
|
Restricted stock awards
|
26
|
155
|
-
|
-
|
155
|
||||||||||||||
|
Tax benefit from exercise of stock
|
|||||||||||||||||||
|
options, net
|
-
|
107
|
-
|
-
|
107
|
||||||||||||||
|
Stock-based compensation expense
|
-
|
3,866
|
-
|
-
|
3,866
|
||||||||||||||
|
Comprehensive income:
|
|||||||||||||||||||
|
Net income
|
-
|
|
-
|
11,880
|
-
|
11,880
|
|||||||||||||
|
Unrealized gain on short- and long-term
|
|||||||||||||||||||
|
investments, net
|
-
|
|
-
|
|
-
|
929
|
929
|
||||||||||||
|
Total comprehensive income
|
12,809
|
||||||||||||||||||
|
Balance at January 30, 2010
|
44,340
|
$ |
122,552
|
$ |
154,905
|
$ |
(410
|
) | $ |
277,047
|
|||||||||
|
Exercise of stock options
|
174
|
938
|
-
|
-
|
938
|
||||||||||||||
|
Employee stock purchase plan
|
95
|
411
|
-
|
-
|
411
|
||||||||||||||
|
Restricted stock awards
|
21
|
155
|
-
|
-
|
155
|
||||||||||||||
|
Tax deficiency from exercise of stock
|
|||||||||||||||||||
|
options, net
|
-
|
(41
|
) |
-
|
-
|
(41
|
|||||||||||||
|
Stock-based compensation expense
|
-
|
4,047
|
-
|
-
|
4,047
|
||||||||||||||
|
Dividends
|
(57,017
|
) |
(57,017
|
) | |||||||||||||||
|
Comprehensive loss:
|
|||||||||||||||||||
|
Net loss
|
-
|
|
-
|
(8,235
|
) |
-
|
(8,235
|
) | |||||||||||
|
Unrealized gain on short- and long-term investments,
|
|||||||||||||||||||
|
net of foreign currency translation adjustments
|
-
|
|
-
|
|
-
|
192
|
192
|
||||||||||||
|
Total comprehensive loss
|
(8,043
|
) | |||||||||||||||||
|
Balance at January 29, 2011
|
44,630
|
$ |
128,062
|
$ |
89,653
|
$ |
(218
|
) | $ |
217,497
|
|||||||||
|
See accompanying Notes to Consolidated Financial Statements.
|
|||||||||||||||||||
F-4
|
Hot Topic, Inc. and Subsidiaries
|
||||||||||||
|
Consolidated Statements of Cash Flows
|
||||||||||||
|
(In thousands)
|
||||||||||||
|
Years Ended
|
||||||||||||
|
January 29,
|
January 30,
|
January 31,
|
||||||||||
|
2011
|
2010
|
2009
|
||||||||||
|
OPERATING ACTIVITIES
|
||||||||||||
|
Net (loss) income
|
$ | (8,235 | ) | $ | 11,880 | $ | 19,742 | |||||
|
Adjustments to reconcile net (loss) income to net cash
|
||||||||||||
|
provided by operating activities:
|
||||||||||||
|
Depreciation and amortization
|
40,926 | 38,317 | 38,328 | |||||||||
|
Stock-based compensation
|
4,235 | 4,021 | 4,114 | |||||||||
|
Loss on disposal of property and equipment
|
1,085 | 344 | 572 | |||||||||
|
Impairment of long-lived assets
|
6,054 | 1,454 | 1,198 | |||||||||
|
Deferred taxes
|
(1,002 | ) | 2,276 | (2,941 | ) | |||||||
|
Gift card breakage
|
(1,100 | ) | (1,071 | ) | (1,152 | ) | ||||||
|
Changes in operating assets and liabilities:
|
||||||||||||
|
Inventory
|
6,203 | 3,441 | 382 | |||||||||
|
Prepaid expenses and other current assets
|
(7,320 | ) | (498 | ) | 801 | |||||||
|
Deposits and other assets
|
(1,246 | ) | (1,697 | ) | (239 | ) | ||||||
|
Accounts payable
|
1,789 | 778 | 1,289 | |||||||||
|
Accrued liabilities
|
(93 | ) | (2,003 | ) | 11,103 | |||||||
|
Deferred rent and other
|
(5,932 | ) | (4,722 | ) | (3,640 | ) | ||||||
|
Income taxes payable
|
(346 | ) | (6,526 | ) | 7,447 | |||||||
|
Net cash provided by operating activities
|
35,018 | 45,994 | 77,004 | |||||||||
|
INVESTING ACTIVITIES
|
||||||||||||
|
Purchases of property and equipment
|
(31,031 | ) | (24,332 | ) | (23,257 | ) | ||||||
|
Proceeds from sale of short- and long-term investments
|
6,160 | 13,810 | 26,672 | |||||||||
|
Purchases of short- and long-term investments
|
(20,685 | ) | (10,085 | ) | (7,743 | ) | ||||||
|
Net cash used in investing activities
|
(45,556 | ) | (20,607 | ) | (4,328 | ) | ||||||
|
FINANCING ACTIVITIES
|
||||||||||||
|
Excess tax benefit from stock-based compensation
|
246 | 558 | 299 | |||||||||
|
Proceeds from employee stock purchases and exercise
|
||||||||||||
|
of stock options
|
1,349 | 1,684 | 769 | |||||||||
|
Payment of capital lease obligation
|
(571 | ) | - | - | ||||||||
|
Payment of cash dividends
|
(57,017 | ) | - | - | ||||||||
|
Net cash (used in) provided by financing activities
|
(55,993 | ) | 2,242 | 1,068 | ||||||||
|
Decrease in cash and cash equivalents
|
(66,531 | ) | 27,629 | 73,744 | ||||||||
|
Effect of foreign currency exchange rate changes
|
||||||||||||
|
on cash
|
83 | - | - | |||||||||
|
Cash and cash equivalents at beginning of period
|
117,764 | 90,135 | 16,391 | |||||||||
|
Cash and cash equivalents at end of period
|
$ | 51,316 | $ | 117,764 | $ | 90,135 | ||||||
|
SUPPLEMENTAL INFORMATION
|
||||||||||||
|
Cash paid during the period for interest
|
$ | 32 | $ | 12 | $ | 73 | ||||||
|
Cash paid during the period for income taxes
|
$ | 2,480 | $ | 12,680 | $ | 7,759 | ||||||
|
See accompanying Notes to Consolidated Financial Statements.
|
||||||||||||
F-5
HOT TOPIC, INC. and SUBSIDIARIES
NOTES TO CONSOLIDATED FINANCIAL STATEMENTS
January 29, 2011
NOTE 1. Organization and Summary of Significant Accounting Policies
Organization and Business Activities We are a mall and web-based specialty retailer of apparel, accessories, music and gift items for young men and women whose lifestyles reflect a passion for music, fashion and pop culture. We operate under two primary concepts: Hot Topic and Torrid. Music is the overriding inspiration at Hot Topic and Torrid is focused on providing the best in fashion to young plus-size women. We generate revenues primarily through our retail stores in the United States of America, Puerto Rico and Canada, and online through our websites. We were incorporated in California in 1988. We currently have one reportable segment given the similarities of the economic characteristics among the Hot Topic and Torrid concepts, and the relatively insubstantial business operations of our ShockHound concept. During the first quarter of fiscal 2011, we announced that the operations of ShockHound, our multi-faceted music website that uniquely combines access to MP3s, music merchandise, online community and exclusive content, will be discontinued. Refer to “NOTE 15 – Subsequent Events” contained in these consolidated financial statements and Notes for more information concerning the discontinuation of ShockHound’s operations.
Principles of Consolidation Our consolidated financial statements are prepared in accordance with accounting principles generally accepted in the United States. The consolidated financial statements include the accounts of Hot Topic, Inc. and our wholly-owned subsidiaries. All significant intercompany transactions and balances have been eliminated in consolidation.
Fiscal Year Our fiscal year ends on the Saturday nearest to January 31. References to fiscal 2011, 2010, 2009, 2008 and 2007 refer to the 52-week periods ending January 28, 2012, January 29, 2011, January 30, 2010, January 31, 2009 and February 2, 2008. Fiscal 2006 refers to the 53-week period ended February 3, 2007.
Use of Estimates We are required to make certain estimates and assumptions in order to prepare consolidated financial statements in conformity with generally accepted accounting principles. Such estimates and assumptions affect the reported amounts of assets, liabilities, revenues and expenses and disclosure of contingent assets and liabilities in the financial statements and accompanying notes. Our most significant estimates relate to the valuation of inventory balances, the valuation of our auction rate securities, the determination of sales returns, the assessment of expected cash flows used in evaluating long-lived assets for impairment, the determination of gift card breakage and estimates related to the cost reduction plan. The estimation process required to prepare our consolidated financial statements requires assumptions to be made about future events and conditions, and as such, is inherently subjective and uncertain. Our actual results could differ materially from those estimates.
Cash and Cash Equivalents We consider all highly liquid investments with maturities of less than three months when purchased to be cash equivalents. Cash used primarily for working capital purposes is maintained with various major financial institutions in amounts which are in excess of the Federal Deposit Insurance Corporation, or FDIC, insurance limits. We are potentially exposed to a concentration of credit risk when cash deposits in banks are in excess of FDIC limits. Excess cash and cash equivalents, which represent the majority of our cash and cash equivalents balance, are held primarily in diversified money market funds.
Fair Value of Financial Instruments We consider carrying amounts of cash and cash equivalents, receivables and accounts payable to approximate fair value because of the short maturity of these financial instruments.
Short- and Long-Term Investments Our short-term investments consist of highly-rated interest-bearing municipal bonds that have maturities that are less than one year and are accounted for as available for sale and certificates of deposit that are guaranteed by the Federal Deposit Insurance Corporation, classified as held to maturity and have maturities that are less than one year. As of the end of fiscal 2010, short-term investments consisted of certificates of deposit of $5.0 million and municipal bonds of $20.2 million. As of the end of fiscal 2009, short-term investments consisted of municipal bonds of $5.3 million. (Refer to “NOTE 7 – Fair Value Measurements” contained in these consolidated financial statements and Notes for further discussion on how we determined the fair value of our short-term investments). The associated unrealized gain in fiscal 2010 was immaterial and has been recorded in accumulated other comprehensive loss, or OCL, reflected in the shareholders’ equity section of the consolidated balance sheet. The associated unrealized gain in fiscal 2009 was $0.1 million.
F-6
As of the end of fiscal 2010, our long-term investments comprised of auction rate securities and highly-rated interest-bearing municipal bonds that have maturities that are more than one year and are accounted for as available for sale. The fair value of our long-term municipal bonds as of the end of fiscal 2010 was $0.5 million and the immaterial associated unrealized gain was recorded in OCL reflected in the shareholders’ equity section of the consolidated balance sheet. As of the end of fiscal 2009, our long-term investments comprised of auction rate securities and certificates of deposit. The fair value of our certificates of deposit as of the end of fiscal 2009 was $5.0 million and the immaterial associated unrealized loss was recorded in OCL reflected in the shareholders’ equity section of the consolidated balance sheet.
Our auction rate securities are AAA/Aaa/A3-rated debt instruments with maturities that range from 23 to 30 years. They are accounted for as available for sale and backed by pools of student loans guaranteed by the U.S. Department of Education. Their interest rates are reset through an auction process, most commonly at intervals of 7, 28 and 35 days. This same auction process is designed to provide a means by which these securities can be sold and prior to 2008 had provided a liquid market for them. There continues to be uncertainty in the global credit and capital markets, which has resulted in the failure of auctions representing the auction rate securities we hold as the amount of securities submitted for sale in those auctions exceed the amount of bids. While we have continued to earn and receive interest on our auction rate securities through the date of this report, we concluded that their estimated fair value no longer approximates par value. Due to the lack of availability of observable market quotes on our auction rate securities, the fair market value of these securities has been based on a valuation model using current assumptions. (Refer to “NOTE 7 – Fair Value Measurements” contained in these consolidated financial statements and Notes for further discussion on how we determined the fair value of our investment in auction rate securities).
As of the end of fiscal 2010 and 2009, the fair value of our auction rate securities was $2.5 million and $3.2 million, respectively. The $0.7 million decline in fair value from the beginning of the fiscal year represents a $0.8 million and a $0.1 million redemption of certain auction rate securities at par during the second and fourth quarters of fiscal 2010, respectively, offset by the recovery in fair value of $0.2 million which was previously temporarily impaired. The fair value of our remaining auction rate securities as of the end of fiscal 2010 reflects a cumulative decline of $0.5 million from the par value. This cumulative $0.5 million decline ($0.3 million net of tax) is deemed temporary as we do not have the intent to sell these securities and it is not likely that we will be required to sell the securities before the recovery of their amortized cost basis. If uncertainties in the credit and capital markets continue, we may incur additional losses, some of which may be other-than-temporary, which could negatively affect our financial condition or results of operations. In addition, in the event that we decide to sell these securities and it becomes likely that we will be required to sell the securities before the recovery of their amortized cost basis, we may be required to recognize impairment charges against income. We have classified all auction rate securities as non-current assets on our consolidated balance sheet, as we do not expect them to successfully auction and recover their full or par value within the next 12 months.
In fiscal 2010 and 2009, we recorded unrealized gains of $0.2 million ($0.1 million net of tax) and $1.3 million ($0.8 million net of tax), respectively, for our auction rate securities in accumulated OCL reflected in the shareholders’ equity section of the consolidated balance sheet. The $0.2 million unrealized gain in fiscal 2010 primarily represents a recovery in fair value which was previously temporarily impaired, slightly offset by a decrease in fair value of the remaining auction rate securities.
Accumulated OCL is comprised of unrealized gains and losses from short- and long-term investments, net of all related taxes, as well as foreign currency translation adjustments and are reflected in the shareholders’ equity section of the consolidated financial statements.
F-7
Inventories Inventories are valued at the lower of average cost or market, on a weighted average cost basis, using the retail method. Under the retail method, inventory is stated at its current retail selling value and then is converted to a cost basis by applying an average cost factor that represents the average cost-to-retail ratio based on beginning inventory and the purchase activity for the month. Throughout the year, we review our inventory levels in order to identify slow-moving merchandise and use permanent markdowns to sell through selected merchandise. We record a charge to cost of goods sold for permanent markdowns. Inherent in the retail method are certain significant management judgments and estimates including initial merchandise markup, future sales, markdowns and shrinkage, which significantly impact the ending inventory valuation at cost and the resulting gross margins. To the extent our estimated markdowns at period-end prove to be insufficient, additional future markdowns will need to be recorded. Physical inventories are conducted during the year to determine actual inventory on hand and shrinkage. We accrue our estimated inventory shrinkage for the period between the last physical count and current balance sheet date. Thus, the difference between actual and estimated shrink amounts may cause fluctuations in quarterly results, but not for the full fiscal year results.
Property and Equipment Property and equipment are recorded at cost less accumulated depreciation, or in the case of capitalized leases, at the present value of future minimum lease payments. Major renewals and improvements are capitalized, while routine maintenance and repairs are expensed as incurred. Application and development costs associated with internally developed software such as salaries of employees and payments made to third parties and consultants working on the software development are capitalized. Subsequent additions, modifications or upgrades to internal-use software are capitalized only to the extent that they allow the software to perform a task it previously did not perform. Capitalized internal use software costs are amortized using the straight-line method over their estimated useful lives, generally three years. In fiscal 2010, 2009 and 2008, we amortized approximately $1.8 million, $1.1 million and $0.8 million, respectively. Additionally, as of the end of fiscal 2010 and 2009, the net book value of capitalized internal use software totaled approximately $3.5 million and $3.7 million, respectively.
Depreciation expense is calculated using the straight-line method over the estimated useful lives of the related assets (3 to 20 years).
Leasehold improvements are amortized using the straight-line method over the shorter of the respective lease terms or the 10 year estimated useful life of the assets.
We assess property and equipment for impairment whenever events or changes in circumstances indicate that an asset’s carrying value may not be recoverable.
Valuation of Long-Lived Assets We assess the impairment of long-lived assets whenever events or changes in circumstances indicate that the carrying value may not be recoverable. For our Hot Topic and Torrid concepts, we group and evaluate long-lived assets for impairment at the individual store level, which is the lowest level at which individual cash flows can be identified. For the purposes of evaluating the impairment of ShockHound, our e-space music concept launched in the third quarter of fiscal 2008, we consider all assets within ShockHound to be one asset group and the lowest level at which individual cash flows can be identified. Factors we consider important that could trigger an impairment review of our stores or online operations include a significant underperformance relative to expected historical or projected future operating results, a significant change in the manner of the use of the asset or a significant negative industry or economic trend. When we determine that the carrying value of long-lived assets may not be recoverable based upon the existence of one or more of the aforementioned factors, impairment is measured based on a projected discounted cash flow method using a discount rate determined by management. These cash flows are calculated by netting future estimated sales against associated merchandise costs and other related expenses such as payroll, occupancy and marketing. The estimated sales, net of the aforementioned costs and expenses, used for this nonrecurring fair value measurement is considered a Level 3 input as defined in “NOTE 7 – Fair Value Measurements” contained in these consolidated financial statements and Notes. In the event future store performance is lower than forecasted results, future cash flows may be lower than expected, which could result in future impairment charges. While we believe recently opened stores will provide sufficient cash flow, material changes in results could result in future impairment charges.
F-8
In fiscal 2010, 2009 and 2008, we recorded store impairment charges of $3.1 million (of which $1.2 million relates to the cost reduction plan described in “NOTE 2 – Cost Reduction Plan” contained in these consolidated financial statements and Notes), $0.9 million and $1.2 million, respectively, which are included in selling, general and administrative expenses in our consolidated statements of operations. During the third quarter of fiscal 2010, we concluded that ShockHound’s assets had become impaired due to its slower than expected revenue growth. Revenues from partnerships entered into in the earlier part of fiscal 2010, as well as other revenues, did not build as much as we had anticipated. In the third quarter of fiscal 2010, we recorded an impairment charge of $3.0 million to selling, general and administrative expenses in our consolidated statements of operations. We did not record any impairment charges for ShockHound in fiscal 2009 and 2008.
Self-Insurance We are self-insured for certain losses related to medical and workers compensation claims although we maintain stop loss coverage with third party insurers to limit our total liability exposure. The estimate of our self-insurance liability involves uncertainty since we must use judgment to estimate the ultimate cost that will be incurred to settle reported claims and unreported claims for incidents incurred but not reported as of the balance sheet date. When estimating our self-insurance liability, we consider a number of factors, which include historical claim experience and valuations provided by independent third party actuaries. As claims develop, the actual ultimate losses may differ from actuarial estimates. Therefore, an analysis is performed quarterly to determine if modifications to the accrual are required.
Revenue Recognition Revenue is generally recognized at our retail store locations at the point at which the customer receives and pays for the merchandise at the register. For online sales, revenue is recognized upon delivery to the customer. Sales are recognized net of merchandise returns, which are reserved for based on historical experience. As of the end of fiscal 2010, 2009 and 2008, net merchandise returns were $22.4 million, $24.0 million and $23.7 million, respectively. Revenue from gift cards and store merchandise credits is recognized at the time of redemption. Shipping and handling revenues from our websites are included as a component of net sales.
We recognize estimated gift card breakage as a component of net sales in proportion to actual gift card redemptions over the period that remaining gift card values are redeemed. Gift card breakage is income recognized due to the non-redemption of a portion of gift cards sold by us for which liability was recorded in prior periods. While customer redemption patterns result in estimated gift card breakage, which approximates 5 to 6%, changes in our customers’ behavior could impact the amount that ultimately is unused and could affect the amount recognized as a component of net sales. In fiscal 2010, 2009 and 2008, we recognized $1.1 million, $1.1 million and $1.2 million, respectively, as a component of sales in proportion to actual gift card redemptions over the period that remaining gift card values are redeemed.
Cost of Goods Sold, Including Buying, Distribution and Occupancy Costs Cost of goods sold, including buying, distribution and occupancy costs includes: merchandise costs; freight; inventory shrink; payroll expenses associated with the merchandising and distribution departments; distribution center expenses including rent, common area maintenance charges, real estate taxes, depreciation, utilities, supplies and maintenance; and store expenses including rents, common area maintenance charges, real estate taxes and depreciation.
Vendor Allowances We receive certain allowances from our vendors primarily related to damaged merchandise, markdowns and pricing. Allowances received from vendors related to damaged merchandise and pricing are reflected as a reduction of inventory in the period they are received and allocated to cost of sales during the period in which the items are sold. Markdown allowances received from vendors are reflected as reductions to cost of sales in the period they are received as these allowances are received after goods have been sold or marked down. In fiscal 2010, 2009 and 2008, we received vendor allowances of $8.5 million, $8.3 million and $8.4 million, respectively, of which $8.4 million, $8.2 million and $8.2 million, respectively, were accounted for as a reduction of cost of goods sold. Most of the vendor allowances that we receive are based on on-going agreements and negotiations with vendors. We receive vendor allowances from substantially all of our vendors.
Selling, General and Administrative Expenses Selling, general and administrative expenses include: payroll expenses associated with stores; store operating expenses; store pre-opening costs; marketing expenses; and payroll and other expenses associated with headquarters and administrative functions.
F-9
Store Pre-Opening Costs These are costs incurred in connection with the opening of a new store are expensed as incurred.
Shipping and Handling Costs We classify shipping and handling costs in costs of goods sold, including buying, distribution and occupancy costs in the accompanying consolidate statements of operations.
Rent Expense Rent expense under our operating leases typically provides for fixed non-contingent rent escalations. We recognize rent expense on a straight-line basis over the non-cancelable term of the lease, commencing when we take possession of the property. Construction allowances are recorded as a deferred rent liability, which we amortize as a reduction of rent expense over the non-cancelable term of each lease. Our leases are discussed in more detail in “NOTE 9 – Commitments and Contingencies” contained in these consolidated financial statements and Notes.
Advertising Costs Advertising costs are expensed the first time the event occurs or as incurred. During fiscal 2010, 2009 and 2008, advertising expenses were $8.5 million, $7.3 million and $8.8 million, respectively, and advertising reimbursements from vendors for these years were immaterial. As of the end of fiscal 2010 and 2009, the amount of advertising costs reported as prepaid advertising was immaterial.
Income Taxes We account for income taxes using the liability method. Under this method, deferred tax assets and liabilities are determined based on differences between financial reporting bases and tax bases of assets and liabilities and are measured using the enacted tax rates expected to apply to taxable income in the periods in which the deferred tax asset or liability is expected to be realized or settled. Deferred tax assets are reduced by valuation allowances if we believe it is more likely than not that some portion or the entire asset will not be realized.
We prescribe a recognition threshold and a measurement attribute for the financial statement recognition and measurement of tax positions taken or expected to be taken in a tax return. For those benefits to be recognized, a tax position must be more likely than not to be sustained upon examination by taxing authorities. The amount recognized is measured as the largest amount of benefit that has a greater than 50% likelihood of being realized upon ultimate settlement. We include interest and penalties related to uncertain tax positions in income tax expense.
Stock-Based Payments We estimate the fair value of stock options granted using the Black-Scholes option-pricing formula and a single option award approach. This fair value is then amortized over the requisite service periods of the awards. This option-pricing model requires the input of highly subjective assumptions, including the option’s expected life, price volatility of the underlying stock, risk free interest rate and expected dividend rate. As stock-based compensation expense is based on awards ultimately expected to vest, it has been reduced for estimated forfeitures. Forfeitures are estimated at the time of grant and revised, if necessary, in subsequent periods if actual forfeitures differ from those estimates. Forfeitures are estimated based on historical experience.
(Loss) Earnings Per Share Basic earnings or loss per share is computed by dividing net income or net loss, respectively, by the weighted average number of common shares outstanding for the period. Diluted earnings per share is applicable only in periods of net income and is computed by dividing net income by the weighted average number of common shares outstanding for the period and potentially dilutive common stock equivalents outstanding for the period. Periods of net loss require the diluted computation to be the same as the basic computation.
Comprehensive (Loss) Income Comprehensive (loss) income includes all changes in equity during a period except those that resulted from investments by or distributions to shareholders. Other comprehensive (loss) income refers to revenues, expenses, gains and losses that, under generally accepted accounting principles, are included in comprehensive (loss) income, but excluded from net (loss) income as these amounts are recorded directly as an adjustment to shareholders’ equity. Components of our comprehensive (loss) income include net (loss) income and gains/losses associated with our short- and long-term investments.
Comprehensive (loss) income as of the end of fiscal 2010, 2009 and 2008 is as follows (in thousands):
F-10
|
Fiscal Year
|
||||||||||||
|
2010
|
2009
|
2008
|
||||||||||
|
Comprehensive (loss) income
|
||||||||||||
|
Net (loss) income
|
$ | (8,235 | ) | $ | 11,880 | $ | 19,742 | |||||
|
Foreign currency translation adjustment
|
71 | - | - | |||||||||
|
Unrealized gain (loss) on short- and long-term
|
||||||||||||
|
investments, net
|
121 | 929 | (1,336 | ) | ||||||||
|
Total comprehensive (loss) income
|
$ | (8,043 | ) | $ | 12,809 | $ | 18,406 | |||||
During fiscal 2010, we recognized an $85,000 tax expense for the $155,000 unrealized gain on auction rate securities. The resulting $70,000 net gain is recorded in other comprehensive loss. Unrealized gain on short-term marketable securities during fiscal 2010 was $51,000 and the related tax expense on this activity was not material. During fiscal 2010, we also recognized a gain on foreign currency translation adjustments in connection with our stores in Canada. During fiscal 2009, we recognized a $0.5 million tax expense for the $1.3 million unrealized gain on auction rate securities resulting in a $0.8 million net gain. Unrealized gain on short-term marketable securities during fiscal 2009 was $132,000 and the related tax expense on this activity was not material. During fiscal 2008, we recognized a $0.8 million tax benefit for the $2.0 million unrealized loss on auction rate securities resulting in a $1.2 million net loss. Unrealized loss on short-term marketable securities during fiscal 2008 was $127,000 and the related tax expense on this activity was not material.
Impact of Recently Issued Accounting Pronouncements In January 2010, the Financial Accounting Standards Board, or FASB, issued guidance titled “Improving Disclosures About Fair Value Measurements” that amends existing disclosure requirements by adding required disclosures about items transferring into and out of levels 1 and 2 in the fair value hierarchy; adding separate disclosures about purchases, sales, issuances, and settlements relative to level 3 measurements; and clarifying, among other things, the existing fair value disclosures about the level of disaggregation. Except for the separate level 3 disclosures, this guidance was effective for financial statements issued for interim or fiscal years beginning after December 15, 2009, and our adoption of it on January 31, 2010 did not have a material impact on our financial condition or results of operations. The rest of the guidance is effective for financial statements issued for interim or fiscal years beginning after December 15, 2010. Since these are disclosure requirements only, our adoption will not have a material impact on our financial condition or results of operations.
NOTE 2. Cost Reduction Plan
Cost Reduction Plan In November 2010, our Board approved a cost reduction plan, designed to meet the challenges of the current environment, which involves closing approximately 50 underperforming stores, a majority of which are expected to close by the end of the first quarter of fiscal 2011. These closures will occur as a result of natural lease expirations, exercising lease kick out clauses and other negotiations. The cost reduction plan also includes reducing our home office and field management positions, reducing planned capital expenditures in fiscal 2011 and implementing other non-payroll overhead expense reduction initiatives. As of the end of fiscal 2010, we had reduced our home office and field management positions, closed 20 Hot Topic stores and two Torrid stores and begun implementing certain non-payroll overhead expense reduction initiatives as part of the cost reduction plan.
The following table details information related to the cost reduction plan charges recorded during fiscal 2010 (in thousands). We did not incur any cost reduction plan charges in fiscal 2009 or 2008.
F-11
|
Non-store Related
|
||||||||||||||||
|
Severance and
|
Other Cost
|
|||||||||||||||
|
Store Related
|
Outplacement
|
Reduction
|
||||||||||||||
|
Closure Costs *
|
Costs
|
Plan Charges **
|
Total
|
|||||||||||||
|
Cost Reduction Plan liability
|
$ | (7,077 | ) | $ | (1,850 | ) | $ | (830 | ) | $ | (9,757 | ) | ||||
|
Cash payments
|
93 | 985 | - | 1,078 | ||||||||||||
|
Non-cash adjustments
|
6,497 | - | 830 | 7,327 | ||||||||||||
|
Balance at January 29, 2011
|
$ | (487 | ) | $ | (865 | ) | $ | - | $ | (1,352 | ) | |||||
* Store related closure costs represent charges related to the closure of approximately 50 underperforming stores. Such charges include the write down and accelerated depreciation of store assets, the write down of inventory, early lease terminations and store severance, partially offset by certain credits and allowances.
** Other cost reduction plan charges represent non-payroll overhead expense reduction initiatives.
We recorded charges related to the write down of store assets; store severance; non-store related severance and outplacement; and the implementation of non-payroll overhead expense reduction initiatives in selling, general and administrative expenses in our consolidated statements of operations. Charges related to the write down of store inventory; accelerated depreciation of store assets; and early lease terminations were recorded in cost of goods sold in our consolidated statements of operations.
During fiscal 2011, we expect to incur approximately $0.6 million, net of certain credits and allowances, of additional charges related to the cost reduction plan.
NOTE 3. Stock-Based Compensation
Stock Plan Activity Under our 1996 Equity Incentive Plan, or the 1996 Plan, we granted stock options, stock bonuses and other awards to our employees, directors and consultants as deemed appropriate by the Board. On June 14, 2006, the 1996 Plan expired and was replaced with the 2006 Equity Incentive Plan, or the 2006 Plan. The 2006 Plan was approved by the Board on March 17, 2006 and by our shareholders on June 13, 2006. Upon expiration of the 1996 Plan, no shares had been granted to consultants and 732,456 shares out of an aggregate of 18,300,000 shares of common stock were authorized and available for grant.
The 2006 Plan provides for the grant of incentive stock options, non-statutory stock options, restricted stock awards, restricted stock unit awards, stock appreciation rights, performance stock awards and other forms of equity compensation to our employees, consultants and directors as deemed appropriate by the Board. Both incentive and non-statutory stock options granted by us under the 2006 Plan must carry an exercise price of at least 100% of the fair market value of our common stock on the date of grant or 110% of the fair market value of our common stock on the date of grant for persons possessing 10% or more of the total combined voting power of all classes of stock. Options granted may be subject to different vesting terms as determined by the Board and the maximum term of options granted is 10 years. In addition, the maximum number of shares of common stock available for future issuance may not exceed the sum of (a) the 732,456 shares of common stock remaining available for issuance under the 1996 Plan as of June 13, 2006, (b) an additional 2,350,000 shares and (c) the number of shares subject to stock awards as of June 13, 2006 under the 1996 Plan pursuant to the terms of the 1996 Plan. As of the end of fiscal 2010, 635,847 shares were available for future grants under the 2006 Plan. These available shares include a portion of the 300,000 shares that were set aside for the issuance of up to 200,000 performance stock awards previously granted to our former Chief Executive Officer in March 2008 which, on June 8, 2010, were voluntarily cancelled in exchange for a nominal payment of $1.00. This cancellation effectively lowered the requirement to set aside 537,000 shares (for the potential issuance of up to 358,000 performance stock awards granted in March 2008) to 237,000 shares (for the potential issuance of up to 158,000 performance stock awards granted in March 2008). As of the end of fiscal 2010, all awards under the 2006 Plan had been granted to our employees and none had been granted to consultants.
F-12
In March 2007, we granted performance stock awards under the 2006 plan to certain members of our management. These 2007 awards provided for the issuance of up to 84,000 shares of our common stock, net of forfeitures, with vesting and issuance contingent upon achieving a performance goal for fiscal 2009, based upon our operating income for that fiscal year; and prior to vesting (or termination without vesting), the awards constituted an agreement by us to issue shares to the extent this performance goal was ultimately met. The market value of our common stock as of the 2007 grant date of these performance stock awards was $11.31. Compensation expense for these awards was required to be recorded over the three-year terms of the awards, based on the market values as of the grant dates, with actual amounts expensed dependent upon the likelihood from period to period of vesting of these awards at the end of fiscal 2009. In March 2010, the Board confirmed that the target performance goal for fiscal 2009 had not been met, and therefore all such awards terminated without vesting or issuance of the underlying shares.
In March 2009 and 2008, we granted performance stock awards under the 2006 Plan to certain members of our management. These grants were substantially similar to the performance stock awards granted in March 2007. None of these awards have vested and no shares have been issued pursuant to the grants. The 2009 and 2008 awards provide for the issuance of up to 430,000 and 158,000 shares of our common stock, respectively, net of forfeitures, with vesting and issuance contingent upon achieving performance goals for fiscal 2011 and 2010, respectively, based upon our operating income for those fiscal years; and prior to vesting (or termination without vesting), the awards constitute an agreement by us to issue shares to the extent these performance goals are ultimately met. The market values of our common stock as of the 2009 and 2008 grant dates of these performance stock awards were $9.56 and $4.75, respectively. Compensation expense for these awards is required to be recorded over the three-year terms of the awards, based on the market values as of the grant dates, with actual amounts expensed dependent upon the likelihood from period to period of vesting of these awards at the end of fiscal 2011 and 2010, respectively. As of the end of fiscal 2010, it is our best estimate that none of the 2009 performance stock awards will be earned at the end of the respective three-year term and none of the 2008 performance stock awards were earned. In aggregate, we have not recognized any compensation expense for these 2009 and 2008 awards.
Under our 1996 Non-Employee Directors’ Stock Option Plan, or the 1996 NEDSOP, we may grant and have granted stock options to non-employee directors. The exercise price of options granted under the 1996 NEDSOP shall be determined by the Board at the date of grant and shall be 100% of the fair market value of our common stock on the date of grant. Unless the Board determines otherwise, options vest over four years and generally expire ten years from the date of grant. The total share reserve under the 1996 NEDSOP is 720,000 shares, of which as of the end of fiscal 2010, 1,226 shares were available for future grants. No options under the 1996 NEDSOP have been granted to consultants.
In October 2010 and in June 2010, 2009 and 2008, we granted non-employee directors an aggregate of 5,638, 31,763, 20,559 and 25,748 shares of restricted common stock, respectively, under the 2006 Plan. Restricted shares generally vest in one installment in the year subsequent to the grant year. All awarded common shares remain restricted (i.e., not transferable by the holders) until such time as the recipient is no longer a member of our Board. The value of these grants is expensed over the vesting period. During fiscal 2010, $172,000, of which $52,000 relates to the fiscal 2009 grant, was expensed. During each fiscal year of 2009 and 2008, $155,000, of which $52,000 related to fiscal 2008 and 2007 grants, respectively, were expensed.
The following table summarizes stock options outstanding under all of our plans as of the end of fiscal 2010, as well as activity during fiscal 2010:
F-13
|
Options
|
Weighted-
Average Exercise
Price
|
|||||||
|
Outstanding at beginning of year
|
6,689,496 | $ | 12.36 | |||||
|
Granted
|
970,100 | $ | 6.00 | |||||
|
Exercised
|
(174,280 | ) | $ | 5.38 | ||||
|
Forfeited or expired
|
(432,899 | ) | $ | 10.72 | ||||
|
Outstanding at end of year
|
7,052,417 | $ | 11.75 | |||||
|
Exercisable at end of year
|
5,113,651 | $ | 13.57 | |||||
The following table summarizes information about stock options outstanding and exercisable as of the end of fiscal 2010:
|
Options Outstanding
|
Options Exercisable
|
||||||||||||||||||||||
|
Weighted-
|
Weighted-
|
Weighted-
|
Weighted-
|
||||||||||||||||||||
|
Average
|
Average
|
Average
|
Average
|
||||||||||||||||||||
|
Exercise
|
Contractual
|
Exercise
|
Contractual
|
||||||||||||||||||||
|
Range of Exercise Prices
|
Options
|
Price
|
Life (Years)
|
Options
|
Price
|
Life (Years)
|
|||||||||||||||||
| $4.56 - $6.37 | 1,814,279 | $ | 5.49 | 8.18 | 553,124 | $ | 4.90 | ||||||||||||||||
| $6.40 - $10.64 | 1,479,475 | $ | 9.51 | 5.9 | 860,667 | $ | 9.82 | ||||||||||||||||
| $10.71 - $13.90 | 1,588,795 | $ | 12.23 | 5.4 | 1,529,992 | $ | 12.26 | ||||||||||||||||
| $14.01 - $21.24 | 1,979,018 | $ | 17.48 | 2.54 | 1,979,018 | $ | 17.48 | ||||||||||||||||
| $21.30 - $25.51 | 190,850 | $ | 25.45 | 3.12 | 190,850 | $ | 25.45 | ||||||||||||||||
| $4.56 - $25.51 | 7,052,417 | $ | 11.75 | 5.36 | 5,113,651 | $ | 13.57 |
4.17
|
|||||||||||||||
The aggregate intrinsic values of stock options outstanding and exercisable as of the end of fiscal 2010 were $0.6 million and $0.3 million, respectively. The aggregate intrinsic values of stock options outstanding and exercisable as of the end of fiscal 2009 were $0.8 million and $0.4 million, respectively.
The total fair value of shares vested during fiscal 2010, 2009 and 2008 is $4.4 million, $3.8 million and $3.8 million, respectively.
Cash proceeds, tax benefits and intrinsic values related to total stock options exercised during fiscal 2010, 2009 and 2008 are provided in the following table (in thousands):
|
Fiscal Year
|
||||||||||||
|
2010
|
2009
|
2008
|
||||||||||
|
Proceeds from stock options exercised
|
$ | 938 | $ | 1,319 | $ | 440 | ||||||
|
Tax benefit related to stock options exercised
|
$ | 206 | $ | 558 | $ | 299 | ||||||
|
Intrinsic value of stock options exercised
|
$ | 514 | $ | 1,429 | $ | 753 | ||||||
F-14
In June 1996, the Board adopted the Employee Stock Purchase Plan, or the Stock Purchase Plan. The Stock Purchase Plan provides for the issuance of up to 1,350,000 shares of common stock to our employees. All eligible employees are granted identical rights to purchase common stock for each Board authorized offering under the Stock Purchase Plan. Rights granted pursuant to any offering under the Stock Purchase Plan terminate immediately upon cessation of an employee’s employment for any reason. In general, an employee may reduce their contribution or withdraw from participation in an offering at any time during the purchase period for such offering. Employees receive a 15% discount on shares purchased under the Stock Purchase Plan. Rights granted under the Stock Purchase Plan are not transferable and may be exercised only by the person to whom such rights are granted. The initial offering under the Stock Purchase Plan commenced October 24, 1996 and terminated December 31, 1996. Subsequent offerings have occurred every six months commencing January 1, 1997. As of the end of fiscal 2010, 801,404 shares could still be sold to employees under the Stock Purchase Plan. Compensation expense for fiscal 2010, 2009 and 2008 was $174,000, $148,000 and $117,000, respectively, related to the fair value of the rights granted to participants under the Stock Purchase Plan.
Accounting for Stock-Based Compensation Expense We account for stock-based compensation expense by estimating the fair value of stock options granted using the Black-Scholes option-pricing formula and a single option award approach. This fair value is then amortized over the requisite service periods of the awards. As stock-based compensation expense is based on awards ultimately expected to vest, it has been reduced for estimated forfeitures.
The effect of recording stock-based compensation for fiscal 2010, 2009 and 2008 was as follows (in thousands, except per share amounts):
|
Fiscal Year
|
||||||||||||
|
Stock-based compensation by type of award:
|
2010
|
2009
|
2008
|
|||||||||
|
Employee and director stock options and awards
|
$ | 4,060 | $ | 4,076 | $ | 3,794 | ||||||
|
Restricted stock units, net of adjustments
|
- | (203 | ) | 203 | ||||||||
|
Employee stock purchase plan
|
175 | 148 | 117 | |||||||||
|
Total stock-based compensation expense
|
$ | 4,235 | $ | 4,021 | $ | 4,114 | ||||||
|
Tax effect on stock-based compensation expense
|
(1,555 | ) | (1,487 | ) | (1,514 | ) | ||||||
|
Net effect on net (loss) income
|
$ | 2,680 | $ | 2,534 | $ | 2,600 | ||||||
|
Effect on (loss) earnings per share:
|
||||||||||||
|
Basic and diluted
|
$ | 0.06 | $ | 0.06 | $ | 0.06 | ||||||
For fiscal 2010, 2009 and 2008, $643,000, $604,000 and $620,000, respectively, of stock-based compensation expense was recorded as a component of cost of goods sold and the remainder, $3.6 million, $3.4 million and $3.5 million, respectively, was charged to selling, general and administrative expense.
As of the end of fiscal 2010 and 2009, we had $5.1 million and $6.5 million, respectively, of unrecognized expense related to non-vested stock option grants, which is expected to be recognized over weighted average periods of 2.48 years and 2.56 years, respectively.
As of the end of fiscal 2010 and 2009, we had $0.1 million of unrecognized expense related to restricted stock grants, which are expected to be recognized over weighted average periods of 0.36 years and 0.35 years, respectively.
Calculation of Fair Value of Options The Black-Scholes option valuation model used to determine the fair value of stock-based compensation incorporates various assumptions including the expected term of awards, volatility of stock price, risk-free rates of return and dividend yield. The expected term of an award is generally no less than the option vesting period and is based on our historical experience. Expected volatility is based upon the historical volatility of our stock price. The risk-free interest rate is approximated using rates available on U.S. Treasury securities with a remaining term equal to the option’s expected life. The dividend yield is based on the expected dividend yield as of the date of option grant. We began to pay dividends during the first quarter of fiscal 2010.
F-15
The following weighted average assumptions were used for stock options granted:
|
Fiscal Year
|
||||||||||||
|
2010
|
2009
|
2008
|
||||||||||
|
Risk free interest rate
|
2 | % | 2 | % | 3 | % | ||||||
|
Expected life
|
5 years
|
5 years
|
5 years
|
|||||||||
|
Expected volatility
|
57 | % | 56 | % | 47 | % | ||||||
|
Expected dividend yield
|
3 | % | 0 | % | 0 | % | ||||||
|
Weighted average fair value at grant date
|
$ | 2.84 | $ | 4.46 | $ | 2.16 | ||||||
NOTE 4. Cash Dividends
In April 2010, the Board authorized a $1.00 per share special one-time cash dividend that was paid to shareholders of record at the close of business on April 19, 2010 and a $0.07 per share regular quarterly cash dividend that was also paid to shareholders of record at the close of business on April 19, 2010. Subsequent payments of the $0.07 per share regular quarterly cash dividend have occurred every quarter since then, the most recent being in January 2011 to shareholders of record at the close of business on January 19, 2011. We released the funds used to pay for this regular quarterly cash dividend during the fourth quarter of fiscal 2010. Our Board will determine future regular quarterly cash dividends after giving consideration to our then existing levels of profit and cash flow, capital requirements, current and forecasted liquidity, as well as financial and other business conditions existing at the time. As of the end of fiscal 2010, total dividends paid amounted to $57.0 million comprising of $44.5 million for the $1.00 per share special one-time cash dividend paid in the first quarter of fiscal 2010 and $12.5 million (of which $3.1 million was paid in the fourth quarter of fiscal 2010) for the $0.07 per share regular quarterly cash dividends initiated in the first quarter of fiscal 2010. We did not make any dividend payments during fiscal 2009 and 2008.
NOTE 5. Property and Equipment
Property and equipment are summarized as follows (in thousands):
|
Fiscal Year
|
||||||||
|
2010
|
2009
|
|||||||
|
Leasehold improvements
|
$ | 163,011 | $ | 168,550 | ||||
|
Furniture, fixtures and equipment
|
119,416 | 116,516 | ||||||
|
Software and licenses
|
66,627 | 55,957 | ||||||
|
Building and land
|
14,270 | 14,270 | ||||||
| 363,324 | 355,293 | |||||||
|
Less: Accumulated depreciation and amortization
|
(240,105 | ) | (215,041 | ) | ||||
|
Property and equipment, net
|
$ | 123,219 | $ | 140,252 | ||||
We recorded depreciation expense in the amounts of $40.9 million, $38.3 million and $38.3 million for fiscal 2010, 2009 and 2008, respectively.
F-16
During the fourth quarter of fiscal 2009, we entered into a capital lease relating to certain computer equipment. The computer equipment was placed in service on December 31, 2009. Furniture, fixtures and equipment as well as accumulated depreciation and amortization in the table above include the following amounts related to this capital lease (in thousands):
|
Fiscal Year
|
||||||||
|
2010
|
2009
|
|||||||
|
Computer equipment
|
$ | 837 | $ | 837 | ||||
| 837 | 837 | |||||||
|
Less: Accumulated depreciation and amortization
|
(302 | ) | (23 | ) | ||||
|
Computer equipment, net
|
$ | 535 | $ | 814 | ||||
NOTE 6. Accrued Liabilities
Accrued liabilities consist of the following (in thousands):
|
Fiscal Year
|
||||||||
|
2010
|
2009
|
|||||||
|
Accrued payroll and related expenses
|
$ | 11,377 | $ | 11,733 | ||||
|
Gift cards, gift certificates and store merchandise credits
|
7,644 | 7,606 | ||||||
|
Accrued self insurance liabilities
|
3,923 | 3,542 | ||||||
|
Accrued sales and use tax
|
3,350 | 5,293 | ||||||
|
Accrued cost of fixed assets and software
|
825 | 1,261 | ||||||
|
Other
|
10,844 | 11,389 | ||||||
|
Accrued liabilities
|
$ | 37,963 | $ | 40,824 | ||||
NOTE 7. Fair Value Measurements
Our financial assets and liabilities are valued at the price that would be received to sell an asset or paid to transfer a liability (an exit price) in an orderly transaction between market participants at the measurement date. We determine fair value based on assumptions that market participants would use in pricing an asset or liability. As a basis for considering such assumptions, we prioritize the inputs used in measuring fair value into a three-tier fair value hierarchy, which are as follows:
Level 1: Observable inputs such as quoted prices in active markets (the fair value hierarchy gives the highest priority to Level 1 inputs);
Level 2: Inputs, other than the quoted prices in active markets, that are observable either directly or indirectly; and
Level 3: Unobservable inputs in which there is little or no market data and require the reporting entity to develop its own assumptions (the fair value hierarchy gives the lowest priority to Level 3 inputs).
Financial assets and liabilities measured at fair value on a recurring basis as of the end of fiscal 2010 consisted of the following (in thousands):
F-17
|
Balance at
January 29, 2011
|
Quoted Prices
in Active
Markets for
Identical
Items
(Level 1)
|
Significant
Other
Observable
Inputs
(Level 2)
|
Significant
Unobservable
Inputs
(Level 3)
|
|||||||||||||
|
Assets:
|
||||||||||||||||
|
Marketable securities (current)
|
$ | 20,280 | $ | 20,280 | $ | - | $ | - | ||||||||
|
Certificates of deposit (current)
|
$ | 4,960 | 4,960 | - | - | |||||||||||
|
Marketable securities (non-current)
|
$ | 508 | 508 | - | - | |||||||||||
|
Auction rate securities (non-current)
|
$ | 2,475 | - | - | 2,475 | |||||||||||
|
Total assets
|
$ | 28,223 | $ | 25,748 | $ | - | $ | 2,475 | ||||||||
|
Liabilities:
|
||||||||||||||||
|
Deferred compensation plan (non-current)
|
$ | 4,289 | $ | 4,289 | $ | - | $ | - | ||||||||
Financial assets and liabilities measured at fair value on a recurring basis as of the end of fiscal 2009 consisted of the following (in thousands):
|
Balance at
January 30, 2010
|
Quoted Prices
in Active
Markets for
Identical
Items
(Level 1)
|
Significant
Other
Observable
Inputs
(Level 2)
|
Significant
Unobservable
Inputs
(Level 3)
|
|||||||||||||
|
Assets:
|
||||||||||||||||
|
Marketable securities (current)
|
$ | 5,301 | $ | 5,301 | $ | - | $ | - | ||||||||
|
Certificates of deposit (non-current)
|
$ | 4,972 | 4,972 | - | - | |||||||||||
|
Auction rate securities (non-current)
|
$ | 3,220 | - | - | 3,220 | |||||||||||
|
Total assets
|
$ | 13,493 | $ | 10,273 | $ | - | $ | 3,220 | ||||||||
|
Liabilities:
|
||||||||||||||||
|
Deferred compensation plan (non-current)
|
$ | 2,987 | $ | 2,987 | $ | - | $ | - | ||||||||
The fair value of our short-term marketable securities, certificates of deposit and deferred compensation plan liability is determined based on quoted prices of identical assets that are trading in active markets. The deferred compensation plan liability represents the amount that would be earned by participants if the funds were invested in securities traded in active markets. Due to the lack of availability of observable market quotes on our auction rate securities, the fair market value of these securities has been determined based on a valuation model using current assumptions. The model values the securities by estimating the present value of future principal and interest payments discounted at rates considered to reflect current market conditions. Assumptions used in the valuation include those made about the liquidity horizon, or period of time expected, before the securities are successfully auctioned; coupon rates; weighted average cost of capital; and holding spreads and yields. Other factors that impact our valuation include changes to credit ratings of our auction rate securities as well as to the underlying assets supporting these securities and the ongoing strength and quality of the credit markets. Our valuation is subject to uncertainties that are difficult to predict and could change significantly based on future market conditions.
The activity of our auction rate securities in fiscal 2010 and 2009, whose fair value was measured using Level 3 inputs, is summarized below (in thousands):
F-18
|
Fiscal Year
|
||||||||
|
2010
|
2009
|
|||||||
|
Carrying value at beginning of year
|
$ | 3,220 | $ | 8,402 | ||||
|
Redemptions
|
(900 | ) * | (6,500 | ) | ||||
|
Total gains
|
||||||||
|
Included in earnings
|
- | - | ||||||
|
Included in other comprehensive income
|
155 | ** | 1,318 | |||||
|
Carrying value at end of year
|
$ | 2,475 | $ | 3,220 | ||||
* Redemptions of $0.8 million and $0.1 million occurred during the second and fourth quarters of fiscal 2010, respectively.
** Unrealized gains of $9,000 and $50,000 occurred during the first and fourth quarters of fiscal 2010, respectively, and unrealized losses of $70,000 and $16,000 occurred during the second and third quarters of fiscal 2010, respectively. In addition, the recovery in fair value of $9,000, $128,000 and $45,000 which was previously temporarily impaired occurred during the first, second and fourth quarters of fiscal 2010, respectively.
NOTE 8. Bank Credit Agreement
We maintain an unsecured bank credit agreement of $5.0 million that will expire on September 1, 2011. Letters of credit, which are primarily used for inventory purchases, are issued under the credit agreement. There were letters of credit for $3,000 and $111,000 outstanding as of the end of fiscal 2010 and 2009, respectively.
NOTE 9. Commitments and Contingencies
Leases We have entered into operating lease agreements for retail, distribution and office space, vehicles and equipment under primarily non-cancelable leases with terms ranging from approximately two to ten years. The retail space leases provide for rents based upon the greater of the minimum annual rental amounts or a percentage of annual store sales volume. Certain leases provide for increasing minimum annual rental amounts. Rent expense is recorded on a straight-line basis over the term of the lease based on us taking possession of premises. Accordingly, deferred rent, as reflected in the accompanying balance sheets, represents the difference between rent expense accrued and amounts paid under the terms of the lease agreements. Total rent expense for fiscal 2010, 2009 and 2008 was $52.6 million, $53.6 million and $54.8 million, respectively, including contingent rentals of $0.2 million, $0.6 million and $0.9 million, respectively.
F-19
Annual future minimum lease payments under operating leases as of the end of fiscal 2010 are as follows (in thousands):
|
Fiscal Year
|
||||
|
2011
|
$ | 57,767 | ||
|
2012
|
49,279 | |||
|
2013
|
41,307 | |||
|
2014
|
33,355 | |||
|
2015
|
25,286 | |||
|
Thereafter
|
41,617 | |||
|
Total minimum operating lease payments
|
$ | 248,611 | ||
During the fourth quarter of fiscal 2009, we entered into a capital lease with a 20-month term relating to certain computer equipment. The computer equipment was placed in service on December 31, 2009. Annual future minimum lease payments under this capital lease as of the end of fiscal 2010 are as follows (in thousands):
|
Fiscal Year
|
||||
|
2011
|
$ | 191 | ||
|
Total minimum capital lease payments
|
191 | |||
|
Less weighted average interest rate
|
||||
|
of 3.25% on capital lease
|
(2 | ) | ||
| $ | 189 | |||
Litigation On July 14, 2010, an employee filed a lawsuit against us in the Superior Court of California, County of Los Angeles, on behalf of herself and a putative class. The lawsuit asserts claims for failure to provide adequate meal or rest breaks, failure to pay regular and overtime wages, failure to timely pay wages at end of employment, failure to indemnify employees for necessary expenditures and unfair business practices. The lawsuit seeks compensatory damages, restitution, special damages, statutory penalties, punitive damages, attorneys' fees and injunctive relief. We intend to vigorously defend ourselves against the various claims, though at the present time we are unable to predict the outcome of this matter.
From time to time, we are involved in other matters of litigation that arise in the ordinary course of business. Though significant litigation or awards against us could seriously harm our business and financial results, we do not at this time expect any of our litigation to have a material adverse effect on our overall financial condition.
Indemnities, Commitments and Guarantees During the ordinary course of business, we have made certain indemnities, commitments and guarantees under which we may be required to make payments in relation to certain transactions. These indemnities include those given to various lessors in connection with facility leases for certain claims arising from such facility or lease and indemnities to our directors and officers to the maximum extent permitted under the laws of the State of California. From time to time, we have issued guarantees in the form of letters of credit as security for some merchandise shipments from overseas (our letters of credit are discussed in more detail in “NOTE 8 – Bank Credit Agreement” contained in these consolidated financial statements and Notes). The durations of these indemnities, commitments and guarantees vary. Some of these indemnities, commitments and guarantees do not provide for any limitation of the maximum potential future payments we could be obligated to make. We have not recorded any liability for these indemnities, commitments and guarantees in the accompanying consolidated financial statements.
F-20
NOTE 10. Income Taxes
(Benefit) Provision for Income Taxes Composition of the (benefit) provision for income taxes for the years ended (in thousands):
|
Fiscal Year
|
||||||||||||
|
2010
|
2009
|
2008
|
||||||||||
|
Current:
|
||||||||||||
|
Federal
|
$ | (4,040 | ) | $ | 4,198 | $ | 12,887 | |||||
|
State
|
(372 | ) | 834 | 2,514 | ||||||||
| (4,412 | ) | 5,032 | 15,401 | |||||||||
|
Deferred:
|
||||||||||||
|
Federal
|
(814 | ) | 2,663 | (2,052 | ) | |||||||
|
State
|
35 | 191 | (599 | ) | ||||||||
| (779 | ) | 2,854 | (2,651 | ) | ||||||||
|
Total income tax (benefit) expense
|
$ | (5,191 | ) | $ | 7,886 | $ | 12,750 | |||||
Significant components of our deferred tax assets and liabilities are as follows (in thousands):
|
Fiscal Year
|
||||||||
|
2010
|
2009
|
|||||||
|
Current deferred tax assets (liabilities):
|
||||||||
|
Inventory
|
$ | 675 | $ | 773 | ||||
|
Accrued expense and other
|
4,482 | 4,559 | ||||||
|
State taxes
|
(409 | ) | 172 | |||||
|
Other assets, net
|
1,302 | 688 | ||||||
|
Net current deferred tax assets
|
6,050 | 6,192 | ||||||
|
Noncurrent deferred tax assets (liabilities):
|
||||||||
|
Depreciation
|
(4,687 | ) | (4,945 | ) | ||||
|
Deferred rent
|
4,147 | 4,629 | ||||||
|
Stock-based compensation expense
|
5,470 | 4,437 | ||||||
|
Other assets, net
|
338 | 390 | ||||||
|
Total noncurrent deferred tax assets
|
5,268 | 4,511 | ||||||
|
Net deferred tax assets
|
$ | 11,318 | $ | 10,703 | ||||
F-21
A reconciliation of the benefit / provision for income taxes to the statutory tax rate is as follows:
|
Fiscal Year
|
||||||||||||
|
2010
|
2009
|
2008
|
||||||||||
|
Statutory federal rate
|
35.0 | % | 35.0 | % | 35.0 | % | ||||||
|
State and local taxes, net of federal benefit and other
|
1.6 | 3.3 | 3.9 | |||||||||
|
Stock-based compensation expense
|
(0.5 | ) | 0.3 | 0.2 | ||||||||
|
Other permanent differences
|
2.6 | 1.3 | 0.1 | |||||||||
|
Effective income tax rate
|
38.7 | % | 39.9 | % | 39.2 | % | ||||||
We operate in numerous tax jurisdictions and are subject to routine tax examinations. Future tax examinations could involve difficult issues and multiple years. Although we cannot predict the outcome of future examinations, amounts that could be owed in excess of amounts accrued would impact future tax expense but would not be expected to have a material impact on our financial condition.
Uncertain Tax Positions As of the end of fiscal 2010, the total liability for income tax associated with unrecognized tax benefits was $2.6 million ($2.2 million net of federal benefit), of which $0.4 million ($0.2 million net of federal benefit) related to interest and $0.2 million related to penalties. Our effective tax rate will be affected by any portion of this liability we may recognize. As of the end of fiscal 2009, the total liability for income tax associated with unrecognized tax benefits was $2.9 million ($2.4 million net of federal benefit), of which $0.3 million ($0.2 million net of federal benefit) related to interest and $0.4 million related to penalties.
We believe that it is reasonably possible that $0.6 million ($0.2 million net of federal benefit) of our liability for unrecognized tax benefits of which $0.2 million ($0.1 million net of federal benefit) of associated interest may be recognized in the next 12 months due to the settlement of audits and the expiration of statutes of limitations. As such, we have classified this amount as a current liability.
The following table reconciles the amount recorded for the liability for income tax associated with unrecognized tax benefits as of the end of fiscal 2010 and 2009 (in thousands):
|
Fiscal Year
|
||||||||
|
2010
|
2009
|
|||||||
|
Unrecognized tax benefits - beginning of year
|
$ | 2,177 | $ | 2,173 | ||||
|
Additions:
|
||||||||
|
Tax positions related to prior period
|
59 | 705 | ||||||
|
Tax positions related to current period
|
45 | 38 | ||||||
|
Reductions:
|
||||||||
|
Tax positions related to prior period
|
(162 | ) | (152 | ) | ||||
|
Settlements
|
(9 | ) | (420 | ) | ||||
|
Lapse of statute of limitations
|
(93 | ) | (167 | ) | ||||
|
Unrecognized tax benefits - end of year
|
$ | 2,017 | $ | 2,177 | ||||
Our continuing practice is to recognize interest and penalties related to unrecognized tax benefits as a tax expense. Tax expense for fiscal 2010 related to interest and penalties was $0.1 million and as of the end of fiscal 2010, we had accrued $0.6 million of interest and penalties related to uncertain tax positions. Tax expense for fiscal 2009 related to interest and penalties was $0.2 million, and as of the end of fiscal 2009, we had accrued $0.7 million of interest and penalties related to uncertain tax positions.
F-22
We operate stores throughout the United States, Puerto Rico and Canada, and as a result, we file income tax returns in the United States federal jurisdiction and various state, local and foreign jurisdictions. In the normal course of business, we are subject to examination by taxing authorities. With few exceptions, we are no longer subject to United States federal, state, local or foreign income tax examinations for years before fiscal 2004. While it is often difficult to predict the final outcome or the timing or resolution of any particular uncertain tax position, we believe our reserves for income taxes represent the most probable outcome. We adjust these reserves, as well as the related interest and penalties, in light of changing facts and circumstances.
NOTE 11. (Loss) Earnings Per Share
Basic earnings or loss per share is computed by dividing net income or net loss, respectively, by the weighted average number of common shares outstanding for the period. Diluted earnings per share is applicable only in periods of net income and is computed by dividing net income by the weighted average number of common shares outstanding for the period and potentially dilutive common stock equivalents outstanding for the period. Periods of net loss require the diluted computation to be the same as the basic computation. As of the end of fiscal 2010, 2009 and 2008, options to purchase 6,309,421, 5,483,812 and 6,062,339 shares, respectively, of potentially anti-dilutive common stock equivalents were outstanding. The calculation of dilutive shares also excludes the portion of the performance stock awards granted to certain members of our management in March 2009 and March 2008 that are not expected to be earned or vest as the issuance of the underlying shares is contingent upon achieving certain performance goals in fiscal 2011 and 2010, respectively.
A reconciliation of the numerator and denominator of basic and diluted (loss) earnings per share is as follows (in thousands except per share amounts):
|
Fiscal Year
|
||||||||||||
|
2010
|
2009
|
2008
|
||||||||||
|
Basic (loss) earnings per share computation:
|
||||||||||||
|
Numerator
|
$ | (8,235 | ) | $ | 11,880 | $ | 19,742 | |||||
|
Denominator:
|
||||||||||||
|
Weighted average common shares outstanding
|
44,554 | 44,134 | 43,789 | |||||||||
|
Basic (loss) earnings per share
|
$ | (0.18 | ) | $ | 0.27 | $ | 0.45 | |||||
|
Diluted (loss) earnings per share computation:
|
||||||||||||
|
Numerator
|
$ | (8,235 | ) | $ | 11,880 | $ | 19,742 | |||||
|
Denominator:
|
||||||||||||
|
Weighted average common shares outstanding
|
44,554 | 44,134 | 43,789 | |||||||||
|
Incremental shares from assumed exercise of options
|
- | 275 | 124 | |||||||||
|
Total shares
|
44,554 | 44,409 | 43,913 | |||||||||
|
Diluted (loss) earnings per share
|
$ | (0.18 | ) | $ | 0.27 | $ | 0.45 | |||||
NOTE 12. Share Repurchases
In fiscal 2007, 2005 and 2004, we announced that our Board approved share repurchase plans in which we repurchased 870,470, 1,435,000 and 4,000,000 shares of our common stock, respectively. We did not repurchase any shares of our common stock during fiscal 2010, 2009 or 2008. All share repurchase programs have since expired.
F-23
NOTE 13. Employee Benefit Plan
Effective January 1, 1995, we adopted the Hot Topic 401(k) Plan, or the 401(k) Plan. All employees who have been employed by us for at least one year, maintained a minimum of 1,000 hours worked during the year and are at least 21 years of age, are eligible to participate. Employees may contribute up to 25% of their eligible compensation to the 401(k) Plan, subject to a statutorily prescribed annual limit. We may at our discretion contribute certain amounts to eligible employees’ accounts. In January 2009, we began to contribute 50% of the first 4% of participants’ eligible contributions into their 401(k) Plan accounts. We contributed $384,000 and $319,000 to eligible employees’ 401(k) accounts during fiscal 2010 and 2009 respectively. Our contribution during fiscal 2008 was not material and we did not make any contribution during fiscal 2007.
NOTE 14. Deferred Compensation Plan
In August 2006, we adopted the Hot Topic Inc. Management Deferred Compensation Plan, or the Deferred Compensation Plan, for the purpose of providing highly compensated employees and members of our Board a program to meet their financial planning needs. The Deferred Compensation Plan provides participants with the opportunity to defer up to 80% of their base salary and up to 100% of their annual earned bonus, or, in the case of members of our Board, 100% of their earned cash fees, all of which, together with the associated investment returns, are 100% vested from the outset. The Deferred Compensation Plan, which is designed to be exempt from most provisions of the Employee Retirement Security Act of 1974, is informally funded by us in order to preserve the tax-deferred savings advantages of a non-qualified plan. As such, all deferrals and associated earnings are general unsecured obligations of Hot Topic, Inc. held within a “rabbi trust” on our consolidated balance sheet. We may at our discretion contribute certain amounts to eligible employees’ accounts. In January 2009, we began to contribute 50% of the first 4% of participants’ eligible contributions into their Deferred Compensation Plan accounts. As of the end of fiscal 2010, assets and associated liabilities of the Deferred Compensation Plan were $4.3 million and $4.3 million, respectively, and are included in other non-current assets and non-current liabilities, respectively, in our consolidated balance sheets. As of the end of fiscal 2009, assets and associated liabilities of the Deferred Compensation Plan were $3.1 million and $3.0 million, respectively.
NOTE 15. Subsequent Events
In February 2011, we entered into a consulting agreement with Lisa Harper, a member of our Board and former member of the Compensation Committee of the Board. Under the agreement, we retained Ms. Harper as an independent consultant from February 14, 2011 to May 13, 2011 (the “Term”) unless, at our election, the agreement was extended from the end of the Term to August 15, 2011 (the “Extended Term”). Ms. Harper advised us and performed additional duties as mutually agreed by her and us. In consideration of these consulting services, it was agreed that Ms. Harper would receive a cash payment of $32,500 each month for and during the Term and for and during the Extended Term, if applicable. Upon the commencement of the Term, Ms. Harper received a grant of restricted stock for the number of shares of the Company’s common stock closest in value, as of the grant date, to $97,500. It was agreed that Ms. Harper would receive another grant of restricted stock of the same value upon the commencement of the Extended Term, if applicable. Effective March 21, 2011, Ms. Harper was appointed our Chief Executive Officer and the consulting agreement terminated. The total consideration received by Ms. Harper for her consulting services consisted of a cash payment of $32,500 and a grant of 17,568 restricted stocks. The market value of our common stock as of the grant date of the restricted stock award was $5.55.
In March 2011, the Board approved certain business changes to better position the company for growth. The business changes will involve discontinuing the operations of ShockHound; writing down inventory that, due to an accounting estimate change, we believe is now unproductive; and writing down fixed assets that are no longer critical to our strategic direction. In connection with the business changes, along with the severance costs related to recent changes in management, we estimate that we will incur a total pre-tax charge of approximately $15 million primarily in the first quarter of fiscal 2011, a portion of which will be a non-cash charge of approximately $9 million. The $15 million charge includes $0.6 million of additional charges that we expect to incur in fiscal 2011 related to the cost reduction plan implemented in fiscal 2010 (explained in more detail in “NOTE 2 – Cost Reduction Plan” contained in these consolidated financial statements and Notes).
F-24