Attached files
| file | filename |
|---|---|
| EX-32 - SAJAN INC | v216368_ex32.htm |
| EX-31.1 - SAJAN INC | v216368_ex31-1.htm |
| EX-23.1 - SAJAN INC | v216368_ex23-1.htm |
| EX-31.2 - SAJAN INC | v216368_ex31-2.htm |
UNITED STATES SECURITIES AND EXCHANGE COMMISSION
WASHINGTON, D.C. 20549
FORM 10-K
(Mark One)
|
x
|
ANNUAL REPORT PURSUANT TO SECTION 13 OR 15(d) OF THE SECURITIES EXCHANGE ACT OF 1934
|
For the fiscal year ended December 31, 2010
or
|
¨
|
TRANSITION REPORT PURSUANT TO SECTION 13 OR 15(d) OF THE SECURITIES EXCHANGE ACT OF 1934
|
For the transition period from _______________________ to ___________________
Commission File Number: 000-51560
Sajan, Inc.
(Exact name of registrant as specified in its charter)
|
Delaware
|
41-1881957
|
|
(State of incorporation)
|
(I.R.S. Employer Identification No.)
|
|
|
|
|
625 Whitetail Blvd., River Falls, Wisconsin
|
54022
|
|
(Address of principal executive offices)
|
(Zip Code)
|
Registrant’s telephone number, including area code: (715) 426-9505
|
Securities registered pursuant to Section 12(b) of the Act:
|
||
|
Title of Each Class
|
|
Name of Each Exchange on which Registered
|
|
None
|
|
|
Securities registered pursuant to Section 12(g) of the Act:
Common Stock, $0.01 par value per share
Preferred Stock Purchase Rights
Indicate by check mark if the registrant is a well-known seasoned issuer, as defined in Rule 405 of the Securities Act. ¨ Yes x No
Indicate by check mark if the registrant is not required to file reports pursuant to Section 13 or Section 15(d) of the Act. ¨ Yes x No
Indicate by check mark whether the registrant (1) has filed all reports required to be filed by Section 13 or 15(d) of the Securities Exchange Act of 1934 during the preceding 12 months (or for such shorter period that the registrant was required to file such reports), and (2) has been subject to the filing requirements for the past 90 days.
x Yes ¨ No
Indicate by check mark whether the registrant has submitted electronically and posted on its corporate website, if any, every Interactive Data File required to be submitted and posted pursuant to Rule 405 of Regulation S-T (§232.405 of this chapter) during the preceding 12 months (or for such shorter period that the registrant was required to submit and post such files). ¨ Yes ¨ No
Indicate by check mark if disclosure of delinquent filers pursuant to Item 405 of Regulation S-K is not contained herein, and will not be contained, to the best of registrant’s knowledge, in definitive proxy or information statements incorporated by reference in Part III of this Form 10-K or any amendment to this Form 10-K. x
Indicate by check mark whether the registrant is a large accelerated filer, an accelerated filer, a non-accelerated filer or a smaller reporting company. See definition of “accelerated filer,” large accelerated filer” and “smaller reporting company” in Rule 12b-2 of the Exchange Act. (Check one):
Large accelerated filer ¨ Accelerated filer ¨ Non-accelerated filer ¨Smaller reporting company x
Indicate by check mark whether the registrant is a shell company (as defined in Rule 12b-2 of the Act).
¨ Yes x No
The aggregate market value of the outstanding common stock, other than shares held by persons who may be deemed affiliates of the registrant, as of the last day of the registrant’s most recently completed fiscal year end was approximately $10,146,573 based on the closing sales price of $0.95 per share as reported on the OTC.
BB market. As of March 15, 2011, there were 16,009,331 shares of our common stock, $0.01 par value per share, outstanding.
DOCUMENTS INCORPORATED IN PART BY REFERENCE
None.
2010 Annual Report on Form 10-K
Table of Contents
[Note: TOC will need to be updated after all revisions are made.]
|
Page
|
||
|
PART I
|
||
|
Item 1.
|
Business
|
3
|
|
Item 1A.
|
Risk Factors
|
11
|
|
Item 1B.
|
Unresolved Staff Comments
|
21
|
|
Item 2.
|
Properties
|
21
|
|
Item 3.
|
Legal Proceedings
|
22
|
|
Item 4.
|
Reserved
|
23
|
|
PART II
|
||
|
Item 5.
|
Market for Registrant’s Common Equity, Related Stockholder Matters and Issuer Purchases of Equity Securities
|
24
|
|
Item 6.
|
Selected Financial Data
|
24
|
|
Item 7.
|
Management’s Discussion and Analysis of Financial Condition and Results of Operations
|
24
|
|
Item 7A.
|
Quantitative and Qualitative Disclosures About Market Risk
|
32
|
|
Item 8.
|
Financial Statements and Supplementary Data
|
33
|
|
Item 9.
|
Changes in and Disagreements with Accountants on Accounting and Financial Disclosure
|
58
|
|
Item 9A.
|
Controls and Procedures
|
58
|
|
Item 9B.
|
Other Information
|
61
|
|
PART III
|
||
|
Item 10.
|
Directors, Executive Officers and Corporate Governance
|
62
|
|
Item 11.
|
Executive Compensation
|
66
|
|
Item 12.
|
Security Ownership of Certain Beneficial Owners and Management and Related Stockholder Matters
|
69
|
|
Item 13.
|
Certain Relationships and Related Transactions and Director Independence
|
71
|
|
Item 14.
|
Principal Accountant Fees and Services
|
72
|
|
PART IV
|
||
|
Item 15.
|
Exhibits and Financial Statement Schedules
|
73
|
|
Signatures
|
76
|
CAUTIONARY NOTICE REGARDING FORWARD-LOOKING STATEMENTS
This Annual Report on Form 10-K contains forward-looking statements within the meaning of Section 27A of the Securities Act of 1933, as amended, and Section 21E of the Securities Exchange Act of 1934 (“Securities Exchange Act”). Forward-looking statements reflect the current view about future events. When used in this Annual Report on Form 10-K, the words “anticipate,” “will,” “believe,” “estimate,” “expect,” “future,” “intend,” “plan” and similar expressions or the negative of these terms as they relate to Sajan, Inc., its subsidiaries or its management identify forward-looking statements. Forward-looking statements are based on information available at the time the statements are made and involve known and unknown risks, uncertainties and other factors that may cause our results, levels of activity, performance or achievements to be materially different from the information expressed or implied by the forward-looking statements. Such statements reflect the current view of the management of Sajan, Inc. with respect to future events and are subject to risks, uncertainties, assumptions and other factors (including the risks contained in the section of this Annual Report on Form 10-K entitled “Risk Factors”) relating to Sajan, Inc.’s industry, its operations and results of operations, and any businesses that may be acquired by it. These factors include:
|
|
·
|
rate of growth in the global multi-lingual content delivery industry, especially for software-as-a-service solutions within this industry;
|
|
|
·
|
changes in the utilization of our software and services by our customers;
|
|
|
·
|
lack of acceptance of any existing or new solutions we offer;
|
|
|
·
|
our ability to continue increasing the number of our customers or the revenues we derive from our recurring revenue customers;
|
|
|
·
|
continued economic weakness and constrained globalization spending by businesses operating in international markets;
|
|
|
·
|
our ability to effectively develop new solutions that compete effectively with the solutions that our current and future competitors offer;
|
|
|
·
|
risk of increased regulation of the Internet and business conducted via the Internet;
|
|
|
·
|
our ability to identify attractive acquisition opportunities, successfully negotiate acquisition terms and effectively integrate any acquired companies or businesses;
|
|
|
·
|
our ability to effectively manage our growth;
|
|
|
·
|
availability of capital on acceptable terms to finance our continued growth;
|
|
|
·
|
risks of conducting international commerce, including foreign currency exchange rate fluctuations, changes in government policies or regulations, longer payment cycles, trade restrictions, economic or political instability in foreign countries where we may increase our business and reduced protection of our intellectual property;
|
|
|
·
|
our ability to add sales and marketing, research and development or other key personnel who are able to successfully sell or develop our solutions;
|
|
|
·
|
our ability to operate as a public company and comply with applicable disclosure and other requirements and to hire additional personnel with public company compliance experience; and
|
|
|
·
|
other risk factors included under “Risk Factors” in this Annual Report on Form 10-K.
|
Should one or more of these risks or uncertainties materialize, or should the underlying assumptions prove incorrect, actual results may differ significantly from those anticipated, believed, estimated, expected, intended or planned. Although the management of Sajan, Inc. believes that the expectations reflected in the forward-looking statements are reasonable, it cannot guarantee future results, levels of activity, performance or achievements. Except as required by applicable law, including the securities laws of the United States, Sajan, Inc. does not intend to update any of the forward-looking statements to conform these statements to actual results. The following discussion should be read in conjunction with the financial statements and the related notes and the pro forma financial information included in this Annual Report on Form 10-K.
2
PART I
ITEM 1. BUSINESS
Sajan, Inc. provides language translation solutions to customers selling products into global markets or those customers otherwise requiring accurate language translation of many varieties of content. Sajan also offers its customers a robust Translation Management System (TMS) technology which is cloud-based to deliver business process automation, cost reduction and improve the quality of translated content. These customers use our solutions to translate product manuals, instructions, warnings, and other product information into numerous languages. We combine our internally developed proprietary technology and high quality translation services to provide language translation solutions that are fast, reliable, and user-friendly. By utilizing an integrated technology and a service-based approach to language translation, we offer a comprehensive solution that allow customers to rely upon a single provider to meet all of their language translation needs. For those customers requiring use of multiple service vendors, Sajan offers a complete Managed Service solution which provides the required flexibility, yet delivers the technology advantages. The overall solution can be described as modular and highly scalable, it extends from small workgroup environments to large enterprises.
We offer our customers the ability to utilize our solutions under two different models:
|
|
·
|
Technology Enabled Service Model: we provide all of the customer’s language translation requirements, and;
|
|
|
·
|
Managed Service Model: customers use our technology and operations staff to manage translators or other language service vendors.
|
Our solutions are used to manage the end-to-end process of content globalization, which is the project, process and delivery management of content translated and localized into multiple languages across the enterprise. Content is localized across the enterprise for a wide variety of high value-added purposes and uses, most notably, product sales and marketing, packaging, user manuals, technical support and training, as well as internal requirements.
Merger Transaction
On February 23, 2010, pursuant to the Merger Agreement, by and among MathStar, a Delaware corporation, and Sajan, a privately held Minnesota corporation whose business was providing language translation technology and service, Garuda, a wholly-owned subsidiary of MathStar, and Thomas Magne, solely in his capacity as agent for the holders of common stock of pre-Merger Sajan, pre-Merger Sajan was merged with and into Garuda. Garuda was the surviving entity in the Merger and subsequently changed its name to Sajan, LLC. As a result of the Merger, pre-Merger Sajan became a wholly-owned subsidiary of MathStar. MathStar then changed its name to “Sajan, Inc.” and continues the language translation technology and service business of pre-Merger Sajan. For accounting purposes, pre-Merger Sajan is treated as the continuing reporting entity that acquired MathStar because pre-Merger Sajan obtained effective control of MathStar as a result of the Merger. This transaction is referred to throughout this report as the “Merger” and, unless otherwise indicated, we refer to the surviving public company following the Merger as “Sajan”, “Sajan, Inc.”, “we”, “us”, “our” or the “Company” and to MathStar prior to the Merger as “MathStar.”
Sajan (formerly MathStar) was incorporated under Minnesota law in April 1997, and was reincorporated under Delaware law on June 14, 2005. During the three months ended June 30, 2008, MathStar curtailed its operations as its board of directors evaluated strategic alternatives, including, but not limited to, restarting the company, merging with or acquiring another company, increasing operations in another structure, or liquidation. Until it curtailed operations, MathStar was a fabless semiconductor company engaged in the development, marketing and selling of its high-performance, programmable platform field programmable object array, or FPOA, chips and design tools required to program its chips. Immediately before the date of the Merger, MathStar was a “shell company”, as defined in Rule 12b-2 under the Securities and Exchange Act of 1934, as amended, having no or nominal operations, and assets consisting solely cash and cash equivalents.
3
As a result of the Merger, pre-Merger Sajan’s 5,573,742 shares of common stock were exchanged for 6,827,734 shares of pre-Merger Sajan common stock, or an exchange of 1 pre-Merger Sajan common share for 1.225 pre-Merger Sajan common shares. Options to purchase pre-Merger Sajan common stock issued under pre-Merger Sajan’s 2001 Stock Option Plan and certain non-plan options and warrants were converted into options and warrants to purchase MathStar common stock and remain outstanding as options and warrants to purchase shares of pre-Merger Sajan common stock. Immediately after the closing of the Merger, the former stockholders of pre-Merger Sajan owned approximately 43% of the outstanding shares of pre-Merger Sajan common stock. At the time of Merger, 112,500 shares, valued at $364,000 per management’s determination of fair value at the time of the Merger, were recorded for dissenter shares.
In 2009, we established Sajan Software Ltd (“Sajan Software”), which is based in Dublin, Ireland. The Ireland facility serves as both a Global Language Service Center and is home to Sajan Software Ltd, the producer of Sajan’s technology tools. Sajan India Software Private Limited (“Sajan – India”), based in Delhi, India, houses our development center at which we conduct substantially all of our software development activities. Sajan-India is a wholly-owned subsidiary of Sajan. In 2010, we also established a Global Language Service Center in Spain, Sajan Spain S.L., to serve the European market. All of these operations are wholly-owned subsidiaries of Sajan.
Products and Services
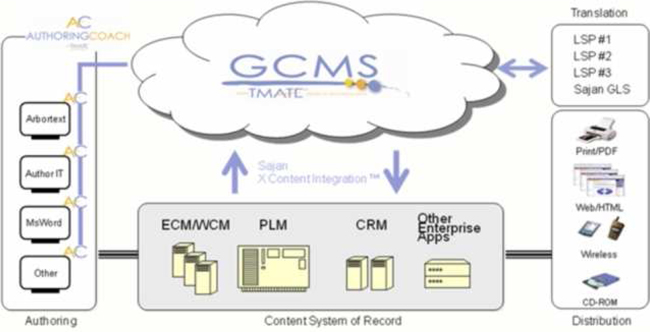
Our robust language translation solution incorporates an innovative technology product that serves as a single platform to meet the needs of the smallest user to the largest enterprise customer. The solution is a hosted platform and requires no installed software. The technology runs in the “cloud”, which means customers can access all our translation lifecycle components via an Internet browser. It is typically delivered as a software as a service (SaaS) model. We combine both language translation services and our own proprietary technology to give customers a single source solution to meet all of their translation needs. For those customers that require language service vendor flexibility, Sajan offers the technology in a Managed Service model. The solution integrates people, processes and data into a service and technology solution that is designed to deliver measurable value in the form of cost reduction, business process automation, improved quality and integrated version control and audit trail.
GCMS. Our Global Communication Management System (“GCMS”) is our cloud-based technology platform. By categorical definition it is a Translation Management System (TMS) which means the technology encompasses features which span the entire language translation lifecycle. The technology has seen two significant upgrade releases during 2010. Our GCMS platform is an integrated, fully SaaS-enabled solution suite that provides the tools to authors, linguists, graphic artists, project operations, administration and publishing staff needed to automate the project cycle for content localization from creation to delivery and to leverage enterprise translation memory (“TM”). Translation services are traditionally delivered on a per word cost basis, with ancillary fees for related services such as pre-and post-production content lay-out and TM integration. TM is the repository of past translation work which, in the case of GCMS, is parsed and stored contextually in a readily accessible data environment using proprietary algorithms that attempts to match current content with past translations. Properly optimized, the re-use of past translations from TM can significantly reduce operating costs and is an asset that is often under-utilized within the enterprise due to a lack of technology investment, fragmented responsibility of TM across the enterprise, fragmented service providers, or a lack of awareness of the economic value of TM. Our business model and strategy are focused on providing services and technologies to remedy such situations and facilitate enterprise customers’ optimization of TM. Our solutions increase worker productivity, accelerate critical time-to-market for customers, enhance the quality of globalized enterprise content, increase operational efficiency and reduce operating costs. Beyond the differentiated feature set and advanced multilingual data management capabilities of Sajan’s GCMS, the technology offers universal content connectors to easily integrate with our business systems such as Content Management Systems (CMS). Recognizing that language translation is part of a larger business process, this integration can prove quite beneficial to Sajan customers.
4
GCMS encapsulates a multilingual content repository, with built-in parsing technology that maintains language segment context. Retention of language context is, we believe, unique to our solutions and valuable for improving re-use of translated content. Simply stated, it makes the content smarter. GCMS also offers a workflow component that streamlines the language translation process. Our solution comes standard with built-in version control and audit trail, which is often well-suited for businesses in highly-regulated industries, such as life sciences companies complying with requirements imposed by the United States Food and Drug Administration. The GCMS is designed to be a modular, secure, online solution that is appropriate for any business environment. The application is an Internet-based development and computer technology, commonly referred to as a “cloud solution ,” that provides high availability and reliability to worldwide customers. In addition, we provide business analytics directly to customers through our system. Using web services, system features can be integrated to other business systems.
Technological Features. We have developed a number of tools that are designed to create value throughout the language translation process, particularly in the pre-translation process of authoring or content creation. Authoring Coach™ is a desktop tool, sold individually to any source content producer, using a Windows™ based editor. It presents similar or like phrases, sentences or paragraphs to the creator and enables the creator to draw from previously translated content. The result is information that is more consistent and reduces the need for new translation. In addition, we developed our TMate™ search technology to enhance intelligent multilingual search. TMate™ is our proprietary advanced multilingual search algorithm.
Process. Utilizing the GCMS platform, human translators who provide translation services to Sajan are first systematically ranked and qualified to ensure that a high-quality language resource is performing translation on a particular project. Incorporating pre-translation processes, such as Authoring Coach and advanced search using TMate™, further differentiates the platform and we believe provides greater price and value differentiation. We believe our technological advances, detailed process methodology, and ISO 9000 practices result in reduced costs while delivering a higher value to the customer. This method offers a blend of both service and technology. Customers may sign in online, request translation of new content, view the status of pending projects, and obtain completed projects. All content is stored at a granular level, referred to as a segment, with language context retained, and each translated segment is stored indefinitely. This capability allows us to offer audit trail and version control, which are useful to regulated businesses operating in industries where compliance is important. An illustration of the content translation lifecycle is provided below.
5
GCMS Advantages. By utilizing a language management platform such as GCMS, we believe that customers are able to reduce the time-to-market for their products. The platform also enables enterprises to simultaneously launch products into all markets, which can result in more rapid revenue growth and a competitive advantage. The GCMS platform has been designed to ensure improved quality of multilingual content. GCMS uses advanced features, which increase the contextual accuracy of re-used multilingual content. For customers whose content accuracy and contextual sensitivity is vital, the GCMS platform offers an attractive solution to these problems. In the most recent broad research assessment, our technology was ranked as the top language Translation Management System (TMS) technology by Common Sense Advisory in its report, “Translation Management Systems, Assessments of Commercial and LSP-Specific TMS Offerings.”
We have a patent pending on a number of components that make up the GCMS platform. Specifically, the structure in which both source and target content is stored results in a logical and contextually accurate placement of content. This means that the content becomes more intelligent and can be used in ways that are more meaningful for future language translation services.
ISO Certified. According to leading industry analysts, approximately 10% of suppliers in this market claim ISO certification. The certification requires significant investment of time and money. The benefits to clients are the assurance of quality controls and defined business structure. We received our ISO 9001:2000 certification in 2005, and are currently ISO 9001:2008 certified.
Market Description
Language is often a barrier in global commerce. The demand for effective language translation continues to grow. The industry has historically been very service centric, but, as is the case in many service industries, price pressures and other market demands impose the need for innovation and new solution paradigms.
Language translation services, although often treated like a commodity service, have historically been expensive, labor intensive and relatively slow in delivery. Human translators can typically translate 2,500 words per day on average, although this varies based on the complexity of the subject matter. This creates constraints on the available supply of translation services and, when positioned against growing demand, we believe will provide translation technology innovators with an advantage. As a result, based on the rising demand for translation services and the looming shortage of human translators worldwide, we expect a favorable pricing environment for Language Service Providers (LSPs) in the coming years.
Global economic challenges have created opportunities. As the U.S. Dollar declines against foreign currency, this influences United States business executives to seek revenue from foreign markets. We believe recent negative worldwide economic conditions have hastened the trend towards globalization. In addition, growth in emerging markets will also help fuel market growth. Language translation is becoming more synonymous with revenue as critical company messages can now reach broader audiences.
We believe the shortage in human translators cast against a rising demand will result in increased opportunities for companies that offer technology-based solutions and improve the efficiency of language translation services. In theory, the language translation service market should shrink if technology is offering improved content reuse. To compete effectively, language translation companies need to obtain translation in an accurate, timely, and cost effective manner. With advances in content management and the growth of the Internet, providers will also need to integrate their multilingual content with other enterprise systems to establish a cohesive single repository of all global content. Content is no longer monolingual content; it is multilingual. Industry analysts and general business analysts have indicated that a more integrated solution, often referred to as the Global Content Lifecycle, will be required to be successful in the future for both global enterprises and for the LSPs that support them. As a result, language translation is no longer likely to be treated as an afterthought in the globalization process, but rather as an integral part of an enterprise system. Further, as the annual spending by multinational companies for language translation solutions accelerates over the next several years, we believe a more technology-based solution will be required to keep pace with the rate of growth in the amount of content and increasingly sophisticated content management solutions.
6
An additional advantage that Sajan provides is flexibility in our solution against a transforming market landscape. Many have speculated as to when the language translation technology industry will realize strong independent growth. Conceptually it makes perfect sense, however adoption of independent technology solutions, comparable with other markets like Content Management have been very slow to take off. We feel this is in part due to the complexity of the translation lifecycle and internal subject matter expertise required by companies to manage both the process and technology themselves. Sajan is well positioned as it is presently using and enhancing an industrialized technology offering, but aligning the offering to the preferred customer method. If the industry matures to a more independent technology approach, Sajan need only modify how it offers its solution, as the base technology already exists and has been stress tested.
Based on the current globalization and language translation market dependence upon non-technology oriented, small language translation firms (see chart below), we believe that vendors who provide both language translation capabilities and offer a strong technology platform will enjoy a competitive advantage.
Market Revenues. Research completed by Common Sense Advisory (“CSA”) confirms an opportune, growing market. According to CSA’s research, the global language services market is expected to reach $38 billion by 2013, nearly 90% of companies outsource some or all of their translation and localization work, and 67% of language buyers say that a vendor’s automation capabilities are important.
The global multi-lingual content delivery market is very fragmented. The combined revenues of the world’s top 40 translation firms account for less than 16% of the overall market, and most are service-only agencies. No single language translation provider exceeds 2% market share.
The breakdown of LSPs in 2008, not materially different by revenue category today, as outlined in the table below, reveals that small providers constitute a very large portion of this market. Generally, these providers have little to offer in the way of technology or value added services.
|
Revenue
|
|
Number of LSPs
|
|
Less than $1 million
|
6,380
|
|
|
$1 million-$5 million
|
391
|
|
|
$5 million-$10 million
|
64
|
|
|
$10-$50 million
|
42
|
|
|
$50 million-$500 million
|
8
|
Market Size. According to CSA, the worldwide global multi-lingual content delivery market in 2010 was $26 billion and is expected to grow to $38 billion by 2013. This equates into an approximate 13% compound annual growth rate over the three-year period. Human translation services account for over 90% of the global translation market and are generally delivered through a network of freelance linguists that freely associate among the LSPs on a per job basis. Nearly 90% of companies outsource some or all of their translation and localization work, and 67% of language buyers say that a vendor’s automation capabilities are important.
7
|
Region
|
Market
Share
|
2009
US$ M
|
2010
US$ M
|
2011
US$ M
|
2012
US$ M
|
2013
US$ M
|
||||||||||||||||||
|
North America
|
48.50 | % | 11,284 | 12,769 | 14,448 | 16,347 | 18,497 | |||||||||||||||||
|
Northern Europe
|
19.00 | % | 4,421 | 5,002 | 5,660 | 6,404 | 7,246 | |||||||||||||||||
|
Western Europe
|
11.10 | % | 2,583 | 2,922 | 3,307 | 3,741 | 4,233 | |||||||||||||||||
|
Southern Europe
|
8.59 | % | 1,999 | 2,264 | 2,559 | 2,895 | 3,276 | |||||||||||||||||
|
Asia
|
7.67 | % | 1,785 | 2,019 | 2,285 | 2,585 | 2,925 | |||||||||||||||||
|
Eastern Europe
|
4.49 | % | 1,045 | 1,182 | 1,338 | 1,513 | 1,712 | |||||||||||||||||
|
Latin America
|
0.35 | % | 81 | 92 | 104 | 118 | 133 | |||||||||||||||||
|
Africa
|
0.18 | % | 42 | 47 | 54 | 61 | 69 | |||||||||||||||||
|
Oceania
|
0.13 | % | 30 | 34 | 39 | 44 | 50 | |||||||||||||||||
|
Growth Totals
|
100 | % | 23,267 | 26,327 | 29,789 | 33,706 | 38,138 | |||||||||||||||||
Table 1: Projected Language Services Revenues and Regional Distribution
Source: Common Sense Advisory, Inc.
Source: Projected Language Services Revenues for 2009-2013 in U.S. Millions of Dollars, Common Sense Advisory, Inc.
The ability of a traditional LSP to compete is growing more challenging. While demand for the service may be rising, which should allow for price increases, the buyers currently are demanding that providers hold or reduce prices. Without technological differentiation, a traditional LSP will continue to operate at a severe disadvantage, not only in its ability to manage the delivered cost, but also to integrate and interoperate with technologies used by its clients such as content management systems and other enterprise class business systems.
Key Market Trends and Influences. Several distinct trends and influences within the global multi-lingual content delivery market have emerged, and we believe they will provide significant opportunities for market innovation. The underlying motivators for many of these include historic objectives such as cost reduction, quality improvement and schedule predictability. However, new factors are rapidly becoming apparent, such as revenue growth derived from foreign market penetration, improving global customer experience and brand support worldwide.
Competition
The global multi-lingual content delivery market is highly competitive and highly-fragmented with numerous existing competitors. We believe the principal competitive factors in providing language translation solutions include the ability to provide a comprehensive solution to customers; infrastructure that supports cost effective and high quality delivery to customers; project management expertise; quality and speed of service delivery; and corporate reputation. We believe that we have competed favorably with respect to these factors and have developed a strong reputation in our industry.
While many potential customers utilize internal resources to address their translation and localization requirements, we believe our primary competition is external and within our industry. Competitors within our industry are categorized into three primary segments: Language Service Providers, Technology Only Providers, and Technology-Enabled Service Providers.
Language Service Providers. The largest segment is comprised of competitors that offer only human language translation services and make limited use of technology on either an internal basis or as part of their solution. These service vendors are abundant due to low barriers to entry and often have only a small number of key, ongoing relationships. These providers make up the largest segment of the translation market and account for approximately 75% of the number of industry participants. The challenge for these providers is that they have little that differentiates them from other providers, with no technology and often unproven processes and quality controls. We believe that such firms offer an opportunity to increase our scale, gain access to critical linguistic skills and also open new geographic markets. We believe providing our technologies and business processes to these organizations will solidify their account base and enhance their margins.
8
Technology Only Providers. The second segment consists of pure technology providers. This group is a disparate collection of point solution and suite providers to enterprises for handling their own translation requirements. These technology solutions handle a wide range of requirements and leave much to the customers to do on their own to integrate and operate across multiple applications. Examples of competitive technology only companies are SDL Plc (SDL), Across Systems GmbH, Kilgray Translation Technologies, LingoTek, Inc., Atril and Wordfast LLC.
Within the category of technology only provider, there are two subsets. One subset consists of providers that serve the translator market most often with what is referred to as Translation Memory tools (a data management application). Often these are inexpensive productivity tools used by translators or small language service providers. The second subset are those technology providers that serve corporate enterprises. These providers operate beyond data management and include business process and analytics. These systems are often referred to as Translation Management Systems (TMS). Technology providers as a whole represent a very small portion of market participants. There has been a trend among the technology solution providers towards new, more nimble entrants embracing SaaS architecture over the more traditional enterprise software model.
Technology-Enabled Service Providers. The third segment consists of companies like us that combine both language translation services and comprehensive technology solutions, often referred to as Technology-Enabled Service Providers. The largest such company is publicly-held Lionbridge Technologies, Inc. (“Lionbridge”), with 2010 revenues of $405.2 million. There is only a small number of Technology-Enabled Service Providers. Within this group, based on the most recent CSA report, we enjoy the highest ranking for our TMS technology offering.
We believe that only a very small number of the largest LSPs, such as SDL, Transperfect and Lionbridge, provide legitimate full featured TMS technology offerings. Each takes a very different technological approach. SDL has acquired many technology companies, both directly relating to the global multi-lingual content delivery industry and others that are peripheral to the industry. We believe that this has alienated SDL from some buyers and partners, as SDL directly competes with them. Lionbridge promotes a SaaS solution. This solution utilizes a legacy technology product called LogoportTM, which was originally designed as a Translation Memory solution. Lionbridge has incorporated some web interfaces to this product. Nearly all of the direct technology competition employs a very common strategy to TM data management. We believe this simplistic approach limits the ability for a customer to maximize reuse of past content and does not permit effective enterprise level integration with high performance business systems, which we believe is inferior to a more robust solution.
We believe the remaining LSPs, while potentially competent in the delivery of language translation service, do not possess significant technology. If they do, they are likely to be using Translation Memory tools to achieve some level of content reuse so as to enable them to make some technological value claim.
Marketing and Sales
Substantially all of our revenues have been generated through our internal direct sales force and the efforts of our senior management team. As of March 15, 2011, we had 17 direct sales professionals in the United States and Europe.
Our sales force has developed relationships with an increasing number of customers. Our sales approach involves planning for a customer organization’s unique ongoing requirements, including future versions of products, and ongoing support, maintenance, and training, related to both technology products and content. A significant focus of our near-term sales effort is to expand the breadth of services and solutions we offer to customers and to gain a larger portion of their language translation business.
9
Customers
All of our customers sell products outside the United States and require content such as warnings, instructions, directions, and other information to be translated into a number of languages. Our customers are predominantly Fortune 1000 companies in the technology, medical, industrial, and manufacturing sectors. Most of our customers are located in the United States, with a high concentration located in the Midwest region. We anticipate that the percentage of our customers located outside of the United States will increase as we expand our sales efforts and Sajan Software hires additional sales personnel.
Major Customers
We derive a significant portion of our revenues from a limited number of customers. For the years ended December 31, 2010 and 2009, our largest customer accounted for approximately 15% and 14%, respectively, of our revenue, and our ten largest customers accounted for approximately 64% and 65%, respectively, of our revenue.
Geographic Areas of Operations
We generate revenues worldwide and during the year ended December 31, 2010, 76% of our revenues were generated within the United States and 24% were generated internationally. Currently, our largest international market is Spain, which accounted for 72% of our international revenues.
Intellectual Property
The development, utilization and protection of technology is an important component of our overall operating strategy. We have filed a patent application with the U.S. Patent and Trademark Office covering aspects of our GCMS solution. We have not filed any applications for patent protection in any country other than the United States. As a result, we do not and will not have the right to enforce our rights under any United States patent, if issued to us, in any foreign country, or to prevent others in foreign countries from utilizing our proprietary technology covered by that patent. We may apply for patent protection on our future technology developments to the extent we believe such protection is available and economically warranted. Despite these efforts, others could independently develop technology that is similar to our technology, or offer or sell products or services in foreign countries that use our technology.
We have registered and use domain names sajan.com, authoringcoach.com, and sajansoftware.com. We use, or intend to use, and claim rights to various trade names and trademarks to identify our language translation services and products. We have obtained a registered U.S. mark for the Sajan logo. We also use and claim rights to the “Sajan™”, “GCMS™”, “X-Content Integration™”, “TMate™”, “Context Intelligence™” and “Authoring Coach™” marks.
We intend to protect our intellectual property to the extent such protection is warranted. In addition to efforts to obtain patent and trademark rights, we rely on a combination of trade secret, license, nondisclosure and other contractual agreements and copyright laws to protect our intellectual property rights. Existing trade secret and copyright laws afford us only limited protection. We enter into confidentiality agreements with our employees and contractors, and limit access to and distribution of our proprietary information. These arrangements may not be adequate to deter misappropriation of our proprietary information and we may not be able to detect unauthorized use and take appropriate steps to enforce our intellectual property rights.
Research and Development
During the years ended December 31, 2010 and 2009, we spent approximately $1,716,000 and $760,000, respectively, on research and development. Research and development expenses consist primarily of wages and benefits for product strategy and development personnel. We have focused our research and development efforts more recently on the commercialization of the GCMS platform and its component modules for general release and independent use by participants in the content globalization process and for the ability to host GCMS using cloud computing methodologies. Functional development has continued in parallel on improving ease of use, functionality, scalability and efficiency of TM processing.
10
Our research and development primarily occurs in the United States, India and Ireland. We expect that on an annual basis, the dollar amount of research and development expenses will remain relatively constant with 2010 levels as we continue to enhance and expand our product offerings, but decrease as a percentage of revenues, as we anticipate that our revenues will grow at a faster rate than the growth of research and development spending.
Employees
As of March 15, 2011, we had 112 full-time employees. Our employees include software development engineers, project managers, language specialists, and graphic designers, as well as sales and marketing, quality assurance and administrative team members. We have approximately 70 employees in our River Falls, Wisconsin office, four employees that work from their home offices in the United States, nine employees in our Dublin, Ireland office, 23 employees in our New Delhi, India office and 6 employees in our Madrid, Spain office. None of our employees are covered by a collective bargaining agreement. We consider our relationship with our employees to be good. In addition, we utilize the services of approximately 3,500 human translators, all of whom are independent contractors, and utilize consultants to perform short-term project-based services, which is a more cost-effective strategy than hiring additional full-time employees.
Corporate Information
General
Our corporate offices are located in River Falls, Wisconsin, which is located approximately 30 miles east of Minneapolis, Minnesota. Our River Falls corporate offices contain our core Global Language Service operations, our administrative, product management, marketing, sales, and professional services functions. Our offices are located at 625 Whitetail Blvd., River Falls, Wisconsin 54022, and our telephone number is (715) 426-9505.
The Company’s fiscal year runs from January 1 through December 31. Neither the Company nor any of its predecessors have been in bankruptcy, receivership or any similar proceeding.
ITEM 1A. RISK FACTORS
You should consider the following risk factors, in addition to the other information presented or incorporated by reference into this Annual Report on Form 10-K, in evaluating our business and your investment in us.
The Company’s common stock involves a high degree of risk. Investors and potential investors should carefully consider the following risk factors, together with all of the other information included in this report, before making investment decisions about shares of our common stock. The risks and uncertainties described below are not the only risks and uncertainties facing the Company in the future. Additional risks and uncertainties not presently known or that are currently considered to be immaterial may also materially and adversely affect the Company’s business operations or the stock price of the Company’s common stock. If any of the following risks or uncertainties occurs, the Company’s business, financial condition, operating results and future growth prospects could materially suffer. In that event, the trading price of your securities could decline, and you may lose all or part of your investment.
11
Risk Related to Our Business and Industry
Our past results may not be indicative of future results, and, therefore, we may be unable to continue to grow at our historical growth rates.
Sajan, Inc. began selling language translation services utilizing its proprietary technology in 2002 and generated only nominal revenues during that year. From 2003 to 2010, however, revenue increased more rapidly. The annual revenues of Sajan, Inc. for the year ended December 31, 2009 were approximately $12.7 million and increased to $16.0 million in the year ended December 31, 2010. Increasing revenues by growing our business operation under the Sajan name is a key component of our strategy. These expansion plans have placed and may continue to place significant demands on our management and operational resources. You should not consider recent revenue growth as indicative of our future performance. In fact, in future periods, we may not have any revenue growth, or our revenues could decline.
We do not have long-term contracts with our customers who provide us with recurring revenue, and our success will depend on our ability to maintain a high level of customer satisfaction and a strong reputation in the global multi-lingual content delivery industry.
Our contracts with our customers who provide us with recurring revenue typically allow the customer to cancel the contract for any reason with 30 days’ prior notice to us. Our continued success therefore depends significantly on our ability to meet or exceed the expectations of these customers because most of such customers do not make long-term commitments to use our solutions. In addition, if our reputation in the global multi-lingual content delivery industry is harmed or diminished for any reason, this may cause our recurring revenue customers to terminate their relationships with us on short notice and seek alternative globalization and translation solutions. If a significant number of recurring revenue customers terminate their relationships with us, our business, results of operations and financial condition would be adversely affected in a short period of time.
We rely on a limited number of customers, and the loss of or reduction in revenue from a major customer could negatively affect our business, financial condition and operations.
We derive a significant portion of our revenues from a limited number of large customers. For the years ended December 31, 2010 and 2009, our largest customer accounted for approximately 15% and 14%, respectively, of our revenue, and our ten largest customers accounted for approximately 64% and 65%, respectively, of our revenue. As a result of the concentration of our revenue to a limited number of customers, we have experienced fluctuations in collection of our revenues. The loss of any major customer or a significant reduction in a large customer’s use of our language translation solutions could materially reduce our revenue and cash flow and adversely affect our business, financial condition and operations.
Continued economic weakness and uncertainty could adversely affect our revenue, lengthen our sales cycle and make it difficult for us to forecast operating results accurately.
Our revenues depend significantly on general economic conditions and the health of large companies that sell products internationally. Economic weakness and constrained globalization spending adversely affected our revenue growth rates and gross margins in 2010, and similar and continuing circumstances may result in slower growth or reductions in our revenues and gross profits in the future. We have experienced, and may experience in the future, reduced spending in our business due to the current financial turmoil affecting the U.S. and global economy and other macroeconomic factors affecting spending behavior. Uncertainty about future economic conditions makes it difficult for us to forecast operating results and to make decisions about future investments. In addition, economic conditions or uncertainty may cause current and potential customers to reduce or delay globalization expenditures, including purchases of our solutions. Our sales cycle may lengthen if purchasing decisions are delayed as a result of uncertain information technology or contracted development budgets or if contract negotiations become more protracted or difficult as customers institute additional internal approvals for globalization and information technology purchases. Delays or reductions in globalization and information technology spending could have a material adverse effect on demand for our software and services, and consequently on our business, financial condition and results of operations.
12
If we are unable to attract new customers or sell additional solutions, or if our customers do not increase their use of our solutions, our revenue growth and profitability will be adversely affected.
To increase our revenues and achieve and maintain profitability, we must regularly add new customers and sell additional solutions, and our customers must increase their use of our solutions they currently utilize. We intend to grow our business by hiring additional inside sales personnel and increasing our marketing activities. If we are unable to hire or retain quality sales personnel, convert customer prospects into paying customers, or ensure the effectiveness of our marketing programs, or if our existing or new customers do not perceive our solutions to be of sufficiently high value and quality, we might not be able to increase sales, and our operating results will be adversely affected. In addition, if we fail to sell our new solutions to existing or new customers, we will not generate anticipated revenues from these solutions, our operating results will suffer and we might be unable to grow our revenues or achieve or maintain profitability.
We have incurred operating losses in the past and may incur operating losses in the future.
For the years ended December 31, 2010 and 2009, Sajan generated net loss of $3.0 million and $1.1 million, respectively. Throughout most of our history, we have experienced net losses and negative cash flows from operations. We expect our operating expenses to increase in the future as we expand our operations. Furthermore, as a public company, we will incur significant legal, accounting and other expenses that we did not incur as a private company. If our revenues do not grow to offset these increased expenses, we may not be profitable. We cannot assure you that we will be able to achieve or maintain profitability.
Our inability to adapt to rapid technological change could impair our ability to remain competitive.
The global multi-lingual content delivery industry in which we compete is characterized by rapid technological change, introductions of new products and evolving industry standards. Our ability to attract new customers and increase revenues from customers will depend in significant part on our ability to anticipate industry standards and to continue to enhance existing solutions or introduce or acquire new solutions on a timely basis to keep pace with technological developments. The success of any enhancement or new solution depends on several factors, including the timely completion, introduction and market acceptance of any enhancement to our solution. Any new solution we develop or acquire might not be introduced in a timely or cost-effective manner and might not achieve the broad market acceptance necessary to generate significant revenues. If any of our competitors implements new technologies before we are able to implement them, those competitors may be able to provide more effective solutions than ours at lower prices. Any delay or failure in the introduction of new or enhanced solutions could adversely affect our business, results of operations and financial condition.
Our business may be harmed by defects or errors in the services we provide to customers.
Many of the services we provide are critical to the business operations of our customers. While we maintain general liability insurance, including coverage for errors and omissions, defects or errors in the services we provide could interrupt our customers’ abilities to provide products and services to their customers, resulting in delayed or lost revenue. This could damage our reputation through negative publicity, make it difficult to attract new and retain existing customers, and cause customers to terminate our contracts and seek damages. We may incur additional costs to correct errors or defects. There can be no assurance that our general liability and errors and omissions insurance coverage will be available in amounts sufficient to cover one or more large claims, or that the insurer will not disclaim coverage as to any future claims.
13
An interruption or failure of our information technology and communications systems could impair our ability to effectively provide our services, which could damage our reputation and business.
The provision of our services depends on the continuing operation of our information technology and communications systems. Any damage to or failure of our systems could result in interruptions in our services. Interruptions in our services could reduce our revenues and profits, and the Sajan brand could be damaged if people believe our system is unreliable. Our systems are vulnerable to damage or interruption from terrorist attacks, floods, tornados, fires, power loss, telecommunications failures, computer viruses or attempts to harm our systems. Our data centers may be subject to break-ins, sabotage and intentional acts of vandalism, and to other potential disruptions. Some of our systems may not be fully redundant, and our disaster recovery planning may not be able to account for all eventualities. The occurrence of a natural disaster, a decision to close a facility we are using without adequate notice for financial reasons, or other unanticipated problems at our data centers could result in lengthy interruptions in our services. Any unscheduled interruption in our service will put a burden on the entire organization and would result in an immediate loss of revenue. If we experience frequent or persistent system failures on our web site, our reputation and the Sajan brand could be permanently harmed. The steps required to increase the reliability and redundancy of our systems are expensive, will reduce our operating margins, and may not be successful in reducing the frequency or duration of unscheduled downtime.
The intellectual property of our customers may be damaged, misappropriated, stolen, or lost while in our possession, subjecting us to litigation and other adverse consequences.
In the course of providing globalization and language translation services to our customers, we take possession of or are granted access to certain intellectual property of our customers. If such intellectual property is damaged, misappropriated, stolen, or lost, we could suffer, among other consequences:
|
|
·
|
claims under indemnification provisions in customer agreements or other liability for damages;
|
|
|
·
|
delayed or lost revenue due to adverse customer reaction;
|
|
|
·
|
negative publicity; and
|
|
|
·
|
litigation that could be costly and time consuming.
|
Any adverse impact attributable to any of the foregoing factors would have a material adverse effect on our business and revenues.
We rely on third parties for key aspects of the process of providing services to our customers, and any failure or interruption in the services provided by these third parties could harm our ability to operate our business and damage our reputation.
We rely on third-party vendors, including data center and bandwidth providers, and we also rely on third parties for key aspects of the process of providing language translation services to our customers. Our revenues and margins are subject to our ability to continue to maintain satisfactory relationships with freelance linguists, who are in high demand worldwide for specific languages. Any disruption in the network access or co-location services provided by these third-party providers or any failure of these third-party providers and freelance linguists to handle current or higher volumes of use could significantly harm our business. Any financial or other difficulties the providers face may have negative effects on our business, the nature and extent of which cannot be predicted. We exercise little control over these third party vendors, which increases our vulnerability to problems with the services they provide. We also license technology and related databases from third parties to facilitate aspects of our translation processes and our data center and connectivity operations including, among others, Internet traffic management and search services. Any errors, failures, interruptions or delays experienced in connection with these third-party technologies and information services could negatively impact our relationships with customers and adversely affect the Sajan brand, and could expose us to liabilities to third parties.
14
Evolving regulation of the Internet may increase our expenditures related to compliance efforts, which may adversely affect our financial condition.
As Internet commerce continues to evolve, increasing regulation by federal, state or foreign agencies becomes more likely. We are particularly sensitive to these risks because the Internet is a critical component of our on-demand business model. In addition, taxation of services provided over the Internet or other charges imposed by government agencies or by private organizations for accessing the Internet may be imposed. Any regulation imposing greater fees for Internet use or restricting information exchange over the Internet could result in a decline in the use of the Internet and the viability of Internet-based services, which could harm our business.
We depend on intellectual property rights to protect proprietary technologies, although we may not be able to successfully protect these rights.
We rely on our proprietary technology to enhance our software and service offerings. We use a combination of patent, trademark, trade secret and copyright law in addition to contractual restrictions to protect our technology. Although we have filed a patent application with the U.S. Patent and Trademark Office covering certain aspects of our technology, there can be no assurance that this application will result in an issued patent or that such patent, if issued, would adequately protect our technology or provide us with a competitive advantage. We may apply for patent protection on our future technology developments to the extent we believe such protection is available and economically warranted. However, there is no assurance that we will file additional applications for patent protection in the United States or in other countries, that any application that we may file will result in an issued patent, or that any issued patent will provide us with a competitive advantage. We have not filed any applications for patent protection in any country other than the United States. As a result, we do not have the right to enforce our rights under any United States patent, if issued, in any foreign country, or to prevent others in foreign countries from utilizing the proprietary technology covered by our patents. Despite our efforts, there can be no assurance that others will not independently develop technology that is similar to our technology, or offer or sell products or services in foreign countries that utilize our technology. The development by others of technology that is similar to our technology, or the sale of products or services in foreign countries that incorporate our technology, would harm our competitive position and have a material adverse effect on our business, results of operations and financial condition.
We may be involved in disputes from time to time relating to our intellectual property and the intellectual property of third parties.
We may become parties to disputes from time to time over rights and obligations concerning intellectual property, and we may not prevail in these disputes. Third parties may raise claims against us alleging infringement or violation of the intellectual property of that third party. Some third party intellectual property rights may be extremely broad, and it may not be possible for us to conduct our operations in such a way as to avoid violating those intellectual property rights. Any such intellectual property claim could subject us to costly litigation and impose a significant strain on our financial resources and management personnel regardless of whether such claim has merit. Our liability insurance, if any, may not cover potential claims of this type adequately or at all, and we may be required to alter products or pay monetary damages or license fees to third parties, which could have a material adverse affect on our financial condition and results of operations.
Our strategy includes pursuing acquisitions, and our potential inability to successfully integrate newly-acquired companies, businesses or technologies may adversely affect our financial results.
We believe part of our growth will be driven by acquisitions of other companies or their businesses or technologies. If we complete acquisitions, we face many risks commonly encountered with growth through acquisitions, including:
|
|
·
|
incurring significantly higher than anticipated capital expenditures and operating expenses;
|
|
|
·
|
failing to assimilate the operations and personnel of the acquired company or business;
|
|
|
·
|
disrupting our ongoing business;
|
|
|
15
|
|
·
|
dissipating our management resources;
|
|
|
·
|
failing to maintain uniform standards, controls and policies; and
|
|
|
·
|
impairing relationships with employees and customers as a result of changes in management.
|
Fully integrating an acquired company, business or technology into our operations may take a significant amount of time. We cannot assure you that we will be successful in overcoming these risks or any other problems encountered with acquisitions. To the extent we do not successfully avoid or overcome the risks or problems related to any acquisitions, our results of operations and financial condition could be adversely affected. Future acquisitions also could impact our financial position and capital needs, and could cause substantial fluctuations in our quarterly and yearly results of operations. Acquisitions could include significant goodwill and intangible assets, which may result in future impairment charges that would reduce our stated earnings.
Our ability to use our U.S. net operating loss carryforwards might be limited or eliminated.
As of December 31, 2010, we had net operating loss carryforwards of approximately $32.2 million, which are potentially available for U.S. federal tax purposes. These loss carryforwards expire between 2015 and 2030. To the extent these net operating loss carryforwards are available, we intend to use them to reduce any corporate income tax liability associated with our operations. Section 382 of the U.S. Internal Revenue Code generally imposes an annual limitation on the amount of net operating loss carryforwards that may be used to offset taxable income when a corporation has undergone significant changes in stock ownership. As a result, prior or future changes in ownership could put limitations on or eliminate the availability of our net operating loss carryforwards to offset any profit. Rules governing the use of net operating loss carryforwards are complex, and any use of our net operating loss carryforwards could be challenged given our change of control in 2007 and 2010. To the extent our use of net operating loss carryforwards is significantly limited or eliminated, any income generated by us could be subject to corporate income tax earlier than if we were able to use net operating loss carryforwards, which could result in lower profit. Future changes of control may result in additional expiration of a portion of the remaining net operating loss carryforward before it can be used. The use of our carryforward is dependent upon our ability to attain profitable operations in the future.
The markets in which we operate are highly competitive, and our failure to compete successfully would make it difficult for us to add and retain customers and would reduce or impede the growth of our business.
The markets for global multi-lingual content delivery software and services are increasingly competitive and global. We expect competition to increase in the future both from existing competitors and new companies that may enter our markets. In addition to our existing competitors, we may face competition in the future from companies that do not currently offer globalization or translation services. We may also face competition from internal globalization departments of Fortune 1000 and large emerging companies. Technology companies, information technology services companies, business process outsourcing companies, web consulting firms, technical support call centers, hosting companies and content management providers may choose to broaden their range of services to include globalization or language translation as they expand their operations internationally. Increased competition could result in pricing pressure, reduced sales, lower margins or the failure of our solutions to achieve or maintain broad market acceptance. However, we cannot assure you that new or established competitors will not offer solutions that are superior to or lower in price than ours. We may not have sufficient resources to continue the investments in all areas of software development and marketing needed to maintain our competitive position. In addition, some of our competitors are better capitalized than us, which may provide them with an advantage in developing, marketing or servicing new solutions. Increased competition could reduce our market share, revenues and operating margins, increase our costs of operations and otherwise adversely affect our business.
16
If we fail to retain our Chief Executive Officer and other key personnel, our business would be harmed and we might not be able to implement our business plan successfully.
Given the complex nature of the technology on which our business is based and the speed with which such technology advances, our future success is dependent, in large part, upon our ability to attract and retain highly qualified managerial, technical and sales personnel. In particular, Shannon Zimmerman, President and Chief Executive Officer and Angel Zimmerman, Chief Operating Officer, are critical to the management of our business and operations. Competition for talented personnel is intense, and we cannot be certain that we can retain our managerial, technical and sales personnel or that we can attract, assimilate or retain such personnel in the future. Our inability to attract and retain such personnel could have an adverse effect on our business, results of operations and financial condition.
Our continued growth could strain our personnel resources and infrastructure, and if we are unable to implement appropriate controls and procedures to manage our growth, we will not be able to implement our business plan successfully.
We have experienced a period of rapid growth in our headcount and operations. To the extent that we are able to sustain such growth, it will place a significant strain on our management, administrative, operational and financial infrastructure. Our success will depend in part upon the ability of our senior management to manage this growth effectively. To do so, we must continue to hire, train and manage new employees as needed. If our new hires perform poorly, or if we are unsuccessful in hiring, training, managing and integrating these new employees, or if we are not successful in retaining our existing employees, our business would be harmed. To manage the expected growth of our operations and personnel, we will need to continue to improve our operational, financial and management controls and our reporting systems and procedures. The additional headcount we are adding will increase our cost base, which will make it more difficult for us to offset any future revenue shortfalls by reducing expenses in the short term. If we fail to successfully manage our growth, we will be unable to execute our business plan.
We may be exposed to potential risks relating to internal controls over financial reporting and our ability to have those controls attested to by our independent registered public accounting firm.
As a public company, we are required, pursuant to Section 404 of the Sarbanes-Oxley Act of 2002, to furnish a report by management on, among other things, the effectiveness of our internal control over financial reporting. Management first evaluation of our internal control systems is presented in this Annual Report on Form 10-K.
In prior years, Baker Tilly Virchow Krause, LLP, the independent registered public accounting firm of Sajan, Inc., identified a number of deficiencies in internal control that it considered to be material weaknesses and other deficiencies that it considered to be significant deficiencies. During 2010, we expended significant resources to develop the necessary documentation and testing procedures required by Section 404. This process resulted in a conclusion that we had remediated the previously identified material weaknesses and significant deficiencies and no other material weaknesses or significant deficiencies were identified. However, there can be no assurance that additional material weaknesses in internal controls will not occur in the future and that we may be unable to remediate the material weaknesses in internal controls identified in a timely manner. In this event, it is possible that investors and others with whom we do business may lose confidence in the reliability of our financial statements, and in our ability to obtain equity or debt financing could suffer.
Because our long-term success depends, in part, on our ability to expand the sales of our solutions to customers located outside of the United States, our business will be susceptible to risks associated with international operations.
We have limited experience operating in foreign jurisdictions. In 2008, we opened Sajan-India in New Delhi, India, in 2009, we opened Sajan Software in Dublin, Ireland and in 2010 we opened Sajan, Spain. Our inexperience in operating our business outside of North America increases the risk that our current and any future international expansion efforts will not be successful. Conducting international operations subjects us to risks that, generally, we have not faced in the United States, including:
|
|
·
|
fluctuations in currency exchange rates;
|
17
|
|
·
|
unexpected changes in foreign regulatory requirements;
|
|
|
·
|
longer accounts receivable payment cycles and difficulties in collecting accounts receivable;
|
|
|
·
|
difficulties in managing and staffing international operations;
|
|
|
·
|
potentially adverse tax consequences, including the complexities of foreign value-added tax systems and restrictions on the repatriation of earnings;
|
|
|
·
|
the burdens of complying with a wide variety of foreign laws and different legal standards, including laws and regulations related to privacy;
|
|
|
·
|
increased financial accounting and reporting burdens and complexities;
|
|
|
·
|
political, social and economic instability abroad, and terrorist attacks and security concerns in general; and
|
|
|
·
|
reduced or varied protection for intellectual property rights in some countries.
|
The occurrence of any one of these risks could negatively affect our international business and, consequently, our results of operations generally. Additionally, operating in international markets also requires significant management attention and financial resources. We cannot be certain that the investment and additional resources required in establishing, acquiring, operating or integrating operations in other countries will produce desired levels of revenues or profitability.
Our management has limited experience operating as a public company.
The members of our current management have limited experience operating a public company. We have six directors. Of these individuals, only directors Michael W. Rogers, Richard C. Perkins and Benno G. Sand, have experience managing a public company. Therefore, most of our officers and directors have had limited experience in complying with the various rules and regulations that are required of a public company. We may not be able to operate successfully as a public company, even if our business operations are successful. Our inability to successfully operate as a public company could have a material adverse effect on our business, financial condition and operating results and on our ability to obtain equity or debt financing.
We cannot predict the outcome of the lawsuit with Ms. Natzel, and an unfavorable outcome of this lawsuit could have a material adverse effect on our business, financial condition and operating results.
As described in section titled “Legal Proceedings” above, Sajan is a party to the lawsuit filed by Mary Jo Natzel. Although our management believes that Ms. Natzel’s claims are without merit, we cannot predict the outcome of either of this lawsuit. It is possible that the ultimate resolution of this lawsuit, if unfavorable, could have a material adverse effect on our business, financial condition and operating results. Even if we ultimately prevail in the lawsuit, legal and other fees associated with the lawsuit could be significant. In addition, there may also be adverse publicity associated with legal proceedings that could negatively affect the perception of our business, regardless of whether the allegations made by Ms. Natzel are valid or whether we are ultimately found liable. As a result, this lawsuit may have a material adverse effect on our business, financial condition and operating results.
18
We may need additional financing in the future, which may not be available, and any such financing will likely dilute our existing stockholders.
We may require additional financing in the future, which could be sought from a number of sources, including, but not limited to, additional sales of equity or debt securities or loans from banks or other financial institutions. There can be no certainty that any such financing will be available to us or, if available, on terms favorable to us. If additional funds are raised by the issuance of our equity securities, such as through the issuance of stock, convertible securities, or the issuance and exercise of warrants, then the ownership interests of our existing stockholders will be diluted and our ability to utilize accumulated net operating loss carryforwards could be impaired or terminated. If we raise additional funds by issuing debt or other instruments, we may become subject to certain operational limitations, and such securities may have rights senior to those of our common stock. The current recession may cause any debt or equity financing to be more difficult to obtain, more costly and more dilutive. If adequate funds are not available on acceptable terms, we may be unable to fund the operation or expansion of our business. Our failure to obtain any necessary financing in a timely manner and on favorable terms could have a material adverse effect on our business strategy and on our financial performance and stock price, and could require us to delay or abandon our growth strategy.
Risks Related to Ownership of Our Common Stock
An active trading market in our common stock may not develop or be adequately maintained, and our common stock may be subject to volatile price and volume fluctuations.
An active trading market in our common stock may not develop or be adequately maintained. Shares of our common stock are quoted on the OTC Bulletin Board Market system and are not listed on any stock exchange, which may limit your ability to sell your shares of our common stock. The overall market for securities in recent years has experienced extreme price and volume fluctuations that have particularly affected the market prices of many smaller companies. These fluctuations have been extremely volatile and are often unrelated or disproportionate to operating performance. Consequently, you may not be able to sell our common stock at prices equal to or greater than the price you paid for your shares. In addition to the factors discussed elsewhere in this section, many factors, most of which are outside of our control, could cause the market price of our common stock to decrease significantly, including:
|
|
·
|
variations in our quarterly operating results;
|
|
|
·
|
decreases in market valuations of similar companies;
|
|
|
·
|
the failure of securities analysts to cover our common stock or changes in financial estimates by analysts who cover us, our competitors or our industry; and
|
|
|
·
|
fluctuations in stock market prices and volumes.
|
These broad market fluctuations could result in extreme fluctuations in the price of our common stock, which could cause a decline in the value of our common stock.
Our quarterly results of operations may fluctuate in the future, which could result in volatility in our stock price.
Our quarterly revenues and results of operations have varied in the past and may fluctuate as a result of a variety of factors. If our quarterly revenues or results of operations fluctuate, the price of our common stock could decline substantially. Fluctuations in our results of operations may be due to a number of factors, including, but not limited to, those listed below and identified throughout this “Risk Factors” section:
|
|
·
|
our ability to retain and increase sales to current customers and attract new customers, including our ability to maintain and increase our number of recurring revenue customers;
|
|
|
·
|
the timing and success of introductions of new solutions or upgrades by us or our competitors;
|
|
|
·
|
the strength of the economy, in particular as it affects globalization activity;
|
|
|
19
|
|
·
|
changes in our pricing policies or those of our competitors;
|
|
|
·
|
competition, including entry into the industry by new competitors and new offerings by existing competitors;
|
|
|
·
|
the amount and timing of expenditures related to operating as a public company, expanding our operations, research and development, acquisitions, or introducing new solutions; and
|
|
|
·
|
changes in the payment terms for our solutions.
|
Due to these and other factors, you should not rely on quarter-to-quarter comparisons of our results of operations as an indication of our future performance.
We may be unable to cause our securities to be listed on the NASDAQ Stock Market, which could limit investors’ ability to make transactions in our securities and subject stockholders to additional trading restrictions.
We intend to continue to be listed on the OTC Bulletin Board Market until such time we satisfy the relevant listing requirements to have our common stock listed on the NASDAQ Global Market or the NASDAQ Capital Market. However, there can be no assurance we will ever be able to meet NASDAQ’s initial listing requirements, in which case our securities may continue to be listed on the OTC Bulletin Board Market indefinitely.
If we are unable to cause our securities to be listed on the NASDAQ Stock Market, we and our stockholders could face significant material adverse consequences, including:
|
|
·
|
a limited availability of market quotations for our securities;
|
|
|
·
|
a determination that our common stock is a “penny stock,” which will require brokers trading in our common stock to adhere to more stringent rules, possibly resulting in a reduced level of trading activity in the secondary trading market for our common stock;
|
|
|
·
|
a limited amount of news and analyst coverage; and
|
|
|
·
|
a decreased ability to issue additional securities or obtain additional financing in the future.
|
Current members of our management own a significant percentage of the outstanding shares of our common stock, which could limit other stockholders’ influence on corporate matters.
Shannon Zimmerman and Angel Zimmerman, who are directors and executive officers after the Merger, collectively own approximately 32.7% of the outstanding shares of our common stock. Accordingly, these individuals are able to exert substantial influence over our affairs, including the election and removal of directors and all other matters requiring stockholder approval, including the future merger, consolidation or sale of our company. This concentrated control could discourage others from initiating any potential merger, takeover, or other change-of-control transactions that may otherwise be beneficial to our stockholders. Furthermore, this concentrated control will limit the practical effect of the stockholders’ participation in our corporate matters, through stockholder votes and otherwise. As a result, the return on your investment in our common stock through the sale of your shares could be adversely affected.
20
Provisions in our charter documents, our Tax Benefit Preservation Plan, and Delaware law may inhibit a takeover, which could limit the price potential investors might be willing to pay in the future for our common stock and could entrench management.
Our certificate of incorporation and bylaws and our Tax Benefit Preservation Plan contain provisions that may discourage unsolicited takeover proposals that stockholders may consider to be in our best interests. Our board of directors has the ability to designate the terms of and issue new series of preferred stock which could be issued to create different or greater voting rights which may affect an acquiror’s ability to gain control of our company. Our Tax Benefit Preservation Plan, which is designed to protect our stockholder value and safeguard valuable tax attributes by reducing the likelihood of an unintended ownership change, could also discourage a change of control. As a Delaware corporation, we are subject to anti-takeover provisions under Delaware law, which could delay or prevent a change of control. Together, these provisions may make it more difficult to remove management and may discourage transactions that otherwise could involve payment of a premium over prevailing market prices for our shares.
Our certificate of incorporation grants our board of directors the power to designate and issue additional shares of common and preferred stock.
Pursuant to authority granted by our certificate of incorporation, our board of directors, without any action by our stockholders, may designate and issue shares in such classes or series (including classes or series of preferred stock) as it deems appropriate, and establish the rights, preferences, and privileges of such shares, including dividends, liquidation, and voting rights. The rights of holders of other classes or series of preferred stock that may be issued could be superior to the rights of our common stock. The designation and issuance of shares of capital stock having preferential rights could adversely affect other rights appurtenant to the shares of our common stock. Any issuances of additional capital stock (common or preferred), will dilute the percentage of ownership interest of our stockholders.
Our certificate of incorporation and bylaws limit directors’ liability to stockholders.
As permitted by Delaware law, our certificate of incorporation and bylaws provide that each director shall have no personal liability for monetary damages for any breach of fiduciary duties to us, subject to certain exceptions. These provisions may reduce the likelihood of derivative litigation against directors and may discourage stockholders from bringing a lawsuit against directors for any breach of our fiduciary duties.
We do not intend to pay dividends on our common stock for the foreseeable future.
We currently intend to retain all future earnings for the operation and expansion of our business and, therefore, do not anticipate declaring or paying cash dividends on our common stock in the foreseeable future. Any payment of cash dividends on our common stock will be at the discretion of our board of directors and will depend upon our results of operations, earnings, capital requirements, financial condition, future prospects, contractual restrictions and other factors deemed relevant by our board of directors. Therefore, you should not expect to receive dividend income from shares of our common stock.
ITEM 1B. UNRESOLVED STAFF COMMENTS
None.
ITEM 2. PROPERTIES
Our primary operations are based in River Falls, Wisconsin, which is located approximately 20 miles east of the Twin Cities in Minnesota. We lease 16,000 square feet of office space from River Valley Business Center, LLC (“RVBC”) under two leases which expire in January 2017. Rents for these facilities averaged approximately $24,000 per month during the year ended December 31, 2010. RVBC is a “related person” as defined in Item 404 of Regulation S-K of the SEC because it is controlled by Shannon and Angela Zimmerman, each of whom is a principal executive officer and a director of the Company. Until the time of the Merger, financial accounting and reporting rules under ASC 810 – Consolidation, (formerly FIN 46(R)), required that the financial statements of RVBC be consolidated with the financial statements of Sajan, Inc. As a result of the Merger, the financial statements of RVBC is no longer consolidated with our financial statements for the year ended December 31, 2010.
21
Sajan Software leases approximately 1,000 square feet of office space in Dublin, Ireland. Sajan-India leases approximately 7,500 square feet of office space in New Delhi, India. Combined rents for these facilities averaged approximately $5,000 dollars per month during the year ended December 31, 2010. We believe all of our facilities are suitable and adequate for current operating needs.
The Company remains obligated for rent payments on a former MathStar facility located in Hillsboro, Oregon, near Portland. The lease expires on August 31, 2011. As part of the Merger, Sajan assumed the liability for this lease obligation and as of December 31, 2010, the lease liability, is approximately $213,000. Payments on this liability are approximately $26,000 per month. In 2010, we sub-leased a portion of this space and now receive approximately $5,000 per month in sub lease income.
ITEM 3. LEGAL PROCEEDINGS
Tiberius Litigation
As reported in MathStar’s Annual Report on Form 10-K for the year ended December 31, 2009, on October 8, 2009, legal counsel for Tiberius Capital II, LLC (“Tiberius”), sent by email to MathStar’s legal counsel a copy of a Complaint labeled “Draft — Subject to Completion” (the “Tiberius Complaint”). The Tiberius Complaint named Tiberius, individually and on behalf of all others similarly situated, as plaintiff. It named MathStar, Feltl and Company (“Feltl”), Sajan, Inc., Perkins Capital Management, Inc., Richard C. Perkins, Merrill A. McPeak, Benno G. Sand, John C. Feltl and Joseph P. Sullivan, as defendants (collectively, the “Minnesota Parties”). The Tiberius Complaint stated that Tiberius was bringing a class action lawsuit on behalf of a class consisting of all those who purchased MathStar’s securities between May 11, 2009 and September 30, 2009 alleging violations of the Securities Exchange Act of 1934, as amended.
On October 14, 2009, the Minnesota Parties filed a Complaint in the United States District Court for the District of Minnesota captioned “MathStar, Inc., Feltl and Company, Inc., Sajan, Inc., Perkins Capital Management, Inc., Richard C. Perkins, Merrill A. McPeak, Benno G. Sand, John C. Feltl and Joseph P. Sullivan, Plaintiffs, v. Tiberius Capital II, LLC, Defendant” (the “Minnesota Complaint”) alleging a claim of tortious interference with prospective economic advantage against Tiberius on behalf of MathStar, Sajan, Inc. and Feltl.
On November 9, 2009, Tiberius served and filed its Answer and Counterclaim denying liability under the Minnesota Complaint and asserting substantially the same claims set forth in the Tiberius Complaint and, in addition, asserting common law claims for fraud against the Minnesota Parties except Sajan, Inc. and against all of the Minnesota Parties for wrongful interference with the prospectively advantageous, successful completion of its tender offer for MathStar’s shares of common stock. On December 8, 2009, Tiberius served and filed an Answer and Amended Counterclaim in which it added a jurisdictional allegation and asserted claims for declaratory relief under its other claims. The Minnesota Parties filed timely motions to dismiss the Counterclaim and Amended Counterclaim on several grounds. The motions were fully briefed, and oral arguments took place before the Court on February 9, 2010.
On April 26, 2010, the United States District Court, District of Minnesota granted the Company’s motion to dismiss all counterclaims asserted by Tiberius. Thereafter, the entire action was dismissed and judgment was entered in favor of the Minnesota Parties. Tiberius did not appeal this decision and therefore the lawsuits have been finally terminated without any liability of any of the Minnesota Parties.
22
Litigation by Sajan, Inc. Stockholder
On February 11, 2010, Mary Jo Natzel, a shareholder of Sajan, Inc., initiated a lawsuit against Shannon Zimmerman and Angel Zimmerman (the “Zimmermans”) and Sajan, Inc. in the Minnesota District Court, Hennepin County, Fourth Judicial District. Ms. Natzel seeks declaratory, injunctive and monetary relief in an amount in excess of $50,000 against Sajan, Inc. and the Zimmermans. The Natzel complaint relates to an October 2001 stock split alleged to be ineffective as to Shannon Zimmerman’s shares and resulting underpayment to Ms. Natzel of distributions made by Sajan, Inc. while it was a corporation taxed under Subchapter S of the Internal Revenue Code. The complaint also alleges oral misrepresentations in 2001 by Mr. Zimmerman to Howard Natzel, the spouse of Mary Jo Natzel, regarding the dollar amount of cash invested by the Zimmermans into Sajan, Inc. prior to Mr. Natzel’s investment in October 2001 of $50,000 to purchase shares of common stock. The complaint alleges breaches by the Zimmermans of their duties to Ms. Natzel; illegal conduct or actions by the Zimmermans unfairly prejudicial towards Ms. Natzel; underpayment of Subchapter S distributions; declaratory judgments that each of the Zimmermans owned 225 shares of common stock of Sajan, Inc. prior to the effective date of the Merger; an order requiring the Zimmermans and Sajan, Inc. to calculate and pay supplemental Subchapter S distributions to the former stockholders of Sajan, Inc.; and an order requiring the Zimmermans to disgorge and pay to Ms. Natzel the amount by which they have been unjustly enriched to Ms. Natzel’s detriment. In the Merger, Sajan, LLC, a wholly-owned subsidiary of Sajan, Inc., assumed the obligations of Sajan, Inc. The Company and the Zimmermans served and filed their Joint and Separate Answer on March 3, 2010.
Following initial pleadings, Sajan, Inc. and the Zimmermans served and filed a third-party complaint against Howard Natzel, asserting claims of breach of contract and indemnification/contribution relating to his execution of the Subscription Agreement to purchase shares of Sajan, Inc. in 2001. The parties have completed discovery. On March 15, 2011, the court heard oral argument on Sajan, Inc. and the Zimmermans' motion for partial summary judgment, seeking dismissal of all of Mary Jo Natzel's investment-related claims. Sajan and the Zimmermans did not move for summary judgment on Mary Jo Natzels' claim seeking recovery of fees incurred in connection with obtaining information from the company during the time period 2001- July 31, 2006. The Natzels cross-moved for summary judgment on the Sajan and the Zimmermans' counterclaims and third-party claims. The Court has taken the motions under advisement and is expected to rule not later than May 9, 2011. The case is scheduled for trial, if necessary, in May 2011. Sajan, Inc. and the Zimmermans dispute the merits of the Natzels’ investment-related claims and intend to vigorously defend those claims and pursue relief for attorney fees incurred in defending the investment-related claims under the terms of the Subscription Agreement Howard Natzel executed in connection with the Natzel investment in Sajan, Inc.
Mary Jo Natzel did not participate in the Merger in February 2010, and instead chose to dissent from the corporate action pursuant to Minnesota Statutes. On May 13, 2010, Sajan, Inc. tendered a check to Ms. Natzel in the amount of $366,942 in payment of the fair value of the shares tendered. On June 8, 2010, Sajan, Inc. received a letter which asserted that the fair value of Natzel’s shares was $495,372. Sajan, Inc. disputes the value claimed, and on November 1, 2010 filed a petition requesting the court to determine the fair value of the shares. The parties are proceeding with discovery which is scheduled to be completed by June 24, 2011. Sajan, Inc. believes the Merger consideration was fair to all shareholders and will seek to have the Court declare that Natzel’s shares are worth no more than the $366,942 tendered to her.
|
ITEM 4.
|
[REMOVED and RESERVED]
|
23
PART II
|
ITEM 5.
|
MARKET FOR REGISTRANT’S COMMON EQUITY, RELATED STOCKHOLDER MATTERS AND ISSUER PURCHASES OF EQUITY SECURITIES
|
Our common stock is quoted on the OTC Bulletin Board system of the OTC Markets.
The following table shows the high and low sales prices for our common stock for the 2010 and 2009 fiscal quarters. The high and low sale prices reported on the OTC Bulletin Board or Pink Sheet Markets reflect inter-dealer prices, without retail mark-up, mark-down or commission and may not necessarily reflect actual transactions.
|
|
Market Price (high/low)
|
|||||||
|
For the Fiscal Year
|
2010
|
2009
|
||||||
|
First Quarter
|
$ | 1.74 – 1.20 | $ | 0.94 – 0.77 | ||||
|
Second Quarter
|
$ | 1.93 – 1.35 | $ | 1.22 – 0.80 | ||||
|
Third Quarter
|
$ | 1.60 – 1.30 | $ | 1.64 – 1.17 | ||||
|
Fourth Quarter
|
$ | 1.45 – 0.80 | $ | 1.50 – 1.15 | ||||
As of March 15, 2011, we had approximately 232 record holders of our common stock, including the nominee of Depository Trust Company which held 9,115,893 shares.
Dividend Policy
Holders of our common stock are entitled to receive such dividends as are declared by our board of directors out of funds legally available for the payment of dividends. We presently intend to retain any earnings to fund the development of our business. Accordingly, we do not anticipate paying any dividends on our common stock for the forseeable future. Any future determination as to declaration and payment of dividends will be made at the discretion of our board of directors.
|
ITEM 6.
|
SELECTED FINANCIAL DATA
|
Not applicable.
|
ITEM 7.
|
MANAGEMENT’S DISCUSSION AND ANALYSIS OF FINANCIAL CONDITION AND RESULTS OF OPERATIONS
|
The following discussion should be read in conjunction with the financial statements and related notes that appear elsewhere in this Annual Report on Form 10-K. This discussion contains forward-looking statements that involve significant uncertainties. Our actual results could differ materially from those anticipated in these forward-looking statements as a result of various factors, including those discussed in “Risk Factors” elsewhere in this report. For further information, see the section titled “Cautionary Notice Regarding Forward-Looking Statements” above.
Discussion of Critical Accounting Policies and Estimates
Discussion of the financial condition and results of our operations is based upon our consolidated financial statements, which have been prepared in accordance with U.S. GAAP. The preparation of these consolidated financial statements requires management to make estimates and assumptions that affect the reported amounts of assets, liabilities, revenues, costs and expenses, and related disclosures. On an ongoing basis, we evaluate our estimates and judgments, including those discussed below. These estimates are based on historical experience and on various other assumptions that are believed to be reasonable under the circumstances. The results of our analysis form the basis for making assumptions about the carrying values of assets and liabilities that are not readily apparent from other sources. Actual results may differ from these estimates under different assumptions or conditions, and the impact of such differences may be material to the consolidated financial statements.
24
Management believes the following critical accounting policies involve significant judgments and estimates in the preparation of our consolidated financial statements:
Revenue Recognition
The Company derives revenues primarily from language translation services, subscription hosting services, professional services or a combination thereof. The Company has two primary services models, each of which is described below.
Technology Enabled Service Model
In our Technology Enabled Service Model, the Company provides all of the customer’s language translation requirements. Services within the Technology Enabled Service Model include: language translation, account management, graphic design services, technical, consulting and professional services. Language translation services are generally billed on a “per word” basis and other services are billed on a per hour rate basis.
In accordance with Financial Accounting Standard Board (“FASB”) and SEC accounting guidance on revenue recognition, the Company considers revenue earned and realizable at the time services are performed and amounts are earned. Sajan considers amounts to be earned when (1) persuasive evidence of an arrangement has been obtained; (2) services are delivered; (3) the fee is fixed or determinable; and (4) collectability is reasonably assured. Determination of criteria (3) and (4) are based on management’s judgments regarding the fixed nature of the fee charged for services rendered and products delivered and the collectability of those fees. The Company recognizes revenue for translations managed on a standard “per word” basis at the time the translation is completed. The Company recognizes revenue for professional services when the services have been completed in accordance with the statement of work.
Managed Service Model
The Managed Service Model has five elements: language translation services, software license fees, post-contract customer support, transaction fees, and professional services. We recognize revenue as earned through transaction fees delivered through the Application Service Provider (ASP) and associated fees for professional services including, implementation, training, and project management provided to customers with installed systems.
For ASP and other hosting arrangements, the Company evaluates whether the customer has the contractual right to take possession of the software at any time during the hosting period without significant penalty and whether the customer can feasibly maintain the software on the customer’s hardware or enter into another arrangement with a third party to host the software. If we determine that the customer has the contractual right to take possession of our software at any time during the hosting period without significant penalty and can feasibly maintain the software on the customer’s hardware or enter into another arrangement with a third party to host the software, we recognize the license, professional services and hosting services revenues. For ASP and other hosting arrangements that do not meet the criteria for recognition, the Company accounts for the elements considering the multiple element arrangements using all applicable facts and circumstances, including whether (i) the element has stand-alone value, (ii) there is a general right of return and (iii) the revenue is contingent on delivery of other elements. The Company allocates revenue to each element of the arrangement that qualifies for treatment as a separate element based on vendor-specific objective evidence (“VSOE”), and if VSOE is not available, third party evidence, and if third party evidence is unavailable, estimated selling price. For professional services associated with ASP and hosting arrangements the Company determines do not have stand-alone value to the customer or are contingent on delivery of other elements, the Company recognizes the services revenue ratably over the term of the applicable agreement.
25
The Company bills service fees either on a time and materials basis or on a fixed-price schedule. In general, the Company’s consulting services are not essential to the functionality of the software. The Company’s software products are fully functional upon delivery and implementation and generally do not require any significant modification or alteration for customer use. Customers purchase the Company’s consulting services to facilitate the adoption of the Company’s technology and may dedicate personnel to participate in the services being performed, but may also decide to use their own resources or appoint other professional service organizations to provide these services. Software products are billed separately from professional services. The Company recognizes revenue from consulting services as services are performed.
In addition, the Company may periodically license to customers certain software which would enable the customer to more efficiently manage and monitor the translation process. In these situations, the Company would receive (1) license fees, and (2) post-contract customer support (maintenance).
The Company recognizes revenue from license fees, based on VSOE when persuasive evidence of an arrangement exists, delivery has occurred, the sales price is fixed or determinable, and collectability is probable at the time the software application is shipped to the client.
The Company’s customers typically purchase maintenance annually. Maintenance prices are based on a percentage of the product license fee. Customers purchasing maintenance receive product upgrades, Web-based technical support and telephone hot-line support. Unspecified product upgrades are not provided without the purchase of maintenance. The Company typically has not granted specific upgrade rights in its license agreements. Specified undelivered elements are allocated a relative fair value amount within a license agreement and the revenue allocated for these elements is deferred until delivery occurs.
Other
Sajan’s agreements with its customers may informally provide the customer with a limited time period following delivery during which the Company will attempt to address any non-conformity to previously agreed upon objective specifications relating to the work. Revenue is recognized as services are delivered in accordance with the terms of the agreement with the customer, are not contingent, and are earned.
Revenues recognized in excess of billings are recorded as unbilled services. Billings in excess of revenues recognized are recorded as deferred revenues until revenue recognition criteria are met.
Income Taxes
Income taxes are provided for tax effects of transactions reported in the consolidated financial statements and consist of income taxes currently due plus deferred income taxes related to timing differences between the basis of certain assets and liabilities for financial statements and income tax reporting. Deferred taxes are determined based on the difference between the financial statement and tax basis of assets and liabilities using enacted tax rates in effect in the years in which the differences are expected to reverse. A valuation allowance for the net deferred tax assets is provided if, based upon the weight of available evidence, it is more likely than not that some or all of the deferred tax assets will not be realized.
We have an accumulated net operating loss (“NOL”) carryforward of approximately $32.2 million for federal income tax purposes and approximately $9.0 million for state income tax purposes. The NOL carryforward amounts may be used to offset future income tax liabilities, subject to limitations as provided in Section 382 of the Internal Revenue Code of 1986, as amended (the “Code”), and will continue to be available provided there is no change of control, as defined in Section 382 of the Code. Based upon the provisions of Section 382 of the Code, as of December 31, 2010, approximately $2.2 million of net operating loss carryforwards are limited as to future use. The amount of these losses which are available in any one year is approximately $0.6 million. No limitations exist on the remaining $30.0 million of federal loss carryover. The Company is allowed to issue shares in each year subsequent to the effective date of the Merger in an amount not to exceed 10% of the share count at the beginning of such year without violating the Section 382 of the Code change of control limitations, even if such issuance were to constitute a change of control as defined in Section 382 of the Code.
26
Software Development Costs
Sajan capitalizes software development costs incurred during the application development stage related to new software or major enhancements to the functionality of existing software that is developed solely to meet the entity’s internal operational needs and when no substantive plans exist or are being developed to market the software externally. Costs capitalized include external direct costs of materials and services and internal payroll and payroll-related costs. Any costs during the preliminary project stage or related to training or maintenance are expensed as incurred. Capitalization ceases when the software project is substantially complete and ready for its intended use. The capitalization and ongoing assessment of recoverability of development costs requires considerable judgment by management with respect to certain external factors, including, but not limited to, technological and economic feasibility, and estimated economic life. When the projects are ready for their intended use, the Company amortizes such costs over their estimated useful lives of three years.
Stock-based Compensation
We measure and recognize compensation expense for all stock-based compensation at fair value. Our determination of fair value of share-based compensation awards on the date of grant using an option-pricing model is affected by our stock price as well as assumptions regarding a number of variables. These variables include, but are not limited to, expected stock price volatility and actual and projected stock option exercise behaviors and forfeitures. An option’s expected term is the estimated period between the grant date and the exercise date of the option. As the expected term increases, the fair value of the option and the compensation cost will also increase. The expected-term assumption is generally calculated using historical stock option exercise data. We do not have historical exercise data to develop such an assumption. In cases where companies do not have historical data and where the options meet certain criteria, SEC Staff Accounting Bulletin 107 (“SAB 107”) provides the use of a simplified expected-term calculation. Accordingly, Sajan calculated the expected terms using the SAB 107 simplified method.
Prior to the Merger, we calculated expected volatility for stock options and awards using an industry index and comparable companies, as we were recently a privately owned company and did not have sufficient information to utilize a historical volatility. We consider specific companies with comparable operations along with the Dow Jones software and computer services small cap technology index to be representative of our size and industry and have used the historical closing total return values of that index for the three years prior to the date of grant to estimate volatility. Management expects and estimates that substantially all employee stock options will vest, and therefore the forfeiture rate used was zero.
The risk-free rates for the expected terms of the stock options are based on the U.S. Treasury yield curve in effect at the time of grant.
Source of Revenues
We generate revenues by providing language translation services to customers for which we are paid based upon the number of words translated and by the languages involved. The price charged per word per language varies depending upon the language, the availability of translator resources and the extent to which our proprietary TMate search algorithm has been applied to reuse prior translation work. We break out for financial reporting purposes revenues for which we incurred direct cost of revenues with linguists versus revenues where the translation is machine-based from Translation Memory. In some cases we may generate revenue by allowing customers to utilize our operating system, for which we will also receive revenue on a per word basis similar to our services business model based upon the number of words processed through our GCMS software platform.
Cost of Revenue
Cost of revenue is highly variable based upon the volume of translation services revenue. We work with freelance linguists who complete the actual language translation, and they are paid on a per word basis. The fixed component of cost of revenue is comprised of the global operations staff located principally in our River Falls, Wisconsin location and also in our Dublin, Ireland location, who are responsible for project and process management, quality control, operational integration, vendor management and production operations. In the near term, our cost of revenues may be affected by a number of factors including the mix of customers, the mix of services and the extent of new customer implementations in a given quarter. Over the long term, we expect cost of revenue will grow in absolute dollars, as we expect to continue to grow our revenue, but decrease as a percentage of revenue due to economies of scale, more efficient sourcing and operational efficiencies from ongoing utilization of our GCMS platform.
27
Sales and marketing expense consists primarily of advertising and promotional costs, wages and benefits for sales and marketing personnel, sales commissions and partner referral fees. Advertising costs consist of pay-per-click payments to search engines and print advertisements in trade journals. Advertising costs are expensed as incurred. Promotional costs consist primarily of public relations, memberships and event costs. As we move to accelerate our sales activities both domestically and internationally, and launch sales and marketing initiatives for our product solutions, we expect sales, advertising and marketing expense to increase in dollar terms but to decrease slightly as a percentage of total sales.
Research and Development Expenses
Research and development expenses represent costs incurred for development of routine enhancements to our operating software system and include costs incurred during the preliminary project stage of development or related to training or maintenance activities. Research and development expenses consist primarily of salaries and related costs of our software engineering organization, fees paid to third party consultants and certain facility expenses. We expense all research and development as incurred.
Research and development expenses consist primarily of wages and benefits for product strategy and development personnel. We have focused our research and development efforts more recently on the industrialization of the GCMS platform and its component modules for general release and independent use by the various participants involved in the content globalization process and for the ability to host GCMS utilizing cloud computing methodologies. Functional development has continued in parallel on improving ease of use, functionality, scalability and efficiency of Translation Memory processing.
General and Administrative Expenses
General and administrative expenses consist primarily of wages and benefits for administrative, human resources, internal information technology support, finance and accounting personnel, professional fees, certain taxes and other corporate expenses. We expect that our general and administrative expenses will increase in absolute dollars but will decrease on a percentage of revenue in 2011, as the costs associated with being a public company stabilize.
Depreciation and Amortization
Depreciation and amortization consist of the expense related to property and equipment, capitalized software development costs and software license costs that are being depreciated or amortized over the estimated useful lives of the assets using the straight-line method.
Foreign Currency Translation
The functional currency for payment of accounts receivable for certain of the Company’s foreign customers is the local currency of the country in which the customer’s operations are based. Realized foreign currency translations gains or losses arising from exchange rate fluctuations on balances denominated in foreign currencies and unrealized foreign currency transaction gains or losses relating to accounts receivable balances were not material for the years ended December 31, 2010 and 2009. Foreign assets and liabilities are translated using the year end exchange rates. Results of operations are translated using average rates throughout the year. Translation gains and losses are accumulated as a separate component of equity.
Results of Operations – Year Ended December 31, 2010 Compared to Year Ended December 31, 2009
For the year ended December 31, 2010, net loss was $3.0 million compared to net loss of $1.1 million for the year ended December 31, 2009. Operating results for the year reflect a 26% increase in revenues driven by additional translation services and a 35% increase in cost of revenues which resulted from a shift in the mix of our business between customers. As a result our gross profit increased by $790,000 or 14%. This was offset by an increase in operating expenses related to increased investment in research and development activities associated with our TMS system and increased general and administrative expenses associated with our the merger transaction, professional fees to comply with public company requirements, and the opening of offices in Ireland and Spain.
28
The major components of revenues, cost of revenue, operating expenses, other income (expense), and income tax benefit are discussed below.
|
Years Ended December 31,
|
% Change
|
|||||||||||
|
Item
|
2010
|
2009
|
(Year Over Year)
|
|||||||||
|
Revenues
|
$ | 15,990,596 | $ | 12,726,202 | 25.7 | % | ||||||
|
Cost of Revenues
|
9,476,046 | 7,001,531 | 35.3 | % | ||||||||
|
Operating Expenses:
|
||||||||||||
|
Sales and Marketing
|
3,006,396 | 3,173,870 | (5.3 | )% | ||||||||
|
Research and Development
|
1,716,461 | 760,472 | 125.7 | % | ||||||||
|
General and Administrative
|
3,826,454 | 2,007,559 | 90.6 | % | ||||||||
|
Depreciation and amortization
|
897,770 | 943,318 | (4.8 | )% | ||||||||
|
Other Income (Expense):
|
||||||||||||
|
Interest expense
|
(110,602 | ) | (209,164 | ) | (47.1 | )% | ||||||
|
Interest and other income
|
29,984 | 3,830 | 682.2 | % | ||||||||
|
Other expense
|
(12,668 | ) | (29,220 | ) | (56.6 | )% | ||||||
|
Income tax benefit
|
- | 308,113 | (100.0 | )% | ||||||||
|
Net loss
|
$ | (3,025,817 | ) | $ | (1,086,989 | ) | 178.40 | % | ||||
Revenues
Revenues totaled $16.0 million for the year ended December 31, 2010 compared to $12.7 million for the year ended December 31, 2009. This $3.3 million or 26.0% increase resulted from an increase in the number of customers, the growth of business with existing customers, and the introduction of new products and services.
The following table summarizes our revenues for the years ended December 31, 2010 and 2009, respectively:
|
|
Years Ended
|
Years Ended
|
||||||||||||||
|
|
December 31,
|
December 31,
|
||||||||||||||
|
|
2010
|
2009
|
2010
|
2009
|
||||||||||||
|
(percentage of revenues)
|
||||||||||||||||
|
Translation and consulting income
|
$ | 14,457,223 | $ | 11,639,588 | 90.40 | % | 91.50 | % | ||||||||
|
Technology income
|
1,312,563 | 1,019,470 | 8.20 | % | 8.00 | % | ||||||||||
|
Product income
|
166,764 | 0 | 1.00 | % | 0.00 | % | ||||||||||
|
Other income
|
54,046 | 67,144 | 0.40 | % | 0.50 | % | ||||||||||
|
Total
|
$ | 15,990,596 | $ | 12,726,202 | 100.0 | % | 100.0 | % | ||||||||
Cost of Revenues
Cost of revenues increased $2.5 million, or 35.3% for the year ended December 31, 2010 compared to the year ended December 31, 2009. As a percentage of revenue, cost of revenues was 59.3% for the year ended December 31, 2010 compared to 55.0% for the year ended December 31, 2009. The increase in dollar terms resulted from an additional $2.4 million of outsourced costs to process the additional words translated, as well as an additional $0.1 million of costs associated with an increase in the operations staff in River Falls. The cost of revenues as a percentage of revenue increased as a result of a shift in the mix of business between customers, the addition of new customers that required incremental implementation costs and the under-utilization of staff which were added in anticipation of future growth.
Cost of revenue excludes depreciation and amortization of $.90 million and $.94 million for the years ended December 31, 2010 and December 31, 2009, respectively, which are included in operating expenses.
29
Operating Expenses
Total operating costs for the year ended December 31, 2010 were $9.4 million compared to $6.9 million for the year ended December 31, 2009. For the year ended December 31, 2010, the major components of these costs were sales and marketing, research and development, general and administrative expenses and depreciation and amortization expense. A discussion of the various components of our operating costs for the years ended December 31, 2010 and 2009 appears below:
Sales and Marketing. Sales and marketing expense of approximately $3.0 million for the year ended December 31, 2010 decreased 5.3% from sales and marketing expense of approximately $3.2 million for the year ended December 31, 2009. The primary reasons for the decrease in our expenses is the result of a decrease in compensation costs related to a revision in the commission program of $143,000 and the reorganization of our domestic sales team which resulted in the reduction of several staff late in 2010 reducing expenses by $156,000. Offsetting these cost reductions were an increase in sales staff costs in Ireland of $67,000 and higher stock based compensation expenses of $28,000 which were required due to the modification of the stock options at the time of the Merger transaction. As a percentage of revenue, sales and marketing expense was 18.8% for the year ended December 31, 2010, a decrease from 24.9% for 2009, reflecting the economies of scale that result from an increase in revenues and a reduction in sales and marketing expenses.
Research and Development. Research and development expense of approximately $1.7 million grew $1.0 million or 125.7% for the year ended December 31, 2010 over research and development expense of $.8 million for the year ended December 31, 2009. The increase for the year ended December 31, 2010 is comprised of additional costs incurred related to our enterprise technology operating system, Global Communication Management System (“GCMS”). The increased expenses primarily resulted from an increase in salaries and benefits expense of $788,000 due to the addition of staff in both the United States and India ($304,000) and fewer development costs capitalized in 2010 than in 2009 ($484,000). In addition, the increase in 2010 results from an increase in stock based compensation expense related to the merger transaction of $260,000. As a percentage of revenue, research and development expense increased to 10.7% for the year ended December 31, 2010 compared to 6.0% for the year ended December 31, 2009.
General and Administrative. General and administrative expense was $3.8 million and $2.0 million for the year ended December 31, 2010 and 2009, respectively, an increase of approximately $1.8 million, or 90.6%. As a percentage of revenue, general and administrative expense was 23.9% for the year ended December 31, 2010 as compared with 15.8% for the year ended December 31, 2009. The largest portion of the increase in costs is due to the Merger that occurred in the first quarter of 2010. Merger related expenses were approximately $585,000. In addition, other costs increased as a result of complying with public company requirements including professional fees, insurance expenses and printing and filing costs. Further, as a result of the Merger, we were required to account for the cost of our facility as rent expense as opposed to consolidating the building into our operations. The result was an increase in rent expense for the year of approximately $280,000. Normal staff cost increases also added to the increase year-over-year, as well as the addition of our Chief Financial Officer increased costs by $261,000. Stock based compensation expenses were also higher in 2010 by about $185,000. Finally, we added incremental general and administrative expenses from our offices in Ireland, India and Spain which accounted for an increase of $378,000 of expense. Ireland and India were opened during 2009 and had an entire year of operation in 2010, while our office in Spain was opened late in 2010.
Depreciation and Amortization. Depreciation and amortization expense was $898,000 and $944,000 for the years ended December 31, 2010 and 2009, respectively, a decrease of $46,000, which is the result of lower depreciation costs associated with our facility. As a percentage of revenue, depreciation and amortization expense was 5.6% for the year ended December 31, 2010 as compared to 7.4% for the year ended December 31, 2009.
Other Income (Expense). Interest expense for the year ended December 31, 2010 of approximately $111,000 decreased from $209,000 for the year ended December 31, 2009 as a result of the elimination of the mortgage interest expense that related to the building owned by River Valley Business Center, LLC and leased by Sajan. The interest expense was discontinued as a result of the deconsolidation of River Valley Business Center, LLC in connection with the merger. Interest and other income for the year ended December 31, 2010 was approximately $30,000 compared to $4 for the year ended December 31, 2009. The increase in interest income is a result of increased cash and cash equivalents. Other expense, which primarily relates to foreign currency transaction costs was $12,000 in 2010 and $29,000 in 2009.
30
Income Tax Benefit
Income tax benefit for the year ended December 31, 2010 was zero compared to income tax benefit of $.3 million for the year ended December 31, 2009.
Stock Based Compensation
Stock based compensation expense was $585,000 for the year ended December 31, 2010 as compared to $112,000 in 2009.
Liquidity and Capital Resources
Summary cash flow data is as follows:
|
|
Years Ended December 31,
|
|||||||
|
|
2010
|
2009
|
||||||
|
Cash flows provided (used) by :
|
||||||||
|
Operating activities
|
$ | (2,079,313 | ) | $ | 695,947 | |||
|
Investing activities
|
4,707,991 | (1,084,445 | ) | |||||
|
Financing activities
|
(850,984 | ) | 140,632 | |||||
|
Net increase (decrease) in cash
|
1,777,694 | (247,866 | ) | |||||
|
Effect of exchange rate changes in cash
|
5,042 | (13,142 | ) | |||||
|
Cash and equivalents, beginning of year
|
120,493 | 381,501 | ||||||
|
Cash and equivalents, end of year
|
$ | 1,903,229 | $ | 120,493 | ||||
Net Cash Provided by (Used in) Operating Activities
Net cash used in operating activities for the year ended December 31, 2010 was $2.1 million, primarily to facilitate the Merger, to fund our growth and expand our operations internationally. Non cash expenses of nearly $1.5 million significantly offset our operating loss of $3.0 million. Net cash provided by operating activities for the year ended December 31, 2009 of $.7 million was a result of a significantly lower net loss, a decrease in accounts receivable and an increase in accrued liabilities, offset by a reduction in deferred revenues.
Net Cash Provided by (Used in) Investing Activities
Net cash of $4.8 million provided by investing activities for the year ended December 31, 2010 primarily related to cash acquired in the Merger. Net cash of $1.1 million used in investing activities for the year ended December 31, 2009 related to purchases of property and equipment, acquisition of specialized software and capitalization of software development costs.
Net Cash Provided by (Used in) Financing Activities
Net cash of $.85 million used in financing activities for the year ended December 31, 2010 primarily related to payments for merger-related costs and repay short-term debt. Net cash of $140,000 provided by financing activities for the year ended December 31, 2009 related to amounts advanced on short -term debt facilities.
Sources of Capital
For the year ended December 31, 2010, our principal source of liquidity was funds generated from operations and cash received as part of the Merger.
31
Sajan’s primary uses of capital resources for the year ended December 31, 2010 have been to fund operating activities, expand business operations internationally, and make nonrecurring payments for professional fees related to the Merger. The capital obtained by way of the Merger will be used to grow and support the business in a variety of different ways, including aggressive expansion of sales and marketing activities both domestically and internationally to drive continued growth in our business. We will continue to invest to improve our translation management system which will extend our differentiation and provide greater value to our global clients. We have a product roadmap influenced heavily by voice of market and will seek to accelerate key feature releases. In the future, we also intend to use this capital and cash generated from operations for purchasing strategic companies which add to the Company’s operations and client base.
We anticipate that we will generate positive cash flow from operations in the next six months but we may require growth capital to fund incremental investments in our sales and marketing activities, our expansion into managed services and, potentially, for acquisitions.
We believe that our cash and cash equivalents and operating cash flows will be sufficient to meet our working capital and capital expenditure requirements for at least the next 12 months. Thereafter, we may need to raise additional funds through public or private financings or borrowings to fund our operations, to develop or enhance products, to fund expansion, to respond to competitive pressures or to acquire complementary products, businesses or technologies. If required, additional financing may not be available on terms that are favorable to us, if at all. If we raise additional funds through the issuance of equity or convertible debt securities, the percentage ownership of our stockholders will be reduced and these securities might have rights, preferences and privileges senior to those of our current stockholders or we may be subject to covenants that restrict how we conduct our business. No assurance can be given that additional financing will be available or that, if available, such financing can be obtained on terms favorable to our stockholders and us.
Off-Balance Sheet Arrangements
The Company had no off-balance sheet arrangements as of December 31, 2010.
Item 7A. Quantitative and Qualitative Disclosures About Market Risk
Not applicable.
32
ITEM 8. FINANCIAL STATEMENTS AND SUPPLEMENTARY DATA
REPORT OF INDEPENDENT REGISTERED PUBLIC ACCOUNTING FIRM
To the Stockholders, Audit Committee and Board of Directors
Sajan, Inc., Subsidiaries and Affiliate (River Valley Business Center, LLC)
River Falls, WI
We have audited the accompanying consolidated balance sheets of Sajan, Inc., Subsidiaries as of December 31, 2010 and 2009, and the related consolidated statements of operations, stockholders’ equity and cash flows for the years then ended. These consolidated financial statements are the responsibility of the company’s management. Our responsibility is to express an opinion on these consolidated financial statements based on our audits.
We conducted our audits in accordance with the standards of the Public Company Accounting Oversight Board (United States). Those standards require that we plan and perform the audit to obtain reasonable assurance about whether the consolidated financial statements are free of material misstatement. The company is not required to have, nor were we engaged to perform, an audit of its internal control over financial reporting. Our audits included consideration of its internal control over financial reporting as a basis for designing audit procedures that are appropriate in the circumstances, but not for the purpose of expressing an opinion on the effectiveness of the company’s internal control over financial reporting. Accordingly, we express no such opinion. An audit includes examining, on a test basis, evidence supporting the amounts and disclosures in the consolidated financial statements. An audit also includes assessing the accounting principles used and significant estimates made by management as well as evaluating the overall consolidated financial statement presentation. We believe that our audits provide a reasonable basis for our opinion.
In our opinion, the consolidated financial statements referred to above present fairly, in all material respects, the financial position of Sajan, Inc., Subsidiaries as of December 31, 2010 and 2009 and the results of their operations and cash flows for the years then ended, in conformity with U.S. generally accepted accounting principles.
/s/ Baker Tilly Virchow Krause, LLP
Minneapolis, Minnesota
March 30, 2011
33
Sajan, Inc., Subsidiaries and Affiliate (River Valley Business Center, LLC) (1)
|
CONSOLIDATED BALANCE SHEETS
|
December 31,
|
|||||||
|
2010
|
2009
|
|||||||
|
Assets
|
||||||||
|
Current assets:
|
||||||||
|
Cash and cash equivalents
|
$ | 1,903,229 | $ | 120,493 | ||||
|
Restricted cash
|
1,000,000 | - | ||||||
|
Accounts receivable, net of allowance of $15,000 and $10,000
|
3,267,120 | 2,871,005 | ||||||
|
Deferred tax asset, net of allowance
|
54,180 | 660,170 | ||||||
|
Unbilled services
|
625,661 | 256,697 | ||||||
|
Prepaid expenses and other current assets
|
138,980 | 38,534 | ||||||
|
Total current assets
|
6,989,170 | 3,946,899 | ||||||
|
Property and equipment, net
|
747,540 | 3,349,556 | ||||||
|
Other assets:
|
||||||||
|
Intangible assets, net
|
178,915 | 336,983 | ||||||
|
Capitalized software development costs, net
|
460,931 | 877,117 | ||||||
|
Other assets, net
|
27,649 | 24,294 | ||||||
|
Total other assets
|
667,495 | 1,238,394 | ||||||
|
Total assets
|
$ | 8,404,205 | $ | 8,534,849 | ||||
|
Liabilities and Stockholders’ Equity
|
||||||||
|
Current liabilities:
|
||||||||
|
Current portion of long-term debt
|
$ | - | $ | 105,159 | ||||
|
Note payable – related party
|
250,000 | 292,973 | ||||||
|
Note payable – indemnification escrow
|
1,000,000 | - | ||||||
|
Line of credit
|
- | 1,000,000 | ||||||
|
Accounts payable
|
1,969,094 | 1,014,261 | ||||||
|
Accrued interest – related party
|
68,164 | 23,415 | ||||||
|
Accrued compensation and benefits
|
481,136 | 505,084 | ||||||
|
Accrued liabilities
|
832,043 | 777,872 | ||||||
|
Deferred revenue
|
319,964 | 336,458 | ||||||
|
Total current liabilities
|
4,920,401 | 4,055,222 | ||||||
|
Long-term liabilities:
|
||||||||
|
Long-term debt, net of current portion
|
- | 2,412,194 | ||||||
|
Note payable – related party
|
750,000 | - | ||||||
|
Deferred tax liability – long-term
|
- | 605,497 | ||||||
|
Total long-term liabilities
|
750,000 | 3,017,691 | ||||||
|
Total liabilities
|
5,670,401 | 7,072,913 | ||||||
|
Commitments and contingencies
|
||||||||
|
Stockholders’ equity:
|
||||||||
|
Preferred stock, $.01 par value, 10,000,000 shares authorized and no shares issued outstanding
|
- | - | ||||||
|
Common stock, $.01 par value, 35,000,000 shares authorized, 16,009,331 issued and outstanding at December 31, 2010; 18,000,000 shares authorized and 5,686,250 issued and outstanding at December 31, 2009
|
160,093 | 56,863 | ||||||
|
Additional paid-in capital
|
6,339,183 | 1,919,161 | ||||||
|
Accumulated deficit
|
(3,743,337 | ) | (709,393 | ) | ||||
|
Accumulated other comprehensive loss:
|
||||||||
|
Foreign currency adjustment
|
(22,135 | ) | (22,896 | ) | ||||
|
Stockholders’ equity
|
2,733,804 | 1,243,735 | ||||||
|
Non-controlling interest in equity affiliate
|
||||||||
|
(River Valley Business Center, LLC) and subsidiary
|
- | 218,201 | ||||||
|
Total equity
|
2,733,804 | 1,461,936 | ||||||
|
Total liabilities and stockholders’ equity
|
$ | 8,404,205 | $ | 8,534,849 | ||||
See notes to consolidated financial statements.
(1) River Valley Business Center, LLC deconsolidated as of February 23, 2010.
34
CONSOLIDATED STATEMENTS OF OPERATIONS
|
Years Ended December 31,
|
||||||||
|
2010
|
2009
|
|||||||
|
Revenues:
|
||||||||
|
Translation and consulting income
|
$ | 14,457,223 | $ | 11,639,588 | ||||
|
Technology income
|
1,312,563 | 1,019,470 | ||||||
|
Product income
|
166,764 | - | ||||||
|
Other income
|
54,046 | 67,144 | ||||||
|
Total revenues
|
15,990,596 | 12,726,202 | ||||||
|
Operating expenses:
|
||||||||
|
Cost of revenues (exclusive of depreciation and amortization)
|
9,476,046 | 7,001,531 | ||||||
|
Sales and marketing
|
3,006,396 | 3,173,870 | ||||||
|
Research and development
|
1,716,461 | 760,472 | ||||||
|
General and administrative
|
3,826,454 | 2,007,559 | ||||||
|
Depreciation and amortization
|
897,770 | 943,318 | ||||||
|
Total operating expenses
|
18,923,127 | 13,886,750 | ||||||
|
Loss from operations
|
(2,932,531 | ) | (1,160,548 | ) | ||||
|
Other income (expense):
|
||||||||
|
Interest expense
|
(110,602 | ) | (209,164 | ) | ||||
|
Interest and other income
|
29,984 | 3,830 | ||||||
|
Other expense
|
(12,668 | ) | (29,220 | ) | ||||
|
Total other (expense), net
|
(93,286 | ) | (234,554 | ) | ||||
|
Net loss before income taxes
|
(3,025,817 | ) | (1,395,102 | ) | ||||
|
Income tax benefit
|
- | (308,113 | ) | |||||
|
Net loss
|
$ | (3,025,817 | ) | $ | (1,086,989 | ) | ||
|
Loss per common share – basic and diluted
|
$ | (0.20 | ) | $ | (0.19 | ) | ||
|
Weighted average shares outstanding – basic and diluted
|
14,999,186 | 5,686,250 | ||||||
See notes to consolidated financial statements.
(1)River Valley Business Center, LLC deconsolidated as of February 23, 2010.
35
|
Sajan Inc., Subsidiaries and Affiliate (River Valley Business Center, LLC)(1)
|
|
CONSOLIDATED STATEMENTS OF STOCKHOLDERS’ EQUITY
|
|
For the years ended December 31, 2010 and 2009
|
|
Common
Shares
|
Common
Stock
|
Additional
Paid-In
Capital
|
Accumulated
other
comprehensive
loss
|
Non-
controlling
interest in
equity of
affiliate
and
subsidiary
|
Retained
earnings
(accumulated
deficit)
|
Total
|
||||||||||||||||||||||
|
Balances at December 31, 2008
|
5,686,250 | $ | 56,863 | $ | 1,824,160 | $ | - | $ | 226,034 | $ | 377,596 | $ | 2,484,653 | |||||||||||||||
|
Net loss
|
- | - | - | - | (8,819 | ) | (1,086,989 | ) | (1,095,808 | ) | ||||||||||||||||||
|
Purchase of subsidiary
|
- | - | (17,413 | ) | - | 986 | - | (16,427 | ) | |||||||||||||||||||
|
Stock-based compensation
|
- | - | 112,414 | - | - | - | 112,414 | |||||||||||||||||||||
|
Other comprehensive loss on foreign currency adjustment
|
- | - | - | (22,896 | ) | - | - | (22,896 | ) | |||||||||||||||||||
|
Balances at December 31, 2009
|
5,686,250 | 56,863 | 1,919,161 | (22,896 | ) | 218,201 | (709,393 | ) | 1,461,936 | |||||||||||||||||||
|
Net loss
|
- | - | - | - | - | (3,025,817 | ) | (3,025,817 | ) | |||||||||||||||||||
|
Issuance of shares in merger transaction
|
10,323,081 | 103,230 | 3,835,240 | - | - | - | 3,938,470 | |||||||||||||||||||||
|
Deconsolidation of affiliate and subsidiary
|
- | - | - | - | (218,201 | ) | (8,127 | ) | (226,328 | ) | ||||||||||||||||||
|
Stock-based compensation
|
- | - | 584,782 | - | - | - | 584,782 | |||||||||||||||||||||
|
Other comprehensive loss on foreign currency adjustment
|
- | - | - | 761 | - | - | 761 | |||||||||||||||||||||
|
Balances at December 31, 2010
|
16,009,331 | $ | 160,093 | $ | 6,339,183 | $ | (22,135 | ) | $ | - | $ | (3,743,337 | ) | $ | 2,733,804 | |||||||||||||
See notes to consolidated financial statements
(1)River Valley Business Center, LLC deconsolidated as of February 23, 2010.
36
Sajan, Inc., Subsidiaries and Affiliate (River Valley Business Center, LLC) (1)
CONSOLIDATED STATEMENT OF CASH FLOWS
|
Years Ended December 31,
|
||||||||
|
|
2010
|
2009
|
||||||
|
Cash flows from operating activities:
|
||||||||
|
Net loss
|
$ | (3,025,817 | ) | $ | (1,086,989 | ) | ||
|
Adjustments to reconcile net loss to net cash from operating activities:
|
||||||||
|
Amortization of capitalized software costs
|
498,002 | 531,626 | ||||||
|
Amortization of license costs
|
160,119 | 131,322 | ||||||
|
Depreciation
|
239,649 | 281,322 | ||||||
|
Stock-based compensation expense
|
584,782 | 112,414 | ||||||
|
Deferred taxes
|
493 | (312,351 | ) | |||||
|
Change in allowance for doubtful accounts
|
5,000 | - | ||||||
|
Decrease (increase) in current assets:
|
||||||||
|
Accounts receivable
|
(517,833 | ) | 67,050 | |||||
|
Change in unbilled services
|
(368,964 | ) | (256,697 | ) | ||||
|
Prepaid expenses and other current assets
|
(89,987 | ) | (16,645 | ) | ||||
|
Increase (decrease) in current liabilities:
|
||||||||
|
Accounts payable
|
984,066 | 445,027 | ||||||
|
Accrued interest – related party
|
68,195 | 2,707 | ||||||
|
Accrued compensation and benefits
|
(23,948 | ) | 33,796 | |||||
|
Other accrued liabilities
|
(576,576 | ) | 555,980 | |||||
|
Deferred revenue
|
(16,494 | ) | 203,148 | |||||
|
Other long-term liabilities
|
- | 4,237 | ||||||
|
Net cash flows provided by (used in) operating activities
|
(2,079,313 | ) | 695,947 | |||||
|
Cash flows from investing activities:
|
||||||||
|
Purchases of property and equipment
|
(198,577 | ) | (162,899 | ) | ||||
|
Purchases of intangible assets
|
(2,051 | ) | (354,586 | ) | ||||
|
Capitalized software development costs
|
(81,816 | ) | (566,961 | ) | ||||
|
Cash acquired in merger transaction
|
5,472,000 | - | ||||||
|
Payment for security deposit
|
(15,406 | ) | - | |||||
|
Payment to dissenter
|
(366,943 | ) | - | |||||
|
Deconsolidation of affiliate
|
(99,216 | ) | - | |||||
|
Net cash flows provided by (used in) investing activities
|
4,707,991 | (1,084,445 | ) | |||||
|
|
||||||||
|
Cash flows from financing activities:
|
||||||||
|
Net proceeds on line of credit
|
- | 300,000 | ||||||
|
Payments on note payable – related party
|
285,645 | (22,709 | ) | |||||
|
Payments on merger costs
|
(540,254 | ) | - | |||||
|
Payments on capital lease obligation
|
(10,514 | ) | (50,517 | ) | ||||
|
Payments on mortgage long-term liability
|
(14,571 | ) | (86,142 | ) | ||||
|
Net cash flows provided by (used in) financing activities
|
(850,984 | ) | 140,632 | |||||
|
|
||||||||
|
Net increase (decrease) in cash and cash equivalents
|
1,777,694 | (247,866 | ) | |||||
|
|
||||||||
|
Effect of exchange rate changes in cash
|
5,042 | (13,142 | ) | |||||
|
|
||||||||
|
Cash and cash equivalents – beginning of period
|
120,493 | 381,501 | ||||||
|
|
||||||||
|
Cash and cash equivalents – end of period
|
$ | 1,903,229 | $ | 120,493 | ||||
|
|
||||||||
|
Cash paid for interest, net of amortization of loan fees
|
$ | 65,853 | $ | 346,814 | ||||
|
Non-cash investing and financing transactions:
|
||||||||
|
Note payable – related party acquired in merger
|
$ | 1,000,000 | $ | - | ||||
|
Short-term note payable – indemnification escrow and restricted cash acquired in merger
|
$ | 1,000,000 | $ | - | ||||
|
Reduction in line of credit via merger transaction
|
$ | 1,000,000 | $ | - | ||||
|
Dissenter accrual acquired in merger transaction
|
$ | 364,000 | $ | - | ||||
|
Other current assets reclassified to investment in subsidiary
|
$ | - | $ | 35,000 | ||||
See notes to consolidated financial statements.
(1)River Valley Business Center, LLC deconsolidated as of February 23, 2010.
37
Sajan, Inc., Subsidiaries and Affiliate (River Valley Business Center, LLC)
Notes to Consolidated Financial Statements
|
1.
|
Nature of Business and Reverse Merger Transaction
|
Sajan, Inc. (the “Company” or “Sajan”), a Delaware corporation, provides language translation services and technology solutions to companies located throughout the world, particularly in the technology, consumer products, medical and life sciences, financial services, manufacturing, government, and retail industries that are selling products into global markets. The Company is located in River Falls, Wisconsin. In 2009, we established Sajan Software Ltd (“Sajan Software”), which is based in Dublin, Ireland. The Ireland facility serves as both a Global Language Service Center and is home to Sajan Software, the producer of Sajan’s technology tools. Sajan India Software Private Limited (“Sajan India”), based in Delhi, India, houses our software development center. In 2010, we also established a Global Language Service Center in Spain, Sajan Spain S.L A (“Sajan Spain”), to serve the European market. All of these operations are wholly-owned subsidiaries of Sajan.
Pursuant to an Agreement and Plan of Merger (the “Merger Agreement”) dated January 8, 2010, by and among MathStar, Inc., a Delaware corporation, and Sajan, Inc. a privately held Minnesota corporation whose business is providing language translation technology and service; Garuda Acquisition, LLC, a wholly-owned subsidiary of MathStar, (“Garuda”) now known as Sajan, LLC; and Thomas Magne, solely in his capacity as agent for the holders of common stock of Sajan, Inc., Sajan, Inc. was merged with and into Garuda Acquisition, LLC, (the “Merger”). Garuda was the surviving entity in the Merger and subsequently changed its name to Sajan, LLC. As a result of the Merger, Sajan became a wholly-owned subsidiary of MathStar. MathStar will continue the business of Sajan and operate as a provider of language translation technology and service under the Sajan name. The Merger was closed and effective on February 23, 2010.
For accounting purposes, Sajan is treated as the continuing reporting entity that acquired MathStar because Sajan obtained effective control of MathStar as a result of the Merger. This determination was based on the following facts: Sajan stockholders have a large minority interest in the combined entity, the governing board consists of a majority of Sajan board members, and the composition of the senior management will be Sajan’s management team. Under this method of accounting, the recognition and measurement provisions of the accounting guidance for business combinations do not apply and, therefore, there is no recognition of goodwill or other intangible assets. Instead, the acquisition has been treated as the equivalent of Sajan issuing stock for the net monetary assets of MathStar, primarily cash, which are stated at their carrying value.
|
2.
|
Summary of Significant Accounting Policies
|
Principles of Consolidation
The accompanying consolidated financial statements include the accounts of Sajan, Inc. and its wholly-owned subsidiaries, Sajan Software, Sajan India and Sajan Spain, from the effective date of their acquisition or formation. The non-controlling interest in subsidiary on the consolidated balance sheets and consolidated statements of operations represents the 6% of Sajan India that was held by third parties during 2009 and part of 2010. This non-controlling interest was reacquired during the third quarter of 2010.
The non-controlling interest in affiliate on the 2009 balance sheet is related to River Valley Business Center, LLC (River Valley), a limited liability company that owns real estate leased to Sajan. River Valley is owned by Shannon Zimmerman and Angela Zimmerman, each of whom is an executive officer and director of the Company, and beneficial owners of the Company’s outstanding voting common stock. Prior to the Merger, the consolidated financial statements included both Sajan, its subsidiaries and River Valley (affiliate) based on a requirement for variable interest entities to be consolidated by their primary beneficiary when certain circumstances exist. The primary beneficiary is the entity that holds the majority of the beneficial interests in the variable interest entity (VIE). A VIE is a legal entity used for business purposes that either does not have equity investors with voting rights or has equity investors that do not provide sufficient financial resources for the entity to support its activities. At December 31, 2009 and through the date of the Merger, Sajan was the primary beneficiary of River Valley, requiring consolidation with the Company. The Merger is a reconsideration event for the lease between Sajan and River Valley. Based on the change in ownership resulting from the Merger, the Company is no longer considered the primary beneficiary of the lease with River Valley. Accordingly, effective on the date of the Merger, River Valley was no longer consolidated with Sajan.
38
All significant intercompany accounts and transactions have been eliminated in the consolidated financial statements.
The pro forma unaudited consolidated financial statements related to the Merger transaction are presented with the deconsolidation of the affiliate. (See Note 3)
Cash and Cash Equivalents
The Company considers all highly liquid investments with an original maturity of three months or less at the date of purchase to be cash equivalents.
Fair Value of Financial Instruments
The carrying amounts of the Company’s financial instruments, which include cash equivalents, accounts receivable, accounts payable and other accrued expenses, approximate their fair values due their short maturities and/or market-consistent interest rates.
Accounts Receivable
The Company extends unsecured credit to customers in the normal course of business. The Company provides an allowance for doubtful accounts when appropriate, the amount of which is based upon a review of outstanding receivables, historical collection information, and existing economic conditions, on an individual customer basis. Normal accounts receivable are due 30 days after issuance of the invoice. Receivables are written off only after all collection attempts have failed, and are based on individual credit evaluation and specific circumstances of the customer. Accounts receivable have been reduced by an allowance for uncollectible accounts of approximately $15,000 and $10,000 at December 31, 2010 and 2009, respectively. Management believes all accounts receivables in excess of the allowance are fully collectible. The Company does not accrue interest on accounts receivable.
Loss Per Common Share
Basic earnings (loss) per share is computed based on the weighted average number of common shares outstanding. Basic per share amounts are computed, generally, by dividing net income (loss) by the weighted average number of common shares outstanding.
Diluted earnings (loss) per share is computed based on the weighted average number of common shares outstanding adjusted by the number of additional shares that would have been outstanding had the potentially dilutive common shares been issued. Potentially dilutive shares of common stock include unexercised stock options and warrants. Diluted per share amounts assume the conversion, exercise or issuance of all potential common stock instruments unless their effect is anti-dilutive, thereby reducing the loss or increasing the income per common share. In calculating diluted weighted average shares and per share amounts, stock options and warrants with exercise prices below average market prices, for the respective fiscal years in which they were dilutive, are considered to be outstanding using the treasury stock method. The treasury stock method requires the calculation of the number of additional shares by assuming the outstanding stock options and warrants were exercised and that the proceeds from such exercises were used to acquire common stock at the average market price during the year. In the event that the Company is in a net loss situation, all options and warrants outstanding are excluded from the diluted weighted average share outstanding calculation as the effect of these options is anti-dilutive.
For the years ended December 31, 2010 and 2009, we excluded options to purchase 836,646 and 945,000 shares and warrants to purchase 557,195 and 415,250 shares from the diluted weighted average share outstanding calculation because the Company had a net loss in both years and inclusion of these shares would have been anti-dilutive.
39
A reconciliation of the basic and diluted loss per share is as follows:
|
|
Years Ended December 31,
|
|||||||
|
|
2010
|
2009
|
||||||
|
Numerator:
|
||||||||
|
Net loss
|
$ | (3,025,817 | ) | $ | (1,086,989 | ) | ||
|
Denominator:
|
||||||||
|
Weighted average common shares outstanding - basic and diluted
|
14,999,186 | 5,686,250 | ||||||
|
Loss per common share - basic and diluted
|
$ | (0.20 | ) | $ | (0.19 | ) | ||
Property and Equipment
Property and equipment are recorded at cost and depreciated over their estimated useful lives, initially determined to be two to five years, using the straight-line method. Upon retirement or sale, the cost of assets disposed of and the related accumulated depreciation are removed from the accounts, and any resulting gain or loss is included in operating results. Repairs and maintenance costs are expensed as incurred.
Capitalized Software Development Costs
Sajan capitalizes software development costs incurred during the application development stage related to new software or major enhancements to the functionality of existing software that is developed solely to meet the entity’s internal operational needs and when no substantive plans exist or are being developed to market the software externally. Costs capitalized include external direct costs of materials and services and internal payroll and payroll-related costs. Any costs during the preliminary project stage or related to training or maintenance are expensed as incurred. Capitalization ceases when the software project is substantially complete and ready for its intended use. The capitalization and ongoing assessment of recoverability of development costs requires considerable judgment by management with respect to certain external factors, including, but not limited to, technological and economic feasibility, and estimated economic life.
When the projects are ready for their intended use, the Company amortizes such costs over their estimated useful lives of three years. Capitalized software amortization expense for the years ended December 31, 2010 and 2009 was $496,858 and $531,626, respectively. Estimated amortization expense for capitalized software costs for the years ending December 31, 2011 and 2012 are expected to be approximately, $331,000, and $130,000, respectively.
The Company measures and recognizes compensation expense for all stock-based compensation at fair value. The Company recognizes stock-based compensation costs on a straight-line basis over the requisite service period of the award, which is generally the option vesting term. For the years ended December 31, 2010 and 2009, total stock-based compensation expense was approximately $585,000 ($0.04 per share) and $112,000 ($0.02, per share), respectively. As of December 31, 2010, there was approximately $286,000 of total unrecognized compensation cost related to non-vested share-based compensation arrangements granted under the Company’s 2004 Long-Term Incentive Plan. That cost is expected to be recognized over a weighted-average period of three years. This is an estimate based on options currently outstanding, and therefore this projected expense could be more in the future.
The Company’s determination of fair value of share-based compensation awards on the date of grant using an option-pricing model is affected by the Company’s stock price as well as assumptions regarding a number of variables. These variables include, but are not limited to; the Company’s expected stock price volatility, and actual and projected stock option exercise behaviors and forfeitures. An option’s expected term is the estimated period between the grant date and the exercise date of the option. As the expected term increases, the fair value of the option and the compensation cost will also increase. The expected-term assumption is generally calculated using historical stock option exercise data; however, the Company does not have historical exercise data to develop such an assumption. As a result, the Company determined the expected term assumption using the simplified expected-term calculation as provided in SEC Staff Accounting Bulletin 107.
40
In 2009, the Company calculated expected volatility for stock options and awards using an industry index and comparable companies, as the Company was a privately owned company and did not have sufficient information to utilize a historical volatility. The Company considered specific companies with comparable operations along with the Dow Jones software and computer services small cap technology index to be representative of the Company’s size and industry and has used the historical closing total return values of that index for the three years prior to the date of grant to estimate volatility. Subsequent to the Merger and going forward, the Company calculates expected volatility for stock options and awards using its own stock price. Management expects and estimates substantially all director and employee stock options will vest, and therefore the forfeiture rate used is zero. The risk-free rates for the expected terms of the stock options are based on the U.S. Treasury yield curve in effect at the time of grant.
The risk-free rates for the expected terms of the stock options are based on the U.S. Treasury yield curve in effect at the time of grant.
In determining the compensation cost of the options granted during 2010 and 2009, the fair value of each option grant has been estimated on the date of grant using the Black-Scholes option pricing model, and the weighted average assumptions used in these calculations are summarized as follows:
|
2010
|
2009
|
|||||||
|
Risk-free interest rate
|
1.16 | % | 2.52 | % | ||||
|
Expected life of options granted
|
4.6 years
|
6.5 years
|
||||||
|
Expected volatility range
|
61 | % | 32 | % | ||||
|
Expected dividend yield
|
0.00 | % | 0.00 | % | ||||
Using the Black-Scholes option pricing model, management has determined that the options and warrants issued in 2010 and 2009 have a weighted-average grant date fair value of $1.45 and $0.84 per share, respectively.
Revenue Recognition
The Company derives revenues primarily from language translation services, subscription hosting services, professional services or a combination thereof. The Company has two primary services models, each of which is described below.
Technology Enabled Service Model
In our Technology Enabled Service Model, the Company provides all of the customer’s language translation requirements. Services within the Technology Enabled Service Model include: language translation, account management, graphic design services, technical, consulting and professional services. Language translation services are generally billed on a “per word” basis and other services are billed on a per hour rate basis.
In accordance with Financial Accounting Standard Board (“FASB”) and SEC accounting guidance on revenue recognition, the Company considers revenue earned and realizable at the time services are performed and amounts are earned. Sajan considers amounts to be earned when (1) persuasive evidence of an arrangement has been obtained; (2) services are delivered; (3) the fee is fixed or determinable; and (4) collectability is reasonably assured. Determination of criteria (3) and (4) are based on management’s judgments regarding the fixed nature of the fee charged for services rendered and products delivered and the collectability of those fees. The Company recognizes revenue for translations managed on a standard “per word” basis at the time the translation is completed. The Company recognizes revenue for professional services when the services have been completed in accordance with the statement of work.
41
Managed Service Model
The Managed Service Model has five elements: language translation services, software license fees, post-contract customer support, transaction fees, and professional services. We recognize revenue as earned through transaction fees delivered through the Application Service Provider (ASP) and associated fees for professional services including, implementation, training, and project management provided to customers with installed systems.
For ASP and other hosting arrangements, the Company evaluates whether the customer has the contractual right to take possession of the software at any time during the hosting period without significant penalty and whether the customer can feasibly maintain the software on the customer’s hardware or enter into another arrangement with a third party to host the software. If we determine that the customer has the contractual right to take possession of our software at any time during the hosting period without significant penalty and can feasibly maintain the software on the customer’s hardware or enter into another arrangement with a third party to host the software, we recognize the license, professional services and hosting services revenues. For ASP and other hosting arrangements that do not meet the criteria for recognition, the Company accounts for the elements considering the multiple element arrangements using all applicable facts and circumstances, including whether (i) the element has stand-alone value, (ii) there is a general right of return and (iii) the revenue is contingent on delivery of other elements. The Company allocates revenue to each element of the arrangement that qualifies for treatment as a separate element based on vendor-specific objective evidence (“VSOE”), and if VSOE is not available, third party evidence, and if third party evidence is unavailable, estimated selling price. For professional services associated with ASP and hosting arrangements the Company determines do not have stand-alone value to the customer or are contingent on delivery of other elements, the Company recognizes the services revenue ratably over the term of the applicable agreement.
The Company bills service fees either on a time and materials basis or on a fixed-price schedule. In general, the Company’s consulting services are not essential to the functionality of the software. The Company’s software products are fully functional upon delivery and implementation and generally do not require any significant modification or alteration for customer use. Customers purchase the Company’s consulting services to facilitate the adoption of the Company’s technology and may dedicate personnel to participate in the services being performed, but may also decide to use their own resources or appoint other professional service organizations to provide these services. Software products are billed separately from professional services. The Company recognizes revenue from consulting services as services are performed.
In addition, the Company may periodically license to customers certain software which would enable the customer to more efficiently manage and monitor the translation process. In these situations, the Company would receive (1) license fees, and (2) post-contract customer support (maintenance).
The Company recognizes revenue from license fees, based on VSOE when persuasive evidence of an arrangement exists, delivery has occurred, the sales price is fixed or determinable, and collectability is probable at the time the software application is shipped to the client.
The Company’s customers typically purchase maintenance annually. Maintenance prices are based on a percentage of the product license fee. Customers purchasing maintenance receive product upgrades, Web-based technical support and telephone hot-line support. Unspecified product upgrades are not provided without the purchase of maintenance. The Company typically has not granted specific upgrade rights in its license agreements. Specified undelivered elements are allocated a relative fair value amount within a license agreement and the revenue allocated for these elements is deferred until delivery occurs.
Other
Sajan’s agreements with its customers may informally provide the customer with a limited time period following delivery during which the Company will attempt to address any non-conformity to previously agreed upon objective specifications relating to the work. Revenue is recognized as services are delivered in accordance with the terms of the agreement with the customer, are not contingent, and are earned.
Revenues recognized in excess of billings are recorded as unbilled services. Billings in excess of revenues recognized are recorded as deferred revenues until revenue recognition criteria are met.
42
Cost of Revenues
Cost of revenues consists primarily of expenses incurred for translation services provided by third parties as well as salaries and associated employee benefits for personnel related to client projects. Cost of revenues excludes depreciation and amortization which is presented separately as a component of operating expenses.
Research and Development
Research and development expenses represent costs incurred for development of routine enhancements to our operating software system and include costs incurred during the preliminary project stage of development or related to training or maintenance activities. Research and development expenses consist primarily of salaries and related costs of our software engineering organization, fees paid to third party consultants and certain facility expenses. We expense all research and development as incurred.
Advertising Costs
The majority of advertising costs are included in sales and marketing expenses and are expensed as incurred. Advertising costs totaled $36,453 and $59,189 for the years ended December 31, 2010 and 2009, respectively.
Foreign Currency Translation
For operations in local currency environments, assets and liabilities are translated at year-end exchange rates with cumulative translation adjustments included as a component of shareholders’ equity and income and expense items are translated at average foreign exchange rates prevailing during the year. For operations in which the U.S. dollar is not considered the functional currency, certain financial statements amounts are re-measured at historical exchange rates, with all other asset and liability amounts translated at year-end exchange rates. These re-measured adjustments are reflected in the results of operations. Gains and losses from foreign currency transactions are included in the Consolidated Statements of Operations.
Income Tax
Current income taxes are recorded based on statutory obligations for the current operating period for the various countries in which the Company has operations.
Deferred taxes are provided on an asset and liability method whereby deferred tax assets are recognized for deductible temporary differences, and deferred tax liabilities are recognized for taxable temporary differences. Temporary differences are the differences between the reported amounts of assets and liabilities and their tax basis. Deferred tax assets are reduced by a valuation allowance when, in the opinion of management, it is more likely than not that some portion or all of the deferred tax assets will not be realized. Deferred tax assets and liabilities are adjusted for the effects of changes in tax laws and rates on the date of enactment.
River Valley is a limited liability company, and, in lieu of corporate income taxes, the members will separately account for their pro rata shares of River Valley’s income, losses, deductions and credits. Accordingly, no provision for River Valley for federal or Wisconsin income taxes was recorded for the years ended December 31, 2010 or 2009. As of the date of the Merger, River Valley was deconsolidated.
Use of Estimates
The preparation of financial statements in conformity with GAAP requires management to make estimates and assumptions that affect the reported amounts of assets and liabilities and disclosure of contingent assets and liabilities at the date of the financial statements and the reported amounts of revenues and expenses during the reporting period. Management bases its estimates on historical experience and on various other assumptions that are believed to be reasonable under the circumstances. Actual results could differ from those estimates.
43
Reclassifications
Certain expense accounts for the year ended December 31, 2009 were reclassified to conform to the current year presentation. These changes had no effect on net loss or stockholders equity.
Recent Accounting Pronouncements
In February 2010, we adopted changes issued by the FASB to consolidation accounting and reporting. These changes establish accounting and reporting for the noncontrolling interest in a subsidiary and for the deconsolidation of a subsidiary. This guidance defines a noncontrolling interest, previously called a minority interest, as the portion of equity in a subsidiary not attributable, directly or indirectly, to a parent. These changes require, among other items, that a noncontrolling interest be included in the consolidated statement of financial position within equity separate from the parent’s equity; that consolidated net income be reported at amounts inclusive of both the parent’s and noncontrolling interest’s shares and, separately, that the amounts of consolidated net income attributable to the parent and noncontrolling interest be included on the consolidated statement of operations; and if a subsidiary is deconsolidated, that any retained noncontrolling equity investment in the former subsidiary be measured at fair value and a gain or loss be recognized in net income based on such fair value. Other than the change in presentation of noncontrolling interests, the adoption of these changes had no impact on the consolidated financial statements. The presentation and disclosure requirements of these changes were applied retrospectively.
In January 2010, the FASB issued amendments to guidance on fair value measurements and disclosures that will require inclusion of the amount of significant transfers in and out of levels 1 and 2 fair value measurements and the reasons for the transfers. In addition, the reconciliation for level 3 activity will be required on a gross rather than net basis. An amendment related to the level of disaggregation in determining classes of assets and liabilities and disclosures about inputs and valuation techniques was also issued. The amendments are effective for annual or interim reporting periods beginning after December 15, 2009, except for the requirement to provide the reconciliation for level 3 activity on a gross basis, which will be effective for fiscal years beginning after December 15, 2010. The Company is currently assessing the impact of the amendments and does not expect the adoption of this amendment guidance to have a material impact on its consolidated financial statements.
In October 2009, the FASB issued Accounting Standards Update (“ASU”) 2009-13, Revenue Recognition (605), Multiple Deliverable Arrangements, a consensus of the FASB Emerging Issues Task Force, which addresses the accounting for products or services (deliverables) separately rather than as a combined unit. ASU 2009-13 also changes the definitions of VSOE. The effective date for ASU 2009-13 is September 30, 2010, although early adoption is permitted. The Company adopted ASU 2009-13 on January 1, 2010. There was not a material impact on the Company’s consolidated financial statements.
|
3.
|
Reverse Merger Transaction –
|
As described in Note 1, effective on February 23, 2010, Sajan, Inc. was merged with and into a wholly-owned subsidiary of MathStar. As a result of the Merger, Sajan became MathStar will continue the business of Sajan and operate as a provider of language translation technology and service under the Sajan name.
At closing, MathStar paid $6,100,000 in cash, of which $5,100,000 was paid to existing stockholders of Sajan. The Merger Agreement provided for the remaining $1,000,000 to be placed in an escrow account with an escrow agent, which funds would be utilized to fulfill the indemnification obligations of the pre-Merger Sajan stockholders through February 23, 2011. This amount is presented as restricted cash and a note payable – indemnification escrow of $1,000,000 on the consolidated balance sheets. The Company may request claims against the escrow as defined in the escrow agreement. The remaining balance of the $1,000,000 escrow at February 23, 2011 was distributed to the pre-Merger Sajan stockholders as defined in the escrow agreement and the Merger Agreement.
As a result of the Merger, Sajan’s 5,573,742 shares of common stock were exchanged for 6,827,734 shares of MathStar common stock, or an exchange of 1 Sajan common share for 1.225 MathStar common shares. Options to purchase Sajan common stock issued under Sajan’s 2001 Stock Option Plan and certain non-plan options and warrants were converted into options and warrants to purchase MathStar common stock and will remain outstanding as options and warrants to purchase shares of MathStar common stock. Immediately after the closing of the Merger, the former stockholders of Sajan, Inc. owned approximately 43% of the outstanding shares of MathStar common stock. At the time of Merger, 112,500 shares, valued at $364,000 per management’s determination of fair value at the time of the Merger, were recorded for dissenter shares. (See Note 14)
44
At the time of the Merger, the following amounts are being allocated from MathStar’s net monetary assets and liabilities to Sajan:
|
Cash and cash equivalents
|
$ | 5,472,000 | ||
|
Restricted cash
|
1,000,000 | |||
|
Prepaid expenses and other assets
|
22,000 | |||
|
Accounts payable and accrued liabilities
|
(652,000 | ) | ||
|
Notes payable – related party
|
(1,000,000 | ) | ||
|
Net monetary assets
|
$ | 4,842,000 |
Cash and cash equivalents, restricted cash, prepaid expenses and other assets, accounts payable: The tangible assets and liabilities were valued at their respective carrying amounts by MathStar, except for adjustments to accrued lease obligations, necessary to state such amounts at their estimated fair values at the effective date of the Merger.
Accrued liabilities: Sajan retained the accrued lease obligations under MathStar’s non-cancellable operating leases, pursuant to which total rent payments were $358,000 in 2010 and will approximate $213,000 for the year ending December 31, 2011. In addition, Sajan retained MathStar’s non-cancellable long-term commitment with Synopsys, Inc. for the purchase of design tools. Payments under this agreement were $151,000 during the year ending December 31, 2010.
Merger transaction costs: In connection with the Merger, MathStar incurred transaction costs of $543,000, including financial advisory, legal, accounting and due diligence costs, which were recorded as Merger transaction expenses on the consolidated statement of operations for the year ended December 31, 2009. Sajan allocated approximately $540,000 of Merger-related costs to additional paid-in capital for the year ended December 31, 2010.
Pro Forma Financial Statements
Since the Merger was effective February 23, 2010, there is not a change in the December 31, 2010 balance sheet and not a material change in the income statement for the year ended December 31, 2010. The unaudited pro forma information for the year ended December 31, 2009 does not purport to represent what the Company’s results of operations would actually have been if such transactions in fact had occurred at such date or to project the Company’s results of future operations.
The accompanying unaudited pro forma consolidated combined financial statements are presented as if Sajan and MathStar had been operating as a combined entity. The unaudited pro forma combined consolidated balance sheet as of December 31, 2009 presents the financial position assuming the Merger had occurred on December 31, 2009. The unaudited pro forma combined consolidated statement of operations for the year ended December 31, 2009 presents the results of operations assuming the acquisition had occurred on January 1, 2009. All material adjustments to reflect the acquisition are set forth in the column “Pro Forma Adjustments”. The pro forma data is for informational purposes only and may not necessarily reflect future results of operations and financial position or what the results of operations or financial position would have been had Sajan and MathStar been operating as a combined entity for the specific periods.
45
SAJAN, INC., SUBSIDIARIES AND AFFILIATE
(RIVER VALLEY BUSINESS CENTER, LLC)
UNAUDITED PRO FORMA COMBINED BALANCE SHEETS
(in thousands, except per share data)
December 31, 2009
|
Sajan, Inc.,
Subsidiaries,
and
Affiliate
|
Deconsolidation of
River Valley
Business Center,
LLC
|
Sajan, Inc.
and
Subsidiaries
|
MathStar,
Inc.
|
Cash Pay
Out
Adjustments
|
Pro Forma
Adjustments
|
Record
MathStar
Net
Assets
Adjustments
|
Unaudited
Pro
Forma
Total
|
|||||||||||||||||||||||||
|
|
||||||||||||||||||||||||||||||||
|
Assets
|
||||||||||||||||||||||||||||||||
|
|
||||||||||||||||||||||||||||||||
|
Current assets:
|
||||||||||||||||||||||||||||||||
|
Cash and cash equivalents
|
$ | 120 | $ | 91 | $ | 29 | $ | 13,050 | $ | (5,100 | )A | $ | 61 | B,C | $ | 5,472 | F,J | $ | 5,562 | |||||||||||||
|
Restricted cash
|
- | - | - | - | - | - | 1,000 | E | 1,000 | |||||||||||||||||||||||
|
Accounts receivable, net of allowance of $10,000
|
2,871 | 30 | 2,841 | - | - | - | - | 2,841 | ||||||||||||||||||||||||
|
Deferred tax asset
|
660 | - | 660 | - | - | - | - | 660 | ||||||||||||||||||||||||
|
Unbilled services
|
257 | - | 257 | - | - | - | - | 257 | ||||||||||||||||||||||||
|
Other current assets
|
39 | 110 | (71 | ) | 54 | - | - | 7 | F | (64 | ) | |||||||||||||||||||||
|
Total current assets
|
3,947 | 231 | 3,716 | 13,104 | (5,100 | ) | 61 | 6,479 | 10,256 | |||||||||||||||||||||||
|
|
||||||||||||||||||||||||||||||||
|
Property and equipment, net
|
3,350 | 2,571 | 779 | - | - | - | - | 779 | ||||||||||||||||||||||||
|
|
||||||||||||||||||||||||||||||||
|
Other assets:
|
||||||||||||||||||||||||||||||||
|
Intangible assets, net
|
337 | - | 337 | - | - | - | - | 337 | ||||||||||||||||||||||||
|
Capitalized software development costs, net
|
877 | - | 877 | - | - | - | - | 877 | ||||||||||||||||||||||||
|
Other assets, net
|
24 | 24 | - | 16 | - | - | 15 | F | 15 | |||||||||||||||||||||||
|
Total other assets
|
1,238 | 24 | 1,214 | 16 | - | - | 15 | 1,229 | ||||||||||||||||||||||||
|
|
||||||||||||||||||||||||||||||||
|
Total assets
|
$ | 8,535 | $ | 2,826 | $ | 5,709 | $ | 13,120 | $ | (5,100 | ) | $ | 61 | $ | 6,494 | $ | 12,264 | |||||||||||||||
|
|
||||||||||||||||||||||||||||||||
|
Liabilities and Stockholders' Equity
|
||||||||||||||||||||||||||||||||
|
|
||||||||||||||||||||||||||||||||
|
Current liabilities:
|
||||||||||||||||||||||||||||||||
|
Current portion of long-term debt
|
$ | 105 | $ | 105 | $ | - | $ | - | $ | - | $ | - | $ | - | $ | - | ||||||||||||||||
|
Cash paid out at closing
|
- | - | - | - | (5,100 | )A | - | - | - | |||||||||||||||||||||||
|
Note payable - related party
|
293 | 31 | 262 | - | - | (262 | )C | 1,000 | E | 1,000 | ||||||||||||||||||||||
|
Note payable - indemnification
|
- | - | - | - | - | - | 1,000 | E | 1,000 | |||||||||||||||||||||||
|
Line of credit
|
1,000 | - | 1,000 | - | - | - | (1,000 | )J | - | |||||||||||||||||||||||
|
Accounts payable
|
1,015 | 51 | 963 | 37 | - | - | 28 | F | 991 | |||||||||||||||||||||||
|
Accrued interest - related party
|
23 | - | 23 | - | - | (23 | )C | - | - | |||||||||||||||||||||||
|
Accrued compensation and benefits
|
505 | - | 505 | - | - | - | - | 505 | ||||||||||||||||||||||||
|
Other accrued liabilities
|
778 | - | 778 | 702 | - | (461 | )D | 775 | F,K | 1,092 | ||||||||||||||||||||||
|
Deferred revenue
|
337 | 6 | 331 | - | - | - | - | 331 | ||||||||||||||||||||||||
|
Total current liabilities
|
4,055 | 193 | 3,862 | 739 | (5,100 | ) | (746 | ) | 1,803 | 4,922 | ||||||||||||||||||||||
|
|
||||||||||||||||||||||||||||||||
|
Long-term liabilities:
|
||||||||||||||||||||||||||||||||
|
Long-term debt, net of current portion
|
2,412 | 2,412 | - | - | - | - | - | - | ||||||||||||||||||||||||
|
Other long-term liability
|
- | - | - | 213 | - | - | 213 | F | 213 | |||||||||||||||||||||||
|
Deferred tax liabilities
|
606 | - | 606 | - | - | - | - | 605 | ||||||||||||||||||||||||
|
Total long-term liabilities
|
3,018 | 2,412 | 606 | 213 | - | - | 213 | 819 | ||||||||||||||||||||||||
|
|
||||||||||||||||||||||||||||||||
|
Total liabilities
|
7,073 | 2,605 | 4,468 | 952 | (5,100 | ) | (746 | ) | 2,016 | 5,741 | ||||||||||||||||||||||
|
|
||||||||||||||||||||||||||||||||
|
Stockholders' equity:
|
||||||||||||||||||||||||||||||||
|
Common stock
|
57 | - | 57 | 92 | - | - | 103 | F,K | 160 | |||||||||||||||||||||||
|
Additional paid-in capital
|
1,919 | - | 1,919 | 155,940 | - | 263 | H,I | 4,375 | F,K | 6,557 | ||||||||||||||||||||||
|
Accumulated deficit
|
(709 | ) | - | (709 | ) | (143,864 | ) | - | 544 | B,D,H,I | - | (165 | ) | |||||||||||||||||||
|
Accumulated other comprehensive loss:
|
||||||||||||||||||||||||||||||||
|
Foreign currency adjustment
|
(23 | ) | - | (23 | ) | - | - | - | - | (23 | ) | |||||||||||||||||||||
|
Stockholders' equity
|
1,244 | - | 1,244 | 12,168 | - | 807 | 4,478 | 6,529 | ||||||||||||||||||||||||
|
|
||||||||||||||||||||||||||||||||
|
Non-controlling interest in equity of affiliate and subsidiary (River Valley Business Center, LLC)
|
218 | 221 | (3 | ) | - | - | - | - | (3 | ) | ||||||||||||||||||||||
|
Total equity
|
1,462 | 221 | 1,241 | 12,168 | - | 807 | 4,478 | 6,526 | ||||||||||||||||||||||||
|
|
||||||||||||||||||||||||||||||||
|
Total liabilities and stockholders' equity
|
$ | 8,535 | $ | 2,826 | $ | 5,709 | $ | 13,120 | $ | (5,100 | ) | $ | 61 | $ | 6,494 | $ | 12,264 | |||||||||||||||
Sajan, Inc., subsidiaries and affiliate (River Valley Business Center, LLC)
Common stock, $.01 par value, 18,000 shares authorized, 9,181 (pre merger) and 16,009 (pro forma) issued and outstanding at December 31, 2009
Preferred stock, $.01 par value, 10,000 shares authorized, no shares issued and outstanding at December 31, 2009
SEE NOTES TO UNAUDITED PRO FORMA FINANCIAL STATEMENTS
46
SAJAN, INC., SUBSIDIARIES AND AFFILIATE
(RIVER VALLEY BUSINESS CENTER, LLC)
UNAUDITED PRO FORMA COMBINED STATEMENTS OF OPERATIONS
(in thousands, except per share data)
For the year ended December 31, 2009
|
Sajan, Inc.,
Subsidiaries,
and Affiliate
|
Deconsolidation
of River Valley
Business
Center, LLC
|
Adjustments
|
Sajan, Inc.
and
Subsidiaries
|
MathStar,
Inc.
|
Pro Forma
Adjustments
|
Unaudited
Pro Forma
Total
|
||||||||||||||||||||||
|
Revenues:
|
|
|
|
|
|
|
|
|||||||||||||||||||||
|
Translation and consulting income
|
$ | 11,640 | $ | - | $ | - | $ | 11,640 | $ | - | $ | - | $ | 11,640 | ||||||||||||||
|
Technology income
|
1,019 | - | - | 1,019 | - | - | 1,019 | |||||||||||||||||||||
|
Rental income
|
67 | 406 | 339 | G | - | - | - | - | ||||||||||||||||||||
|
Other revenue
|
- | - | - | - | 95 | - | 95 | |||||||||||||||||||||
|
Total revenues
|
12,726 | 406 | 339 | 12,659 | 95 | - | 12,754 | |||||||||||||||||||||
|
|
||||||||||||||||||||||||||||
|
Operating expenses:
|
||||||||||||||||||||||||||||
|
Cost of revenues (exclusive of amortization and depreciation included below)
|
7,002 | - | - | 7,002 | 105 | - | 7,107 | |||||||||||||||||||||
|
Sales and marketing
|
3,174 | - | - | 3,174 | - | 158 | I | 3,332 | ||||||||||||||||||||
|
Research and development
|
760 | - | - | 760 | 36 | 3 | I | 799 | ||||||||||||||||||||
|
General and administrative
|
2,008 | 246 | 339 | G | 2,101 | 2,200 | (705 | )H | 3,596 | |||||||||||||||||||
|
Depreciation and amortization
|
943 | - | - | 943 | - | - | 943 | |||||||||||||||||||||
|
Restructuring and impairment charges
|
- | - | - | - | 593 | - | 593 | |||||||||||||||||||||
|
Total operating expenses
|
13,887 | 246 | 339 | 13,980 | 2,934 | (544 | ) | 16,370 | ||||||||||||||||||||
|
|
||||||||||||||||||||||||||||
|
Income (loss) from operations
|
(1,161 | ) | 160 | - | (1,321 | ) | (2,839 | ) | 544 | (3,616 | ) | |||||||||||||||||
|
|
||||||||||||||||||||||||||||
|
Other income (expense):
|
||||||||||||||||||||||||||||
|
Interest expense
|
(209 | ) | (165 | ) | - | (44 | ) | - | - | (44 | ) | |||||||||||||||||
|
Interest and other income
|
4 | - | - | 4 | 88 | - | 92 | |||||||||||||||||||||
|
Other expense
|
(29 | ) | - | - | (38 | ) | - | - | (38 | ) | ||||||||||||||||||
|
Total other income (expense)
|
(234 | ) | (165 | ) | - | (69 | ) | 88 | - | 19 | ||||||||||||||||||
|
|
||||||||||||||||||||||||||||
|
Net loss before income taxes
|
(1,395 | ) | (5 | ) | - | (1,390 | ) | (2,751 | ) | 544 | (3,597 | ) | ||||||||||||||||
|
|
||||||||||||||||||||||||||||
|
Income tax benefit
|
(308 | ) | - | - | (308 | ) | - | - | (308 | ) | ||||||||||||||||||
|
|
||||||||||||||||||||||||||||
|
Net loss
|
$ | (1,087 | ) | $ | (5 | ) | $ | - | $ | (1,082 | ) | $ | (2,751 | ) | $ | 544 | $ | (3,289 | ) | |||||||||
|
|
||||||||||||||||||||||||||||
|
Loss per common share - Basic and diluted
|
$ | (0.19 | ) | $ | - | $ | - | $ | (0.19 | ) | $ | (0.30 | ) | $ | - | $ | (0.21 | ) | ||||||||||
|
|
||||||||||||||||||||||||||||
|
Weighted average shares outstanding - Basic and diluted
|
5,686 | - | - | 5,686 | 9,181 | - | 16,009 | |||||||||||||||||||||
SEE NOTES TO UNAUDITED PRO FORMA FINANCIAL STATEMENTS
47
NOTES TO UNAUDITED PRO FORMA FINANCIAL STATEMENTS (in thousands)
The Merger is a reconsideration event for the lease between Sajan and River Valley Business Center, LLC (affiliate). Based on the change in ownership, the Company is no longer considered the primary beneficiary of the lease with River Valley Business Center, LLC (affiliate). The pro forma unaudited financial statements are presented with the deconsolidation of the affiliate.
|
|
A
|
Merger document notes cash of $5,100 paid at the time of closing to the stockholders of Sajan.
|
|
|
B
|
Transaction costs of $261 related fees and expenses by MathStar.
|
|
|
Transaction costs of $85 related fees and expense by Sajan.
|
|
|
C
|
Payment of note payable – related party of $262 and accrued interest – related party of $23 as required by the Merger Agreement.
|
|
|
D
|
Transaction costs accrued of $282 related fees and expenses by MathStar.
|
|
|
Transaction costs accrued of $179 related fees and expenses by Sajan.
|
|
|
E
|
Merger agreement provides for a note payable for one year of $1,000 to the majority stockholders of Sajan.
|
|
|
Merger agreement provides for $1,000 to be placed in escrow for the indemnification obligations.
|
|
|
F
|
Record net monetary assets of MathStar of $4,842 for the issuance of 9,181 shares of common stock and the conversion of Sajan shares at 1.225 per share.
|
|
|
G
|
Rent expense paid by Sajan to River Valley Business Center, LLC which will no longer be accounted for as a variable interest entity.
|
|
|
H
|
Transaction costs of $543 related fees and expenses by MathStar.
|
Transaction costs of $264 related fees and expenses by Sajan.
Stock options and warrants repriced based on terms of Merger document. Expense of $102 for the modification for vested equity instruments.
Additional expense to be recorded for the modifications in the years ending December 31:
|
2010
|
$ | 17 | ||
|
2011
|
16 | |||
|
2012
|
16 | |||
|
2013
|
16 | |||
|
|
$ | 65 |
|
|
I
|
Stock options and warrants repriced based on terms of Merger document. Expense of $161 for the modification for vested equity instruments.
|
Additional expense to be recorded for the modifications in the years ending December 31:
|
2010
|
$ | 156 | ||
|
2011
|
80 | |||
|
2012
|
77 | |||
|
|
$ | 313 |
48
|
|
J
|
Pay off of line of credit of $1,000.
|
|
|
K
|
Accrual for 113 dissenter’s common shares with a fair value of $364.
|
|
4.
|
Concentrations of Credit Risk –
|
Financial instruments which potentially subject the Company to concentrations of credit risk consist principally of cash and cash equivalents and accounts receivable.
Cash Concentration – The Company places its cash at financial institutions with balances that, at times, may exceed federally insured limits. The Company evaluates the creditworthiness of these financial institutions in determining the risk associated with these deposits. The Company has not experienced any losses on such accounts.
Accounts receivable concentration – Concentrations of credit risk with respect to trade accounts receivable are limited due to the dispersion of customers across different industries and geographic regions. At December 31, 2010, one customer accounted for approximately 36% of accounts receivable. At December 31, 2009 three customers accounted for 18%, 17%, and 12% of accounts receivable, respectively.
Sales concentration – For the year ended December 31, 2010, the Company had one customer that accounted for 15% of net revenues. For the year ended December 31, 2009, two customers accounted for 14% and 12% of net revenues.
|
5.
|
Segment Information and Major Customers –
|
The Company views its operations and manages its business as one reportable segment, providing language translation solutions to a variety of companies, primarily in its targeted vertical markets. Factors used to identify the Company’s single operating segment include the financial information available for evaluation by the chief operating decision maker in making decisions about how to allocate resources and assess performance. The Company markets its products and services through its headquarters in the United States and its wholly-owned subsidiaries operating in Ireland, Spain and India.
Net sales per geographic region, based on the billing location of end customer, are summarized below. For comparative purposes, we have omitted rental income of approximately $10,200 and $67,200 for the years ended December 31, 2010 and 2009, respectively, derived from the River Valley affiliate through the effective date of the Merger.
|
Years Ended December 31,
|
||||||||||||||||
|
2010
|
2009
|
|||||||||||||||
|
Sales
|
Percent
|
Sales
|
Percent
|
|||||||||||||
|
United States
|
$ | 12,163,284 | 76.1 | % | $ | 10,513,975 | 83.1 | % | ||||||||
|
International
|
3,817,112 | 23.9 | % | 2,145,027 | 16.9 | % | ||||||||||
|
Total Sales
|
$ | 15,980,396 | 100.0 | % | $ | 12,659,002 | 100.0 | % | ||||||||
49
|
6.
|
Property and equipment —
|
Property and equipment consisted of the following at December 31:
|
2010
|
2009
|
|||||||
|
Furniture, equipment, and software
|
$ | 1,359,823 | $ | 1,115,221 | ||||
|
Vehicles
|
61,659 | |||||||
|
Building and building improvements
|
2,541,778 | |||||||
|
Leasehold improvements
|
380,796 | 850,631 | ||||||
|
Total
|
1,740,619 | 4,569,289 | ||||||
|
Less accumulated depreciation and amortization
|
(993,079 | ) | (1,219,733 | ) | ||||
|
Total property and equipment, net
|
$ | 747,540 | $ | 3,349,556 | ||||
Prior to the Merger, the consolidated financial statements included both Sajan, its subsidiaries and River Valley, a limited liability company that owns real estate leased to Sajan. Based on the change in ownership resulting from the Merger, the Company is no longer considered the primary beneficiary of the lease with River Valley and accordingly, effective on the date of the Merger, River Valley was no longer consolidated with Sajan. This resulted in a decrease in property and equipment, net of $2,556,665.
Depreciation and amortization expense was $241,899 and $281,322 for the years ended December 31, 2010 and 2009, respectively.
7. Capitalized Software Development Costs—
Capitalized software development costs consist of the following as of December 31:
|
|
2010
|
2009
|
||||||
|
Capitalized software development costs
|
$ | 2,565,172 | $ | 2,483,356 | ||||
|
Less accumulated amortization
|
(2,104,241 | ) | (1,606,239 | ) | ||||
|
Total capitalized software development costs, net
|
$ | 460,931 | $ | 877,117 | ||||
8. Related Party Transactions –
Notes Payable
Notes payable and accrued interest to related parties was approximately $1,068,000 and $316,000 at December 31, 2010 and December 31, 2009, respectively, related to two notes payable to officers and stockholders of the Company, Shannon and Angela Zimmerman. The majority of the note payable as of December 31, 2009 was paid as of the date of the Merger. On February 23, 2010, the Company issued a Promissory Note to Shannon and Angela Zimmerman as part of the Merger consideration. The Promissory Note documents the Company’s obligation to pay $1,000,000 of the pro rata amount of the cash Merger consideration to the Zimmermans. The Promissory Note had a term of one year and provides for an interest rate of 8% per year to be accrued until payment of the Promissory Note. Accrued interest was approximately $68,000 as of December 31, 2010. Upon the occurrence of an “event of default,” as defined in the Promissory Note, and at any time thereafter, the unpaid principal balance, plus accrued interest, plus all other amounts due under the Promissory Note will, at the option of the Zimmermans, be immediately due and payable, without notice or demand. The obligations of the Company under the Promissory Note are unsecured.
50
On February 22, 2011, the Promissory Note was amended. The amendment called for the payment of $250,000 of the principle amount immediately together with all accrued interest, but extended the due date on the remaining $750,000 principle amount of the Promissory Note to August 23, 2012. The other terms of the Promissory Note remain the same.
Lease
Sajan leases its office space from River Valley under two non-cancelable operating leases. The first lease was entered into during 2005 and originally expired in January 2026. The second lease was entered into during 2008 and originally expired in January 2026. In February 2010, the lease terms were amended to expire on January 31, 2017 and reduce the monthly lease payments by $1,766 per month. These lease agreements require the Company to pay a minimum monthly rental plus certain operating expenses. Related party rental income and expense for the office leases of approximately $51,400 and $338,640 has been eliminated from the consolidated financial statements for the years ended December 31, 2010 and 2009, respectively. Payment of rent under these leases is secured by goods, chattels, fixtures and personal property of the Company.
9. Debt –
Line of Credit
The Company had $0 and $1,000,000 outstanding at December 31, 2010 and December 31, 2009, respectively, under a $1,000,000 bank line of credit. The line of credit due in December 2009 was extended to mature in March 2010. The line of credit was paid in full and closed on February 23, 2010.
Long Term Debt
|
Long-term debt consists of the following at December 31, 2009:
|
||||
|
Mortgage Payable - First National Bank, monthly installments of $10,506 including interest at 6.00%, due March 15, 2016, secured by the building
|
$ | 1,502,878 | ||
|
Mortgage Payable - First National Bank, monthly installments of $1,584 including interest at 6.00%, due September 5, 2011, secured by the building
|
30,048 | |||
|
Mortgage Payable - Small Business Administration, monthly installments of $8,664 including interest at 5.65%, due March 1, 2026, secured by the building
|
984,427 | |||
|
Total long-term debt
|
2,517,353 | |||
|
Less: Current Portion
|
(105,159 | ) | ||
|
Long-term debt, net of current portion
|
$ | 2,412,194 | ||
Prior to the Merger, the consolidated financial statements included both Sajan, its subsidiaries and River Valley, a limited liability company that owns real estate leased to Sajan. The long-term debt at December 31, 2009 was debt that was held by River Valley that was associated with the Sajan building. Based on the change in ownership resulting from the Merger, the Company is no longer considered the primary beneficiary of the lease with River Valley and accordingly, effective on the date of the Merger, River Valley was no longer consolidated with Sajan.
51
10. Accrued Liabilities –
Accrued liabilities of the following at December 31:
|
|
2010
|
2009
|
||||||
|
Legal and professional services
|
$ | 20,328 | $ | 184,497 | ||||
|
Professional translator services
|
551,586 | 418,243 | ||||||
|
Accrued lease obligations
|
213,029 | - | ||||||
|
Other
|
47,100 | 144,931 | ||||||
|
Total
|
$ | 832,043 | $ | 747,671 | ||||
11. Non-controlling Interest –
In 2009, Sajan formed Sajan India, a software development subsidiary in Delhi, India. To comply with local regulations, two individuals created the subsidiary and each held a 3% interest at time of formation. During the third quarter of 2010, the Company acquired this 6% interest for $3,000 and the Indian operation is now a wholly-owned subsidiary of Sajan. All non-controlling interests have been eliminated as a result of the acquisition of the outstanding shares and recorded through retained earnings. In view of the immaterial amount involved to reacquire the shares, no purchase accounting adjustments have been recorded. The non-controlling interest at December 31, 2009 was $3,075.
Prior to the Merger, the consolidated financial statements included both Sajan, its subsidiaries and River Valley, a limited liability company that owns real estate leased to Sajan. Based on the change in ownership resulting from the Merger, the Company is no longer considered the primary beneficiary of the lease with River Valley and accordingly, effective on the date of the Merger, River Valley was no longer consolidated with Sajan. The non-controlling interest related to River Valley was immaterial for each of the years ended December 31, 2010 and 2009.
12. Options and Warrants –
Amended and Restated 2004 Long-Term Incentive Plan
As a result of the Merger, Sajan adopted the Mathstar Amended and Restated 2004 Long-Term Incentive Plan (the “Plan”). Over the past several years, shareholders had approved various modifications to the plan so that at the time of the Merger, 1,200,000 shares of the Company's common stock were reserved for the issuance of restricted stock and incentive and nonqualified stock options to directors, officers and employees of and advisors to the Company at exercise prices as determined by the Board of Directors on the dates of grants. Subsequent to the Merger, on June 10, 2010, the stockholders of Sajan approved an amendment to increase the number of shares reserved for issuance by 1.0 million shares. The total number of shares reserved under the Plan as of December 31, 2010 is 2,200,000.
Upon completion of the Merger, Sajan converted the options outstanding in their 2001 Stock Option Plan into 1.225 options of MathStar common stock.
The following table summarizes stock option activity for options granted under and outside of the Plan for the years ended December 31, 2010 and 2009:
52
|
Number of
Stock
Options
|
Weighted-
Average
Exercise
Price
|
Weighted-
Average
Fair
Value
|
Weighted-
Average
Remaining
Contractual
Term
(Years)
|
|||||||||||||
|
Balance at December 31, 2008
|
319,375 | $ | 1.99 | $ | 0.50 | 5.7 | ||||||||||
|
Granted
|
525,000 | 2.72 | 1.02 | |||||||||||||
|
Cancelled
|
(2,250 | ) | 1.00 | 0.26 | ||||||||||||
|
Balance at December 31, 2009
|
842,125 | $ | 2.45 | $ | 0.82 | 8.7 | ||||||||||
|
Conversion of Sajan options
|
189,479 | 1.08 | 0.82 | |||||||||||||
|
Options assumed in Merger
|
127,369 | 19.45 | ||||||||||||||
|
Granted
|
296,000 | 1.45 | 0.87 | |||||||||||||
|
Cancelled
|
(618,327 | ) | 3.64 | 1.80 | ||||||||||||
|
Balance at December 31, 2010
|
836,646 | $ | 2.01 | $ | 1.25 | 7.3 | ||||||||||
|
Exercisable
|
378,868 | $ | 2.97 | $ | 1.24 | 5.8 | ||||||||||
|
Vested during the year
|
326,979 | $ | 1.11 | $ | 1.50 | |||||||||||
|
Nonvested at December 31, 2010
|
457,778 | $ | 1.20 | $ | 1.25 | 8.6 | ||||||||||
Aggregate fair value of options vested during the years ended December 31, 2010 and 2009 were $491,304 and $86,790, respectively.
Intrinsic value as of December 31, 2010 is based on the fair value price of $0.95, which would have been received by the option holders had all in-the-money option holders exercised their options as of that date. The Company used a fair value of $2.72 on December 31, 2009. The total number of shares of in-the-money options outstanding as of December 31, 2010 and 2009 was 394,479 and 317,125 shares, respectively. The total number of shares subject to in-the-money options exercisable as of December 31, 2010 and 2009 was 288,670 and 154,125 shares, respectively. The intrinsic value of options outstanding and exercisable at December 31, 2010 was $134,316 and $99,241, respectively. The intrinsic value of options outstanding and exercisable at December 31, 2009 was $159,166 and $77,466, respectively.
The following is a summary of warrants outstanding and exercisable for the years ended December 31, 2010 and 2009:
|
Warrants
Shared
|
Weighted-
Average
Exercise
Price
|
Weighted-
Average
Fair
Value
|
Aggregate
Fair Value
|
Weighted-
Average
Remaining
Contractual
Term
(Years)
|
||||||||||||||||
|
Balance at December 31, 2009
|
102,875 | $ | 2.00 | $ | 0.55 | $ | 56,581 | 6.75 | ||||||||||||
|
Exercisable at end of period
|
102,875 | 2.00 | 0.55 | 56,581 | ||||||||||||||||
|
Warrants Converted in Merger
|
23,147 | 0.61 | ||||||||||||||||||
|
Warrants assumed in Merger
|
581,044 | 23.30 | 0.00 | 0.00 | 1.1 | |||||||||||||||
|
Warrants expired
|
(159,059 | ) | 23.30 | |||||||||||||||||
|
Balance at December 31, 2010
|
557,195 | $ | 17.89 | $ | 0.10 | $ | 56,581 | 2.2 | ||||||||||||
|
Exercisable
|
557,195 | $ | 17.89 | $ | 0.10 | $ | 56,581 | 2.2 | ||||||||||||
|
Nonvested at December 31, 2010
|
0 | $ | 0.00 | $ | 0.00 | $ | 0.00 | |||||||||||||
53
13. Income Taxes –
The following is a reconciliation of the federal statutory income tax rate to income tax expense for the years ended December 31:
|
2010
|
2009
|
|||||||
|
Federal Income tax at the statutory rate
|
$ | (1,067,150 | ) | $ | (491,373 | ) | ||
|
State income tax
|
(240,871 | ) | (60,693 | ) | ||||
|
Federal benefit for state taxes
|
84,305 | 21,243 | ||||||
|
Non-deductible expenses
|
20,068 | 36,853 | ||||||
|
Transaction costs
|
- | 86,625 | ||||||
|
Foreign rate differential
|
- | 74,474 | ||||||
|
Change in tax rate on deferred items
|
(194,199 | ) | - | |||||
|
Valuation allowance
|
1,397,847 | - | ||||||
|
Other
|
- | 24,758 | ||||||
|
Income tax expense (benefit)
|
$ | - | $ | 308,113 | ||||
Our deferred income tax assets and liabilities are recognized for the differences between the financial statement and income tax reporting basis of assets and liabilities based on currently enacted rates and laws. These differences include depreciation, net operating loss carryforwards, capital loss carryforwards, allowance for accounts receivable, stock options and warrants, prepaid expenses, capitalized software costs, cash to accrual conversion, and accrued liabilities. Prior to the year ended December 31, 2009, the Company filed its tax returns based upon the cash method. During the year ended December 31, 2009, the Company reached an average level of revenues that required the Company to file its tax returns based upon the accrual method. This change in tax accounting method resulted in the reversal of the Company’s deferred tax liabilities related to accounts receivable and its deferred tax assets related to accounts payable and other liabilities, as well as all or a portion of the Company’s net operating loss carryforwards.
|
Net deferred tax assets consist of the following as of December 31:
|
||||||||
|
2010
|
2009
|
|||||||
|
Deferred tax assets:
|
|
|
||||||
|
Accounts payable and other liabilities
|
$ | 325,779 | $ | 414,184 | ||||
|
Stock-based compensation
|
340,208 | 19,230 | ||||||
|
Net operating loss and credit carryforward
|
12,475,000 | 804,309 | ||||||
|
Other
|
36,649 | 5,570 | ||||||
|
Valuation allowance
|
(12,311,734 | ) | ||||||
|
|
$ | 865,902 | $ | 1,243,293 | ||||
|
Deferred tax liabilities
|
||||||||
|
Accounts receivable and other assets
|
(585,128 | ) | (823,084 | ) | ||||
|
Depreciation
|
(41,394 | ) | (38,460 | ) | ||||
|
Capitalized software development costs
|
(185,200 | ) | (327,078 | ) | ||||
| $ | (811,722 | ) | $ | (1,188,620 | ) | |||
54
The above deferred taxes have been classified in the accompanying consolidated balance sheets as follows as of December 31:
|
2010
|
2009
|
|||||||
|
Current assets
|
$ | 54,180 | $ | 660,170 | ||||
|
Noncurrent liability
|
- | (605,497 | ) | |||||
|
|
$ | 54,180 | $ | 54,673 | ||||
The provision for income taxes charged to operations consists of the following for the years ended December 31:
|
2010
|
2009
|
|||||||
|
Current
|
$ | - | $ | 4,237 | ||||
|
Deferred - US
|
- | (284,239 | ) | |||||
|
Deferred - Foreign
|
- | (28,111 | ) | |||||
|
Total
|
$ | - | $ | (308,113 | ) | |||
The cumulative net operating loss available to offset future income for federal and state reporting purposes was approximately $32.2 million and $9.0 million, respectively as of December 31, 2010. Available research and development credit carryforwards at December 31, 2010, were $.7 million. The difference between the amount of net operating loss carryforward available for federal and state purposes is due to the fact that a substantial portion of the operating losses were generated in states in which the Company does not have ongoing operations. No deferred taxes have been provided for these losses. The Company's federal and state net operating loss carryforwards expire in various calendar years from 2015 through 2030 and the tax credit carryforwards expire in calendar years 2020 through 2028.
In connection with the Merger, the Company acquired $10.7 million of net deferred tax assets which included $9.8 million in federal net operating loss carryforwards, $0.2 million in state net operating loss carryforwards and $0.7 million of federal tax credit carryforwards. The acquired net deferred tax assets have a full valuation allowance to fully reserve against those deferred tax assets as the Company believes it is more likely than not that it will be unable to fully utilize the acquired deferred tax benefits.
Future utilization of available net operating loss carryforwards may be limited under Section 382 of the Internal Revenue Code of 1986, as amended (the “Code”) as a result of significant changes in ownership. These limitations could result in reduction of these net operating loss carryforwards before they are utilized. Based upon the provisions of Section 382 of the Code, as of December 31, 2010 approximately $2.2 million of net operating loss carryforwards are limited as to future use. The amount of these losses which are available in any one year is approximately $0.6 million. No limitations exist on the remaining $30.0 million of federal loss carryforwards.
In assessing the recovery of the deferred tax assets, management considers whether it is more likely than not that a portion or all of the deferred tax assets will not be realized. The ultimate realization of deferred tax assets is dependent upon the generations of future taxable income in the periods in which those temporary differences become deductible. Management considers the scheduled reversals of future deferred tax liabilities, projected future taxable income, and tax planning strategies in making this assessment. As such, the Company has recorded a valuation allowance to offset a portion of its deferred taxes. The valuation allowance was $12.3 million and $0 as of December 31, 2010 and December 31, 2009, respectively.
On February 25, 2010, the Company entered into the Tax Benefit Preservation Plan and Rights Agreement (the “Preservation Plan”) with Wells Fargo Shareowner Services, a division of Wells Fargo Bank, National Association, as Rights Agent. The Company’s Board of Directors adopted the Preservation Plan in an effort to protect against a possible limitation on the ability to use its net operating losses under the Code and rules promulgated by the Internal Revenue Service. Under the Preservation Plan, beginning March 12, 2010, for each share of the Company’s common stock held, the holder of the common stock has the right to purchase one one-millionth of a share of a new series of preferred stock of the Company.
55
We file a consolidated U.S. federal tax return. The Company’s federal and state tax returns for the years ended 2008-2010 are still subject to examination. As a result of the adoption of ASC 740 – Income Taxes, effective October 1, 2007, we applied the requirements of ASC 740 to all tax positions for which the statute of limitations remained open. ASC 740 was issued to address the non-comparability in reporting tax assets and liabilities resulting from a lack of specific guidance in prior standards on consistent recognition threshold and a measurement attribute for the financial statement recognition and measurement of a tax position taken or expected to be taken in a tax return. ASC 740 also provides related guidance on derecognition, classification, interest and penalties, accounting interim periods, disclosures and transition. To the extent interest and penalties would be assessed by taxing authorities on any underpayment of income taxes, such amounts would be accrued and classified as a component of income tax expenses on the consolidated statement of operations.
14. Commitments and Contingencies
Capital Leases
The Company has no capital lease obligations as of December 31, 2010 and 2009.
Operating Leases
The Company leases its office buildings and certain office equipment under non-cancellable operating leases. Total rent expense under these operating leases was $310,654 and $28,667 for the years ended December 31, 2010 and 2009, respectively.
Future minimum lease payments under non-cancellable operating leases at December 31, 2010 are as follows:
|
Year Ending
|
Amount
|
|||
|
2011
|
$ | 379,821 | ||
|
2012
|
361,782 | |||
|
2013
|
352,998 | |||
|
2014
|
354,637 | |||
|
2015
|
353,544 | |||
|
Thereafter
|
574,900 | |||
|
Total
|
2,377,681 | |||
In addition to the amounts presented above, the Company remains obligated for rent payments on a former MathStar facility located in Hillsboro, Oregon, near Portland. The lease expires on August 31, 2011. As part of the Merger, Sajan assumed the liability for this lease obligation and as of December 31, 2010, the remaining lease liability, is approximately $213,000. Payments on this liability are approximately $26,000 per month. In 2010, we sub-leased a portion of this space and now receive approximately $5,000 per month in sub lease income.
The Company has employee agreements with three officers which provide for severance payments of up to one year annual salary for those officers if employment is terminated by the Company without cause.
Legal Proceedings
In the ordinary course of business, the Company is subject to legal proceedings and claims. In the opinion of management, the amount of ultimate liability with respect to these actions may or may not materially affect the financial position of the Company nor can an estimate be made. The Company expenses legal costs during the period incurred.
56
Tiberius Litigation
As reported in MathStar’s Annual Report on Form 10-K for the year ended December 31, 2009, on October 8, 2009, legal counsel for Tiberius Capital II, LLC (“Tiberius”), sent by email to MathStar’s legal counsel a copy of a Complaint labeled “Draft — Subject to Completion” (the “Tiberius Complaint”). The Tiberius Complaint named Tiberius, individually and on behalf of all others similarly situated, as plaintiff. It named MathStar, Feltl and Company (“Feltl”), Sajan, Inc., Perkins Capital Management, Inc., Richard C. Perkins, Merrill A. McPeak, Benno G. Sand, John C. Feltl and Joseph P. Sullivan, as defendants (collectively, the “Minnesota Parties”). The Tiberius Complaint stated that Tiberius was bringing a class action lawsuit on behalf of a class consisting of all those who purchased MathStar’s securities between May 11, 2009 and September 30, 2009 alleging violations of the Securities Exchange Act of 1934, as amended.
On October 14, 2009, the Minnesota Parties filed a Complaint in the United States District Court for the District of Minnesota captioned “MathStar, Inc., Feltl and Company, Inc., Sajan, Inc., Perkins Capital Management, Inc., Richard C. Perkins, Merrill A. McPeak, Benno G. Sand, John C. Feltl and Joseph P. Sullivan, Plaintiffs, v. Tiberius Capital II, LLC, Defendant” (the “Minnesota Complaint”) alleging a claim of tortious interference with prospective economic advantage against Tiberius on behalf of MathStar, Sajan, Inc. and Feltl.
On November 9, 2009, Tiberius served and filed its Answer and Counterclaim denying liability under the Minnesota Complaint and asserting substantially the same claims set forth in the Tiberius Complaint and, in addition, asserting common law claims for fraud against the Minnesota Parties except Sajan, Inc. and against all of the Minnesota Parties for wrongful interference with the prospectively advantageous, successful completion of its tender offer for MathStar’s shares of common stock. On December 8, 2009, Tiberius served and filed an Answer and Amended Counterclaim in which it added a jurisdictional allegation and asserted claims for declaratory relief under its other claims. The Minnesota Parties filed timely motions to dismiss the Counterclaim and Amended Counterclaim on several grounds. The motions were fully briefed, and oral arguments took place before the Court on February 9, 2010.
On April 26, 2010, the United States District Court, District of Minnesota granted the Company’s motion to dismiss all counterclaims asserted by Tiberius. Thereafter, the entire action was dismissed and judgment was entered in favor of the Minnesota Parties. Tiberius did not appeal this decision and therefore the lawsuits have been finally terminated without any liability of any of the Minnesota Parties.
Litigation by Sajan, Inc. Stockholder (Natzel)
On February 11, 2010, Mary Jo Natzel, a stockholder of Sajan, Inc., initiated a lawsuit against Shannon Zimmerman and Angel Zimmerman (the “Zimmermans”) and Sajan, Inc. in the Minnesota District Court, Hennepin County, Fourth Judicial District. Ms. Natzel seeks declaratory, injunctive and monetary relief in an amount in excess of $50,000 against Sajan, Inc. and the Zimmermans in connection with the alleged underpayment to Ms. Natzel of distributions made by Sajan, Inc. while it was a corporation taxed under Subchapter S of the Internal Revenue Code and representations by the Zimmermans with respect to the amount of money invested in Sajan, Inc. The Company and the Zimmermans served and filed their Joint and Separate Answer on March 3, 2010.
Following initial pleadings, Sajan and the Zimmermans served and filed a third-party complaint against Howard Natzel asserting claims of breach of contract and indemnification/contribution relating to his execution of the Subscription Agreement to purchase shares of Sajan in 2001. The parties have completed discovery. On March 15, 2011, the court heard oral argument on the parties’ motions for summary judgment, seeking dismissal of several claims. The Court has taken the motions under advisement and is expected to rule not later than May 9, 2011. The case is scheduled for trial, if necessary, in May 2011. Sajan, Inc. and the Zimmermans dispute the merits of the Natzels’ investment-related claims and intend to vigorously defend those claims and pursue relief for attorney fees incurred in defending the investment-related claims under the terms of the Subscription Agreement Howard Natzel executed in connection with the Natzel investment in Sajan, Inc.
57
Mary Jo Natzel did not participate in the Merger in February 2010, and instead chose to dissent from the corporate action pursuant to Minnesota Statutes. On May 13, 2010, Sajan, Inc. tendered a check to Ms. Natzel in the amount of $366,942 in payment of the fair value of the shares tendered. On June 8, 2010, Sajan, Inc. received a letter which asserted that the fair value of Natzel’s shares was $495,372. Sajan, Inc. disputes the value claimed, and on November 1, 2010 filed a petition requesting the court to determine the fair value of the shares. The parties are proceeding with discovery which is scheduled to be completed by June 24, 2011. Sajan, Inc. believes the Merger consideration was fair to all shareholders and will seek to have the Court declare that Natzel’s shares are worth no more than the $366,942 tendered to her.
ITEM 9. CHANGES IN AND DISAGREEMENTS WITH ACCOUNTANTS ON ACCOUNTING AND FINANCIAL DISCLOSURE
None.
ITEM 9A. CONTROLS AND PROCEDURES
DISCLOSURE CONTROLS AND PROCEDURES
This report includes the certifications of our Chief Executive Officer and Chief Financial Officer required by Rule 13a-14 of the Securities Exchange Act of 1934 (the “Exchange Act”). See Exhibits 31.1 and 31.2 to this report. This Item 9A includes information concerning the controls and control evaluations referred to in those certifications.
EVALUATION OF DISCLOSURE CONTROLS AND PROCEDURES
As required by Rule 13a-15(b) under the Exchange Act, our management carried out an evaluation, with the participation of our Chief Executive Officer and Chief Financial Officer, of the effectiveness of the design and operation of our disclosure controls and procedures (as defined in Rules 13a-15(e) of the Exchange Act), as of the period covered by this report. Disclosure controls and procedures are defined as controls and other procedures that are designed to ensure that information required to be disclosed by us in reports filed with the SEC under the Exchange Act is recorded, processed, summarized and reported within the time periods specified in the SEC’s rules and forms. Disclosure controls and procedures include, without limitation, controls and procedures designed to ensure that information required to be disclosed by us in reports filed under the Exchange Act is accumulated and communicated to our management, including our principal executive and principal financial officers, or person performing similar functions, as appropriate to allow timely decisions regarding required disclosure. Based upon their evaluation, our management (including our Chief Executive Officer and Chief Financial Officer) concluded that our disclosure controls and procedures were effective as of December 31, 2010.
MANAGEMENT’S REPORT ON INTERNAL CONTROL OVER FINANCIAL REPORTING
Our management is responsible for establishing and maintaining adequate internal control over financial reporting. Internal control over financial reporting is a set of processes designed by, or under the supervision of, a company’s principal executive and principal financial officers, to provide reasonable assurance regarding the reliability of financial reporting and the preparation of financial statements for external purposes in accordance with GAAP and includes those policies and procedures that:
|
|
·
|
pertain to the maintenance of records that in reasonable detail accurately and fairly reflect our transactions and dispositions of our assets,
|
|
|
·
|
provide reasonable assurance our transactions are recorded as necessary to permit preparation of our financial statements in accordance with GAAP, and that receipts and expenditures are being made only in accordance with authorizations of our management and directors, and
|
|
|
·
|
provide reasonable assurance regarding prevention or timely detection of unauthorized acquisition, use or disposition of our assets that could have a material effect on the financial statement.
|
58
Because of its inherent limitations, internal control over financial reporting may not prevent or detect misstatements. It should be noted that any system of internal control, however well designed and operated, can provide only reasonable, and not absolute, assurance that the objectives of the system will be met. Also, projections of any evaluation of effectiveness to future periods are subject to the risk that controls may become inadequate because of changes in conditions, or that the degree of compliance with the policies or procedures may deteriorate.
Under the supervision and with the participation of management, including its principal executive officer and principal financial officer, Sajan’s management assessed the design and operating effectiveness of internal control over financial reporting as of December 31, 2010 based on the framework set forth in Internal Control—Integrated Framework issued by the Committee of Sponsoring Organizations of the Treadway Commission. Based on this assessment, management believes that, as of December 31, 2010, Sajan’s internal control over financial reporting is effective based on these criteria.
Baker Tilly Virchow Krause, LLP, an independent registered public accounting firm, is not required to issue, and thus has not issued, an attestation report on Sajan’s internal control over financial reporting as of December 31, 2010.
CHANGES IN INTERNAL CONTROL OVER FINANCIAL REPORTING
At December 31, 2009, management identified the following control deficiencies that represented material weaknesses:
|
|
·
|
MathStar failed to maintain an effective control environment and had insufficient oversight of the design and operating effectiveness of the Company’s disclosure controls and internal controls over financial reporting; insufficient oversight to ensure the 302 sub-certifications were completed; infrequent review of its corporate governance documents, policies and procedures; lack of proper segregation of duties; and insufficient oversight to ensure the transition of system administrator rights for the financial application, servers, backup devices and utilities to Sajan, Inc. upon completion of the Merger.
|
|
|
·
|
Both MathStar and Sajan failed to maintain effective controls over the period-end financial reporting process, including controls with respect to journal entries, account reconciliations and proper segregation of duties. Journal entries, both recurring and nonrecurring, were not always accompanied by sufficient supporting documentation and were not adequately reviewed and approved for validity, completeness and accuracy. Account reconciliations over balance sheet accounts were not always properly performed and approved for validity and accuracy of supporting documentation.
|
|
|
·
|
MathStar did not maintain proper segregation of duties. In certain instances, persons responsible to review transactions for validity, completeness and accuracy were also responsible for preparation.
|
|
|
·
|
The Sajan financial reporting team did not possess the requisite skill sets, knowledge, education or experience to prepare the consolidated financial statements and notes to consolidated financial statements in accordance with US GAAP or to review the financial statements and notes to the financial statements prepared by external consultants and professionals to ensure accuracy and completeness.
|
|
|
·
|
The Company failed to maintain effective controls within the purchasing and accounts payable function, including appropriate security access and use of purchase orders and the automatic three-way match option within the financial application.
|
|
|
·
|
MathStar failed to maintain effective general computer controls, including ensuring proper security access within the financial application and to ensure backups were performed in accordance with generally accepted practices. Sajan failed to ensure that Administrator passwords for servers, the financial application and other technological devices used to store and support the financial application software and files were obtained from MathStar and timely changed.
|
59
|
|
·
|
MathStar failed to design sufficient controls to mitigate risks within the financial reporting, expenditures, fixed asset, equity, payroll and treasury functions. In addition, insufficient corporate governance and general computer controls were designed and operating effectively to provide overriding risk mitigation at the entity level.
|
MathStar’s internal controls over financial reporting were essentially performed by three individuals during fiscal 2009. This was due to MathStar’s reduction in workforce when the operations were curtailed in 2008.
MANAGEMENT’S REMEDIATION PLAN
Although the control deficiencies identified in section “Evaluation of Disclosure Controls and Procedures” included MathStar, Inc., operations within that entity were virtually non-existent as of December 31, 2009 and MathStar’s operations did not continue. Therefore, a specific remediation plan to address deficiencies related solely to the former Mathstar operations was not designed or included below. Rather, we have designed and implemented, remediation initiatives described below as they relate to Sajan, Inc. on a post-Merger basis:
During the year ended December 31, 2010, the Company made numerous changes in our internal controls over financial reporting that materially affected our internal control processes and procedures. These changes included hiring a Chief Financial Officer who has initiated a number of changes to processes and procedures which have served to strengthen the Company’s internal accounting and disclosure controls. In addition, during fiscal 2010, the Company implemented the following steps to remediate the material weaknesses noted in the Annual Report on Form 10-K for the year ended December 31, 2009:
|
|
¨
|
increased the oversight performed by our Board of Directors through expansion of our Board of Directors to seven members and expansion of our Audit Committee to four members.
|
|
|
¨
|
increased our Audit Committee’s oversight role, including providing additional oversight of the Company’s internal controls, more formal review of our consolidated financial statements, reviewing management’s analysis of actual expenditures compared to its approved budget, discussing complex or unusual accounting transactions with management and our independent registered public accounting firm, and reviewing the draft periodic reports we file with the SEC;
|
|
|
¨
|
designed and implemented robust corporate governance including: (1) direct oversight of our internal controls by the Audit Committee of our Board of Directors; (2) review of our Annual Report on Form 10-K and Quarterly Reports on Form 10-Q by the Audit Committee of our Board of Directors prior to filing with the SEC; (3) adoption and communication of our Code of Business Conduct and Ethics to our employees and consultants; (4) adoption and communication of our Policy on Insider Trading to our employees and consultants; (5) revision of policies within our employee handbook to ensure that appropriate disciplinary actions may be taken in the event an employee fails to properly perform their responsible internal controls or intentionally overrides any internal control and completion of employee training on the policy revisions; (6) adoption of charters for our Audit, Compensation, Governance and Nominating Committees of our Board of Directors; (7) adoption and training for our employees on our Whistleblower Policy, which includes our anonymous reporting system; (8) adoption of our policy on reporting and investigating complaints regarding accounting, internal accounting controls or auditing matters and concerns regarding questionable accounting or auditing matters; (9) communication to our global workforce by our Chief Executive Officer on the importance of internal control compliance and reporting of noncompliance; and (10) adoption of our operating budget and our strategic plan by our Board of Directors;
|
|
|
¨
|
Improved security surrounding financial applications, the servers and other devices used to support and backup the financial application, and replicate backup files to our corporate location;
|
|
|
¨
|
completed documentation of our key accounting processes and internal controls, completed an internal assessment of the design and operating effectiveness of our internal controls, design remediation efforts as necessary for proper compliance, and tested the internal controls for effectiveness;
|
|
|
¨
|
designed and implemented a formalized financial reporting process that includes properly prepared, supported and reviewed balance sheet reconciliations; properly prepared, supported and reviewed journal entries; properly segregated duties, and properly completed and approved financial close checklist and financial reporting calendar;
|
60
|
|
¨
|
implemented an Enterprise Resource Planning (“ERP”) system to replace our old financial software application, which included ensuring that assigned access rights comply with designated roles and responsibilities and support the proper segregation of duties; and
|
|
|
¨
|
implemented a system generated set of consolidated financial statements directly from the new ERP financial application, thereby eliminating our prior manual consolidation process.
|
These changes enabled the Company to conclude that we have effectively remediated the material weaknesses described in our Annual Report on Form 10-K for the year ended December 31, 2009.
ITEM 9B. OTHER INFORMATION
None.
61
PART III
ITEM 10 DIRECTORS, EXECUTIVE OFFICERS AND CORPORATE GOVERNANCE
MANAGEMENT
DIRECTORS AND EXECUTIVE OFFICERS
The following table sets forth the name and position of each of our directors and executive officers.
|
Name
|
|
Age
|
|
Positions
|
|
Shannon Zimmerman
|
|
38
|
|
President, Chief Executive Officer and Chairman
|
|
Angela (Angel) Zimmerman
|
|
38
|
|
Chief Operating Officer and a Director
|
|
Timothy Clayton
|
|
56
|
|
Chief Financial Officer
|
|
Richard C. Perkins
|
|
57
|
|
Director
|
|
Michael W. Rogers
|
|
55
|
|
Director
|
|
Benno G. Sand
|
|
56
|
|
Director
|
|
Kris Tufto
|
|
52
|
|
Director
|
The biographies of the above-identified individuals are set forth below:
Shannon Zimmerman. Mr. Zimmerman is the Company’s President, Chief Executive Officer and Chairman of the Board of Directors. He co-founded pre-Merger Sajan, Inc. in 1998 along with Angela Zimmerman, and served as its Chairman and Chief Executive Officer from inception. Mr. Zimmerman is the spouse of Angela Zimmerman. Mr. Zimmerman has served in technology focused and strategic business leadership roles in the telecommunications, healthcare, manufacturing, and service industries.
Mr. Zimmerman’s experience as Chief Executive and co-founder of Sajan, Inc. gives him unique insights into the Company’s challenges, opportunities and operations.
Angela (Angel) Zimmerman. Ms. Zimmerman is the Company’s Chief Operating Officer and a director. She co-founded Sajan, Inc. in 1998, and served as its President, Chief Operating Officer, Treasurer and a director from inception. Ms. Zimmerman is the spouse of Shannon Zimmerman.
Ms. Zimmerman’s experience as Chief Operating Officer and co-founder of Sajan, Inc. gives her unique insights into the Company’s challenges, opportunities and operations.
Timothy Clayton. Mr. Clayton was appointed Chief Financial Officer on August 4, 2010. Prior to joining Sajan, Mr. Clayton was the founding principal of Emerging Capital, LLC, a specialized management consulting firm providing advisory services in the areas of strategic planning, mergers and acquisitions, capital formation, corporate governance and CFO-related activities. Prior to establishing Emerging Capital, Mr. Clayton served as Executive Vice President, Chief Financial Officer and Treasurer of Building One Services Corporation, a publicly traded national provider of facility services. Prior to that, Mr. Clayton worked for 21 years at Price Waterhouse, LLP, serving as an audit partner for nine years. In this role, he was responsible for audit, acquisition support and business advisory services for a variety of clients. Mr. Clayton has a B.A. in Accounting from Michigan State University, and is a Certified Public Accountant.
Mr. Clayton’s experience with financial, accounting and public reporting rules and regulations, knowledge of capital markets and merger and acquisition experience provides him with the requisite skills to serve in the capacity of Chief Financial Officer of the Company.
62
Benno G. Sand. Mr. Sand has been a director of the Company since August 2001. He is Executive Vice President, Business Development, Investor Relations and Secretary at FSI International, Inc. (NASDAQ: FSII), a global supplier of wafer-cleaning and resist-processing equipment and technology, and he has served in such positions since January 2000. Mr. Sand also serves on the board of Digitiliti, Inc. (DIGI: OTC), which develops and markets on-line management services. He also serves on the boards of several subsidiaries of FSI International, Inc. and other privately-held companies. Throughout his career, Mr. Sand has served as a director of various public and private companies and several community organizations.
Mr. Sand’s extensive knowledge of the capital markets and accounting issues from his experience as Executive Vice President, Business Development, Investor Relations and Secretary at FSI International, a public reporting company listed on the NASDAQ exchange, as well as his director position with Digitiliti, Inc., brings to the Board of Directors the perspective of a leader facing the same set of current external economic, social and governance issues.
Richard C. Perkins, CFA. Mr. Perkins has been a director of the Company since February 26, 2009. He is a Chartered Financial Analyst, has been Executive Vice President and Portfolio Manager of Perkins Capital Management, Inc. since 1990, and has over 30 years of experience in the investment business. From 1978 until 1990, Mr. Perkins was an Investment Executive with Piper, Jaffray & Hopwood, Incorporated, an investment banking firm. From 1975 through 1977, he was a Grain Merchandiser with General Mills, Inc. Mr. Perkins served as President of the Board of Directors, YMCA Camp Olson in Rochester, Minnesota from 1983 through 1986 and again from 2004 through 2006. He has also served on the boards of several privately-held companies.
Mr. Perkins’ extensive knowledge of the capital markets and accounting issues from his experience as Executive Vice President and Portfolio Manager of Perkins Capital Management and Investment Executive with Piper, Jaffray & Hopwood, Inc. is invaluable to the Board of Directors’ discussions of the Company’s capital and liquidity needs.
Michael W. Rogers. Mr. Rogers became a director of the Company on the date of the Merger. He served as a member of the board of directors of pre-Merger Sajan, Inc. from April 2006 until the date of the Merger. From March 2002 until 2006, he served as a consultant to several early-stage technology companies. In 1985, Mr. Rogers founded Ontrack Data International, Inc., a once publicly-held provider of computer data recovery services and electronic discovery services located in Eden Prairie, Minnesota, which was acquired by Kroll, Inc. in June 2002. He served as Chief Executive Officer of Ontrack Data International, Inc. from 1986 to 2001, and as Chairman from 1989 to 2002.
Mr. Rogers brings to the Board of Directors, entrepreneurial experience and expertise in early-stage technology companies.
Kris Tufto. Mr. Tufto joined the Company’s Board of Directors on the date of the Merger. He served as a member of pre-Merger Sajan, Inc.’s board of directors from February 2006 until the date of the Merger. From April 2005 until February 2006, he served as an executive with or consultant to several early-stage technology companies. Mr. Tufto was President and Chief Executive Officer of Jasc Software, Inc., a provider of digital imaging software based in Eden Prairie, Minnesota, from March 1998 through March 2005. Jasc Software, Inc. was acquired by Corel Corporation in 2004.
Mr. Tufto, brings to the Board of Directors, entrepreneurial experience and expertise in early-stage technology companies.
63
CORPORATE GOVERNANCE
BOARD OF DIRECTORS
Our Board of Directors consists of six members. Our Board of Directors has determined that Richard C. Perkins, Benno G Sand, Michael W. Rogers and Kris Tufto are independent directors under the listing standards of The NASDAQ Stock Market. Presently, we are not required to comply with the director independence requirements of any securities exchange. Under our corporate bylaws, a director elected for an indefinite term serves until the next regular meeting of the stockholders and until the director’s successor is elected and qualified, or until the earlier death, resignation removal or disqualification of the director.
BOARD DIVERSITY
We have not determined whether or not to adopt a policy on diversity related to the composition of our Board of Directors.
BOARD LEADERSHIP STRUCTURE
Mr. Zimmerman serves as the Chairman of the Board. Mr. Zimmerman is also the Company’s Chief Executive Officer and President. The Board of Directors believes this leadership structure is appropriate for Sajan given Mr. Zimmerman’s extensive knowledge of Sajan and the language translation industry, and because this combination has served, and is serving Sajan well by providing unified leadership and direction. The Board is evaluating whether to appoint a lead independent director.
FAMILY RELATIONSHIPS
Shannon Zimmerman, the Company’s Chief Executive Officer and Angel Zimmerman, the Company’s Chief Operating Officer are spouses. Mr. Zimmerman’s sister-in-law, who is also Ms. Zimmerman’s sister, is the Company’s Controller. The Controller’s husband is the Company’s Vice President of North American Client Services and he reports directly to the Chief Operating Officer. The Chief Operating Officer reports directly to the Chief Executive Officer.
BOARD COMMITTEES
Our Board of Directors has a standing audit committee, a standing compensation committee and a standing governance and nominating committee.
Audit Committee. The audit committee is responsible, among its other duties and responsibilities, for overseeing our accounting and financial reporting processes, the audits of our consolidated financial statements, the qualifications of our independent registered public accounting firm, and the performance of our internal audit function and independent registered public accounting firm. The audit committee reviews and assesses the qualitative aspects of our financial reporting, our processes to manage business and financial risk, and our compliance with significant applicable legal, ethical, and regulatory requirements. The audit committee is directly responsible for the appointment, compensation, retention, and oversight of our independent registered public accounting firm. The audit committee also oversees our policies regarding related party transactions. The members of our audit committee are Benno G. Sand, who serves as chair of the committee, Richard C. Perkins, Michael W. Rogers and Kris Tufto. Our Board of Directors has determined that Mr. Benno Sand is an “audit committee financial expert,” as that term is defined under the Securities and Exchange Commission rules implementing Section 407 of the Sarbanes-Oxley Act of 2002. Our Board of Directors has determined that each member of our audit committee is independent under the listing standards of The NASDAQ Stock Market and each member of our audit committee is independent pursuant to Rule 10A-3 of the Exchange Act. The Board of Directors has determined that each of the audit committee members is able to read and understand fundamental financial statements and that at least one member of the audit committee has past employment experience in finance or accounting.
64
Compensation Committee. The compensation committee is responsible, among its other duties and responsibilities, for establishing the compensation and benefits of our chief executive officer and other executive officers, monitoring compensation arrangements applicable to our chief executive officer and other executive officers in light of their performance, effectiveness, and other relevant considerations, and administering our equity incentive plans. The members of our compensation committee are Kris Tufto, who serves as chair of the committee, Michael Rogers and Benno Sand. Our Board of Directors has determined that the composition of our compensation committee meets the independence requirements of The NASDAQ Stock Market required for approval of the compensation of our chief executive officer and other executive officers.
Governance and Nominating Committee. The governance and nominating committee is responsible for recommending candidates for election to the board of directors. The committee is also responsible, among its other duties and responsibilities, for making recommendations to the board of directors or otherwise acting with respect to corporate governance policies and practices, including board size and membership qualifications, new director orientation, committee structure and membership, succession planning of our chief executive officer and other key executive officers, and communications with stockholders. The members of our nominating and corporate governance committee are Michael Rogers, who serves as the chair of the committee, Benno Sand and Kris Tufto. Our Board of Directors has determined that the composition of our nominating and corporate governance committee meets the independence requirements of The NASDAQ Stock Market required for director nominations.
INVOLVEMENT IN CERTAIN LEGAL PROCEEDINGS
During the past ten years, no officer, director, control person or promoter of the Company has been involved in any legal proceedings respecting: (i) any bankruptcy petition filed by or against any business of which such person was a general partner or executive officer either at the time of the bankruptcy or within two years prior to that time; (ii) any conviction in a criminal proceeding or being subject to a pending criminal proceeding (excluding traffic violations and other minor offenses); (iii) being subject to any order, judgment, or decree, not subsequently reversed, suspended or vacated, of any court of competent jurisdiction, permanently or temporarily enjoining, barring, suspending or otherwise limiting his involvement in any type of business, securities or banking activities; or (iv) being found by a court of competent jurisdiction (in a civil action), the commission or the Commodity Futures Trading Commission to have violated a federal or state securities or commodities law, and the judgment has not been reversed, suspended, or vacated.
CODE OF ETHICS
We adopted a Code of Ethics on March 30, 2010 which governs the conduct of our officers, directors and employees in order to promote honesty, integrity, loyalty and the accuracy of our financial statements. You may obtain a copy of the Code of Ethics without charge by writing us and requesting a copy, attention: Shannon Zimmerman, 625 Whitetail Drive, River Falls, Wisconsin 54022 or by calling us at (715) 426-9505. Our Code of Ethics is also available on our website at www.sajan.com. Any amendment to, or waiver from, the provisions of the Code of Ethics for the CEO and Senior Financial Officers that applies to any of those officers will be posted to the same location on our website.
SECTION 16(A) BENEFICIAL OWNERSHIP REPORTING COMPLIANCE
Section 16(a) of the Securities Exchange Act of 1934 requires the Company’s officers, directors and persons considered to be beneficial owners of more than ten percent of a registered class of the Company’s equity securities to file reports of ownership and changes in ownership with the Securities and Exchange Commission and NASDAQ. Officers, directors and greater-than-ten-percent stockholders are required by SEC regulations to furnish the Company with copies of all Section 16(a) forms they file. Based solely on a review of the copies of such forms furnished to the Company, or written representations that no applicable filings were required, the Company believes that all such filings were filed on a timely basis for the fiscal year 2010.
65
ITEM 11. EXECUTIVE COMPENSATION
SUMMARY COMPENSATION TABLE
The following table summarizes the compensation for fiscal 2010 and 2009 of Sajan, Inc.’s chief executive officer and the next three most highly compensated executive officers serving as executive officers as of December 31, 2010. These four individuals comprise our named executive officers or “NEOs.”
|
Name and Principal Position
|
Year
|
Salary
|
Stock Option
Awards (1)
|
Other Annual
Compensation
|
Total
|
|||||||||||||
|
Shannon Zimmerman
|
2010
|
|
$
|
185,000
|
|
|
$
|
-
|
|
|
$
|
50,208
|
(2)
|
|
235,208
|
|
||
|
President, Chief Executive Officer, Interim Chief Financial Officer through August 2010
|
2009
|
|
$
|
140,000
|
|
|
$
|
-
|
|
|
$
|
111,430
|
(3)
|
|
$
|
251,430
|
|
|
|
Vern Hanzlik (4)
|
2010
|
|
$
|
151,462
|
|
|
$
|
|
|
$
|
3,536
|
(5)
|
|
$
|
154,998
|
|
||
|
Chief Marketing Officer, President of Sajan, Software Ltd.
|
2009
|
|
$
|
150,000
|
|
|
$
|
204,000
|
|
|
$
|
4,070
|
(6)
|
|
$
|
358,070
|
|
|
|
Angela Zimmerman
|
2010
|
|
$
|
153,000
|
|
|
$
|
-
|
|
|
$
|
5,822
|
(7)
|
|
$
|
158,822
|
|
|
|
Chief Operating Officer
|
2009
|
|
$
|
110,000
|
|
|
$
|
-
|
|
|
$
|
2,089
|
(8)
|
|
$
|
117,401
|
|
|
|
Timothy Clayton (9)
|
2010
|
|
$
|
71,337
|
|
|
$
|
173,800
|
|
|
$
|
2,036
|
(10)
|
|
$
|
247,173
|
|
|
|
Chief Financial Officer since August 2010
|
|
|
|
|
|
|
|
|||||||||||
|
(1)
|
A discussion of the assumptions used in calculating the stock option award amounts may be found in the “Stock-Based Compensation” note to the audited financial statements included in this 2010 Annual Report on Form 10-K.
|
|
(2)
|
Figure includes commissions of $37,880, $8,470 in employer paid retirement contributions, and $3,858 for family health insurance premiums, which includes coverage for Ms. Zimmerman.
|
|
(3)
|
Figure includes $95,640 in commission payments, $4,165 in employer-paid retirement contributions, and $11,625 for family health and life insurance premiums, which includes coverage for Ms. Zimmerman.
|
|
(4)
|
Mr. Hanzlik’s employment with the Company ended on December 31, 2010.
|
|
(5)
|
Figure includes $3,536 for family health and life insurance premiums.
|
|
(6)
|
Figure includes $4,070 in health and life insurance premiums.
|
|
(7)
|
Figure relates to employer paid retirement contributions of $5,750 and disability insurance premiums of $72. Ms. Zimmerman’s health insurance premiums are included in Mr. Zimmerman’s compensation because he carries the family coverage.
|
|
(8)
|
Figure relates to $2,017 in employer-paid retirement contributions and $72 of disability insurance premiums.
|
|
(9)
|
Mr. Clayton became the Company’s Chief Financial Officer effective August 1, 2010.
|
|
Figure includes $1,750 in employer-paid retirement contributions, $286 in health insurance premiums.
|
66
OUTSTANDING EQUITY AWARDS AT FISCAL YEAR END - 2010
The following table sets forth information about unexercised options that were held at December 31, 2010 by the named executive officers of Sajan, Inc.:
|
Option Awards
|
||||||||||||||
|
Name
|
Number of
Securities
Underlying
Unexercised
Options (#)
Exercisable
|
Number of
Securities
Underlying
Unexercised
Options (#)
Unexercisable
|
Option
Exercise
Price ($)
|
Option
Expiration
Date
|
||||||||||
|
Vern Hanzlik
|
6,891 | - | $ | 0.61 |
4/1/2011
|
|||||||||
| 61,250 | - | $ | 0.61 |
1/2/2017
|
||||||||||
| 275,625 | - | $ | 0.61 |
1/2/2017
|
||||||||||
|
Timothy Clayton
|
0 | 250,000 | (1) | $ | 1.45 |
8/4/2020
|
||||||||
(1) These options vest in equal installments on June 1, 2011, 2012, 2013 and 2014 and expire 10 years from the date of grant.
EMPLOYMENT AND CHANGE-IN-CONTROL AGREEMENTS
On May 19, 2006 pre-Merger Sajan entered into employment agreements with each of Shannon Zimmerman and Angel Zimmerman, which were amended effective as of February 1, 2010. Under the employment agreements, Mr. Zimmerman receives an annual base salary of $185,000 and Ms. Zimmerman receives an annual base salary of $150,000. The employment agreements require Sajan, to pay severance in an amount equal to the then-current annual salary upon termination of employment by Sajan other than for cause or upon termination of employment by the employee for Sajan’s breach. The employment agreements contain confidentiality, invention assignment, non-solicitation and non-competition provisions.
On January 1, 2007, as amended on June 2, 2009 and February 1, 2010, pre-Merger Sajan entered into an employment agreement with Vern Hanzlik. Under the employment agreement, Mr. Hanzlik received an annual base salary of $175,000. The employment agreement requires Sajan to pay severance in an amount equal to one month of Mr. Hanzlik’s then-current annual salary upon termination of employment by Sajan other than for cause or upon termination of employment by the employee for Sajan’s breach. Pursuant to the terms of the employment agreement, Sajan granted to Mr. Hanzlik an option to purchase 336,875 shares of common stock of Sajan, all of which have vested. The employment agreement contains confidentiality, invention assignment, non-solicitation and non-competition provisions. The employment agreement was amended on June 2, 2009 following Mr. Hanzlik’s appointment as the President of Sajan Software. As provided in the amendment, pre-Merger Sajan, Inc. granted Mr. Hanzlik an additional option to purchase 245,000 shares of Sajan, Inc. common stock, which vested upon achievement of certain financial targets set forth in the agreement or established by the board of directors for each of 2010, 2011 and 2012. None of these shares have vested. Mr. Hanzlik’s employment with the Company ended on December 31, 2010 and no severance was paid.
Timothy Clayton receives an annual base salary of $175,000. Pursuant to an employment offer letter dated August 4, 2010, Sajan granted to Mr. Clayton an option to purchase 250,000 shares of common stock of Sajan The stock options will be exercisable at the fair market value of Sajan’s common stock on the date of grant, will vest in equal installments on June 1, 2011, 2012, 2013, and 2014 and expire 10 years from the date of the grant. The employment agreement requires that in the event Sajan terminates Mr. Clayton’s employment for any reason not constituting Cause, Sajan will pay his base salary through the date of termination and will provide the following benefits: (i) severance pay equal to six months of his ending base salary and (ii) immediate vesting of all stock options that are due to be vested within six months from the date of termination. Mr. Clayton is subject to traditional non-competition and employee non-solicitation restrictions during the term of his employment with Sajan and for one year following his termination of employment with Sajan for any reason.
67
COMPENSATION OF DIRECTORS
The table below delineates director compensation for the year ended December 31, 2010. Compensation received by executive management directors is included in the respective executive compensation tables above.
|
Name
|
Fees Earned
or
Paid in Cash
|
Option
Awards (1)(2)
|
Total
Compensation
|
|||||||||
|
Benno G. Sand
|
|
$
|
27,750
|
|
|
$
|
3,750
|
|
|
$
|
31,500
|
|
|
|
|
|
|
|
|
|
|
|
|
|
|
|
|
Michael Rogers
|
|
$
|
9,500
|
|
|
$
|
13,023
|
|
|
$
|
22,523
|
|
|
|
|
|
|
|
|
|
|
|
|
|
|
|
|
Richard C. Perkins
|
|
$
|
23,750
|
|
|
$
|
3,750
|
|
|
$
|
27,500
|
|
|
|
|
|
|
|
|
|
|
|
|
|
|
|
|
Kris Tufto
|
|
$
|
9,500
|
|
|
$
|
13,023
|
|
|
$
|
22,523
|
|
|
|
|
|
|
|
|
|
|
|
|
|
|
|
|
Merrill McPeak (3)
|
$
|
15,000
|
|
|
$
|
0
|
|
|
$
|
15,000
|
||
|
(1)
|
The amounts shown for option awards reflect the aggregate full grant date value as determined under ASC Topic 718 – Compensation – Stock Compensation. Refer to “Note 5 – Stock -Based Compensation” in the audited financial statements included in Item 8 of this Annual Report on Form 10-K for a discussion of the assumptions used in calculating the award amount. On February 23, 2010, Mr. Rogers and Mr. Tufto were automatically granted a 10-year option under the 2004 Incentive Plan to purchase 5,000 shares of common stock at an exercise price of $1.65 per share with a grant date fair value of $4,450. These options are fully exercisable. At the time of the Merger, these individuals received an additional 1,266 options to reflect the exchange ratio of the Merger. These options had an exercise price of $0.61 per share with a grant date fair value of $4,823. These options are fully exercisable. On June 11, 2011, all non-employee directors were automatically granted a 10-year option under the 2004 Incentive Plan to purchase 5,000 shares of common stock at an exercise price of $1.40 per share with a grant date fair value of $3,750. These options as to all of the shares on June 11, 2011, but only if the director is then a director of the Company.
|
|
(2)
|
As of December 31, 2010, Mr. Sand had outstanding options to purchase 20,667 shares, which were vested as to 19,303 shares and not vested as to 1,364 shares; Mr. Rogers had outstanding options to purchase 16,891 shares, which were vested as to 15,527 shares and not vested as to 1,364 shares; Mr. Perkins had outstanding options to purchase 11,000 shares, which were vested as to 7,969 and not vested as to 3,031shares; and Mr. Tufto had outstanding options to purchase 16,891 shares, which were vested as to 15,527 shares and not vested as to 1,364 shares .
|
|
(3)
|
Mr. McPeak resigned from the board of directors on the date of the Merger.
|
Board of Director Compensation Structure
Sajan’s non-employee directors received a cash retainer of $2,000 per quarter. The chairperson of the Audit Committee, Compensation Committee and Governance Committee also receive an additional $1,500 annually.
Under the 2004 Incentive Plan, non-employee directors automatically receive an option to purchase 5,000 shares of the Company’s common stock when they are initially elected or appointed to our board of directors, which vests as to one-third of the shares subject to the option on the first, second and third anniversary dates of the date of grant so long as they are directors of the Company. Non-employee directors also automatically receive an option to purchase 5,000 shares at each Annual Meeting of Shareholders which vests as to all of the shares subject to the option on the first anniversary date of the date of grant of the option if they are then directors of the Company. The exercise price of these options is equal to the closing price of the Company’s common stock on the grant date of the option, and all options expire 10 years after the date of grant. Under the automatic grant provisions of the 2004 Incentive Plan, on February 23, 2010, Mr. Rogers and Mr. Tufto received a 10-year option to purchase 5,000 shares at an exercise price of $1.65 per share, and on June 11, 2010, Mr. Sand, Mr. Rogers, Mr. Perkins and Mr. Tufto each received a 10-year option to purchase 5,000 shares at an exercise price of $1.40 per share.
68
Consideration of Compensation-Related Risks
In connection with its oversight of compensation-related risks, the compensation committee annually evaluates whether Sajan’s compensation policies and practices create risks that are reasonably likely to have a material adverse effect on Sajan. For fiscal 2010, the compensation committee evaluated the current risk profile of Sajan’s compensation policies and programs for all of its employees, with particular emphasis on annual and long-term incentive compensation. In its evaluation, the compensation committee reviewed the executive compensation structure, identified important business risks that could materially affect Sajan, and assessed how Sajan managed or mitigated these risks in the design of its compensation structure. The compensation committee also considered the ability of Sajan’s officers and other employees to affect changes in their incentive compensation that could create risk for Sajan. Based on this evaluation, Sajan determined that its compensation programs do not encourage risk-taking that is reasonably likely to have a material adverse effect on Sajan.
|
ITEM 12.
|
SECURITY OWNERSHIP OF CERTAIN BENEFICIAL OWNERS AND MANAGEMENT AND RELATED STOCKHOLDER MATTERS
|
The following table contains certain information regarding the beneficial ownership of Sajan’s common stock as of March 15, 2011 (except as otherwise indicated) by (i) each person who is known by Sajan to own beneficially more than 5% of the outstanding shares of our common stock; (ii) each director of Sajan; (iii) each executive officer of Sajan; and (iv) all executive officers and directors as a group. This information is based on information received from or on behalf o the named individuals. Unless otherwise noted, each person or group identified possesses sole voting and investment power with respect to such shares.
|
Name and Address (1)
|
Common Shares
Beneficially Owned (2)
|
Percentage of
Common Shares (2)
|
||||||
|
Officers and Directors
|
|
|
|
|
|
|
||
|
|
|
|
|
|
|
|
||
|
Shannon Zimmerman
|
|
|
2,643,437
|
|
|
|
16.5
|
%
|
|
|
|
|
|
|
|
|
|
|
|
Angel Zimmerman
|
|
|
2,618,437
|
|
|
|
16.4
|
%
|
|
|
|
|
|
|
|
|
|
|
|
Vern Hanzlik
|
|
|
383,141
|
(3)
|
|
|
2.4
|
%
|
|
|
|
|
|
|
|
|
|
|
|
Timothy Clayton
|
|
|
0
|
|
|
*
|
|
|
|
|
|
|
|
|
|
|
|
|
|
Kris Tufto
|
|
|
20,027
|
(4)
|
|
|
*
|
|
|
|
|
|
|
|
|
|
|
|
|
Michael W. Rogers
|
|
|
35,839
|
(5)
|
|
|
*
|
|
|
|
|
|
|
|
|
|
|
|
|
Benno G. Sand
c/o FSI International, Inc.
3455 Lyman Boulevard
Chaska, MN 55318
|
|
|
21,970
|
(6)
|
|
|
*
|
|
|
|
|
|
|
|
|
|
|
|
|
Richard C. Perkins
c/o Perkins Capital Management, Inc.
730 East Lake Street
Wayzata, MN 55391
|
|
|
7,969
|
(7)
|
|
|
*
|
|
|
|
|
|
|
|
|
|
|
|
|
All directors and executive officers as a group (8 individuals) (8)
|
|
|
5,730,820
|
(9)
|
|
|
35.8
|
%
|
69
* less than 1%
|
Unless otherwise indicated the business address of each individual is c/o Sajan, 625 Whitetail Blvd., River Falls, Wisconsin 54022.
|
|
Based on 16,009,331 shares of common stock outstanding. Such number does not include shares of Sajan common stock issuable upon exercise of outstanding stock options and warrants. Each figure showing the percentage of outstanding shares owned beneficially has been calculated by treating as outstanding and owned the shares which could be purchased by the indicated person(s) on March 15, 2011 or within 60 days of March 15, 2011 upon the exercise of stock options and warrants.
|
|
Includes options to purchase 343,766 shares of common stock that are currently exercisable or will become exercisable within 60 days of March 15, 2011.
|
|
Includes options to purchase 15,527 shares of common stock that are currently exercisable or will become exercisable within 60 days of March 15, 2011.
|
|
Includes options to purchase 15,527 shares of common stock that are currently exercisable or will become exercisable within 60 days of March 15, 2011.
|
|
Includes options to purchase 19,303 shares of common stock that are currently exercisable or will become exercisable within 60 days of March 15, 2011.
|
|
Consists of an option to purchase 7,969 shares of common stock that will become exercisable within 60 days of March 15, 2011. Does not includes 96,420 shares or warrants to purchase 4,667 shares of common stock held in client accounts for which Perkins Capital Management, Inc. (“PCM”) is the investment advisor. Mr. Perkins is the holder of 20% of the outstanding equity interests and Executive Vice President/Portfolio Manager of PCM and disclaims beneficial ownership over these 96,420 shares and warrants to purchase 4,667 shares.
|
|
Consists of Ms. Zimmerman and Messrs. Zimmerman, Hanzlik, Clayton, Rogers, Tufto, Sand and Perkins.
|
|
Consists of 5,328,728 outstanding shares of common stock and options to purchase a total of 402,092 shares of common stock. See Footnotes 3, 4, 5, 6, and 7 above.
|
70
Securities Authorized for Issuance Under Equity Compensation Plans
The following table sets forth the aggregate information regarding grants under all equity compensation plans as of December 31, 2010:
|
Plan category
|
Number of securities to
be issued upon exercise
of outstanding options,
warrants and rights
|
Weighted-average
exercise price of
outstanding options,
warrants and rights
|
Number of securities
remaining available for
future issuance under
equity compensation
plans (excluding
securities reflected in
column (a))
|
|||||||||
|
|
|
(a)
|
|
|
(b)
|
|
|
(c)
|
|
|||
|
Equity compensation plans approved by security holders
|
|
|
1,393,841
|
|
|
$
|
9.15
|
|
|
|
1,363,354
|
|
|
Equity compensation plans not approved by security holders
|
|
|
—
|
|
|
|
—
|
|
|
|
—
|
|
|
Total
|
|
|
|
|
|
|
|
|
|
|
|
|
|
ITEM 13.
|
CERTAIN RELATIONSHIPS AND RELATED TRANSACTIONS AND DIRECTOR INDEPENDENCE
|
CERTAIN RELATIONSHIPS AND TRANSACTIONS
Sajan, LLC and River Valley Business Center, LLC (“RVBC”) are parties to two office lease agreements. RVBC owns a two-story commercial office building located near River Falls, Wisconsin. RVBC is owned and operated by Shannon Zimmerman and Angel Zimmerman, both of whom are executive officers, directors and significant stockholders of the Company. Under the terms of a lease agreement dated February 1, 2010, Sajan, LLC leases 12,000 square feet of space which comprises the entire second floor of the building, and pays monthly rent of approximately $19,000. Under the terms of a lease agreement dated February 1, 2010, Sajan, LLC leases an additional 4,100 square feet of space which comprises a portion of the first floor of the building and pays monthly rent of approximately $6,500. Both of these leases will expire on January 31, 2017. Sajan, LLC may not assign either of the lease agreements without the prior written consent of RVBC. In the lease agreements, Sajan, LLC granted RVBC a security interest in all goods, chattels, fixtures and personal property of Sajan, LLC located in the premises to secure rents and other amounts that may be due under the lease agreements. Management of Sajan, LLC believes, based on an informal assessment conducted by a commercial real estate agent familiar with commercial properties in the River Falls, Wisconsin area, that the rent paid for the leased premises is competitive with rents paid for similar commercial office space in the River Falls, Wisconsin market. The foregoing lease agreements were authorized by the disinterested members of the Sajan, Inc. board of directors before the date of the Merger.
DIRECTOR INDEPENDENCE
Presently, we are not required to comply with the director independence requirements of any securities exchange. In determining whether our directors are independent, however, we have elected to be guided by the rules of the NASDAQ Stock Market LLC. Under the NASDAQ rules, each of Mr. Rogers, Mr. Tufto, Mr. Sand and Mr. Perkins qualifies as an independent director. Accordingly, our board of directors is composed of a majority of independent directors.
71
All ongoing and future transactions between us and any of our officers and directors or their respective affiliates, including loans by our officers and directors, will be on terms believed by us to be no less favorable than are available from unaffiliated third parties and such transactions or loans, including any forgiveness of loans, will require prior approval in each instance by a majority of our uninterested “independent” directors or the members of our board who do not have an interest in the transaction, in either case who had access, at our expense, to our attorneys or independent legal counsel.
ITEM 14. PRINCIPAL ACCOUNTANT FEES AND SERVICES
Audit and Non-Audit Services and Fees
The following table summarizes the fees we were billed for audit and non-audit services rendered for fiscal years 2010 and 2009. Baker Tilly Virchow Krause audited the Company’s consolidated financial statements for fiscal years 2010 and 2009.
|
|
2010
|
2009
|
||||||
|
Audit Fees
|
$ | 88,241 | $ | 108,555 | ||||
|
Audit-Related Fees
|
- | - | ||||||
|
Tax Fees
|
- | - | ||||||
|
All Other Fees
|
5,857 | 37,779 | ||||||
|
Total
|
$ | 94,098 | $ | 146,334 | ||||
Audit Fees. The fees identified under this caption were for professional services rendered for years ended 2010 and 2009 in connection with the audit of our annual financial statements and review of the financial statements included in our quarterly reports on Form 10-Q. The amounts also include fees for services that are normally provided by the independent public registered accounting firm in connection with statutory and regulatory filings and engagements for the years identified.
Audit-Related Fees. The fees identified under this caption were for assurance and related services that were related to the performance of the audit or review of our financial statements and were not reported under the caption “Audit Fees.” This category may include fees related to the performance of audits and attestation services not required by statute or regulations, and accounting consultations about the application of generally accepted accounting principles to proposed transactions.
Tax Fees. The fees identified under this caption were for tax compliance, tax planning, tax advice and corporate tax services. Corporate tax services encompass a variety of permissible services, including technical tax advice related to tax matters; assistance with withholding-tax matters; assistance with state and local taxes; preparation of reports to comply with local tax authority transfer pricing documentation requirements; and assistance with tax audits.
All Other Fees. The fees identified under this caption were for services related to potential acquisitions, due diligence and review of merger-related documents and filings.
Approval Policy. Our Audit Committee approves in advance all services provided by our independent registered public accounting firm. All engagements of our independent registered public accounting firm in years ended 2010 and 2009 were pre-approved by the Audit Committee.
72
PART IV
ITEM 15. EXHIBITS AND FINANCIAL STATEMENT SCHEDULES
FINANCIAL STATEMENTS
|
Item
|
|
Page
|
|
Report of Independent Registered Public Accounting Firm
|
|
33
|
|
Balance Sheets – December 31, 2010 and December 31, 2009
|
|
34
|
|
Statements of Operations – Years ended December 31, 2010 and December 31, 2009
|
|
35
|
|
Statements of Stockholders’ Equity – Years ended December 31, 2010 and December 31, 2009
|
|
36
|
|
Statements of Cash Flows – Years ended December 31, 2010 and December 31, 2009
|
|
37
|
|
Notes to Financial Statements
|
|
38
|
EXHIBITS
|
Exhibit No.
|
Description
|
|
|
|
|
|
|
2.1
|
|
Agreement and Plan of Merger, dated January 8, 2010, among MathStar, Inc., Sajan, Inc., Garuda Acquisition, LLC, and Thomas Magne (incorporated by reference to Exhibit 2.1 to the Current Report on Form 8-K filed with the Securities and Exchange Commission (“ SEC ”) on January 11, 2010).
|
|
|
|
|
|
3.1
|
|
Certificate of Incorporation of the Company (incorporated by reference to Exhibit 3.1 to the Registration Statement on Form S-1 filed by MathStar, Inc. with the SEC on August 3, 2005, Registration No. 333-127164 {“Registration Statement”}).
|
|
|
|
|
|
3.2
|
|
Certificate of Amendment of the Certificate of Incorporation of the Company filed with the Delaware Secretary of State on May 23, 2008 (incorporated by reference to Exhibit 3.1 to the Current Report on Form 8-K filed with the SEC on May 23, 2008).
|
|
|
|
|
|
3.3
|
|
Certificate of Designation of Series A Preferred Stock filed with the Secretary of State of the State of Delaware on February 25, 2010 (incorporated by reference to Exhibit 3.1 of the Company’s Current Report on Form 8-K dated February 25, 2010 filed with the SEC).
|
|
|
|
|
|
3.4
|
|
Certificate of Ownership and Merger merging Sajan, Inc. into MathStar, Inc. filed with the Securities and Exchange Commission on March 3, 2010 (incorporated by reference to Exhibit 3.1 to the Current Report on Form 8-K filed with the SEC on March 3, 2010).
|
|
|
|
|
|
3.5
|
|
Bylaws of the Company (incorporated by reference to Exhibit 3.2 to the Registration Statement).
|
|
|
|
|
|
4.1
|
|
Form of common stock certificate of the Company (incorporated by reference to Exhibit 4.1 to the Registration Statement).
|
|
|
|
|
|
4.2
|
|
Tax Benefit Preservation Plan and Rights Agreement, dated as of February 25, 2010, between the Company and Wells Fargo Shareowner Services, a division of Wells Fargo Bank, National Association, as Rights Agent, together with the following exhibits thereto: Exhibit A - Form of Certificate of Designation of Series A Preferred Stock of the Company; Exhibit B — Form of Right Certificate; Exhibit C — Summary of Rights to Purchase Shares of Preferred Stock of the Company (incorporated by reference to Exhibit 4.1 of the Company’s Current Report on Form 8-K dated February 25, 2010 filed with the Securities and Exchange Commission).
|
|
|
|
|
|
10.1
|
|
The Company’s 2004 Amended and Restated Long-Term Incentive Plan (incorporated by reference to Exhibit 10.1 to the Current Report on Form 8-K filed with the SEC on May 17, 2007).
|
73
|
10.2
|
|
Form of Incentive Stock Option Agreement (incorporated by reference to Exhibit 10.2 to the Current Report on Form 8-K filed with the SEC on February 24, 2010).
|
|
|
|
|
|
10.3
|
|
Form of Non-Statutory Stock Option Agreement for non-employee directors (incorporated by reference to Exhibit 10.5 to the Current Report on Form 8-K filed with the SEC on February 24, 2010).
|
|
|
|
|
|
10.4
|
|
Form of Common Stock Purchase Warrant (incorporated by reference to Exhibit 10.6 to the Current Report on Form 8-K filed with the SEC on February 24, 2010).
|
|
|
|
|
|
10.5
|
|
Employment Agreement, dated May 19, 2006, and as amended on February 1, 2010, between Sajan, Inc. and Angela Zimmerman (incorporated by reference to Exhibit 10.8 to the Current Report on Form 8-K filed with the SEC on February 24, 2010).
|
|
|
|
|
|
10.6
|
|
Employment Agreement, dated May 19, 2006, and as amended on February 1, 2010, between Sajan, Inc. and Shannon Zimmerman (incorporated by reference to Exhibit 10.8 to the Current Report on Form 8-K filed with the SEC on February 24, 2010).
|
|
|
|
|
|
10.7
|
|
Employment Agreement, dated August 4, 2010, between Sajan, Inc. and Timothy Clayton (incorporated by reference to Exhibit 10.1 to the Current Report on Form 8-K filed with the SEC on August 6, 2010).
|
|
|
|
|
|
10.8
|
|
Office Lease Agreement dated June 1, 2005, as amended on September 23, 2005, and as further amended on July 24, 2007 by and between Mark Tanasbourne, LLC and the Company (incorporated by reference to Exhibit 10.12 to the Registration Statement).
|
|
|
|
|
|
10.9
|
|
Standard Office Lease Agreement (No. 1) between Sajan, Inc. and River Valley Business Center, LLC, dated February 1, 2010 (incorporated by reference to Exhibit 10.12 to the Current Report on Form 8-K filed with the SEC on February 24, 2010).
|
|
|
|
|
|
10.10
|
|
Standard Office Lease Agreement (No. 2) between Sajan, Inc. and River Valley Business Center, LLC, dated February 1, 2010 (incorporated by reference to Exhibit 10.13 to the Current Report on Form 8-K filed with the SEC on February 24, 2010).
|
|
|
|
|
|
10.11
|
|
Promissory Note, dated February 23, 2010, in the original principal amount of $1,000,000 issued by the Company to Shannon and Angel Zimmerman (incorporated by reference to Exhibit 10.14 to the Current Report on Form 8-K filed with the SEC on February 24, 2010).
|
|
10.12
|
Amendment to Promissory Note dated February 22, 2011 (incorporated by reference to Exhibit 10.1 to the Current Report on Form 8-K filed with the SEC on February 24, 2011).
|
|
|
|
|
|
|
10.13
|
|
Escrow Agreement, dated February 23, 2010, among the Company, Sajan, LLC and Thomas Magne, as representative for the shareholders of Sajan, Inc. (incorporated by reference to Exhibit 10.15 to the Current Report on Form 8-K filed with the SEC on February 24, 2010).
|
|
|
|
|
|
14.1
|
|
Code of Ethics adopted March 30, 2010.
|
|
21.1
|
|
Subsidiaries of Sajan, Inc.
|
|
|
|
|
|
23.1
|
|
Consent from Baker Tilly Virchow Krause, LLP
|
|
|
|
|
|
31.1
|
|
Certification of principal executive officer pursuant to Rule 13a-14(a)/15d-14(a)
|
74
|
31.2
|
|
Certification of principal financial officer pursuant to Rule 13a-14(a)/15d-14(a)
|
|
|
|
|
|
32
|
|
Certification of principal executive officer and principal financial officer pursuant to 18 U.S.C. 1350, as adopted pursuant to Section 906 of the Sarbanes-Oxley Act of 2002
|
75
SIGNATURES
Pursuant to the requirements of Section 13 or 15(d) of the Securities Exchange Act of 1934, the registrant has duly caused this report to be signed on its behalf by the undersigned, thereunto duly authorized.
|
|
SAJAN, INC.
|
|
|
|
|
|
|
|
|
|
/s/ Shannon Zimmerman
|
3/30/11
|
|
|
|
Shannon Zimmerman
|
|
|
|
|
Chief Executive Officer, President
|
|
|
|
/s/ Timothy Clayton
|
3/30/11
|
||
|
Timothy Clayton
|
|||
|
|
Chief Financial Officer
|
|
|
Pursuant to the requirements of the Securities Exchange Act of 1934, this report has been signed below by the following persons on behalf of the registrant and in the capacities and on the dates indicated.
|
|
/s/ Shannon Zimmerman
|
3/30/11
|
|
|
Shannon Zimmerman, Director,
Chairman, Chief Executive Officer and
President (Principal Executive Officer)
|
|
|
|
/s/ Angela Zimmerman
|
3/30/11
|
|
|
Angela (Angel) Zimmerman, Director
|
|
|
|
||
|
|
/s/ Timothy Clayton
|
3/30/11
|
|
|
Timothy Clayton, Chief Financial
Officer (Principal Financial Officer and
Principal Accounting Officer)
|
|
|
|
||
|
|
/s/ Michael W. Rogers
|
3/30/11
|
|
|
Michael W. Rogers, Director
|
|
|
|
||
|
|
/s/ Kris Tufto
|
3/30/11
|
|
|
Kris Tufto, Director
|
|
|
|
||
|
|
/s/ Richard C Perkins
|
3/30/11
|
|
|
Richard C. Perkins, Director
|
|
|
|
||
|
|
/s/ Benno G. Sand
|
3/30/11
|
|
|
Benno G. Sand, Director
|
76