Attached files
| file | filename |
|---|---|
| EXCEL - IDEA: XBRL DOCUMENT - SAJAN INC | Financial_Report.xls |
| EX-31.1 - EXHIBIT 31.1 - SAJAN INC | v306924_ex31-1.htm |
| EX-23.1 - EXHIBIT 23.1 - SAJAN INC | v306924_ex23-1.htm |
| EX-21.1 - EXHIBIT 21.1 - SAJAN INC | v306924_ex21-1.htm |
| EX-32.1 - EXHIBIT 32.1 - SAJAN INC | v306924_ex32-1.htm |
| EX-32.2 - EXHIBIT 32.2 - SAJAN INC | v306924_ex32-2.htm |
| EX-10.17 - EXHIBIT 10.17 - SAJAN INC | v306924_ex10-17.htm |
| EX-10.10 - EXHIBIT 10.10 - SAJAN INC | v306924_ex10-10.htm |
| EX-10.16 - EXHIBIT 10.16 - SAJAN INC | v306924_ex10-16.htm |
| EX-10.15 - EXHIBIT 10.15 - SAJAN INC | v306924_ex10-15.htm |
| EX-31.2 - EXHIBIT 31.2 - SAJAN INC | v306924_ex31-2.htm |
UNITED STATES SECURITIES AND EXCHANGE COMMISSION
WASHINGTON, D.C. 20549
FORM 10-K
(Mark One)
| x | ANNUAL REPORT PURSUANT TO SECTION 13 OR 15(d) OF THE SECURITIES EXCHANGE ACT OF 1934 |
For the fiscal year ended December 31, 2011
or
| ¨ | TRANSITION REPORT PURSUANT TO SECTION 13 OR 15(d) OF THE SECURITIES EXCHANGE ACT OF 1934 |
For the transition period from _______________________ to ___________________
Commission File Number: 000-51560
Sajan, Inc.
(Exact name of registrant as specified in its charter)
| Delaware | 41-1881957 |
| (State of incorporation) | (I.R.S. Employer Identification No.) |
| 625 Whitetail Blvd., River Falls, Wisconsin | 54022 |
| (Address of principal executive offices) | (Zip Code) |
Registrant’s telephone number, including area code: (715) 426-9505
| Securities registered pursuant to Section 12(b) of the Act: | ||
| Title of Each Class | Name of Each Exchange on which Registered | |
| None | Not Applicable | |
Securities registered pursuant to Section 12(g) of the Act:
Common Stock, $0.01 par value per share
Preferred Stock Purchase Rights
Indicate by check mark if the registrant is a well-known seasoned issuer, as defined in Rule 405 of the Securities Act. ¨ Yes x No
Indicate by check mark if the registrant is not required to file reports pursuant to Section 13 or Section 15(d) of the Act. ¨ Yes x No
Indicate by check mark whether the registrant (1) has filed all reports required to be filed by Section 13 or 15(d) of the Securities Exchange Act of 1934 during the preceding 12 months (or for such shorter period that the registrant was required to file such reports), and (2) has been subject to the filing requirements for the past 90 days.
x Yes ¨ No
Indicate by check mark whether the registrant has submitted electronically and posted on its corporate website, if any, every Interactive Data File required to be submitted and posted pursuant to Rule 405 of Regulation S-T (§232.405 of this chapter) during the preceding 12 months (or for such shorter period that the registrant was required to submit and post such files). x Yes ¨ No
Indicate by check mark if disclosure of delinquent filers pursuant to Item 405 of Regulation S-K is not contained herein, and will not be contained, to the best of registrant’s knowledge, in definitive proxy or information statements incorporated by reference in Part III of this Form 10-K or any amendment to this Form 10-K. £
Indicate by check mark whether the registrant is a large accelerated filer, an accelerated filer, a non-accelerated filer or a smaller reporting company. See definition of “accelerated filer,” large accelerated filer” and “smaller reporting company” in Rule 12b-2 of the Exchange Act. (Check one):
Large accelerated filer ¨ Accelerated filer ¨ Non-accelerated filer ¨ Smaller reporting company x
Indicate by check mark whether the registrant is a shell company (as defined in Rule 12b-2 of the Act).
¨ Yes x No
The aggregate market value of the outstanding common stock, other than shares held by persons who may be deemed affiliates of the registrant, as of the last day of the registrant’s most recently completed second fiscal quarter was approximately $16,232,000 based on the closing sales price of $1.50 per share as reported on the OTCBB market. As of March 15, 2012, there were 16,165,970 shares of our common stock, $0.01 par value per share, outstanding.
DOCUMENTS INCORPORATED IN PART BY REFERENCE
Portions of our definitive proxy statement relating to our 2012 Annual Meeting of Stockholders is incorporated by reference into Part III of this Annual Report on Form 10-K.
2011 Annual Report on Form 10-K
Table of Contents
| Page | ||
| PART I | ||
| Item 1. | Business | 4 |
| Item 1A. | Risk Factors | 13 |
| Item 1B. | Unresolved Staff Comments | 22 |
| Item 2. | Properties | 22 |
| Item 3. | Legal Proceedings | 23 |
| Item 4. | Mine Safety Disclosures | 23 |
| PART II | ||
| Item 5. | Market for Registrant’s Common Equity, Related Stockholder Matters and Issuer Purchases of Equity Securities | 24 |
| Item 6. | Selected Financial Data | 24 |
| Item 7. | Management’s Discussion and Analysis of Financial Condition and Results of Operations | 25 |
| Item 7A. | Quantitative and Qualitative Disclosures About Market Risk | 32 |
| Item 8. | Financial Statements and Supplementary Data | 33 |
| Item 9. | Changes in and Disagreements with Accountants on Accounting and Financial Disclosure | 53 |
| Item 9A. | Controls and Procedures | 53 |
| Item 9B. | Other Information | 54 |
| PART III | ||
| Item 10. | Directors, Executive Officers and Corporate Governance | 55 |
| Item 11. | Executive Compensation | 55 |
| Item 12. | Security Ownership of Certain Beneficial Owners and Management and Related Stockholder Matters | 55 |
| Item 13. | Certain Relationships and Related Transactions and Director Independence | 55 |
| Item 14. | Principal Accounting Fees and Services | 55 |
| PART IV | ||
| Item 15. | Exhibits, Financial Statement Schedules | 56 |
| Signatures | 59 |
| 2 |
CAUTIONARY NOTICE REGARDING FORWARD-LOOKING STATEMENTS
Forward-Looking Statements
This Annual Report on Form 10 - K contains forward-looking statements within the meaning of Section 27A of the Securities Act of 1933, as amended, and Section 21E of the Securities Exchange Act of 1934 (“ Securities Exchange Act ”). Forward-looking statements reflect the current view about future events. When used in this Annual Report on Form 10 - K the words “anticipate,” “will,” “believe,” “estimate,” “expect,” “future,” “intend,” “plan” and similar expressions or the negative of these terms as they relate to Sajan , Inc. (the “Company,” “Sajan,” “we,” “us” or “our”) its subsidiaries or its management identify forward-looking statements. Our forward-looking statements in this report generally relate to: our expectations regarding customer demand, market growth rates and conditions, pricing, our competitive position and strategic opportunities; our beliefs regarding the benefits of our technology and our ability to adapt to changing industry conditions; expectations regarding international sales; our intent with respect to intellectual property protection and research and development activities; our intent to grow organically and through acquisitions; our intent to list our securities for trading on NASDAQ upon satisfaction of the relevant listing standards; our intent to retain earnings to fund development; our expected growth initiatives; and our expectations with respect to cash flows and adequacy of capital resources. Forward-looking statements are based on information available at the time the statements are made and involve known and unknown risks, uncertainties and other factors that may cause our results, levels of activity, performance or achievements to be materially different from the information expressed or implied by the forward-looking statements. Such statements reflect the current view of our management with respect to future events and are subject to risks, uncertainties, assumptions and other factors (including the risks contained in the section entitled “Risk Factors” of this Annual Report on Form 10-K) relating to the Company’s industry, its operations and results of operations, and any businesses that may be acquired by it. These factors include:
| · | our rate of growth in the global multilingual content delivery industry; |
| · | our ability to effectively manage our growth; |
| · | lack of acceptance of any existing or new solutions we offer; |
| · | our ability to continue increasing the number of our customers or the revenues we derive from our recurring revenue customers; |
| · | continued economic weakness and constrained globalization spending by businesses operating in international markets; |
| · | our ability to effectively develop new solutions that compete effectively with the solutions that our current and future competitors offer; |
| · | risk of increased regulation of the Internet and business conducted via the Internet; |
| · | our ability to identify attractive acquisition opportunities, successfully negotiate acquisition terms and effectively integrate any acquired companies or businesses; |
| · | availability of capital on acceptable terms to finance our operations and growth; |
| · | risks of conducting international commerce, including foreign currency exchange rate fluctuations, changes in government policies or regulations, longer payment cycles, trade restrictions, economic or political instability in foreign countries where we may increase our business and reduced protection of our intellectual property; |
| · | our ability to add sales and marketing, research and development or other key personnel who are able to successfully sell or develop our solutions; |
| 3 |
| · | our ability to operate as a public company and comply with applicable disclosure and other requirements and to hire additional personnel with public company compliance experience; and |
| · | other risk factors included under “Risk Factors” in this Annual Report on Form 10 –K. |
Should one or more of these risks or uncertainties materialize, or should the underlying assumptions prove incorrect, actual results may differ significantly from those anticipated, believed, estimated, expected, intended or planned. Although our management believes that the expectations reflected in the forward-looking statements are reasonable, it cannot guarantee future results, levels of activity, performance or achievements. Except as required by applicable law, including the securities laws of the United States, Sajan does not intend to update any of the forward-looking statements to conform these statements to actual results.
PART I
ITEM 1. BUSINESS
Sajan provides on-demand language translation solutions to customers selling products into global markets. These customers use our solutions to translate product sales and marketing materials, packaging, user manuals, technical support and training documents, product manuals, instructions, warnings, and other product information into numerous languages. We combine our internally developed proprietary technology and high quality translation services to provide language translation solutions that are fast, reliable, and user-friendly. By utilizing an integrated technology and a service-based approach to language translation, we offer comprehensive solutions that allow customers to rely upon a single provider to meet all of their language translation needs. Our hosted technology system delivers a secure online solution that can be offered on a modular basis, which makes it attractive in both small business settings and in large enterprise environments.
Merger Transaction
Pursuant to an Agreement and Plan of Merger (the “Merger Agreement”) dated January 8, 2010, by and among MathStar, Inc., a Delaware corporation, incorporated in June 2005, and Sajan, Inc. a privately held Minnesota corporation whose business is providing language translation technology and service; Garuda Acquisition, LLC, a wholly-owned subsidiary of MathStar, now known as Sajan, LLC; and Thomas Magne, solely in his capacity as agent for the holders of common stock of Sajan, Inc., Sajan, Inc. was merged with and into Garuda Acquisition, LLC, (the “Merger”). Garuda Acquisition, LLC (“Garuda”) was the surviving entity in the Merger and subsequently changed its name to Sajan, LLC. As a result of the Merger, Sajan became a wholly-owned subsidiary of MathStar. MathStar continued the business of Sajan and began operating as a provider of language translation technology and service under the Sajan name. The Merger was closed and effective on February 23, 2010.
For accounting purposes, Sajan was treated as the continuing reporting entity that acquired MathStar because Sajan obtained effective control of MathStar as a result of the Merger. This determination was based on the following facts: Sajan stockholders have a large minority interest in the combined entity, the governing board consists of a majority of Sajan board members, and the composition of the senior management will be Sajan’s management team. Under this method of accounting, the recognition and measurement provisions of the accounting guidance for business combinations do not apply and, therefore, there is no recognition of goodwill or other intangible assets. Instead, the acquisition has been treated as the equivalent of Sajan issuing stock for the net monetary assets of MathStar, primarily cash, which are stated at their carrying value.
In 2009, we established Sajan Software Ltd (“Sajan Software”), which is based in Dublin, Ireland. The Ireland facility serves as both a Global Language Service Center and is home to Sajan Software, the producer of Sajan’s technology tools. Sajan India Software Private Limited (“Sajan India”), based in Delhi, India, was our software development center. This center was closed in January 2012 and these functions were moved to our River Falls headquarters. In 2010, we also established a Global Language Service Center in Spain, Sajan Spain S.L A (“Sajan Spain”), to serve the European market. In 2011, we established a Global Language Service Center in Singapore, Sajan Singapore Pte. Ltd. (“Sajan Singapore”), to serve the Asia Pacific market. All of these operations are wholly-owned subsidiaries of Sajan.
| 4 |
In October 2011, we completed the acquisition of the New Global Group (“New Global”) of companies. New Global is a provider of multilingual communication services and technologies - serving clients in the United States, Canada and Europe through offices in Montreal, Canada and Madrid, Spain. This acquisition included the purchase of the outstanding stock of two subsidiaries of New Global, New Global Canada and New Global Europe, and certain assets and liabilities of New Global LLC. The effective date of the acquisition was October 1, 2011. New Global Canada and New Global Europe are now wholly-owned subsidiaries of Sajan.
Products and Services
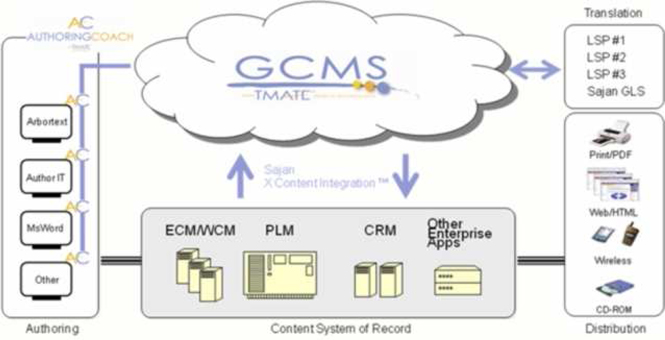
Our robust language translation solution incorporates an innovative technology product that serves as a single platform to meet the needs of the smallest user to the largest enterprise customer. The solution is a hosted platform and requires no installed software. The technology runs in the “cloud”, which means customers can access all our translation lifecycle components via an Internet browser. We combine both language translation services and our own proprietary technology to give customers a single source solution to meet all of their translation needs. The solution integrates people, processes and data into a service and technology solution that is designed to deliver measurable value in the form of cost reduction, business process automation, improved quality and integrated version control and audit trail.
GCMS. Our Global Communication Management System (“GCMS”) is our cloud-based technology platform. By categorical definition it is a Translation Management System (“TMS”) which means the technology encompasses features which span the entire language translation lifecycle. Our GCMS platform is an integrated solution suite that provides the tools to authors, linguists, graphic artists, project operations, administration and publishing staff needed to automate the project cycle for content localization from creation to delivery and to leverage enterprise Translation Memory (“TM”). Translation services are traditionally delivered on a per word cost basis, with ancillary fees for related services such as pre-and post-production content lay-out and TM integration. TM is the repository of past translation work which, in the case of GCMS, is parsed and stored contextually in a readily accessible data environment using proprietary algorithms that attempts to match current content with past translations. Properly optimized, the re-use of past translations from TM can significantly reduce operating costs and is an asset that is often under-utilized within the enterprise due to a lack of technology investment, fragmented responsibility of TM across the enterprise, fragmented service providers, or a lack of awareness of the economic value of TM. Our business model and strategy are focused on providing services and technologies to remedy such situations and facilitate enterprise customers’ optimization of TM. Our solutions increase productivity, accelerate critical time-to-market for customers, enhance the quality of globalized enterprise content, increase operational efficiency and reduce operating costs. Beyond the differentiated feature set and advanced multilingual data management capabilities of Sajan’s GCMS, the technology offers universal content connectors to easily integrate with our business systems such as Content Management Systems. Recognizing that language translation is part of a larger business process, this integration can prove quite beneficial to Sajan customers.
GCMS encapsulates a multilingual content repository, with built-in parsing technology that maintains language segment context. Retention of language context is, we believe, unique to our solutions and valuable for improving re-use of translated content. Simply stated, it makes the content smarter. GCMS also offers a workflow component that streamlines the language translation process. Our solution comes standard with built-in version control and audit trail, which is often well-suited for businesses in highly-regulated industries, such as life sciences companies complying with requirements imposed by the United States Food and Drug Administration. The GCMS is designed to be a modular, secure, online solution that is appropriate for any business environment. The application is an Internet-based development and computer technology, commonly referred to as a “cloud solution ,” that provides high availability and reliability to worldwide customers. In addition, we provide business analytics directly to customers through our system. Using web services, system features can be integrated with other business systems.
Technological Features. We have developed a number of tools that are designed to create value throughout the language translation process, particularly in the pre-translation process of authoring or content creation. Authoring Coach™ is a desktop tool sold individually to any source content producer, using a Windows™ based editor. It presents similar or like phrases, sentences or paragraphs to the creator and enables the creator to draw from previously translated content. The result is information that is more consistent and reduces the need for new translation. In addition, we developed our TMate™ search technology to enhance intelligent multilingual search. TMate™ is our proprietary advanced multilingual search algorithm.
| 5 |
Process. Utilizing the GCMS platform, human translators who provide translation services to Sajan are first systematically ranked and qualified to ensure that a high-quality language resource is performing translation on a particular project. Incorporating pre-translation processes, such as Authoring Coach and advanced search using TMate™, further differentiates the platform and we believe provides greater price and value differentiation. We believe our technological advances, detailed process methodology, and ISO 9000 practices result in reduced costs while delivering a higher value to the customer. This method offers a blend of both service and technology. Customers may sign in online, request translation of new content, view the status of pending projects, and obtain completed projects. All content is stored at a granular level, referred to as a segment, with language context retained, and each translated segment is stored indefinitely. This capability allows us to offer audit trail and version control, which are useful to regulated businesses operating in industries where compliance is important. An illustration of the content translation lifecycle is provided below.
GCMS Advantages. By utilizing a language management platform such as GCMS, we believe that customers are able to reduce the time-to-market for their products. The platform also enables enterprises to simultaneously launch products into all markets, which can result in more rapid revenue growth and a competitive advantage. The GCMS platform has been designed to ensure improved quality of multilingual content. GCMS uses advanced features, which increase the contextual accuracy of re-used multilingual content. For customers whose content accuracy and contextual sensitivity is vital, the GCMS platform offers an attractive solution to these problems. In the most recent broad research assessment, our technology was ranked as the top language TMS technology by Common Sense Advisory in its report, “Translation Management Systems, Assessments of Commercial and LSP-Specific TMS Offerings.”
In June 2011 we were granted a patent covering a number of components that make up the GCMS platform. Specifically, the structure in which both source and target content is stored results in a logical and contextually accurate placement of content. This means that the content becomes more intelligent and can be used in ways that are more meaningful for future language translation services.
| 6 |
ISO Certified. According to leading industry analysts, approximately 10% of suppliers in this market claim ISO certification. The certification requires significant investment of time and money. The benefits to clients are the assurance of quality controls and defined business structure. We received our ISO 9001:2000 certification in 2005, and are currently ISO 9001:2008 certified.
Market Description
Language is often a barrier in global commerce. The demand for effective language translation continues to grow. The industry has historically been very service centric, but, as is the case in many service industries, price pressures and other market demands impose the need for innovation and new solution paradigms.
Language translation services, although often treated like a commodity service, have historically been expensive, labor intensive and relatively slow in delivery. Human translators can typically translate 2,500 words per day on average, although this varies based on the complexity of the subject matter. This creates constraints on the available supply of translation services and, when positioned against growing demand, we believe will provide translation technology innovators with an advantage. As a result, based on the rising demand for translation services and the looming shortage of human translators worldwide, we expect a favorable pricing environment for Language Service Providers (LSPs) in the coming years.
Global economic challenges have created opportunities. Although the weak economy and declines in the U.S. Dollar against foreign currency have impacted corporate spending, it has also influenced United States business executives to seek revenue from foreign markets. We believe recent negative worldwide economic conditions have hastened the trend towards globalization. In addition, growth in emerging markets will also help fuel market growth. Language translation is becoming more synonymous with revenue as critical company messages can now reach broader audiences.
We believe the shortage in human translators cast against a rising demand will result in increased opportunities for companies that offer technology-based solutions and improve the efficiency of language translation services. In theory, the language translation service market should shrink if technology is offering improved content reuse. To compete effectively, language translation companies need to obtain translation in an accurate, timely, and cost effective manner. With advances in content management and the growth of the Internet, providers will also need to integrate their multilingual content with other enterprise systems to establish a cohesive single repository of all global content. Content is no longer monolingual content; it is multilingual. Industry analysts and general business analysts have indicated that a more integrated solution, often referred to as the Global Content Lifecycle, will be required to be successful in the future for both global enterprises and for the LSPs that support them. As a result, language translation is no longer likely to be treated as an afterthought in the globalization process, but rather as an integral part of an enterprise system. Further, as the annual spending by multinational companies for language translation solutions accelerates over the next several years, we believe a more technology-based solution will be required to keep pace with the rate of growth in the amount of content and increasingly sophisticated content management solutions.
An additional advantage that Sajan provides is flexibility in our solution against a transforming market landscape. Many have speculated as to when the language translation technology industry will realize strong independent growth. Conceptually it makes perfect sense, however adoption of independent technology solutions, comparable with other markets like Content Management, is occurring at a slower pace. We feel this is in part due to the complexity of the translation lifecycle and internal subject matter expertise required by companies to manage both the process and technology themselves. We believe Sajan is well positioned because it aligns the manner in which it offers technology with customer preferences. If the industry matures to a more independent technology approach, we expect that Sajan will be able to modify how it offers its solution using existing base technology that has been stress tested.
| 7 |
Based on the current globalization and language translation market dependence upon non-technology oriented, small language translation firms (see chart below), we believe that vendors who provide both language translation capabilities and offer a strong technology platform will enjoy a competitive advantage.
Market Revenues. Research completed by Common Sense Advisory (“CSA”) confirms an opportune, growing market. According to CSA’s research, the worldwide global multilingual content delivery market in 2010 was $26 billion and the global language services market is expected to reach $38 billion by 2013. This equates into an approximate 13% compound annual growth rate over the three-year period. Human translation services account for over 90% of the global translation market and are generally delivered through a network of freelance linguists that freely associate among the LSPs on a per job basis. Nearly 90% of companies outsource some or all of their translation and localization work, and 67% of language buyers say that a vendor’s automation capabilities are important.
The global multilingual content delivery market is very fragmented. The combined revenues of the world’s top 40 translation firms account for less than 16% of the overall market, and most are service-only agencies. No single language translation provider exceeds 2% market share.
The breakdown of LSPs in 2008, not materially different by revenue category today, as outlined in the table below, reveals that small providers constitute a very large portion of this market. Generally, these providers have little to offer in the way of technology or value added services.
| Revenue | Number of LSPs | |||
| Less than $1 million | 6,380 | |||
| $1 million-$5 million | 391 | |||
| $5 million-$10 million | 64 | |||
| $10 million -$50 million | 42 | |||
| $50 million-$500 million | 8 | |||
According to CSA’s 2010 market research, the breakdown of language services revenue by geographical region is as follows:
| Region | Market Share | 2009 US$ M | 2010 US$ M | 2011 US$ M | 2012 US$ M | 2013 US$ M | ||||||||||||||||||
| North America | 48.50 | % | 11,284 | 12,769 | 14,448 | 16,347 | 18,497 | |||||||||||||||||
| Northern Europe | 19.00 | % | 4,421 | 5,002 | 5,660 | 6,404 | 7,246 | |||||||||||||||||
| Western Europe | 11.10 | % | 2,583 | 2,922 | 3,307 | 3,741 | 4,233 | |||||||||||||||||
| Southern Europe | 8.59 | % | 1,999 | 2,264 | 2,559 | 2,895 | 3,276 | |||||||||||||||||
| Asia | 7.67 | % | 1,785 | 2,019 | 2,285 | 2,585 | 2,925 | |||||||||||||||||
| Eastern Europe | 4.49 | % | 1,045 | 1,1 82 | 1,338 | 1,513 | 1,712 | |||||||||||||||||
| Latin America | 0.35 | % | 81 | 92 | 104 | 118 | 133 | |||||||||||||||||
| Africa | 0.18 | % | 42 | 47 | 54 | 61 | 69 | |||||||||||||||||
| Oceania | 0.13 | % | 30 | 34 | 39 | 44 | 50 | |||||||||||||||||
| Growth Totals | 100 | % | 23,267 | 26,327 | 29,789 | 33,706 | 38,138 | |||||||||||||||||
| Table 1: Projected Language. Services Revenues and Regional Distribution | ||||||||||||||||||||||||
| Source: Common Sense Advisory, Inc. | ||||||||||||||||||||||||
Source: Projected Language Services Revenues for 2009-2013 in U.S. Millions of Dollars, Common Sense Advisory, Inc.
The ability of a traditional LSP to compete is growing more challenging. While demand for the service may be rising, which should allow for price increases, the buyers currently are demanding that providers hold or reduce prices. Without technological differentiation, a traditional LSP will continue to operate at a severe disadvantage, not only in its ability to manage the delivered cost, but also to integrate and interoperate with technologies used by its clients such as content management systems and other enterprise class business systems.
| 8 |
Key Market Trends and Influences. Several distinct trends and influences within the global multilingual content delivery market have emerged, and we believe they will provide significant opportunities for market innovation. The underlying motivators for many of these include historic objectives such as cost reduction, quality improvement and schedule predictability. In addition, globalization is causing new factors to emerge, such as revenue growth derived from foreign market penetration, improving global customer experience and brand support worldwide.
Competition
The global multilingual content delivery market is highly competitive and highly-fragmented with numerous existing competitors. We believe the principal competitive factors in providing language translation solutions include the ability to provide a comprehensive solution to customers; infrastructure that supports cost effective and high quality delivery to customers; project management expertise; quality and speed of service delivery; and corporate reputation. We believe that we have competed favorably with respect to these factors and have developed a strong reputation in our industry.
While many potential customers utilize internal resources to address their translation and localization requirements, we believe our primary competition is external and within our industry. Competitors within our industry are categorized into three primary segments: Language Service Providers, Technology Only Providers, and Technology-Enabled Service Providers.
Language Service Providers. The largest segment is comprised of competitors that offer only human language translation services and make limited use of technology on either an internal basis or as part of their solution. These service vendors are abundant due to low barriers to entry and often have only a small number of key, ongoing relationships. These providers make up the largest segment of the translation market and account for approximately 75% of the number of industry participants. The challenge for these providers is that they have little that differentiates them from other providers, with no technology and often unproven processes and quality controls. We believe that such firms offer an opportunity to increase our scale, gain access to critical linguistic skills and also open new geographic markets. We believe providing our technologies and business processes to these organizations will solidify their account base and enhance their margins.
Technology Only Providers. The second segment consists of pure technology providers. This group is a disparate collection of point solution and suite providers to enterprises for handling their own translation requirements. These technology solutions handle a wide range of requirements and leave much to the customers to do on their own to integrate and operate across multiple applications. Examples of competitive technology only companies are SDL Plc, Across Systems GmbH, Kilgray Translation Technologies, LingoTek, Inc., Atril and Wordfast LLC.
Within the category of technology only provider, there are two subsets. One subset consists of providers that serve the translator market most often with what is referred to as Translation Memory tools (a data management application). Often these are inexpensive productivity tools used by translators or small language service providers. The second subset are those technology providers that serve corporate enterprises. These providers operate beyond data management and include business process and analytics. These systems are often referred to as Translation Management Systems. Technology providers as a whole represent a very small portion of market participants. There has been a trend among the technology solution providers towards new, more nimble entrants embracing SaaS architecture over the more traditional enterprise software model.
Technology-Enabled Service Providers. The third segment consists of companies like us that combine both language translation services and comprehensive technology solutions, often referred to as Technology-Enabled Service Providers. The largest such company is publicly-held Lionbridge Technologies, Inc. (“Lionbridge”), with 2011 revenues of $427.8 million. There is only a small number of Technology-Enabled Service Providers. Within this group, based on the most recent CSA report, we enjoy the highest ranking for our TMS technology offering.
| 9 |
We believe that only a very small number of the largest LSPs, such as SDL, Transperfect and Lionbridge, provide legitimate full featured TMS technology offerings. Each takes a very different technological approach. SDL has acquired many technology companies, both directly relating to the global multi-lingual content delivery industry and others that are peripheral to the industry. We believe that this has alienated SDL from some buyers and partners, as SDL directly competes with them. Lionbridge promotes a SaaS solution. This solution utilizes a legacy technology product called LogoportTM, which was originally designed as a TM solution. Lionbridge has incorporated some web interfaces to this product. Nearly all of the direct technology competition employs a very common strategy to TM data management. We believe this simplistic approach limits the ability for a customer to maximize reuse of past content and does not permit effective enterprise level integration with high performance business systems, which we believe is inferior to a more robust solution.
We believe the remaining LSPs, while potentially competent in the delivery of language translation service, do not possess significant technology. If they do, they are likely to be using TM tools to achieve some level of content reuse so as to enable them to make some technological value claim.
Marketing and Sales
Substantially all of our revenues have been generated through our internal direct sales force and the efforts of our senior management team. As of March 15, 2012, we had 15 direct sales professionals in the United States and Europe.
Our sales force has developed valuable customer relationships. Our sales approach involves planning for a customer organization’s unique ongoing requirements, including future versions of products, and ongoing support, maintenance, and training, related to both technology products and content. We believe that tailoring our solutions to the customer’s preference will result in gaining a larger portion of their language translation business.
Customers
All of our customers sell products outside the United States and require content such as warnings, instructions, directions, and other information to be translated into a number of languages. Our customers are predominantly Fortune 1000 companies in the technology, medical, industrial, and manufacturing sectors. Most of our customers are located in the United States, with a high concentration located in the Midwest region. We anticipate that the percentage of our customers located outside of the United States will increase as we expand our sales efforts and Sajan Software hires additional sales personnel.
Major Customers
We derive a significant portion of our revenues from a limited number of customers. For the years ended December 31, 2011 and 2010, our largest customer accounted for approximately 11% and 15%, respectively, of our revenue, and, on a combined basis, our ten largest customers accounted for approximately 53% and 64%, respectively, of our revenue.
Geographic Areas of Operations
We generate revenues worldwide and during the year ended December 31, 2011, 69% of our revenues were generated within the United States and 31% were generated internationally. Currently, our largest international market is Spain, which accounted for 36% of our international revenues.
| 10 |
Intellectual Property
The development, utilization and protection of technology is an important component of our overall operating strategy. During 2011 we received a patent from the U.S. Patent and Trademark Office covering aspects of our GCMS solution which expires in 2021. We have not filed any applications for patent protection in any country other than the United States. As a result, we do not and will not have the right to enforce our rights under any United States patent, if issued to us, in any foreign country, or to prevent others in foreign countries from utilizing our proprietary technology covered by that patent. We may apply for patent protection on our future technology developments to the extent we believe such protection is available and economically warranted. Despite these efforts, others could independently develop technology that is similar to our technology, or offer or sell products or services in foreign countries that use our technology.
We have registered and use domain names sajan.com, authoringcoach.com, and sajansoftware.com. We use, or intend to use, and claim rights to various trade names and trademarks to identify our language translation services and products. We have obtained a registered U.S. mark for the Sajan logo. We also use and claim rights to the “Sajan™”, “GCMS™”, “X-Content Integration™”, “TMate™”, “Context Intelligence™” and “Authoring Coach™” marks.
We intend to protect our intellectual property to the extent such protection is warranted. In addition to efforts to obtain patent and trademark rights, we rely on a combination of trade secret, license, nondisclosure and other contractual agreements and copyright laws to protect our intellectual property rights. Existing trade secret and copyright laws afford us only limited protection. We enter into confidentiality agreements with our employees and contractors, and limit access to and distribution of our proprietary information. These arrangements may not be adequate to deter misappropriation of our proprietary information and we may not be able to detect unauthorized use and take appropriate steps to enforce our intellectual property rights.
Research and Development
During the years ended December 31, 2011 and 2010, we spent approximately $1.6 million and $1.7 million respectively, on research and development. Research and development expenses consist primarily of wages and benefits for product strategy and development personnel. We have focused our research and development efforts on the industrialization of the GCMS platform and its component modules for use by the various participants involved in the content globalization process. Functional development has focused on improving ease of use, functionality, scalability and efficiency of Translation Memory processing.
Our research and development primarily occurs in the United States and Ireland. We expect that on an annual basis, the dollar amount of research and development expenses will remain relatively constant with 2011 levels as we continue to enhance and expand our product offerings, but decrease as a percentage of revenues, as we anticipate that our revenues will grow at a faster rate than the growth of research and development spending.
Employees
As of March 15, 2012, we had 114 full-time employees. Our employees include software development engineers, project managers, language specialists, and graphic designers, as well as sales and marketing, quality assurance and administrative team members. We have approximately 84 employees in our River Falls, Wisconsin office, 3 employees that work from their home offices in the United States, 12 employees in our Dublin, Ireland office, 12 employees in our Madrid, Spain office and 3 employees in our Singapore office. None of our employees are covered by a collective bargaining agreement. We consider our relationship with our employees to be good. In addition, we utilize the services of approximately 3,500 human translators, all of whom are independent contractors, and utilize consultants to perform short-term project-based services, which is a more cost-effective strategy than hiring additional full-time employees.
| 11 |
Corporate Information
General
Our corporate offices are located in River Falls, Wisconsin, which is located approximately 30 miles east of Minneapolis, Minnesota. Our River Falls corporate offices contain our core Global Language Service operations, our administrative, product management, marketing, sales, and professional services functions. Our offices are located at 625 Whitetail Blvd., River Falls, Wisconsin 54022, and our telephone number is (715) 426-9505.
The Company’s fiscal year runs from January 1 through December 31. Neither the Company nor any of its predecessors have been in bankruptcy, receivership or any similar proceeding.
| 12 |
ITEM 1A. RISK FACTORS
You should consider the following risk factors, in addition to the other information presented or incorporated by reference into this Annual Report on Form 10-K, in evaluating our business and your investment in us.
The Company’s common stock involves a high degree of risk. Investors and potential investors should carefully consider the following risk factors, together with all of the other information included in this report, before making investment decisions about shares of our common stock. The risks and uncertainties described below are not the only risks and uncertainties facing the Company in the future. Additional risks and uncertainties not presently known or that are currently considered to be immaterial may also materially and adversely affect the Company’s business operations or the stock price of the Company’s common stock. If any of the following risks or uncertainties occurs, the Company’s business, financial condition, operating results and future growth prospects could materially suffer. In that event, the trading price of your securities could decline, and you may lose all or part of your investment.
Risk Related to Our Business and Industry
Our past results may not be indicative of future results, and, therefore, we may be unable to continue to grow at our historical growth rates.
Sajan, Inc. began selling language translation services utilizing its proprietary technology in 2002 and generated only nominal revenues during that year. From 2003 to 2010, however, revenue increased more rapidly. The annual revenues of Sajan, Inc. for the year ended December 31, 2009 were approximately $12.7 million and increased to $16.0 million in the year ended December 31, 2010 and to approximately $20.9 million in the year ended December 31, 2011. We experienced rapid revenue growth from 2009 through 2011Increasing revenues by growing our business operation under the Sajan name is a key component of our strategy. These expansion plans have placed and may continue to place significant demands on our management, operational and financial resources. You should not consider recent revenue growth as indicative of our future performance. In future periods, we may not have any revenue growth, or our revenues could decline.
We have incurred operating losses in the past and may incur operating losses in the future.
For the year ended December 31, 2011, Sajan reported a loss from operations of $423,000. For the years ended December 31, 2010 and 2009, Sajan generated net loss of $3.0 million and $1.1 million, respectively. Throughout most of our history, we have experienced net losses and negative cash flows from operations. We expect our operating expenses to increase in the future as we expand our operations. Furthermore, as a public company, we incur significant legal, accounting and other expenses. If our revenues do not grow to offset these increased expenses, we may not be profitable. We cannot assure you that we will be able to achieve or maintain profitability.
We may need additional financing in the future, which may not be available, and any such financing will likely dilute our existing stockholders.
We may require additional financing in the future, which could be sought from a number of sources, including, but not limited to, additional sales of equity or debt securities or loans from banks or other financial institutions. There can be no certainty that any such financing will be available to us or, if available, on terms favorable to us. If additional funds are raised by the issuance of our equity securities, such as through the issuance of stock, convertible securities, or the issuance and exercise of warrants, then the ownership interests of our existing stockholders will be diluted and our ability to utilize accumulated net operating loss carryforwards could be impaired or terminated. If we raise additional funds by issuing debt or other instruments, we may become subject to certain operational limitations, and such securities may have rights senior to those of our common stock. If adequate funds are not available on acceptable terms, we may be unable to fund our operations or the expansion of our business. Our failure to obtain any necessary financing in a timely manner and on favorable terms could have a material adverse effect on our business strategy and on our financial performance and stock price, and could require us to delay or abandon our growth strategy.
| 13 |
We do not have long-term contracts with our customers who provide us with recurring revenue, and our success will depend on our ability to maintain a high level of customer satisfaction and a strong reputation in the global multilingual content delivery industry.
Our contracts with our customers who provide us with recurring revenue typically allow the customer to cancel the contract for any reason with 30 days’ prior notice to us. Our continued success therefore depends significantly on our ability to meet or exceed the expectations of these customers because most of such customers do not make long-term commitments to use our solutions. In addition, if our reputation in the global multilingual content delivery industry is harmed or diminished for any reason, this may cause our recurring revenue customers to terminate their relationships with us on short notice and seek alternative globalization and translation solutions. If a significant number of recurring revenue customers terminate their relationships with us, our business, results of operations and financial condition would be adversely affected in a short period of time.
We rely on a limited number of customers, and the loss of or reduction in revenue from a major customer could negatively affect our business, financial condition and operations.
We derive a significant portion of our revenues from a limited number of large customers. For the years ended December 31, 2011 and 2010, our largest customer accounted for approximately 11% and 15%, respectively, of our revenue, and, on a combined basis, our ten largest customers accounted for approximately 53% and 64%, respectively, of our revenue. As a result of the concentration of our revenue to a limited number of customers, we have experienced fluctuations in collection of our revenues. The loss of any major customer or a significant reduction in a large customer’s use of our language translation solutions could materially reduce our revenue and cash flow and adversely affect our business, financial condition and operations.
Continued economic weakness and uncertainty could adversely affect our revenue, lengthen our sales cycle and make it difficult for us to forecast operating results accurately.
Our revenues depend significantly on general economic conditions and the health of large companies that sell products internationally. Economic weakness and constrained globalization spending may result in slower growth or reductions in our revenues and gross profits in 2012. We have experienced, and may experience in the future, reduced spending in our business due to the current financial turmoil affecting the U.S. and global economy and other macroeconomic factors affecting spending behavior. Uncertainty about future economic conditions makes it difficult for us to forecast operating results and to make decisions about future investments. In addition, economic conditions or uncertainty may cause current and potential customers to reduce or delay globalization expenditures, including purchases of our solutions. Our sales cycle may lengthen if purchasing decisions are delayed as a result of uncertain information technology or contracted development budgets or if contract negotiations become more protracted or difficult as customers institute additional internal approvals for globalization and information technology purchases. Delays or reductions in globalization and information technology spending could have a material adverse effect on demand for our software and services, and consequently on our business, financial condition and results of operations.
If we are unable to attract new customers or sell additional solutions, or if our customers do not increase their use of our solutions, our revenue growth and profitability will be adversely affected.
To increase our revenues and achieve and maintain profitability, we must regularly add new customers and sell additional solutions, and our customers must increase their use of our solutions they currently utilize. We intend to grow our business by hiring additional inside sales personnel and increasing our marketing activities. If we are unable to hire or retain quality sales personnel, convert customer prospects into paying customers, or ensure the effectiveness of our marketing programs, or if our existing or new customers do not perceive our solutions to be of sufficiently high value and quality, we might not be able to increase sales, and our operating results will be adversely affected. In addition, if we fail to sell our new solutions to existing or new customers, we will not generate anticipated revenues from these solutions, our operating results will suffer and we might be unable to grow our revenues or achieve or maintain profitability.
| 14 |
Our strategy includes pursuing acquisitions, and our potential inability to successfully integrate newly-acquired companies, businesses or technologies may adversely affect our financial results.
Late in 2011 we acquired New Global. We believe part of our growth will be driven by acquisitions of other companies or their businesses or technologies. As we integrate New Global and if we complete other acquisitions, we face many risks commonly encountered with growth through acquisitions, including:
| · | incurring significantly higher than anticipated capital expenditures and operating expenses; |
| · | failing to assimilate the operations and personnel of the acquired company or business; |
| · | loss of customers that were obtained in the acquisition; |
| · | disrupting our ongoing business; |
| · | dissipating our management resources; |
| · | failing to maintain uniform standards, controls and policies; and |
| · | impairing relationships with employees and customers as a result of changes in management. |
Fully integrating New Global and other acquired companies, business or technology into our operations may take a significant amount of time. We cannot assure you that we will be successful in overcoming these risks or any other problems encountered with acquisitions. To the extent we do not successfully avoid or overcome the risks or problems related to any acquisitions, our results of operations and financial condition could be adversely affected. The acquisition of New Global and future acquisitions also could impact our financial position and capital needs, and could cause substantial fluctuations in our quarterly and yearly results of operations. In addition, the acquisition of New Global and future acquisitions will include significant goodwill and intangible assets, which may result in future amortization or impairment charges that would reduce our stated earnings.
Our inability to adapt to rapid technological change could impair our ability to remain competitive.
The global multilingual content delivery industry in which we compete is characterized by rapid technological change, introductions of new products and evolving industry standards. Our ability to attract new customers and increase revenues from customers will depend in significant part on our ability to anticipate industry standards and to continue to enhance existing solutions or introduce or acquire new solutions on a timely basis to keep pace with technological developments. The success of any enhancement or new solution depends on several factors, including the timely completion, introduction and market acceptance of any enhancement to our solution. Any new solution we develop or acquire might not be introduced in a timely or cost-effective manner and might not achieve the broad market acceptance necessary to generate significant revenues. If any of our competitors implements new technologies before we are able to implement them, those competitors may be able to provide more effective solutions than ours at lower prices. Any delay or failure in the introduction of new or enhanced solutions could adversely affect our business, results of operations and financial condition.
| 15 |
Our business may be harmed by defects or errors in the services we provide to customers.
Many of the services we provide are critical to the business operations of our customers. While we maintain general liability insurance, including coverage for errors and omissions, defects or errors in the services we provide could interrupt our customers’ abilities to provide products and services to their customers, resulting in delayed or lost revenue. This could damage our reputation through negative publicity, make it difficult to attract new and retain existing customers, and cause customers to terminate our contracts and seek damages. We may incur additional costs to correct errors or defects. There can be no assurance that our general liability and errors and omissions insurance coverage will be available in amounts sufficient to cover one or more large claims, or that the insurer will not disclaim coverage as to any future claims.
An interruption or failure of our information technology and communications systems could impair our ability to effectively provide our services, which could damage our reputation and business.
The provision of our services depends on the continuing operation of our information technology and communications systems. Any damage to or failure of our systems could result in interruptions in our services. Interruptions in our services could reduce our revenues and profits, and the Sajan brand could be damaged if people believe our system is unreliable. Our systems are vulnerable to damage or interruption from terrorist attacks, floods, tornados, fires, power loss, telecommunications failures, computer viruses or attempts to harm our systems. Our data centers may be subject to break-ins, sabotage and intentional acts of vandalism, and to other potential disruptions. Some of our systems may not be fully redundant, and our disaster recovery planning may not be able to account for all eventualities. The occurrence of a natural disaster, a decision to close a facility we are using without adequate notice for financial reasons, or other unanticipated problems at our data centers could result in lengthy interruptions in our services. Any unscheduled interruption in our service will put a burden on the entire organization and would result in an immediate loss of revenue. If we experience frequent or persistent system failures on our web site, our reputation and the Sajan brand could be permanently harmed. The steps required to increase the reliability and redundancy of our systems are expensive, will reduce our operating margins, and may not be successful in reducing the frequency or duration of unscheduled downtime.
The intellectual property of our customers may be damaged, misappropriated, stolen, or lost while in our possession, subjecting us to litigation and other adverse consequences.
In the course of providing globalization and language translation services to our customers, we take possession of or are granted access to certain intellectual property of our customers. If such intellectual property is damaged, misappropriated, stolen, or lost, we could suffer, among other consequences:
| · | claims under indemnification provisions in customer agreements or other liability for damages; |
| · | delayed or lost revenue due to adverse customer reaction; |
| · | negative publicity; and |
| · | litigation that could be costly and time consuming. |
Any adverse impact attributable to any of the foregoing factors would have a material adverse effect on our business and revenues.
We rely on third parties for key aspects of the process of providing services to our customers, and any failure or interruption in the services provided by these third parties could harm our ability to operate our business and damage our reputation.
We rely on third-party vendors, including data center and bandwidth providers, and we also rely on third parties for key aspects of the process of providing language translation services to our customers. Our revenues and margins are subject to our ability to continue to maintain satisfactory relationships with freelance linguists, who are in high demand worldwide for specific languages. Any disruption in the network access or co-location services provided by these third-party providers or any failure of these third-party providers and freelance linguists to handle current or higher volumes of use could significantly harm our business. Any financial or other difficulties the providers face may have negative effects on our business, the nature and extent of which cannot be predicted. We exercise little control over these third party vendors, which increases our vulnerability to problems with the services they provide. We also license technology and related databases from third parties to facilitate aspects of our translation processes and our data center and connectivity operations including, among others, Internet traffic management and search services. Any errors, failures, interruptions or delays experienced in connection with these third-party technologies and information services could negatively impact our relationships with customers and adversely affect the Sajan brand, and could expose us to liabilities to third parties.
| 16 |
Evolving regulation of the Internet may increase our expenditures related to compliance efforts, which may adversely affect our financial condition.
As Internet commerce continues to evolve, increasing regulation by federal, state or foreign agencies becomes more likely. We are particularly sensitive to these risks because the Internet is a critical component of our on-demand business model. In addition, taxation of services provided over the Internet or other charges imposed by government agencies or by private organizations for accessing the Internet may be imposed. Any regulation imposing greater fees for Internet use or restricting information exchange over the Internet could result in a decline in the use of the Internet and the viability of Internet-based services, which could harm our business.
We depend on intellectual property rights to protect proprietary technologies, although we may not be able to successfully protect these rights.
We rely on our proprietary technology to enhance our software and service offerings. We use a combination of patent, trademark, trade secret and copyright law in addition to contractual restrictions to protect our technology. Although we have received a patent from the U.S. Patent and Trademark Office covering certain aspects of our technology, there can be no assurance that this patent will adequately protect our technology or provide us with a competitive advantage. We may apply for patent protection on our future technology developments to the extent we believe such protection is available and economically warranted. However, there is no assurance that we will file additional applications for patent protection in the United States or in other countries, that any application that we may file will result in an issued patent, or that any issued patent will provide us with a competitive advantage. We have not filed any applications for patent protection in any country other than the United States. As a result, we do not have the right to enforce our rights under any United States patent, if issued, in any foreign country, or to prevent others in foreign countries from utilizing the proprietary technology covered by our patents. Despite our efforts, there can be no assurance that others will not independently develop technology that is similar to our technology, or offer or sell products or services in foreign countries that utilize our technology. The development by others of technology that is similar to our technology, or the sale of products or services in foreign countries that incorporate our technology, would harm our competitive position and have a material adverse effect on our business, results of operations and financial condition.
We may be involved in disputes from time to time relating to our intellectual property and the intellectual property of third parties.
We may become parties to disputes from time to time over rights and obligations concerning intellectual property, and we may not prevail in these disputes. Third parties may raise claims against us alleging infringement or violation of the intellectual property of that third party. Some third party intellectual property rights may be extremely broad, and it may not be possible for us to conduct our operations in such a way as to avoid violating those intellectual property rights. Any such intellectual property claim could subject us to costly litigation and impose a significant strain on our financial resources and management personnel regardless of whether such claim has merit. Our liability insurance, if any, may not cover potential claims of this type adequately or at all, and we may be required to alter products or pay monetary damages or license fees to third parties, which could have a material adverse affect on our financial condition and results of operations.
| 17 |
Our ability to use our U.S. net operating loss carryforwards might be limited or eliminated.
As of December 31, 2011, we had net operating loss carryforwards of approximately $30.8 million, which are potentially available for U.S. federal tax purposes. These loss carryforwards expire between 2015 and 2030. To the extent these net operating loss carryforwards are available, we intend to use them to reduce any corporate income tax liability associated with our operations. Section 382 of the U.S. Internal Revenue Code generally imposes an annual limitation on the amount of net operating loss carryforwards that may be used to offset taxable income when a corporation has undergone significant changes in stock ownership. As a result, prior or future changes in ownership could put limitations on or eliminate the availability of our net operating loss carryforwards to offset any profit. Rules governing the use of net operating loss carryforwards are complex, and any use of our net operating loss carryforwards could be challenged given our change of control in 2007 and 2010. To the extent our use of net operating loss carryforwards is significantly limited or eliminated, any income generated by us could be subject to corporate income tax earlier than if we were able to use net operating loss carryforwards, which could result in lower profit. Future changes of control may result in additional expiration of a portion of the remaining net operating loss carryforward before it can be used. The use of our carryforward is dependent upon our ability to attain profitable operations in the future.
The markets in which we operate are highly competitive, and our failure to compete successfully would make it difficult for us to add and retain customers and would reduce or impede the growth of our business.
The markets for global multilingual content delivery software and services are increasingly competitive and global. We expect competition to increase in the future both from existing competitors and new companies that may enter our markets. In addition to our existing competitors, we may face competition in the future from companies that do not currently offer globalization or translation services. We may also face competition from internal globalization departments of Fortune 1000 and large emerging companies. Technology companies, information technology services companies, business process outsourcing companies, web consulting firms, technical support call centers, hosting companies and content management providers may choose to broaden their range of services to include globalization or language translation as they expand their operations internationally. Increased competition could result in pricing pressure, reduced sales, lower margins or the failure of our solutions to achieve or maintain broad market acceptance. New or established competitors may offer solutions that are superior to or lower in price than ours. We may not have sufficient resources to continue the investments in all areas of software development and marketing needed to maintain our competitive position. In addition, some of our competitors are better capitalized than us, which may provide them with an advantage in developing, marketing or servicing new solutions. Increased competition could reduce our market share, revenues and operating margins, increase our costs of operations and otherwise adversely affect our business.
If we fail to retain our Chief Executive Officer and other key personnel, our business would be harmed and we might not be able to implement our business plan successfully.
Given the complex nature of the technology on which our business is based and the speed with which such technology advances, our future success is dependent, in large part, upon our ability to attract and retain highly qualified managerial, technical and sales personnel. In particular, Shannon Zimmerman, President and Chief Executive Officer is critical to the management of our business and operations. Competition for talented personnel is intense, and we cannot be certain that we can retain our managerial, technical and sales personnel or that we can attract, assimilate or retain such personnel in the future. Our inability to attract and retain such personnel could have an adverse effect on our business, results of operations and financial condition.
Our continued growth could strain our personnel resources and infrastructure, and if we are unable to implement appropriate controls and procedures to manage our growth, we will not be able to implement our business plan successfully.
We have experienced a period of rapid growth in our headcount and operations. To the extent that we are able to sustain such growth, it will place a significant strain on our management, administrative, operational and financial infrastructure. Our success will depend in part upon the ability of our senior management to manage this growth effectively. To do so, we must continue to hire, train and manage new employees as needed. If our new hires perform poorly, or if we are unsuccessful in hiring, training, managing and integrating these new employees, or if we are not successful in retaining our existing employees, our business would be harmed. To manage the expected growth of our operations and personnel, we will need to continue to improve our operational, financial and management controls and our reporting systems and procedures. The additional headcount we are adding will increase our cost base, which will make it more difficult for us to offset any future revenue shortfalls by reducing expenses in the short term. If we fail to successfully manage our growth, we will be unable to execute our business plan.
| 18 |
Because our long-term success depends, in part, on our ability to expand the sales of our solutions to customers located outside of the United States, our business will be susceptible to risks associated with international operations.
We have limited experience operating in foreign jurisdictions. In 2009, we opened Sajan Software in Dublin, Ireland, in 2010 we opened Sajan, Spain and in 2011 we opened Sajan, Singapore. Our inexperience in operating our business outside of North America increases the risk that our current and any future international expansion efforts will not be successful. Conducting international operations subjects us to risks that, generally, we have not faced in the United States, including:
| · | fluctuations in currency exchange rates; | |
| · | unexpected changes in foreign regulatory requirements; | |
| · | longer accounts receivable payment cycles and difficulties in collecting accounts receivable; | |
| · | difficulties in managing and staffing international operations; | |
| · | potentially adverse tax consequences, including the complexities of foreign value-added tax systems and restrictions on the repatriation of earnings; | |
| · | the burdens of complying with a wide variety of foreign laws and different legal standards, including laws and regulations related to privacy; | |
| · | increased financial accounting and reporting burdens and complexities; | |
| · | political, social and economic instability abroad, and terrorist attacks and security concerns in general; and | |
| · | reduced or varied protection for intellectual property rights in some countries. |
The occurrence of any one of these risks could negatively affect our international business and, consequently, our results of operations generally. Additionally, operating in international markets also requires significant management attention and financial resources. We cannot be certain that the investment and additional resources required in establishing, acquiring, operating or integrating operations in other countries will produce desired levels of revenues or profitability.
Our management has limited experience operating as a public company.
The members of our current management have limited experience operating a public company. We may not be able to operate successfully as a public company, even if our business operations are successful. Our inability to successfully operate as a public company could have a material adverse effect on our business, financial condition and operating results and on our ability to obtain equity or debt financing.
| 19 |
Risks Related to Ownership of Our Common Stock
An active trading market in our common stock may not develop or be adequately maintained, and our common stock may be subject to volatile price and volume fluctuations.
An active trading market in our common stock may not develop or be adequately maintained. Shares of our common stock are quoted on the OTC Bulletin Board Market system and are not listed on any stock exchange, which may limit your ability to sell your shares of our common stock. The overall market for securities in recent years has experienced extreme price and volume fluctuations that have particularly affected the market prices of many smaller companies. These fluctuations have been extremely volatile and are often unrelated or disproportionate to operating performance. Consequently, you may not be able to sell our common stock at prices equal to or greater than the price you paid for your shares. In addition to the factors discussed elsewhere in this section, many factors, most of which are outside of our control, could cause the market price of our common stock to decrease significantly, including:
| · | variations in our quarterly operating results; |
| · | decreases in market valuations of similar companies; |
| · | the failure of securities analysts to cover our common stock or changes in financial estimates by analysts who cover us, our competitors or our industry; and |
| · | fluctuations in stock market prices and volumes. |
These broad market fluctuations could result in extreme fluctuations in the price of our common stock, which could cause a decline in the value of our common stock.
Our quarterly results of operations may fluctuate in the future, which could result in volatility in our stock price.
Our quarterly revenues and results of operations have varied in the past and may fluctuate as a result of a variety of factors. If our quarterly revenues or results of operations fluctuate, the price of our common stock could decline substantially. Fluctuations in our results of operations may be due to a number of factors, including, but not limited to, those listed below and identified throughout this “Risk Factors” section:
| · | our ability to retain and increase sales to current customers and attract new customers, including our ability to maintain and increase our number of recurring revenue customers; |
| · | the timing and success of introductions of new solutions or upgrades by us or our competitors; |
| · | the strength of the economy, in particular as it affects globalization activity; |
| · | changes in our pricing policies or those of our competitors; |
| · | changes in the payment terms for our products and services; |
| · | the need for, and availability of, additional financing to support operations; |
| · | competition, including entry into the industry by new competitors and new offerings by existing competitors; and |
| · | the amount and timing of expenditures related to operating as a public company, expanding our operations, research and development, acquisitions, or introducing new solutions. |
| 20 |
Due to these and other factors, you should not rely on quarter-to-quarter comparisons of our results of operations as an indication of our future performance.
We may be unable to cause our securities to be listed on the NASDAQ Stock Market, which could limit investors’ ability to make transactions in our securities and subject stockholders to additional trading restrictions.
We intend to continue to be listed on the OTC Bulletin Board Market until such time we satisfy the relevant listing requirements to have our common stock listed on the NASDAQ Global Market or the NASDAQ Capital Market. However, there can be no assurance we will ever be able to meet NASDAQ’s initial listing requirements, in which case our securities may continue to be listed on the OTC Bulletin Board Market indefinitely.
If we are unable to cause our securities to be listed on the NASDAQ Stock Market, we and our stockholders could face significant material adverse consequences, including:
| · | a limited availability of market quotations for our securities; |
| · | a determination that our common stock is a “penny stock,” which will require brokers trading in our common stock to adhere to more stringent rules, possibly resulting in a reduced level of trading activity in the secondary trading market for our common stock; |
| · | a limited amount of news and analyst coverage; and |
| · | a decreased ability to issue additional securities or obtain additional financing in the future. |
Current members of our management own a significant percentage of the outstanding shares of our common stock, which could limit other stockholders’ influence on corporate matters.
Shannon Zimmerman and Angel Zimmerman, who are directors and executive officers, collectively own approximately 32.4% of the outstanding shares of our common stock. Accordingly, these individuals are able to exert substantial influence over our affairs, including the election and removal of directors and all other matters requiring stockholder approval, including the future merger, consolidation or sale of our company. This concentrated control could discourage others from initiating any potential merger, takeover, or other change-of-control transactions that may otherwise be beneficial to our stockholders. Furthermore, this concentrated control will limit the practical effect of the stockholders’ participation in our corporate matters, through stockholder votes and otherwise. As a result, the return on your investment in our common stock through the sale of your shares could be adversely affected.
Provisions in our charter documents, our Tax Benefit Preservation Plan, and Delaware law may inhibit a takeover, which could limit the price potential investors might be willing to pay in the future for our common stock and could entrench management.
Our certificate of incorporation and bylaws and our Tax Benefit Preservation Plan contain provisions that may discourage unsolicited takeover proposals that stockholders may consider to be in our best interests. Our board of directors has the ability to designate the terms of and issue new series of preferred stock which could be issued to create different or greater voting rights which may affect an acquiror’s ability to gain control of our company. Our Tax Benefit Preservation Plan, which is designed to protect our stockholder value and safeguard valuable tax attributes by reducing the likelihood of an unintended ownership change, could also discourage a change of control. As a Delaware corporation, we are subject to anti-takeover provisions under Delaware law, which could delay or prevent a change of control. Together, these provisions may make it more difficult to remove management and may discourage transactions that otherwise could involve payment of a premium over prevailing market prices for our shares.
| 21 |
Our certificate of incorporation grants our board of directors the power to designate and issue additional shares of common and preferred stock.
Pursuant to authority granted by our certificate of incorporation, our board of directors, without any action by our stockholders, may designate and issue shares in such classes or series (including classes or series of preferred stock) as it deems appropriate, and establish the rights, preferences, and privileges of such shares, including dividends, liquidation, and voting rights. The rights of holders of other classes or series of preferred stock that may be issued could be superior to the rights of our common stock. The designation and issuance of shares of capital stock having preferential rights could adversely affect other rights appurtenant to the shares of our common stock. Any issuances of additional capital stock (common or preferred), will dilute the percentage of ownership interest of our stockholders.
Our certificate of incorporation and bylaws limit directors’ liability to stockholders.
As permitted by Delaware law, our certificate of incorporation and bylaws provide that each director shall have no personal liability for monetary damages for any breach of fiduciary duties to us, subject to certain exceptions. These provisions may reduce the likelihood of derivative litigation against directors and may discourage stockholders from bringing a lawsuit against directors for any breach of our fiduciary duties.
We do not intend to pay dividends on our common stock for the foreseeable future.
We currently intend to retain all future earnings for the operation and expansion of our business and, therefore, do not anticipate declaring or paying cash dividends on our common stock in the foreseeable future. Any payment of cash dividends on our common stock will be at the discretion of our board of directors and will depend upon our results of operations, earnings, capital requirements, financial condition, future prospects, contractual restrictions and other factors deemed relevant by our board of directors. Therefore, you should not expect to receive dividend income from shares of our common stock.
ITEM 1B. UNRESOLVED STAFF COMMENTS
As a smaller reporting company, we are not required to provide disclosure pursuant to this item.
ITEM 2. PROPERTIES
Our primary operations are based in River Falls, Wisconsin, which is located approximately 30 miles east of Minneapolis, Minnesota. During 2011, we leased approximately 16,000 square feet of office space from River Valley Business Center, LLC (“RVBC”) under two leases which expire in January 2017. Rent for these facilities averaged approximately $24,000 per month. Effective February 28, 2012 we leased an additional 3,850 square feet from RVBC for additional rent of $5,000 per month. RVBC is a “related person” as defined in Item 404 of Regulation S-K of the SEC because it is controlled by Shannon and Angela Zimmerman, each of whom is an executive officer and a director of the Company.
Sajan Software leases approximately 1,000 square feet of office space in Dublin, Ireland. Sajan Spain leases approximately 1,000 square feet of office space in Madrid, Spain. Sajan Singapore leases approximately 600 square feet of space in Singapore. Sajan-India leases approximately 7,500 square feet of office space in New Delhi, India. Combined rents for these facilities averaged approximately $5,000 dollars per month during the year ended December 31, 2011. We believe all of our facilities are suitable and adequate for current operating needs.
| 22 |
ITEM 3. LEGAL PROCEEDINGS
Litigation by Sajan, Inc. Stockholder
On February 11, 2010, Mary Jo Natzel, a stockholder of Sajan, Inc., initiated a lawsuit against Shannon Zimmerman and Angel Zimmerman (the “Zimmermans”) and Sajan, Inc. in the Minnesota District Court, Hennepin County, Fourth Judicial District. Ms. Natzel sought declaratory, injunctive and monetary relief in an amount in excess of $50,000 against Sajan, Inc. and the Zimmermans in connection with the alleged underpayment to Ms. Natzel of distributions made by Sajan, Inc. while it was a corporation taxed under Subchapter S of the Internal Revenue Code and representations by the Zimmermans with respect to the amount of money invested in Sajan, Inc. On April 29, 2011 the parties resolved their dispute on mutually acceptable terms pursuant to a confidential settlement agreement.
Mary Jo Natzel did not participate in the Merger in February, 2010, and instead chose to dissent from the corporate action pursuant to Minnesota Statutes. On May 13, 2010, Sajan, Inc. tendered a check to Ms. Natzel in the amount of $366,942 in payment of the fair value of the shares tendered. On June 8, 2010, Sajan, Inc. received a letter which asserted that the fair value of Natzel’s shares was $495,372. Sajan, Inc. disputed the value claimed, and on November 1, 2010 filed a petition requesting the court to determine the fair value of the shares. On June 30, 2011 the parties resolved their dispute on mutually agreeable terms pursuant to a confidential agreement.
In addition to the foregoing, we may be subject to legal actions, proceedings and claims in the ordinary course of business. As of the date of this report management is not aware of any undisclosed actual or threatened litigation that would have a material adverse effect on our financial condition or results of operations.
| ITEM 4. | MINE SAFETY DISCLOSURES |
Not applicable.
| 23 |
PART II
| ITEM 5. | MARKET FOR REGISTRANT’S COMMON EQUITY, RELATED STOCKHOLDER MATTERS AND ISSUER PURCHASES OF EQUITY SECURITIES |
Our common stock is quoted on the OTC Bulletin Board system of the OTC Markets under the symbol SAJA. The last reported bid price for our common stock on March 15, 2012 was $1.16.
The following table shows the high and low bid prices for our common stock for the 2011 and 2010 fiscal quarters. The high and low closing bid prices reported on the OTC Bulletin Board reflect inter-dealer prices, without retail mark-up, mark-down or commission and may not necessarily reflect actual transactions.
| Market Price (high/low) | ||||||||
| For the Fiscal Year | 2011 | 2010 | ||||||
| First Quarter | $ | 1.40 – 0.85 | $ | 1.90 – 1.20 | ||||
| Second Quarter | $ | 2.16 – 1.20 | $ | 1.97 – 1.30 | ||||
| Third Quarter | $ | 1.60 – 0.65 | $ | 1.62 – 1.30 | ||||
| Fourth Quarter | $ | 1.50 – 1.01 | $ | 1.45 – 0.80 | ||||
As of March 7, 2012, we had approximately 132 record holders of our common stock, including the nominee of Depository Trust Company which held 9,989,600 shares as the nominee for street name holders
Dividend Policy
Holders of our common stock are entitled to receive such dividends as are declared by our board of directors out of funds legally available for the payment of dividends. We presently intend to retain any earnings to fund the development of our business. Accordingly, we do not anticipate paying any dividends on our common stock for the foreseeable future. Any future determination as to declaration and payment of dividends will be made at the discretion of our board of directors.
Sales of Unregistered Securities
None.
Purchases of Equity Securities by the Company
None.
Equity Compensation Plan Information
See Part III, Item 12, “Security Ownership of Certain Beneficial Owners and Management and Related Stockholder Matters.”
| ITEM 6. | SELECTED FINANCIAL DATA |
As a smaller reporting company, we are not required to provide disclosure pursuant to this item.
| 24 |
| ITEM 7. | MANAGEMENT’S DISCUSSION AND ANALYSIS OF FINANCIAL CONDITION AND RESULTS OF OPERATIONS |
The following discussion should be read in conjunction with the financial statements and related notes that appear elsewhere in this Annual Report on Form 10-K. This discussion contains forward-looking statements that involve significant uncertainties. Our actual results could differ materially from those anticipated in these forward-looking statements as a result of various factors, including those discussed in “Risk Factors” elsewhere in this report. For further information, see the section titled “Cautionary Notice Regarding Forward-Looking Statements” above.
Discussion of Critical Accounting Policies and Estimates
Discussion of the financial condition and results of our operations is based upon our consolidated financial statements, which have been prepared in accordance with U.S. GAAP. The preparation of these consolidated financial statements requires management to make estimates and assumptions that affect the reported amounts of assets, liabilities, revenues, costs and expenses, and related disclosures. On an ongoing basis, we evaluate our estimates and judgments, including those discussed below. These estimates are based on historical experience and on various other assumptions that are believed to be reasonable under the circumstances. The results of our analysis form the basis for making assumptions about the carrying values of assets and liabilities that are not readily apparent from other sources. Actual results may differ from these estimates under different assumptions or conditions, and the impact of such differences may be material to the consolidated financial statements.
Management believes the following critical accounting policies involve significant judgments and estimates in the preparation of our consolidated financial statements:
Revenue Recognition
The Company derives revenues primarily from language translation services and professional consulting services.
Translation services utilize the Company’s proprietary translation management system – GCMS — to provide a solution for all of the customer’s language translation requirements. Services include content analysis, translation memory and retrieval, language translation, account management, graphic design services, technical consulting and professional services. Services associated with translation of content are generally billed on a “per word” basis. Professional services, including technical consulting and project management are billed on a per hour rate basis.
In accordance with Financial Accounting Standard Board (“FASB”) and SEC accounting guidance on revenue recognition, the Company considers revenue earned and realizable at the time services are performed and amounts are earned. Sajan considers amounts to be earned when (1) persuasive evidence of an arrangement has been obtained; (2) services are delivered; (3) the fee is fixed or determinable; and (4) collectability is reasonably assured. Determination of criteria (3) and (4) are based on management’s judgments regarding the fixed nature of the fee charged for services rendered and products delivered and the collectability of those fees. The Company recognizes revenue for translations services on a standard “per word” basis at the time the translation is completed. The Company recognizes revenue for professional services when the services have been completed in accordance with the statement of work.
Sajan’s agreements with its customers may informally provide the customer with a limited time period following delivery during which the Company will attempt to address any non-conformity to previously agreed upon objective specifications relating to the work. Revenue is recognized as services are delivered in accordance with the terms of the agreement with the customer, are not contingent, and are earned.
Revenues recognized in excess of billings are recorded as unbilled services. Billings in excess of revenues recognized are recorded as deferred revenues to the extent cash has been received.
Income Taxes
Income taxes are provided for tax effects of transactions reported in the consolidated financial statements and consist of income taxes currently due plus deferred income taxes related to timing differences between the basis of certain assets and liabilities for financial statements and income tax reporting. Deferred taxes are determined based on the difference between the financial statement and tax basis of assets and liabilities using enacted tax rates in effect in the years in which the differences are expected to reverse. A valuation allowance for the net deferred tax assets is provided if, based upon the weight of available evidence, it is more likely than not that some or all of the deferred tax assets will not be realized.
| 25 |
We have an accumulated NOL carryforward of approximately $30.8 million for federal income tax purposes and approximately $8.4 million for state income tax purposes. The NOL carryforward amounts may be used to offset future income tax liabilities. Future utilization of available net operating loss carryforwards may be limited under Section 382 of the Internal Revenue Code of 1986, as amended (the “Code”) as a result of significant changes in ownership. These limitations could result in reduction of these net operating loss carryforwards before they are utilized. Based upon the provisions of Section 382 of the Code, as of December 31, 2011 approximately $1.6 million of net operating loss carryforwards are limited as to future use. The amount of these losses which are available in any one year is approximately $0.6 million. No limitations exist on the remaining $29.2 million of federal loss carryforwards. The Company is subject to Alternative Minimum Tax (AMT), which only allows for the utilization of existing NOL carryforwards to offset 90% of AMT taxable income.
The Company is allowed to issue shares in each year subsequent to the effective date of the Merger in an amount not to exceed 10% of the share count at the beginning of such year without violating the Section 382 of the Code change of control limitations, even if such issuance were to constitute a change of control as defined in Section 382 of the Code.
Property and Equipment
Property and equipment are recorded at cost and depreciated over their estimated useful lives, initially determined to be two to five years, using the straight-line method. Upon retirement or sale, the cost of assets disposed of and the related accumulated depreciation are removed from the accounts, and any resulting gain or loss is included in operating results. Repairs and maintenance costs are expensed as incurred.
Software Development Costs
Sajan capitalizes software development costs incurred during the application development stage related to new software or major enhancements to the functionality of existing software that is developed solely to meet the entity’s internal operational needs and when no substantive plans exist or are being developed to market the software externally. Costs capitalized include external direct costs of materials and services and internal payroll and payroll-related costs. Any costs during the preliminary project stage or related to training or maintenance are expensed as incurred. Capitalization ceases when the software project is substantially complete and ready for its intended use. The capitalization and ongoing assessment of recoverability of development costs requires considerable judgment by management with respect to certain external factors, including, but not limited to, technological and economic feasibility, and estimated economic life. When the projects are ready for their intended use, the Company amortizes such costs over their estimated useful lives of three years.
Long-lived Assets
The Company annually reviews its long-lived assets for events or changes in circumstances that may indicate that the carrying amount of a long-lived asset may not be recoverable or exceeds its fair value. The carrying amount of a long-lived asset is not recoverable if it exceeds the sum of the undiscounted cash flows expected to result from the use and eventual disposition of the asset. An impairment loss shall be measured as the amount by which the carrying amount of a long-lived asset exceeds its fair value. Fair value is defined as the price that would be received to sell an asset or paid to transfer a liability in an orderly transaction between market participants at the measurement date. The Company's long-lived assets, which include intangibles and patents, are subject to amortization.
Stock-based Compensation
We measure and recognize compensation expense for all stock-based compensation at fair value. Our determination of fair value of share-based compensation awards on the date of grant using an option-pricing model is affected by our stock price as well as assumptions regarding a number of variables. These variables include, but are not limited to, expected stock price volatility and actual and projected stock option exercise behaviors and forfeitures. An option’s expected term is the estimated period between the grant date and the exercise date of the option. As the expected term increases, the fair value of the option and the compensation cost will also increase. The expected-term assumption is generally calculated using historical stock option exercise data. We do not have historical exercise data to develop such an assumption. In cases where companies do not have historical data and where the options meet certain criteria, SEC Staff Accounting Bulletin 107 (“SAB 107”) provides the use of a simplified expected-term calculation. Accordingly, Sajan calculated the expected terms using the SAB 107 simplified method.
| 26 |
Management expects and estimates that substantially all employee stock options will vest, and therefore the forfeiture rate used was zero.
The risk-free rates for the expected terms of the stock options are based on the U.S. Treasury yield curve in effect at the time of grant.
Source of Revenues
We generate revenues by providing language translation services to customers for which we are paid based upon the number of words translated and by the languages involved. The price charged per word per language varies depending upon the language, the availability of translator resources and the extent to which our proprietary TMate search algorithm has been applied to reuse prior translation work. In some cases we may generate revenue by allowing customers to utilize our operating system, for which we will also receive revenue on a per word basis similar to our services business model based upon the number of words processed through our GCMS software platform.
Cost of Revenue
Cost of revenue is highly variable based upon the volume of translation services revenue. We work with freelance linguists who complete the actual language translation, and they are paid on a per word basis. The fixed component of cost of revenue is comprised of the global operations staff located in our River Falls, Wisconsin location and also in our Ireland, Spain and Singapore locations, who are responsible for project and process management, quality control, operational integration, vendor management and production operations. In the near term, our cost of revenues may be affected by a number of factors including the mix of customers, the mix of language translated, staff levels and the extent of new customer implementations in a given quarter. Over the long term, we expect cost of revenue will grow in absolute dollars, as we expect to continue to grow our revenue, but decrease as a percentage of revenue due to economies of scale, more efficient sourcing and operational efficiencies from ongoing utilization of our GCMS platform.
Sales and Marketing Expenses
Sales and marketing expense consists primarily of wages and benefits for sales and marketing personnel, sales commissions, advertising and promotional costs, sales and marketing tools and partner referral fees. Advertising costs consist of pay-per-click payments to search engines and print advertisements in trade journals. Advertising costs are expensed as incurred. Promotional costs consist primarily of public relations, memberships and event costs. As we move to accelerate our sales activities both domestically and internationally, and launch sales and marketing initiatives for our product solutions, we expect sales, advertising and marketing expense to increase in dollar terms but to decrease slightly as a percentage of total sales.
Research and Development Expenses
Research and development expenses represent costs incurred for development of routine enhancements to our operating software system, costs incurred during the preliminary project stage of development and costs incurred related to training or maintenance activities. Research and development expenses consist primarily of salaries and related costs of our software engineering organization including costs related to software development tools and licenses, fees paid to third party consultants and certain facility expenses. We expense all research and development as incurred.
| 27 |
We have focused our research and development efforts on the industrialization of the GCMS platform and its component modules for use by the various participants involved in the content globalization process. Functional development has focused on improving ease of use, functionality, scalability and efficiency of Translation Memory processing.
General and Administrative Expenses
General and administrative expenses consist primarily of wages and benefits for administrative, human resources, internal information technology support, finance and accounting personnel, professional fees, certain taxes and other corporate expenses. We expect that our general and administrative expenses will increase in absolute dollars but will decrease on a percentage of revenue.
Depreciation and Amortization
Depreciation and amortization consist of the expense related to property and equipment, capitalized software development costs, software license costs and intangible assets that are being depreciated or amortized over the estimated useful lives of the assets using the straight-line method. Intangible assets primarily relate to the value of customer lists obtained in the acquisition of New Global in October 2011.
Foreign Currency Translation
For operations in local currency environments, assets and liabilities are translated at year-end exchange rates with cumulative translation adjustments included as a component of shareholders’ equity and income and expense items are translated at average foreign exchange rates prevailing during the year. For operations in which the U.S. dollar is not considered the functional currency, certain financial statements amounts are re-measured at historical exchange rates, with all other asset and liability amounts translated at year-end exchange rates. These re-measured adjustments are reflected in the results of operations. Gains and losses from foreign currency transactions are included in the Consolidated Statements of Operations.
Results of Operations – Year Ended December 31, 2011 Compared to Year Ended December 31, 2010
For the year ended December 31, 2011, net income was $0.1 million compared to net loss of $3.0 million for the year ended December 31, 2010. Operating results for the year reflect a 31% increase in revenues driven by additional translation services and a 32% increase in cost of revenues which resulted from a shift in the mix of our business between customers and an increase in client services staff. As a result, our gross profit increased by $1.9 million or 30%. Operating expenses decreased from 2010 levels due to reductions in our sales and marketing costs and research and development costs, offset by increases in general and administrative costs related to expansion of our global operations and acquisition costs. In addition, net income in 2011 was positively affected by the sale of a non-utilized intellectual property portfolio which resulted in a non-recurring gain of approximately $550,000.
The major components of revenues, cost of revenue, operating expenses, other income (expense), and income tax benefit are discussed below.
| Twelve Months Ended December 31, | % Change | |||||||||||
| Item | 2011 | 2010 | (Year Over Year) | |||||||||
| Revenues | $ | 20,904,311 | $ | 15,990,596 | 30.7 | % | ||||||
| Operating expenses: | ||||||||||||
| Cost of revenues | 12,467,302 | 9,476,046 | 31.6 | % | ||||||||
| Sales and marketing | 2,545,309 | 3,006,396 | -15.3 | % | ||||||||
| Research and development | 1,622,564 | 1,716,461 | -5.5 | % | ||||||||
| General and administrative | 3,849,049 | 3,826,454 | 0.6 | % | ||||||||
| Acquisition | 95,481 | - | 100.0 | % | ||||||||
| Depreciation and amortization | 747,672 | 897,770 | -16.7 | % | ||||||||
| Other income (expense) | 502,053 | (93,286 | ) | -638.2 | % | |||||||
| Income tax expense | 12,000 | - | 100.0 | % | ||||||||
| Net income (loss) | $ | 66,987 | $ | (3,025,817 | ) | |||||||
| 28 |
Revenues
Revenues totaled $20.9 million for the year ended December 31, 2011 compared to $16.0 million for the year ended December 31, 2010. This $4.9 million or 30.7% increase resulted from an increase in the number of customers and the growth of business with existing customers.
Cost of Revenues
Cost of revenues increased $3.0 million, or 31.6% for the year ended December 31, 2011 compared to the year ended December 31, 2010. As a percentage of revenue, cost of revenues was 59.6% for the year ended December 31, 2011 compared to 59.3% for the year ended December 31, 2010. The increase in dollar terms resulted from additional costs to process the additional words translated, as well as additional costs associated with an increase in the operations staff in support of existing and anticipated growth. The cost of revenues as a percentage of revenue increased slightly primarily as a result of a shift in the mix of business between customers.
Cost of revenue excludes depreciation and amortization of $0.7 million and $0.9 million for the years ended December 31, 2011 and December 31, 2010, respectively, which are included in operating expenses.
Operating Expenses
Total operating expenses for the year ended December 31, 2011 were $8.9 million compared to $9.4 million for the year ended December 31, 2010. The major components of these costs were sales and marketing, research and development, general and administrative expenses, acquisition costs and depreciation and amortization expense. A discussion of the various components of our operating expenses for the year ended December 31, 2011 as compared with 2010 follows.
Sales and Marketing. Sales and marketing expense of approximately $2.5 million for the year ended December 31, 2011 decreased 15% from sales and marketing expense of approximately $3.0 million for the year ended December 31, 2010. The decrease primarily resulted from a $230,000 decrease in compensation costs related to a revision in the commission program, which reduced commissions on existing accounts and increased commission on new business, and a $240,000 decrease in regular sales compensation expense (cash and stock options) related to the restructuring of our domestic sales team late in 2010. In addition, advertising costs were lower in 2011. Offsetting these cost reductions were an increase in expenses related to sales and marketing tools. As a percentage of revenue, sales and marketing expense was 12.2% for the year ended December 31, 2011, a decrease from 18.8% for 2010, reflecting the economies of scale that result from an increase in revenues and a reduction in sales and marketing expenses.
Research and Development. Research and development expense of approximately $1.6 million decreased by $0.1 million or 6% for the year ended December 31, 2011 over research and development expense of $1.7 million for the year ended December 31, 2010. The decrease for the year ended December 31, 2011 is due to a realignment of our staff during 2011 which served to reduce our compensation costs. As a percentage of revenue, research and development expense decreased to 7.8% for the year ended December 31, 2011 compared to 10.7% for the year ended December 31, 2010.
| 29 |
General and Administrative. General and administrative expense was $3.8 million for both years ended December 31, 2011 and 2010. As a percentage of revenue, general and administrative expense was 18.4% for the year ended December 31, 2011 as compared with 23.9% for the year ended December 31, 2010. In 2010, we incurred approximately $500,000 of non-recurring merger related expenses including significant legal and accounting related professional fees, insurance expenses and printing and filing costs. Offsetting these cost reductions were increases in staff related compensation, stock based compensation, general and administrative expenses from our offices in Ireland, India, Spain, Canada and Singapore and increased travel costs.
Depreciation and Amortization. Depreciation and amortization expense was $0.7 million and $0.9 million for the years ended December 31, 2011 and 2010, respectively, a decrease of $.2 million, which is the result of lower amortization costs associated with our capitalized software and software licenses and lower depreciation costs. These decreases were offset by an increase in the amortization of intangible assets, primarily customer relationships, which were obtained in our acquisition of New Global in 2011. As a percentage of revenue, depreciation and amortization expense was 3.6% for the year ended December 31, 2011 as compared to 5.6% for the year ended December 31, 2010.
Acquisition. Acquisition costs incurred in 2011 relate to non-recurring legal and incremental general and administrative costs associated with completing the acquisition of New Global in 2011 and with the integration of those operations into our existing operations. These costs represented 0.5% of revenues in 2011.
Other Income (expense)
Sale of Patents. In 2011, we completed the sale of a portfolio of intellectual property that was acquired in the Merger in 2010 and recognized a gain on this sale of $551,000. The patents sold are not related to our language translation business. The sales price for the portfolio was $600,000 and we incurred legal and other costs associated with the sale of approximately $49,000.
Interest Expense. Interest expense for the year ended December 31, 2011 was approximately $73,000, a decrease from $111,000 for the year ended December 31, 2010. The decrease resulted from the repayment of a portion of the note to shareholders in 2011. Other income for the year ended December 31, 2011 was approximately $24,000 compared to $17,000 for the year ended December 31, 2010. Other income primarily relates to foreign currency transaction gains and interest income.
Income Taxes
Income tax expense in the year ended December 31, 2011 of $12,000 relates to alternative minimum tax obligations. There was no tax benefit or expense for the year ended December 31, 2010. In the future, the Company expects to continue to be in an alternative minimum tax situation as the rules associated with the Alternative Minimum Tax only allow for the utilization of existing Net Operating Losses to offset 90% of taxable income determined under the Alternative Minimum Tax rules.
Stock Based Compensation
Stock based compensation expense was $221,000 for the year ended December 31, 2011 as compared to $585,000 in 2010. In 2010, a substantial stock based compensation expense was recognized in connection with the Merger transaction.
| 30 |
Liquidity and Capital Resources
Summary cash flow data is as follows:
| Years Ended December 31, | ||||||||
| 2011 | 2010 | |||||||
| Cash flows provided (used) by : | ||||||||
| Operating activities | $ | 413,275 | $ | (2,079,313 | ) | |||
| Investing activities | 1,139,879 | 4,707,991 | ||||||
| Financing activities | (1,541,774 | ) | (850,984 | ) | ||||
| Net increase (decrease) in cash | (11,380 | ) | 1,777,694 | |||||
| Effect of exchange rate changes in cash | (151,360 | ) | 5,042 | |||||
| Cash and equivalents, beginning of year | 1,903,229 | 120,493 | ||||||
| Cash and equivalents, end of year | $ | 1,763,249 | $ | 1,903,229 | ||||
Net Cash Provided by (Used in) Operating Activities
Net cash provided by operating activities for the year ended December 31, 2011 was $0.4 million, as non cash expenses of $0.9 million were offset by the gain on the sale of the patents of $0.5 million, which is not considered to be an operating activity. Net cash used by operating activities for the year ended December 31, 2010 of $2.1 million was a result of significant cash expenses primarily to facilitate our Merger transaction, to fund our growth and expand our operations internationally. Non cash expenses of nearly $1.5 million significantly offset our operating loss of $3.0 million.
Net Cash Provided by Investing Activities
Net cash of $1.1 million provided by investing activities for the year ended December 31, 2011 resulted from the release of funds from a restricted escrow account ($1.0 million), a portion of which was used to satisfy a note payable to former shareholders (as discussed below) and cash proceeds from the sale of the old patent portfolio ($0.5 million), offset by cash used to acquire New Global, to purchase property and equipment, and to satisfy a dissenting shareholder claim. Net cash of $4.7 million provided by investing activities for the year ended December 31, 2010 primarily related to cash acquired in the Merger transaction.
Net Cash (Used in) Financing Activities
Net cash of $1.5 million used in financing activities for the year ended December 31, 2011 related to repayment of notes payable – indemnification obligation of $1.0 million, repayment of $0.25 million of the note payable to former shareholders and repayment of $0.3 million of debt assumed in connection with an acquisition. Net cash of $0.85 million used in financing activities for the year ended December 31, 2010 primarily related to payments for Merger-related costs and repayment of short-term debt.
Sources of Capital
For the year ended December 31, 2011, our principal source of liquidity was funds generated from operations, cash received as part of the Merger and cash received from the sale of the intellectual property portfolio.
In March 2012 we entered into a one-year revolving working capital line of credit with Silicon Valley Bank (“SVB”), which permits borrowings up to a principal amount equal to the lesser of (a) $1,500,000 or (b) 80% of the aggregate amount of our outstanding eligible domestic accounts receivable, subject to customary limitations and exceptions (the “Credit Facility”). As of March 29, 2012, no borrowings had been drawn under the Credit Facility. Interest on the principal amount outstanding under the Credit Facility accrues at a floating rate equal to the greater of 50 basis points above the U.S. prime rate and 4.0%, and is payable monthly on the first calendar day of each month. The outstanding principal amount of any borrowings under the Credit Facility, along with any accrued and unpaid interest thereon, is payable on the maturity date, March 28, 2013. The facility is governed by the terms of a Loan and Security Agreement (the “Loan Agreement”) which requires compliance with certain financial and other covenants, is secured by all of our domestic assets, except intellectual property (which we agreed not to pledge to others), and is guaranteed on an unsecured basis by certain of our subsidiaries. The Loan Agreement contains customary events of default, which, if triggered, would permit SVB to exercise customary remedies such as acceleration of all then-outstanding obligations arising under the Loan Agreement. In connection with the Loan Agreement, we extended the maturity date of a promissory note issued by us to Angel and Shannon Zimmerman in the original aggregate principal amount of $1,000,000 (the “Zimmerman Note”). The remaining principal balance of $750,000 under the Zimmerman Note is now due August 23, 2013. For a more detailed description of the Credit Facility, Loan Agreement and amendment to the Zimmerman Note, please refer to Part II, Item 9B of this Annual Report on Form 10-K.
Uses of Capital
Sajan’s primary uses of capital resources for the year ended December 31, 2011 were to fund operating activities, expand business operations internationally, acquire New Global and repay debt. Our commitments and contingencies are described in more detail in Note 13 to our financial statements, included in Part II, Item 8 of this Annual Report on Form 10-K.
We intend to utilize our current capital resources to support our business, including 1) ongoing sales and marketing activities both domestically and internationally, 2) investments in our translation management system, and 3) purchasing strategic companies that may add to our operations and client base.
| 31 |
We believe that our cash and cash equivalents, operating cash flows, and proceeds for our new credit facility will be sufficient to meet our working capital and capital expenditure requirements for at least the next 12 months. Thereafter, we may need to raise additional funds through public or private financings or borrowings to fund our operations, to develop or enhance products, to fund expansion, to respond to competitive pressures or to acquire complementary products, businesses or technologies.
If required, additional financing may not be available on terms that are favorable to us, if at all. If we raise additional funds through the issuance of equity or convertible debt securities, the percentage ownership of our stockholders will be reduced and these securities might have rights, preferences and privileges senior to those of our current stockholders or we may be subject to covenants that restrict how we conduct our business. No assurance can be given that additional financing will be available or that, if available, such financing can be obtained on terms favorable to our stockholders and us.
Off-Balance Sheet Arrangements
The Company had no off-balance sheet arrangements as of December 31, 2011.
| ITEM 7A. | QUANTITATIVE AND QUALITATIVE DISCLOSUORES ABOUT MARKET RISK |
As a smaller reporting company, we are not required to provide disclosure pursuant to this item.
| 32 |
ITEM 8. FINANCIAL STATEMENTS AND SUPPLEMENTARY DATA
REPORT OF INDEPENDENT REGISTERED PUBLIC ACCOUNTING FIRM
To the Stockholders, Audit Committee and Board of Directors
Sajan, Inc.
River Falls, WI
We have audited the accompanying consolidated balance sheets of Sajan, Inc. and Subsidiaries as of December 31, 2011 and 2010, and the related consolidated statements of operations, stockholders’ equity and cash flows for the years then ended. These consolidated financial statements are the responsibility of the company’s management. Our responsibility is to express an opinion on these consolidated financial statements based on our audits.
We conducted our audits in accordance with the standards of the Public Company Accounting Oversight Board (United States). Those standards require that we plan and perform the audit to obtain reasonable assurance about whether the consolidated financial statements are free of material misstatement. The company is not required to have, nor were we engaged to perform, an audit of its internal control over financial reporting. Our audits included consideration of its internal control over financial reporting as a basis for designing audit procedures that are appropriate in the circumstances, but not for the purpose of expressing an opinion on the effectiveness of the company’s internal control over financial reporting. Accordingly, we express no such opinion. An audit includes examining, on a test basis, evidence supporting the amounts and disclosures in the consolidated financial statements. An audit also includes assessing the accounting principles used and significant estimates made by management as well as evaluating the overall consolidated financial statement presentation. We believe that our audits provide a reasonable basis for our opinion.
In our opinion, the consolidated financial statements referred to above present fairly, in all material respects, the financial position of Sajan, Inc. and Subsidiaries as of December 31, 2011 and 2010 and the results of their operations and cash flows for the years then ended, in conformity with U.S. generally accepted accounting principles.
/s/ Baker Tilly Virchow Krause, LLP
Minneapolis,
Minnesota
March 30, 2012
| 33 |
Sajan, Inc. and Subsidiaries
CONSOLIDATED BALANCE SHEETS
| December 31, | ||||||||
| 2011 | 2010 | |||||||
| Assets | ||||||||
| Current assets: | ||||||||
| Cash and cash equivalents | $ | 1,763,249 | $ | 1,903,229 | ||||
| Restricted cash | - | 1,000,000 | ||||||
| Accounts receivable, net of allowance of $15,000 | 3,501,898 | 3,267,120 | ||||||
| Deferred tax asset, net of allowance | 54,180 | 54,180 | ||||||
| Unbilled services | 823,617 | 625,661 | ||||||
| Prepaid expenses and other current assets | 415,794 | 138,980 | ||||||
| Total current assets | 6,558,738 | 6,989,170 | ||||||
| Property and equipment, net | 758,440 | 747,540 | ||||||
| Other assets: | ||||||||
| Intangible assets, net | 944,791 | 178,915 | ||||||
| Capitalized software development costs, net | 123,003 | 460,931 | ||||||
| Other assets | 32,820 | 27,649 | ||||||
| Total other assets | 1,100,614 | 667,495 | ||||||
| Total assets | $ | 8,417,792 | $ | 8,404,205 | ||||
| Liabilities and Stockholders’ Equity | ||||||||
| Current liabilities: | ||||||||
| Current portion of capital lease obligation | $ | 26,039 | $ | - | ||||
| Note payable – related party | - | 250,000 | ||||||
| Note payable – indemnification escrow | - | 1,000,000 | ||||||
| Acquisition liability - due to sellers | 331,131 | - | ||||||
| Accounts payable | 2,507,490 | 2,520,680 | ||||||
| Accrued interest – related party | 51,123 | 68,164 | ||||||
| Accrued compensation and benefits | 665,793 | 481,136 | ||||||
| Accrued liabilities | 167,230 | 280,457 | ||||||
| Deferred revenue | 875,017 | 319,964 | ||||||
| Total current liabilities | 4,623,823 | 4,920,401 | ||||||
| Long-term liabilities: | ||||||||
| Capital lease obligation, net of current portion | 38,528 | - | ||||||
| Note payable – related party | 750,000 | 750,000 | ||||||
| Total long-term liabilities | 788,528 | 750,000 | ||||||
| Total liabilities | 5,412,351 | 5,670,401 | ||||||
| Commitments and contingencies | ||||||||
| Stockholders’ equity: | ||||||||
| Preferred stock, $.01 par value, 10,000,000 shares authorized and no shares issued outstanding | - | - | ||||||
| Common stock, $.01 par value, 35,000,000 shares authorized; 16,165,970 and 16,009,331 issued and outstanding at December 31, 2011 and 2010 | 161,659 | 160,093 | ||||||
| Additional paid-in capital | 6,695,069 | 6,339,183 | ||||||
| Accumulated deficit | (3,676,350 | ) | (3,743,337 | ) | ||||
| Accumulated other comprehensive loss: | ||||||||
| Foreign currency adjustment | (174,937 | ) | (22,135 | ) | ||||
| Total stockholders’ equity | 3,005,441 | 2,733,804 | ||||||
| Total liabilities and stockholders’ equity | $ | 8,417,792 | $ | 8,404,205 | ||||
See notes to consolidated financial statements.
| 34 |
Sajan, Inc. and Subsidiaries
CONSOLIDATED STATEMENTS OF OPERATIONS
| Year Ended December 31, | ||||||||
| 2011 | 2010 | |||||||
| Revenues: | ||||||||
| Translation and consulting income | $ | 20,904,311 | $ | 15,990,596 | ||||
| Operating expenses: | ||||||||
| Cost of revenues (exclusive of depreciation and amortization) | 12,467,302 | 9,476,046 | ||||||
| Sales and marketing | 2,545,309 | 3,006,396 | ||||||
| Research and development | 1,622,564 | 1,716,461 | ||||||
| General and administrative | 3,849,049 | 3,826,454 | ||||||
| Depreciation and amortization | 747,672 | 897,770 | ||||||
| Acquisition expense | 95,481 | - | ||||||
| Total operating expenses | 21,327,377 | 18,923,127 | ||||||
| Loss from operations | (423,066 | ) | (2,932,531 | ) | ||||
| Other income (expense): | ||||||||
| Interest expense | (72,679 | ) | (110,602 | ) | ||||
| Net gain on sale of patents | 550,775 | - | ||||||
| Interest and other income | 5,630 | 29,984 | ||||||
| Other expense (income) | 18,327 | (12,668 | ) | |||||
| Total other income (expense), net | 502,053 | (93,286 | ) | |||||
| Net Income (loss) before income taxes | 78,987 | (3,025,817 | ) | |||||
| Income tax expense (benefit) | 12,000 | - | ||||||
| Net income (loss) | $ | 66,987 | $ | (3,025,817 | ) | |||
| Income (loss) per common share – basic | $ | .00 | $ | (0.20 | ) | |||
| Weighted average shares outstanding – basic | 16,051,259 | 14,999,186 | ||||||
| Income (loss) per common share – diluted | $ | .00 | $ | (0.20 | ) | |||
| Weighted average shares outstanding – diluted | 16,341,340 | 14,999,186 | ||||||
See notes to consolidated financial statements.
| 35 |
Sajan Inc. and Subsidiaries
CONSOLIDATED STATEMENTS OF STOCKHOLDERS’ EQUITY
| For the years ended December 31, 2011 and 2010 |
| Common Shares | Common Stock | Additional Paid-In Capital | Accumulated other comprehensive loss | Non- controlling interest in equity of affiliate and subsidiary | Retained earnings (accumulated deficit) | Total | ||||||||||||||||||||||
| Balances at December 31, 2009 | 5,686,250 | $ | 56,863 | $ | 1,919,161 | $ | (22,896 | ) | $ | 218,201 | $ | (709,393 | ) | $ | 1,461,936 | |||||||||||||
| Net loss | - | - | - | - | (3,025,817 | ) | (3,025,817 | ) | ||||||||||||||||||||
| Issuance of shares in merger transaction | 10,323,081 | 103,230 | 3,835,240 | - | - | - | 3,938,470 | |||||||||||||||||||||
| Deconsolidation of affiliate and subsidiary | - | - | - | - | (218,201 | ) | (8,127 | ) | (226,328 | ) | ||||||||||||||||||
| Stock-based compensation | - | - | 584,782 | - | - | - | 584,782 | |||||||||||||||||||||
| Other comprehensive loss on foreign currency adjustment | - | - | - | 761 | - | - | 761 | |||||||||||||||||||||
| Balances at December 31, 2010 | 16,009,331 | 160,093 | 6,339,183 | (22,135 | ) | - | (3,743,337 | ) | 2,733,804 | |||||||||||||||||||
| Net income | - | - | - | - | - | 66,987 | 66,987 | |||||||||||||||||||||
| Exercise of Stock Options/Warrants | 18,468 | 184 | 8,223 | - | - | - | 8,407 | |||||||||||||||||||||
| Issuance of share for acquisition | 138,171 | 1,382 | 157,307 | - | - | - | 158,689 | |||||||||||||||||||||
| Cash returned from dissenter shares | - | - | (30,210 | ) | - | - | - | (30,210 | ) | |||||||||||||||||||
| Stock-based compensation | - | - | 220,566 | - | - | - | 220,566 | |||||||||||||||||||||
| Other comprehensive loss on foreign currency adjustment | - | - | - | (152,802 | ) | - | - | (152,802 | ) | |||||||||||||||||||
| Balances at December 31, 2011 | 16,165,970 | $ | 161,659 | $ | 6,695,069 | $ | (174,937 | ) | $ | - | $ | (3,676,350 | ) | $ | 3,005,441 | |||||||||||||
See notes to consolidated financial statements.
| 36 |
Sajan, Inc. and Subsidiaries
CONSOLIDATED STATEMENT OF CASH FLOWS
| Year ended December 31, | ||||||||
| 2011 | 2010 | |||||||
| Cash flows from operating activities: | ||||||||
| Net income (loss) | $ | 66,987 | $ | (3,025,817 | ) | |||
| Adjustments to reconcile net income (loss) to net cash from operating activities: | ||||||||
| Amortization of capitalized software costs | 331,411 | 498,002 | ||||||
| Amortization of license costs | 147,889 | 160,119 | ||||||
| Depreciation | 268,372 | 239,649 | ||||||
| Stock-based compensation expense | 220,566 | 584,782 | ||||||
| Net gain on sale of patents | (550,775 | ) | - | |||||
| Gain on lease termination | (36,568 | ) | - | |||||
| Change in allowance for doubtful accounts | - | 5,000 | ||||||
| Decrease (increase) in current assets: | ||||||||
| Accounts receivable | 50,588 | (517,833 | ) | |||||
| Unbilled services | (197,956 | ) | (368,964 | ) | ||||
| Prepaid expenses and other current assets | (272,769 | ) | (89,987 | ) | ||||
| Other assets | 2,463 | 493 | ||||||
| Increase (decrease) in current liabilities: | ||||||||
| Accounts payable | (278,913 | ) | 984,066 | |||||
| Accrued interest – related party | (17,041 | ) | 68,195 | |||||
| Accrued compensation and benefits | 184,657 | (23,948 | ) | |||||
| Accrued liabilities | (60,689 | ) | (576,576 | ) | ||||
| Deferred revenue | 555,053 | (16,494 | ) | |||||
| Net cash flows provided by (used in) operating activities | 413,275 | (2,079,313 | ) | |||||
| Cash flows from investing activities: | ||||||||
| Purchases of property and equipment | (194,837 | ) | (198,577 | ) | ||||
| Release of restrictions of escrow funds | 1,000,000 | - | ||||||
| Cash paid for purchase of company | (158,689 | ) | - | |||||
| Purchases of intangible assets | (1,359 | ) | (2,051 | ) | ||||
| Capitalized software development costs | - | (81,816 | ) | |||||
| Cash acquired in acquisition and merger transactions | 14,375 | 5,472,000 | ||||||
| Payment for security deposit | (20,386 | ) | (15,406 | ) | ||||
| Payment to dissenter | (50,000 | ) | (366,943 | ) | ||||
| Proceeds from sale of patents | 550,775 | - | ||||||
| Deconsolidation of affiliate | - | (99,216 | ) | |||||
| Net cash flows provided by investing activities | 1,139,879 | 4,707,991 | ||||||
| Cash flows from financing activities: | ||||||||
| Payments on note payable – related party | (250,000 | ) | (285,645 | ) | ||||
| Payments on note payable – indemnification escrow | (1,000,000 | ) | - | |||||
| Payments on merger costs | - | (540,254 | ) | |||||
| Payments on capital lease obligation | (14,793 | ) | (10,514 | ) | ||||
| Payments on mortgage long-term liability | - | (14,571 | ) | |||||
| Repayment of debt acquired | (305,178 | ) | - | |||||
| Escrow proceeds returned for dissenter shares | 19,790 | - | ||||||
| Proceeds from common stock issuance | 8,407 | - | ||||||
| Net cash flows used in financing activities | (1,541,774 | ) | (850,984 | ) | ||||
| Net increase (decrease) in cash and cash equivalents | 11,380 | 1,777,694 | ||||||
| Effect of exchange rate changes in cash | (151,360 | ) | 5,042 | |||||
| Cash and cash equivalents – beginning of year | 1,903,229 | 120,493 | ||||||
| Cash and cash equivalents – end of year | $ | 1,763,249 | $ | 1,903,229 | ||||
| Cash paid for interest, net of amortization of loan fees | $ | 89,720 | $ | 65,853 | ||||
| Non-cash investing and financing transactions: | ||||||||
| Note payable – related party acquired in merger | $ | $ | 1,000,000 | |||||
| Short-term note payable – indemnification escrow and restricted cash acquired in merger | $ | - | $ | 1,000,000 | ||||
| Reduction in line of credit via merger transaction | $ | - | $ | 1,000,000 | ||||
| Dissenter accrual acquired in merger transaction | $ | - | $ | 364,000 | ||||
| Common stock issued for purchase of company (See Note 3) | $ | 158,689 | $ | - | ||||
| Debt acquired in acquisition (See Note 3) | $ | 305,178 | $ | - | ||||
| Purchase of fixed assets via capital lease obligation | $ | 79,360 | $ | - | ||||
See notes to consolidated financial statements.
| 37 |
Sajan, Inc. and Subsidiaries
Notes to Consolidated Financial Statements
| 1. | Nature of Business |
Sajan, Inc. (the “Company” or “Sajan”), a Delaware corporation, provides language translation services and technology solutions to companies located throughout the world, particularly in the technology, consumer products, medical and life sciences, financial services, manufacturing, government, and retail industries that are selling products into global markets. The Company is located in River Falls, Wisconsin. In 2009, we established Sajan Software Ltd (“Sajan Software”), which is based in Dublin, Ireland. The Ireland facility serves as both a Global Language Service Center and is home to Sajan Software, the producer of Sajan’s technology tools. Sajan India Software Private Limited (“Sajan India”), based in Delhi, India, houses our software development center. In 2010, we also established a Global Language Service Center in Spain, Sajan Spain S.L A (“Sajan Spain”), to serve the European market. In 2011, we established a Global Language Service Center in Singapore, Sajan Singapore Pte. Ltd. (“Sajan Singapore”), to serve the Asia Pacific market. In addition, in 2011 we acquired companies in Spain (“New Global Europe”) and Canada (“New Global Canada”) (See Note 3). All of these operations are wholly-owned subsidiaries of Sajan.
Pursuant to an Agreement and Plan of Merger (the “Merger Agreement”) dated January 8, 2010, by and among MathStar, Inc., a Delaware corporation, and Sajan, Inc. a privately held Minnesota corporation whose business is providing language translation technology and service; Garuda Acquisition, LLC, a wholly-owned subsidiary of MathStar, now known as Sajan, LLC; and Thomas Magne, solely in his capacity as agent for the holders of common stock of Sajan, Inc., Sajan, Inc. was merged with and into Garuda Acquisition, LLC, (the “Merger”). Garuda Acquisition, LLC (“Garuda”) was the surviving entity in the Merger and subsequently changed its name to Sajan, LLC. As a result of the Merger, Sajan became a wholly-owned subsidiary of MathStar. MathStar will continue the business of Sajan and operate as a provider of language translation technology and service under the Sajan name. The Merger was closed and effective on February 23, 2010.
For accounting purposes, Sajan was treated as the continuing reporting entity that acquired MathStar because Sajan obtained effective control of MathStar as a result of the Merger. This determination was based on the following facts: Sajan stockholders have a large minority interest in the combined entity, the governing board consists of a majority of Sajan board members, and the composition of the senior management will be Sajan’s management team. Under this method of accounting, the recognition and measurement provisions of the accounting guidance for business combinations do not apply and, therefore, there is no recognition of goodwill or other intangible assets. Instead, the acquisition has been treated as the equivalent of Sajan issuing stock for the net monetary assets of MathStar, primarily cash, which are stated at their carrying value.
The Merger Agreement provided for $1 million to be placed in an escrow account with an escrow agent, which funds would be utilized to fulfill the indemnification obligations of the pre-Merger Sajan stockholders through February 23, 2011. This amount is presented as restricted cash and a note payable – indemnification escrow of $1 million as of December 31, 2010 on the consolidated balance sheets. The $1 million escrow balance at February 23, 2011 was distributed to the pre-Merger Sajan stockholders as provided in the escrow agreement and the Merger Agreement.
| 2. | Summary of Significant Accounting Policies |
Principles of Consolidation
The accompanying consolidated financial statements include the accounts of Sajan, Inc. and its wholly-owned subsidiaries, Sajan Software, Sajan India, Sajan Spain, Sajan Singapore, New Global Europe and New Global Canada from the effective date of their acquisition or formation.
| 38 |
All significant intercompany accounts and transactions have been eliminated in the consolidated financial statements.
Cash and Cash Equivalents
The Company considers all highly liquid investments with an original maturity of three months or less at the date of purchase to be cash equivalents.
Fair Value of Financial Instruments
The carrying amounts of the Company’s financial instruments, which include cash equivalents, accounts receivable, accounts payable and other accrued expenses, approximate their fair values due their short maturities and/or market-consistent interest rates.
Accounts Receivable
The Company extends unsecured credit to customers in the normal course of business. The Company provides an allowance for doubtful accounts when appropriate, the amount of which is based upon a review of outstanding receivables, historical collection information, and existing economic conditions, on an individual customer basis. Normal accounts receivable are due 30 days after issuance of the invoice. Receivables are written off only after all collection attempts have failed, and are based on individual credit evaluation and specific circumstances of the customer. Accounts receivable have been reduced by an allowance for uncollectible accounts of approximately $15,000 at both December 31, 2011 and 2010. Management believes all accounts receivables in excess of the allowance are fully collectible. The Company does not accrue interest on accounts receivable.
Income / Loss Per Common Share
Basic earnings (loss) per share is computed based on the weighted average number of common shares outstanding. Basic per share amounts are computed, generally, by dividing net income (loss) by the weighted average number of common shares outstanding.
Diluted earnings (loss) per share is computed based on the weighted average number of common shares outstanding adjusted by the number of additional shares that would have been outstanding had the potentially dilutive common shares been issued. Potentially dilutive shares of common stock include unexercised stock options and warrants. Diluted per share amounts assume the conversion, exercise or issuance of all potential common stock instruments unless their effect is anti-dilutive, thereby reducing the loss or increasing the income per common share. In calculating diluted weighted average shares and per share amounts, stock options and warrants with exercise prices below average market prices, for the respective fiscal years in which they were dilutive, are considered to be outstanding using the treasury stock method. The treasury stock method requires the calculation of the number of additional shares by assuming the outstanding stock options and warrants were exercised and that the proceeds from such exercises were used to acquire common stock at the average market price during the year. In the event that the Company is in a net loss situation, all options and warrants outstanding are excluded from the diluted weighted average share outstanding calculation as the effect of these options is anti-dilutive.
For the year ended December 31, 2011 we excluded options to purchase 649,667 and warrants to purchase 50,004 shares from the diluted weighted average share outstanding calculation because the inclusion of these shares would have been anti-dilutive. For the year ended December 31, 2010, we excluded options to purchase 836,646 shares and warrants to purchase 557,195 shares from the diluted weighted average share outstanding calculation because the Company had a net loss and inclusion of these shares would have been anti-dilutive.
| 39 |
A reconciliation of the denominator in the basic and diluted income or loss per share is as follows:
| Year Ended December 31, 2011 | Year Ended December 31, 2010 | |||||||
| Numerator: | ||||||||
| Net income (loss) | $ | 66,987 | $ | (3,025,817 | ) | |||
| Denominator: | ||||||||
| Weighted average common shares outstanding - basic | 16,051,529 | 14,999,186 | ||||||
| Income (loss) per common share – basic | $ | 0.00 | $ | (0.20 | ) | |||
| Weighted average common shares outstanding – diluted | 16,341,340 | 14,999,186 | ||||||
| Income (loss) per common share – diluted | $ | 0.00 | $ | (0.20 | ) | |||
Property and Equipment
Property and equipment are recorded at cost and depreciated over their estimated useful lives, initially determined to be two to seven years, using the straight-line method. Upon retirement or sale, the cost of assets disposed of and the related accumulated depreciation are removed from the accounts, and any resulting gain or loss is included in operating results. Repairs and maintenance costs are expensed as incurred.
Long-lived Assets
The Company annually reviews its long-lived assets for events or changes in circumstances that may indicate that the carrying amount of a long-lived asset may not be recoverable or exceeds its fair value. The carrying amount of a long-lived asset is not recoverable if it exceeds the sum of the undiscounted cash flows expected to result from the use and eventual disposition of the asset. An impairment loss shall be measured as the amount by which the carrying amount of a long-lived asset exceeds its fair value. Fair value is defined as the price that would be received to sell an asset or paid to transfer a liability in an orderly transaction between market participants at the measurement date. The Company's long-lived assets, which include intangibles and patents, are subject to amortization. There was no impairment for the years ended December 31, 2011 and 2010.
Capitalized Software Development Costs
Sajan capitalizes software development costs incurred during the application development stage related to new software or major enhancements to the functionality of existing software that is developed solely to meet the entity’s internal operational needs and when no substantive plans exist or are being developed to market the software externally. Costs capitalized include external direct costs of materials and services and internal payroll and payroll-related costs. Any costs during the preliminary project stage or related to training or maintenance are expensed as incurred. Capitalization ceases when the software project is substantially complete and ready for its intended use. The capitalization and ongoing assessment of recoverability of development costs requires considerable judgment by management with respect to certain external factors, including, but not limited to, technological and economic feasibility, and estimated economic life.
| 40 |
When the projects are ready for their intended use, the Company amortizes such costs over their estimated useful lives of three years. Capitalized software amortization expense for the years ended December 31, 2011 and 2010 was $331,411 and $498,002, respectively. Estimated amortization expense for capitalized software costs for the years ending December 31, 2012, and 2013 are expected to be approximately, $115,000, and $8,000, respectively.
Stock-Based Compensation
The Company measures and recognizes compensation expense for all stock-based compensation at fair value. The Company recognizes stock-based compensation costs on a straight-line basis over the requisite service period of the award, which is generally the option vesting term. For the years ended December 31, 2011 and 2010, total stock-based compensation expense was approximately $221,000 ($0.01 per share) and $585,000 ($0.04 per share), respectively. As of December 31, 2011, there was approximately $560,000 of total unrecognized compensation cost related to non-vested share-based compensation arrangements granted under the Company’s 2004 Long-Term Incentive Plan. That cost is expected to be recognized over a weighted-average period of three years. This is an estimate based on options currently outstanding, and therefore this projected expense could be more in the future.
The Company’s determination of fair value of share-based compensation awards on the date of grant using an option-pricing model is affected by the Company’s stock price as well as assumptions regarding a number of variables. These variables include, but are not limited to; the Company’s expected stock price volatility, and actual and projected stock option exercise behaviors and forfeitures. An option’s expected term is the estimated period between the grant date and the exercise date of the option. As the expected term increases, the fair value of the option and the compensation cost will also increase. The expected-term assumption is generally calculated using historical stock option exercise data; however the Company does not have historical exercise data to develop such an assumption. As a result, the Company determined the expected term assumption using the simplified expected-term calculation as provided in SEC Staff Accounting Bulletin 107.
The Company calculates expected volatility for stock options and awards using its own stock price. Management expects and estimates substantially all director and employee stock options will vest, and therefore the forfeiture rate used is zero. The risk-free rates for the expected terms of the stock options are based on the U.S. Treasury yield curve in effect at the time of grant.
In determining the compensation cost of the options granted during 2011 and 2010, the fair value of each option grant has been estimated on the date of grant using the Black-Scholes option pricing model, and the weighted average assumptions used in these calculations are summarized as follows:
| 2011 | 2010 | |||||||
| Risk-free interest rate | 1.9 | % | 1.2 | % | ||||
| Expected life of options granted | 7 years | 4.6 years | ||||||
| Expected volatility range | 60 | % | 61 | % | ||||
| Expected dividend yield | - | % | - | % | ||||
Using the Black-Scholes option pricing model, management has determined that the options and warrants issued in 2011 and 2010 have a weighted-average grant date fair value of $1.34 and $1.45 per share, respectively.
Revenue Recognition
The Company derives revenues primarily from language translation services and professional consulting services.
Translation services utilize the Company’s proprietary translation management system – GCMS — to provide a solution for all of the customer’s language translation requirements. Services include content analysis, translation memory and retrieval, language translation, account management, graphic design services, technical consulting and professional services. Services associated with translation of content are generally billed on a “per word” basis. Professional services, including technical consulting and project management are billed on a per hour rate basis.
| 41 |
In accordance with Financial Accounting Standard Board (“FASB”) and SEC accounting guidance on revenue recognition, the Company considers revenue earned and realizable at the time services are performed and amounts are earned. Sajan considers amounts to be earned when (1) persuasive evidence of an arrangement has been obtained; (2) services are delivered; (3) the fee is fixed or determinable; and (4) collectability is reasonably assured. Determination of criteria (3) and (4) are based on management’s judgments regarding the fixed nature of the fee charged for services rendered and products delivered and the collectability of those fees. The Company recognizes revenue for translations services on a standard “per word” basis at the time the translation is completed. The Company recognizes revenue for professional services when the services have been completed in accordance with the statement of work.
Sajan’s agreements with its customers may informally provide the customer with a limited time period following delivery during which the Company will attempt to address any non-conformity to previously agreed upon objective specifications relating to the work. Revenue is recognized as services are delivered in accordance with the terms of the agreement with the customer, are not contingent, and are earned.
Revenues recognized in excess of billings are recorded as unbilled services. Billings in excess of revenues recognized are recorded as deferred revenues to the extent cash has been received.
Cost of Revenues
Cost of revenues consists primarily of expenses incurred for translation services provided by third parties as well as salaries and associated employee benefits for personnel related to client projects. Cost of revenues excludes depreciation and amortization which is presented separately as a component of operating expenses.
Research and Development
Research and development expenses represent costs incurred for development of routine enhancements to our operating software system and include costs incurred during the preliminary project stage of development or related to training or maintenance activities. Research and development expenses consist primarily of salaries and related costs of our software engineering organization, fees paid to third party consultants and certain facility expenses. We expense all research and development as incurred.
Advertising Costs
The majority of advertising costs are included in sales and marketing expenses and are expensed as incurred. Advertising costs totaled $20,357 and $36,453 for the years ended December 31, 2011 and 2010, respectively.
Foreign Currency Translation
For operations in local currency environments, assets and liabilities are translated at year-end exchange rates with cumulative translation adjustments included as a component of shareholders’ equity and income and expense items are translated at average foreign exchange rates prevailing during the year. For operations in which the U.S. dollar is not considered the functional currency, certain financial statements amounts are re-measured at historical exchange rates, with all other asset and liability amounts translated at year-end exchange rates. These re-measured adjustments are reflected in the results of operations. Gains and losses from foreign currency transactions are included in the Consolidated Statements of Operations.
Income Tax
Current income taxes are recorded based on statutory obligations for the current operating period for the various countries in which the Company has operations.
Deferred taxes are provided on an asset and liability method whereby deferred tax assets are recognized for deductible temporary differences, and deferred tax liabilities are recognized for taxable temporary differences. Temporary differences are the differences between the reported amounts of assets and liabilities and their tax basis. Deferred tax assets are reduced by a valuation allowance when, in the opinion of management, it is more likely than not that some portion or all of the deferred tax assets will not be realized. Deferred tax assets and liabilities are adjusted for the effects of changes in tax laws and rates on the date of enactment.
| 42 |
Use of Estimates
The preparation of financial statements in conformity with GAAP requires management to make estimates and assumptions that affect the reported amounts of assets and liabilities and disclosure of contingent assets and liabilities at the date of the financial statements and the reported amounts of revenues and expenses during the reporting period. Management bases its estimates on historical experience and on various other assumptions that are believed to be reasonable under the circumstances. Actual results could differ from those estimates.
Reclassifications
Certain liability accounts for the year ended December 31, 2010 were reclassified to conform to the current year presentation.
| 3. | Acquisition |
In October 2011, the Company completed the acquisition of the New Global Group (New Global) of companies. New Global is a provider of multilingual communication services and technologies - serving clients in the United States, Canada and Europe through offices in Montreal, Canada and Madrid, Spain. This acquisition included the purchase of the outstanding stock of two subsidiaries of New Global, New Global Canada and New Global Europe, and certain assets and liabilities of New Global LLC. The effective date of the acquisition was October 1, 2011.
The consideration for the acquisition of New Global included cash, Sajan common stock and the assumption of New Global liabilities and debt. The assumed debt was repaid immediately upon closing of the transaction. Half of the cash and stock consideration was paid at closing and the remaining half of the consideration will be paid on the first anniversary of the transaction.
The primary asset acquired was the New Global customer list. The Company evaluated the purchase price allocation based on the fair value of the assets acquired and liabilities assumed. The fair value allocated to the customer list is being amortized over a period of four years from the date of purchase.
An allocation of the purchase price to the net assets acquired as of the closing date of the acquisition is as follows:
| Current Assets | $ | 327,563 | ||
| Intangible Assets – Customer Relationships | 912,406 | |||
| Debt Obligations | (305,178 | ) | ||
| Current Liabilities | (286,282 | ) | ||
| Net Assets Acquired | $ | 648,509 |
Form of consideration was as follows:
| Cash | $ | 158,689 | ||
| Stock | 158,689 | |||
| Liability Due to Sellers | 331,131 | |||
| Total | $ | 648,509 |
The value of the intangible asset associated with the customer relationships acquired in the New Global transaction was established based on the determination of the future expected discounted net cash flows of those customers over a four year period.
| 43 |
The liability due to the sellers of approximately $331,000 is subject to adjustment in the event of the discovery of any additional pre-closing liabilities or in the event of loss of revenue from New Global customers during the six month period after closing. The final liability is due in October 2012. Half of the liability due to the sellers will be paid in cash and the other half will be settled through the issuance of Sajan common stock. The value and the number of the shares to be issued in settlement of this liability will be the same as those used as of the closing of the acquisition.
The results of the New Global operations have been included in the results of operations of Sajan from October 1, 2011. On a pro-forma basis, if the acquisition of New Global had been completed on January 1, 2011, the financial results of Sajan would have been as follows:
| For the Year Ended December 31, 2011 | ||||||||
| As Reported | Pro-Forma | |||||||
| Revenues | $ | 20,904,000 | $ | 22,099,000 | ||||
| Operating Expenses | 21,327,000 | 22,402,000 | ||||||
| Loss from Operations | $ | (423,000 | ) | $ | (303,000 | ) | ||
The unaudited pro-forma financial information set forth above for the year ended December 31, 2011 does not purport to represent what the Company’s results of operations would actually have been if this transaction had in fact occurred on January 1, 2011, or to project the Company’s future results of operations.
| 4. | Concentrations of Credit Risk – |
Financial instruments which potentially subject the Company to concentrations of credit risk consist principally of cash and cash equivalents and accounts receivable.
Cash Concentration – The Company places its cash at financial institutions with balances that, at times, may exceed federally insured limits. The Company evaluates the creditworthiness of these financial institutions in determining the risk associated with these deposits. The Company has not experienced any losses on such accounts.
Accounts receivable concentration – Concentrations of credit risk with respect to trade accounts receivable are limited due to the dispersion of customers across different industries and geographic regions. At December 31, 2011 and 2010, one customer accounted for approximately 17% and 36% of accounts receivable, respectively.
Sales concentration – For the years ended December 31, 2011 and 2010, the Company had one customer that accounted for 11% and 15% of net revenues, respectively.
| 5. | Segment Information and Major Customers – |
The Company views its operations and manages its business as one reportable segment, providing language translation solutions to a variety of companies, primarily in its targeted vertical markets. Factors used to identify the Company’s single operating segment include the financial information available for evaluation by the chief operating decision maker in making decisions about how to allocate resources and assess performance. The Company markets its products and services through its headquarters in the United States and its wholly-owned subsidiaries operating in Ireland, Spain, Canada and Singapore.
Net sales per geographic region, based on the billing location of end customer, are summarized below.
| Years Ended December 31, | ||||||||||||||||
| 2011 | 2010 | |||||||||||||||
| Sales | Percent | Sales | Percent | |||||||||||||
| United States | $ | 14,334,089 | 68.6 | % | $ | 12,163,284 | 76.1 | % | ||||||||
| International | 6,570,222 | 31.4 | % | 3,817,112 | 23.9 | % | ||||||||||
| Total Sales | $ | 20,904,311 | 100.0 | % | $ | 15,980,396 | 100.0 | % | ||||||||
| 44 |
One foreign country accounted for 11.3% of consolidated revenue in 2011.
| 6. | Property and Equipment |
Property and equipment consisted of the following as of December 31:
| 2011 | 2010 | |||||||
| Furniture, equipment, and software | $ | 1,625,441 | $ | 1,359,823 | ||||
| Leasehold improvements | 389,375 | 380,796 | ||||||
| Total | 2,014,816 | 1,740,619 | ||||||
| Less accumulated depreciation and amortization | (1,256,376 | ) | (993,079 | ) | ||||
| Total property and equipment, net | $ | 758,440 | $ | 747,540 | ||||
Depreciation and amortization expense was $268,372 and $241,899 for the years ended December 31, 2011 and 2010, respectively.
| 7. | Capitalized Software Development Costs |
Capitalized software development costs consist of the following as of December 31:
| 2011 | 2010 | |||||||
| Capitalized software development costs | $ | 2,534,891 | $ | 2,565,172 | ||||
| Less accumulated amortization | (2,435,652 | ) | (2,104,241 | ) | ||||
| Change in foreign currency exchange rates | (23,764 | )) | - | |||||
| Total capitalized software development costs, net | $ | 123,003 | $ | 460,931 | ||||
| 8. | Intangible Assets |
Intangible assets consist of the following as of December 31:
| 2011 | 2010 | |||||||
| Customer lists acquired | $ | 912,405 | $ | - | ||||
| Patents and licenses | 504,838 | 503,478 | ||||||
| Total | 1,417,243 | 503,478 | ||||||
| Less accumulated amortization | (472,452 | ) | (324,563 | ) | ||||
| Total intangible assets, net | $ | 944,791 | $ | 178,915 | ||||
Intangible assets are amortized over their expected useful lives of 3 to 4 years. Amortization of intangible assets was $147,889 and $169,119 for the years ended December 31, 2011 and 2010, respectively. Estimated amortization expense of intangible assets for the years ending December 31, 2012, 2013, 2014, and 2015 is $258,816, $230,836, $230,836, and $224,303 respectively. The weighted average remaining life of the intangibles is 4 years.
| 45 |
| 9. | Related Party Transactions |
Note Payable
Notes payable and accrued interest to related parties was approximately $801,000 and $1,068,000 at December 31, 2011 and December 31, 2010, respectively, related to notes payable to officers and stockholders of the Company, Shannon and Angela Zimmerman. On February 23, 2010, the Company issued a Promissory Note to Shannon and Angela Zimmerman as part of the Merger consideration. The Promissory Note documents the Company’s obligation to pay $1 million of the pro rata amount of the cash Merger consideration to the Zimmermans. The Promissory Note had a term of one year and provides for an interest rate of 8% per year to be accrued until payment of the Promissory Note. On February 22, 2011, the Promissory Note was amended. The amendment called for the payment of $250,000 of the principal amount immediately together with all accrued interest, but extended the due date on the remaining $750,000 principal amount of the Promissory Note to August 23, 2012. The other terms of the Promissory Note remain the same. On March 26, 2012, the Company amended the Promissory Note – see Note 15.
Upon the occurrence of an “event of default,” as defined in the Promissory Note, and at any time thereafter, the unpaid principal balance, plus accrued interest, plus all other amounts due under the Promissory Note will, at the option of the Zimmermans, be immediately due and payable, without notice or demand. The obligations of the Company under the Promissory Note are unsecured.
Accrued interest was approximately $51,000 and $68,000 as of December 31, 2011 and 2010, respectively. Interest expense was $63,000 and $68,000 for the years ended December 31, 2011 and 2010, respectively.
Lease
Sajan leases its office space, under three non-cancelable operating leases, from River Valley Business Center, LLC (“RVBC”), a limited liability company that is owned by Shannon Zimmerman and Angela Zimmerman, each of whom is an executive officer and director of the Company, and beneficial owners of the Company’s outstanding voting common stock. During 2011, the space consisted of approximately 16,000 square feet and was leased pursuant to two agreements. These lease agreements require the Company to pay a minimum monthly rental plus certain operating expenses and expire in January 2017. Payment of rent under these leases is secured by goods, chattels, fixtures and personal property of the Company. Effective February 28, 2012, the Company entered into a third lease for an additional 3,850 square feet of space in the same building. The monthly lease payment for this additional space is $4,650. All other terms of the lease were the same as the previous leases.
| 10. | Other Accrued Liabilities – |
Other accrued liabilities of the following as of December 31:
| 2011 | 2010 | |||||||
| Legal and professional services | $ | 22,720 | $ | 20,328 | ||||
| Accrued lease obligations | - | 213,029 | ||||||
| VAT tax obligations | 71,185 | - | ||||||
| Income taxes payable | 12,000 | - | ||||||
| Other | 61,325 | 47,100 | ||||||
| Total | $ | 167,230 | $ | 280,457 | ||||
| 46 |
| 11. | Options and Warrants – |
Amended and Restated 2004 Long-Term Incentive Plan
Over the past several years, shareholders have approved various modifications to the Amended and Restated 2004 Long-Term Incentive Plan (the “Plan”) so that as of December 31, 2011, 2,200,000 shares of the Company's common stock were reserved for the issuance of restricted stock and incentive and nonqualified stock options to directors, officers and employees of and advisors to the Company. Exercise prices are determined by the board of directors on the dates of grants. The Company issues new shares when stock options are exercised.
Upon completion of the Merger, Sajan converted the options outstanding in their 2001 Stock Option Plan into 1.225 options of MathStar common stock.
The following table summarizes stock option activity for options granted under and outside of the Plan for the years ended December 31, 2011 and 2010:
| Weighted- | ||||||||||||||||
| Average | ||||||||||||||||
| Weighted- | Remaining | |||||||||||||||
| Average | Weighted- | Contractual | ||||||||||||||
| Number of | Exercise | Average | Term | |||||||||||||
| Stock Options | Price | Fair Value | (Years) | |||||||||||||
| Balance at December 31, 2009 | 842,125 | $ | 2.45 | $ | 0.82 | 8.7 | ||||||||||
| Conversion of Sajan options | 189,479 | 1.08 | 0.82 | |||||||||||||
| Options assumed in Merger | 127,369 | 19.45 | ||||||||||||||
| Granted | 296,000 | 1.45 | 0.87 | |||||||||||||
| Cancelled | (618,327 | ) | 3.64 | 1.80 | ||||||||||||
| Balance at December 31, 2010 | 836,646 | $ | 2.01 | $ | 1.25 | 7.3 | ||||||||||
| Granted | 680,000 | 1.34 | 0.89 | |||||||||||||
| Exercised | (20,673 | ) | 0.61 | 0.21 | ||||||||||||
| Cancelled | (59,506 | ) | 1.32 | 0.79 | ||||||||||||
| Balance at December 31, 2011 | 1,436,467 | $ | 1.74 | $ | 1.05 | 7.7 | ||||||||||
| Exercisable at December 31, 2010 | 378,868 | $ | 2.97 | $ | 1.24 | 5.8 | ||||||||||
| Exercisable at December 31, 2011 | 587,880 | $ | 2.29 | $ | 1.05 | 5.4 | ||||||||||
| Vested during 2011 | 153,316 | $ | 1.28 | $ | 0.71 | |||||||||||
| Nonvested at December 31, 2011 | 848,587 | $ | 1.36 | $ | 1.05 | 8.8 | ||||||||||
Aggregate fair value of options vested during the years ended December 31, 2011 and 2010 were $128,178 and $491,304, respectively.
Intrinsic value as of December 31, 2011 is based on the fair value price of $1.26, which would have been received by the option holders had all in-the-money option holders exercised their options as of that date. The Company used a fair value of $0.95 on December 31, 2010. The total number of shares of in-the-money options outstanding as of December 31, 2011 and 2010 was 786,800 and 394,479 shares, respectively. The total number of shares subject to in-the-money options exercisable as of December 31, 2011 and 2010 was 462,381 and 288,670 shares, respectively. The intrinsic value of options outstanding and exercisable at December 31, 2011 was $282,263 and $244,984, respectively. The intrinsic value of options outstanding and exercisable at December 31, 2010 was $134,316 and $99,241, respectively. The intrinsic value of options exercised during the year ended December 31, 2011 was $16,332.
| 47 |
The following is a summary of warrants outstanding and exercised for the years ended December 31, 2011 and 2010:
| Weighted- | ||||||||||||||||||||
| Average | ||||||||||||||||||||
| Weighted- | Remaining | |||||||||||||||||||
| Average | Weighted- | Contractual | ||||||||||||||||||
| Warrants | Exercise | Average | Aggregate | Term | ||||||||||||||||
| Shares | Price | Fair Value | Fair Value | (Years) | ||||||||||||||||
| Balance at December 31, 2009 | 102,875 | $ | 2.00 | $ | 0.55 | $ | 56,581 | 6.75 | ||||||||||||
| Warrants Converted in Merger | 23,147 | 0.61 | ||||||||||||||||||
| Warrants assumed in merger | 581,044 | 23.30 | - | 1.1 | ||||||||||||||||
| Warrants expired | (159,059 | ) | 23.30 | |||||||||||||||||
| Balance at December 31, 2010 | 548,007 | $ | 17.89 | $ | 0.10 | $ | 56,581 | 2.2 | ||||||||||||
| Warrants expired | (371,981 | ) | $ | 23.30 | ||||||||||||||||
| Balance at December 31, 2011 | 176,026 | $ | 2.17 | $ | 0.32 | $ | 56,581 | 4.2 | ||||||||||||
| Exercisable at December 31, 2011 | 176,026 | $ | 2.17 | $ | 0.32 | $ | 56,581 | 4.2 | ||||||||||||
| Exercisable at December 31, 2010 | 548,007 | $ | 17.89 | $ | 0.10 | $ | 56,581 | 2.2 | ||||||||||||
All warrants were vested as of December 31, 2011 and 2010.
| 12. | Income Taxes – |
The following is a reconciliation of the federal statutory income tax rate to income tax expense for the years ended December 31:
| 2011 | 2010 | |||||||
| Federal Income tax at the statutory rate | $ | 27,000 | $ | (1,067,150 | ) | |||
| State income tax | 6,000 | (240,871 | ) | |||||
| Federal benefit for state taxes | (2,000 | ) | 84,305 | |||||
| Non-deductible expenses | 36,000 | 20,068 | ||||||
| Adjustment of net operating loss | 155,000 | - | ||||||
| Change in tax rate on deferred items | - | (194,199 | ) | |||||
| Valuation allowance | (210,000 | ) | 1,397,847 | |||||
| Income tax expense (benefit) | $ | 12,000 | $ | 0 | ||||
| 48 |
The Company is subject to Alternative Minimum Tax (AMT), which only allow for the utilization of existing NOL carryforwards to offset 90% of AMT taxable income.
Our deferred income tax assets and liabilities are recognized for the differences between the financial statement and income tax reporting basis of assets and liabilities based on currently enacted rates and laws. These differences include depreciation, net operating loss carryforwards, capital loss carryforwards, allowance for accounts receivable, stock options and warrants, prepaid expenses, capitalized software costs, cash to accrual conversion, and accrued liabilities.
Net deferred tax assets consist of the following as of December 31:
| 2011 | 2010 | |||||||
| Deferred tax assets: | ||||||||
| Accounts payable and other liabilities | $ | 202,000 | $ | 326,000 | ||||
| Stock-based compensation | 429,000 | 340,000 | ||||||
| Net operating loss and credit carryforward | 11,926,000 | 12,475,000 | ||||||
| Other | 31,000 | 37,000 | ||||||
| Valuation allowance | (11,997,000 | ) | (12,312,000 | ) | ||||
| $ | 591,000 | $ | 866,000 | |||||
| Deferred tax liabilities | ||||||||
| Accounts receivable and other assets | (323,000 | ) | (585,000 | ) | ||||
| Nondeductible acquired intangibles | (121,000 | ) | - | |||||
| Depreciation | (41,000 | ) | (42,000 | ) | ||||
| Capitalized software development costs | (52,000 | ) | (185,000 | ) | ||||
| $ | (537,000 | ) | $ | (812,000 | ) | |||
The above deferred taxes have been classified in the accompanying consolidated balance sheets as follows as of December 31:
| 2011 | 2010 | |||||||
| Current assets | $ | 54,000 | $ | 54,000 | ||||
| Noncurrent liability | - | - | ||||||
| $ | 54,000 | $ | 54,000 | |||||
The provision for income taxes charged to operations consists of the following for the years ended December 31:
| 2011 | 2010 | |||||||
| Current | $ | 12,000 | $ | - | ||||
| Deferred - US | - | - | ||||||
| Deferred - Foreign | - | - | ||||||
| Total | $ | 12,000 | $ | - | ||||
| 49 |
The cumulative net operating loss available to offset future income for federal and state reporting purposes was approximately $30.8 million and $8.4 million, respectively as of December 31, 2011. Available research and development credit carryforwards at December 31, 2011, were $0.7 million. The difference between the amount of net operating loss carryforward available for federal and state purposes is due to the fact that a substantial portion of the operating losses were generated in states in which the Company does not have ongoing operations. No deferred taxes have been provided for these losses. The Company's federal and state net operating loss carryforwards expire in various calendar years from 2015 through 2030 and the tax credit carryforwards expire in calendar years 2020 through 2028.
In connection with the Merger, the Company acquired $10.7 million of net deferred tax assets which included $9.8 million in federal net operating loss carryforwards, $0.2 million in state net operating loss carryforwards and $0.7 million of federal tax credit carryforwards. The acquired net deferred tax assets have a full valuation allowance to fully reserve against those deferred tax assets as the Company believes it is more likely than not that it will be unable to fully utilize the acquired deferred tax benefits. In the event that the Company determines that a valuation allowance is no longer required, any benefits realized from the use of the NOLs and credits acquired will reduce its deferred income tax expense.
Future utilization of available net operating loss carryforwards may be limited under Section 382 of the Internal Revenue Code of 1986, as amended (the “Code”) as a result of significant changes in ownership. These limitations could result in reduction of these net operating loss carryforwards before they are utilized. Based upon the provisions of Section 382 of the Code, as of December 31, 2011 approximately $1.6 million of net operating loss carryforwards are limited as to future use. The amount of these losses which are available in any one year is approximately $0.6 million. No limitations exist on the remaining $29.2 million of federal loss carryforwards.
In assessing the recovery of the deferred tax assets, management considers whether it is more likely than not that a portion or all of the deferred tax assets will not be realized. The ultimate realization of deferred tax assets is dependent upon the generations of future taxable income in the periods in which those temporary differences become deductible. Management considers the scheduled reversals of future deferred tax liabilities, projected future taxable income, and tax planning strategies in making this assessment. As such, the Company has recorded a valuation allowance to offset a portion of its deferred taxes. The valuation allowance was $12 million and $12.3 as of December 31, 2011 and December 31, 2010, respectively. The change in the valuation allowance shown in the effective tax rate reflects the current year’s activity. It does not include a change in the valuation allowance due to changes in deferred items for adjustments or purchase accounting items that do not affect the current year tax provision.
On February 25, 2010, the Company entered into the Tax Benefit Preservation Plan and Rights Agreement (the “Preservation Plan”) with Wells Fargo Shareowner Services, a division of Wells Fargo Bank, National Association, as Rights Agent. The Company’s Board of Directors adopted the Preservation Plan in an effort to protect against a possible limitation on the ability to use its net operating losses under the Internal Revenue Code of 1986, as amended (the “Code”), and rules promulgated by the Internal Revenue Service. Under the Preservation Plan, beginning March 12, 2010, for each share of the Company’s common stock held, the holder of the common stock has the right to purchase one one-millionth of a share of a new series of preferred stock of the Company.
We file a consolidated U.S. federal tax return. The Company’s federal and state tax returns for the years ended 2008-2010 are still subject to examination. As a result of the adoption of ASC 740 – Income Taxes, effective October 1, 2007, we applied the requirements of ASC 740 to all tax positions for which the statute of limitations remained open. ASC 740 was issued to address the non-comparability in reporting tax assets and liabilities resulting from a lack of specific guidance in prior standards on consistent recognition threshold and a measurement attribute for the financial statement recognition and measurement of a tax position taken or expected to be taken in a tax return. ASC 740 also provides related guidance on derecognition, classification, interest and penalties, accounting interim periods, disclosures and transition. To the extent interest and penalties would be assessed by taxing authorities on any underpayment of income taxes, such amounts would be accrued and classified as a component of income tax expenses on the consolidated statements of operations.
| 50 |
| 13. | Commitments and Contingencies |
Capital Lease
The Company entered into a three year capital lease agreement for the purchase of computer equipment in May 2011. The lease provides for the purchase of the equipment at the end of the lease term for a nominal amount. The total amount financed under the lease is $79,000 and the monthly payments are $2,943.
The Company’s capital lease obligation as of December 31, 2011 are as follows:
| 2011 | ||||
| Equipment Lease – American Capital, monthly installments of $2,943 including interest at 17.5%, due April, 2014, secured by the equipment | $ | 64,567 | ||
| Less: Current Portion | (26,039 | ) | ||
| Capital lease obligation, net of current portion | $ | 38,528 | ||
Payments on the capital lease obligation, including interest for 2012, 2013 and 2014 are $35,316, $35,316, and $8,829, respectively.
Operating Leases
The Company leases its office buildings and certain office equipment under non-cancellable operating leases. Total rent expense under these operating leases was $387,559 and $310,654 for the years ended December 31, 2011 and 2010, respectively.
Future minimum lease payments under non-cancellable operating leases as of December 31, 2011 are as follows:
| Year Ending | Amount | |||
| 2012 | $ | 426,772 | ||
| 2013 | 386,657 | |||
| 2014 | 345,540 | |||
| 2015 | 344,629 | |||
| 2016 | 289,464 | |||
| Thereafter | 287,448 | |||
| Total | $ | 2,080,510 | ||
Severance Agreements
The Company has employee agreements with three officers which provide for severance payments of up to one year annual salary for those officers if employment is terminated by the Company without cause.
Legal Proceedings
In the ordinary course of business, the Company is subject to legal proceedings and claims. In the opinion of management, the amount of ultimate liability with respect to these actions may or may not materially affect the financial position of the Company nor can an estimate be made. The Company expenses legal costs during the period incurred.
| 51 |
Litigation by Sajan, Inc. Stockholder (Natzel)
On February 11, 2010, Mary Jo Natzel, a stockholder of Sajan, Inc., initiated a lawsuit against Shannon Zimmerman and Angel Zimmerman (the “Zimmermans”) and Sajan, Inc. in the Minnesota District Court, Hennepin County, Fourth Judicial District. Ms. Natzel sought declaratory, injunctive and monetary relief in an amount in excess of $50,000 against Sajan, Inc. and the Zimmermans in connection with the alleged underpayment to Ms. Natzel of distributions made by Sajan, Inc. while it was a corporation taxed under Subchapter S of the Internal Revenue Code and representations by the Zimmermans with respect to the amount of money invested in Sajan, Inc. On April 29, 2011, the parties resolved their dispute on mutually acceptable terms pursuant to a confidential settlement agreement.
Mary Jo Natzel did not participate in the Merger in February 2010, and instead chose to dissent from the corporate action pursuant to Minnesota Statutes. On May 13, 2010, Sajan, Inc. tendered a check to Ms. Natzel in the amount of $366,942 in payment of the fair value of the shares tendered. On June 8, 2010, Sajan, Inc. received a letter which asserted that the fair value of Natzel’s shares was $495,372. Sajan, Inc. disputed the value claimed, and on November 1, 2010 filed a petition requesting the court to determine the fair value of the shares. On June 30, 2011, the parties resolved their dispute on mutually acceptable terms pursuant to a confidential settlement agreement.
| 14. | Sale of Patents |
In 2011, Sajan completed the sale of selected patents and patent applications that were acquired in the merger with Mathstar in February, 2010. The technology sold is not related to Sajan’s language translation business. Gross proceeds from the sale were $600,000 and costs associated with the sale were $49,225. The net gain on the sale is presented in other income on the consolidated statement of operations.
| 15. | Subsequent Events |
Close of India Operation
In January 2012, the Company implemented a plan to close the software development operation in India and to transfer those activities to its River Falls headquarters. The Company terminated the employees in January and is in the process of terminating the facility lease. There were limited assets and liabilities of the operation. The Company expects to incur the following costs and gains in connection with this action:
| Loss on disposal of equipment and other assets | $ | 30,000 | ||
| Employee severance | 15,000 | |||
| Lease termination | 15,000 | |||
| Professional fees and costs | 10,000 | |||
| Realization of gain on intercompany loan | (40,000 | ) | ||
| Net loss | $ | 30,000 |
Total cash expenses of $40,000 will all be paid in the first quarter of 2012.
New Credit Facility
In March 2012 we entered into a one-year revolving working capital line of credit with Silicon Valley Bank (“SVB”), which permits up to a principal amount equal to the lesser of (a) $1,500,000 or (b) 80% of the aggregate amount of our outstanding eligible domestic accounts receivable, subject to customary limitations and exceptions (the “Credit Facility”). As of March 29, 2012, no borrowings had been drawn under the Credit Facility. Interest on the principal amount outstanding under the Credit Facility accrues at a floating rate equal to the greater of 50 basis points above the U.S. prime rate and 4.0%, and is payable monthly on the first calendar day of each month. The outstanding principal amount of any borrowings under the Credit Facility, along with any accrued and unpaid interest thereon, is payable on the maturity date, March 28, 2013. The facility is governed by the terms of a Loan and Security Agreement (the “Loan Agreement”) which requires compliance with certain financial and other covenants, is secured by all of our domestic assets, except intellectual property (which we agreed not to pledge to others) and is guaranteed on an unsecured basis by certain of our subsidiaries. The Loan Agreement contains customary events of default, which, if triggered, would permit SVB to exercise customary remedies such as acceleration of all then-outstanding obligations arising under the Loan Agreement. In connection with the Loan Agreement, we extended the maturity date of a promissory note issued by us to Angel and Shannon Zimmerman in the original aggregate principal amount of $1,000,000 (the “Zimmerman Note”). The remaining principal balance of $750,000 under the Zimmerman Note is now due August 23, 2013.
| 52 |
ITEM 9. CHANGES IN AND DISAGREEMENTS WITH ACCOUNTANTS ON ACCOUNTING AND FINANCIAL DISCLOSURE
None.
ITEM 9A. CONTROLS AND PROCEDURES
DISCLOSURE CONTROLS AND PROCEDURES
This report includes the certifications of our Chief Executive Officer and Chief Financial Officer required by Rule 13a-14 of the Securities Exchange Act of 1934 (the “Exchange Act”). See Exhibits 31.1 and 31.2 to this report. This Item 9A includes information concerning the controls and control evaluations referred to in those certifications.
EVALUATION OF DISCLOSURE CONTROLS AND PROCEDURES
As required by Rule 13a-15(b) under the Exchange Act, our management carried out an evaluation, with the participation of our Chief Executive Officer and Chief Financial Officer, of the effectiveness of the design and operation of our disclosure controls and procedures (as defined in Rules 13a-15(e) of the Exchange Act), as of the period covered by this report. Disclosure controls and procedures are defined as controls and other procedures that are designed to ensure that information required to be disclosed by us in reports filed with the SEC under the Exchange Act is recorded, processed, summarized and reported within the time periods specified in the SEC’s rules and forms. Disclosure controls and procedures include, without limitation, controls and procedures designed to ensure that information required to be disclosed by us in reports filed under the Exchange Act is accumulated and communicated to our management, including our principal executive and principal financial officers, or person performing similar functions, as appropriate to allow timely decisions regarding required disclosure. Based upon their evaluation, our management (including our Chief Executive Officer and Chief Financial Officer) concluded that our disclosure controls and procedures were effective as of December 31, 2011.
MANAGEMENT’S REPORT ON INTERNAL CONTROL OVER FINANCIAL REPORTING
Our management is responsible for establishing and maintaining adequate internal control over financial reporting. Internal control over financial reporting is a set of processes designed by, or under the supervision of, a company’s principal executive and principal financial officers, to provide reasonable assurance regarding the reliability of financial reporting and the preparation of financial statements for external purposes in accordance with GAAP and includes those policies and procedures that:
| — | pertain to the maintenance of records that in reasonable detail accurately and fairly reflect our transactions and dispositions of our assets, |
| — | provide reasonable assurance our transactions are recorded as necessary to permit preparation of our financial statements in accordance with GAAP, and that receipts and expenditures are being made only in accordance with authorizations of our management and directors, and |
| — | provide reasonable assurance regarding prevention or timely detection of unauthorized acquisition, use or disposition of our assets that could have a material effect on the financial statement. |
Because of its inherent limitations, internal control over financial reporting may not prevent or detect misstatements. It should be noted that any system of internal control, however well designed and operated, can provide only reasonable, and not absolute, assurance that the objectives of the system will be met. Also, projections of any evaluation of effectiveness to future periods are subject to the risk that controls may become inadequate because of changes in conditions, or that the degree of compliance with the policies or procedures may deteriorate.
| 53 |
Under the supervision and with the participation of management, including its principal executive officer and principal financial officer, Sajan’s management assessed the design and operating effectiveness of internal control over financial reporting as of December 31, 2011 based on the framework set forth in Internal Control—Integrated Framework issued by the Committee of Sponsoring Organizations of the Treadway Commission. Based on this assessment, management believes that, as of December 31, 2011, Sajan’s internal control over financial reporting is effective based on these criteria.
Baker Tilly Virchow Krause, LLP, an independent registered public accounting firm, is not required to issue, and thus has not issued, an attestation report on Sajan’s internal control over financial reporting as of December 31, 2011.
CHANGES IN INTERNAL CONTROL OVER FINANCIAL REPORTING
During the year ended December 31, 2011, there were no significant changes to the Company’s system of internal controls over financial reporting.
ITEM 9B. OTHER INFORMATION
On March 28, 2012, Sajan, Inc. and Sajan, LLC entered into a one-year revolving working capital line of credit with Silicon Valley Bank (“SVB”), which permits borrowings of up to a principal amount equal to the lesser of (a) $1,500,000 or (b) 80% of the aggregate amount of our outstanding eligible domestic accounts receivable, subject to customary limitations and exceptions (the “Credit Facility”). The unpaid principal amount borrowed under the Credit Facility accrues interest at a floating rate per annum equal to the greater of (a) 50 basis points above the U.S. prime rate and (b) 4.0%. As of March 29, 2012, no borrowings had been drawn under the Credit Facility. Interest on the principal amount outstanding under the Credit Facility is payable monthly on the first calendar day of each month. The outstanding principal amount of any borrowings under the Credit Facility, along with any accrued and unpaid interest thereon, is payable on the maturity date, March 28, 2013.
The Credit Facility is governed by the terms of a Loan and Security Agreement, dated as of March 28, 2012, entered into by and among Sajan, Inc. and Sajan, LLC, as borrowers, and SVB, as lender (the “Loan Agreement”). The Loan Agreement requires us to maintain (a) a minimum liquidity ratio of 1.25:1.00, measured monthly based on the ratio of (i) the amount of borrowers’ unrestricted cash and cash equivalents held at SVB plus (ii) the aggregate amount of borrowers’ outstanding eligible domestic accounts receivable, subject to customary limitations and exceptions to (iii) all outstanding indebtedness owing by borrowers to SVB and (b) a minimum EBITDA covenant, measured monthly on a consolidated basis. In addition, we are required to provide certain financial information and compliance certificates to SVB and comply with certain other customary affirmative and negative covenants. The Credit Facility is secured by all of our domestic assets except for intellectual property (which we agreed not to pledge to others), and the pledge of our equity interests in our foreign subsidiaries is limited to 65% of such equity interests. Our obligations under the Loan Agreement are also guaranteed on an unsecured basis by certain of our subsidiaries. The Loan Agreement contains customary events of default, which, if triggered, would permit SVB to exercise customary remedies such as acceleration of all then-outstanding obligations arising under the Loan Agreement, to terminate its obligations to lend under the Credit Facility, to apply a default rate of interest to such outstanding obligations, and to exercise customary remedies under the Uniform Commercial Code.
The loans made to us under the Loan Agreement are senior in right of payment to loans made to us by certain of our officers. In connection with the Loan Agreement, we entered into a Subordination Agreement, dated as of March 28, 2012, with SVB and Shannon and Angel Zimmerman (the “Zimmermans”), relating to the promissory note issued by us to the Zimmermans on February 23, 2010, in the original aggregate principal amount of $1,000,000 (the “Zimmerman Note”). The Subordination Agreement provides that we will not make principal payments on the Zimmerman Note prior to repaying the full amount of borrowings made under the Credit Facility. On March 26, 2012, the Zimmerman Note was amended to extend the maturity date of the remaining $750,000 principal amount from August 23, 2012 to August 23, 2013.
The foregoing descriptions of the Credit Facility and Zimmerman Note as amended do not purport to be complete and are qualified in their entirety by reference to the Loan Agreement, the Subordination Agreement and the Second Amendment to Promissory Note, which are attached hereto as Exhibits 10.15, 10.16 and 10.17, respectively, and are incorporated herein by reference.
| 54 |
PART III
ITEM 10. DIRECTORS, EXECUTIVE OFFICERS, AND CORPORATE GOVERNANCE.
The information required by Item 10 is incorporated by reference to the sections entitled “Election of Directors,” “Executive Officers,” “Corporate Governance,” “Meetings and Committees of the Board of Directors,” “Qualifications of Candidates for Election to the Board,” “Stockholder Recommendations for Directors,” “Stockholder Communications with the Board of Directors,” and “Compliance with Section 16(a) of the Exchange Act” in our definitive proxy statement relating to our 2012 Annual Meeting of Stockholders.
ITEM 11. EXECUTIVE COMPENSATION.
The information required by Item 11 is incorporated by reference to the sections entitled “Executive Compensation” and “Director Compensation” in our definitive proxy statement relating to our 2012 Annual Meeting of Stockholders.
ITEM 12. SECURITY OWNERSHIP OF CERTAIN BENEFICIAL OWNERS AND MANAGEMENT AND RELATED STOCKHOLDER MATTERS.
The information required by Item 12 is incorporated by reference to the sections entitled “Beneficial Ownership of Common Stock” and “Securities Authorized for Issuance Under Equity Compensation Plans” in our definitive proxy statement relating to our 2012 Annual Meeting of Stockholders.
ITEM 13. CERTAIN RELATIONSHIPS AND RELATED TRANSACTIONS, AND DIRECTOR INDEPENDENCE.
The information required by Item 13 is incorporated by reference to the sections entitled “Corporate Governance” and “Certain Relationships and Related Transactions” in our definitive proxy statement relating to our 2012 Annual Meeting of Stockholders.
Item 14. PRINCIPAL ACCOUNTING FEES AND SERVICES
The information required by Item 14 is incorporated by reference to the section entitled “Audit and Non-Audit Services and Fees Billed to Company by Independent Registered Public Accounting Firm,” included in the proposal to ratify the appointment of our independent registered public accounting firm in our definitive proxy statement relating to our 2012 Annual Meeting of Stockholders.
| 55 |
PART IV
| ITEM 15. | EXHIBITS, FINANCIAL STATEMENT SCHEDULES |
FINANCIAL STATEMENTS
| Item | Page | |
| Report of Independent Registered Public Accounting Firm | 33 | |
| Balance Sheets – December 31, 2011 and December 31, 2010 | 34 | |
| Statements of Operations – Years ended December 31, 2011 and December 31, 2010 | 35 | |
| Statements of Stockholders’ Equity – Years ended December 31, 2011 and December 31, 2010 | 36 | |
| Statements of Cash Flows – Years ended December 31, 2011 and December 31, 2010 | 37 | |
| Notes to Financial Statements | 38 |
EXHIBITS
| Exhibit No. | Description | |
| 2.1 | Agreement and Plan of Merger, dated January 8, 2010, among MathStar, Inc., Sajan, Inc., Garuda Acquisition, LLC, and Thomas Magne (incorporated by reference to Exhibit 2.1 to the Current Report on Form 8-K filed with the Securities and Exchange Commission (“ SEC ”) on January 11, 2010). | |
| 3.1 | Certificate of Incorporation of the Company (incorporated by reference to Exhibit 3.1 to the Registration Statement on Form S-1 filed by MathStar, Inc. with the SEC on August 3, 2005, Registration No. 333-127164 {“Registration Statement”}). | |
| 3.2 | Certificate of Amendment of the Certificate of Incorporation of the Company filed with the Delaware Secretary of State on May 23, 2008 (incorporated by reference to Exhibit 3.1 to the Current Report on Form 8-K filed with the SEC on May 23, 2008). | |
| 3.3 | Certificate of Designation of Series A Preferred Stock filed with the Secretary of State of the State of Delaware on February 25, 2010 (incorporated by reference to Exhibit 3.1 of the Company’s Current Report on Form 8-K dated February 25, 2010 filed with the SEC). | |
| 3.4 | Certificate of Ownership and Merger merging Sajan, Inc. into MathStar, Inc. filed with the Securities and Exchange Commission on March 3, 2010 (incorporated by reference to Exhibit 3.1 to the Current Report on Form 8-K filed with the SEC on March 3, 2010). | |
| 3.5 | Bylaws of the Company (incorporated by reference to Exhibit 3.2 to the Registration Statement). | |
| 4.1 | Form of common stock certificate of the Company (incorporated by reference to Exhibit 4.1 to the Registration Statement). | |
| 4.2 | Tax Benefit Preservation Plan and Rights Agreement, dated as of February 25, 2010, between the Company and Wells Fargo Shareowner Services, a division of Wells Fargo Bank, National Association, as Rights Agent, together with the following exhibits thereto: Exhibit A - Form of Certificate of Designation of Series A Preferred Stock of the Company; Exhibit B — Form of Right Certificate; Exhibit C — Summary of Rights to Purchase Shares of Preferred Stock of the Company (incorporated by reference to Exhibit 4.1 of the Company’s Current Report on Form 8-K dated February 25, 2010 filed with the Securities and Exchange Commission). | |
| 10.1* | The Company’s 2004 Amended and Restated Long-Term Incentive Plan (incorporated by reference to Exhibit 10.1 to the Current Report on Form 8-K filed with the SEC on May 17, 2007). |
| 56 |
| 10.2* | Form of Incentive Stock Option Agreement (incorporated by reference to Exhibit 10.2 to the Current Report on Form 8-K filed with the SEC on February 24, 2010). | |
| 10.3* | Form of Non-Statutory Stock Option Agreement for non-employee directors (incorporated by reference to Exhibit 10.5 to the Current Report on Form 8-K filed with the SEC on February 24, 2010). | |
| 10.4* | Form of Common Stock Purchase Warrant (incorporated by reference to Exhibit 10.6 to the Current Report on Form 8-K filed with the SEC on February 24, 2010). | |
| 10.5* | Employment Agreement, dated May 19, 2006, and as amended on February 1, 2010, between Sajan, Inc. and Angela Zimmerman (incorporated by reference to Exhibit 10.8 to the Current Report on Form 8-K filed with the SEC on February 24, 2010). | |
| 10.6* | Employment Agreement, dated May 19, 2006, and as amended on February 1, 2010, between Sajan, Inc. and Shannon Zimmerman (incorporated by reference to Exhibit 10.8 to the Current Report on Form 8-K filed with the SEC on February 24, 2010). | |
| 10.7* |
Employment Agreement, dated August 4, 2010, between Sajan, Inc. and Timothy Clayton (incorporated by reference to Exhibit 10.1 to the Current Report on Form 8-K filed with the SEC on August 6, 2010).
| |
| 10.8 | Standard Office Lease Agreement (No. 1) between Sajan, Inc. and River Valley Business Center, LLC, dated February 1, 2010 (incorporated by reference to Exhibit 10.12 to the Current Report on Form 8-K filed with the SEC on February 24, 2010). | |
| 10.9 | Standard Office Lease Agreement (No. 2) between Sajan, Inc. and River Valley Business Center, LLC, dated February 1, 2010 (incorporated by reference to Exhibit 10.13 to the Current Report on Form 8-K filed with the SEC on February 24, 2010). | |
| 10.10 | Standard Office Lease Agreement (No. 3) between Sajan, Inc. and River Valley Business Center, LLC, effective February 28, 2012 (filed herewith). | |
| 10.11 | Promissory Note, dated February 23, 2010, in the original principal amount of $1,000,000 issued by the Company to Shannon and Angel Zimmerman (incorporated by reference to Exhibit 10.14 to the Current Report on Form 8-K filed with the SEC on February 24, 2010). | |
| 10.12 | Escrow Agreement, dated February 23, 2010, among the Company, Sajan, LLC and Thomas Magne, as representative for the shareholders of Sajan, Inc. (incorporated by reference to Exhibit 10.15 to the Current Report on Form 8-K filed with the SEC on February 24, 2010). | |
| 10.13* | Form of Indemnification Agreement between the Company and its officers and directors. | |
| 10.14 | Amendment to Promissory Note dated February 22, 2011 (incorporated by reference to Exhibit 10.1 to the Current Report on Form 8-K filed with the SEC on February 24, 2011). | |
| 10.15 | Loan and Security Agreement dated March 28, 2012, by and among Sajan, Inc., Sajan, LLC and Silicon Valley Bank (filed herewith). | |
| 10.16 | Subordination Agreement dated March 28, 2012, by and among Sajan, Inc., Sajan, LLC, Angel and Shannon Zimmerman and Silicon Valley Bank (filed herewith). | |
| 10.17 | Second Amendment, dated March 26, 2012, to Promissory Note dated February 23, 2010 (filed herewith). |
| 21.1 | Subsidiaries of Sajan, Inc. (filed herewith). | |
| 23.1 | Consent from Baker Tilly Virchow Krause, LLP (filed herewith). |
| 57 |
| 24.1 | Power of Attorney (included on signature page). | |
| 31.1 | Certification of principal executive officer pursuant to Rule 13a-14(a)/15d-14(a) (filed herewith). | |
| 31.2 | Certification of principal financial officer pursuant to Rule 13a-14(a)/15d-14(a) (filed herewith). | |
| 32.1 | Certification of principal executive officer pursuant to 18 U.S.C. 1350, as adopted pursuant to Section 906 of the Sarbanes-Oxley Act of 2002 (filed herewith). | |
| 32.2 | Certification of principal financial officer pursuant to 18 U.S.C. 1350, as adopted pursuant to Section 906 of the Sarbanes-Oxley Act of 2002 (filed herewith). | |
| 101** | The following financial statements from the Company’s Annual Report on Form 10-K for the year ended December 31, 2012, formatted in Extensible Business Reporting Language (XBRL): (i) the consolidated Balance Sheets, (ii) the Consolidated Statement of Operations, (iii) the Consolidated Statement of Cash Flows, (iv) the Consolidated Statement of Stockholders’ Equity, and (v) Notes to the Consolidated Financial Statements. | |
| (*) | Indicates a management contract or compensatory plan or arrangement. | |
| (**) | Pursuant to Rule 406T of Regulation S-T, the XBRL related information in Exhibit 101 to this Annual Report on Form 10-K shall not be deemed to be “filed” for purposes of Section 18 of the Exchange Act, or otherwise subject to the liability of that section, and shall not be deemed part of a registration statement, prospectus of other document filed under the Securities Act or the Exchange Act, except as shall be expressly set forth by specific reference in such filings. |
| 58 |
SIGNATURES
Pursuant to the requirements of Section 13 or 15(d) of the Securities Exchange Act of 1934, the registrant has duly caused this report to be signed on its behalf by the undersigned, thereunto duly authorized.
| SAJAN, INC. | ||
| /s/ Shannon Zimmerman | 3/30/12 | |
| Shannon Zimmerman | ||
| Chief Executive Officer, President | ||
| /s/ Timothy Clayton | 3/30/12 | |
| Timothy Clayton | ||
| Chief Financial Officer |
| 59 |
POWER OF ATTORNEY
Each person whose signature appears below constitutes SHANNON ZIMMERMAN and TIMOTHY CLAYTON, or either of them, as his or her true and lawful attorney-in-fact and agent, with full power of substitution and resubstitution, for him or her and in his or her name, place and stead, in any and all capacities, to sign any or all amendments to this Annual Report on Form 10-K and to file the same, with all exhibits thereto, and other documents in connection therewith, with the Securities and Exchange Commission, granting unto said attorney-in-fact and agent, full power and authority to do and perform each and every act and thing requisite and necessary to be done in and about the premises, as fully to all intents and purposes as he or she might or could do in person, hereby ratifying and confirming all said attorney-in-fact and agent, or her substitute or substitutes, may lawfully do or cause to be done by virtue thereof.
Pursuant to the requirements of the Securities Exchange Act of 1934, this report has been signed below by the following persons on behalf of the registrant and in the capacities and on the dates indicated.
| /s/ Shannon Zimmerman | 3/30/12 | |||
| Shannon Zimmerman, Director, Chairman, Chief Executive Officer and President (Principal Executive Officer) | ||||
| /s/ Angela Zimmerman | 3/30/12 | |||
| Angela (Angel) Zimmerman, Director | ||||
| /s/ Timothy Clayton | 3/30/12 | |||
| Timothy Clayton, Chief Financial Officer (Principal Financial Officer and Principal Accounting Officer) | ||||
| /s/ Michael W. Rogers | 3/30/12 | |||
| Michael W. Rogers, Director | ||||
| /s/ Kris Tufto | 3/30/12 | |||
| Kris Tufto, Director | ||||
| /s/ Richard C Perkins | 3/30/12 | |||
| Richard C. Perkins, Director | ||||
| /s/ Benno G. Sand | 3/30/12 | |||
| Benno G. Sand, Director | ||||
| /s/ Benjamin Allen | 3/30/12 | |||
| Benjamin Allen, Director |
| 60 |
EXHIBIT INDEX
SAJAN, INC.
ANNUAL REPORT FOR THE YEAR ENDED DECEMBER 31, 2011
| Exhibit No. | Description | |
| 2.1 | Agreement and Plan of Merger, dated January 8, 2010, among MathStar, Inc., Sajan, Inc., Garuda Acquisition, LLC, and Thomas Magne (incorporated by reference to Exhibit 2.1 to the Current Report on Form 8-K filed with the Securities and Exchange Commission (“ SEC ”) on January 11, 2010). | |
| 3.1 | Certificate of Incorporation of the Company (incorporated by reference to Exhibit 3.1 to the Registration Statement on Form S-1 filed by MathStar, Inc. with the SEC on August 3, 2005, Registration No. 333-127164 {“Registration Statement”}). | |
| 3.2 | Certificate of Amendment of the Certificate of Incorporation of the Company filed with the Delaware Secretary of State on May 23, 2008 (incorporated by reference to Exhibit 3.1 to the Current Report on Form 8-K filed with the SEC on May 23, 2008). | |
| 3.3 | Certificate of Designation of Series A Preferred Stock filed with the Secretary of State of the State of Delaware on February 25, 2010 (incorporated by reference to Exhibit 3.1 of the Company’s Current Report on Form 8-K dated February 25, 2010 filed with the SEC). | |
| 3.4 | Certificate of Ownership and Merger merging Sajan, Inc. into MathStar, Inc. filed with the Securities and Exchange Commission on March 3, 2010 (incorporated by reference to Exhibit 3.1 to the Current Report on Form 8-K filed with the SEC on March 3, 2010). | |
| 3.5 | Bylaws of the Company (incorporated by reference to Exhibit 3.2 to the Registration Statement). | |
| 4.1 | Form of common stock certificate of the Company (incorporated by reference to Exhibit 4.1 to the Registration Statement). | |
| 4.2 | Tax Benefit Preservation Plan and Rights Agreement, dated as of February 25, 2010, between the Company and Wells Fargo Shareowner Services, a division of Wells Fargo Bank, National Association, as Rights Agent, together with the following exhibits thereto: Exhibit A - Form of Certificate of Designation of Series A Preferred Stock of the Company; Exhibit B — Form of Right Certificate; Exhibit C — Summary of Rights to Purchase Shares of Preferred Stock of the Company (incorporated by reference to Exhibit 4.1 of the Company’s Current Report on Form 8-K dated February 25, 2010 filed with the Securities and Exchange Commission). | |
| 10.1* | The Company’s 2004 Amended and Restated Long-Term Incentive Plan (incorporated by reference to Exhibit 10.1 to the Current Report on Form 8-K filed with the SEC on May 17, 2007). | |
| 10.2* | Form of Incentive Stock Option Agreement (incorporated by reference to Exhibit 10.2 to the Current Report on Form 8-K filed with the SEC on February 24, 2010). | |
| 10.3* | Form of Non-Statutory Stock Option Agreement for non-employee directors (incorporated by reference to Exhibit 10.5 to the Current Report on Form 8-K filed with the SEC on February 24, 2010). | |
| 10.4* | Form of Common Stock Purchase Warrant (incorporated by reference to Exhibit 10.6 to the Current Report on Form 8-K filed with the SEC on February 24, 2010). |
| 61 |
| 10.5* | Employment Agreement, dated May 19, 2006, and as amended on February 1, 2010, between Sajan, Inc. and Angela Zimmerman (incorporated by reference to Exhibit 10.8 to the Current Report on Form 8-K filed with the SEC on February 24, 2010). | |
| 10.6* | Employment Agreement, dated May 19, 2006, and as amended on February 1, 2010, between Sajan, Inc. and Shannon Zimmerman (incorporated by reference to Exhibit 10.8 to the Current Report on Form 8-K filed with the SEC on February 24, 2010). | |
| 10.7* |
Employment Agreement, dated August 4, 2010, between Sajan, Inc. and Timothy Clayton (incorporated by reference to Exhibit 10.1 to the Current Report on Form 8-K filed with the SEC on August 6, 2010).
| |
| 10.8 | Standard Office Lease Agreement (No. 1) between Sajan, Inc. and River Valley Business Center, LLC, dated February 1, 2010 (incorporated by reference to Exhibit 10.12 to the Current Report on Form 8-K filed with the SEC on February 24, 2010). | |
| 10.9 | Standard Office Lease Agreement (No. 2) between Sajan, Inc. and River Valley Business Center, LLC, dated February 1, 2010 (incorporated by reference to Exhibit 10.13 to the Current Report on Form 8-K filed with the SEC on February 24, 2010). | |
| 10.10 | Standard Office Lease Agreement (No. 3) between Sajan, Inc. and River Valley Business Center, LLC, effective February 28, 2012 (filed herewith). | |
| 10.11 | Promissory Note, dated February 23, 2010, in the original principal amount of $1,000,000 issued by the Company to Shannon and Angel Zimmerman (incorporated by reference to Exhibit 10.14 to the Current Report on Form 8-K filed with the SEC on February 24, 2010). | |
| 10.12 | Escrow Agreement, dated February 23, 2010, among the Company, Sajan, LLC and Thomas Magne, as representative for the shareholders of Sajan, Inc. (incorporated by reference to Exhibit 10.15 to the Current Report on Form 8-K filed with the SEC on February 24, 2010). | |
| 10.13* | Form of Indemnification Agreement between the Company and its officers and directors. | |
| 10.14 | Amendment to Promissory Note dated February 22, 2011 (incorporated by reference to Exhibit 10.1 to the Current Report on Form 8-K filed with the SEC on February 24, 2011). | |
| 10.15 | Loan and Security Agreement dated March 28, 2012, by and among Sajan, Inc., Sajan, LLC and Silicon Valley Bank (filed herewith). | |
| 10.16 | Subordination Agreement dated March 28, 2012, by and among Sajan, Inc., Sajan, LLC, Angel and Shannon Zimmerman and Silicon Valley Bank (filed herewith). | |
| 10.17 | Second Amendment, dated March 26, 2012, to Promissory Note dated February 23, 2010 (filed herewith). |
| 21.1 | Subsidiaries of Sajan, Inc. (filed herewith). | |
| 23.1 | Consent from Baker Tilly Virchow Krause, LLP (filed herewith). | |
| 24.1 | Power of Attorney (included on signature page). | |
| 31.1 | Certification of principal executive officer pursuant to Rule 13a-14(a)/15d-14(a) (filed herewith). | |
| 31.2 | Certification of principal financial officer pursuant to Rule 13a-14(a)/15d-14(a) (filed herewith). | |
| 32.1 | Certification of principal executive officer pursuant to 18 U.S.C. 1350, as adopted pursuant to Section 906 of the Sarbanes-Oxley Act of 2002 (filed herewith). | |
| 32.2 | Certification of principal financial officer pursuant to 18 U.S.C. 1350, as adopted pursuant to Section 906 of the Sarbanes-Oxley Act of 2002 (filed herewith). | |
| 62 |
| 101** | The following financial statements from the Company’s Annual Report on Form 10-K for the year ended December 31, 2012, formatted in Extensible Business Reporting Language (XBRL): (i) the consolidated Balance Sheets, (ii) the Consolidated Statement of Operations, (iii) the Consolidated Statement of Cash Flows, (iv) the Consolidated Statement of Stockholders’ Equity, and (v) Notes to the Consolidated Financial Statements. | |
| (*) | Indicates a management contract or compensatory plan or arrangement. | |
| (**) | Pursuant to Rule 406T of Regulation S-T, the XBRL related information in Exhibit 101 to this Annual Report on Form 10-K shall not be deemed to be “filed” for purposes of Section 18 of the Exchange Act, or otherwise subject to the liability of that section, and shall not be deemed part of a registration statement, prospectus of other document filed under the Securities Act or the Exchange Act, except as shall be expressly set forth by specific reference in such filings. |
| 63 |