Attached files
| file | filename |
|---|---|
| EX-31.1 - CERTIFICATION - LAKE AREA CORN PROCESSORS LLC | exhibit311certification.htm |
| EX-10.22 - RPMG AGREEMENT - LAKE AREA CORN PROCESSORS LLC | exhibit1022rpmgagreement.htm |
| EX-31.2 - CERTIFICATION - LAKE AREA CORN PROCESSORS LLC | exhibit312certification.htm |
| EX-32.1 - CERTIFICATION - LAKE AREA CORN PROCESSORS LLC | exhibit321certification.htm |
| EX-32.2 - CERTIFICATION - LAKE AREA CORN PROCESSORS LLC | exhibit322certification.htm |
UNITED STATES
SECURITIES AND EXCHANGE COMMISSION
Washington, D.C. 20549
FORM 10-K
x | Annual report pursuant to Section 13 or 15(d) of the Securities Exchange Act of 1934. |
For the fiscal year ended December 31, 2010 | |
o | Transition report pursuant to Section 13 or 15(d) of the Securities Exchange Act of 1934. |
Commission file number 000-50254 | |
LAKE AREA CORN PROCESSORS, LLC | |||
(Exact name of registrant as specified in its charter) | |||
South Dakota | 46-0460790 | ||
(State or other jurisdiction of incorporation or organization) | (I.R.S. Employer Identification No.) | ||
46269 SD HIghway 34 P.O. Box 100 Wentworth, South Dakota | 57075 | ||
(Address of principal executive offices) | (Zip Code) | ||
(605) 483-2676 | |||
(Registrant's telephone number, including area code) | |||
Securities registered pursuant to Section 12(b) of the Act: None | |||
Securities registered pursuant to Section 12(g) of the Act: Membership Units | |||
Indicate by check mark if the registrant is a well-known seasoned issuer, as defined in Rule 405 of the Securities Act.
o Yes x No
Indicate by check mark if the registrant is not required to file reports pursuant to Section 13 or Section 15(d) of the Act.
o Yes x No
Indicate by check mark whether the registrant: (1) has filed all reports required to be filed by Section 13 or 15(d) of the Securities Exchange Act of 1934 during the preceding 12 months (or for such shorter period that the registrant was required to file such reports), and (2) has been subject to such filing requirements for the past 90 days. x Yes o No
Indicate by check mark whether the registrant has submitted electronically and posted on its corporate Website, if any, every Interactive Data File required to be submitted and posted pursuant to Rule 405 of Regulation S-T (§232.405 of this chapter) during the preceding 12 months (or for such shorter period that the registrant was required to submit and post such files).
o Yes o No
Indicate by check mark if disclosure of delinquent filers pursuant to Item 405 of Regulation S-K (§229.405 of this chapter) is not contained herein, and will not be contained, to the best of registrant's knowledge, in definitive proxy or information statements incorporated by reference in Part III of this Form 10-K or any amendment to this Form 10-K. o
Indicate by check mark whether the registrant is a large accelerated filer, an accelerated filer, a non-accelerated filer, or a smaller reporting company. See the definitions of “large accelerated filer,” “accelerated filer” and “smaller reporting company” in Rule 12b-2 of the Exchange Act.
Large accelerated filer o | Accelerated filer o | |
Non-accelerated filer x | Smaller Reporting Company o | |
(Do not check if a smaller reporting company) |
Indicate by check mark whether the registrant is a shell company (as defined in Rule 12b-2 of the Act). o Yes x No
As of June 30, 2010, the last business day of the registrant's most recently completed second fiscal quarter, the aggregate market value of the registrant's membership units held by non-affiliates of the registrant was $14,218,375 computed by reference to the most recent public offering price on Form S-4.
As of March 30, 2011, there are 29,620,000 membership units of the registrant outstanding.
DOCUMENTS INCORPORATED BY REFERENCE
The registrant has incorporated by reference into Part III of this Annual Report on Form 10-K portions of its definitive information statement to be filed with the Securities and Exchange Commission within 120 days after the close of the fiscal year covered by this Annual Report (December 31, 2010). This information statement is referred to in this report as the 2011 Information Statement.
INDEX
Page No. | |
2
CAUTIONARY STATEMENTS REGARDING FORWARD-LOOKING STATEMENTS
This annual report contains historical information, as well as forward-looking statements that involve known and unknown risks and relate to future events, our future financial performance, or our expected future operations and actions. In some cases, you can identify forward-looking statements by terms such as “may,” “will,” “should,” “expect,” “plan,” “anticipate,” “believe,” “estimate,” “future,” “intend,” “could,” “hope,” “predict,” “target,” “potential,” or “continue” or the negative of these terms or other similar expressions. These forward-looking statements are only our predictions based upon current information and involve numerous assumptions, risks and uncertainties. Our actual results or actions may differ materially from these forward-looking statements for many reasons, including the reasons described in this report. While it is impossible to identify all such factors, factors that could cause actual results to differ materially from those estimated by us include:
ü | Availability and costs of raw materials, particularly corn and natural gas; |
ü | Changes in the price and market for ethanol, distillers grains and corn oil; |
ü | Our ability to maintain liquidity and maintain our risk management positions; |
ü | Decreases in the price of gasoline or decreased gasoline demand; |
ü | Changes in the availability and cost of credit; |
ü | Changes and advances in ethanol production technology; |
ü | The effectiveness of our risk management strategy to offset increases in the price of our raw materials and decreases in the prices of our products; |
ü | Overcapacity within the ethanol industry causing supply to exceed demand; |
ü | Our ability to market and our reliance on third parties to market our products; |
ü | The decrease or elimination of governmental incentives which support the ethanol industry; |
ü | Changes in the weather or general economic conditions impacting the availability and price of corn; |
ü | Our ability to generate free cash flow to invest in our business and service our debt; |
ü | Changes in plant production capacity or technical difficulties in operating the plant; |
ü | Changes in our business strategy, capital improvements or development plans; |
ü | Our ability to retain key employees and maintain labor relations; |
ü | Our liability resulting from litigation; |
ü | Competition from alternative fuels and alternative fuel additives; and |
ü | Other factors described elsewhere in this report. |
The cautionary statements referred to in this section also should be considered in connection with any subsequent written or oral forward-looking statements that may be issued by us or persons acting on our behalf. We undertake no duty to update these forward-looking statements, even though our situation may change in the future. Furthermore, we cannot guarantee future results, events, levels of activity, performance, or achievements. We caution you not to put undue reliance on any forward-looking statements, which speak only as of the date of this report. You should read this report and the documents that we reference in this report and have filed as exhibits completely and with the understanding that our actual future results may be materially different from what we currently expect. We qualify all of our forward-looking statements by these cautionary statements.
3
PART I.
ITEM 1. BUSINESS.
Overview
Lake Area Corn Processors, LLC is a South Dakota limited liability company that owns and manages an ethanol plant that has a nameplate production capacity of 40 million gallons of ethanol per year through its wholly-owned subsidiary Dakota Ethanol, L.L.C. The ethanol plant is located near Wentworth, South Dakota. Lake Area Corn Processors, LLC is referred to in this report as “LACP,” the “company,” “we,” or “us.” Dakota Ethanol, L.L.C. is referred to in this report as “Dakota Ethanol” or the “ethanol plant.”
Since September 4, 2001, we have been engaged in the production of ethanol and distillers grains. Fuel grade ethanol is our primary product accounting for the majority of our revenue. We also sell distillers grains, a principal co-product of the ethanol production process. During our 2009 fiscal year, we completed the installation of equipment which allows us to extract corn oil from the distillers grains we produce which represents another co-product of the ethanol production process and a new source of revenue for our operations.
General Development of Business
LACP was formed as a South Dakota cooperative on May 25, 1999. On August 20, 2002, our members approved a plan to reorganize into a South Dakota limited liability company. The reorganization became effective on August 31, 2002, and the assets and liabilities of the cooperative were transferred to the newly formed limited liability company. Following the reorganization, our legal name was changed to Lake Area Corn Processors, LLC.
Our ownership of Dakota Ethanol represents substantially our only asset and our only source of revenue. Since we operate Dakota Ethanol as a wholly-owned subsidiary, all revenues generated by Dakota Ethanol are passed to LACP. We make distributions of the income received from Dakota Ethanol to our unit holders in proportion to the number of units held by each member compared to the units held by our members generally.
On July 9, 2010, we elected to repay the entire outstanding balance of our term loan with First National Bank of Omaha (FNBO). Our term loan was used to finance the construction and development of our ethanol plant. We repaid the total outstanding principal balance of $1,282,110 along with the accrued interest and a prepayment penalty of $7,350. Our term loan was scheduled to mature on September 1, 2011. Our other financing with FNBO is still in effect.
Financial Information
Please refer to “Item 7 - Management's Discussion and Analysis of Financial Condition and Results of Operations” for information regarding our results of operations and “Item 8 - Financial Statements and Supplementary Data” for our audited consolidated financial statements.
Principal Products
The principal products produced at the ethanol plant are fuel grade ethanol, distillers grains and corn oil.
Ethanol
Ethanol is ethyl alcohol, a fuel component made primarily from corn and various other grains. Ethanol is primarily used for blending with unleaded gasoline and other fuel products. The vast majority of the ethanol that is produced in the United States uses corn as the feedstock in the ethanol production process. Corn produces large quantities of carbohydrates, which convert into glucose more easily than most other kinds of biomass. As of March 3, 2011, the Renewable Fuels Association estimates United States ethanol production capacity at more than 14.1 billion gallons. However, as of March 3, 2011, the Renewable Fuels Association estimates that 4% of the ethanol production capacity in the United States was idle.
An ethanol plant is essentially a fermentation plant. Ground corn and water are mixed with enzymes and yeast to produce a substance called “beer,” which contains approximately 15% alcohol, 11% solids and 74% water. The “beer” is boiled to separate the water, resulting in ethyl alcohol, which is then dehydrated to increase the alcohol content. This product is then mixed with a certified denaturant such as gasoline to make the product unfit for human consumption and commercially saleable.
4
Ethanol can be used as: (i) an octane enhancer in fuels; (ii) an oxygenated fuel additive for the purpose of reducing ozone and carbon monoxide vehicle emissions; and (iii) a non-petroleum-based gasoline substitute. Used as a fuel oxygenate, ethanol provides a means to control carbon monoxide emissions in large metropolitan areas where oxygenated fuels are required during certain times of the year.
The following table shows the percentage of our total revenue that was derived from sales of ethanol for each of our last three fiscal years:
Fiscal Year | Percentage of Revenue from Sales of Ethanol | |
Ended December 31, 2010 | 84 | % |
Ended December 31, 2009 | 83 | % |
Ended December 31, 2008 | 86 | % |
Distillers Grains
A principal co-product of the ethanol production process is distillers grains, a high protein, high-energy animal feed supplement primarily marketed to the dairy and beef industry. Distillers grains contain by-pass protein that is superior to other protein supplements such as cottonseed meal and soybean meal. By-pass proteins are more digestible to the animal, thus generating greater lactation in milk cows and greater weight gain in beef cattle. Dry mill ethanol processing creates four forms of distillers grains: Distillers Wet Grains (“DWS”), Distillers Modified Wet Grains with Solubles (“DMWS”), Condensed Distillers with Solubles (“CDS”) and Distillers Dried Grains with Solubles (“DDGS”). DWS is processed corn mash that contains approximately 70% moisture. DWS has a shelf life of approximately seven days and can be sold only to consumers within the immediate vicinity of an ethanol plant. DMWS is DWS that has been dried to approximately 50% moisture. DMWS has a slightly longer shelf life of approximately ten days and is often sold to nearby markets. CDS contains approximately 75% moisture and is marketed locally. CDS has a shelf life of approximately thirty days. DDGS is DWS that has been dried to between 10% and 12% moisture. DDGS has an almost indefinite shelf life and may be sold and shipped to any market regardless of its vicinity to an ethanol plant. At our plant, the composition of the distillers grains we produce is approximately 1% DWS, 50% DMWS, 3% CDS and 46% DDGS.
The following table shows the percentage of our total revenue that was derived from sales of distillers grains for each of our last three fiscal years:
Fiscal Year | Percentage of Revenue from Sales of Distillers Grains | |
Ended December 31, 2010 | 13 | % |
Ended December 31, 2009 | 16 | % |
Ended December 31, 2008 | 14 | % |
Corn Oil
During our 2009 fiscal year, we commenced operating our corn oil extraction equipment which allows us to separate some of the corn oil contained in our distillers grains. The corn oil that we produce is not food grade corn oil and therefore cannot be used for human consumption without further refining. However, corn oil can be used as the feedstock to produce biodiesel and has other industrial and feed uses.
For our 2010 fiscal year, revenue from sales of corn oil accounted for approximately 2% of our total revenue. For our 2009 fiscal year, revenue from sales of corn oil accounted for approximately 1% of our total revenue. We did not have any sales of corn oil prior to our 2009 fiscal year.
Incentive Revenue
We receive incentive revenue from the State of South Dakota associated with our production of ethanol. In each of our last three fiscal years, this incentive revenue accounted for less than 1% of our total revenue.
5
Principal Product Markets
Ethanol
The primary market for our ethanol is the domestic fuel blending market. During the end of 2010, ethanol exports to European Union countries increased significantly. However, due to our location, we do not anticipate a significant amount of the ethanol we produce will be exported. Ethanol is generally blended with gasoline before it is sold to the end consumer. Therefore, the primary purchasers of ethanol are fuel blending companies who mix the ethanol we produce with gasoline. As discussed below in the section entitled “Distribution of Principal Products,” we have a third party marketer that sells all of our ethanol. Our ethanol marketer makes all decisions regarding where our ethanol is sold.
Below is a chart showing the price for ethanol at the Sioux Falls, South Dakota Rack during our last three fiscal years.
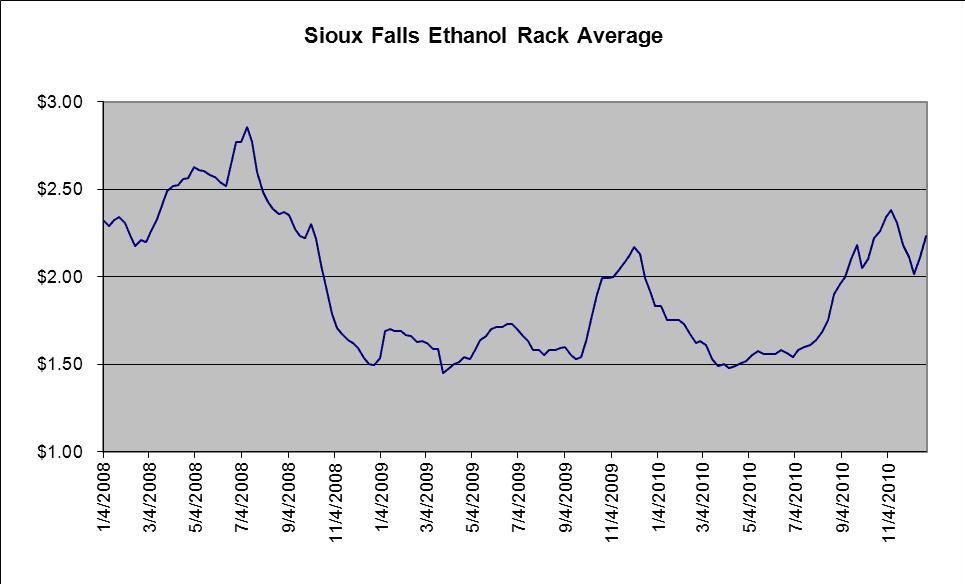
Ethanol prices have been volatile during our last three fiscal years. Ethanol prices increased significantly during the first half of 2008 as energy prices surged. However, energy prices fell significantly during the later half of 2008 due to the worldwide economic downturn. Ethanol prices were lower during 2009 as energy demand was lower and corn prices fell due to favorable weather conditions and decreased demand. Ethanol prices increased during 2010 as corn prices increased, especially at the end of 2010, due to lower corn carryover from strong corn demand and relatively lower supply. We anticipate that ethanol prices will continue at their current levels due to what appears will be sustained high corn prices and higher gasoline prices due to uncertainty and unrest in the Middle East. Please see our “Item 7 - Management's Discussion and Analysis of Financial Condition and Results of Operations” for further discussion of anticipated ethanol prices.
Distillers Grains
Distillers grains are primarily used as an animal feed substitute. Distillers grains are typically fed to animals instead of other traditional animal feeds such as corn and soybean meal. We primarily market our distillers grains through a third-party marketer. However, we market a portion of our distillers grains directly into our local market without the assistance of a third party marketer. We believe that nearly all of our distillers grains are sold to consumers in the United States. However, distillers grains exports have increased recently as distillers grains have become a more accepted animal feed substitute. During 2010, China significantly increased its distillers grains imports as China continues to expand its animal feeding industry and as Chinese consumers increase their meat consumption. However, late in 2010, China instituted an investigation of the United States distillers
6
grains industry based on claims that the United States was dumping distillers grains in China. While management believes that China's dumping claims are without merit, this investigation and subsequent actions by the Chinese government may significantly decrease distillers grains exports to China. This may have a negative impact on market distillers grains prices in the United States. Management believes China's dumping investigation is at odds with market conditions in China where animal feeding operations continue to demand additional distillers grains from the United States. Despite the recent increases in distillers grains exports, we anticipate that the vast majority of our distillers grains will continue to be sold in the domestic market due to our plant's location.
Below is a chart showing the market price for distillers grains compared to corn and soybean meal prices during our last three fiscal years.
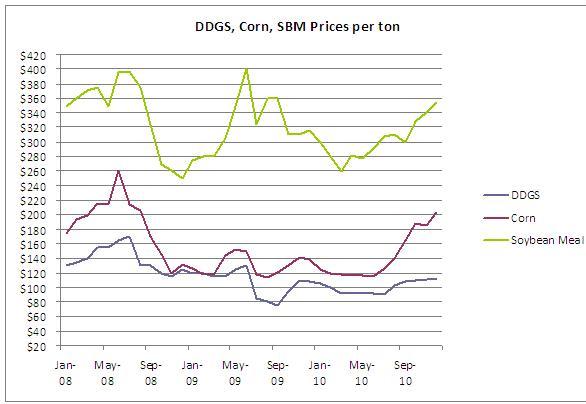
Distillers grains prices tend to follow changes in corn and soybean meal prices. Therefore, we believe that higher corn and soybean meal prices will lead to higher distillers grains prices. However, should we experience an oversupply of distillers grains, we may experience a decrease in distillers grains prices, regardless of the recent high corn prices. This oversupply of distillers grains could result from decreased distillers grains demand from China since China currently purchases a significant amount of the distillers grains the United State ethanol industry produces.
Distribution of Principal Products
Ethanol Distribution
On November 30, 2005, we entered into an Ethanol Fuel Marketing Agreement with Renewable Products Marketing Group (“RPMG”) of Shakopee, Minnesota, for the purposes of marketing and distributing our ethanol. On April 1, 2007, we became an owner of RPMG by making a capital contribution to RPMG. Our capital contribution was $605,000, of which $105,000 was paid at the time we became an owner of RPMG and the balance was paid over time with a portion of our ethanol sales revenue. We have fully paid our capital contribution to RPMG. Becoming an owner of RPMG allows us to share any profits made by RPMG and reduces the fees that we pay RPMG to market our ethanol. We pay RPMG a fee to market our ethanol based on RPMG's actual cost to market our ethanol. On March 26, 2010, we entered into a new ethanol marketing agreement with RPMG on essentially the same terms as our previous agreement. The new ethanol marketing agreement changes the manner in which
7
our marketing fee is calculated. We do not anticipate this change will have a material effect on our ethanol marketing fees.
Distillers Grains Distribution
Other than the distillers grains that we market locally without a third party marketer, our distillers grains are marketed by RPMG, the same entity that markets our ethanol and corn oil. On July 15, 2008 we entered into a distillers grains marketing agreement with RPMG. The initial term of our distillers grains marketing agreement with RPMG was two years. Our distillers grains marketing agreement with RPMG automatically renews for additional one-year terms unless notice of termination is given as provided by the distillers grains marketing agreement. We pay RPMG a commission based on each ton of distillers grains sold by RPMG.
On December 1, 2005, we began marketing some of our distillers grains to our local market without the use of an external marketer. Currently, we market approximately 54% of our distillers grains internally. Shipments of these products are made to local markets by truck. This has allowed us to sell less distillers grains in the form of DDGS which has decreased our natural gas usage and increased our revenues from the sale of distillers grains.
Corn Oil Distribution
We market all of our corn oil through RPMG, which is the same entity that markets our ethanol and distillers grains. On August 11, 2009, we executed a corn oil marketing agreement with RPMG. Pursuant to the corn oil marketing agreement, RPMG agreed to market all of the corn oil we produce. The initial term of the agreement was for one year. The agreement automatically renews for additional one year terms unless either party gives 180 days notice that the agreement will not be renewed. We agreed to pay RPMG a commission based on each pound of our corn oil that is sold by RPMG.
New Products and Services
We did not introduce any new products or services during our 2010 fiscal year.
Patents, Trademarks, Licenses, Franchises and Concessions
We do not currently hold any patents, trademarks, franchises or concessions. We were granted a license by Broin and Associates, Inc., the company that designed and built the ethanol plant, to use certain ethanol production technology necessary to operate our ethanol plant. The cost of the license granted by Broin was included in the amount we paid to Broin to design and build our ethanol plant.
Sources and Availability of Raw Materials
Corn Feedstock Supply
The major raw material required for our ethanol plant to produce ethanol, distillers grains and corn oil is corn. The plant operates in excess of its nameplate capacity of 40 million gallons of ethanol per year, producing approximately 47 million gallons of ethanol annually from approximately 17.1 million bushels of corn. The area surrounding the ethanol plant currently provides an ample supply of corn to meet and exceed our raw material requirements for the production capacity of the plant.
8
Below is a chart showing the spot price of corn during our last three fiscal years.
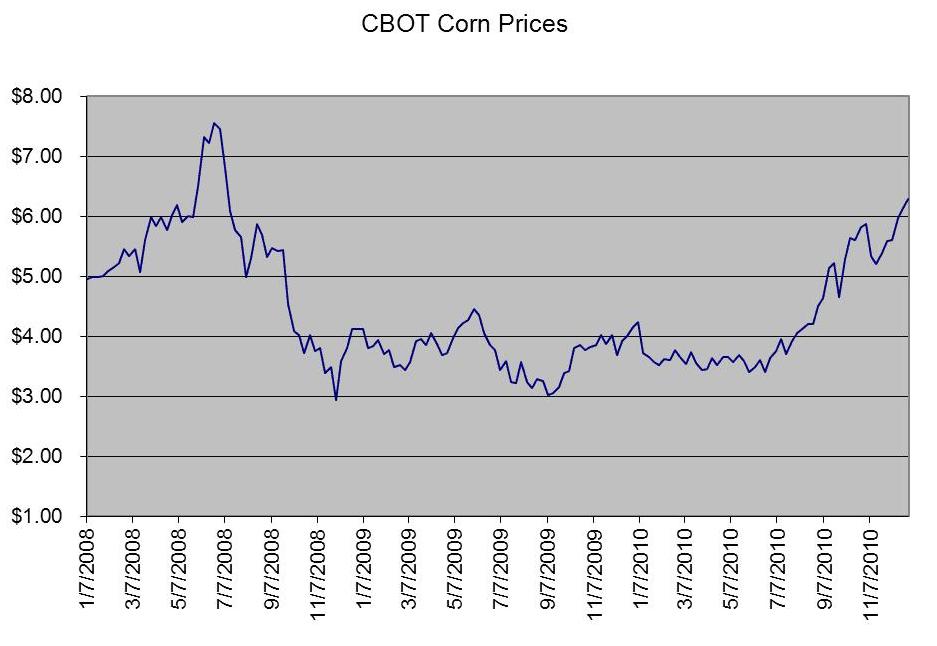
Corn prices have been volatile in recent years due to changes in supply and demand as well as yield and production fluctuations that have had a significant impact on corn prices. Corn carryover from the 2009/2010 crop year was significantly lower than in recent years which resulted in a significant increase in corn prices at the end of 2010 and into 2011. Management believes these higher corn prices will continue until it is clear that the corn harvest in the fall of 2011 will be sufficient to increase corn carryover and meet current demand. Therefore, management believes that the current high corn prices will continue for most of our 2011 fiscal year. Further, should we experience unfavorable weather conditions during the 2011 growing season, corn prices could continue to rise. The area around our ethanol plant experienced strong yields and high corn production during the fall of 2010. Therefore, we have not experienced the same level of corn price increases that other ethanol plants may have experienced.
In February 2009, we entered into an agreement with John Stewart & Associates (“JS&A”) to provide us with consulting services related to our risk management strategy. We agreed to pay JS&A a fee of $2,500 per month to assist us in making risk management decisions regarding our commodity purchases. The initial term of the agreement is one year and thereafter it renews on a month-to-month basis.
Corn is supplied to us primarily from our members who are local agricultural producers and from purchases of corn on the open market. Certain of our members have corn delivery contracts that require them to supply us with corn as a condition of being a member of the company. On August 1, 2007, our board of directors approved a resolution making it voluntary for these members to deliver corn to us under their respective corn delivery agreements. We anticipate that many of our members will continue to supply us with corn on a voluntary basis. We anticipate purchasing corn from third parties should our members fail to supply us with enough corn to operate the ethanol plant at capacity.
Natural Gas
Natural gas is an important input to our manufacturing process. We use natural gas to dry our distillers grains products to moisture contents at which they can be stored for long periods of time. This allows the distillers grains we produce to be transported greater distances which allows them to serve broader livestock markets, including poultry and swine markets in the
9
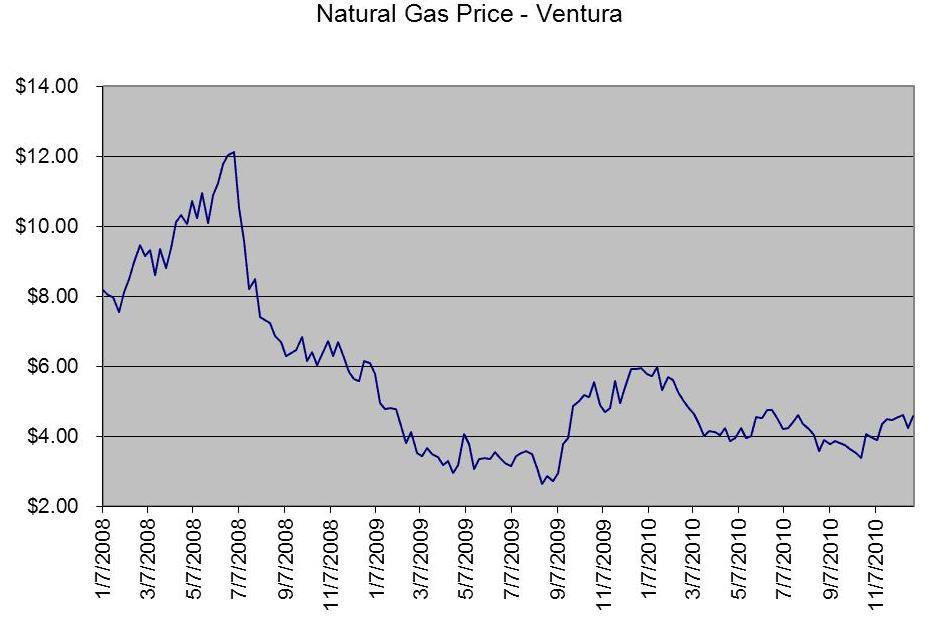
continental United States. We contract with NorthWestern Energy for our natural gas. Under our agreement, the price for our natural gas is based on market rates. The agreement is in effect until 2011 and is renewable for an additional ten-year term, unless the agreement is terminated by either party. We do not anticipate that this agreement will be terminated. Since operations commenced in 2001, there have been no interruptions in the supply of natural gas from NorthWestern Energy, and all of our natural gas requirements have been met. Recently we have experienced significant decreases in natural gas prices which have followed energy and commodity prices generally. We anticipate that natural gas prices will continue to remain low with the typical premium natural gas prices during the winter months. However, should we experience supply interruptions during our 2011 fiscal year, such as from hurricane activity in the Gulf Coast region of the United States, we may experience higher natural gas prices.
Below is a chart showing the spot market price of natural gas during our last three fiscal years.
Electricity
Electricity is necessary for lighting and powering much of the machinery and equipment used in the production process. We contract with Sioux Valley Energy, Inc. to provide all of the electric power and energy requirements for the ethanol plant. The agreement is in effect until 2011 and automatically renews for additional five-year terms, unless at least 18 months notice is given by either party to terminate the agreement prior to the expiration of the current term. We do not anticipate that this agreement will be terminated. We have had no interruptions or shortages in the supply of electricity to the plant since operations commenced in 2001.
Water
Water is a necessary part of the ethanol production process. It is used in the fermentation process and to produce steam for the cooking, evaporation, and distillation processes. We contract with Big Sioux Community Water System, Inc. to meet our water requirements. Our agreement with Big Sioux is for a five-year term commencing in August 2009 and is renewable for additional five year terms. Since our operations commenced in September 2001, we have had no interruption in the supply of water and all of our requirements have been met.
10
Seasonal Factors in Business
We anticipate some seasonality of demand for ethanol during the summer months that coincides with increases in gasoline demand. Since ethanol is typically blended with gasoline, when gasoline demand changes, ethanol demand typically changes correspondingly. Distillers grains demand decreases during the summer months when domestic animal feeding operations typically reduce the size of their herds. In addition, we experience some seasonality in the price we pay for natural gas with premium pricing during the winter months. This increase in natural gas prices coincides with increased natural gas demand for heating needs in the winter months.
Dependence on One or a Few Major Customers
As discussed above, we have entered into marketing agreements with RPMG to market our ethanol, distillers grains and corn oil. Therefore, we rely on RPMG to market almost all of our products, except for the distillers grains that we market locally. Our financial success will be highly dependent on RPMG's ability to market our products at competitive prices. Any loss of RPMG as our marketing agent or any lack of performance under these agreements or inability to secure competitive prices could have a significant negative impact on our revenues. While we believe we can secure new marketers if RPMG were to fail, we may not be able to secure such new marketers at rates which are competitive with RPMG's.
Our Competition
We are in direct competition with numerous ethanol producers, many of whom have greater resources than we do. While management believes we are a lower cost producer of ethanol, larger ethanol producers may be able to take advantages of economies of scale due to their larger size and increased bargaining power with both customers and raw material suppliers. Following the significant growth in the ethanol industry during 2005 and 2006, the ethanol industry has grown at a much slower pace. As of March 3, 2011, the Renewable Fuels Association estimates that there are 204 ethanol production facilities in the United States with capacity to produce approximately 14.1 billion gallons of ethanol and another 9 plants under expansion or construction with capacity to produce an additional 522 million gallons. However, the RFA estimates that approximately 4% of the ethanol production capacity in the United States was not operating as of March 3, 2011. The ethanol industry is continuing to experience a consolidation where a few larger ethanol producers are increasing their production capacities and are controlling a larger portion of United States ethanol production. The largest ethanol producers include Archer Daniels Midland, Green Plains Renewable Energy, POET, and Valero Renewable Fuels, each of which are capable of producing significantly more ethanol than we produce.
The following table identifies the largest ethanol producers in the United States along with their production capacities.
U.S. FUEL ETHANOL PRODUCTION CAPACITY
BY TOP PRODUCERS
Producers of Approximately 600
million gallons per year (MMgy) or more
Company | Current Capacity (MMgy) | Under Construction/Expansions (MMgy) | ||||
POET Biorefining | 1,629 | — | ||||
Archer Daniels Midland | 1,750 | — | ||||
Valero Renewable Fuels | 1,130 | — | ||||
Green Plains Renewable Energy | 680 | — |
Updated: March 3, 2011
Ethanol is a commodity product where competition in the industry is predominantly based on price. Larger ethanol producers may be able to realize economies of scale in their operations that we are unable to realize. This could put us at a competitive disadvantage to other ethanol producers.
In 2008, Valero Renewable Fuels, which is a subsidiary of a major gasoline refining company, purchased several ethanol plants from the VeraSun Energy bankruptcy auction. Currently, Valero Renewable Fuels owns 10 ethanol plants with capacity to produce approximately 1.1 billion gallons of ethanol annually. This makes Valero Renewable Fuels one of the largest ethanol producers in the United States. Further, since the parent company of Valero Renewable Fuels is a gasoline blender, Valero Renewable Fuels has an established customer for the ethanol it produces which may allow Valero Renewable Fuels to be more competitive in the ethanol industry than we are able. At times when ethanol demand may be lower, it is unlikely that Valero
11
Renewable Fuels will have difficulty selling the ethanol it produces due to the fact that it is a subsidiary of a company that is required to blend a significant amount of ethanol. While Valero has the largest stake in the ethanol industry of any oil company, other oil companies have become involved in the ethanol industry. This trend may continue. Should other large oil companies become more involved in the ethanol industry, it may be increasingly difficult for us to compete. While we believe that we are a lower cost producer of ethanol, increased competition in the ethanol industry may make it more difficult for us to operate the ethanol plant profitably.
We anticipate increased competition from renewable fuels that do not use corn as the feedstock. Many of the current ethanol production incentives are designed to encourage the production of renewable fuels using raw materials other than corn. One type of ethanol production feedstock that is being explored is cellulose. Cellulose is the main component of plant cell walls and is the most common organic compound on earth. Cellulose is found in wood chips, corn stalks, rice straw, amongst other common plants. Cellulosic ethanol is ethanol produced from cellulose. Currently, cellulosic ethanol production technology is not sufficiently advanced to produce cellulosic ethanol on a commercial scale. However, due to government incentives designed to encourage innovation in the production of cellulosic ethanol, we anticipate that commercially viable cellulosic ethanol technology will be developed in the near future. Several companies and researchers have commenced pilot projects to study the feasibility of commercially producing cellulosic ethanol. If this technology can be profitably employed on a commercial scale, it could potentially lead to ethanol that is less expensive to produce than corn based ethanol, especially when corn prices are high. Cellulosic ethanol may also capture more government subsidies and assistance than corn based ethanol. This could decrease demand for our product or result in competitive disadvantages for our ethanol production process.
A number of automotive, industrial and power generation manufacturers are developing alternative clean power systems using fuel cells, plug-in hybrids, electric cars or clean burning gaseous fuels. Like ethanol, the emerging fuel cell industry offers a technological option to address worldwide energy costs, the long-term availability of petroleum reserves and environmental concerns. Fuel cells have emerged as a potential alternative to certain existing power sources because of their higher efficiency, reduced noise and lower emissions. Fuel cell industry participants are currently targeting the transportation, stationary power and portable power markets in order to decrease fuel costs, lessen dependence on crude oil and reduce harmful emissions. Recently, several Japanese car makers and related companies issued a press release signaling the release of commercially available fuel cell vehicles as soon as 2015. If the fuel cell industry continues to expand and gain broad acceptance and becomes readily available to consumers for motor vehicle use, we may not be able to compete effectively. This additional competition could reduce the demand for ethanol, which would negatively impact our profitability.
Distillers Grains Competition
Our ethanol plant competes with other ethanol producers in the production and sales of distillers grains. Distillers grains are primarily used as an animal feed supplement which replaces corn and soybean meal. As a result, we believe that distillers grains prices are positively impacted by increases in corn and soybean prices. In addition, recently the United States ethanol industry has experienced increased exports of distillers grains which management believes has positively impacted demand and prices for distillers grains in the United States. In the event these distillers grains exports decrease, such as due to tariffs being imposed by the Chinese government following its anti-dumping investigation, it could lead to an oversupply of distillers grains. This could result in increased competition among ethanol producers for sales of distillers grains. This could negatively impact distillers grains prices in the United States.
Research and Development
We do not conduct any research and development activities associated with the development of new technologies for use in producing ethanol, distillers grains and corn oil.
Governmental Regulation
Federal Ethanol Supports
The ethanol industry is dependent on several economic incentives to produce ethanol, including federal tax incentives and ethanol use mandates. One significant federal ethanol support is the Federal Renewable Fuels Standard (the “RFS”). The RFS requires that in each year, a certain amount of renewable fuels must be used in the United States. The RFS is a national program that does not require that any renewable fuels be used in any particular area or state, allowing refiners to use renewable fuel blends in those areas where it is most cost-effective. The RFS requirement increases incrementally each year until the United States is required to use 36 billion gallons of renewable fuels by 2022. Starting in 2009, the RFS required that a portion of the RFS must be met by certain “advanced” renewable fuels. These advanced renewable fuels include ethanol that is not made from corn, such as cellulosic ethanol and biomass based biodiesel. The use of these advanced renewable fuels increases each year as
12
a percentage of the total renewable fuels required to be used in the United States.
The RFS for 2010 was approximately 13 billion gallons, of which corn based ethanol could be used to satisfy approximately 12 billion gallons. The RFS for 2011 is approximately 14 billion gallons, of which corn based ethanol can be used to satisfy approximately 12.6 billion gallons. Current ethanol production capacity exceeds the 2011 RFS requirement which can be satisfied by corn based ethanol.
In February 2010, the EPA issued new regulations governing the RFS. These new regulations have been called RFS2. The most controversial part of RFS2 involves what is commonly referred to as the lifecycle analysis of green house gas emissions. Specifically, the EPA adopted rules to determine which renewable fuels provided sufficient reductions in green house gases, compared to conventional gasoline, to qualify under the RFS program. RFS2 establishes a tiered approach, where regular renewable fuels are required to accomplish a 20% green house gas reduction compared to gasoline, advanced biofuels and biomass-based biodiesel must accomplish a 50% reduction in green house gases, and cellulosic biofuels must accomplish a 60% reduction in green house gases. Any fuels that fail to meet this standard cannot be used by fuel blenders to satisfy their obligations under the RFS program. The scientific method of calculating these green house gas reductions has been a contentious issue. Many in the ethanol industry were concerned that corn based ethanol would not meet the 20% green house gas reduction requirement based on certain parts of the environmental impact model that many in the ethanol industry believed was scientifically suspect. However, RFS2 as adopted by the EPA provides that corn-based ethanol from modern ethanol production processes does meet the definition of a renewable fuel under the RFS program. Our ethanol plant was grandfathered into the RFS due to the fact that it was constructed prior to the effective date of the lifecycle green house gas requirement and is not required to prove compliance with the lifecycle green house gas reductions. In addition to the lifecycle green house gas reductions, many in the ethanol industry are concerned that certain provisions of RFS2 as adopted may disproportionately benefit ethanol produced from sugarcane. This could make sugarcane based ethanol, which is primarily produced in Brazil, more competitive in the United States ethanol market. If this were to occur, it could reduce demand for the ethanol that we produce.
Many in the ethanol industry believe that it will be difficult to meet the RFS requirement in future years without an increase in the percentage of ethanol that can be blended with gasoline for use in standard (non-flex fuel) vehicles. Most ethanol that is used in the United States is sold in a blend called E10. E10 is a blend of 10% ethanol and 90% gasoline. E10 is approved for use in all standard vehicles. Estimates indicate that gasoline demand in the United States is approximately 135 billion gallons per year. Assuming that all gasoline in the United States is blended at a rate of 10% ethanol and 90% gasoline, the maximum demand for ethanol is 13.5 billion gallons per year. This is commonly referred to as the “blend wall,” which represents a theoretical limit where more ethanol cannot be blended into the national gasoline pool. This is a theoretical limit because it is believed that it would not be possible to blend ethanol into every gallon of gasoline that is being used in the United States and it discounts the possibility of additional ethanol used in higher percentage blends such as E85 used in flex fuel vehicles. Many in the ethanol industry believe that we will reach this blend wall in 2011, since the RFS requirement for 2011 is 14 billion gallons, much of which will come from ethanol. The RFS requires that 36 billion gallons of renewable fuels must be used each year by 2022, which equates to approximately 27% renewable fuels used per gallon of gasoline sold. In order to meet the RFS mandate and expand demand for ethanol, management believes higher percentage blends of ethanol must be utilized in standard vehicles.
Recently, the United States Environmental Protection Agency allowed the use of E15, gasoline which is blended at a rate of 15% ethanol and 85% gasoline, in vehicles manufactured in the model year 2001 and later. Management believes that many gasoline retailers will refuse to provide E15 because not all standard vehicles will be allowed to use E15 and due to liability concerns regarding consumers who use E15 in unapproved vehicles. There are stiff fines that can be imposed on consumers and retail gas station owners if E15 is used in vehicles which are not approved by the EPA. This has led to significant concern from retail gas station owners that they could be subject to hefty fines if their customers use E15 in vehicles that are not approved by the EPA. Further, the EPA is considering instituting labeling requirements associated with E15 which may discourage consumers from purchasing E15. Some believe these labeling requirements may also discourage consumers from purchasing E10 blends. Management believes the labeling requirements the EPA is considering unfairly portray ethanol blended fuels. As a result of all of these factors, the approval of E15 may not significantly increase demand for ethanol. Two lawsuits were filed on November 9, 2010 by representatives of the food industry and the petroleum industry challenging the EPA's approval of E15. It is unclear what effect these lawsuits will have on the implementation of E15 in the United States retail gasoline market.
In addition to the RFS, the ethanol industry depends on the Volumetric Ethanol Excise Tax Credit (“VEETC”). VEETC provides a volumetric ethanol excise tax credit of 45 cents per gallon of ethanol that is sold in a blend of at least 10% ethanol, which equals a credit of 4.5 cents per gallon of E10 sold (total credit of 45 cents per gallon of ethanol blended at a rate of 10% which equals 4.5 cents per gallon for E10). VEETC was recently renewed until December 31, 2011. If this tax credit is not renewed before the end of 2011, it likely would have a negative impact on the price of ethanol and demand for ethanol in the market due to reduced discretionary blending of ethanol. Discretionary blending is when gasoline blenders use ethanol to reduce the cost of blended gasoline. However, due to the RFS, we anticipate that demand for ethanol will continue to mirror the RFS requirement,
13
even if the VEETC is not renewed past 2011. If the RFS is reduced or eliminated, the decrease in demand for ethanol related to the elimination of VEETC may be more substantial.
The USDA recently announced that it will provide financial assistance to help implement more “blender pumps” in the United States in order to increase demand for ethanol and to help offset the cost of introducing mid-level ethanol blends into the United States retail gasoline market. A blender pump is a gasoline pump that can dispense a variety of different ethanol/gasoline blends. Blender pumps typically can dispense E10, E20, E30, E40, E50 and E85. These blender pump accomplish these different ethanol/gasoline blends by internally mixing ethanol and gasoline which are held in separate tanks at the retail gas stations. Many in the ethanol industry believe that increased use of blender pumps will increase demand for ethanol by allowing gasoline retailers to provide various mid-level ethanol blends in a cost effective manner and allowing consumers with flex-fuel vehicles to purchase more ethanol through these mid-level blends. However, blender pumps cost as much as $25,000 each, so it may take time before they become widely available in the retail gasoline market.
Effect of Governmental Regulation
The government's regulation of the environment changes constantly. We are subject to extensive air, water and other environmental regulations and we have been required to obtain a number of environmental permits to construct, expand and operate the plant. It is possible that more stringent federal or state environmental rules or regulations could be adopted, which could increase our operating costs and expenses. It also is possible that federal or state environmental rules or regulations could be adopted that could have an adverse effect on the use of ethanol. Plant operations are governed by the Occupational Safety and Health Administration (“OSHA”). OSHA regulations may change such that the costs of operating the plant may increase. Any of these regulatory factors may result in higher costs or other adverse conditions effecting our operations, cash flows and financial performance.
In late 2009, California passed a Low Carbon Fuels Standard (LCFS). The California LCFS requires that renewable fuels used in California must accomplish certain reductions in green house gases which is measured using a lifecycle analysis, similar to RFS2. Management believes that this lifecycle analysis is based on unsound scientific principles that unfairly harms corn based ethanol. Management believes that these new regulations could preclude corn based ethanol from being used in California. California represents a significant ethanol demand market. If we are unable to supply ethanol to California, it could significantly reduce demand for the ethanol we produce. Currently, several lawsuits have been filed challenging the California LCFS.
United States ethanol production is currently benefited by a 54 cent per gallon tariff imposed on ethanol imported into the United States. The 54 cent per gallon tariff was recently extended until December 31, 2011. If this tariff is eliminated, it could lead to the importation of ethanol produced in other countries, especially in areas of the United States that are easily accessible by international shipping ports. Ethanol imported from other countries may be a less expensive alternative to domestically produced ethanol and may affect our ability to sell our ethanol profitably.
Costs and Effects of Compliance with Environmental Laws
We are subject to extensive air, water and other environmental regulations, and we have been required to obtain a number of environmental permits to construct and operate the plant. We have obtained all of the necessary permits to operate the plant. Although we have been successful in obtaining all of the permits currently required, any retroactive change in environmental regulations, either at the federal or state level, could require us to obtain additional permits or spend considerable resources on complying with such regulations. In addition, we may be required to purchase and install equipment for controlling and improving emissions. During our 2010 fiscal year, our costs of environmental compliance were approximately $37,000. We anticipate that our environmental compliance costs will be approximately $115,000 during our 2011 fiscal year because we will be doing additional environmental testing required for environmental permit renewals we will apply for during our 2011 fiscal year.
We are subject to environmental oversight by the EPA. There is always a risk that the EPA may enforce certain rules and regulations differently than South Dakota's environmental administrators. South Dakota or EPA rules are subject to change, and any such changes could result in greater regulatory burdens on plant operations. We could also be subject to environmental or nuisance claims from adjacent property owners or residents in the area arising from possible foul smells or other air or water discharges from the plant. Such claims may result in an adverse result in court if we are deemed to engage in a nuisance that substantially impairs the fair use and enjoyment of property.
The government's regulation of the environment changes constantly. It is possible that federal or state environmental rules or regulations could be adopted that could have an adverse effect on the use of ethanol. In addition, in the future our industry may be negatively impacted by the effects of climate change legislation, specifically legislation aimed at reducing greenhouse gas
14
emissions. In 2007, the Supreme Court decided a case in which it ruled that carbon dioxide is an air pollutant under the Clean Air Act for the purposes of motor vehicle emissions. The Supreme Court directed the EPA to regulate carbon dioxide from vehicle emissions as a pollutant under the Clean Air Act. Additionally, legislation is pending in Congress on a comprehensive carbon dioxide regulatory scheme, such as a carbon tax or cap-and-trade system which could affect how our plant is regulated. Further, the California LCFS has signaled greater interest by the states in regulating greenhouse gas emissions. If the EPA or the State of South Dakota were to regulate carbon dioxide emissions by plants such as ours, we may have to apply for additional permits or we may be required to install carbon dioxide mitigation equipment. Compliance with any future regulation of carbon dioxide or other greenhouse gas emissions, could require us to use our capital resources to comply with these environmental regulations.
Employees
As of March 30, 2011, we had a total of 38 full-time employees. We do not expect to hire a significant number of employees in the next 12 months.
Financial Information about Geographic Areas
All of our operations are domiciled in the United States. All of the products sold to our customers for fiscal years 2010, 2009 and 2008 were produced in the United States and all of our long-lived assets are domiciled in the United States. We have engaged a third-party professional marketer which decides where the majority of our products are marketed and we have no control over the marketing decisions made by our third-party professional marketer. Therefore, some of our products may be sold outside of the United States based on decisions made by our marketer.
ITEM 1A. RISK FACTORS.
You should carefully read and consider the risks and uncertainties below and the other information contained in this report. The risks and uncertainties described below are not the only ones we may face. The following risks, together with additional risks and uncertainties not currently known to us or that we currently deem immaterial could impair our financial condition and results of operation.
Risks Relating to Our Business
We may violate the terms of our credit agreement and financial covenants which could result in our lender demanding immediate repayment of our loans. At the end of our 2008 fiscal year and the beginning of our 2009 fiscal year, we were not in compliance with all of our financial loan covenants due to tight operating margins and unfavorable conditions in the ethanol industry. We have addressed all of these prior loan non-compliances and we are currently in compliance with all of our financial loan covenants. Current management projections indicate that we will be in compliance with our loan covenants for at least the next 12 months. However, unforeseen circumstances may develop which could result in us violating our loan covenants. If we violate the terms of our credit agreement, our primary lender could deem us in default of our loans and require us to immediately repay the entire outstanding balance of our loans. If we do not have the funds available to repay the loans or we cannot find another source of financing, we may fail which could decrease the value of our units.
Our financial performance is significantly dependent on corn and natural gas prices. Our results of operations and financial condition are significantly affected by the cost and supply of corn and natural gas. Generally, we cannot pass on increases in input prices to our customers. Changes in the price and supply of corn and natural gas are subject to and determined by market forces over which we have no control.
Corn, as with most other crops, is affected by weather, disease and other environmental conditions. The price of corn is also influenced by general economic, market and government factors. These factors include weather conditions, farmer planting decisions, domestic and foreign government farm programs and policies, global demand, supply and quality. Changes in the price of corn can significantly affect our business. Generally, higher corn prices will produce lower profit margins and, therefore, represent unfavorable market conditions. If we endure high corn prices for a sustained period of time without corresponding increases in the selling price of ethanol and distillers grains, such pricing may reduce our ability to operate our ethanol plant profitably. If our region becomes saturated by ethanol plants, corn used for ethanol could consume a significant portion of the total corn production in our region, which would likely increase local corn prices. We may not be able to offset an increase in the price of corn by increasing the price of our products.
The prices for and availability of natural gas are subject to volatile market conditions, including supply shortages and infrastructure incapacities. Significant disruptions in the supply of natural gas could impair our ability to operate the ethanol plant.
15
During the end of 2005 and early 2006, natural gas supply disruptions as a result of hurricanes in the Gulf Coast led to historically high natural gas prices. At any time, similar supply disruptions may increase the price we pay for natural gas.
Increases in the price we pay for corn and natural gas, without corresponding increases in the price we receive for our ethanol, distillers grains and corn oil, may make our ethanol plant operate unprofitably which could reduce or eliminate the value of our units.
The spread between ethanol and corn prices can vary significantly which could prevent us from operating the ethanol plant profitably. Corn costs significantly impact our cost of goods sold. The spread between the price of ethanol and the price we pay per bushel of corn has fluctuated significantly in the past and may fluctuate significantly in the future. The ethanol industry is currently experiencing tight operating margins. These tight operating margins could continue for a significant period of time. Any volatility in the spread between the price of ethanol and price of corn may lead to volatility in our net income which could lead to negative operating margins. Any reduction in the spread between ethanol and corn prices, whether as a result of an increase in corn prices or a reduction in ethanol prices, could prevent us from operating the ethanol plant profitably. Our inability to operate the ethanol plant profitably for an extended period of time may reduce or eliminate the value of our units.
Our revenues will be greatly affected by the price at which we can sell our ethanol and distillers grains which could result in our inability to operate the ethanol plant profitably. The prices of ethanol and distillers grains can be volatile as a result of a number of factors. These factors include overall supply and demand, commodity prices generally, including the price of gasoline and corn, government mandates for ethanol use such as the Renewable Fuels Standard, levels of government support, the blend wall and the availability and price of competing products.
In recent years, the price of ethanol has been volatile. We anticipate the price of ethanol will continue to be volatile as a result of changes in ethanol supply and demand, uncertainty regarding oil prices due to instability in the Middle East, and the effect the improving economy will have on energy demand and prices. These factors will likely create swings in the price of ethanol into the foreseeable future. Further, we anticipate that increases in ethanol supply will also lead to increases in distillers grains supply. If the increased supply of distillers grains is not also met with corresponding increases in distillers grains demand, it may reduce the selling price of distillers grains. This is especially true if distillers grains exports to China decrease or stop altogether due to the recent Chinese anti-dumping investigation and any tariffs the Chinese may institute. As the ethanol industry continues to grow, we anticipate volatility in the price of both ethanol and distillers grains which makes future price projections unreliable. Any downward changes in the price of ethanol and/or distillers grains will result in less revenue and may impact our ability to operate profitably.
The price of distillers grains may decline as a result of China's anti-dumping investigation of distillers grains originating in the United Sates. Estimates indicate that as much as 10 to 15 percent of the distillers grains produced in the United States will be exported to China in the coming year. However, this export market may be jeopardized if the Chinese government imposes trade barriers in response to the outcome of an anti-dumping investigation currently being conducted by the Chinese Ministry of Commerce. If producers and exporters of distillers grains are subjected to trade barriers when selling distillers grains to Chinese customers, there may be a reduction in the price of distillers grains in the United States. Declines in the price we receive for our distillers grains will lead to decreased revenues and may result in our inability to operate the ethanol plant profitably.
Our business is not diversified. Our success depends on our ability to profitably operate our ethanol plant. We do not have any other lines of business or other sources of revenue if we are unable to operate our ethanol plant and manufacture ethanol, distillers grains and corn oil. If economic or political factors adversely affect the market for ethanol, distillers grains and corn oil, we may not be able to continue our operations. Our business would also be significantly harmed if our ethanol plant could not operate at full capacity for any extended period of time. This could reduce or eliminate the value of our units.
Our inability to secure credit facilities we may require in the future may negatively impact our liquidity. Due to current conditions in the credit markets, it has been difficult for businesses to secure financing. While we do not currently require more financing than we have, in the future we may need additional financing. If we require financing in the future and we are unable to secure such financing, or we are unable to secure the financing we require on reasonable terms, it may have a negative impact on our liquidity. This could negatively impact the value of our units.
Advances in ethanol production technology could require us to incur costs to update our plant or could otherwise hinder our ability to compete or operate profitably. Advances and changes in the technology of ethanol production are expected to occur. Such advances and changes may make the ethanol production technology installed in our plant less desirable or obsolete. These advances could also allow our competitors to produce ethanol at a lower cost than us. If we are unable to adopt or incorporate technological advances, our ethanol production methods and processes could be less efficient than our competitors, which could cause our plant to become uncompetitive or completely obsolete. If our competitors develop, obtain or license technology that is
16
superior to ours or that makes our technology obsolete, we may be required to incur significant costs to enhance or acquire new technology so that our ethanol production remains competitive. Alternatively, we may be required to seek third-party licenses, which could also result in significant expenditures. These third-party licenses may not be available or, once obtained, may not continue to be available on commercially reasonable terms. These costs could negatively impact our financial performance by increasing our operating costs and reducing our net income.
Our product marketer may fail to market our products at competitive prices which may cause us to operate unprofitably. RPMG is the sole marketer of all of our ethanol, corn oil and most of our distillers grains, and we rely heavily on its marketing efforts to successfully sell our products. Because RPMG sells ethanol, corn oil and distillers grains for a number of other producers, we have limited control over its sales efforts. Our financial performance is dependent upon the financial health of RPMG as substantially all of our revenues are attributable to RPMG's sales. If RPMG breaches our marketing agreements or it cannot market all of the ethanol, corn oil and distillers grains we produce, we may not have any readily available means to sell our ethanol, corn oil and distillers grains and our financial performance could be negatively affected. While we market a portion of our distillers grains internally to local consumers, we do not anticipate that we would have the ability to sell all of the distillers grains, corn oil and ethanol we produce ourselves. If our agreements with RPMG terminate, we may seek other arrangements to sell our ethanol, corn oil and distillers grains, including selling our own product, but we may not be able to achieve results comparable to those achieved by RPMG which could harm our financial performance.
We engage in hedging transactions which involve risks that could harm our business. We are exposed to market risk from changes in commodity prices. Exposure to commodity price risk results from our dependence on corn and natural gas in the ethanol production process. We seek to minimize the risks from fluctuations in the prices of corn, natural gas and ethanol through the use of hedging instruments. The effectiveness of our hedging strategies is dependent on the price of corn, natural gas and ethanol and our ability to sell sufficient products to use all of the corn and natural gas for which we have futures contracts. Our hedging activities may not successfully reduce the risk caused by price fluctuation which may leave us vulnerable to corn and natural gas price volatility. We may choose not to engage in hedging transactions in the future and our operations and financial conditions may be adversely affected during periods in which corn and/or natural gas prices increase. Significant losses on our hedging activities may cause us to operate unprofitably and could decrease the value of our units.
We may incur casualty losses that are not covered by insurance which could negatively impact the value of our units. We have purchased insurance which we believe adequately covers our losses from foreseeable risks. However, there are risks that we may encounter for which there is no insurance or for which insurance is not available on terms that are acceptable to us. If we experience a loss which materially impairs our ability to operate the ethanol plant which is not covered by insurance, the value of our units could be reduced or eliminated.
Risks Related to Ethanol Industry
Demand for ethanol may not continue to grow unless ethanol can be blended into gasoline in higher percentage blends for standard vehicles. Currently, ethanol is primarily blended with gasoline for use in standard (non-flex fuel) vehicles to create a blend which is 10% ethanol and 90% gasoline. Estimates indicate that approximately 135 billion gallons of gasoline are sold in the United States each year. Assuming that all gasoline in the United States is blended at a rate of 10% ethanol and 90% gasoline, the maximum demand for ethanol is 13.5 billion gallons. This is commonly referred to as the “blend wall,” which represents a theoretical limit where more ethanol cannot be blended into the national gasoline pool. Management believes that the ethanol industry has essentially reached the blend wall. Management believes that in order to expand demand for ethanol, higher percentage blends of ethanol must be utilized in standard vehicles. Such higher percentage blends of ethanol are a contentious issue. Automobile manufacturers and environmental groups have fought against higher percentage ethanol blends. Recently, the EPA approved the use of E15 in standard vehicles produced in the model year 2001 and later. However, the EPA is also expected to introduce E15 labeling requirements which may cause consumers to avoid using E15. The fact that E15 has not been approved for use in all vehicles and the anticipated labeling requirements may lead to gasoline retailers refusing to carry E15. Further, many gasoline retailers are fearful of significant fines that could be levied against gas stations if consumers use E15 in vehicles that have not been approved by the EPA. Without an increase in the allowable percentage blends of ethanol that can be used in all vehicles, demand for ethanol may not continue to increase which could decrease the selling price of ethanol and could result in our inability to operate the ethanol plant profitably. This could reduce or eliminate the value of our units.
The ethanol industry is changing rapidly which can result in unexpected developments that could negatively impact our operations and the value of our units. The ethanol industry has grown significantly in the last decade. According to the Renewable Fuels Association, the ethanol industry has grown from approximately 1.5 billion gallons of production per year in 1999 to more than 13 billion gallons in 2010. This rapid growth has resulted in significant shifts in supply and demand of ethanol over a very short period of time. As a result, past performance by the ethanol plant or the ethanol industry generally might not be indicative of future performance. We may experience a rapid shift in the economic conditions in the ethanol industry which may
17
make it difficult to operate the ethanol plant profitably. If changes occur in the ethanol industry that make it difficult for us to operate the ethanol plant profitably, it could result in a reduction in the value of our units.
Overcapacity within the ethanol industry could cause an oversupply of ethanol and a decline in ethanol prices. Excess ethanol production capacity could have an adverse impact on our results of operations, cash flows and general financial condition. If demand for ethanol does not grow at the same pace as increases in supply, we would expect the price of ethanol to decline. If excess capacity in the ethanol industry occurs, the market price of ethanol may decline to a level that is inadequate to generate sufficient cash flow to cover our costs which could reduce the value of our units.
We operate in an intensely competitive industry and compete with larger, better financed companies which could impact our ability to operate profitably. There is significant competition among ethanol producers. There are numerous producer-owned and privately-owned ethanol plants operating throughout the Midwest and elsewhere in the United States. We also face competition from outside of the United States. The passage of the Energy Policy Act of 2005 included a renewable fuels mandate. The Energy Independence and Security Act of 2007 increased the RFS to 36 billion gallons by 2022. Further, some states have passed renewable fuel mandates. These increases in ethanol demand have encouraged companies to enter the ethanol industry. The largest ethanol producers include POET, Archer Daniels Midland, Green Plains Renewable Energy, and Valero Renewable Fuels, all of which are each capable of producing more ethanol than we produce. We may not be able to compete effectively with these larger ethanol producers. Further, many believe that there will be consolidation occurring in the ethanol industry in the near future which will likely lead to a few companies who control a significant portion of the ethanol production market. These larger ethanol producers may be able to affect the ethanol market in ways that are not beneficial to us which could affect our financial performance.
Competition from the advancement of alternative fuels may lessen the demand for ethanol. Alternative fuels, gasoline oxygenates and ethanol production methods are continually under development. A number of automotive, industrial and power generation manufacturers are developing alternative clean power systems using fuel cells, plug-in hybrids, electric cars or clean burning gaseous fuels. Like ethanol, these emerging technologies offer an option to address worldwide energy costs, the long-term availability of petroleum reserves and environmental concerns. Fuel cells have emerged as a potential alternative to certain existing power sources because of their higher efficiency, reduced noise and lower emissions. Fuel cell industry participants are currently targeting the transportation, stationary power and portable power markets in order to decrease fuel costs, lessen dependence on crude oil and reduce harmful emissions. Several companies in Japan recently issued a press release indicating that they plan to release commercially available fuel cells as early as 2015. If these alternative technologies continue to expand and gain broad acceptance and become readily available to consumers for motor vehicle use, we may not be able to compete effectively. This additional competition could reduce the demand for ethanol, resulting in lower ethanol prices that might adversely affect our results of operations and financial condition.
Technology advances in the commercialization of cellulosic ethanol may decrease demand for corn based ethanol which may negatively affect our profitability. The current trend in ethanol production research is to develop an efficient method of producing ethanol from cellulose-based biomass, such as agricultural waste, forest residue, municipal solid waste, and energy crops. This trend is driven by the fact that cellulose-based biomass is generally cheaper than corn, and producing ethanol from cellulose-based biomass would create opportunities to produce ethanol in areas which are unable to grow corn. The Energy Independence and Security Act of 2007 and the 2008 Farm Bill offer a very strong incentive to develop commercial scale cellulosic ethanol. The RFS requires that 16 billion gallons per year of advanced bio-fuels be consumed in the United States by 2022. Additionally, state and federal grants have been awarded to several companies who are seeking to develop commercial-scale cellulosic ethanol plants. We expect this will encourage innovation that may lead to commercially viable cellulosic ethanol plants in the near future. If an efficient method of producing ethanol from cellulose-based biomass is developed, we may not be able to compete effectively. We do not believe it will be cost-effective to convert our ethanol plant into a plant which will use cellulose-based biomass to produce ethanol. If we are unable to produce ethanol as cost-effectively as cellulose-based producers, our ability to generate revenue and our financial condition will be negatively impacted.
Growth in the ethanol industry is dependent on increased use of mid-level ethanol blends which requires significant expansion of the fuel blending infrastructure to accommodate higher ethanol blends, which may be slow and could result in decreased demand for ethanol. The ethanol industry has essentially run into the blend wall since approximately 13.2 billion gallons of ethanol were produced in 2010. Total gasoline demand in the United States is estimated at 135 billion gallons per year. Therefore, almost all of the gasoline in the United States is blended at a rate of 10% ethanol and 90% gasoline. In order to expand ethanol demand, the ethanol industry must increase the amount of ethanol that is blended with gasoline beyond 10%. In order to increase the percentage of ethanol that is blended into gasoline in the United States, mid-level ethanol blends must be made available to consumers. Infrastructure improvements are needed in order to make these mid-level ethanol blends available to United States consumers. These infrastructure improvements will be expensive. If these infrastructure improvements are not made, domestic ethanol demand may not increase past current levels. This may result in excess ethanol supply compared to ethanol
18
demand which could reduce ethanol prices and prevent us from profitably operating the ethanol plant which could negatively impact the value of our units.
Consumer beliefs may affect the demand for ethanol. We believe that certain consumers perceive the use of ethanol to have a negative impact on gasoline prices at the pump. Some consumers also believe that ethanol adds to air pollution and harms car and truck engines. Still other consumers believe that the process of producing ethanol actually uses more fossil fuel energy, such as oil and natural gas, than the energy in the ethanol that is produced. These consumer beliefs could potentially be widespread. If consumers choose not to buy ethanol, it will affect the demand for the ethanol we produce which could lower the selling price of ethanol and negatively affect our profitability and financial condition.
Risks Related to Regulation and Governmental Action
Government incentives for ethanol production, including federal tax incentives, may be eliminated in the future, which could hinder our ability to operate at a profit. The ethanol industry is assisted by various federal ethanol production and tax incentives, including the RFS set forth in the Energy Policy Act of 2005 and increased by the Energy Independence and Security Act of 2007. The RFS helps support a market for ethanol that might disappear without this incentive; as such, waiver of the RFS minimum levels of renewable fuels included in gasoline could negatively impact our results of operations.
In addition, the elimination or reduction of tax incentives to the ethanol industry, such as the Volumetric Ethanol Excise Tax Credit (“VEETC”) available to gasoline refiners and blenders, could also reduce the market demand for ethanol, which could reduce prices and our revenues by making it more costly or difficult for us to produce and sell ethanol. VEETC was renewed for one year at the end of 2010, so this incentive is set to expire on December 31, 2011. Due to the current makeup of Congress, it is not clear whether VEETC will be renewed past December 31, 2011. If the federal tax incentives are eliminated or sharply curtailed, we believe that decreased demand for ethanol will result, which could negatively impact our ability to operate profitably.
Also, elimination of the tariffs that protect the United States ethanol industry could lead to the importation of ethanol produced in other countries, especially in areas of the United States that are easily accessible by international shipping ports. This tariff is scheduled to expire at the end of 2011. If the tariff is allowed to expire, it could lead to increased ethanol supplies and decreased ethanol prices.
Changes in environmental regulations or violations of the regulations could reduce our profitability. We are subject to extensive air, water and other environmental laws and regulations. In addition, some of these laws require our plant to operate under a number of environmental permits. These laws, regulations and permits often require expensive pollution control equipment or operational changes to limit actual or potential impacts to the environment. A violation of these laws and regulations or permit conditions can result in substantial fines, damages, criminal sanctions, permit revocations and/or plant shutdowns. In the future, permit requirements may change or we may exceed certain limits in our permits that may lead to regulatory actions by the State of South Dakota or the EPA. Further, we may be required to secure additional permits in the future which may be costly and may affect our ability to operate the ethanol plant. We may also be subject to litigation by environmental advocacy groups and other parties based on actual or alleged violations of environmental laws. Additionally, any changes in environmental laws and regulations, both at the federal and state level, could require us to spend considerable resources in order to comply with future environmental regulations. The expense of compliance with environmental laws as well as litigation concerning environmental laws could be significant and reduce our profitability and negatively affect our financial condition.
Regulation of carbon dioxide and other greenhouse gases could adversely affect our financial performance. In 2007, the Supreme Court decided a case in which it ruled that carbon dioxide is an air pollutant under the Clean Air Act for the purposes of motor vehicle emissions. The Supreme Court directed the EPA to regulate carbon dioxide from vehicle emissions as a pollutant under the Clean Air Act. Similar lawsuits have been filed seeking to require the EPA to regulate carbon dioxide emissions from stationary sources such as our ethanol plant under the Clean Air Act. Additionally, legislation is pending in Congress on a comprehensive carbon dioxide regulatory scheme, such as a carbon tax or cap-and-trade system and California recently instituted a Low Carbon Fuel Standard requiring a 10% reduction in GHG emissions from transportation fuels by 2020. While this standard is currently being challenged by various lawsuits, implementation of such a standard may have an adverse impact on the market for corn-based ethanol.
Our plant produces a significant amount of carbon dioxide that we currently vent into the atmosphere. While there are currently no regulations applicable to us concerning carbon dioxide, if the EPA or the State of South Dakota were to regulate carbon dioxide emissions by plants such as ours, we may have to apply for additional permits or we may be required to install carbon dioxide mitigation equipment or take other as yet unknown steps to comply with these potential regulations. Further, compliance with the California Low Carbon Fuel Standard may significantly reduce demand for our ethanol. Compliance with any future regulation of carbon dioxide and other greenhouse gases, if it occurs, could be costly and may prevent us from operating
19
the ethanol plant profitably which could decrease or eliminate the value of our units.
ITEM 2. PROPERTIES.
We own Dakota Ethanol as a wholly-owned subsidiary. The ethanol plant is located on Dakota Ethanol's 212-acre rural site near Wentworth, South Dakota. During our 2008 fiscal year, we purchased 135 acres of additional land that is adjacent to our current property. The total cost of this additional land was $550,000. All of our operations occur at our plant in Wentworth, South Dakota. Our property is adequate for our needs.
All of Dakota Ethanol's tangible and intangible property, real and personal, serves as the collateral for debt financing with First National Bank of Omaha described below under “Item 7 - Management's Discussion and Analysis of Financial Condition and Results of Operations - Indebtedness.” Further, the additional 135 acres of land we purchased in 2008 is collateral for our debt obligation related to this purchase. We also granted a security interest in our corn oil extraction equipment in exchange for certain equipment financing we received to purchase and install this equipment.
ITEM 3. LEGAL PROCEEDINGS.
From time to time in the ordinary course of business, Dakota Ethanol or Lake Area Corn Processors may be named as a defendant in legal proceedings related to various issues, including, worker's compensation claims, tort claims, or contractual disputes. We are not currently involved in any material legal proceedings, directly or indirectly, and we are not aware of any claims pending or threatened against us or any of the managers that could result in the commencement of material legal proceedings.
ITEM 4. (REMOVED AND RESERVED).
PART II
ITEM 5. MARKET FOR REGISTRANT'S COMMON EQUITY, RELATED MEMBER MATTERS AND ISSUER PURCHASES OF EQUITY SECURITIES.
Recent Sales of Unregistered Equity Securities
None.
Market Information
There is no public trading market for our units. Our units may only be transferred in accordance with our Capital Units Transfer System, which provides for transfers by gift to family members, upon death, and through a qualified matching service, subject to approval by our board of managers. Our qualified matching service is operated through Variable Investment Advisors, Inc., a registered broker-dealer based in Sioux Falls, South Dakota. Variable Investment Advisor's Alternative Trading System may be accessed at www.agstocktrade.com. The matching service consists of an electronic bulletin board that provides information to prospective sellers and buyers of our units. We do not receive any compensation relating to the matching service. We have no role in effecting the transactions beyond approval, as required under our operating agreement and the issuance of new certificates. So long as we remain a publicly reporting company, information about us will be publicly available through the SEC's filing system. However, if at any time we cease to be a publicly reporting company, we anticipate continuing to make information about us publicly available on our website in order to continue to operate our qualified matching service.
Unit Holders
As of March 30, 2011, the company had 29,620,000 membership units issued and outstanding and a total of approximately 1,033 unit holders. There is no other class of membership unit issued or outstanding.
Bid and Asked Prices
The following table contains information concerning completed unit transactions that occurred during the last two fiscal years. Our bulletin board trading system does not track bid and asked prices and therefore we only have information concerning completed unit transactions.
20
Quarter | Low Price | High Price | Average Price | Number of Units Traded | |||||||||||
First Quarter 2009 | $ | 1.90 | $ | 1.90 | $ | 1.90 | 5,000 | ||||||||
Second Quarter 2009 | 1.04 | 1.04 | 1.04 | 5,000 | |||||||||||
Third Quarter 2009 | 1.25 | 1.70 | 1.39 | 15,000 | |||||||||||
Fourth Quarter 2009 | 0.99 | 1.11 | 1.06 | 31,235 | |||||||||||
First Quarter 2010 | 1.15 | 1.35 | 1.21 | 32,000 | |||||||||||
Second Quarter 2010 | 1.11 | 1.15 | 1.14 | 51,500 | |||||||||||
Third Quarter 2010 | 0.99 | 1.10 | 1.02 | 136,950 | |||||||||||
Fourth Quarter 2010 | 1.00 | 1.02 | 1.01 | 70,000 | |||||||||||
Distributions
Under the terms of our Third Amended and Restated Operating Agreement, we are required to make distributions to our members and may not retain more than $200,000 of net cash from operations, unless: (1) a 75% supermajority of our board decides otherwise; (2) it would violate or cause a default under the terms of any debt financing or other credit facilities; or (3) it is otherwise prohibited by law. We recently amended our credit agreement with our primary lender, First National Bank of Omaha, to provide that First National will approve all distributions by us prior to making any such distributions. Our ability to make distributions to our members is dependent upon the distributions made to us by Dakota Ethanol. All net income generated from plant operations is distributed by Dakota Ethanol to us since Dakota Ethanol is our wholly-owned subsidiary. We distribute the net income received from Dakota Ethanol to our unit holders in proportion to the number of units held by each unit holder. A unit holder's distribution percentage is determined by dividing the number of units owned by such unit holder by the total number of units outstanding. We anticipate continuing to monitor our financial performance and projected financial performance and we expect to make distributions at such times and in such amounts as will allow us to continue to profitably operate the ethanol plant, maintain compliance with our loan covenants and maintain our liquidity.
2010 Distributions
On November 9, 2010, we declared a distribution of $0.10 per unit to our members of record as of October 1, 2010. This distribution was paid in November 2010.
2009 Distributions
We did not make any distributions to our members during our 2009 fiscal year.
Performance Graph
The following graph shows a comparison of cumulative total member return since January 1, 2006, calculated on a dividend reinvested basis, for the Company, the NASDAQ Composite Index (the “NASDAQ Market Index”) and an index of other companies that have the same SIC code as the Company (the “SIC Code Index”). The graph assumes $100 was invested in each of our units, the NASDAQ Market Index, and the SIC Code Index on January 1, 2006. Data points on the graph are annual. Note that historic unit price performance is not necessarily indicative of future unit price performance. The data for this performance graph was compiled for us by Morningstar, Inc.
Pursuant to the rules and regulations of the Securities and Exchange Commission, the performance graph and the information set forth therein shall not be deemed to be filed for purposes of Section 18 of the Securities Exchange Act of 1934, and shall not be deemed to be incorporated by reference in any filing under the Securities Act of 1933, as amended, or the Exchange Act, except as shall be expressly set forth by specific reference in such a filing.
21
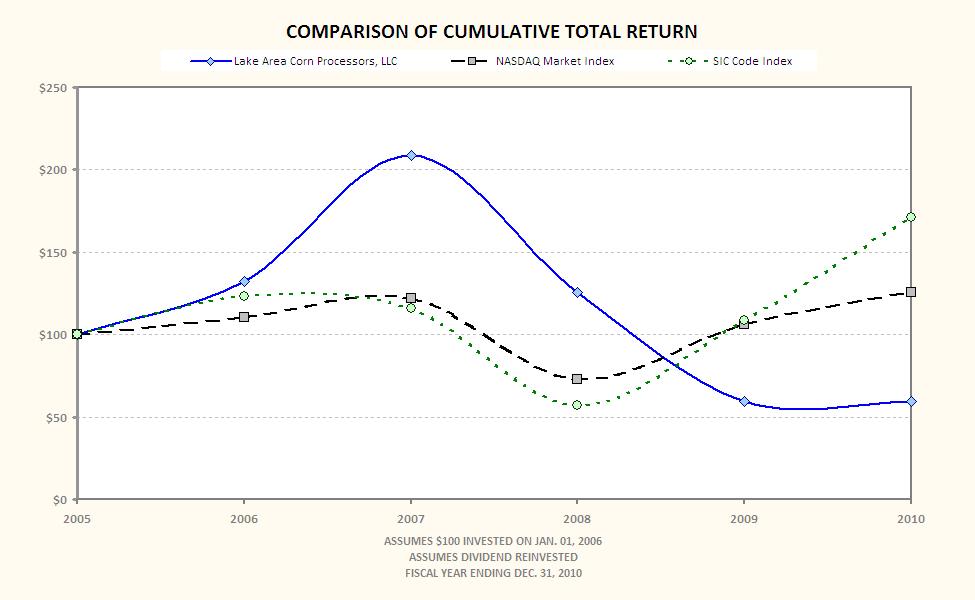
22
ITEM 6. SELECTED FINANCIAL DATA
The following table sets forth selected consolidated financial data, which is derived from our audited financial statements for the periods indicated. The selected consolidated balance sheet financial data as of December 31, 2008, 2007 and 2006 and the selected consolidated income statement data and other financial data for the years ended December 31, 2007 and 2006 have been derived from our audited consolidated financial statements that are not included in this Form 10-K. The selected consolidated balance sheet financial data as of December 31, 2010 and 2009 and the selected consolidated income statement data and other financial data for each of the years in the three year period ended December 31, 2010 have been derived from the audited Consolidated Financial Statements included elsewhere in this Form 10-K. You should read the following table in conjunction with (i) the consolidated financial statements and accompanying notes included elsewhere in this Form 10-K; (ii) “Item 7 Management's Discussion and Analysis of Financial Condition and Results of Operations”; and (iii) “Item 1A Risk Factors” found elsewhere in this Form 10-K. Among other things, those items include more detailed information regarding the basis of presentation for the following consolidated financial data.
Statement of Operations Data: | 2010 | 2009 | 2008 | 2007 | 2006 | |||||||||||||||
Revenues | $ | 96,395,789 | $ | 90,340,642 | $ | 111,778,588 | $ | 103,739,699 | $ | 103,889,412 | ||||||||||
Cost of Revenues | 86,289,732 | 81,659,486 | 125,413,056 | 80,977,667 | 50,792,418 | |||||||||||||||
Gross Profit (Loss) | 10,106,057 | 8,681,156 | (13,634,468 | ) | 22,762,032 | 53,096,994 | ||||||||||||||
Operating Expense | 2,922,059 | (2,957,809 | ) | (3,534,274 | ) | (3,721,813 | ) | (3,938,845 | ) | |||||||||||
Income (Loss) From Operations | 7,183,998 | 5,723,347 | (17,168,742 | ) | 19,040,219 | 49,158,149 | ||||||||||||||
Other Expense | (401,281 | ) | (793,658 | ) | (656,303 | ) | (695,043 | ) | (1,008,300 | ) | ||||||||||
Other Income (Expense) | 261,845 | (54,920 | ) | 1,211,596 | (339,971 | ) | 121,719 | |||||||||||||
Noncontrolling Interest in Subsidiary Income | — | — | — | — | (2,235,776 | ) | ||||||||||||||
Net Income (Loss) | $ | 7,044,562 | $ | 4,874,769 | $ | (16,613,449 | ) | $ | 18,005,205 | $ | 46,035,792 | |||||||||
Capital Units Outstanding | 29,620,000 | 29,620,000 | 29,620,000 | 29,620,000 | 29,620,000 | |||||||||||||||
Net Income Per Capital Unit | $ | 0.24 | $ | 0.16 | $ | (0.56 | ) | $ | 0.61 | $ | 1.55 | |||||||||
Cash Distributions per Capital Unit | $ | 0.10 | $ | — | $ | 0.05 | $ | 0.6 | $ | 0.45 | ||||||||||
Balance Sheet Data: | 2010 | 2009 | 2008 | 2007 | 2006 | |||||||||||||||
Working Capital | $ | 6,031,369 | $ | 2,372,783 | $ | (3,068,598 | ) | $ | 16,054,455 | $ | 17,220,709 | |||||||||
Net Property, Plant & Equipment | 29,760,568 | 32,445,979 | 34,531,667 | 35,345,093 | 35,695,754 | |||||||||||||||
Total Assets | 62,178,421 | 58,625,220 | 58,206,448 | 73,554,744 | 72,381,310 | |||||||||||||||
Long-Term Obligations | 1,181,410 | 3,923,596 | 5,664,276 | 5,077,137 | 6,921,695 | |||||||||||||||
Member's Equity | 48,097,148 | 43,733,907 | 38,859,138 | 56,953,587 | 56,720,382 | |||||||||||||||
Book Value Per Capital Unit | $ | 1.62 | $ | 1.48 | $ | 1.31 | $ | 1.92 | $ | 1.91 | ||||||||||
23
ITEM 7. MANAGEMENT'S DISCUSSION AND ANALYSIS OF FINANCIAL CONDITION AND RESULTS OF OPERATIONS
Except for the historical information, the following discussion contains forward-looking statements that are subject to risks and uncertainties. We caution you not to put undue reliance on any forward-looking statements, which speak only as of the date of this report. Our actual results or actions may differ materially from these forward-looking statements for many reasons, including the risks described in “Item 1A - Risk Factors” and elsewhere in this annual report. Our discussion and analysis of our financial condition and results of operations should be read in conjunction with the financial statements and related notes and with the understanding that our actual future results may be materially different from what we currently expect.
Results of Operations
Comparison of Fiscal Years Ended December 31, 2010 and 2009
The following table shows the results of our operations and the percentage of revenues, cost of revenues, operating expenses and other items to total revenues in our consolidated statements of operations for the fiscal years ended December 31, 2010 and 2009:
2010 | 2009 | |||||||||||||
Income Statement Data | Amount | % | Amount | % | ||||||||||
Revenue | $ | 96,395,789 | 100.0 | $ | 90,340,642 | 100.0 | ||||||||
Cost of Revenues | 86,289,732 | 89.5 | 81,659,486 | 90.4 | ||||||||||
Gross Profit | 10,106,057 | 10.5 | 8,681,156 | 9.6 | ||||||||||
Operating Expense | 2,922,059 | 3.0 | 2,957,809 | 3.3 | ||||||||||
Income from Operations | 7,183,998 | 7.5 | 5,723,347 | 6.3 | ||||||||||
Other Income (Expense) | (139,436 | ) | (0.1 | ) | (848,578 | ) | (0.9 | ) | ||||||
Net Income | 7,044,562 | 7.3 | 4,874,769 | 5.4 | ||||||||||
Revenues
Revenue from ethanol sales increased by approximately 8% during our 2010 fiscal year compared to our 2009 fiscal year. Revenue from distillers grains decreased by approximately 6% during our 2010 fiscal year compared to our 2009 fiscal year. Revenue from corn oil increased by approximately 84% during our 2010 fiscal year compared to our 2009 fiscal year.
Ethanol
Our ethanol revenue increased by approximately $5.8 million during our 2010 fiscal year compared to our 2009 fiscal year, an increase of approximately 8%. This increase in ethanol revenue was due to an increase in the average price we received for our ethanol of approximately $0.16 per gallon, an increase of approximately 10%, during our 2010 fiscal year compared to our 2009 fiscal year. Management attributes this increase in ethanol prices with higher corn and energy prices during 2010. Management anticipates that ethanol prices will remain at their current levels during our 2011 fiscal year due to the higher corn prices we have been experiencing along with higher gasoline prices. Management anticipates that gasoline prices will remain high due to instability in the Middle East. However, ethanol prices may be negatively impacted by the effect of the blend wall on ethanol demand. If the ethanol industry cannot continue to increase ethanol demand, it may result in an over-supply of ethanol which could negatively impact prices.
Partially offsetting these higher ethanol prices was a decrease in our total ethanol sales of approximately 2%, or approximately 931,000 gallons. Management attributes this decrease in ethanol sales with decreased ethanol shipments at the end of our 2010 fiscal year. Our ethanol production was comparable in our 2010 and 2009 fiscal years. Management anticipates that ethanol sales during our 2011 fiscal year will be comparable to our 2010 fiscal year as we anticipate comparable ethanol production during our 2011 fiscal year.
Ethanol demand has increased during our 2010 fiscal year due to increased domestic demand for ethanol as more markets
24
in the United States started to blend ethanol, along with increased ethanol exports to Europe. These increases in ethanol demand boosted ethanol prices during a time when ethanol supply was relatively stable. However, because of the blend wall, domestic ethanol supply is not expected to increase significantly without the implementation of more mid-level blends of ethanol. Management believes that the recent push to increase ethanol demand in the United States through E15 may not result in a significant increase in ethanol demand. Management believes that gasoline retailers will refuse to carry E15 due to the fact that not all standard vehicles can use E15 and due to potential liability for gasoline retailers if customers use E15 in vehicles that are not approved for E15. In addition, management believes that the labeling requirement for E15 that is being considered by the EPA may discourage the use of higher percentage blends of ethanol.
Distillers Grains
We sold more of our distillers grains in the dried form during our 2010 fiscal year compared to our 2009 fiscal year. This change in the composition of our distillers grains sales was due to market conditions that favored the production and sale of dried distillers grains compared to modified/wet distillers grains. We increased sales of dried distillers grains by approximately 20%, or approximately 11,000 tons, during our 2010 fiscal year compared to our 2009 fiscal year. The average price we received per ton of dried distillers grains deceased by approximately 7%, or approximately $7.00 per ton, during our 2010 fiscal year compared to our 2009 fiscal year. We experienced relatively higher distillers grains prices during our 2009 fiscal year due to higher distillers grains demand and relatively lower supply during that time period. We sold approximately 8% less modified/wet distillers grains during our 2010 fiscal year compared to our 2009 fiscal year. In addition, the average price we received for our modified/wet distillers grains was approximately 10% lower during our 2010 fiscal year compared to our 2009 fiscal year. In real terms, this was a decrease of approximately $10 per ton.
Distillers grains prices were benefited during our 2010 fiscal year with increased exports compared to our 2009 fiscal year. Management believes that the domestic distillers grains market is reaching a saturation point where demand for distillers grains may not continue to increase. As a result, the ethanol industry has been pursuing increased exports of distillers grains. One key market for distillers grains during our 2010 fiscal year was China. China significantly increased their imports of distillers grains during 2010 which benefited distillers grains prices in the United States. However, China recently commenced an investigation of the United States distillers grains industry for dumping distillers grains in China. While management believes that China's anti-dumping investigation is without merit, it may result in the imposition of tariffs by China on distillers grains produced in the United States. This could reduce or eliminate distillers grains exports to China which could negatively impact distillers grains prices in the United States. While we do not export a significant amount of distillers grains, changes in the market price of distillers grains in the United States might affect the price we receive for our distillers grains.
Management expects to continue to make decisions as to whether our distillers grains will be marketed as dried distillers grains as opposed to modified/wet distillers grains based on market conditions. These market conditions include supply and demand factors as well as the price difference between dried distillers grains and wet/modified distillers grains compared to the higher natural gas costs associated with drying our distillers grains.
Corn Oil
Our total gallons of corn oil sold increased by approximately 92% during our 2010 fiscal year compared to our 2009 fiscal year, primarily due to improved operation of the corn oil extraction equipment. Management anticipates that our corn oil sales will be comparable during our 2011 fiscal year to our 2010 fiscal year. In addition to the increase in corn oil sales, the average price we received for our corn oil increased by approximately 24% during our 2010 fiscal year compared to our 2009 fiscal year, an increase of approximately $0.05 per pound of corn oil sold due to higher corn prices and increased corn oil demand. Management anticipates corn oil prices will be comparable during our 2011 fiscal year to our 2010 fiscal year.
Government Incentives
During our 2010 fiscal year, we experienced a slight increase in our incentive revenue of less than $30,000 compared to our 2009 fiscal year. We annually receive an ethanol producer's incentive from the State of South Dakota. Management attributes this slight increase in incentive revenue during our 2010 fiscal year with more funds being available for the South Dakota program.
Cost of Revenues
The primary raw materials we use to produce ethanol and distillers grains are corn and natural gas. Our cost of revenues was approximately 6% greater for our 2010 fiscal year compared to our 2009 fiscal year due to higher corn costs. Our average cost per bushel of corn increased by approximately 10% during our 2010 fiscal year compared to our 2009 fiscal year from approximately $3.55 per bushel in 2009 to approximately $3.91 per bushel during 2010. Management attributes this increase in
25
corn costs with higher market corn prices due to decreased corn carryover from the 2009/2010 crop year. However, the area surrounding our ethanol plant had a good harvest in the fall of 2010 so we have not experienced the same corn price increases that other ethanol plants in other areas of the country may have experienced. Management anticipates that the area surrounding the ethanol plant will continue to produce a significant amount of corn and that we will not have any difficulty securing the corn that we need to operate the ethanol plant. In addition to the increase in corn costs per bushel, we used approximately 55,000 more bushels of corn, an increase of less than 1%, during our 2010 fiscal year compared to our 2009 fiscal year. Management attributes this increase in corn consumption with the fact that we ran the ethanol plant harder during 2010 in order to benefit from favorable economic conditions in the ethanol industry which led to slightly lower ethanol yields per bushel of corn.
Our cost of revenues related to natural gas decreased by approximately $922,000, a decrease of approximately 11%, during our 2010 fiscal year compared to our 2009 fiscal year. This decrease was due to a decrease in market natural gas prices during our 2010 fiscal year compared to our 2009 fiscal year. Our average cost per MMBtu of natural gas during our 2010 fiscal year was approximately 16% lower compared to our 2009 fiscal year, a decrease of approximately $1.00 per MMBtu of natural gas. Management attributes this decrease in natural gas prices to strong natural gas supplies and relatively stable natural gas demand. Management anticipates that natural gas prices will remain steady during our 2011 fiscal year unless natural gas production problems arise, such as from hurricane activity in the Gulf Coast.
Partially offsetting this decrease in natural gas costs per MMBtu was an increase in the total MMBtu of natural gas that we consumed during our 2010 fiscal year of approximately 71,000 MMBtu, an increase of approximately 5%, compared to our 2009 fiscal year. Management attributes this increase in natural gas consumption with increased production of dried distillers grains which require more natural gas to produce than modified/wet distillers grains because we use natural gas to fire our distillers grains dryers. Management anticipates that our natural gas consumption will be comparable during our 2011 fiscal year to our 2010 fiscal year due to anticipated levels of production at the ethanol plant.
Operating Expense
We did not experience any material changes in our operating expenses during our 2010 fiscal year compared to our 2009 fiscal year.
Other Income and Expense
Our other expense was significantly lower during our 2010 fiscal year compared to our 2009 fiscal year. We had less interest income during our 2010 fiscal year compared to our 2009 fiscal year because we had less cash on hand during the 2010 period. Our investments provided income during our 2010 fiscal year compared to a loss during our 2009 fiscal year. Finally, we paid significantly less interest during our 2010 fiscal year compared to our 2009 fiscal year due to our continuing retirement of our long-term debt.
Changes in Financial Condition for the Fiscal Year Ended December 31, 2010 Compared to the Fiscal Year Ended December 31, 2009.
Current Assets
Our current assets were higher at December 31, 2010 compared to December 31, 2009 primarily due to increased accounts receivable, inventory and amounts we had due from our commodities broker. All of these increases are tied to recent increases in corn and ethanol prices. Our accounts receivable was higher at December 31, 2010 compared to December 31, 2009 due to higher ethanol prices. We were awaiting payment for a comparable number of gallons of ethanol at December 31, 2010 compared to December 31, 2009, however, since the price of ethanol was higher at the end of 2010 compared to the end of 2009, the total amount of our receivable was higher. The value of our inventory was higher at December 31, 2010 compared to December 31, 2009 due to higher corn and ethanol prices and due to having more ethanol inventory at December 31, 2010 compared to December 31, 2009. The amount we had due from our commodities broker was higher at December 31, 2010 compared to December 31, 2009 due to increased cash we were required to hold in our margin account to offset unrealized losses on risk management positions. These unrealized losses are due to recent corn price increases which negatively impacted our risk management positions.
Property and Equipment
Our net property and equipment was lower at December 31, 2010 compared to December 31, 2009 as a result of our accumulated depreciation. We did not make any significant capital expenditures during our 2010 fiscal year that increased the value of our property and equipment.
26
Other Assets
The value of our investments increased at December 31, 2010 compared to December 31, 2009 mainly due to our investment in RPMG, our ethanol, distillers grains and corn oil marketer. We experienced a significant increase in our other assets at December 31, 2010 compared to December 31, 2009 due to contract rights related to the water supply agreement completed during 2010.
Current Liabilities
We experienced a decrease in our accounts payable at December 31, 2010 compared to December 31, 2009 due to having less corn payables at the end of our 2010 fiscal year compared to our 2009 fiscal year. Our risk management positions represented a much larger liability at December 31, 2010 compared to December 31, 2009 due to recent corn price increases which resulted in significant unrealized losses on our risk management positions. We had approximately $1.9 million in short-term notes payable issued at December 31, 2010 which we used for cash for our continuing operations. We had no short-term notes payable at December 31, 2009. The current portion of our notes payable was lower at December 31, 2010 compared to December 31, 2009 because we paid off our term loan in July 2010.
Long-Term Liabilities
Our notes payable, net of current portions, was significantly lower at December 31, 2010 compared to December 31, 2009 because we repaid the entire balance of our term loan in September 2010 and the subordinated notes we issued to certain individuals in early 2009 were included in our current debt at December 31, 2010. These notes will mature during our first and second fiscal quarters of 2011. Our other long-term liability was higher at December 31, 2010 compared to December 31, 2009 because we anticipate being required to pay for damage to our distillers grains railcars as required by our railcar leases.
Comparison of Years Ended December 31, 2009 and 2008.
The following table shows the results of our operations and the percentage of revenues, cost of revenues, operating expenses and other items to total revenues in our consolidated statements of operations for the fiscal years ended December 31, 2009 and 2008:
2009 | 2008 | |||||||||||||
Income Statement Data | Amount | % | Amount | % | ||||||||||
Revenue | $ | 90,340,642 | 100.0 | $ | 111,778,588 | 100.0 | ||||||||
Cost of Revenues | 81,659,486 | 90.4 | 125,413,056 | 112.2 | ||||||||||
Gross Profit (Loss) | 8,681,156 | 9.6 | (13,634,468 | ) | (12.2 | ) | ||||||||
Operating Expense | 2,957,809 | 3.3 | 3,534,274 | 3.2 | ||||||||||
Income (Loss) from Operations | 5,723,347 | 6.3 | (17,168,742 | ) | (15.4 | ) | ||||||||
Other Income (Expense) | (848,578 | ) | (0.9 | ) | 555,293 | 0.5 | ||||||||
Net Income (Loss) | 4,874,769 | 5.4 | (16,613,449 | ) | (14.9 | ) | ||||||||
Revenues
Our revenues decreased significantly during our 2009 fiscal year compared to our 2008 fiscal year. We attribute this decrease in revenue during our 2009 fiscal year with significantly lower market prices for our products. This decrease in the market prices of our products was partially offset by increased sales of ethanol and distillers grains during our 2009 fiscal year compared to our 2008 fiscal year.
Ethanol
Our revenue from the sale of ethanol decreased by approximately 21% during our 2009 fiscal year compared to our 2008 fiscal year. This decrease was the result of an approximately 23% decrease in the average price we received for our ethanol during
27
our 2009 fiscal year compared to our 2008 fiscal year. The average price we received for our ethanol during our 2009 fiscal year was approximately $1.57 per gallon sold compared to approximately $2.05 per gallon sold during our 2008 fiscal year. Management attributes this decrease in the average price we received for our ethanol during our 2009 fiscal year with lower commodities prices generally, including lower energy prices. We experienced historically high commodity prices leading up to the middle of our 2008 fiscal year. Following this peak, commodity prices decreased significantly. Management attributes this decrease in commodity prices with the global economic recession that negatively impacted energy prices and demand in the second half of 2008. Commodity prices were less volatile during our 2009 fiscal year but were also significantly lower than we experienced during our 2008 fiscal year. We experienced a general increasing trend in the average price we received for our ethanol during our 2009 fiscal year, with a peak in ethanol prices during the fourth quarter of our 2009 fiscal year.
Our ethanol sales were higher during our 2009 fiscal year compared to our 2008 fiscal year which partially offset the decrease we experienced in ethanol prices during our 2009 fiscal year. We increased ethanol sales by approximately 2% during our 2009 fiscal year compared to our 2008 fiscal year. Management attributes this increase in ethanol sales during our 2009 fiscal year with increased ethanol production compared to our 2008 fiscal year. We experienced equipment problems at the ethanol plant during the first quarter of our 2008 fiscal year which resulted in decreased ethanol and distillers grains production during that time period. We have since remedied these equipment problems and the ethanol plant is operating at full capacity.
Distillers Grains
Our total revenue from sales of distillers grains was lower during our 2009 fiscal year compared to our 2008 fiscal year. Our distillers grains prices were lower during our 2009 fiscal year compared to our 2008 fiscal year, which was somewhat offset by an increase in the total tons of distillers grains we sold during our 2009 fiscal year compared to our 2008 fiscal year. During our 2009 fiscal year, we experienced more favorable prices for our dried distillers grains compared to our modified/wet distillers grains so we sold more of our distillers grains in the dried form.
The average price we received for our dried distillers grains was approximately 10% lower during our 2009 fiscal year compared to our 2008 fiscal year. In real terms, this was a decrease of approximately $11 per ton of dried distillers grains sold. The average price we received for our modified/wet distillers grains was approximately 8% lower during our 2009 fiscal year compared to our 2008 fiscal year. In real terms, this equaled a decrease of approximately $8 per ton of modified/wet distillers grains sold. Management attributes these decreases in the average prices we received for our distillers grains with decreased market corn and soybean meal prices during 2009. Management believes that since distillers grains are typically used as an animal feed substitute, changes in the price of corn and soybean meal which are also used as animal feed impacts the prices of distillers grains.
During our 2009 fiscal year, we experienced an increase in the total tons of dried distillers grains we sold of approximately 21% compared to our 2008 fiscal year. In real terms, this was an increase of approximately 9,000 tons. Management attributes this increase in dried distillers grains sales during our 2009 fiscal year with more favorable marketing opportunities for dried distillers grains compared to modified/wet distillers grains during our 2009 fiscal year. Correspondingly, we experienced a decrease of approximately 6% in the total tons of modified/wet distillers grains we sold during our 2009 fiscal year compared to our 2008 fiscal year. In real terms, this was a decrease of approximately 6,000 tons, on a dry-equivalent basis.
Corn Oil
During our 2009 fiscal year our revenue related to corn oil sales was approximately $808,000. We experienced a general increasing trend in corn oil prices during our 2009 fiscal year. We did not have any corn oil sales during our 2008 fiscal year as our corn oil extraction equipment was not yet operational.
Government Incentives
During our 2009 fiscal year, our incentive revenue increased by less than $20,000. We annually receive an ethanol producer's incentive from the State of South Dakota. Management attributes this slight increase in incentive revenue during our 2009 fiscal year compared to our 2008 fiscal year with more funds being available for the South Dakota program.
Cost of Revenues
Our cost of revenues decreased significantly for our 2009 fiscal year compared to our 2008 fiscal year. This decrease in our cost of revenues was larger than the decrease in revenues we experienced in our 2009 fiscal year which positively impacted our profitability. Management attributes this decrease in our cost of revenues primarily with a significant decrease in our average cost per bushel of corn for our 2009 fiscal year compared to our 2008 fiscal year.
28
Our average cost per bushel of corn, which includes gains and losses we experience on our derivative instrument positions, decreased by approximately 38% for our 2009 fiscal year compared to our 2008 fiscal year. In real terms, our average cost per bushel of corn during our 2009 fiscal year was approximately $3.55 per bushel compared to approximately $5.73 per bushel during our 2008 fiscal year. Management attributes this decrease in corn costs with a decrease in market corn prices from highs that we experienced in the middle of our 2008 fiscal year. Corn prices spiked in the middle of our 2008 fiscal year and then fell significantly as we entered the worldwide economic recession. This resulted in decreased commodity prices generally, including corn prices. We experienced some increase in corn prices at the end of our 2009 fiscal year as a result of unfavorable weather conditions during the 2009 harvest.
Along with the decrease in corn costs, our corn consumption was higher during our 2009 fiscal year compared to our 2008 fiscal year. We consumed approximately 3% more corn during our 2009 fiscal year compared to our 2008 fiscal year, which in real terms equaled an increase of approximately 522,000 bushels. Management attributes this increase in corn consumption with increased ethanol production during our 2009 fiscal year. During our 2008 fiscal year, we experienced some equipment problems that decreased our ethanol production and consequently, we used less corn.
During our 2009 fiscal year, our total natural gas costs decreased by approximately 44% compared to our 2008 fiscal year. In real terms, this equaled a decrease of approximately $6.4 million. We attribute this decrease in our total natural gas costs to record high commodity prices during the first half of our 2008 fiscal year which increased our natural gas costs during that time period, along with losses on our natural gas derivative instruments during our 2008 fiscal year. Our average cost of natural gas per MMBtu during our 2009 fiscal year was approximately 43% lower compared to our 2008 fiscal year. In real terms, this was a decrease of approximately $4.66 per MMBtu. Our natural gas consumption also decreased by approximately 2% during our 2009 fiscal year compared to our 2008 fiscal year. Management attributes this decrease in natural gas consumption during our 2009 fiscal year with improved efficiencies achieved from marketing more condensed distillers with solubles and corn oil.
Operating Expense
Management attributes this decrease in operating expenses with a decrease in our environmental test fees of approximately $75,000, public relations costs of approximately $25,000, professional fees of approximately $136,000 and decreased bonus expenses of approximately $150,000 during our 2009 fiscal year compared to our 2008 fiscal year.
Other Income and Expense
We had more interest income during our 2009 fiscal year compared to our 2008 fiscal year as a result of having more cash on hand during our 2009 fiscal year. We had a net loss on our investments during our 2009 fiscal year compared to a significant gain on our investments during our 2008 fiscal year. Management attributes this change to the impact of derivative instruments utilized by our investments in their operations. We had a larger interest expense during our 2009 fiscal year compared to our 2008 fiscal year as a result of the subordinated debt we issued at the beginning of our 2009 fiscal year to help fund our operations and provide us with working capital.
Plant Operations
Management anticipates that the plant will continue to operate at or above name-plate capacity of 40 million gallons per year for the next twelve months. We expect to have sufficient cash from cash flow generated by our continuing operations, our debt financing and our cash reserves to cover the costs of operations over the next 12 months, which consist primarily of corn supply, natural gas supply, staffing, office, audit, legal, compliance, working capital costs and debt service obligations.
Application of Critical Accounting Policies
Management uses estimates and assumptions in preparing our consolidated financial statements in accordance with generally accepted accounting principles. These estimates and assumptions affect the reported amounts of assets and liabilities, the disclosure of contingent assets and liabilities, and the reported revenues and expenses. Of the significant accounting policies described in the notes to our consolidated financial statements, we believe that the following are the most critical:
Derivative Instruments
We enter into short-term cash grain, option and futures contracts as a means of securing corn and natural gas for the ethanol plant and managing exposure to changes in commodity and energy prices. We enter into short-term forward, option and futures contracts for sales of ethanol to manage exposure to changes in energy prices. All of our derivatives are designated as
29
non-hedge derivatives, and accordingly are recorded at fair value with changes in fair value recognized in net income. Although the contracts are considered economic hedges of specified risks, they are not designated as and accounted for as hedging instruments.
As part of our trading activity, we use futures and option contracts offered through regulated commodity exchanges to reduce our risk and we are exposed to risk of loss in the market value of inventories. To reduce that risk, we generally take positions using cash and futures contracts and options.
Unrealized gains and losses related to derivative contracts for corn and natural gas purchases are included as a component of cost of revenues and derivative contracts related to ethanol sales are included as a component of revenues in the accompanying financial statements. The fair values of derivative contracts are presented on the accompanying balance sheet as derivative financial instruments.
Lower of cost or market accounting for inventory and forward purchase contracts
With the significant change in the prices of our main inputs and outputs, the lower of cost or market analysis of inventories and purchase commitments can have a significant impact on our financial performance.
The impact of market activity related to pricing of corn and ethanol will require us to continuously evaluate the pricing of our inventory and purchase commitments under a lower of cost or market analysis.
We recorded a lower of cost or market impairment adjustment related to our inventory as of December 31, 2009 and December 31, 2008. The lower of cost or market adjustment represented a reduction to assets of approximately $212,000 and $1,139,000 at December 31, 2009 and 2008 respectively. We did not have a lower of cost or market adjustment to our inventory as of December 31, 2010.
We recorded a lower of cost or market impairment adjustment related to our future corn purchase contracts as of December 31, 2008. The lower of cost or market adjustment represented a liability of approximately $2,736,000.
Liquidity and Capital Resources
Our main sources of liquidity are cash from our continuing operations and amounts we have available to draw on our revolving lines of credit. Management does not anticipate that we will need to raise additional debt or equity financing in the next twelve months and management believes that our current sources of liquidity will be sufficient to continue our operations during that time period. We do not anticipate making any significant capital expenditures in the next 12 months other than ordinary repair and replacement of equipment in our ethanol plant.
Currently, we have two revolving loans which allow us to borrow funds for working capital. These two revolving loans are described in greater detail below in the section entitled “Item 7 - Management's Discussion and Analysis of Financial Condition and Results of Operations - Indebtedness.” As of December 31, 2010, we had $1,872,000 outstanding and $8,128,000 available to be drawn on these revolving loans. Management anticipates that this is sufficient to maintain our liquidity and continue our operations.
The following table shows a comparison of cash flows for the fiscal years ended December 31, 2010 and December 31, 2009:
Year ended December 31, | ||||||||
2010 | 2009 | |||||||
Net cash from operating activities | $ | 5,017,112 | $ | 2,015,584 | ||||
Net cash (used for) investing activities | (63,601 | ) | (1,033,331 | ) | ||||
Net cash (used for) financing activities | (4,680,773 | ) | (1,105,704 | ) | ||||
Cash Flow From Operations. Our operating activities provided more cash during our 2010 fiscal year compared to our 2009 fiscal year primarily due to our increased net income.
Cash Flow From Investing Activities. We used significantly less cash for investing activities during our 2010 fiscal year compared to our 2009 fiscal year due to decreased capital expenditures during 2010. During our 2009 fiscal year, we made capital expenditures related to our corn oil equipment. We also purchased other assets related to water supply contract rights during our 2010 fiscal year. We did not purchase any investments during our 2010 and 2009 fiscal years.
30
Cash Flow From Financing Activities. We used more cash in our financing activities during our 2010 fiscal year compared to our 2009 fiscal year primarily due to a distribution we paid during our 2010 fiscal year along with less borrowing during our 2010 fiscal year compared to our 2009 fiscal year.
The following table shows a comparison of cash flows for the fiscal years ended December 31, 2009 and December 31, 2008:
Year ended December 31, | ||||||||
2009 | 2008 | |||||||
Net cash from operating activities | $ | 2,015,584 | $ | 6,495,595 | ||||
Net cash (used for) investing activities | (1,033,331 | ) | (3,110,513 | ) | ||||
Net cash (used for) financing activities | (1,105,704 | ) | (3,257,687 | ) | ||||
Cash Flow From Operations. Our operating activities generated less cash during our 2009 fiscal year compared to our 2008 fiscal year, primarily as a result of a significant change in the amount of cash our commodities broker was holding in our margin account. During the fourth quarter of our 2008 fiscal year, we liquidated all of our derivative instrument positions. We also had a lower of cost or market adjustment to the value of our inventory that positively impacted our cash position during our 2008 fiscal year compared to our 2009 fiscal year.
Cash Flow From Investing Activities. We used less cash for investing activities during our 2009 fiscal year compared to our 2008 fiscal year. This change was primarily the result of having less purchases of property and equipment during our 2009 fiscal year compared to our 2008 fiscal year as well as the impact that distributions of revenues from our investments had on our cash position during our 2009 fiscal year compared to our 2008 fiscal year. During our 2008 fiscal year, we used cash to purchase two investments. We used $300,000 to purchase an interest in Corn Oil Bio-Solutions, LLC and we used $1,050,000 to purchase an interest in Prairie Gold Venture Partnership, LLC. During our 2007 fiscal year, we purchased an investment in RPMG, which is our ethanol, corn oil and distillers grains marketer. In our 2008 fiscal year, we experienced a decrease in our liability related to our RPMG capital contribution of approximately $246,000. The final payments for our RPMG capital contribution were made during our 2008 fiscal year and no payments were made during our 2009 fiscal year for this capital contribution.
Cash Flow From Financing Activities. We used less cash in our financing activities during our 2009 fiscal year compared to our 2008 fiscal year. We received proceeds from subordinated loans during our 2009 fiscal year compared to the loan proceeds we received on our revolving lines of credit with our primary lender during our 2008 fiscal year. We had less payments on short-term loans during our 2009 fiscal year compared to our 2008 fiscal year due to having less payments on our revolving line of credit with our primary lender. We had more payments on our long-term loans during our 2009 fiscal year compared to our 2008 fiscal year as a result of having more payments on our long-term revolving loan with our primary lender as well as having increased payments pursuant to certain of the subordinated debt we issued during our 2009 fiscal year. We did not make any distributions to our members during our 2009 fiscal year compared to a distribution of approximately $1.5 million that we made during our 2008 fiscal year.
Indebtedness
First National Bank of Omaha (FNBO) is our primary lender. We have two loans outstanding with FNBO, a short-term revolving loan and a long-term revolving loan. During our third fiscal quarter of 2010, we repaid the entire balance of our term loan with FNBO. In addition to our FNBO debt, we have subordinated unsecured debt financing with various individuals. We also secured two loans to offset the cost of our corn oil extraction equipment which are secured by a lien on our corn oil extraction equipment. We have a long-term loan related to a piece of property that we purchased adjacent to our ethanol plant that is secured by a lien on this piece of property. The specifics of each credit facility are discussed below.
Short-Term Debt Sources
We have a short-term revolving promissory note with FNBO. We can borrow up to $5,000,000 pursuant to this revolving promissory note. The maturity date of the revolving promissory note is May 12, 2011. We agreed to pay a variable interest rate on the revolving promissory note at an annual rate 350 basis points above the 1 month London Interbank Offered Rate (LIBOR). The interest rate for this loan at December 31, 2010 was 4.50%. The revolving promissory note is subject to a minimum interest rate of 4.5% per year. We are required to pay a fee of 1/2 percent on the unused portion of the revolving promissory note. The revolving promissory note is collateralized by the ethanol plant, its accounts receivable and inventories. As of December 31, 2010,
31
we had $1,872,000 outstanding on our revolving promissory note and $3,128,000 available to be drawn.
Long-Term Debt Sources
During our third quarter of 2010, we repaid our term note that was used for the permanent financing of the ethanol plant.
We restructured our long-term revolving loan that we refer to as Term Note 5 on May 13, 2010. Term Note 5 was restructured into a $5,000,000 loan with an interest rate that accrues at 400 basis points above the 1 month LIBOR. Term Note 5 is subject to a minimum interest rate of 5.0% per year. The credit limit on Term Note 5 reduces each year by $1,000,000 until the maturity date on May 1, 2013. Therefore, the funds available for us to draw on Term Note 5 will decrease each year. If in any year we have a principal balance outstanding on Term Note 5 in excess of the new credit limit, we must make a payment to FNBO such that the amount outstanding on Term Note 5 does not exceed the new credit limit. We are required to pay a fee of 1/2 percent on the unused portion of Term Note 5. On December 31, 2010, we had $0 outstanding and $5 million available to be drawn on this loan. As of December 31, 2010, interest accrued on Term Note 5 at the minimum interest rate of 5.0% per year.
We also have a long-term debt obligation related to our purchase of an additional 135 acres of land pursuant to a land purchase contract. The total cost of this additional land was $550,000. This long-term debt obligation matures on December 1, 2012. Interest accrues on this debt obligation at a fixed rate of 7% per year. As of December 31, 2010, we had $225,000 remaining to be paid pursuant to this land purchase contract.
Subordinated Debt
During our 2009 fiscal year, we completed a private placement offering of subordinated unsecured debt securities. The debt securities that we offered were not registered with the Securities and Exchange Commission and were offered pursuant to claimed exemptions from registration under state and federal securities laws. We raised a total of $1,439,000 in subordinated debt through this offering. Interest on the subordinated notes accrues at a fixed interest rate of 9% per year. These subordinated debt securities had a two-year maturity from the date they were issued, with interest being paid on January 30th of each year and at maturity. These notes will mature during our first two quarters of our 2011 fiscal year.
In addition, on July 24, 2009, we entered into a $700,000 subordinated secured loan with Guardian Eagle Investments, LLC. The note accrues interest at a fixed rate of 9% per year and requires monthly installments of principal and interest. This loan was scheduled to mature in April 2012. We repaid the balance of the Guardian Eagle loan in December 2010, therefore, the principal balance of the Guardian Eagle loan was $0 as of December 31, 2010.
We secured a total of $1,200,000 in subordinated loans to help offset the cost of our corn oil extraction equipment from two different parties. We secured $1,000,000 in financing for the corn oil extraction equipment from the Rural Electric Economic Development, Inc. (REED) and $200,000 from the First District Development Company (FDDC). We closed on these loans on May 22, 2009. We agreed to pay 4.70% interest on the $1,000,000 loan from REED and 5.5% interest on the $200,000 FDDC loan. Both loans are amortized over a period of five years and both loans require monthly payments. The principal balance of the REED loan was approximately $709,000 as of December 31, 2010. The principal balance of the FDDC loan was approximately $142,000 as of December 31, 2010.
Covenants
Our credit facilities with FNBO are subject to various loan covenants. If we fail to comply with these loan covenants, FNBO can declare us to be in default of our loans. The material loan covenants applicable to our credit facilities are our fixed charge coverage ratio, our minimum net worth and minimum working capital requirements. We are required to maintain a fixed charge coverage ratio of no less than 1.10 to 1.0. This fixed charge coverage ratio compares our EBITDA adjusted earnings, as defined in our credit agreements, with our scheduled principal and interest payments on our outstanding debt obligations, including our subordinated debt. We are also required to maintain at least $2.5 million in working capital and maintain a minimum net worth of $20 million.
As of December 31, 2010, we were in compliance with all our loan covenants. Management's current financial projections indicate that we will be in compliance with our financial covenants for the next 12 months and we expect to remain in compliance thereafter. Management does not believe that it is reasonably likely that we will fall out of compliance with our material loan covenants in the next 12 months. If we fail to comply with the terms of our credit agreements with FNBO, and FNBO refuses to waive the non-compliance, FNBO may require us to immediately repay all amounts outstanding on our loans.
32
Lake County Tax Increment Financing Bonds
We have a guarantee obligation on a portion of a $1.323 million tax increment revenue bond series issued by Lake County, South Dakota on December 2, 2003. The portion for which we are obligated is estimated at approximately $148,000. The bond was issued in connection with the refunding of a tax increment financing bond issued by Lake County in 2001, of which we were the recipient of the proceeds. In 2003, Lake County became aware that the taxes collected from the property on which the plant is located would be insufficient to cover the debt service of the 2001 bond issue. Based on this deficiency and changes in interest rates during December 2003, Lake County refunded the 2001 bond issue and replaced it with two separate bonds: a tax-exempt bond in the amount of $824,599 and a taxable bond in the amount of $1,323,024. As a part of this refund, we entered into an agreement with the holder of these bonds to guarantee the entire debt service on the taxable bond issue. The taxes levied on our property are used first towards paying the debt service of the tax-exempt bonds and any remaining taxes are used for paying the debt service of the taxable bonds. Since the property taxes on the property are currently sufficient to cover a portion of the debt service on the taxable bond series, our obligation under the guarantee is to cover the shortfall in debt service, representing the difference between the original taxable bond amount ($1,323,024) and the estimated amount expected to be collected in property taxes from the real property on which our plant is located. The interest rate on the bonds is 7.75% annually. The taxable bonds require semi-annual payments of interest on December 1 and June 1, in addition to a payment of principal on December 1 of each year. While our obligation under the guarantee is expected to continue until maturity in 2018, such obligation may cease at some point in time if the property on which the plant is located appreciates in value to the extent that Lake County is able to collect a sufficient amount in taxes to cover the principal and interest payments on the taxable bonds. The principal balance outstanding was approximately $1,217,000 as of December 31, 2010.
In addition to our debt obligations, we have certain other contractual cash obligations and commitments. The following table provides information regarding our consolidated contractual obligations and commitments as of December 31, 2010:
Payment Due By Period | ||||||||||||||||||||
Contractual Cash Obligations | Total | Less than One Year | One to Three Years | Three to Five Years | After Five Years | |||||||||||||||
Long-Term Debt Obligations | $ | 2,647,149 | $ | 1,813,494 | $ | 676,120 | $ | 157,535 | $ | — | ||||||||||
Estimated Interest on Long-Term Debt | 252,264 | 196,722 | 52,455 | 3,087 | — | |||||||||||||||
Operating Lease Obligations | 390,000 | 390,000 | — | — | — | |||||||||||||||
Purchase Obligations | 19,754,127 | 19,754,127 | — | — | — | |||||||||||||||
Other Long-Term Liabilities | 147,793 | 52,382 | 86,685 | 8,076 | 650 | |||||||||||||||
Total Contractual Cash Obligations | $ | 23,191,333 | $ | 22,206,725 | $ | 815,260 | $ | 168,698 | $ | 650 | ||||||||||
Off-Balance Sheet Arrangements
We do not have any off-balance sheet arrangements.
ITEM 7A. QUANTITATIVE AND QUALITATIVE DISCLOSURES ABOUT MARKET RISK
We are exposed to the impact of market fluctuations associated with commodity prices as discussed below. We have no exposure to foreign currency risk as all of our business is conducted in U.S. Dollars. We use derivative financial instruments as part of an overall strategy to manage market risk. We use cash, futures and option contracts to hedge changes to the commodity prices of corn and natural gas. We do not enter into these derivative financial instruments for trading or speculative purposes, nor do we designate these contracts as hedges for accounting purposes pursuant to the requirements of SFAS 133, Accounting for Derivative Instruments and Hedging Activities.
Commodity Price Risk
We are exposed to market risk from changes in commodity prices. Exposure to commodity price risk results from our dependence on corn and natural gas in the ethanol production process. We seek to minimize the risks from fluctuations in the prices of corn and natural gas through the use of hedging instruments. In practice, as markets move, we actively manage our risk and adjust hedging strategies as appropriate. Although we believe our hedge positions accomplish an economic hedge against our future purchases, they are not designated as such for hedge accounting purposes, which would match the gain or loss on our hedge
33
positions to the specific commodity purchase being hedged. We are marking to market our hedge positions, which means as the current market price of our hedge positions changes, the gains and losses are immediately recognized in our cost of revenues.
The immediate recognition of hedging gains and losses can cause net income to be volatile from quarter to quarter due to the timing of the change in value of the derivative instruments relative to the cost and use of the commodity being hedged. We recorded an increase to our cost of revenues of approximately $6.8 million related to derivative instruments for the year ended December 31, 2010. We recorded a decrease to our cost of revenues of approximately $3.5 million related to derivative instruments for the year ended December 31, 2009. We recorded an increase to cost of revenue of approximately $27.3 million related to our derivative instruments for our fiscal year ended December 31, 2008. There are several variables that could affect the extent to which our derivative instruments are impacted by price fluctuations in the cost of corn or natural gas. However, it is likely that commodity cash prices will have the greatest impact on the derivatives instruments with delivery dates nearest the current cash price.
As of December 31, 2010, we had price protection for approximately 24% of our expected corn usage for fiscal year ended December 31, 2011 using CBOT futures and options and over-the-counter option contracts. As corn prices move in reaction to market trends and information, our income statement will be affected depending on the impact such market movements have on the value of our derivative instruments. Depending on market movements, crop prospects and weather, these price protection positions may cause immediate adverse effects to our financial results, but are designed to produce long-term positive growth for us.
As of December 31, 2010, we were committed to purchasing approximately 120,000 MMBtu's of natural gas during our 2011 fiscal year, valued at approximately $260,000. The natural gas purchases represent approximately 8% of the annual plant requirements.
A sensitivity analysis has been prepared to estimate our exposure to corn and natural gas price risk. The table presents the fair value of our derivative instruments as of December 31, 2010, December 31, 2009 and December 31, 2008 and the potential loss in fair value resulting from a hypothetical 10% adverse change in such prices. The fair value of the positions is a summation of the fair values calculated by valuing each net position at quoted market prices as of the applicable date. The results of this analysis, which may differ from actual results, are as follows:
Year Ended | Fair Value | Effect of Hypothetical Adverse Change - Market Risk | ||||||
December 31, 2010 | $ | 6,535,668 | $ | 653,567 | ||||
December 31, 2009 | 3,562,370 | 356,237 | ||||||
December 31, 2008 | 21,607,078 | 2,160,708 | ||||||
34
ITEM 8. FINANCIAL STATEMENTS AND SUPPLEMENTARY DATA
LAKE AREA CORN PROCESSORS, LLC
Table of Contents
Page | |
REPORT OF INDEPENDENT REGISTERED PUBLIC ACCOUNTING FIRM | |
CONSOLIDATED FINANCIAL STATEMENTS | |
Consolidated Balance Sheets | |
Consolidated Statements of Operations | |
Consolidated Statements of Changes in Members' Equity | |
Consolidated Statements of Cash Flows | |
Notes to Consolidated Financial Statements | |
35

REPORT OF INDEPENDENT REGISTERED PUBLIC ACCOUNTING FIRM
To the Board of Managers and Members
Lake Area Corn Processors, LLC
We have audited the accompanying consolidated balance sheets of Lake Area Corn Processors, LLC and subsidiary as of December 31, 2010 and 2009, and the related consolidated statements of operations, changes in members' equity, and cash flows for each of the three years in the period ended December 31, 2010. These financial statements are the responsibility of the Company's management. Our responsibility is to express an opinion on these financial statements based on our audits.
We conducted our audits in accordance with the standards of the Public Company Accounting Oversight Board (United States). Those standards require that we plan and perform the audit to obtain reasonable assurance about whether the financial statements are free of material misstatement. The Company is not required to have, nor were we engaged to perform an audit of its internal control over financial reporting. Our audit included consideration of internal control over financial reporting as a basis for designing audit procedures that are appropriate in the circumstances, but not for the purpose of expressing an opinion on the effectiveness of the Company's internal control over financial reporting. Accordingly, we express no such opinion. An audit also includes examining, on a test basis, evidence supporting the amounts and disclosures in the financial statements, assessing the accounting principles used and significant estimates made by management, as well as evaluating the overall financial statement presentation. We believe that our audits provide a reasonable basis for our opinion.
In our opinion, the consolidated financial statements referred to above present fairly, in all material respects, the financial position of Lake Area Corn Processors, LLC and subsidiary as of December 31, 2010 and 2009, and the results of their operations and their cash flows for each of the three years in the period ended December 31, 2010, in conformity with U.S. generally accepted accounting principles.

McGladrey & Pullen, LLP
Des Moines, Iowa
March 30, 2011
36
LAKE AREA CORN PROCESSORS, LLC
CONSOLIDATED BALANCE SHEETS
DECEMBER 31, 2010 AND 2009
2010 | 2009 | ||||||
ASSETS | |||||||
CURRENT ASSETS | |||||||
Cash | $ | 637,804 | $ | 365,066 | |||
Accounts receivable | 4,114,940 | 3,456,380 | |||||
Other receivables | 188,959 | 276,273 | |||||
Inventory | 10,063,208 | 7,580,174 | |||||
Due from broker | 3,725,998 | 1,494,653 | |||||
Derivative financial instruments | 73,800 | — | |||||
Prepaid expenses | 126,523 | 167,954 | |||||
Total current assets | 18,931,232 | 13,340,500 | |||||
PROPERTY AND EQUIPMENT | |||||||
Land | 676,097 | 676,097 | |||||
Land improvements | 2,665,358 | 2,665,358 | |||||
Buildings | 8,088,853 | 8,088,853 | |||||
Equipment | 40,799,589 | 40,768,265 | |||||
52,229,897 | 52,198,573 | ||||||
Less accumulated depreciation | (22,469,329 | ) | (19,752,594 | ) | |||
Net property and equipment | 29,760,568 | 32,445,979 | |||||
OTHER ASSETS | |||||||
Goodwill | 10,395,766 | 10,395,766 | |||||
Investments | 2,856,445 | 2,345,300 | |||||
Other | 234,410 | 97,675 | |||||
Total other assets | 13,486,621 | 12,838,741 | |||||
TOTAL ASSETS | $ | 62,178,421 | $ | 58,625,220 | |||
See Notes to Consolidated Financial Statements
37
2010 | 2009 | ||||||
LIABILITIES AND MEMBERS’ EQUITY | |||||||
CURRENT LIABILITIES | |||||||
Outstanding checks in excess of bank balance | $ | 584,412 | $ | 285,804 | |||
Accounts payable | 5,377,598 | 6,245,418 | |||||
Accrued liabilities | 672,802 | 1,045,279 | |||||
Derivative financial instruments | 2,527,175 | 610,991 | |||||
Short-term notes payable | 1,872,000 | — | |||||
Current portion of guarantee payable | 52,382 | 52,485 | |||||
Current portion of notes payable | 1,813,494 | 2,727,740 | |||||
Total current liabilities | 12,899,863 | 10,967,717 | |||||
LONG-TERM LIABILITIES | |||||||
Notes payable, net of current maturities | 833,655 | 3,609,203 | |||||
Guarantee payable, net of current portion | 95,411 | 147,793 | |||||
Other | 252,344 | 166,600 | |||||
Total long-term liabilities | 1,181,410 | 3,923,596 | |||||
COMMITMENTS AND CONTINGENCIES | |||||||
MEMBERS’ EQUITY | |||||||
Capital units, $0.50 stated value, 29,620,000 units issued and outstanding | 14,810,000 | 14,810,000 | |||||
Additional paid-in capital | 96,400 | 96,400 | |||||
Retained earnings | 33,190,748 | 28,827,507 | |||||
Total members' equity | 48,097,148 | 43,733,907 | |||||
TOTAL LIABILITIES AND MEMBERS' EQUITY | $ | 62,178,421 | $ | 58,625,220 | |||
See Notes to Consolidated Financial Statements
38
LAKE AREA CORN PROCESSORS, LLC
CONSOLIDATED STATEMENS OF OPERATIONS
YEARS ENDED DECEMBER 31, 2010, 2009 AND 2008
2010 | 2009 | 2008 | |||||||||
REVENUES | $ | 96,395,789 | $ | 90,340,642 | $ | 111,778,588 | |||||
COSTS OF REVENUES | 86,289,732 | 81,659,486 | 125,413,056 | ||||||||
GROSS PROFIT (LOSS). | 10,106,057 | 8,681,156 | (13,634,468 | ) | |||||||
OPERATING EXPENSES | 2,922,059 | 2,957,809 | 3,534,274 | ||||||||
INCOME (LOSS) FROM OPERATIONS | 7,183,998 | 5,723,347 | (17,168,742 | ) | |||||||
OTHER INCOME (EXPENSE) | |||||||||||
Interest and other income | 31,379 | 106,854 | 54,522 | ||||||||
Equity in net income of investments | 230,466 | (161,774 | ) | 1,157,074 | |||||||
Interest and other expense | (401,281 | ) | (793,658 | ) | (656,303 | ) | |||||
Total other income (expense) | (139,436 | ) | (848,578 | ) | 555,293 | ||||||
Net income (loss) | $ | 7,044,562 | $ | 4,874,769 | $ | (16,613,449 | ) | ||||
Basic and diluted earnings (loss) per unit | $ | 0.24 | $ | 0.16 | $ | (0.56 | ) | ||||
Weighted average number of units outstanding for the calculation of basic & diluted earnings (loss) per unit | 29,620,000 | 29,620,000 | 29,620,000 | ||||||||
See Notes to Consolidated Financial Statements
39
LAKE AREA CORN PROCESSORS, LLC
CONSOLIDATED STATEMENTS OF CHANGES IN MEMBERS' EQUITY
YEARS ENDED DECEMBER 31, 2010, 2009 AND 2008
Capital Units | Additional | Retained | ||||||||||||||||
Units | Amount | Paid-In Capital | Earnings | Total | ||||||||||||||
Balance, December 31, 2007 | 29,620,000 | $ | 14,810,000 | $ | 96,400 | $ | 42,047,187 | $ | 56,953,587 | |||||||||
Net loss | — | — | — | (16,613,449 | ) | (16,613,449 | ) | |||||||||||
Distributions paid ($.05 per capital unit) | — | — | — | (1,481,000 | ) | (1,481,000 | ) | |||||||||||
Balance, December 31, 2008 | 29,620,000 | 14,810,000 | 96,400 | 23,952,738 | 38,859,138 | |||||||||||||
Net Income | — | — | — | 4,874,769 | 4,874,769 | |||||||||||||
Balance, December 31, 2009 | 29,620,000 | 14,810,000 | 96,400 | 28,827,507 | 43,733,907 | |||||||||||||
Net income | — | — | — | 7,044,562 | 7,044,562 | |||||||||||||
Equity adjustment in investee | — | — | — | 280,679 | 280,679 | |||||||||||||
Distributions paid ($.10 per capital unit) | — | — | — | (2,962,000 | ) | (2,962,000 | ) | |||||||||||
Balance, December 31, 2010 | 29,620,000 | $ | 14,810,000 | $ | 96,400 | $ | 33,190,748 | $ | 48,097,148 | |||||||||
See Notes to Consolidated Financial Statements
40
LAKE AREA CORN PROCESSORS, LLC
CONSOLIDATED STATEMENTS OF CASH FLOWS
YEARS ENDED DECEMBER 31, 2010, 2009 AND 2008
2010 | 2009 | 2008 | |||||||||
OPERATING ACTIVITIES | |||||||||||
Net income (loss) | $ | 7,044,562 | $ | 4,874,769 | $ | (16,613,449 | ) | ||||
Changes to net income not affecting cash | |||||||||||
Depreciation and amortization | 2,759,379 | 2,775,009 | 2,759,580 | ||||||||
Equity in net (income) loss of investments | (230,466 | ) | 161,774 | (1,157,074 | ) | ||||||
Unrealized loss on purchase commitments | — | (2,735,966 | ) | 2,735,966 | |||||||
Lower of cost or market adjustment on inventory | — | 211,935 | 1,139,029 | ||||||||
(Increase) decrease in | |||||||||||
Receivables | (571,246 | ) | (796,528 | ) | 2,220,370 | ||||||
Inventory | (2,483,034 | ) | (1,265,132 | ) | 417,199 | ||||||
Prepaid expenses | 41,431 | 121,490 | 10,664 | ||||||||
Derivative financial instruments and due from broker | (388,961 | ) | (608,201 | ) | 13,402,114 | ||||||
Increase (decrease) in | |||||||||||
Accounts payable | (867,820 | ) | (1,209,677 | ) | 1,451,801 | ||||||
Accrued liabilities | (286,733 | ) | 486,111 | 129,395 | |||||||
NET CASH PROVIDED BY OPERATING ACTIVITIES | 5,017,112 | 2,015,584 | 6,495,595 | ||||||||
INVESTING ACTIVITIES | |||||||||||
Purchase of property and equipment | (31,325 | ) | (1,033,331 | ) | (1,514,941 | ) | |||||
Purchase of other assets | (32,276 | ) | — | (1,595,572 | ) | ||||||
NET CASH USED FOR INVESTING ACTIVITIES | (63,601 | ) | (1,033,331 | ) | (3,110,513 | ) | |||||
FINANCING ACTIVITIES | |||||||||||
Increase (decrease) in outstanding checks in excess of bank balance | 298,608 | (115,114 | ) | 400,918 | |||||||
Short-term notes payable issued | 1,872,000 | — | — | ||||||||
Long-term notes payable issued | — | 3,339,000 | 2,450,000 | ||||||||
Principal payments on short-term notes payable | — | — | (2,333,000 | ) | |||||||
Principal payments on long-term notes payable | (3,836,896 | ) | (4,268,912 | ) | (2,232,285 | ) | |||||
Payment on guarantee payable | (52,485 | ) | (60,678 | ) | (62,320 | ) | |||||
Distributions paid to LACP members | (2,962,000 | ) | — | (1,481,000 | ) | ||||||
NET CASH USED FOR FINANCING ACTIVITIES | (4,680,773 | ) | (1,105,704 | ) | (3,257,687 | ) | |||||
NET INCREASE (DECREASE) IN CASH | 272,738 | (123,451 | ) | 127,395 | |||||||
CASH AT BEGINNING OF PERIOD | 365,066 | 488,517 | 361,122 | ||||||||
CASH AT END OF PERIOD | $ | 637,804 | $ | 365,066 | $ | 488,517 | |||||
SUPPLEMENTAL DISCLOSURES OF CASH FLOW INFORMATION | |||||||||||
Cash paid during the year for interest | $ | 487,277 | $ | 707,119 | $ | 678,272 | |||||
SUPPLEMENTAL SCHEDULE OF NONCASH OPERATING AND FINANCING ACTIVITIES | |||||||||||
Capital expenditures in accounts payable | $ | — | — | $ | 403,840 | ||||||
Land acquired through issuance of note payable | — | — | 450,000 | ||||||||
Other assets acquired through issuance of note payable | 147,102 | — | — | ||||||||
Equity adjustment in investee | 280,679 | — | — | ||||||||
See Notes to Consolidated Financial Statements
41
LAKE AREA CORN PROCESSORS, LLC
NOTES TO CONSOLIDATED FINANCIAL STATEMENTS
DECEMBER 31, 2010, 2009 AND 2008
NOTE 1 . NATURE OF OPERATIONS
Principal Business Activity
Lake Area Corn Processors, LLC and subsidiary (the Company) is a South Dakota limited liability company located in Wentworth, South Dakota. The Company was organized by investors to provide a portion of the corn supply for a 40 million-gallon (annual capacity) ethanol plant, owned by Dakota Ethanol, L.L.C. (Dakota Ethanol). The Company sells ethanol and related products to customers located in North America.
NOTE 2. SUMMARY OF SIGNIFICANT ACCOUNTING POLICIES
Principles of Consolidation
The consolidated financial statements of the Company include the accounts of its wholly owned subsidiary, Dakota Ethanol. All significant inter-company transactions and balances have been eliminated in consolidation.
Revenue Recognition
Revenue from the production of ethanol and related products is recorded when title transfers to customers, net of allowances for estimated returns. Generally, ethanol and related products are shipped FOB shipping point, based on written contract terms between Dakota Ethanol and its customers. Collectability of revenue is reasonably assured based on historical evidence of collectability between Dakota Ethanol and its customers. Interest income is recognized as earned.
Shipping costs incurred by the Company in the sale of ethanol are not specifically identifiable and as a result, revenue from the sale of ethanol is recorded based on the net selling price reported to the Company from the marketer.
Cost of Revenues
The primary components of cost of revenues from the production of ethanol and related co-product are corn expense, energy expense (natural gas and electricity), raw materials expense (chemicals and denaturant), and direct labor costs.
Shipping costs incurred in the sale of distiller's grains are classified in net revenues. Shipping costs on distiller's grains were approximately $629,000, $795,000, and $1,718,000, for the years ended December 31, 2010, 2009 and 2008, respectively.
Operating Expenses
The primary components of operating expenses are administrative wages and benefits, professional fee expenses (legal and audit), and insurance expenses.
Inventory Valuation
Ethanol inventory is valued at the lower of cost (first-in, first-out) or market. Distiller's grains and related products are stated at net realizable value. Raw materials, work-in-process, and parts inventory are valued using methods which approximate the lower of cost (first-in, first-out) or market. In the valuation of inventories and purchase and sale commitments, market is based on current replacement values except that it does not exceed net realizable values and is not less than net realizable values reduced by allowances for approximate normal profit margin.
Cash and Cash Equivalents
Cash and cash equivalents consist of demand accounts and other accounts that provide withdrawal privileges. Checks drawn in excess of bank balance are recorded as a liability on the balance sheet and as a financing activity on the statement of cash flows.
42
LAKE AREA CORN PROCESSORS, LLC
NOTES TO CONSOLIDATED FINANCIAL STATEMENTS
DECEMBER 31, 2010, 2009 AND 2008
Receivables and Credit Policies
Trade receivables are uncollateralized customer obligations due under normal trade terms requiring payment within fifteen days from the invoice date. Unpaid trade receivables with invoice dates over thirty days old bear interest at 1.5 percent per month. Trade receivables are stated at the amount billed to the customer. Payments of trade receivables are allocated to the specific invoices identified on the customer's remittance advice or, if unspecified, are applied to the earliest unpaid invoices.
The carrying amount of trade receivables is reduced by a valuation allowance that reflects management's best estimate of the amounts that will not be collected. Management reviews all trade receivable balances that exceed sixty days from the invoice date and based on an assessment of current creditworthiness, estimates the portion, if any, of the balance that will not be collected.
Investment in commodities contracts, derivative instruments and hedging activities
The Company is exposed to certain risks related to our ongoing business operations. The primary risks that we manage by using forward or derivative instruments are price risk on anticipated purchases of corn, natural gas and the sale of ethanol.
The Company is subject to market risk with respect to the price and availability of corn, the principal raw material we use to produce ethanol and ethanol by-products. In general, rising corn prices result in lower profit margins and, therefore, represent unfavorable market conditions. This is especially true when market conditions do not allow us to pass along increased corn costs to our customers. The availability and price of corn is subject to wide fluctuations due to unpredictable factors such as weather conditions, farmer planting decisions, governmental policies with respect to agriculture and international trade and global demand and supply.
Certain contracts that literally meet the definition of a derivative may be exempted from derivative accounting as normal purchases or normal sales. Normal purchases and normal sales are contracts that provide for the purchase or sale of something other than a financial instrument or derivative instrument that will be delivered in quantities expected to be used or sold over a reasonable period in the normal course of business. Contracts that meet the requirements of normal purchases or sales are documented as normal and exempted from the accounting and reporting requirements of derivative accounting. Effective January 1, 2008, we applied the normal purchase and sales exemption under derivative accounting for forward purchases of corn and sales of distiller's grains. Transactions initiated prior to January 1, 2008 are not exempted from the accounting and reporting requirements. As of December 31, 2010, we are committed to purchasing 4.5 million bushels of corn on a forward contract basis with an average price of $4.58 per bushel, of which 40,000 bushels are subject to derivative accounting treatment and 4.4 million bushels are accounted for as normal purchases, and accordingly, are not marked to market and are accounted for using lower of cost or market accounting. Dakota Ethanol has a derivative financial instrument asset of approximately $74,000 related to the forward contracted purchases of corn. The total corn purchase contracts represent 26% of the annual plant corn usage.
The Company sometimes enters into firm-price purchase commitments with some of our natural gas suppliers under which the Company agrees to buy natural gas at a price set in advance of the actual delivery of that natural gas to us. Under these arrangements, the Company assumes the risk of a price decrease in the market price of natural gas between the time this price is fixed and the time the natural gas is delivered. At December 31, 2010, the Company was committed to purchasing 120,000 MMBtu's of natural gas with an average price of $4.39 per MMBtu. The Company accounts for these transactions as normal purchases, and accordingly, does not mark these transactions to market. The natural gas purchases represent approximately 8% of the annual plant requirements.
The Company enters into short-term forward, option and futures contracts as a means of securing corn and natural gas for the ethanol plant and managing exposure to changes in commodity and energy prices. The Company enters into short-term forward, option and futures contracts for sales of ethanol to manage exposure to changes in energy prices. All of our derivatives are designated as non-hedge derivatives, and accordingly are recorded at fair value with changes in fair value recognized in net income. Although the contracts are considered economic hedges of specified risks, they are not designated as and accounted for as hedging instruments.
As part of our trading activity, the Company uses futures and option contracts offered through regulated commodity exchanges to reduce risk and the Company is exposed to risk of loss in the market value of inventories. To reduce that risk, the Company generally takes positions using forward and futures contracts and options.
43
LAKE AREA CORN PROCESSORS, LLC
NOTES TO CONSOLIDATED FINANCIAL STATEMENTS
DECEMBER 31, 2010, 2009 AND 2008
Derivatives not designated as hedging instruments at December 31, 2010 and December 31, 2009 were as follows:
Balance Sheet Classification | December 31, 2010 | December 31, 2009 | ||||||||
Forward contracts | Current Assets | $ | 73,800 | $ | — | |||||
Futures and options contracts | (Current Liabilities) | (2,527,175 | ) | (551,420 | ) | |||||
Forward contracts | (Current Liabilities) | — | (59,571 | ) | ||||||
Realized and unrealized gains and losses related to derivative contracts related to corn and natural gas purchases are included as a component of cost of revenues and derivative contracts related to ethanol sales are included as a component of revenues in the accompanying financial statements.
Statement of Operations | Years Ended December 31, | |||||||||||||
Classification | 2010 | 2009 | 2008 | |||||||||||
Net realized and unrealized gains (losses) related to sales contracts: | ||||||||||||||
Futures and options contracts | Revenues | $ | 252,938 | $ | (1,487,368 | ) | $ | — | ||||||
Net realized and unrealized gains (losses) related to purchase contracts: | ||||||||||||||
Futures and options contracts | Cost of Revenues | $ | (6,912,347 | ) | $ | 720,608 | $ | (15,542,120 | ) | |||||
Forward contracts | Cost of Revenues | $ | 133,371 | $ | 38,341 | $ | (9,052,358 | ) | ||||||
Investments
Dakota Ethanol has investment interests in two unlisted companies in related industries. These investments are flow-through entities and are being accounted for by the equity method of accounting under which the Company's share of net income is recognized as income in the Company's income statement and added to the investment account. Distributions or dividends received from the investments are treated as a reduction of the investment account. The Company consistently follows the practice of recognizing the net income based on the most recent reliable data.
Dakota Ethanol has a nine percent investment interest in the company's ethanol marketer, Renewable Products Marketing Group, LLC (RPMG). The net income which is reported in the Company's income statement for RPMG is based on RPMG's September 30, 2010 audited results. The carrying amount of the Company's investment was approximately $1,863,000 and $1,351,000 as of December 31, 2010 and 2009, respectively.
Dakota Ethanol has a twelve percent investment interest in Prairie Gold Venture Partnership, LLC (PGVP), a venture capital fund investing in cellulosic ethanol production. The net income which is reported in the Company's income statement for PGVP is based on PGVP's June 30, 2010 interim results. The carrying amount of the Company's investment was approximately $994,000 as of December 31, 2010 and 2009.
Use of Estimates
The preparation of financial statements in conformity with accounting principles generally accepted in the United States of America requires management to make estimates and assumptions that affect the reported amount of assets and liabilities and disclosure
44
LAKE AREA CORN PROCESSORS, LLC
NOTES TO CONSOLIDATED FINANCIAL STATEMENTS
DECEMBER 31, 2010, 2009 AND 2008
of contingent assets and liabilities at the date of the financial statements and revenues and expenses during the reporting period. Actual results could differ from those estimates.
Concentrations of Credit Risk
The Company's cash balances are maintained in bank depositories and periodically exceed federally insured limits. The company has not experienced any losses in connection with these balances.
Property and Equipment
Property and equipment is stated at cost. Significant additions and betterments are capitalized, while expenditures for maintenance, repairs and minor renewals are charged to operations when incurred. Depreciation on assets placed in service is computed using the straight-line method over estimated useful lives as follows:
Land improvements | 40 years |
Equipment | 5 - 20 years |
Buildings | 40 years |
Equipment relates to two general categories: mechanical equipment and administrative and maintenance equipment. Mechanical equipment generally relates to equipment for handling inventories and the production of ethanol and related products, with useful lives of 15 to 20 years, including boilers, cooling towers, grain bins, centrifuges, conveyors, fermentation tanks, pumps and drying equipment. Administrative and maintenance equipment is equipment with useful lives of 5 to 15 years, including vehicles, computer systems, security equipment, testing devices and shop equipment.
The Company reviews its property and equipment for impairment whenever events indicate that the carrying amount of the asset may not be recoverable. An impairment loss is recorded when the sum of the future cash flows is less than the carrying amount of the asset. An impairment loss is measured as the amount by which the carrying amount of the asset exceeds its fair value. No impairment has been identified.
Goodwill
Goodwill represents the excess of purchase price over the underlying net assets of business acquired. Goodwill is not amortized but is subject to annual impairment tests. The Company has performed the required impairment tests, which have resulted in no impairment adjustments.
Earnings (loss) Per Unit
For purposes of calculating basic earnings (loss) per unit, units issued are considered outstanding on the effective date of issuance. Diluted earnings per unit are calculated by including dilutive potential equity units in the denominator. There were no dilutive equity units for the years ending December 31, 2010, 2009, and 2008.
Income Taxes
The Company is taxed as a limited liability company under the Internal Revenue Code. The income of the Company flows through to the members to be taxed at the member level rather than the corporate level. Accordingly, the Company has no tax liability.
Management has evaluated the Company's tax positions under the Financial Accounting Standards Board issued guidance on accounting for uncertainty in income taxes and concluded that the Company had taken no uncertain tax positions that require adjustment to the financial statements to comply with the provisions of this guidance. Generally, the Company is no longer subject to income tax examinations by the U.S. federal, state or local authorities for the years before 2007.
45
LAKE AREA CORN PROCESSORS, LLC
NOTES TO CONSOLIDATED FINANCIAL STATEMENTS
DECEMBER 31, 2010, 2009 AND 2008
Environmental Liabilities
Dakota Ethanol's operations are subject to environmental laws and regulations adopted by various governmental authorities in the jurisdiction in which it operates. These laws require Dakota Ethanol to investigate and remediate the effects of the release or disposal of materials at its locations. Accordingly, Dakota Ethanol has adopted policies, practices and procedures in the areas of pollution control, occupational health and the production, handling, storage and use of hazardous materials to prevent material environmental or other damage, and to limit the financial liability which could result from such events. Environmental liabilities are recorded when Dakota Ethanol's liability is probable and the costs can be reasonably estimated.
Operating Segment
The Company uses the “management approach” for reporting information about segments in annual and interim financial statements. The management approach is based on the way the chief operating decision-maker organizes segments within a company for making operating decisions and assessing performance. Reportable segments are based on products and services, geography, legal structure, management structure and any other manner in which management disaggregates a company. Based on the “management approach” model, the Company has determined that its business is comprised of a single operating segment.
Recently Issued Accounting Pronouncements
In January 2010, the FASB issued ASU 2010.06, Improving Disclosures About Fair Value Measurements, which amends ASC 820.10 to require new disclosures about transfers in and out of Level 1 and Level 2 fair value measurements and the roll forward activity in Level 3 fair value measurements. ASU 2010.06 also clarifies existing disclosure requirements regarding the level of disaggregation of each class of assets and liabilities within a line item in the statement of financial condition and clarifies that a reporting entity should provide disclosures about the valuation techniques and inputs used to measure fair value for both recurring and nonrecurring fair value measurements that fall in either Level 2 or Level 3 fair value measurements. The new disclosures and clarifications of existing disclosures are effective for interim and annual reporting periods beginning after December 15, 2009, except for the new disclosures about the roll forward of activity in Level 3 fair value measurements which are effective for fiscal years beginning after December 15, 2010 and for interim periods within those fiscal years. The Company's adoption of this guidance did not have an impact on its financial condition or results of operations.
NOTE 3. INVENTORY
Inventory consisted of the following as of December 31, 2010 and 2009:
2010 | 2009 | |||||||
Raw Materials | $ | 6,100,759 | $ | 5,049,737 | ||||
Finished Goods | 2,233,676 | 855,745 | ||||||
Work in process | 821,897 | 679,817 | ||||||
Parts inventory | 906,876 | 994,875 | ||||||
$ | 10,063,208 | $ | 7,580,174 | |||||
Included in inventory is a lower of cost or market adjustment of approximately $0 and $212,000 at December 31, 2010 and 2009 respectively.
46
LAKE AREA CORN PROCESSORS, LLC
NOTES TO CONSOLIDATED FINANCIAL STATEMENTS
DECEMBER 31, 2010, 2009 AND 2008
NOTE 4. INVESTMENTS
Condensed financial information of the investments is as follows:
RPMG | PGVP (unaudited) | |||||||||||||||
12/31/2010 | 12/31/2009 | 12/31/2010 | 12/31/2009 | |||||||||||||
Current Assets | $ | 125,291,437 | $ | 104,251,285 | $ | — | $ | — | ||||||||
Other Assets | 405,396 | 527,470 | 8,500,000 | 8,500,000 | ||||||||||||
Current Liabilities | 105,780,199 | 88,638,769 | 6,404 | 5,509 | ||||||||||||
Long-term debt | — | — | — | — | ||||||||||||
Member's equity | 19,916,634 | 16,139,986 | 8,493,596 | 8,494,491 | ||||||||||||
Revenue | 1,790,452,547 | 1,668,159,966 | — | — | ||||||||||||
Net income (loss) | 2,737,451 | 3,703,030 | (895 | ) | (1,484 | ) | ||||||||||
NOTE 5. SHORT TERM NOTE PAYABLE
On May 13, 2010, Dakota Ethanol renewed a revolving promissory note from First National Bank of Omaha in the amount of $5,000,000. The note expires on May 12, 2011 and the amount available is subject to certain restrictive covenants establishing minimum reporting requirements, ratios, working capital, net worth and borrowing base requirements. Interest on the outstanding principal balances will accrue at 350 basis points above the 1 month LIBOR rate (4.50 percent at December 31, 2010). The rate is subject to a floor of 4.5 percent. There is a commitment fee of 1/2 percent on the unused portion of the $5,000,000 availability. In addition, the bank draws the checking account balance to a minimum balance on a daily basis. The excess cash pays down or the shortfall is drawn upon the note as needed. The note is collateralized by the ethanol plant, its accounts receivable and inventories. On December 31, 2010 Dakota Ethanol had $1,872,000 outstanding and $3,128,000 available to be drawn on the revolving promissory note. On December 31, 2009, Dakota Ethanol had $0 outstanding and $4,000,000 available to be drawn on the revolving promissory note.
NOTE 6. LONG-TERM NOTES PAYABLE
Dakota Ethanol has two notes payable to First National Bank of Omaha, Nebraska (the Bank) (Term Notes 2 and 5).
As part of the note payable agreements, Dakota Ethanol is subject to certain restrictive covenants establishing minimum reporting requirements, ratios, working capital and net worth requirements. The notes are collateralized by the ethanol plant and equipment, its accounts receivable and inventories. Term note 2 is subject to prepayment penalties based on the cost incurred by the Bank to break its fixed interest rate commitment.
The balance of Term Note 2 was due and payable in quarterly installments of $581,690 through September 1, 2011. Interest on outstanding principal balances accrue at a fixed rate of 9 percent. In July 2010, Dakota Ethanol paid off the outstanding principal on Term Note 2.
On May 13, 2010, Dakota Ethanol restructured Term Note 5. Term Note 5 is a reducing revolving note with an availability of $5,000,000. Interest on outstanding principal balances will accrue at 400 basis points above the 1 month LIBOR rate (5.0 percent at December 31, 2010). The rate is subject to a floor of 5.0 percent. Dakota Ethanol may elect to borrow any principal amount repaid on Term Note 5 up to $5,000,000 subject to the terms of the agreement. Should Dakota Ethanol elect not to utilize this feature, the lender will assess an unused commitment fee of 1/2 percent on the unused portion of the note. Term Note 5 has a reducing feature through which the available amount of the note is reduced by $1,000,000 on the anniversary of the note. The note matures on May 1, 2013. On December 31, 2010, Dakota Ethanol had $0 outstanding and $5,000,000 available to be drawn on Term Note 5. On December 31, 2009, Dakota Ethanol had $0 outstanding and $5,000,000 available to be drawn on Term Note 5.
During December 2008, Dakota Ethanol issued a note payable related to the purchase of land adjacent to the plant site. The note was issued for $450,000. The note matures on December 1, 2012. The note is payable in annual installments of $112,500 plus interest. Interest on outstanding principal balances will accrue at a fixed rate of 7.0 percent. This note is collaterilized by the land.
47
Dakota Ethanol conducted a private placement offering of subordinated unsecured debt securities which closed on May 30, 2009. The securities mature two years from the date of issuance. Interest on the outstanding balances will accrue at a fixed rate of 9 percent. Interest will be paid annually on January 30th of each year beginning on January 30, 2010. We issued $1,439,000 in subordinated debt through this offering.
On July 24, 2009 Dakota Ethanol issued an additional $700,000 in subordinated secured debt to Guardian Eagle Investments, LLC. The note has a fixed interest rate of 9.0%. The note requires monthly installments of $25,000 and matures in April 2012. Dakota Ethanol repaid the remaining principal balance in December 2010.
On May 22, 2009, Dakota Ethanol entered into two loan agreements for alternative financing for our corn oil extraction equipment as we had agreed with FNBO; one loan with Rural Electric Economic Development, Inc (REED) and the other loan with First District Development Company (FDDC).
The note to REED for $1 million has a fixed interest rate of 4.7%. The note requires monthly installments of $18,734 and matures on May 25, 2014. The note is secured by the oil extraction equipment.
The note to FDDC for $200,000 has a fixed interest rate of 5.5%. The note requires monthly installments of $3,820 and matures on May 22, 2014. The note is secured by the oil extraction equipment.
We are in compliance with our financial covenants as of December 31, 2010.
The balance of the notes payable as of December 31, 2010 and 2009 is as follows:
2010 | 2009 | |||||||
Note payable to First National Bank, Omaha | ||||||||
Term Note 2 | $ | — | $ | 2,864,121 | ||||
Term Note 3 | — | — | ||||||
Note payable - Land | 225,000 | 337,500 | ||||||
Note payable - Subordinated notes | 1,439,000 | 1,439,000 | ||||||
Note payable - REED | 708,881 | 895,586 | ||||||
Note payable - FDDC | 142,497 | 179,394 | ||||||
Note payable - Guardian Eagle | — | 621,342 | ||||||
Note payable - Other | 131,771 | — | ||||||
2,647,149 | 6,336,943 | |||||||
Less current portion | (1,813,494 | ) | (2,727,740 | ) | ||||
$ | 833,655 | $ | 3,609,203 | |||||
Minimum principal payments for the next five years are as follows:
Years Ending December 31, | Amount | |||
2011 | $ | 1,813,494 | ||
2012 | 387,489 | |||
2013 | 288,631 | |||
2014 | 143,827 | |||
2015 | 13,708 | |||
NOTE 7. EMPLOYEE BENEFIT PLANS
Dakota Ethanol maintains a 401(k) plan for the employees who meet the eligibility requirements set forth in the plan documents. Dakota Ethanol matches a percentage of the employees' contributed earnings. Employer contributions to the plan totaled
48
LAKE AREA CORN PROCESSORS, LLC
NOTES TO CONSOLIDATED FINANCIAL STATEMENTS
DECEMBER 31, 2010, 2009 AND 2008
approximately $82,000, $39,000 and $39,000 for the years ended December 31, 2010, 2009 and 2008, respectively.
NOTE 8. FAIR VALUE MEASUREMENTS
The Company complies with the fair value measurements and disclosures standard which defines fair value, establishes a framework for measuring fair value, and expands disclosure for those assets and liabilities carried on the balance sheet on a fair value basis.
The Company's balance sheet contains derivative financial instruments that are recorded at fair value on a recurring basis. Fair value measurements and disclosures require that assets and liabilities carried at fair value be classified and disclosed according to the process for determining fair value. There are three levels of determining fair value.
Level 1 uses quoted market prices in active markets for identical assets or liabilities.
Level 2 uses observable market based inputs or unobservable inputs that are corroborated by market data.
Level 3 uses unobservable inputs that are not corroborated by market data.
A description of the valuation methodologies used for instruments measured at fair value, as well as the general classification of such instruments pursuant to the valuation hierarchy, is set forth below.
Derivative financial instruments. Commodity futures and options contracts are reported at fair value utilizing Level 1 inputs. For these contracts, the Company obtains fair value measurements from an independent pricing service. The fair value measurements consider observable data that may include dealer quotes and live trading levels from the CBOT and NYMEX markets. Over-the-counter commodity options contracts are reported at fair value utilizing Level 2 inputs. For these contracts, the Company obtains fair value measurements from an independent pricing service. The fair value measurements consider observable data that may include dealer quotes and live trading levels from the over-the-counter markets. Forward purchase contracts are reported at fair value utilizing Level 2 inputs. For these contracts, the Company obtains fair value measurements from local grain terminal bid values. The fair value measurements consider observable data that may include live trading bids from local elevators and processing plants which are based off the CBOT markets.
The following table summarizes financial assets and financial liabilities measured at fair value on a recurring basis as of December 31, 2010 and 2009, segregated by the level of the valuation inputs within the fair value hierarchy utilized to measure fair value:
Total | Level 1 | Level 2 | Level 3 | |||||||||||||
December 31, 2010 | ||||||||||||||||
Assets: | ||||||||||||||||
Derivative financial instruments | $ | 73,800 | $ | — | $ | 73,800 | $ | — | ||||||||
Liabilities: | ||||||||||||||||
Derivative financial instruments | $ | (2,527,175 | ) | $ | (2,527,175 | ) | $ | — | $ | — | ||||||
December 31, 2009 | ||||||||||||||||
Liabilities: | ||||||||||||||||
Derivative financial instruments | $ | 610,991 | $ | 551,420 | $ | 59,571 | $ | — | ||||||||
49
LAKE AREA CORN PROCESSORS, LLC
NOTES TO CONSOLIDATED FINANCIAL STATEMENTS
DECEMBER 31, 2010, 2009 AND 2008
Certain financial assets and financial liabilities are measured at fair value on a nonrecurring basis; that is, the instruments are not measured at fair value on an ongoing basis but are subject to fair value adjustments in certain circumstances (for example, when there is evidence of impairment). Financial assets and financial liabilities measured at fair value on a non-recurring basis were not significant at December 31, 2010.
Disclosure requirements for fair value of financial instruments require disclosure of the fair value of financial assets and financial liabilities, including those financial assets and financial liabilities that are not measured and reported at fair value on a recurring basis or nonrecurring basis. The methodologies for estimating the fair value of financial assets and financial liabilities that are measured at fair value on a recurring or non-recurring basis are discussed above. The methodologies for other financial assets and financial liabilities are discussed below.
The Company believes the carrying amount of cash, cash equivalents, accounts receivable, due from broker, outstanding checks in excess of bank balance, accounts payable, and short-term debt approximates fair value due to the short maturity of these instruments.
The carrying amount of long-term obligations at December 31, 2010 of $2,794,942 had an estimated fair value of approximately $2,797,016 based on estimated interest rates for comparable debt. The carrying amount and fair value were $6,537,221 and $6,602,314 respectively at December 31, 2009.
NOTE 9. COMMITMENTS, CONTINGENCIES, AND AGREEMENTS
Dakota Ethanol has entered into contracts and agreements regarding the operation and management of the ethanol plant.
Natural Gas - The agreement provides Dakota Ethanol with a fixed transportation rate for natural gas for a ten-year term through September 2011, renewable for ten-year terms. The agreement does not require minimum purchases of natural gas during their initial term.
Electricity - The agreement provides Dakota Ethanol with electric service for a term of ten years through September 2011, renewable for five-year periods. The agreement sets rates for energy usage based on market rates and requires a minimum purchase of electricity each month during the initial term of the agreement.
Expenses related to the agreement for the purchase of electricity and natural gas were approximately $8,779,000, $9,585,000 and $14,031,000, for the years ended December 31, 2010, 2009 and 2008, respectively.
Minimum annual payments during the term of the electricity agreement are as follows:
Year Ending December 31, | Amount | |||
2011 | $ | 206,000 | ||
Ethanol Fuel Marketing Agreement - Dakota Ethanol has an agreement with RPMG (a related party, see note 2), a joint venture of ethanol producers, for the sale, marketing, billing and receipt of payment and other administrative services for all ethanol produced by the plant. The agreement expires on March 31, 2011, and is automatically renewed for successive one-year terms unless terminated 90 days prior to expiration.
Distiller's Grain Marketing Agreement - Dakota Ethanol has an agreement with RPMG (a related party, see note 2), for the marketing of all distiller's dried grains produced by the plant. The agreement expires on July 15, 2011, and is automatically renewed for successive one-year terms unless terminated 180 days prior to expiration.
Rail Car Lease Agreements - Dakota Ethanol has agreements with Chicago Freight Car Leasing Co. and Trinity Industries Leasing Co. for rail car leases for the shipment of Dakota Ethanol's distiller's dried grains. The leases expire in October and December of 2010. Dakota Ethanol extended the lease with Trinity Industries Leasing Co. for a period of one year expiring in December 2011. Costs related to the leases were $851,100, $851,100 and $859,800 for the years ended December 31, 2010, 2009 and 2008, respectively.
50
LAKE AREA CORN PROCESSORS, LLC
NOTES TO CONSOLIDATED FINANCIAL STATEMENTS
DECEMBER 31, 2010, 2009 AND 2008
Minimum annual payments during the term of the rail car lease agreement are as follows:
Year Ending December 31, | Amount | |||
2011 | $ | 390,000 | ||
Dakota Ethanol receives an incentive payment from the State of South Dakota to produce ethanol. In accordance with the terms of this arrangement, revenue is recorded based on ethanol sold. Incentive revenue of $669,956, $641,649 and $623,515, was recorded for the years ended December 31, 2010, 2009 and 2008, respectively. Dakota Ethanol did not receive the annual maximum for the 2010 program year due to budget constraints on the State of South Dakota program and will not likely receive the annual maximum under the 2011 program year.
NOTE 10. RELATED PARTY TRANSACTIONS
On April, 1 2007, Dakota Ethanol purchased a 9% interest in RPMG, in which Dakota Ethanol has entered into an ethanol marketing agreement for the exclusive rights to market, sell and distribute the entire ethanol inventory produced by Dakota Ethanol. The marketing fees are included in net revenues.
On August 1, 2008, Dakota Ethanol entered into a dried distiller's grains marketing agreement with RPMG for the exclusive rights to market, sell and distribute the entire dried distiller's grains inventory produced by Dakota Ethanol. The marketing fees are included in net revenues.
Sales and marketing fees related to the agreements are as follows:
Years Ended December 31, | ||||||||||||
2010 | 2009 | 2008 | ||||||||||
Sales ethanol | $ | 80,384,553 | $ | 76,313,982 | $ | 96,258,317 | ||||||
Sales distillers grains | 7,934,785 | 6,183,806 | 2,843,819 | |||||||||
Marketing fees ethanol | 212,080 | 197,985 | 193,360 | |||||||||
Marketing fees distillers grains | 96,596 | 88,533 | 33,748 | |||||||||
Amounts due included in accounts receivable | 3,504,400 | 2,973,282 | 2,049,739 | |||||||||
Additional agreements with related parties are included in Note 9.
NOTE 11. TIF BOND GUARANTEE
During December 2003, Dakota Ethanol entered into an agreement to guarantee a bond issued by Lake County, South Dakota. The bond issue was in conjunction with the refunding of the tax increment financing (TIF) bond issued by Lake County in 2001, of which Dakota Ethanol was the recipient of the proceeds. During 2003, Lake County became aware that the taxes collected based on the incremental tax would not be sufficient to cover the debt service of the 2001 bond issue. Based on the aforementioned deficiency and changes in interest rate during December of 2003, Lake County refunded the 2001 bond issue replacing it with two separate bonds. A tax-exempt bond in the amount of $824,599 and a taxable bond in the amount of $1,323,024 were issued. As a part of the refunding, Dakota Ethanol entered into the agreement to guarantee the taxable bond issue. The taxes levied on Dakota Ethanol's property will first go towards the semiannual debt service of the tax-exempt bonds and any remaining taxes will be used for the debt service of the taxable bonds. Dakota Ethanol guarantees any shortfall in debt service for the taxable bonds. The guarantee expires in December of 2018.
51
LAKE AREA CORN PROCESSORS, LLC
NOTES TO CONSOLIDATED FINANCIAL STATEMENTS
DECEMBER 31, 2010, 2009 AND 2008
The maximum amount of estimated future payments on the taxable bond debt service is $1,217,735 as of December 31, 2010. The carrying amount of the guarantee liability on Dakota Ethanol's balance sheet is $147,793, which represents the estimated shortfall between the taxable bond amount and the amount of taxes estimated to be collected on Dakota Ethanol's property.
Estimated maturities of the guarantee for the next five years are as follows:
Years Ending December 31, | Amount | |||
2011 | $ | 52,382 | ||
2012 | 52,145 | |||
2013 | 34,540 | |||
2014 | 3,923 | |||
2015 | 4,153 | |||
Dakota Ethanol has no recourse from third parties or collateral held by third parties related to the guarantee.
NOTE 12. CAPTIVE INSURANCE
The Company is a stockholder in a captive insurance company (Captive). The Captive re-insures losses related to general liability, property and workers compensation claims. Premiums and surplus are paid by the Company through a charge to income in the period to which the premium relates. The Captive reinsures losses not to exceed a predetermined amount. That predetermined amount is fully funded through a portion of paid premium and surplus each year.
For losses covered by the Company's insurance, the Company is solely responsible for paying its deductible. The Company has a deductible of $100,000 for property damage claims plus the first five days of business interruption loss. The Company has a deductible of $10,000 for employee benefits claims. The Company has no deductible for products and premises liability claims and for workers compensation claims. The Company has a catastrophic loss limit of $90 million for property loss claims, a $1 million per occurrence with a $2 million annual aggregate for product liability claims, a $1 million per occurrence with a $10 million annual aggregate for premises liability claims, a $1 million per occurrence with a $2 million annual aggregate for employee benefit liability claims and a $500,000 per occurrence with a $500,000 annual aggregate for workers compensation claims. The Company also purchases a $20 million per occurrence with a $40 million aggregate umbrella to cover above the previously stated liability and workers compensation claims.
NOTE 13. SUBSEQUENT EVENTS
Subsequent events have been evaluated through the date the financial statements are filed with the Securities and Exchange Commission. Through that date, there were no events requiring disclosure.
52
LAKE AREA CORN PROCESSORS, LLC
NOTES TO CONSOLIDATED FINANCIAL STATEMENTS
DECEMBER 31, 2010, 2009 AND 2008
NOTE 14. QUARTERLY FINANCIAL REPORTING (UNAUDITED)
Summary quarterly results are as follows:
First Quarter | Second Quarter | Third Quarter | Fourth Quarter | |||||||||||||
Year ended December 31, 2010 | ||||||||||||||||
Total revenues | $ | 22,838,763 | $ | 20,245,683 | $ | 24,502,954 | $ | 28,808,389 | ||||||||
Gross profit | 3,356,683 | 1,703,097 | 1,916,291 | 3,129,986 | ||||||||||||
Income from operations | 2,596,673 | 995,094 | 1,237,184 | 2,355,047 | ||||||||||||
Net income | 2,546,687 | 962,841 | 1,213,113 | 2,321,921 | ||||||||||||
Basic and diluted earnings per unit | 0.09 | 0.03 | 0.04 | 0.08 | ||||||||||||
Year ended December 31, 2009 | ||||||||||||||||
Total revenues | $ | 20,975,004 | $ | 22,487,000 | $ | 20,705,138 | $ | 26,173,500 | ||||||||
Gross profit | 38,588 | 1,030,400 | 1,255,086 | 6,357,082 | ||||||||||||
Income (loss) from operations | (663,874 | ) | 283,257 | 568,372 | 5,535,592 | |||||||||||
Net income (loss) | (1,250,020 | ) | 182,653 | 375,551 | 5,566,585 | |||||||||||
Basic and diluted earnings (loss) per unit | (0.04 | ) | 0.01 | 0.01 | 0.19 | |||||||||||
Year ended December 31, 2008 | ||||||||||||||||
Total revenues | $ | 26,478,012 | $ | 29,916,456 | $ | 31,200,349 | $ | 24,183,771 | ||||||||
Gross profit (loss) | 12,049,847 | 11,643,197 | (20,416,898 | ) | (16,910,614 | ) | ||||||||||
Income (loss) from operations | 10,948,791 | 10,654,549 | (21,252,764 | ) | (17,519,318 | ) | ||||||||||
Net income (loss) | 10,736,498 | 10,502,321 | (21,359,855 | ) | (16,492,413 | ) | ||||||||||
Basic and diluted earnings (loss) per unit | 0.36 | 0.35 | (0.72 | ) | (0.55 | ) | ||||||||||
The above quarterly financial data is unaudited, but in the opinion of management, all adjustments necessary for the fair presentation of the selected data for these interim periods presented have been included.
53
ITEM 9. CHANGES IN AND DISAGREEMENTS WITH ACCOUNTANTS ON ACCOUNTING AND FINANCIAL DISCLOSURE.
None.
ITEM 9A. CONTROLS AND PROCEDURES.
Disclosure Controls and Procedures
Our management, including our President and Chief Executive Officer (the principal executive officer), Scott Mundt, along with our Chief Financial Officer (the principal financial officer), Robbi Buchholtz, have reviewed and evaluated the effectiveness of our disclosure controls and procedures (as defined in Rule 13a-15(e) and Rule 15d-15(e) under the Securities Exchange Act of 1934, as amended) as of December 31, 2010. Based on this review and evaluation, these officers have concluded that our disclosure controls and procedures are effective to ensure that information required to be disclosed in the reports that we file or submit under the Exchange Act is recorded, processed, summarized and reported within the time periods required by the forms and rules of the Securities and Exchange Commission; and to ensure that the information required to be disclosed by an issuer in the reports that it files or submits under the Exchange Act is accumulated and communicated to our management including our principal executive and principal financial officers, or persons performing similar functions, as appropriate to allow timely decisions regarding required disclosure.
Internal Control Over Financial Reporting
Inherent Limitations Over Internal Controls
Our internal control over financial reporting is designed to provide reasonable assurance regarding the reliability of financial reporting and the preparation of financial statements for external purposes in accordance with generally accepted accounting principles. Our internal control over financial reporting includes those policies and procedures that:
(i) pertain to the maintenance of records that, in reasonable detail, accurately and fairly reflect the transactions and dispositions of our assets;
(ii) provide reasonable assurance that transactions are recorded as necessary to permit preparation of financial statements in accordance with generally accepted accounting principles, and that our receipts and expenditures are being made only in accordance with authorizations of our management and directors; and
(iii) provide reasonable assurance regarding prevention or timely detection of unauthorized acquisition, use, or disposition of our assets that could have a material effect on the financial statements.
Management, including our Chief Executive Officer and Chief Financial Officer, does not expect that our internal controls will prevent or detect all errors and all fraud. A control system, no matter how well designed and operated, can provide only reasonable, not absolute, assurance that the objectives of the control system are met. Further, the design of a control system must reflect the fact that there are resource constraints, and the benefits of controls must be considered relative to their costs. Because of the inherent limitations in all control systems, no evaluation of internal controls can provide absolute assurance that all control issues and instances of fraud, if any, have been detected. Also, any evaluation of the effectiveness of controls in future periods are subject to the risk that those internal controls may become inadequate because of changes in business conditions, or that the degree of compliance with the policies or procedures may deteriorate.
Management's Annual Report on Internal Control Over Financial Reporting
Our management is responsible for establishing and maintaining adequate internal control over financial reporting (as defined in Rule 13a-15(f) under the Securities Exchange Act of 1934, as amended). Management conducted an evaluation of the effectiveness of our internal control over financial reporting based on the criteria set forth in Internal Control-Integrated Framework issued by the Committee of Sponsoring Organizations of the Treadway Commission (“COSO”). Based on this evaluation, management has concluded that our internal control over financial reporting was effective as of December 31, 2010.
This annual report does not include an attestation report of our registered public accounting firm regarding internal control over financial reporting. As we are a non-accelerated filer, management's report is not subject to attestation by our registered
54
public accounting firm pursuant to Section 404(c) of the Sarbanes-Oxley Act of 2002 that permits us to provide only management's report in this annual report.
Changes in Internal Control Over Financial Reporting
There were no changes in our internal control over financial reporting during the fourth quarter of our 2010 fiscal year, which were identified in connection with management's evaluation required by paragraph (d) of rules 13a-15 and 15d-15 under the Exchange Act, that have materially affected, or are reasonably likely to materially affect, our internal control over financial reporting.
ITEM 9B. OTHER INFORMATION.
None.
PART III
Pursuant to General Instruction G(3), we omit Part III, Items 10, 11, 12, 13 and 14 and incorporate such items by reference to our definitive information statement to be filed with the Securities and Exchange Commission within 120 days after the close of the fiscal year covered by this Annual Report (the “2011 Information Statement”).
ITEM 10. MANAGERS, EXECUTIVE OFFICERS AND CORPORATE GOVERNANCE
The information required by this Item is incorporated by reference to the 2011 Information Statement.
ITEM 11. EXECUTIVE COMPENSATION.
The information required by this Item is incorporated by reference to the 2011 Information Statement.
ITEM 12. SECURITY OWNERSHIP OF CERTAIN BENEFICIAL OWNERS AND MANAGEMENT AND RELATED MEMBER MATTERS.
The information required by this Item is incorporated by reference to the 2011 Information Statement.
ITEM 13. CERTAIN RELATIONSHIPS AND RELATED TRANSACTIONS, AND MANAGER INDEPENDENCE.
The information required by this Item is incorporated by reference to the 2011 Information Statement.
ITEM 14. PRINCIPAL ACCOUNTING FEES AND SERVICES.
The information required by this Item is incorporated by reference to the 2011 Information Statement.
55
PART IV
ITEM 15. EXHIBITS, FINANCIAL STATEMENT SCHEDULES.
The following exhibits and financial statements are filed as part of, or are incorporated by reference into, this report:
(1) The financial statements appear beginning on page 36 of this report.
(2) All supplemental schedules are omitted because of the absence of conditions under which they are required or because the information is shown in the Consolidated Financial Statements or notes thereto.
(3) The exhibits we have filed herewith or incorporated by reference herein are identified in the Exhibit Index set forth below.
The following exhibits are filed as part of this report. Exhibits previously filed are incorporated by reference, as noted.
Exhibit No. | Exhibit | Filed Herewith | Incorporated by Reference | |||
2.1 | Plan of Reorganization. | Filed as Exhibit 2.1 on the registrant's Form S-4 filed with the Commission on August 2, 2001 and incorporated by reference herein. | ||||
3.1 | Articles of organization of the registrant. | Filed as Exhibit 3.1 on the registrant's Form S-4 filed with the Commission on August 2, 2001 and incorporated by reference herein. | ||||
3.2 | Amended and restated operating agreement of the registrant. | Filed as Exhibit 3.6 on the registrant's Form 10-K filed with the Commission on March 31, 2005 and incorporated by reference herein. | ||||
3.3 | First amendment to the amended and restated operating agreement of the registrant. | Filed as Exhibit 99.1 on the registrant's Form 8-K filed with the Commission on March 19, 2007 and incorporated by reference herein. | ||||
10.1 | Twelfth Amendment to the Construction Loan Agreement dated January 12, 2009 between First National Bank of Omaha and Dakota Ethanol, L.L.C. | Filed as Exhibit 99.1 on the registrant's Form 8-K filed with the Commission on January 20, 2009 and incorporated by reference herein. | ||||
10.2 | Revolving Promissory Note dated January 12, 2009 between First National Bank of Omaha and Dakota Ethanol, L.L.C. | Filed as Exhibit 99.2 on the registrant's Form 8-K filed with the Commission on January 20, 2009 and incorporated by reference herein. | ||||
10.3 | Promissory Note (Term Note 5 Reducing Revolver) dated January 12, 2009 between First National Bank of Omaha and Dakota Ethanol, L.L.C. | Filed as Exhibit 99.3 on the registrant's Form 8-K filed with the Commission on January 20, 2009 and incorporated by reference herein. | ||||
10.4 | Distillers Grains Marketing Agreement dated July 15, 2008 between RPMG, Inc. and Dakota Ethanol, L.L.C. + | Filed as Exhibit 10.1 on the registrant's Form 10-Q filed with the Commission on August 14, 2008 and incorporated by reference herein. | ||||
10.5 | Contribution Agreement between Renewable Products Marketing Group, LLC and Dakota Ethanol, L.L.C. dated April 1, 2007. | Filed as Exhibit 10.1 on the registrant's Form 10-Q filed with the Commission on August 14, 2007 and incorporated by reference herein. | ||||
10.6 | Member Ethanol Fuel Marketing Agreement between Renewable Products Marketing Group, LLC and Dakota Ethanol, L.L.C. dated April 1, 2007. | Filed as Exhibit 10.2. on the registrant's Form 10-Q filed with the Commission on August 14, 2007 and incorporated by reference herein. | ||||
10.7 | Addendum to Water Purchase Agreement dated February 28, 2007 between Big Sioux Community Water Systems, Inc. and Dakota Ethanol, L.L.C. | Filed as Exhibit 10.1 on the registrant's Form 10-K filed with the Commission on March 30, 2007. | ||||
10.8 | Eighth Amendment to the Construction Loan Agreement dated June 30, 2006 between First National Bank of Omaha and Dakota Ethanol, L.L.C. | Filed as Exhibit 10.2 on the registrant's Form 10-Q filed with the Commission on August 14, 2006 and incorporated by reference herein. | ||||
56
10.9 | Sixth Amendment to the Construction Loan Agreement dated March 23, 2006 between First National Bank of Omaha and Dakota Ethanol, L.L.C. | Filed as Exhibit 10.1 on the registrant's Form 10-Q filed with the Commission on May 15, 2006 and incorporated by reference herein. | ||||
10.10 | Risk Management Agreement dated November 28, 2005 between FCStone, LLC and Dakota Ethanol, L.L.C. | Filed as Exhibit 10.1 on the registrant's Form 8-K filed with the Commission on December 2, 2005 and incorporated by reference herein. | ||||
10.11 | Distillers Grain Marketing Agreement dated November 28, 2005 between Commodity Specialists Company and Dakota Ethanol, L.L.C. | Filed as Exhibit 10.2 on the registrant's Form 8-K filed with the Commission on December 2, 2005 and incorporated by reference herein. | ||||
10.12 | Fourth Amendment to Construction Loan Agreement dated April 22, 2005 between First National Bank of Omaha and Dakota Ethanol, L.L.C. | Filed as Exhibit 10. 1 on the registrant's Form 10-Q filed with the Commission on May 16, 2005 and incorporated by reference herein. | ||||
10.13 | Revolving Promissory Note dated April 21, 2005 between First National Bank of Omaha and Dakota Ethanol, L.L.C. | Filed as Exhibit 10.2 on the registrant's Form 10-Q filed with the Commission on May 16, 2005 and incorporated by reference herein. | ||||
10.14 | Employment Agreement between Scott Mundt and Dakota Ethanol, L.L.C. dated October 17, 2005. | Filed as Exhibit 10.9 on the registrant's Form 10-K filed with the Commission on March 30, 2006 and incorporated by reference herein. | ||||
10.15 | Thirteenth Amendment to the Construction Loan Agreement dated March 31, 2009 between First National Bank of Omaha and Dakota Ethanol, L.L.C. | Filed as Exhibit 10.15 on the registrant's Form 10-K filed with the Commission on March 31, 2009 and incorporated by reference herein. | ||||
10.16 | Employment Agreement between Scott Mundt and Dakota Ethanol, L.L.C. dated April 1, 2009 | Filed as Exhibit 10.1 on the registrant's Form 10-Q filed with the Commission on May 15, 2009 and incorporated by reference herein. | ||||
10.17 | First Amended and Restated Construction Loan Agreement dated June 18, 2009 between First National Bank of Omaha and Dakota Ethanol, L.L.C. | Filed as Exhibit 10.1 on the registrant's Form 10-Q filed with the Commission on August 12, 2009 and incorporated by reference herein. | ||||
10.18 | Corn Oil Marketing Agreement dated August 11, 2009 between RPMG, Inc. and Dakota Ethanol, L.L.C. + | Filed as Exhibit 10.2 on the registrant's Form 10-Q filed with the Commission on August 12, 2009 and incorporated by reference herein. | ||||
10.19 | First Amendment to First Amended and Restated Construction Loan Agreement between Dakota Ethanol, L.L.C. and First National Bank of Omaha dated May 13, 2010. | Filed as Exhibit 10.1 on the registrant's Form 10-Q filed with the Commission on August 13, 2010 and incorporated by reference herein. | ||||
10.20 | Long Term Reducing Revolving Promissory Note between Dakota Ethanol, L.L.C. and First National Bank of Omaha dated May 13, 2010. | Filed as Exhibit 10.2 on the registrant's Form 10-Q filed with the Commission on August 13, 2010 and incorporated by reference herein. | ||||
10.21 | Operating Line of Credit Promissory Note between Dakota Ethanol, L.L.C. and First National Bank of Omaha dated May 13, 2010. | Filed as Exhibit 10.3 on the registrant's Form 10-Q filed with the Commission on August 13, 2010 and incorporated by reference herein. | ||||
10.22 | Member Ethanol Fuel Marketing Agreement between Dakota Ethanol, LLC and RPMG, Inc. dated March 26, 2010. + | X | Filed herewith | |||
31.1 | Certificate Pursuant to 17 CFR 240.13a-14(a) | X | Filed herewith | |||
31.2 | Certificate Pursuant to 17 CFR 240.13a-14(a) | X | Filed herewith | |||
32.1 | Certificate Pursuant to 18 U.S.C. Section 1350 | X | Filed herewith |
57
32.2 | Certificate Pursuant to 18 U.S.C. Section 1350 | X | Filed herewith |
+ Confidential Treatment Requested
SIGNATURES
Pursuant to the requirements of Section 13 or 15(d) of the Securities Exchange Act of 1934, the registrant has duly caused this report to be signed on its behalf by the undersigned, thereunto duly authorized.
LAKE AREA CORN PROCESSORS, LLC | |||
Date: | March 30, 2011 | /s/ Scott Mundt | |
Scott Mundt | |||
President and Chief Executive Officer (Principal Executive Officer) | |||
Date: | March 30, 2011 | /s/ Robbi Buchholtz | |
Robbi Buchholtz | |||
Chief Financial Officer (Principal Financial and Accounting Officer) | |||
Pursuant to the requirements of the Securities Exchange Act of 1934, this report has been signed below by the following persons on behalf of the registrant and in the capacities and on the dates indicated.
Date: March 30, 2011 | /s/ Ronald Alverson |
Ronald Alverson, Manager | |
Date: March 30, 2011 | /s/ Todd Brown |
Todd Brown, Manager | |
Date: March 30, 2011 | /s/ Randy Hansen |
Randy Hansen, Manager | |
Date: March 30, 2011 | /s/ Rick Kasperson |
Rick Kasperson, Manager | |
Date: March 30, 2011 | /s/ Dale Thompson |
Dale Thompson, Manager | |
Date: March 30, 2011 | /s/ Brian Woldt |
Brian Woldt, Manager | |
Date: March 30, 2011 | /s/ Dave Wolles |
Dave Wolles, Manager | |
58