Attached files
| file | filename |
|---|---|
| 8-K - FORM 8-K - EAGLE BANCORP INC | f8k_030811.htm |
Ticker: EGBN
www.eaglebankcorp.com
www.eaglebankcorp.com
March 2011

1
Forward Looking Statements
This presentation contains forward looking statements within the meaning of the Securities and
Exchange Act of 1934, as amended, including statements of goals, intentions, and expectations as
to future trends, plans, events or results of Company operations and policies and regarding general
economic conditions. In some cases, forward-looking statements can be identified by use of words
such as “may,” “will,” “anticipates,” “believes,” “expects,” “plans,” “estimates,” “potential,”
“continue,” “should,” and similar words or phrases. These statements are based upon current and
anticipated economic conditions, nationally and in the Company’s market, interest rates and
interest rate policy, competitive factors and other conditions which by their nature, are not
susceptible to accurate forecast and are subject to significant uncertainty. For details on factors
that could affect these expectations, see the risk factors and other cautionary language included in
the Company’s Annual Report on Form 10-K and other periodic and current reports filed with the
SEC. Because of these uncertainties and the assumptions on which this discussion and the
forward-looking statements are based, actual future operations and results in the future may differ
materially from those indicated herein. Readers are cautioned against placing undue reliance on
any such forward-looking statements. The Company’s past results are not necessarily indicative of
future performance. The Company does not undertake to publicly revise or update forward-
looking statements in this presentation to reflect events or circumstances that arise after the date
of this presentation, except as may be required under applicable law.
For further information on the Company please contact: Michael T. Flynn
Executive Vice President
240-497-2040
mflynn@eaglebankcorp.com

2
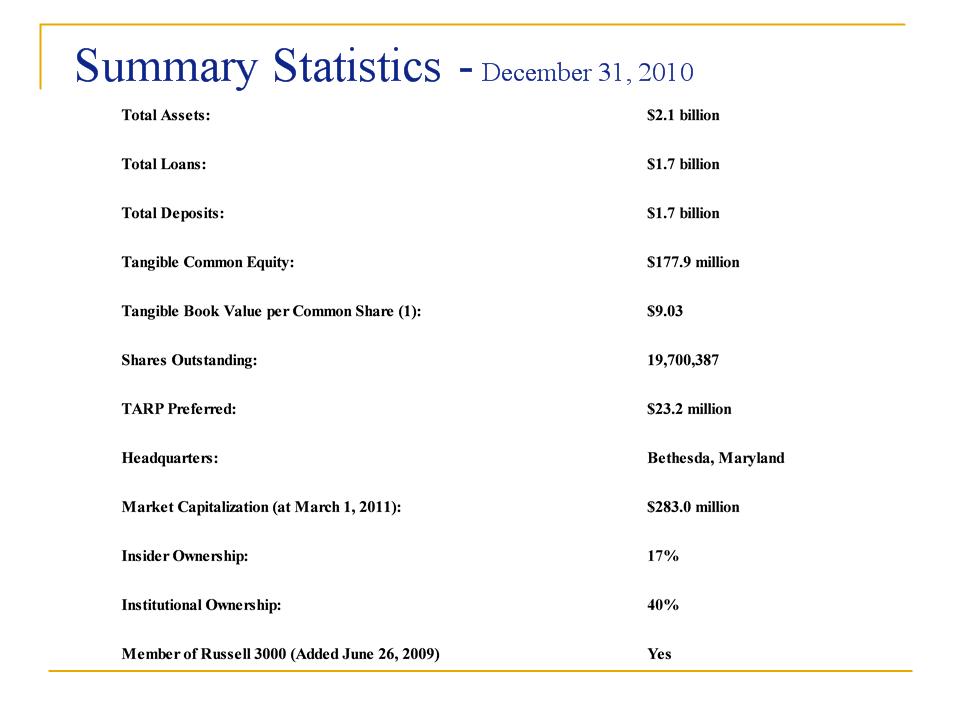
Company Overview
 Eagle Bancorp, Inc. is a rapidly growing commercial bank headquartered in
 Bethesda, Maryland
o $2.1 billion in assets, focused on Washington, DC Metro Area with 13 branches
o Commercially oriented business model with deep relationships on loan and deposit side
of balance sheet
o 2nd largest bank headquartered in Maryland by Assets and Market Capitalization
Positioned as an alternative solution between small community banks and regional / money center banks
o Growth oriented culture based on sales and service
o Provides customers with immediate access to senior management/decision-makers with
local market knowledge
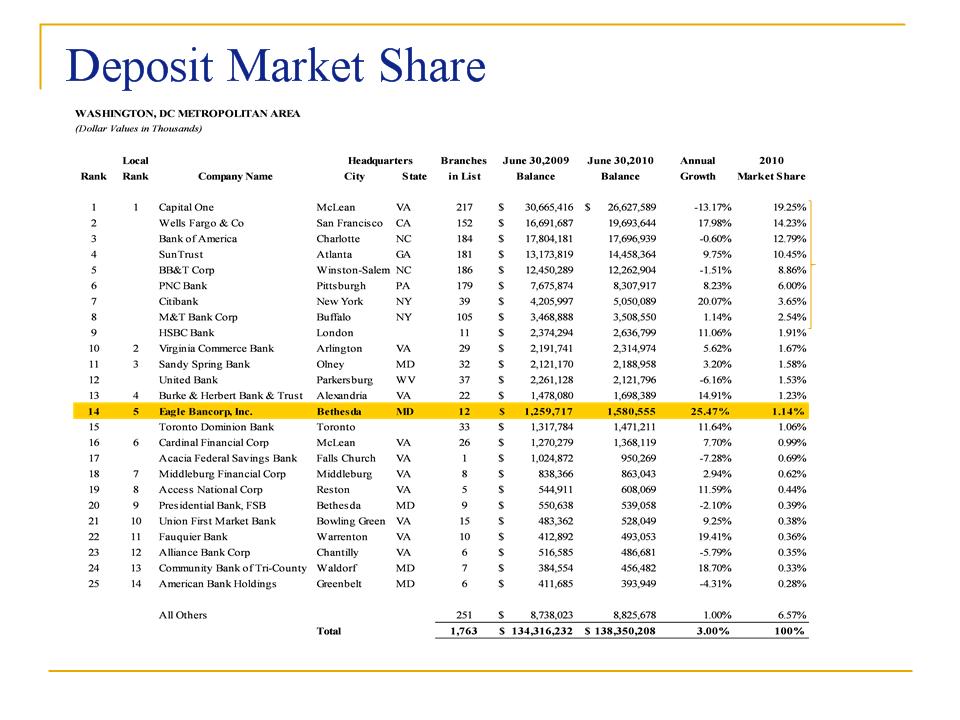
o Largest deposit market share in Washington, DC (proper) of any locally-based bank, and
5th largest locally-based bank in the Metro Area
o Quickly becoming the leading community bank in the Washington, DC Metro Area
Note: Financial data at December 31, 2010. Deposit market share data as of June 30, 2010.

3
History of Growth
Founding members had extensive banking experience Raised $16.5 million in initial subscription offering - 1997* Commenced operations with three Maryland branches - July, 1998 Second subscription offering raised $30 million - 2003* Reached $500 million in assets in 2004 Private placement of $12.1 million of subordinated debt - August 2008 (Current balance $9.3 million) Fidelity & Trust Financial Corporation (“F&T”) acquisition completed - August 31, 2008 $1.4 billion of assets upon completion of acquisition Placed $38.2 million of TARP Preferred Stock - December, 2008 (Current balance $23.2 million) $55 million common stock offering - September, 2009* Reached $2.0 billion in assets - September, 2010 Eight consecutive quarters of increasing Net Income through December, 2010*1997, 2003 and 2009 subscription offerings were over subscribed
4
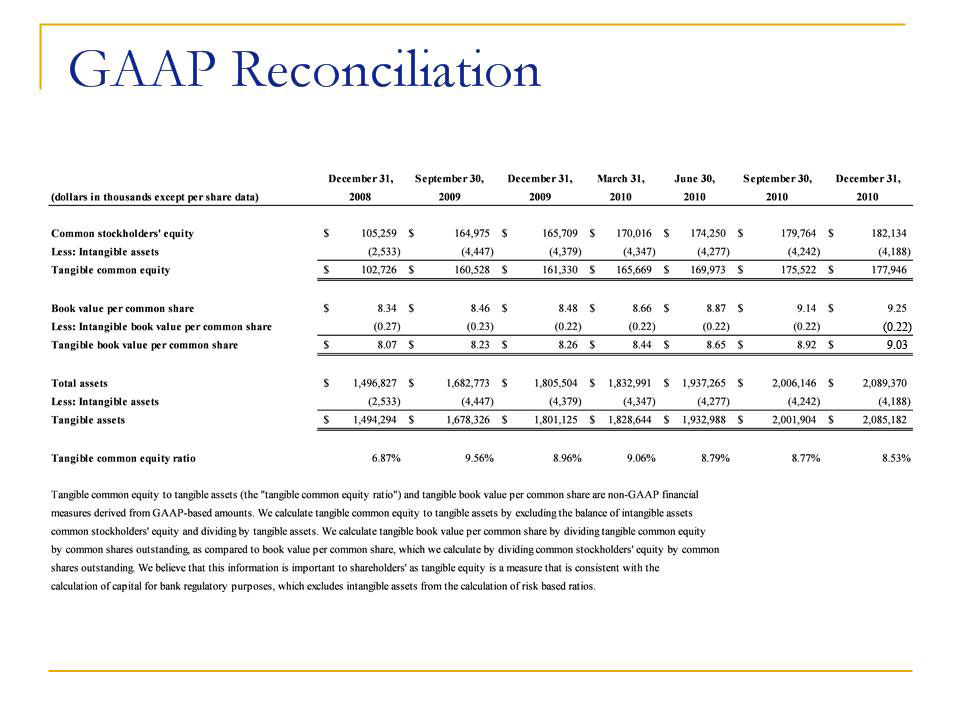
Note: Data at December 31, 2010 unless otherwise noted. (1) This constitutes a non-GAAP financial measure. Please refer to the GAAP reconciliation in the appendices on
Page 43 for a discussion on non-GAAP financial measures and a reconciliation to the most comparable GAAP measures.
5
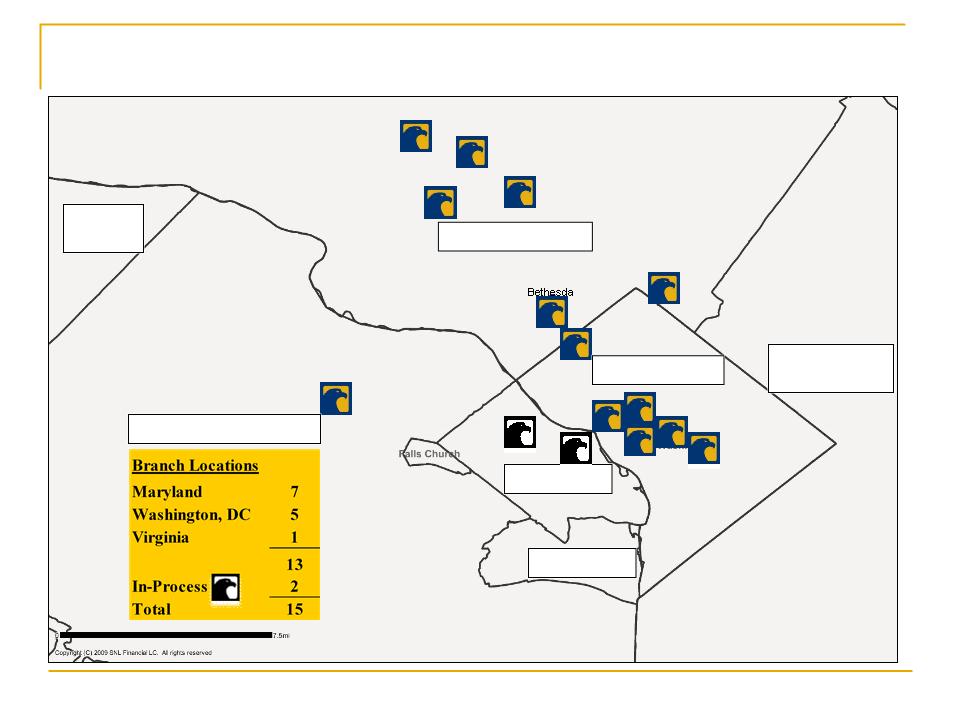
EagleBank Locations
Tyson's Corner
Montgomery County
Prince George’s
County
County
Alexandria
Arlington
Fairfax County
Loudoun
County
County
Washington, DC
Reston
6
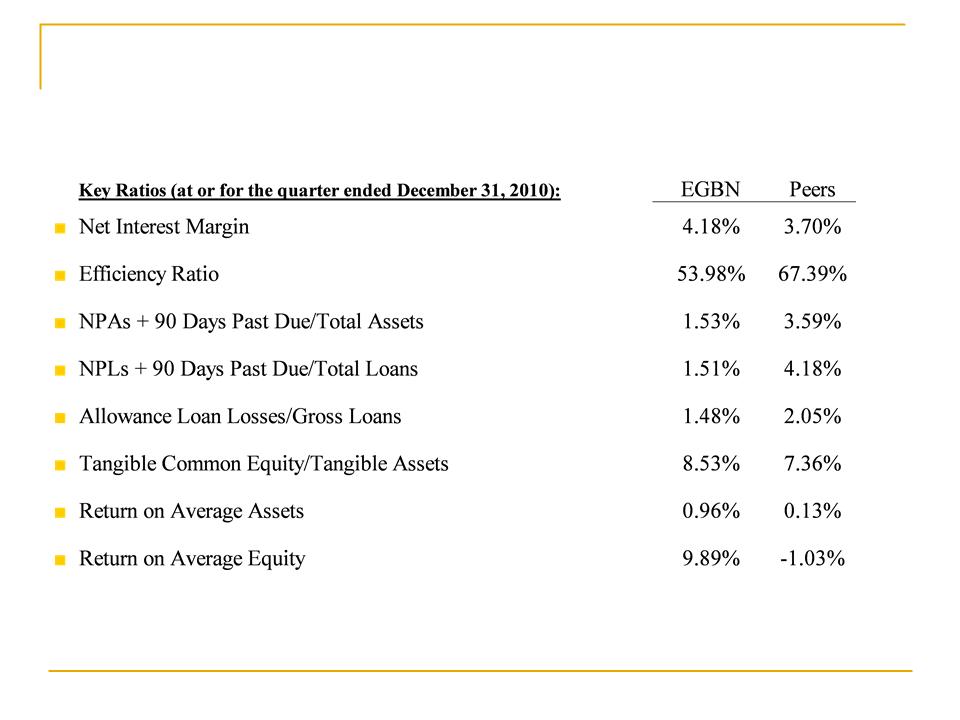
Financial Indicators - Regional Peer Analysis
Note: Regional peers includes publicly-traded commercial banks with Assets between $1 and $5 billion and headquartered in Washington, DC, Virginia, West Virginia, Maryland, Pennsylvania
and Delaware who reported at all reporting periods shown above.
and Delaware who reported at all reporting periods shown above.
Source: SNL Financial
7
Financial Indicators - Local Peer Analysis
Note: Bank level data for local peers in the Washington D.C. metro area: Access National Bank, Alliance Bank Corp., Cardinal Bank, Community Bank of Tri-County, Frederick County Bank,
Sandy Spring Bank and Virginia Commerce Bank.
Sandy Spring Bank and Virginia Commerce Bank.
Source: SNL Financial
8
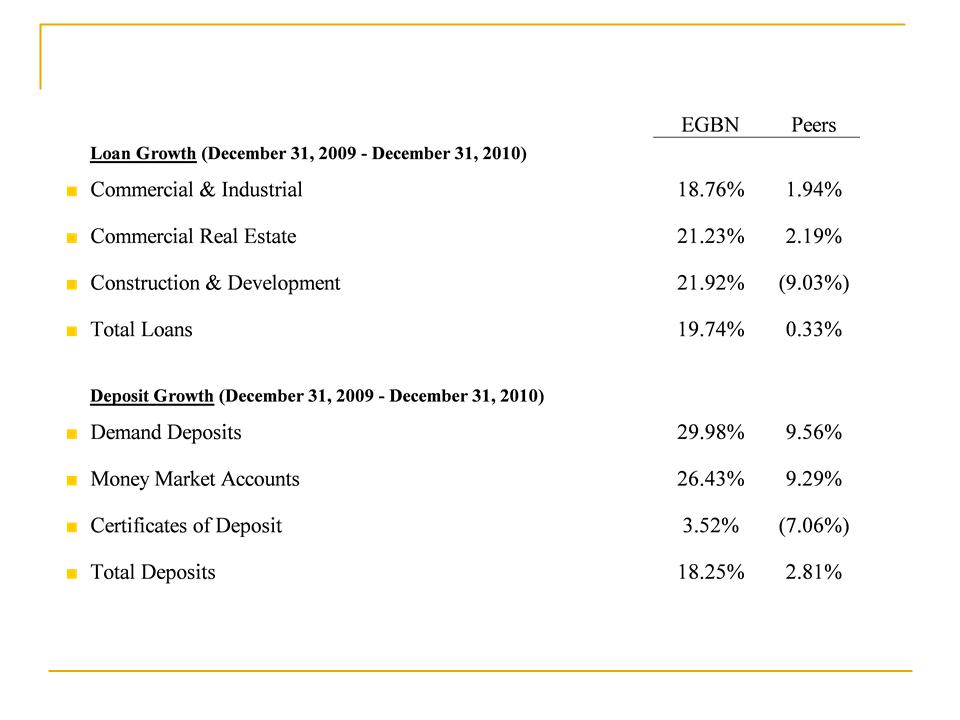
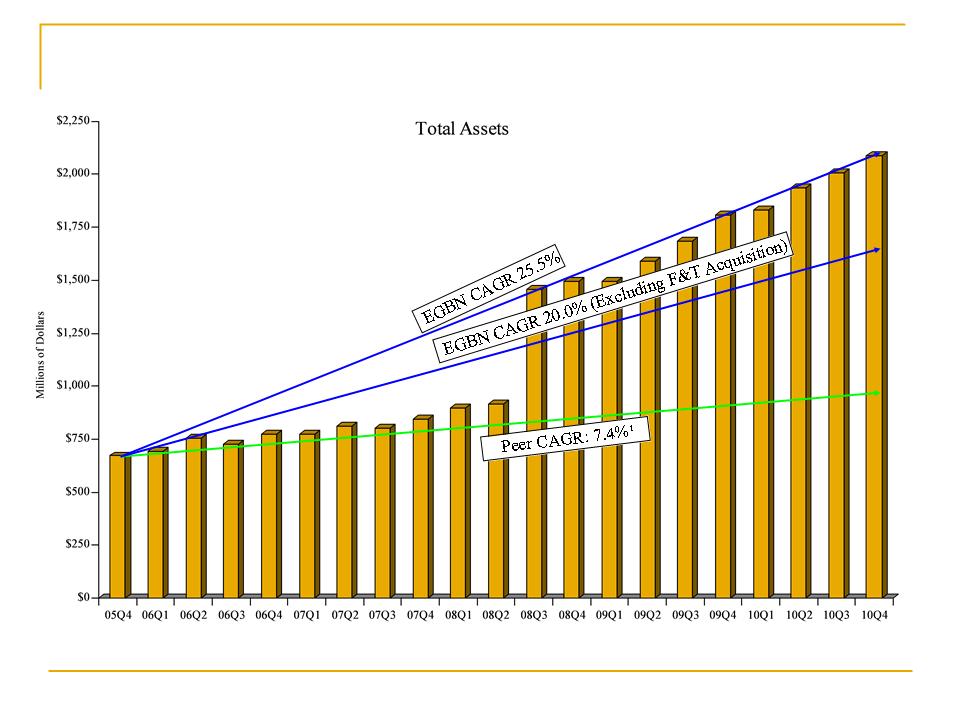
Consistent Balance Sheet Growth
(1) Regional peers includes publicly-traded commercial banks with assets between $1 and $5 billion and headquartered in Washington, DC, Virginia, West Virginia, Maryland, Pennsylvania and
Delaware who reported total assets at all reporting periods shown above.
Source: SNL Financial
9
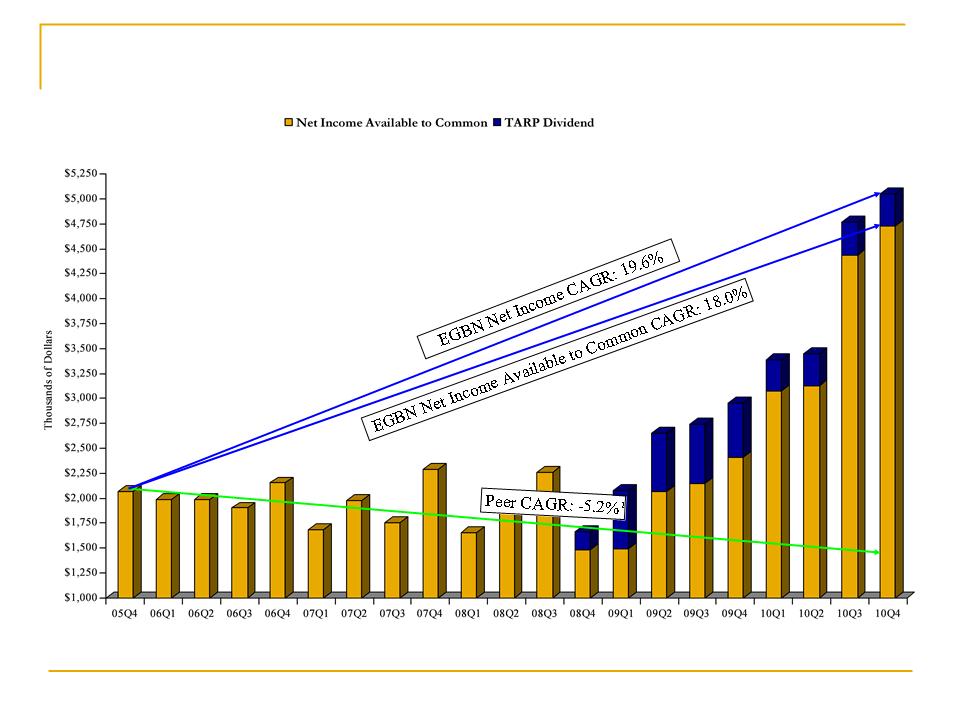
Consistent Net Income Growth
(1) Regional peers includes publicly-traded commercial banks with assets between $1 and $5 billion and headquartered in Washington, DC, Virginia, West Virginia, Maryland, Pennsylvania and
Delaware who reported net income or loss for all reporting periods shown above.
Source: SNL Financial
$5,054
10
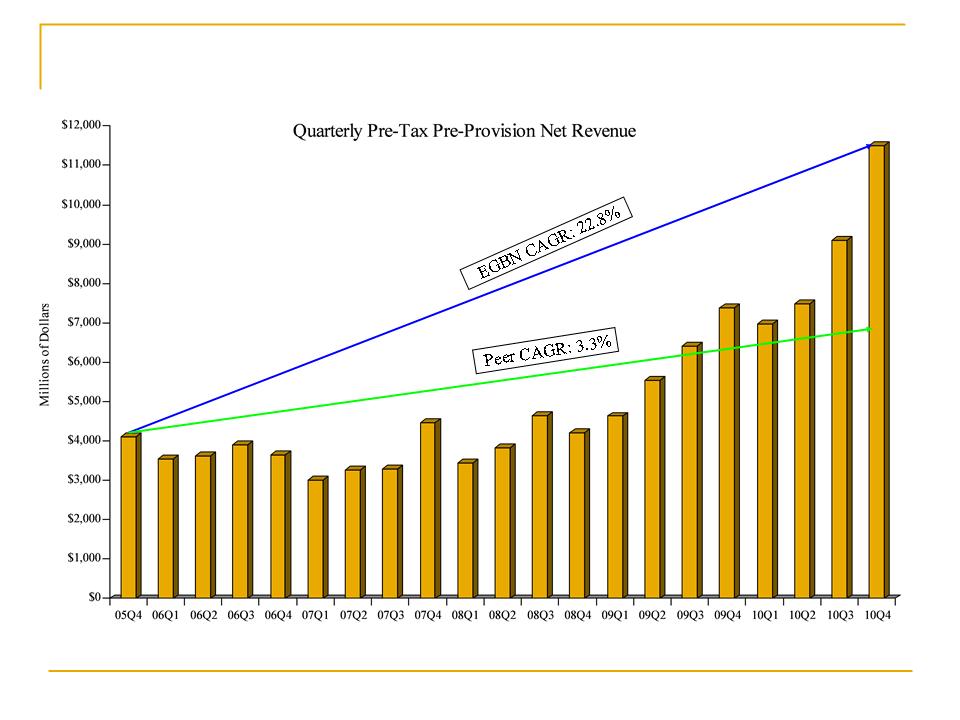
Pre-Tax, Pre-Provision Income
(1) Regional peers includes publicly-traded commercial banks with assets between $1 and $5 billion and headquartered in Washington, DC, Virginia, West Virginia, Maryland, Pennsylvania and Delaware
who reported pre-tax pre-provision net revenues for all reporting periods shown above.
Source: SNL Financial
$11,489
11
Washington, D.C. Metro Area: MD- Montgomery and Prince George's; DC - Washington DC; VA - Arlington, Alexandria, Fairfax, Fairfax (City), Falls Church, Loudon, Prince William, Manassas, Manassas Park
Note: Shaded companies in grey denote those companies headquartered outside of Washington, D.C. Metro Area. Data excludes: E*Trade and UNIFI Mutual Holding Company whose deposits are substantially from
outside of the defined market area.
outside of the defined market area.
Source: FDIC, as of June 30, 2010
80%
12
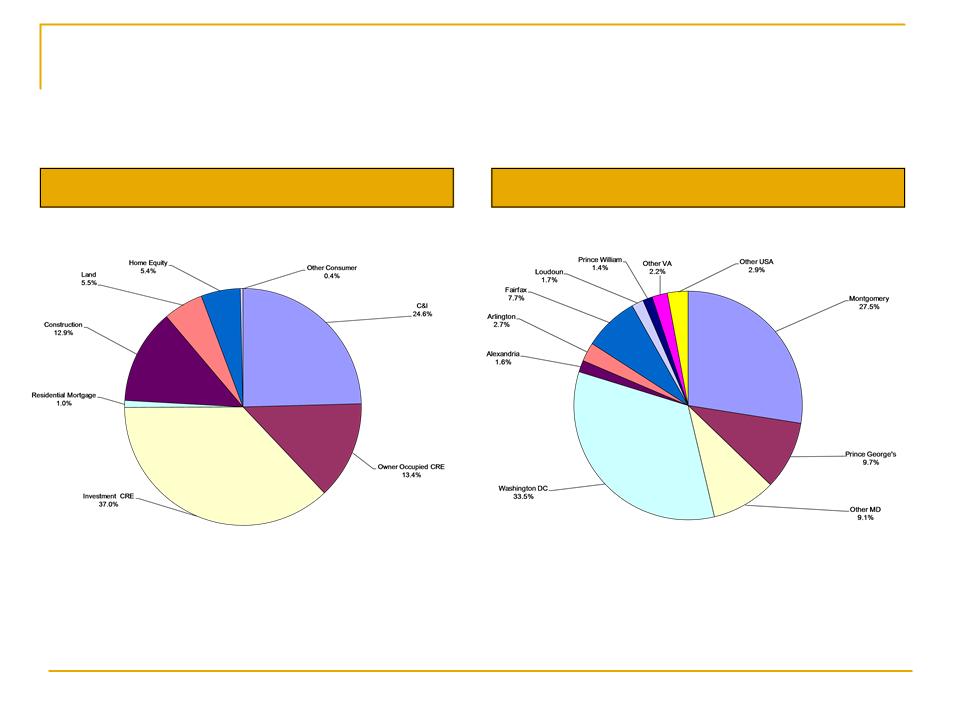
Loan Portfolio Composition
Loan Portfolio by Type
Loan Portfolio by Location
Note: At December 31, 2010
Total Gross Loans: $1.7 Billion
13
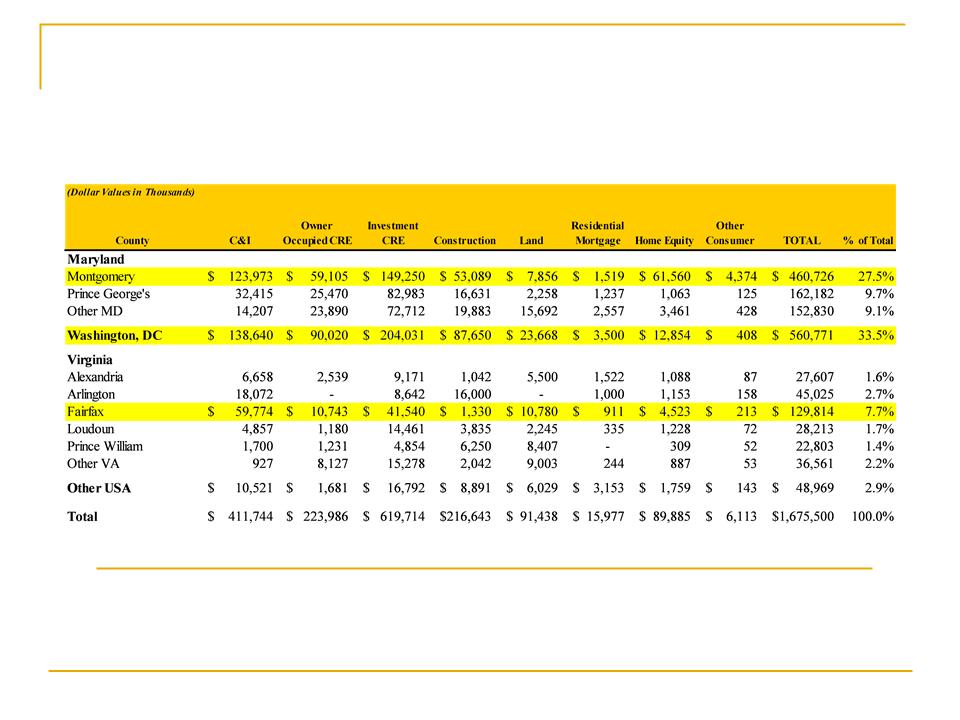
Geographic Detail of Loan Portfolio
Note: At December 31, 2010
Concentration in quality markets: Washington, DC, Montgomery County, Fairfax County
14
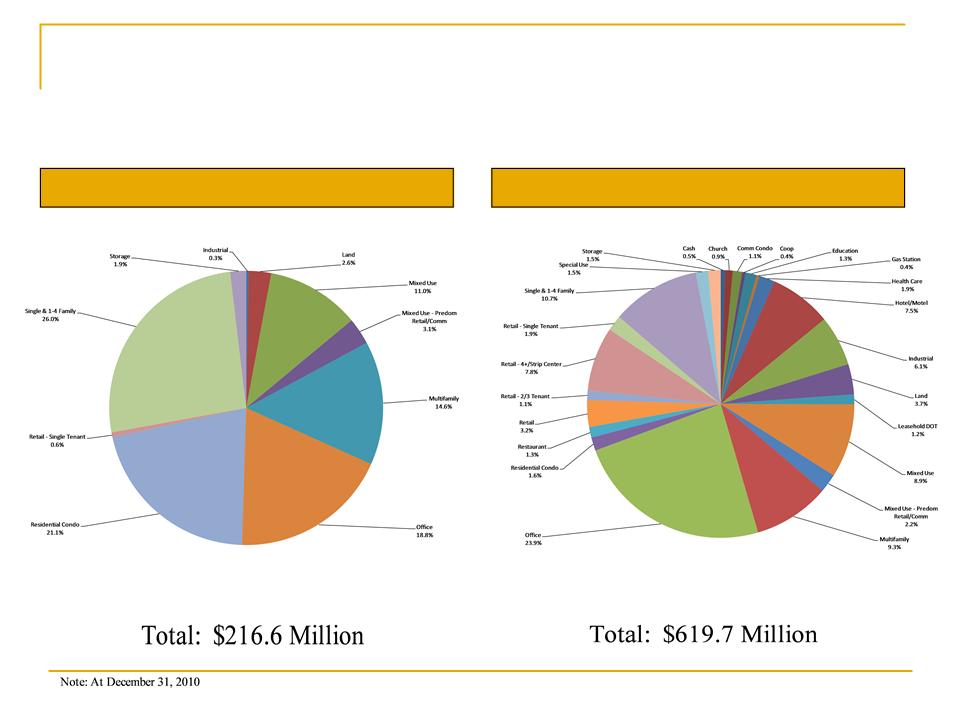
Diversified Commercial Real Estate Portfolio
Construction Loans by Type
Investment CRE by Type
15
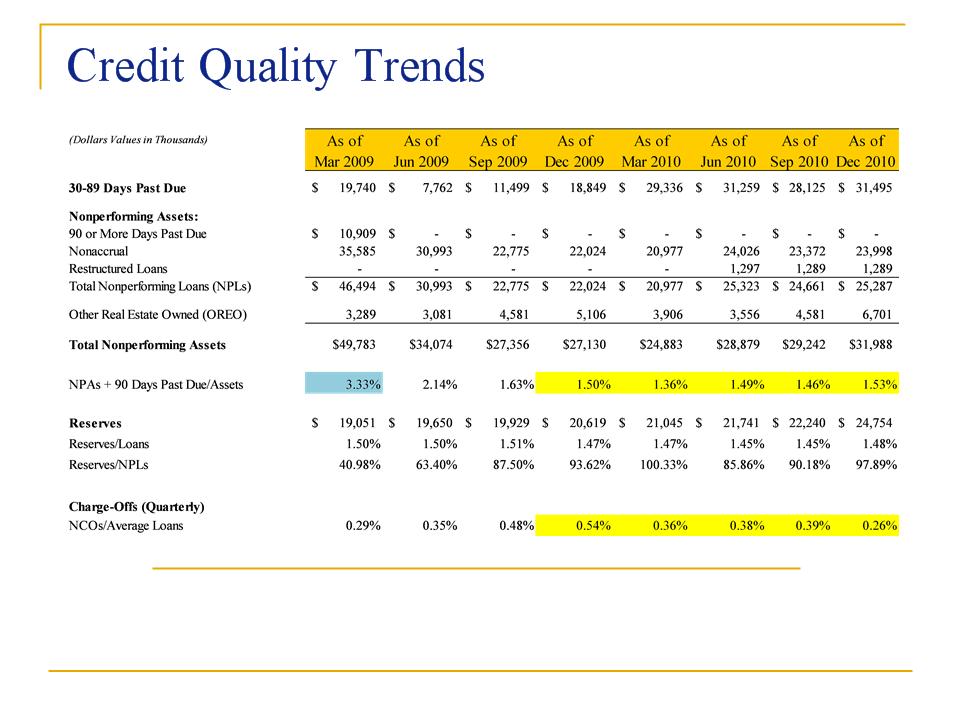
Asset Quality remains at a very strong level An adequate Allowance is being maintained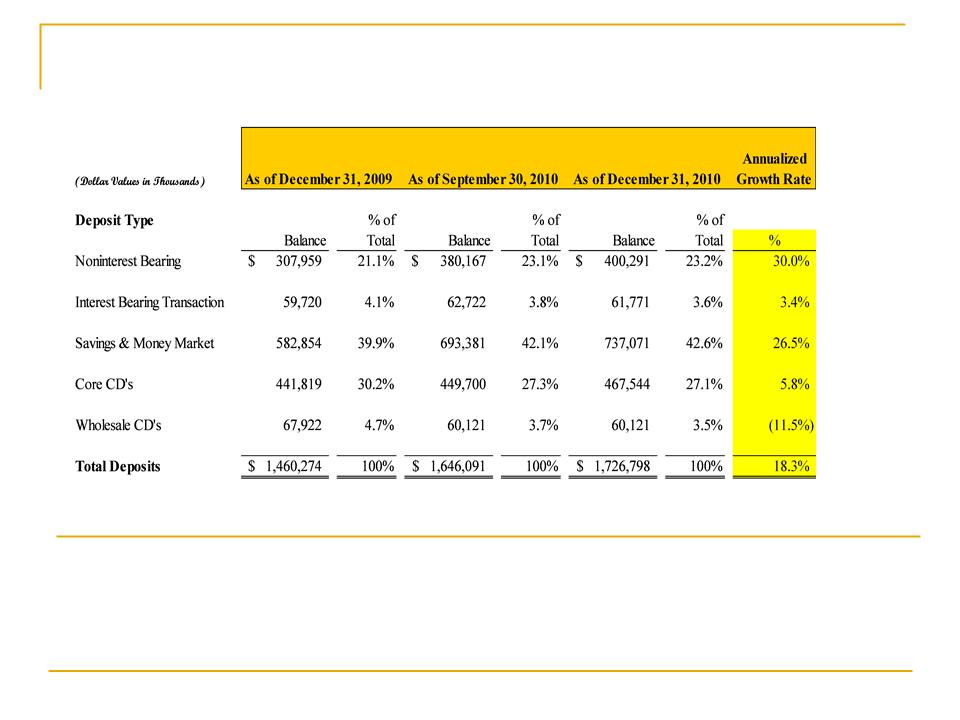
16
Commercial focus drives growth of Noninterest Bearing Demand accounts Taking business from regional/super-regional banks, but demanding relationship pricing Still have tremendous opportunity based on current market share in DC Metro AreaDeposit Composition Trends
17
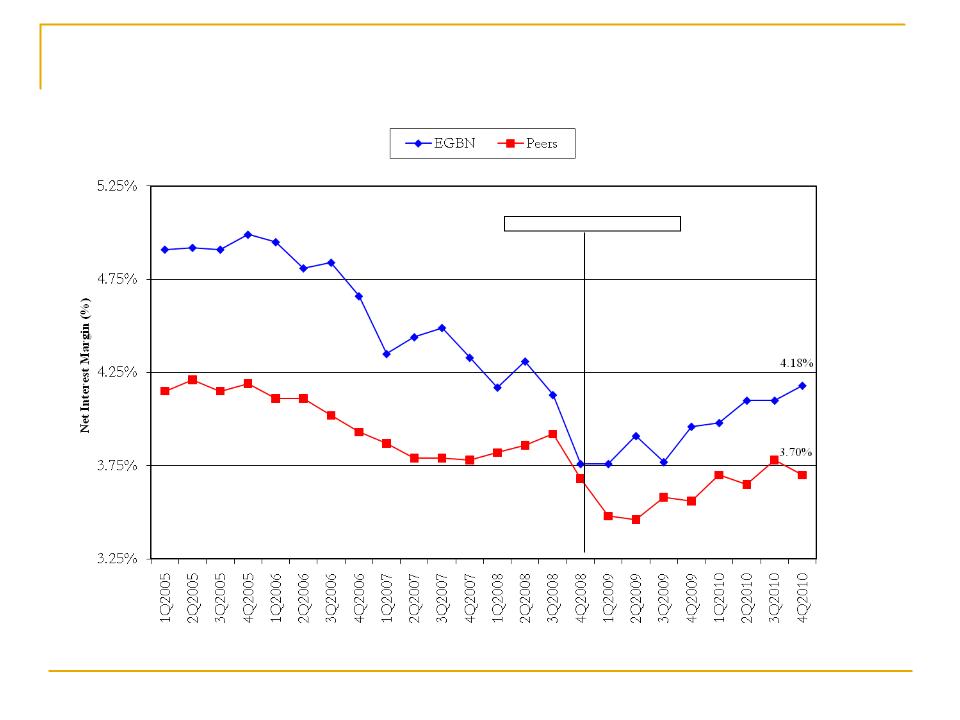
Superior Relationships/Net Interest Margin
Note: Regional peers includes publicly-traded commercial banks with Assets between $1 and $5 billion and headquartered in Washington, DC, Virginia,
West Virginia, Maryland, Pennsylvania and Delaware who reported net interest margin for all periods shown above.
Source: SNL Financial
F&T closed August 31, 2008
18
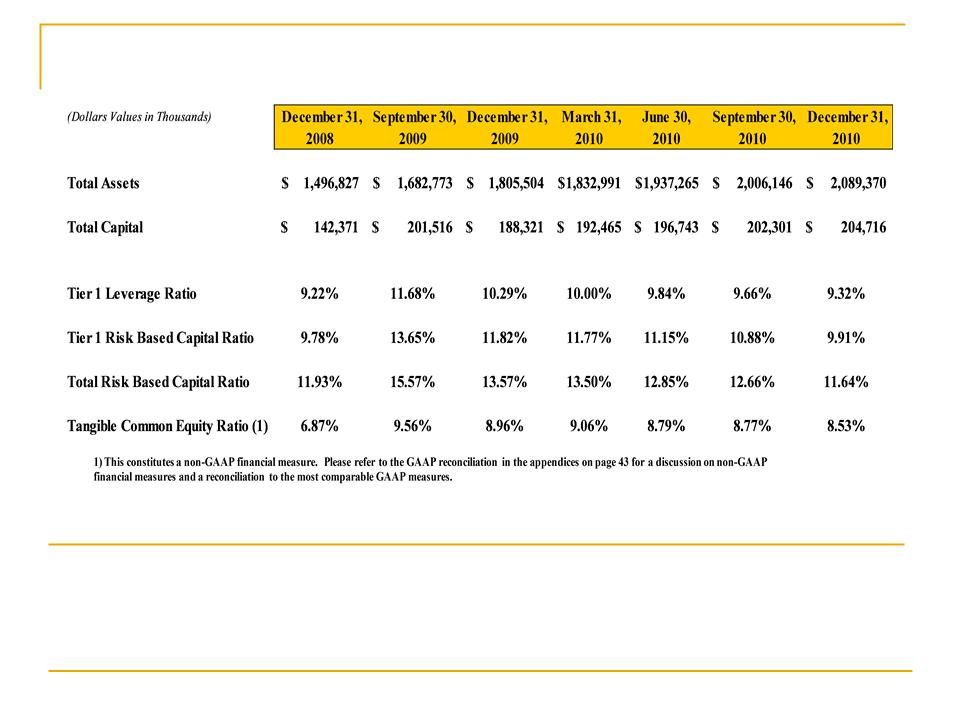
Capital Strength
$12.1 million of Sub-debt raised in August, 2008, $2.9 million repaid in September, 2009 $38.2 million of TARP Preferred Stock placed in December, 2008, $15 million redeemed in December, 2009
$55.2 million raised through common stock offering in September, 2009
19
Market Information -Washington, DC
Metropolitan Statistical Area
Metropolitan Statistical Area
Population 6.2 Million 5th largest market in the U.S. Employment 2.9 Million Average annual job creation is 39,500 Highest in net new job growth in the U.S. over last decade Washington DC Metro area has highest concentration of fastest
 growing private companies in U.S. (according to Inc. Magazine)
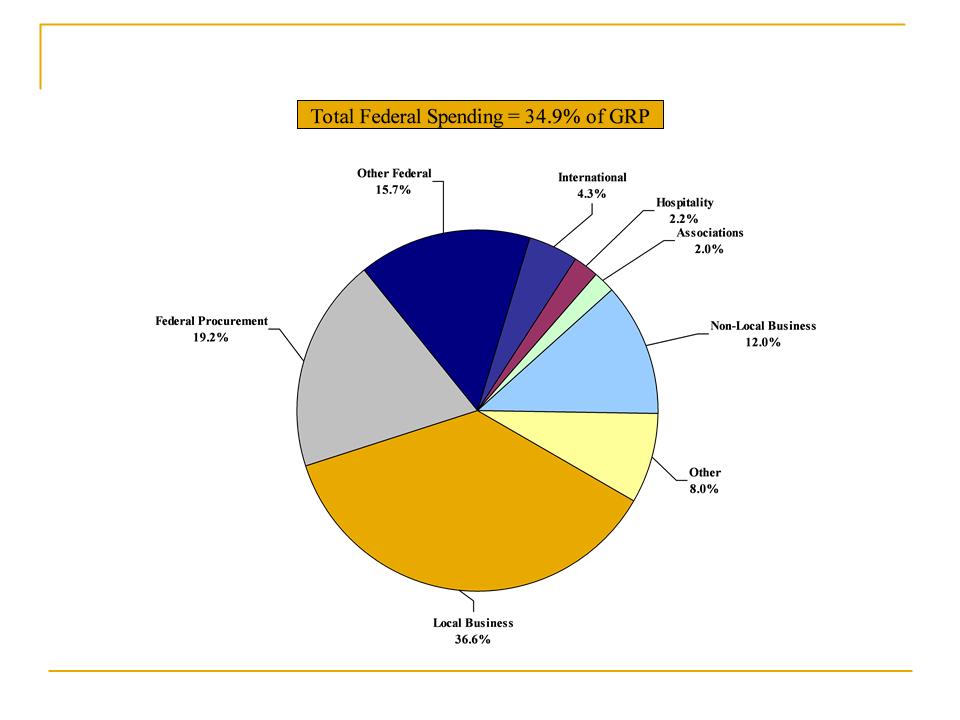
Gross Regional Product (GRP) $443 Billion 5th largest regional economy in the U.S. 5.3% CAGR in GRP over last 20 years Federal Government Spending is 34.9% of GRPSource: Greater Washington Initiative 2010 Regional Report
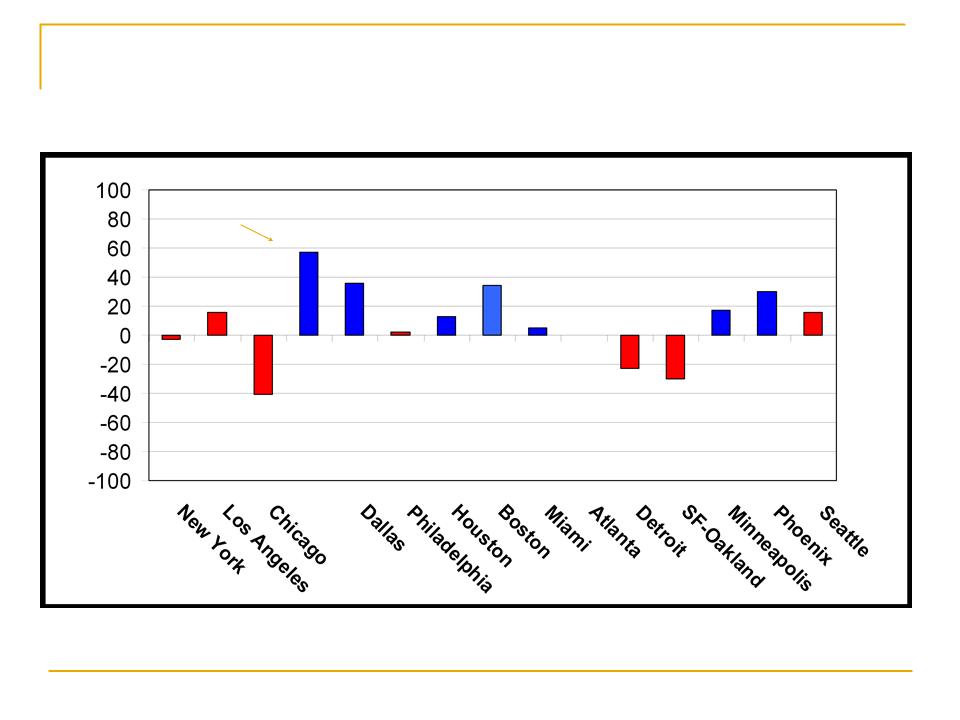
Largest US Markets, Job Change Dec‘09 - Dec‘10
(000s)
Source: BLS Benchmark, GMU Center for Regional Analysis
20
Washington, DC
57,500
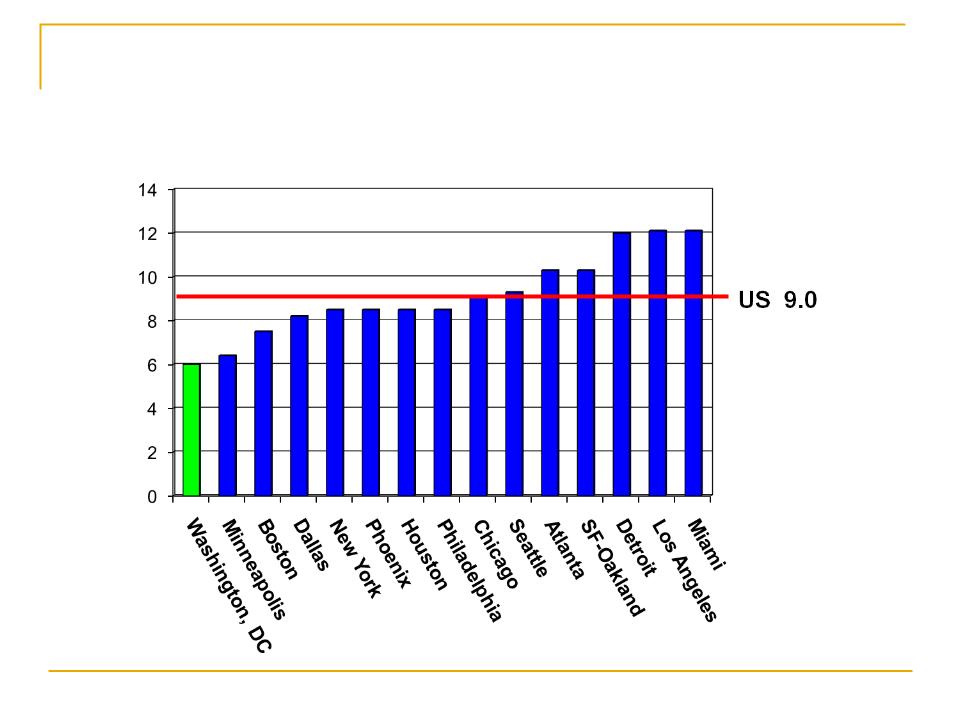
Unemployment Rate- Largest US Markets
January 2011
21
6.0
Source: BLS, NOT Seasonally Adjusted
22
Greater Washington Economy - 2010
Note: Other includes Health/Education, Media
Source: George Mason University, Center for Regional Analysis
Source: George Mason University, Center for Regional Analysis
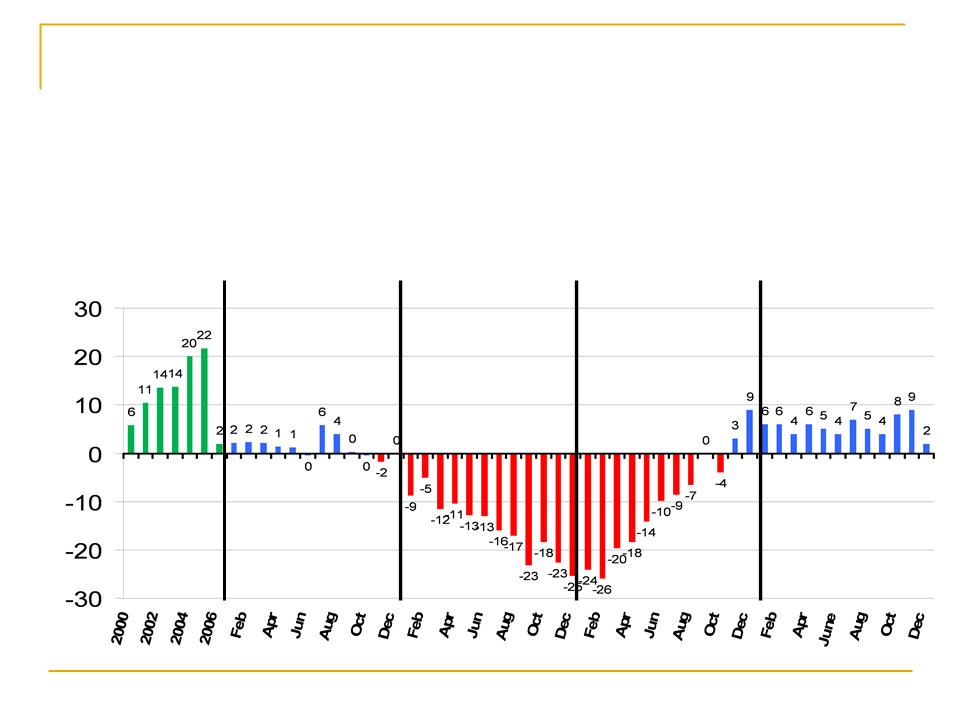
Average Sales Price Percent Change Washington MSA
All Housing Types
%
Source: MRIS, GMU Center for Regional Analysis
Annual Change Annual Change by Month
2007 2008 2009 2010
23
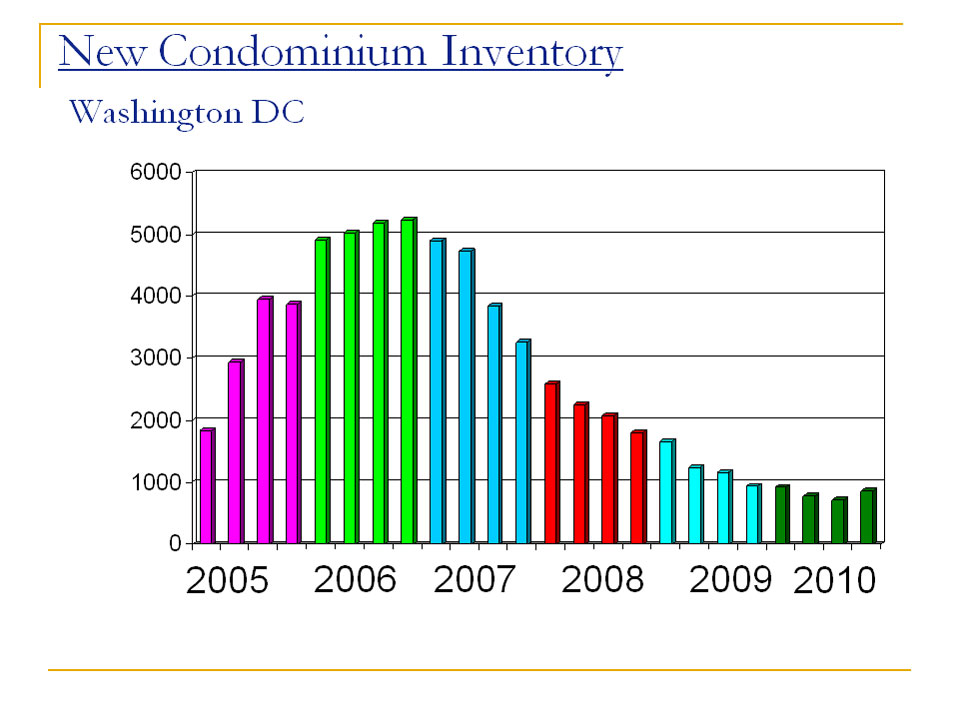
Current Inventory = 866 Units
Source: The Mayhood Co, December, 2010
24

25
Looking Ahead
Focus on organic growth o Take advantage of dislocation in market
o Hire seasoned lenders
o Increase Northern Virginia footprint
o Focus on relationships to increase deposit penetration
Profitability o Continued focus on Net Interest Margin
o Grow noninterest components of revenue
o Diligent expense control to drive Efficiency Ratio
o Lower effective tax rate
o Reduce dividend rate by replacing TARP funds with SBLF (Application submitted)
Explore potential acquisitions Continued emphasis on credit quality Improve capital position through participation in SBLF (Application submitted)
26
Why Invest in EGBN?
 Driven by Profitability Superior Net Interest Margin Emphasis on Core Deposits and Deep Relationship Banking Strong Organic Growth Geographic Market Positioning Experienced and Dedicated Board and Management Team - 17% Insider Ownership Exceptional Asset Quality Record Conservative Securities Portfolio Proven Ability to Execute Acquisitions
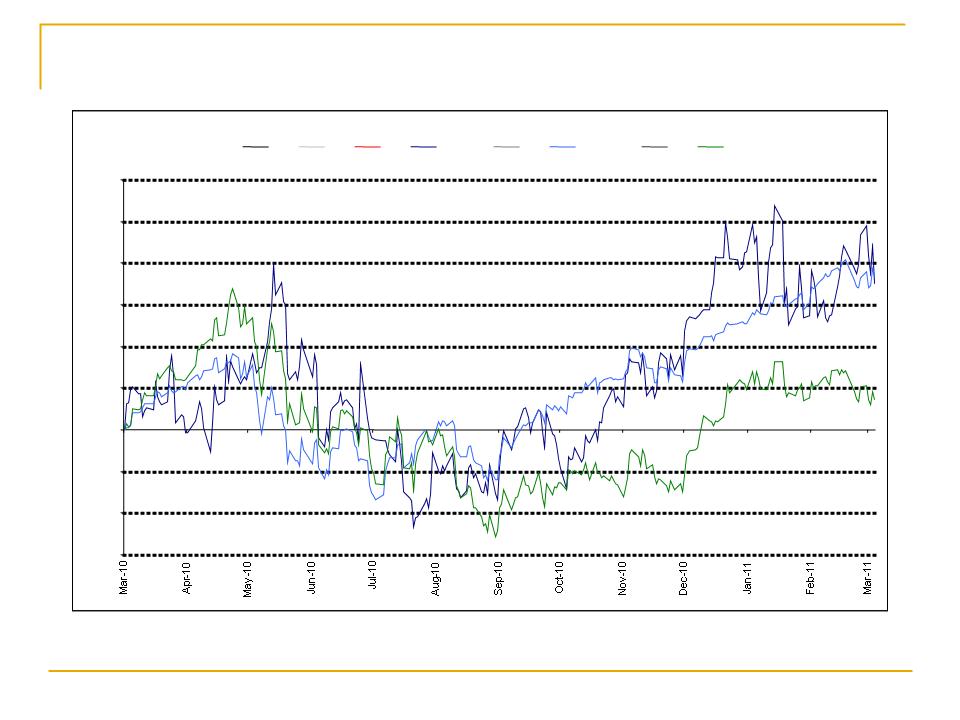
EGBN Stock Price Performance
Source: SNL Financial
27
Price Change (%)
-15.00
-10.00
-5.00
0.00
5.00
10.00
15.00
20.00
25.00
30.00
EGBN
S&P 500
NASDAQ Bank

28
Appendices
29
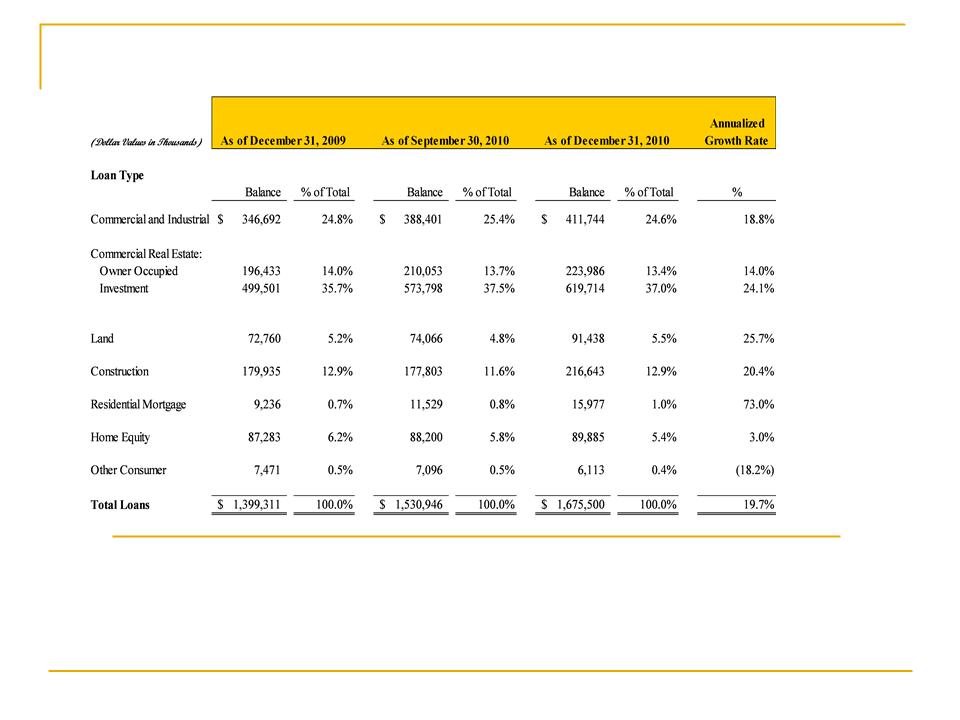
Loan Portfolio Trends
Continued effort to grow C&I and Owner Occupied loans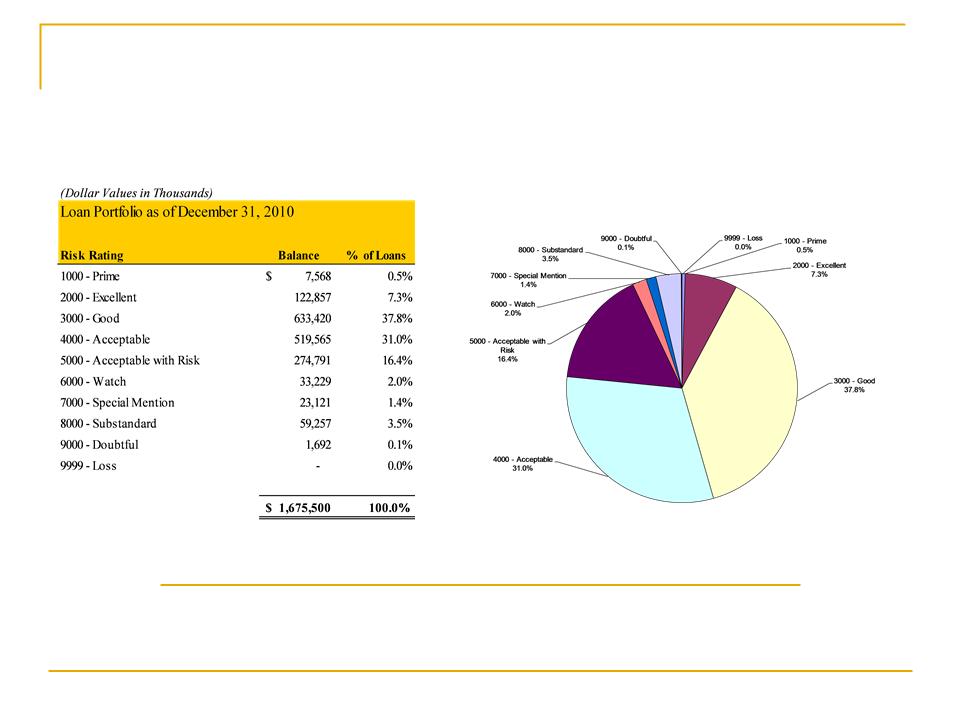
30
Loan Portfolio by Risk Rating
Loan portfolio and risk ratings reviewed by independent, third-party credit review quarterly
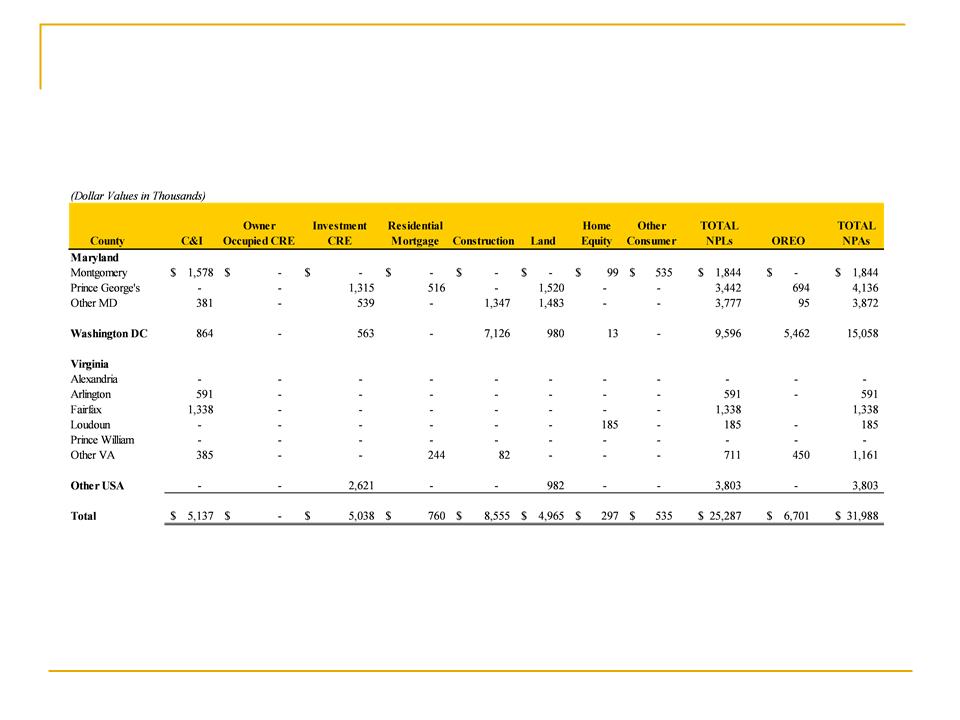
Geographic Detail of NPA’s
31
Note: At December 31, 2010
32
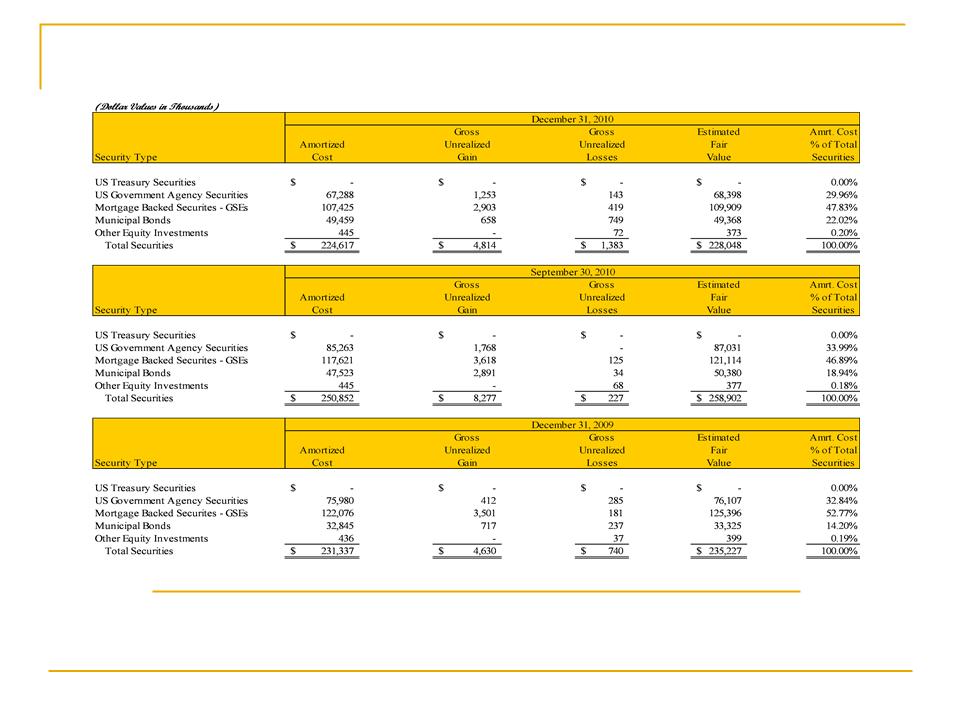
Portfolio has $3.4 million of net unrealized gains at December 31, 2010 No holdings of GSE equities or bank Trust Preferred or bank Trust Preferred CDOs Average life of portfolio is 3.9 years Excludes Federal Reserve and Federal Home Loan Bank stockConservative Securities Portfolio

33
Proven Acquisition Capabilities
Evaluated many acquisition opportunities in 12 year history and only pursued one transaction - F&T
Acquisition of F&T completed on August 31, 2008 System conversion successfully completed one week after close Targeted expense savings achieved in methodical and thoughtful manner, without disrupting relationships with customers
Contributions from key F&T employees have been meaningful to relationship growth
Adopted best practices of both companies
34
Fidelity & Trust Acquisition
Strategic Matters: Strong cultural match Both institutions were growth oriented Both institutions were “high touch” Both institutions were “well connected” to community Financial Matters: Stock-for-stock transaction - 1,638,031 shares issued Acquisition cost - $13.1 million Price to book value 83% Business Matters: Additional six banking offices in Maryland, Washington, DC and Tysons Corner 79 additional employees Total assets acquired: $471 million Total loans acquired: $361 million Total securities acquired: $ 99 million Total deposits acquired: $385 millionNote: F&T balance sheet data at August 31, 2008.
35
36
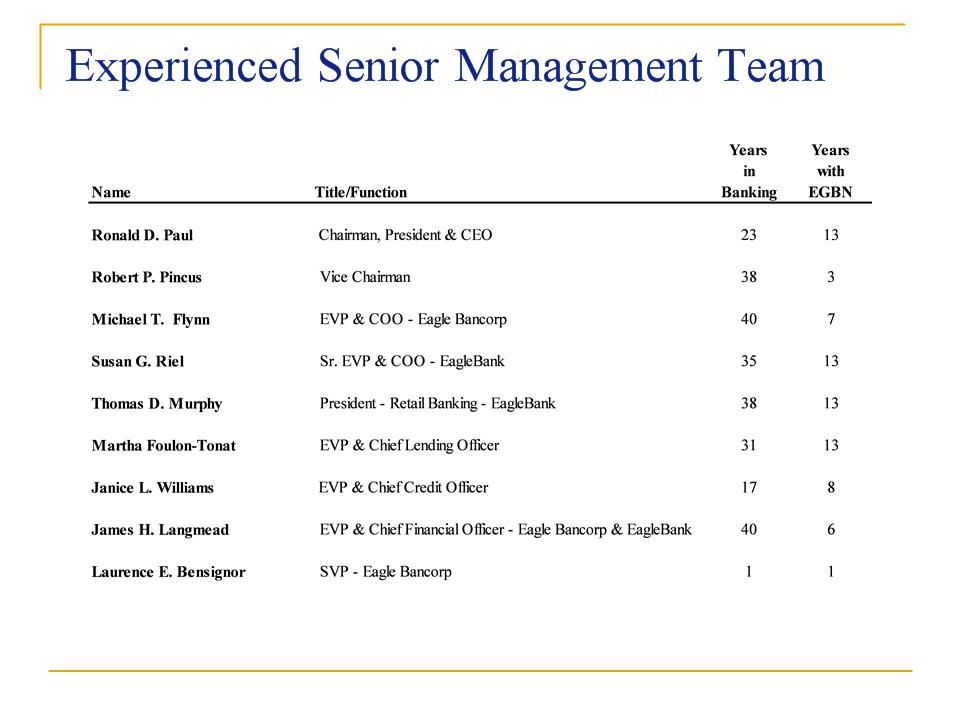
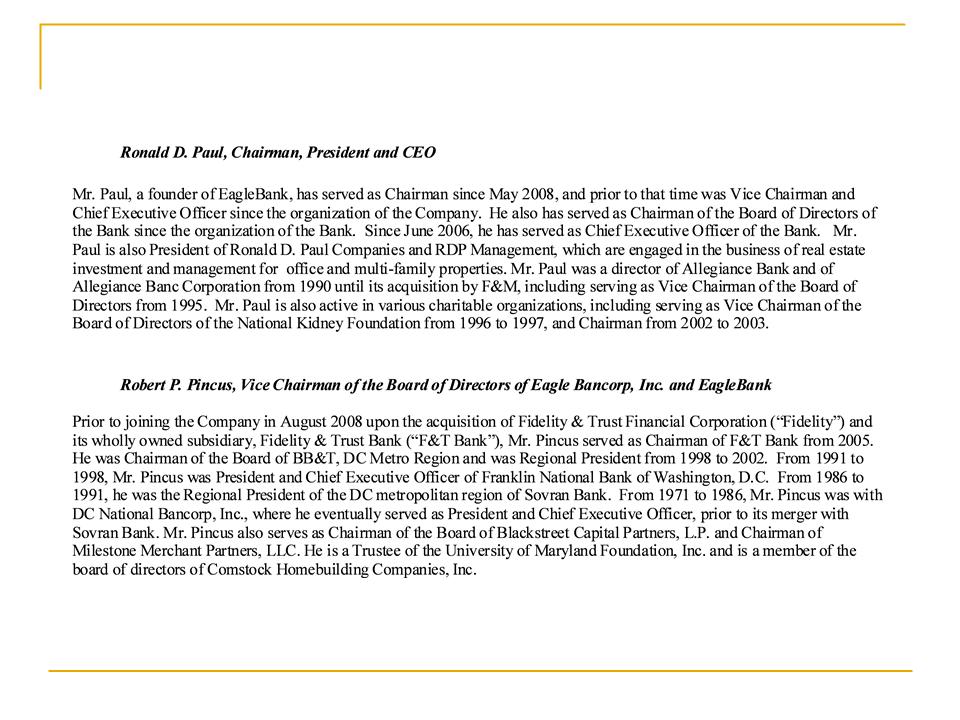
Experienced Management Team
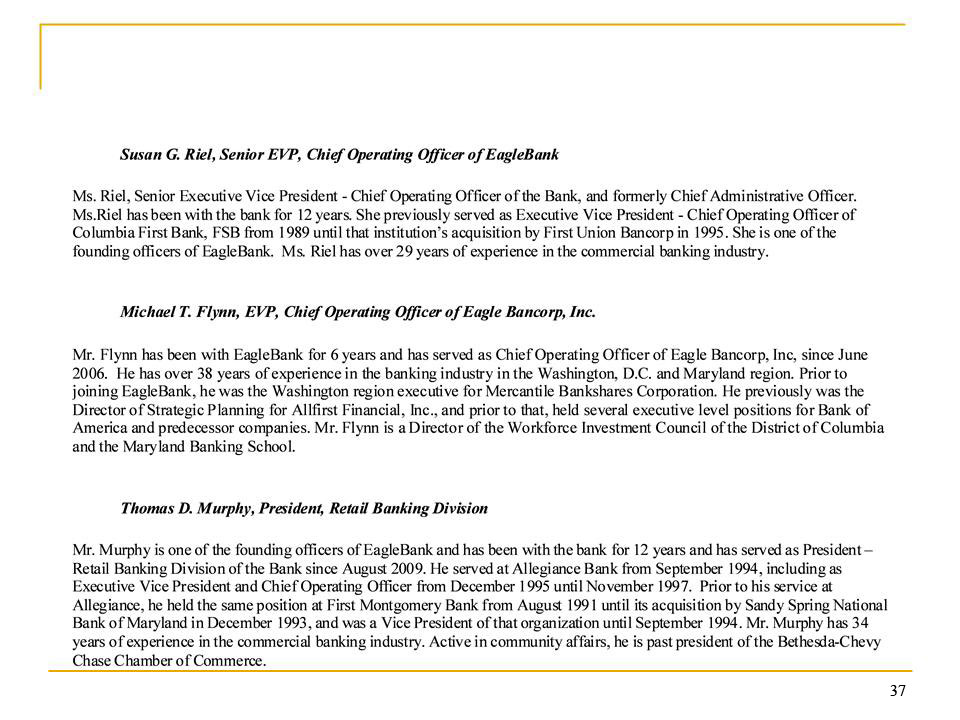
Experienced Management Team
38
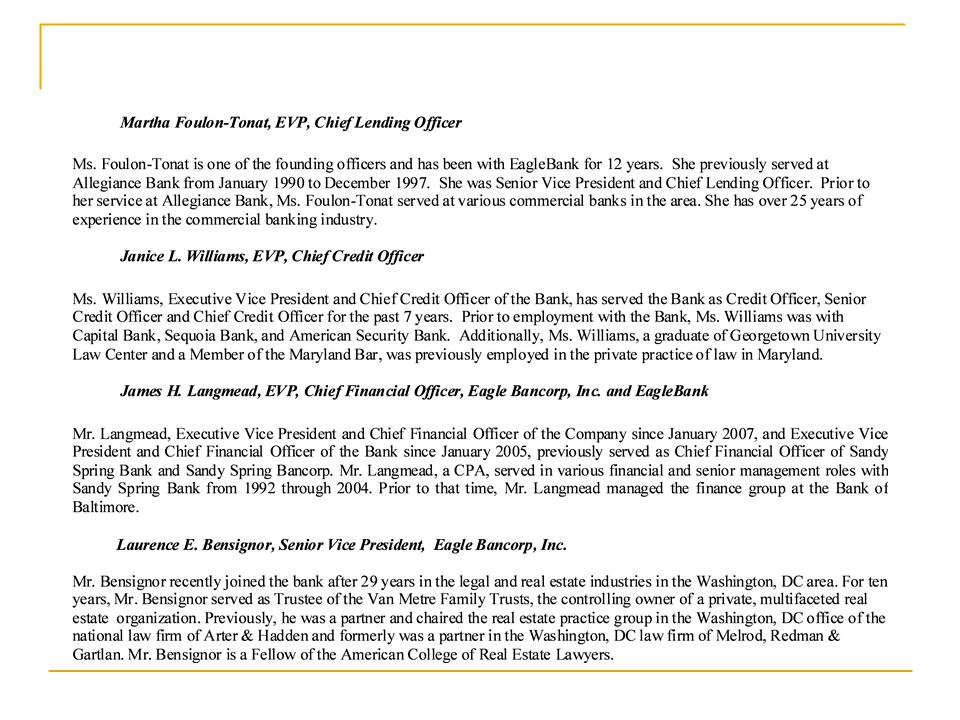
Experienced Management Team
39
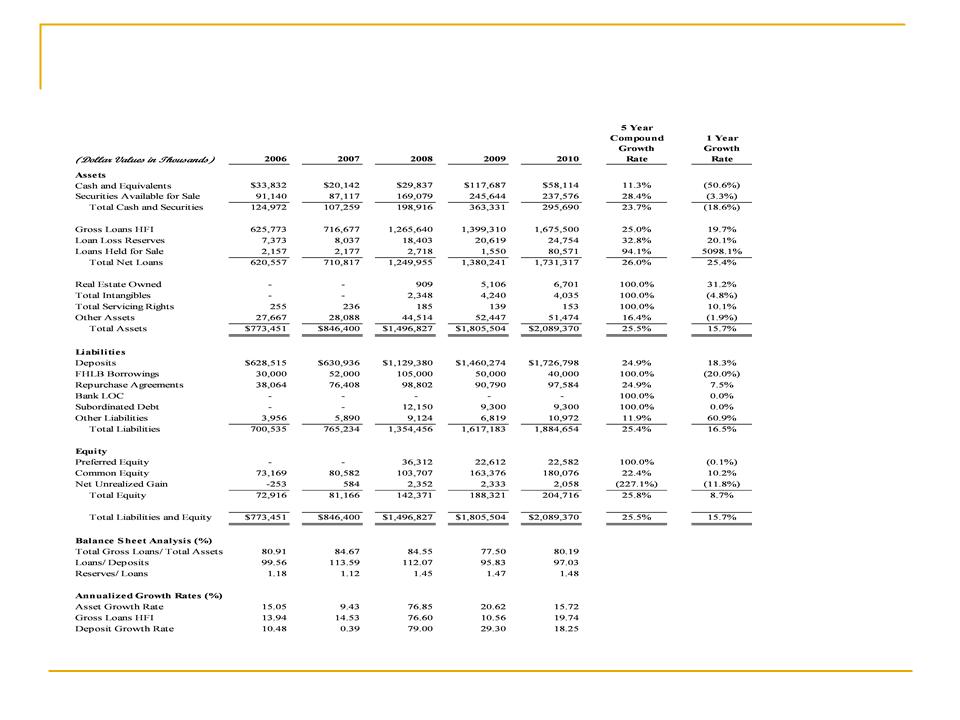
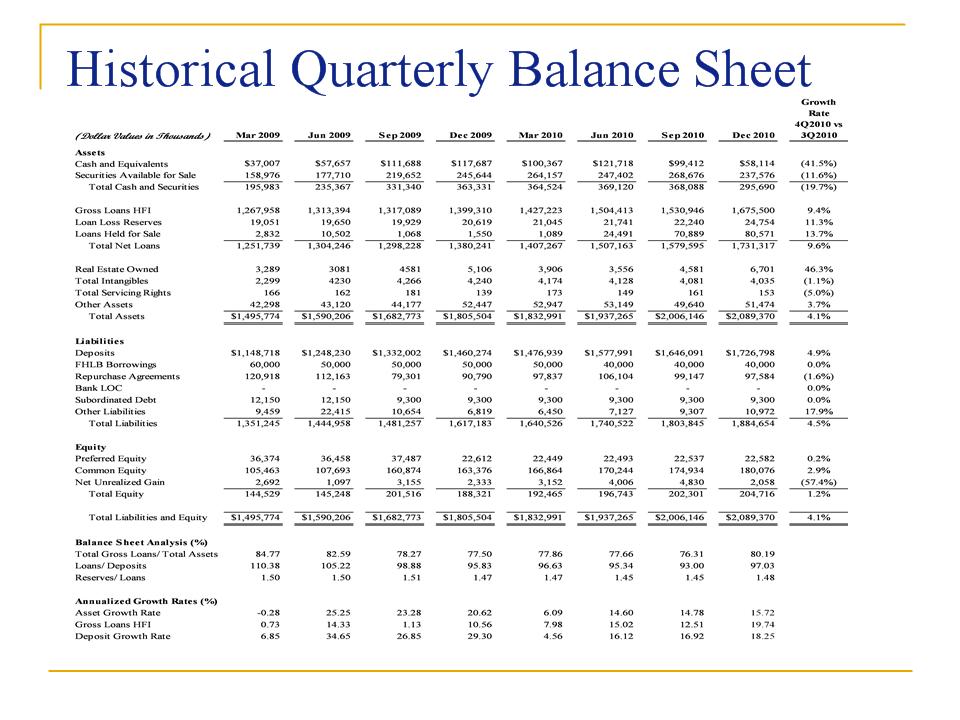
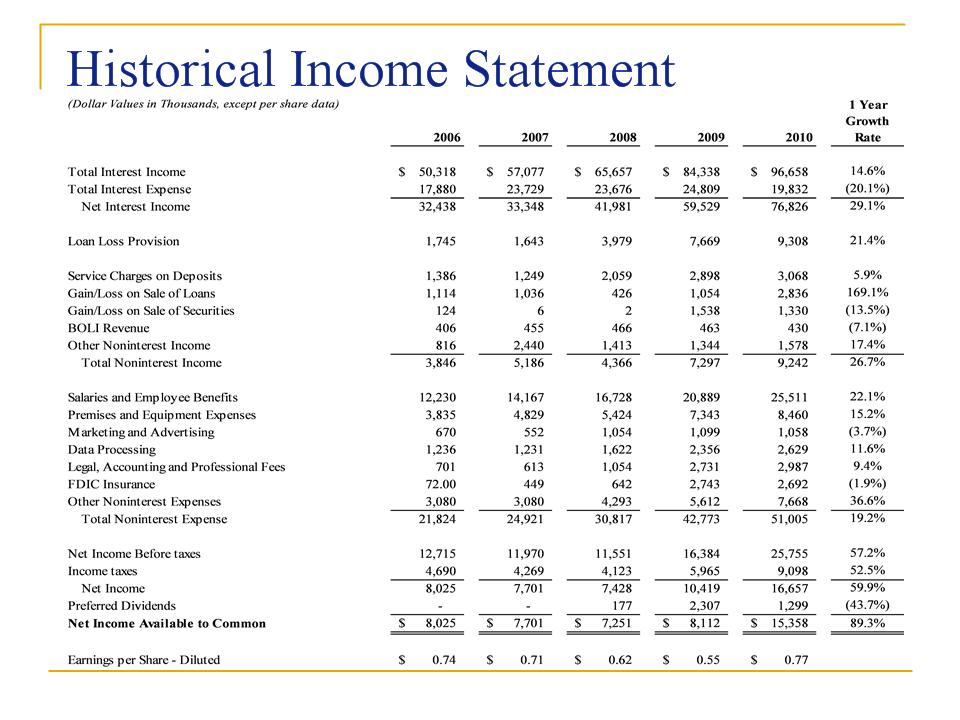
Historical Balance Sheet
40
41
42
43