Attached files
| file | filename |
|---|---|
| EX-99.1 - EXHIBIT 99.1 - DYNEGY INC. | ex99_1.htm |
| 8-K - DYNEGY INC 8-K 3-8-2011 - DYNEGY INC. | form8k.htm |
Exhibit 99.2

2010 Annual and 4th Quarter Results
March 8, 2011
Investor Relations | Norelle Lundy, Vice President | Laura Hrehor, Senior Director | 713-507-6466 | ir@dynegy.com

Forward-Looking Statements/Additional Information/
Participants in Solicitation
Participants in Solicitation
2
Cautionary Statement Regarding Forward-Looking Statements
This presentation contains statements reflecting assumptions, expectations, projections, intentions or beliefs about future events that are intended as “forward looking
statements.” Discussion of risks and uncertainties that could cause actual results to differ materially from current projections, forecasts, estimates and expectations of
Dynegy is contained in Dynegy's filings with the Securities and Exchange Commission (the “SEC”). Specifically, Dynegy makes reference to, and incorporates herein by
reference, the section entitled “Risk Factors” in its most recent Form 10-K and subsequent reports on Form 10-Q, the section entitled “Cautionary Statement Regarding
Forward-Looking Statements” and the section entitled “Forward-Looking Statements” in its preliminary consent revocation statement filed with the SEC on November
26, 2010. In addition to the risks and uncertainties set forth in Dynegy's SEC filings, the forward-looking statements described in this presentation could be affected by,
among other things, (i) the timing and anticipated benefits to be achieved through Dynegy's company-wide cost savings program; (ii) beliefs and assumptions relating to
liquidity, available borrowing capacity and capital resources generally; (iii) expectations regarding environmental matters, including costs of compliance, availability and
adequacy of emission credits, and the impact of ongoing proceedings and potential regulations or changes to current regulations, including those relating to climate
change, air emissions, cooling water intake structures, coal combustion byproducts, and other laws and regulations to which Dynegy is, or could become, subject; (iv)
beliefs about generation volumes and commodity pricing, including natural gas prices and the impact of such prices from shale gas proliferation; (v) anticipated liquidity
in the regional power and fuel markets in which Dynegy transacts, including the extent to which such liquidity could be affected by poor economic and financial market
conditions or new regulations and any resulting impacts on financial institutions and other current and potential counterparties; (vi) sufficiency of, access to and costs
associated with coal, fuel oil and natural gas inventories and transportation thereof; (vii) beliefs and assumptions about market competition, generation capacity and
regional supply and demand characteristics of the wholesale power generation market, including the anticipation of higher market pricing over the longer term; (viii) the
possibility of further consideration in the power generation industry and the impact of any such activity on Dynegy; (ix) beliefs and assumptions regarding the ability to
enhance long-term value for stockholders; (x) the effectiveness of Dynegy's strategies to capture opportunities presented by changes in commodity prices and to manage
its exposure to energy price volatility; (xi) beliefs and assumptions about weather and general economic conditions; (x) beliefs regarding the U.S. economy, its trajectory
and its impacts, as well as Dynegy's stock price; (xii) projected operating or financial results, including anticipated cash flows from operations, revenues and profitability;
(xiii) expectations regarding Dynegy's revolver capacity, credit facility compliance, collateral demands, capital expenditures, interest expense and other payments; (xiv)
Dynegy's focus on safety and its ability to efficiently operate its assets so as to capture its revenue generating opportunities and operating margins; (xv) beliefs about the
outcome of legal, regulatory, administrative and legislative matters; (xvi) expectations and estimates regarding capital and maintenance expenditures, including the
Midwest Consent Decree and its associated costs and (xvii) uncertainties associated with the consent solicitation (the “Seneca Capital Solicitation”) engaged in by Seneca
Capital International Master Fund, L.P., Seneca Capital, L.P., Seneca Capital Investments, L.P., Seneca Capital Investments, LLC, Seneca Capital International GP, LLC,
Seneca Capital Advisors, LLC and Douglas A. Hirsch (“Seneca Capital”). Any or all of Dynegy's forward-looking statements may turn out to be wrong. They can be affected
by inaccurate assumptions or by known or unknown risks, uncertainties and other factors, many of which are beyond Dynegy's control.
Non-GAAP Financial Measures
This presentation contains non-GAAP financial measures including EBITDA, Adjusted EBITDA, Adjusted Cash Flow from Operations, Adjusted Free Cash Flow, Net Debt
and Net Debt and Other Obligations. Reconciliations of these measures to the most directly comparable GAAP measures to the extent available without unreasonable
effort are contained herein. To the extent required, statements disclosing the utility and purposes of these measures are set forth in Item 2.02 to our current report on
form 8-K filed with the SEC on March 8, 2011, which is available on our website free of charge, www.dynegy.com.

Financial Results
Capital & Liquidity (as of 12/31/10)
• Net debt and other obligations(1) of $4.1 billion
– Net cash-on-hand and investments of $397 million
and restricted cash and investments of $850
million(2)
and restricted cash and investments of $850
million(2)
• Collateral of $462 million posted(3)
• Liquidity of $1.8 billion
Significant Impacts:
Decreased contribution from financial transactions
due to lower value received on hedging activity
due to lower value received on hedging activity
+ Increased contribution from physical transactions due
to improved prices and spark spreads
to improved prices and spark spreads
Less energy and capacity/tolling revenue due to
assets sold in 4Q09
assets sold in 4Q09
+ Less operating expense primarily due to assets sold
in 4Q09 and cost reduction initiatives
in 4Q09 and cost reduction initiatives
+ Less premium expense due to fewer options
purchased
purchased
Financial Results
4
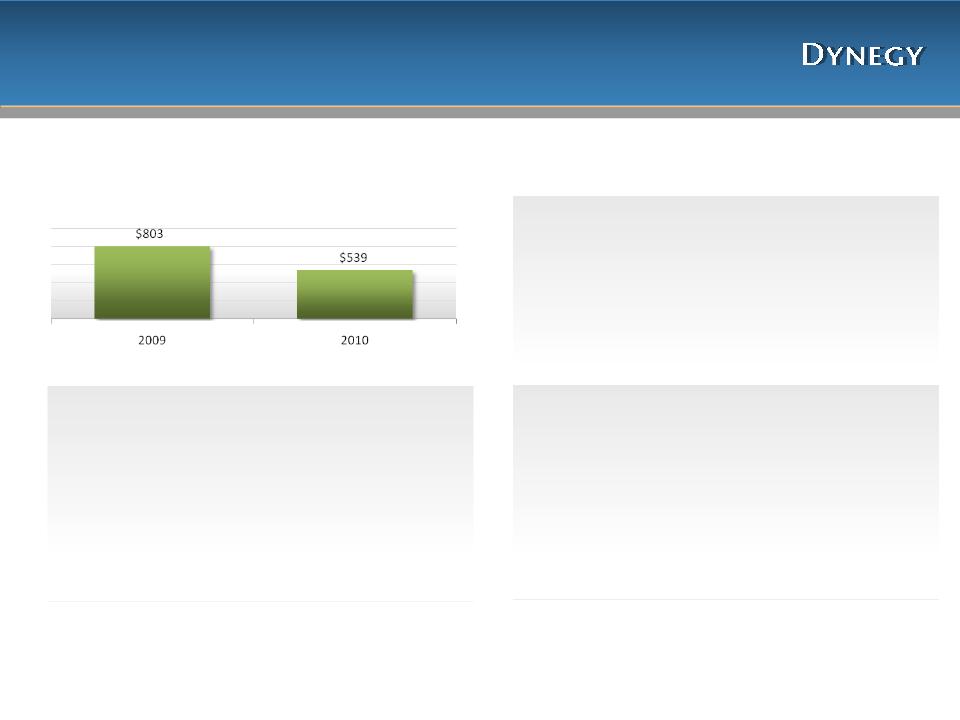
Adjusted EBITDA ($MM)
2010 Annual Adjusted EBITDA down 33% compared to 2009
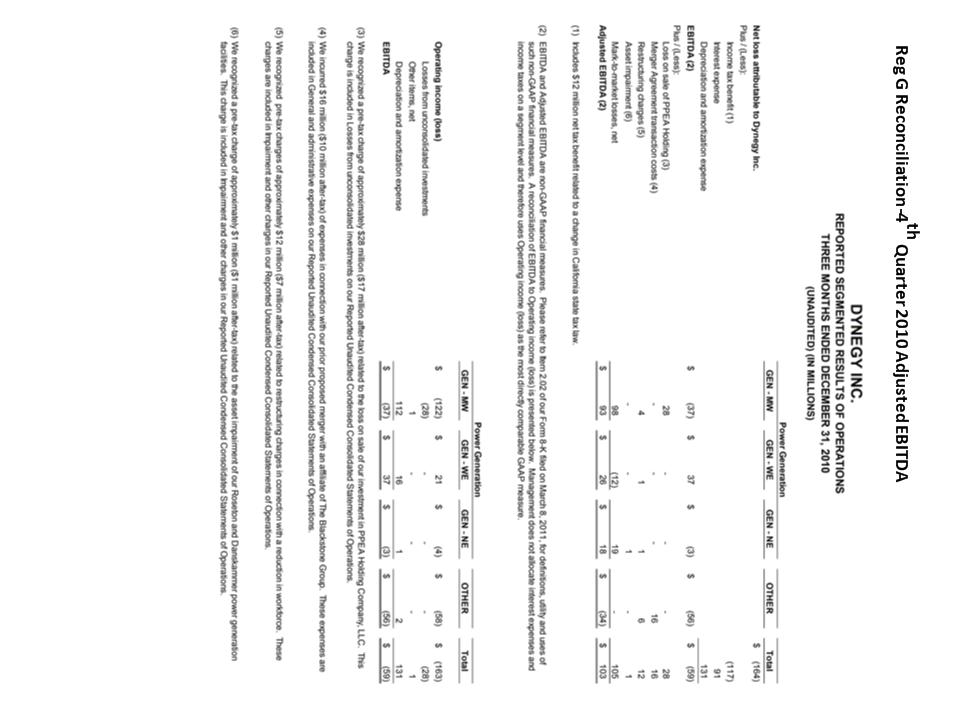
Net Income / Loss
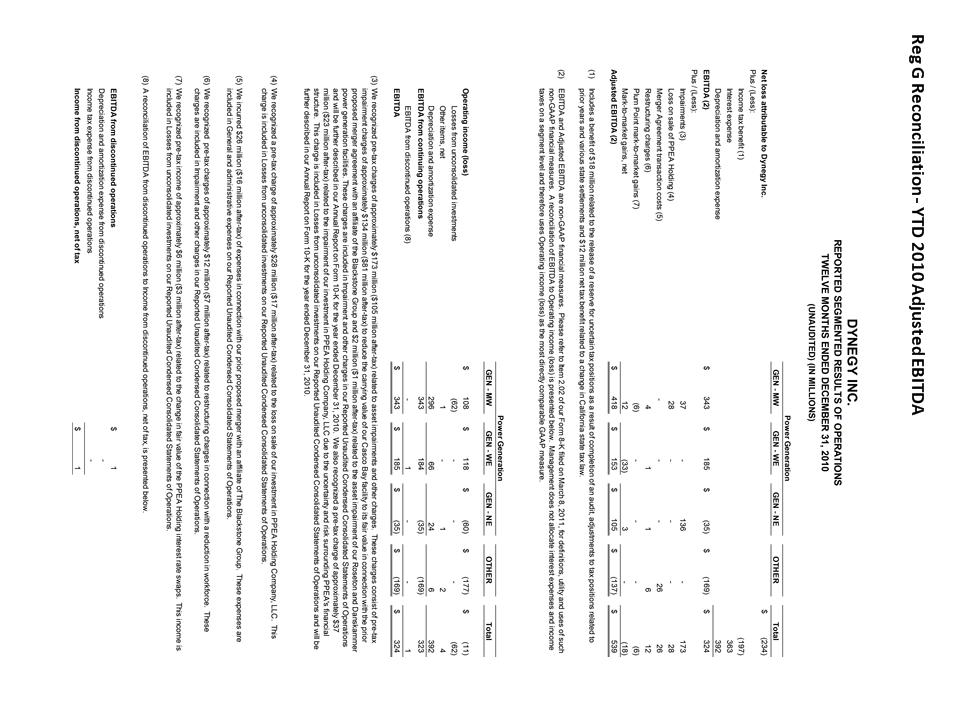
• Net loss attributable to Dynegy Inc. of $234
million for 2010 includes after-tax charges of:
million for 2010 includes after-tax charges of:
– $105 million related to asset impairments
– $17 million loss on asset sale
– $16 million transaction fees
– $7 million for restructuring charges
– With an offsetting $15 million of net MTM gains
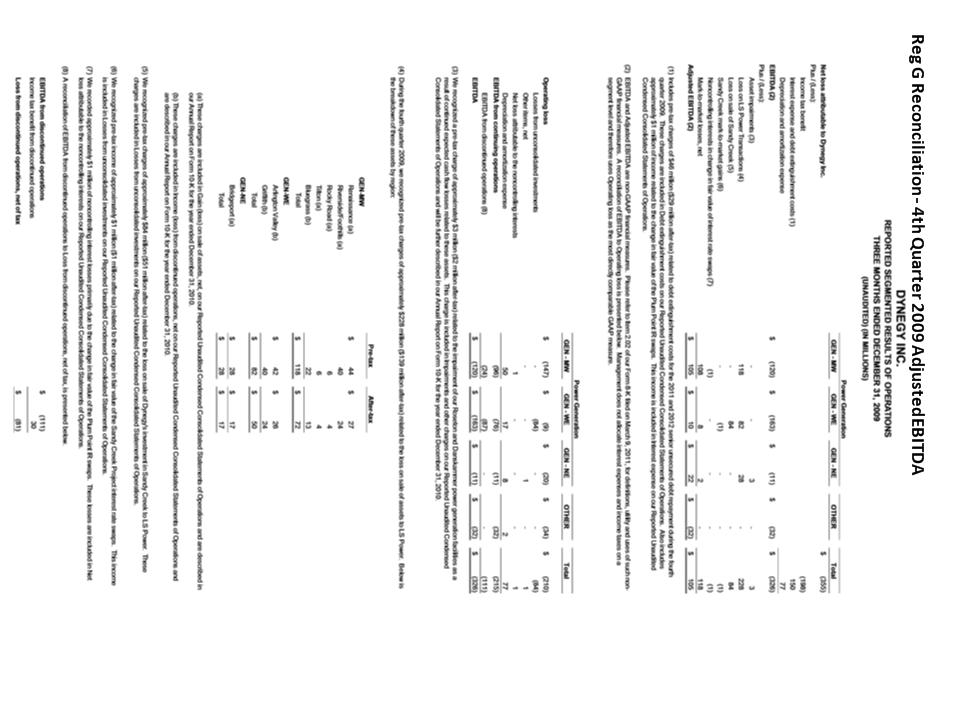
• This compares to net loss attributable to Dynegy
Inc. of $1,247 million for 2009, which primarily
consisted of after-tax charges of:
Inc. of $1,247 million for 2009, which primarily
consisted of after-tax charges of:
– $922 million related to impairments
– $184 million net loss on asset sales
– $111 million of net MTM losses
(1) Net debt and other obligations is a non-GAAP measure, please see the reconciliation on the Capital
Structure page in the Appendix; and for definition and uses, please see the Debt Definitions page in the
Appendix. (2) Restricted cash includes $850 million related to Term Letter of Credit facility (3) For additional
information see the Collateral page in the Appendix.
Structure page in the Appendix; and for definition and uses, please see the Debt Definitions page in the
Appendix. (2) Restricted cash includes $850 million related to Term Letter of Credit facility (3) For additional
information see the Collateral page in the Appendix.
|
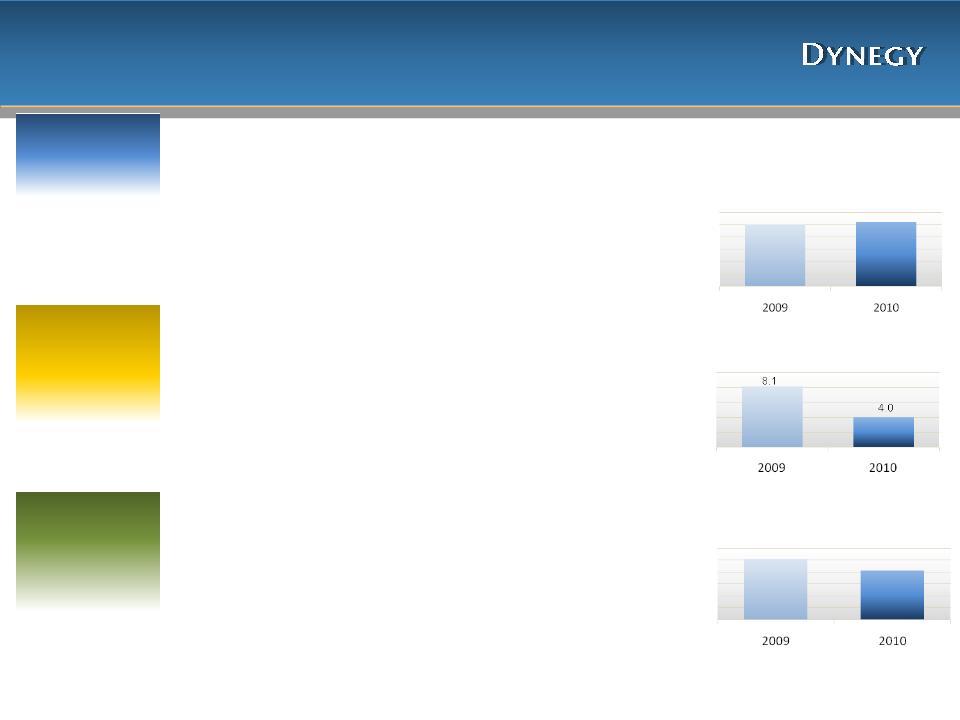
Midwest
|
• Adjusted EBITDA decreased 35%
– Energy contributions from financial transactions(1) declined due to lower value received in 2010; partially
offset by less premium expense due to fewer options purchased – Energy contributions from physical transactions(1) increased due to improved prices and spark spreads,
notwithstanding a receipt in 3Q09 of $50 million for a contract sale and assignment – Less operating expense in 2010 primarily due to assets sold in 4Q09 and cost reduction initiatives
– Less capacity revenue due to assets sold in 4Q09 and lower pricing in MISO; partially offset by more
capacity revenue in PJM – Lower margin due to increased forced outages
• Production volumes increased 6%
– Increase in volumes due to increased prices and spark spreads
• Midwest coal fleet achieved in-market-availability of 91%
|
Volumes 2009 vs 2010 (MM Mwh) (2)
|
|
West
|
• Adjusted EBITDA decreased 15%
– Energy contributions from financial transactions(1) declined as a result of lower value received in 2010
– Energy contributions from physical transactions(1) declined due to compressed spark spreads
– Less tolling revenue due to assets sold in 4Q09
– Less operating expense in 2010 primarily due to assets sold in 4Q09, lower outage costs at Moss Landing
and the closure of 2 units in 2009 at South Bay – Less revenue from tolling/RMR contracts as a result of lower contracted prices and less contracted volumes
at South Bay • Production volumes decreased 51%
– Two CCGT facilities sold in 4Q09 and compressed spark spreads
– Partially offset by increased volumes due to fewer planned outages
|
|
|
Northeast
|
• Adjusted EBITDA decreased 19%
– Energy contributions from financial transactions(1) declined due to lower value received in 2010
– Energy contributions from physical transactions(1) increased due to increased prices and spark spreads
– Less energy and capacity revenues due to asset sold in 4Q09
– Less operating expense in 2010 primarily due to asset sold in 4Q09 and cost reduction initiatives
• Production volumes decreased 19%
– CCGT facility sold in 4Q09
– Partially offset by increased volumes at CCGTs due to improved spark spreads
• Danskammer achieved in-market-availability of 95%
|
Summary of 2010 Year-Over-Year
Regional Performance Drivers
Regional Performance Drivers
(1) Financial transactions refer to hedging activities that include financial swaps and options activity, while physical transactions can be defined as generation sales
(2) 2009 volumes include assets sold in 4Q09
5
25.0
26.4
10.2
8.3

Dynegy Exceeds
November 2010 Guidance Estimates
November 2010 Guidance Estimates
6
|
2010 Guidance - GAAP Measures ($MM)
|
|
2010 Guidance
|
2010 Actual
|
||
|
Net loss
|
|
$
|
(200) - (180)
|
$
|
(234)
|
|
Net cash provided by operating activities
|
|
$
|
245 - 275
|
$
|
423
|
|
Net cash provided by investing activities
|
|
$
|
(685)
|
$
|
(534)
|
|
Net cash used by financing activities
|
|
$
|
(65)
|
$
|
(69)
|
(1) Based on 2010 forward natural gas prices of $4.39/MMBtu as of 10/4/10
|
($MM)
|
10/4/2010
Guidance(1) |
|
2010 Actual
|
Delta from top of
Guidance range |
|
Adjusted EBITDA
|
$ 500 - 530
|
|
$ 539
|
$ 9
|
|
Interest payments
|
(360)
|
|
(358)
|
2
|
|
Working capital / Non-cash adjustments / Other
|
115
|
|
274
|
159
|
|
Adjusted cash flow from operations
|
$ 255 - 285
|
|
$ 455
|
$ 170
|
|
Maintenance capital expenditures
|
(120)
|
|
(121)
|
(1)
|
|
Environmental capital expenditures
|
(200)
|
|
(197)
|
3
|
|
Capitalized Interest
|
(25)
|
|
(15)
|
10
|
|
Adjusted free cash flow
|
$ (90) - (60)
|
|
$ 122
|
$ 182
|
|
Table above is not intended as a GAAP reconciliation; reconciliation located in the Appendix.
|
|
|
|
|
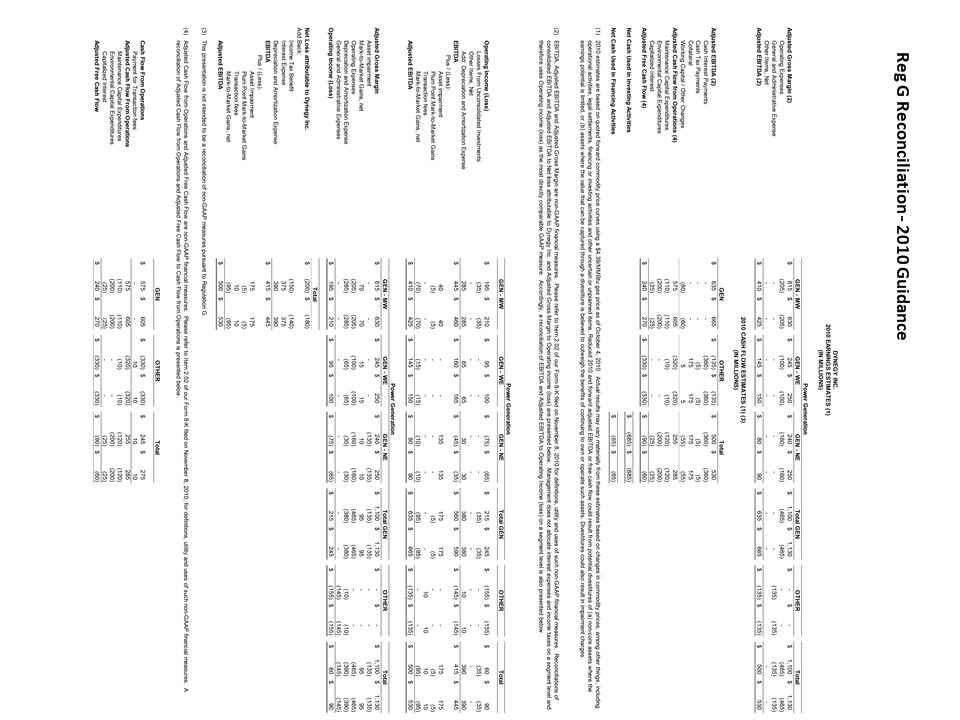
• As a result of lower commodity prices and reduced margin requirements, Dynegy received $290 million in cash in 2010 from its futures clearing
manager. Cash received in 2010 will be partially offset by reduced future cash flows due to lower values of the underlying generation.
manager. Cash received in 2010 will be partially offset by reduced future cash flows due to lower values of the underlying generation.
• Cost savings in G&A, O&M and capital expenditures in 2010 were driven largely by the cost savings initiative implemented in 2009.

Financial Estimates
7
In light of recent management and board changes that may affect the company’s strategic plans, Dynegy currently does not
intend to provide guidance estimates for 2011. Further, we have not updated nor do we intend to update, or otherwise
revise, the financial forecasts (the “Forecasts”) provided in Dynegy’s Solicitation/Recommendation Statement on Schedule
14D-9 (as amended or supplemented from time to time) filed with the SEC by Dynegy on December 30, 2010 and its
Preliminary Proxy Statement on Schedule 14A filed with the SEC by Dynegy on January 10, 2011. Consequently, readers
of these Forecasts are cautioned not to rely on such Forecasts . The company will reconsider at a later time whether it will
provide guidance estimates for 2011 and future years.

Appendix
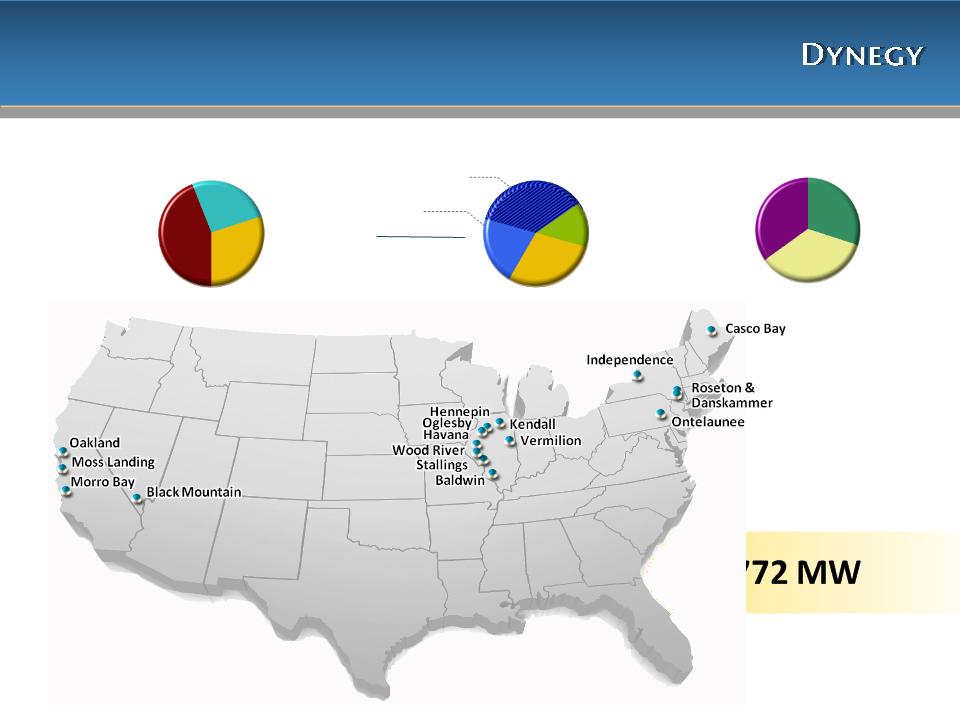
Dynegy’s Diversified Asset Portfolio
Dispatch Diversity
Peaking
32%
Intermediate
38%
Baseload
30%
Geographic Diversity
Midwest
43%
Northeast
28%
West
29%
Fuel Diversity
Combined Cycle
37%
Peaking
20%
Total Gas-Fired
57%
Coal
30%
Fuel Oil
13%
9

10
|
Average Actual On-Peak Power Prices
|
||
|
($/MWh) |
FY09
|
FY10
|
|
CIN Hub
|
$35
|
$42 |
|
PJM West
|
$45
|
$54 |
|
NI Hub
|
$35 |
$41 |
|
Average On-Peak Spark Spread ($/MWh)
|
||
|
PJM West/TetM3
|
$12 |
$19 |
|
NI Hub/ChiCG |
$7 |
$10 |
|
Operating Income/Loss ($MM)
|
||||
|
|
4Q09
|
FY09
|
4Q10
|
FY10
|
|
Midwest
Segment |
$(147)
|
$(4)
|
$(122)
|
$108
|
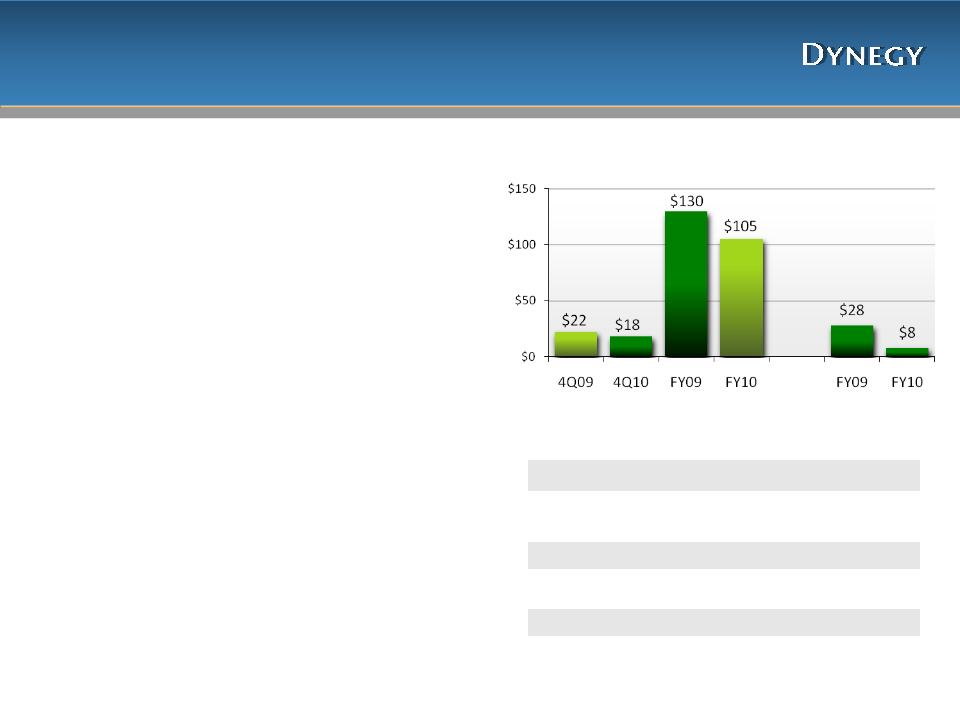
Midwest - Regional Results
Maint.
Enviro.
$ Million
Adjusted EBITDA
CapEx
• FY Adjusted EBITDA decreased by 35% period-over-period:
– Energy contributions from financial transactions were reduced due to lower
value received in 2010; partially offset by ~$45MM due to less premium
expense as a result of buying fewer options
value received in 2010; partially offset by ~$45MM due to less premium
expense as a result of buying fewer options
– Energy contributions from physical transactions increased due to improved
power prices and spark spreads, notwithstanding receipt in 3Q09 of $50
million from a contract sale and assignment
power prices and spark spreads, notwithstanding receipt in 3Q09 of $50
million from a contract sale and assignment
– Less capacity revenue of ~$40MM as a result of sale of assets in 4Q09;
capacity prices also benefitted from higher prices in PJM, however, were
offset by lower MISO capacity prices.
capacity prices also benefitted from higher prices in PJM, however, were
offset by lower MISO capacity prices.
– Less operating expense of ~$25MM primarily due to assets sold in 2009 and
cost reduction initiatives
cost reduction initiatives
– Tolling revenues increased ~$10MM due to the monetization and
replacement, at a lower volume, of a tolling agreement on the Kendall
facility; offset by a decrease in margin due to increased forced outages
replacement, at a lower volume, of a tolling agreement on the Kendall
facility; offset by a decrease in margin due to increased forced outages
– Annual average 2010 basis cost $4.05/MWh compared to $4.41/MWh in
2009
2009
• 4Q Adjusted EBITDA decreased primarily due to lower value
received in 4Q10 from energy contributions from financial
transactions
received in 4Q10 from energy contributions from financial
transactions
• FY Overall volumes increased 6% period-over-period primarily due
to:
to:
– 10% greater coal volumes due to increased power prices
– 81% and 27% capacity factors in 2010 for the coal fleet and CCGTs
respectively compared to 74% and 29% capacity factors in 2009 for the coal
fleet and CCGTs respectively
respectively compared to 74% and 29% capacity factors in 2009 for the coal
fleet and CCGTs respectively
• FY CapEx decreased due to reduced Consent Decree spending and removal
of Plum Point project expenditures due to deconsolidation
of Plum Point project expenditures due to deconsolidation
GAAP Measures:
• FY10 Operating Income reflects $37 million in pre-tax impairment
charges, a $28 million pre-tax charge on loss related to the sale of
Plum Point and $12 million in pre-tax MTM losses
charges, a $28 million pre-tax charge on loss related to the sale of
Plum Point and $12 million in pre-tax MTM losses
• FY09 Operating Loss reflects $223 million pre-tax asset and
goodwill impairment charges, a $96 million pre-tax loss on assets
sales(1) and includes a $112 million pre-tax MTM loss
goodwill impairment charges, a $96 million pre-tax loss on assets
sales(1) and includes a $112 million pre-tax MTM loss
• Operating Income 4Q10 is net of pre-tax MTM losses of $98 million
and a $28 million pre-tax loss related to the sale of Plum Point.
Operating Loss 4Q09 includes a $96 million pre-tax loss on asset
sales (1) and a $108 million pre-tax MTM loss.
and a $28 million pre-tax loss related to the sale of Plum Point.
Operating Loss 4Q09 includes a $96 million pre-tax loss on asset
sales (1) and a $108 million pre-tax MTM loss.
Discret.
(1) Assets associated with loss on sale include Renaissance, Riverside, Rocky Road and Tilton. Bluegrass
was classified as Discontinued Operations and therefore was not reflected in FY09 Operating Income
was classified as Discontinued Operations and therefore was not reflected in FY09 Operating Income
$533
$300

11
West - Regional Results
|
Average On-Peak Spark Spread ($/MWh)
|
||
|
|
FY09
|
FY10
|
|
North Path 15/PGECG
|
$8
|
$6
|
|
Operating Income/Loss ($MM)
|
||||
|
|
4Q09
|
FY09
|
4Q10
|
FY10
|
|
West
Segment |
$(9)
|
$(218)
|
$21
|
$118
|
• FY Adjusted EBITDA decreased 15% period-over-period:
– Less tolling revenue of ~$45MM due to assets sold in 4Q09
– Less operating expense of ~$50MM in 2010 primarily due to
assets sold in 4Q09, lower outage costs at Moss Landing and
closure of 2 units in 2009 at South Bay
assets sold in 4Q09, lower outage costs at Moss Landing and
closure of 2 units in 2009 at South Bay
– Energy contributions from financial transactions reduced due to
lower value received
lower value received
– Less tolling/RMR revenue of ~$15MM on South Bay and Moss
Landing
Landing
• 4Q Adjusted EBITDA increased due to lower operating
expenses totaling ~$22MM at Moss Landing due to lower
outage costs and the closure of 2 units at South Bay in 2009
expenses totaling ~$22MM at Moss Landing due to lower
outage costs and the closure of 2 units at South Bay in 2009
• FY Overall volumes were down 51%
– Two CCGTs sold in 4Q09
– 2010 capacity factor for Moss Landing 1&2 of 36% compared to
2009 capacity factor of 41%
2009 capacity factor of 41%
GAAP Measures:
• FY CapEx decreased due to lower maintenance expense at
Moss Landing in 2010
Moss Landing in 2010
• FY010 Operating Income includes a $33 million MTM gain.
• FY09 Operating Loss includes a pre-tax $58 million MTM
loss and a pre-tax $260 million goodwill impairment. FY09
Operating Loss does not include results from certain assets
reported as Discontinued Operations
loss and a pre-tax $260 million goodwill impairment. FY09
Operating Loss does not include results from certain assets
reported as Discontinued Operations
• Operating Income 4Q10 is net of a $12 million pre-tax
MTM gain. Operating Income 4Q09 includes a pre-tax $8
million MTM loss
MTM gain. Operating Income 4Q09 includes a pre-tax $8
million MTM loss
$ Million
Adjusted EBITDA
CapEx
12
Northeast - Regional Results
|
Average Actual On-Peak Power Prices
|
||
|
($/MWh)
|
FY09
|
FY10
|
|
NY - Zone G
|
$50
|
$59
|
|
Average On-Peak Spark Spread ($/MWh)
|
||
|
Fuel Oil
|
$(53)
|
$(72)
|
|
NY - Zone A
|
$4
|
$9
|
|
Mass Hub
|
$12
|
$18
|
|
Operating Income/(Loss)($MM)
|
||||
|
|
4Q09
|
FY09
|
4Q10
|
FY10
|
|
Northeast
Segment |
$(20)
|
$(444)
|
$(4)
|
$(60)
|
• FY Adjusted EBITDA decreased 19% period-over-period:
– Energy contributions from financial transactions declined due to lower value
received
received
– Energy contributions from physical transactions increased due to improved
spark spreads and power prices
spark spreads and power prices
– Less energy and capacity revenues of ~$45MM due to the sale of the
Bridgeport facility in 4Q09 and lower NY capacity pricing
Bridgeport facility in 4Q09 and lower NY capacity pricing
– Decreased operating expense of ~$25MM primarily due to assets sold in
4Q09 and cost reduction initiatives
4Q09 and cost reduction initiatives
– Decreased expenses due to coal inventory write-down of ~$10MM in 2009
– Increased revenue of ~$10MM due to a sale of excess fuel oil from our
Roseton facility, offset by fewer emission sales
Roseton facility, offset by fewer emission sales
• 4Q Adjusted EBITDA down slightly due to decreased energy and
capacity revenues from the sale of the Bridgeport facility in 4Q09
and lower NY capacity pricing, partially offset by a gain on the sale
of fuel oil
capacity revenues from the sale of the Bridgeport facility in 4Q09
and lower NY capacity pricing, partially offset by a gain on the sale
of fuel oil
• FY Overall volumes down 19%
– 2010 capacity factors were 39% for Danskammer and 47% for the CCGTs
versus 2009 capacity factors of 47% for Danskammer and 40% for the CCGTs
versus 2009 capacity factors of 47% for Danskammer and 40% for the CCGTs
– Decrease in production volume due to assets sold in 4Q09 partially offset by
increased runtime at CCGT’s due to improved spark spreads
increased runtime at CCGT’s due to improved spark spreads
• FY CapEx decreased due to fewer outages
GAAP Measures:
• FY10 Operating Loss includes $136 million pre-tax asset
impairments related to Casco Bay, Roseton and Danskammer
impairments related to Casco Bay, Roseton and Danskammer
• FY09 Operating Loss reflects $488 million in pre-tax asset and
goodwill impairment charges on Bridgeport, Roseton and
Danskammer and $28 million in a pre-tax loss on sale of assets
related to Bridgeport
goodwill impairment charges on Bridgeport, Roseton and
Danskammer and $28 million in a pre-tax loss on sale of assets
related to Bridgeport
• FY09 Operating Loss includes a $10 million pre-tax MTM loss
• 4Q10 Operating Loss includes a $19 million pre-tax MTM loss
• 4Q09 Operating Loss includes a pre-tax $28 million loss on the sale
of Bridgeport and a pre-tax MTM loss of $2 million
of Bridgeport and a pre-tax MTM loss of $2 million
$ Million
Adjusted EBITDA
CapEx
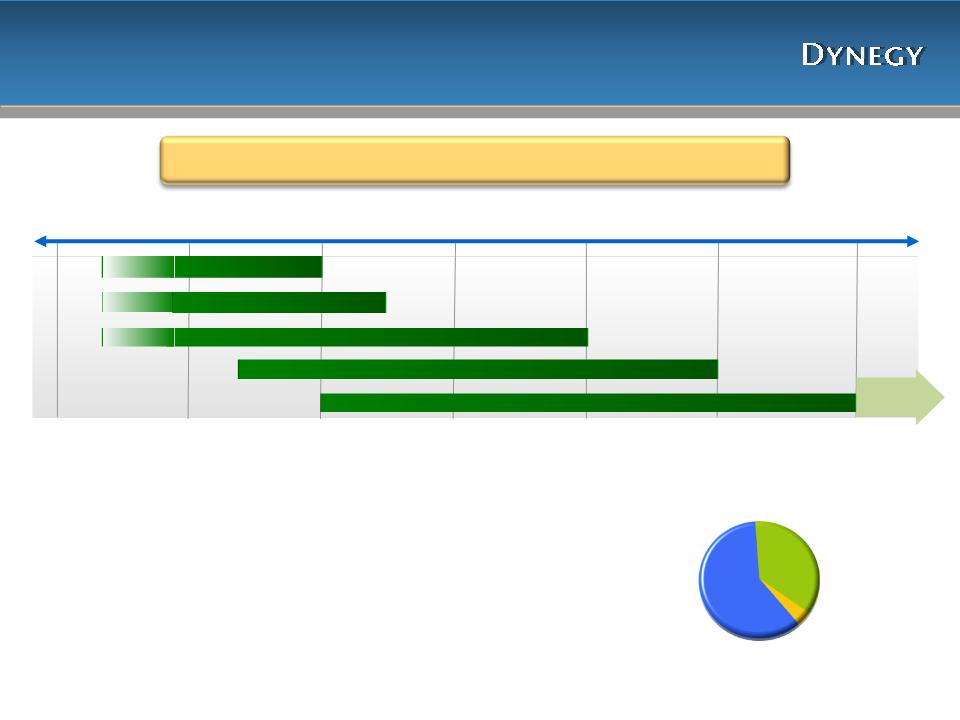
Significant Environmental Progress
13
On target to further reduce emissions in the Midwest
• Estimate of remaining cash spend is ~$230 million from
12/31/10 through 2013
12/31/10 through 2013
• Approximately 25% of remaining costs are firm
• Labor and material prices are assumed to escalate 4%
annually
annually
• All projects include installing baghouses and scrubbers
with the exception of Hennepin, which has baghouses
only
with the exception of Hennepin, which has baghouses
only
Labor
~71%
Rental Equipment
& Other ~4%
& Other ~4%
Estimated Go Forward
Cost Composition
Materials
~25%
2008
2010
2009
2011
2012
2007
Hennepin
Baldwin 3
Baldwin 1
Baldwin 2
Havana
Projects complete
Cash outflow
continues
through 2013
continues
through 2013
14
Mark-to-Market (Pre-tax)
|
($ Million)
|
3 Months Ending 12/31/09
|
3 Months Ending 12/31/10
|
||||||
|
Quarter
|
Midwest
|
West
|
Northeast
|
TOTAL
|
Midwest
|
West
|
Northeast
|
TOTAL
|
|
MTM for positions settled or to
be settled in the current year |
(84)
|
0
|
(8)
|
(92)
|
(48)
|
(4)
|
(10)
|
(62)
|
|
MTM gain/(losses) for future
period positions |
(24)
|
(8)
|
6
|
(26)
|
(50)
|
16
|
(9)
|
(43)
|
|
Total MTM adjustment
|
(108)
|
(8)
|
(2)
|
(118)
|
(98)
|
12
|
(19)
|
(105)
|
• To the extent MTM positions settled or to be settled in the current year were entered into prior to current year, MTM
gains/(losses) were also recognized in prior year
gains/(losses) were also recognized in prior year
• Option premiums are recognized in period received (paid) and are excluded from MTM impacts shown above
• A significant amount of MTM for future period positions has been settled in cash through a brokerage account
|
($ Million)
|
YTD Ending 12/31/09
|
YTD Ending 12/31/10
|
||||||
|
Year-to-Date
|
Midwest
|
West
|
Northeast
|
TOTAL
|
Midwest
|
West
|
Northeast
|
TOTAL
|
|
MTM for positions settled or to
be settled in the current year |
(137)
|
(16)
|
(1)
|
(154)
|
(68)
|
7
|
(1)
|
(62)
|
|
MTM gain/(losses) for future
period positions |
25
|
(42)
|
(9)
|
(26)
|
56
|
26
|
(2)
|
80
|
|
Total MTM adjustment
|
(112)
|
(58)
|
(10)
|
(180)
|
(12)
|
33
|
(3)
|
18
|
Note: Table includes MTM for both continuing and discontinued operations

15
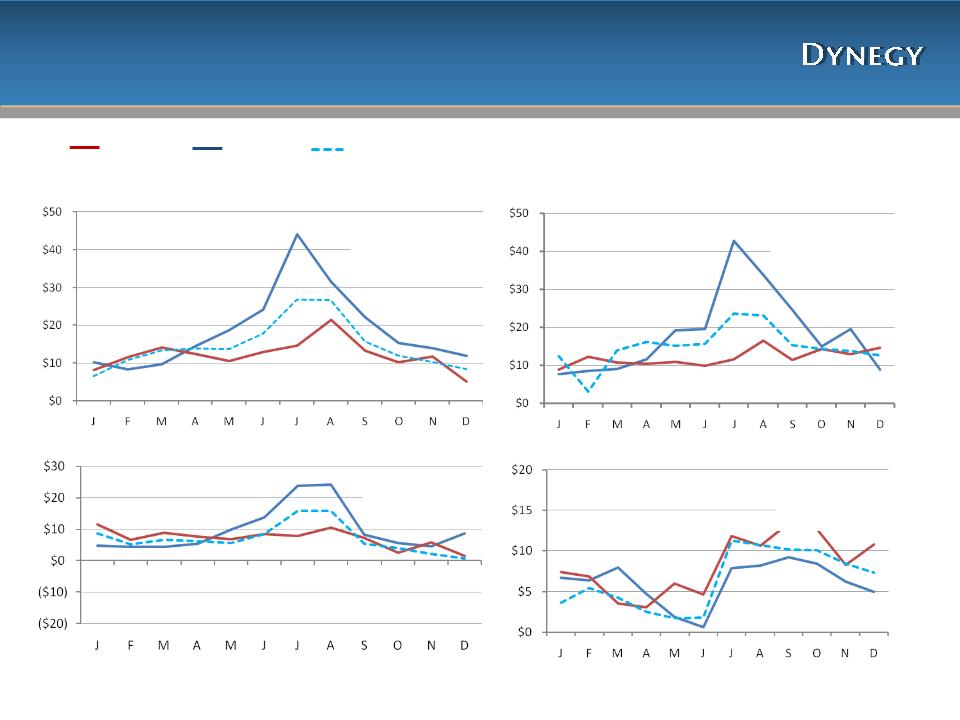
Commodity Pricing
Cin Hub/Cinergy ($/MWh)
New York Zone G ($/MWh)
NP-15 ($/MWh)
Natural Gas ($/MMBtu)
2011 A/F (Feb): $38.35
2010 A: $42.40
2009A: $34.67
2011 A/F (Feb): $56.30
2010 A: $59.19
2009A: $49.83
2011 A/F (Feb): $38.43
2010 A: $39.92
2009A: $39.27
2011 A/F (Feb): $4.29
2010 A: $4.38
2009A: $3.92
(1) Pricing as of 2/10/11. Prices reflect actual day ahead on-peak settlement prices for 1/1/11 - 2/10/2011 and quoted forward on-peak monthly prices for 2/11/2011-12/31/11
2010 Actual
2011 Forward as of
2/10/2011(1)
2/10/2011(1)
2009 Actual
16
Spark Spreads
PJM West ($/MWh)
Mass Hub ($/MWh)
NI Hub ($/MWh)
NP-15 ($/MWh)
2011 A/F (Feb): $14.68
2010 A: $18.69
2009A: $12.19
2011 A/F (Feb): $15.02
2010 A: $18.48
2009A: $12.10
2011 A/F (Feb): $7.08
2010 A: $9.82
2009A: $7.08
2011 A/F (Feb): $6.44
2010 A: $6.06
2009A: $8.28
(1) Pricing as of 2/10/11. Prices reflect actual day ahead on-peak settlement prices for 1/1/11 - 2/10/2011 and quoted forward on-peak monthly prices for 2/11/2011-12/31/11
2010 Actual
2011 Forward as of
2/10/2011(1)
2/10/2011(1)
2009 Actual
17
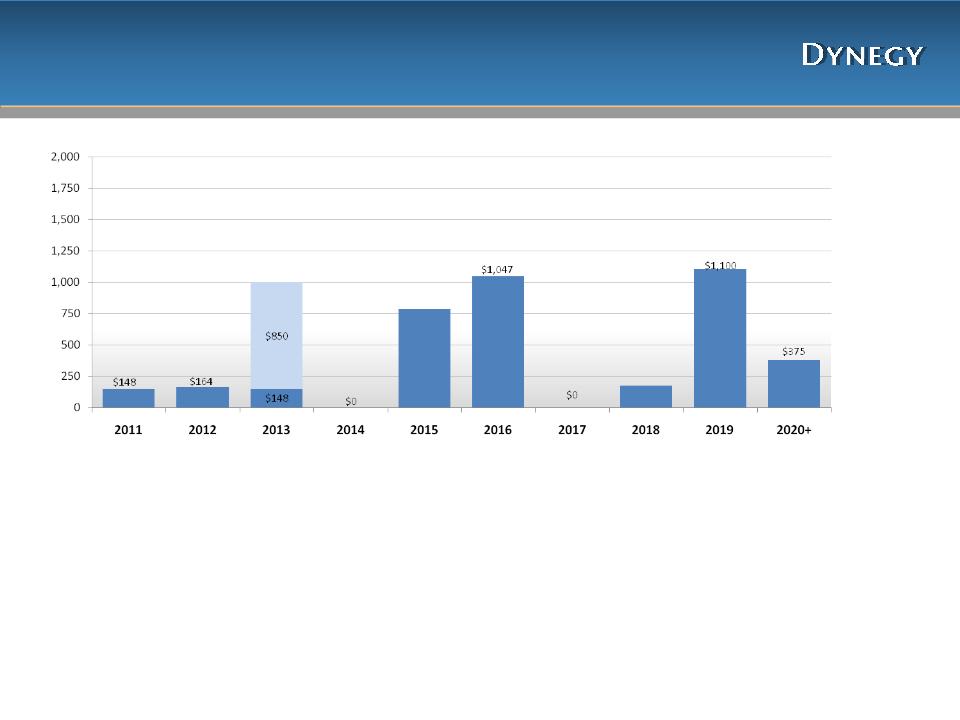
• Total balance sheet debt as of 12/31/10 is ~$4.8B
• $850 million due in 2013 is a synthetic letter of credit facility supported by $850 million of
restricted cash
restricted cash
• Excludes $590 million related to Central Hudson lease
Debt Maturity Profile (as of 12/31/10, $MM)
$998
$785
$175
18
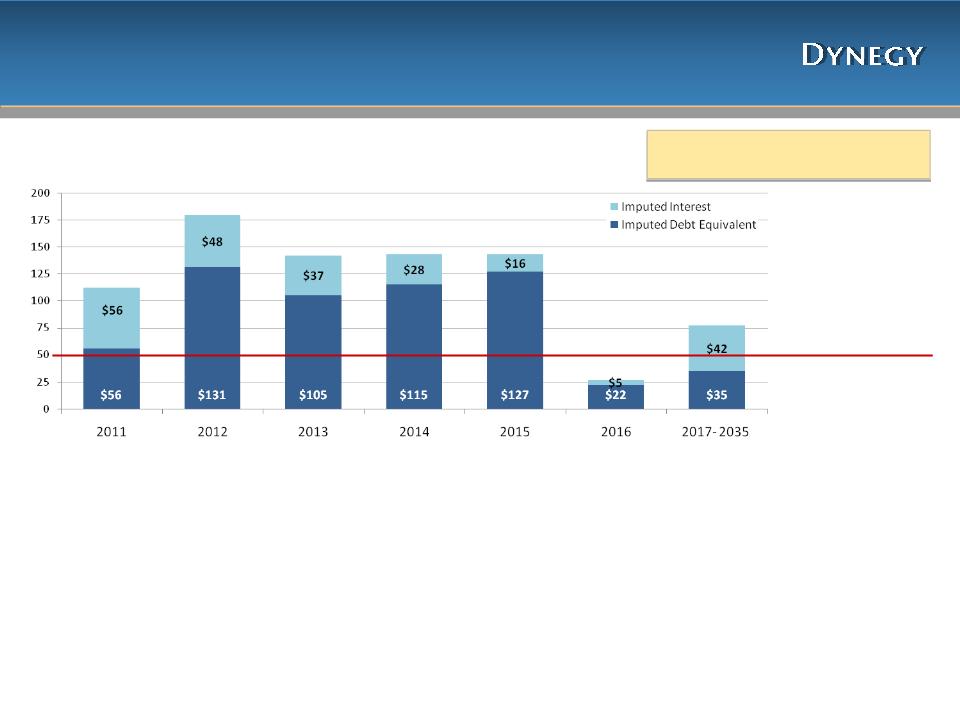
Central Hudson Lease - Northeast Segment
Central Hudson Cash Payments (remaining as of 12/31/10, $MM)
Imputed Debt Equivalent at PV (10%) of
future lease payments = $590MM(1)
future lease payments = $590MM(1)
$112
$179
$142
$143
$143
$77
• Chart represents total cash lease payments, which are included in Operating Cash Flows
• Lease expense is approximately $50 million per year and included in Operating Expense
Central Hudson treated as Lease (2)
(as currently shown in GAAP financials):
(as currently shown in GAAP financials):
• Income Statement - $50 million lease expense included in
Adjusted EBITDA; no interest expense or depreciation &
amortization expense
Adjusted EBITDA; no interest expense or depreciation &
amortization expense
• Cash Flow Statement - $112 million cash payment included in
Operating Cash Flows
Operating Cash Flows
• Balance Sheet - lease obligation not included in debt balance
Central Hudson treated as Debt (2)
(would require the following adjustments to GAAP financials):
(would require the following adjustments to GAAP financials):
•Income Statement - Add back $50 million lease expense to Adjusted EBITDA; add $56
million imputed interest expense to Interest Expense; add $23 million estimated
depreciation & amortization expense; adjust tax expense for net difference
million imputed interest expense to Interest Expense; add $23 million estimated
depreciation & amortization expense; adjust tax expense for net difference
– Depreciation & Amortization calculated using purchase price of $920 million divided by
40 years
•Cash Flow Statement - Add back $56 million of imputed principal to Operating Cash Flows
– $112 million cash payment split between $56 million imputed interest payment (Operating
Cash Flows) and $56 million imputed principal payment (Financing Cash Flows)
•Balance Sheet - Include $590 million total PV (10%) of future lease payments
(1) PV of payments calculated as of 12/31/2010 ; (2) Calculated on an annual basis
Accrual Lease Expense (2)
$27
19
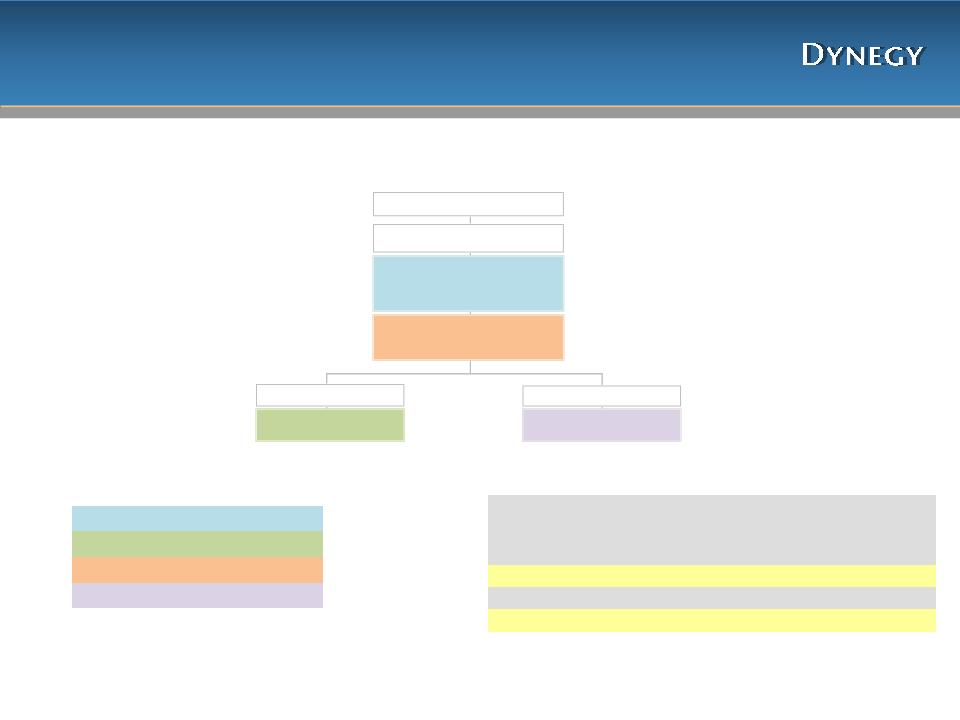
Capital Structure
Debt & Other Obligations as of 12/31/2010
Dynegy Power Corp.
Central Hudson(2) $590
Dynegy Holdings Inc.
$1,080 Million Revolver(1) $0
Term L/C Facility $850
Tranche B Term $68
Sr. Unsec. Notes/Debentures $3,450
Sub.Cap.Inc.Sec (“SKIS”) $200
Dynegy Inc.
Senior Debentures $225
Sithe Energies
|
TOTALS ($ Million)
|
12/31/2010
|
|
Secured
|
$918
|
|
Secured Non-Recourse
|
$225
|
|
Unsecured
|
$3,650
|
|
Lease Obligation
|
$590
|
|
($ Million)
|
12/31/2010
|
12/31/2009
|
|
Total Obligations
|
$5,383
|
$6,225
|
|
Less: Cash & short-term investments
|
397
|
471
|
|
Less: Restricted cash(3)
|
850
|
869
|
|
Net Debt & Other Obligations
|
$4,136
|
$4,885
|
|
Less: Central Hudson Lease Obligation
|
590
|
626
|
|
Net Debt
|
$3,546
|
$4,259
|
(1) Represents drawn amounts under the revolver; actual amount of revolver was $1.08 Billion as of 12/31/2010;
(2) Represents PV (10%) of future lease payments. Central Hudson lease payments are unsecured obligations of
Dynegy Inc., but are a secured obligation of an unrelated third party (“lessor”) under the lease. DHI has
guaranteed the lease payments on a senior unsecured basis; (3) Restricted cash includes $850MM related to the
Synthetic Letter of Credit facility; 2009 also includes ~$19MM related to Plum Point

20
Collateral Excluding Clearing Settlements
|
($MM)
|
12/31/2009
|
|
12/31/2010
|
|
3/3/2011
|
|
Generation
|
$ 638
|
|
$ 377
|
|
$ 459
|
|
Other
|
189
|
|
85
|
|
85
|
|
Total
|
$ 827
|
|
$ 462
|
|
$ 544
|
|
|
|
|
|
|
|
|
Cash and short-term investments
|
$ 291
|
|
$ 87
|
|
$ 152
|
|
LCs
|
536
|
|
375
|
|
392
|
|
Total
|
$ 827
|
|
$ 462
|
|
$ 544
|
• Changes in generation collateral include initial margin postings related to hedging activity for 2010-2012
− Decrease in generation collateral from 12/31/09 to 12/31/10 primarily due to lower commodity prices and lower initial margin posting
requirements
requirements
− Increase in generation collateral from 12/31/10 to 3/3/11 primarily due higher in initial margin posting requirements
• Other collateral primarily includes Sithe Debt Service Reserve of $83 million
− Other collateral for 12/31/2009 also included $102 million related to a tax exempt facility associated with PPEA
• Changes in cash and short-term investments include initial margin postings related to hedging activity for 2010-2012
− Decrease in cash and short-term investments from 12/31/09 to 12/31/10 posted to our futures clearing manager due to lower commodity prices
and lower initial margin posting requirements
and lower initial margin posting requirements
− Increase in cash and short-term investments from 12/31/10 to 3/31/11 posted to our futures clearing manager primarily due to higher initial
margin posting requirements
margin posting requirements
• In addition to cash and LCs posted as collateral, we have granted additional permitted first priority liens on the assets currently
subject to first priority liens under our Credit Facility. The fair value collateralized by first priority liens, netted by counterparty,
includes liabilities of $31 million, $30 million and $20 million at 12/31/09, 12/31/10 and 3/3/11, respectively
subject to first priority liens under our Credit Facility. The fair value collateralized by first priority liens, netted by counterparty,
includes liabilities of $31 million, $30 million and $20 million at 12/31/09, 12/31/10 and 3/3/11, respectively
21
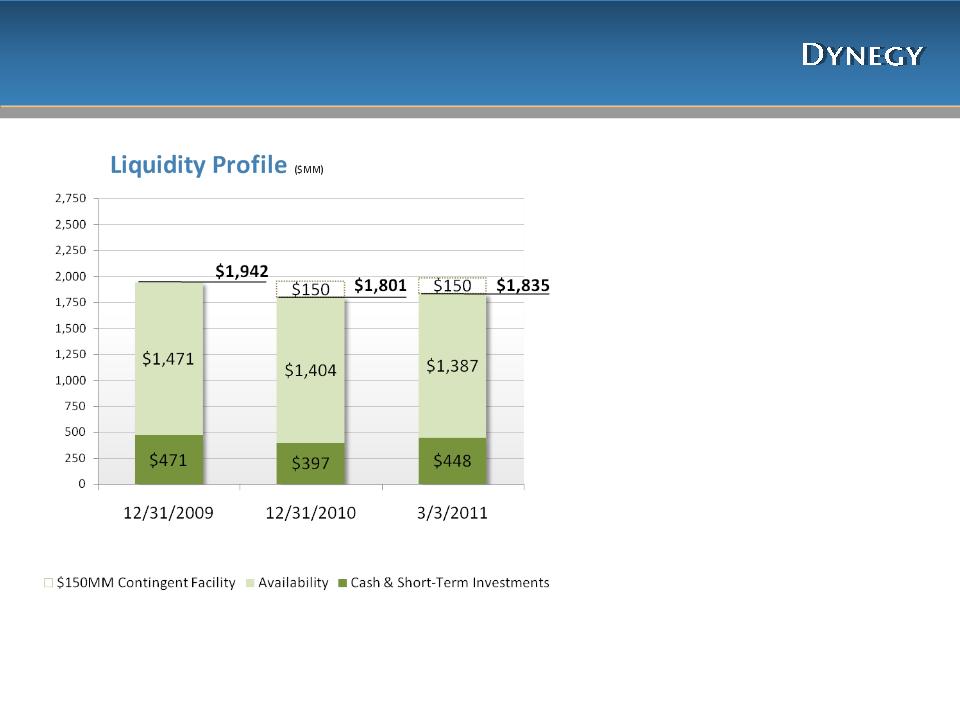
• Decrease in cash from FY09 to FY10
due to FY10 operating activities
due to FY10 operating activities
• Due to covenant limitations, decrease
in revolver availability of $126 million
at 12/31/10
in revolver availability of $126 million
at 12/31/10
• Currently there is no availability under
the $150MM contingent letter of
credit facility
the $150MM contingent letter of
credit facility
– Under terms of this facility, up to
$150 million of capacity can become
available based on increases in spark
spreads and power prices for 2012
positions
$150 million of capacity can become
available based on increases in spark
spreads and power prices for 2012
positions
• Increase in cash from 12/31/10 to
3/3/11 primarily due to the expiration
of an agreement and the subsequent
release of restricted cash
3/3/11 primarily due to the expiration
of an agreement and the subsequent
release of restricted cash
Liquidity
22
Contracted Generation Volumes
|
2011 Contracted Generation Volumes as of:
|
|
|
|
|
|
|
|||||
|
|
Dec 08
|
Feb 09
|
May 09
|
Aug 09
|
Nov 09
|
Jan 10
|
Feb 10
|
May 10
|
Jul 10
|
Oct 10
|
Feb 11
|
|
Midwest
|
5%
|
5%
|
5%
|
15%
|
50%
|
75%
|
75%
|
90%
|
100%
|
95%
|
100%
|
|
West
|
20%
|
20%
|
20%
|
40%
|
50%
|
>95%
|
>95%
|
>95%
|
100%
|
100%
|
100%
|
|
Northeast
|
10%
|
5%
|
5%
|
15%
|
60%
|
>95%
|
>95%
|
>95%
|
100%
|
85%
|
100%
|
|
Consolidated
|
10%
|
10%
|
10%
|
20%
|
50%
|
85%
|
85%
|
95%
|
100%
|
95%
|
100%
|
|
2012 Contracted Generation Volumes as of:
|
|
|
|
||||
|
|
Nov 09
|
Jan 10
|
Feb 10
|
May 10
|
Jul 10
|
Oct 10
|
Feb 11
|
|
Midwest
|
0%
|
0%
|
0%
|
5%
|
15%
|
20%
|
25%
|
|
West
|
15%
|
50%
|
50%
|
50%
|
50%
|
40%
|
45%
|
|
Northeast
|
10%
|
10%
|
15%
|
25%
|
40%
|
35%
|
45%
|
|
Consolidated
|
5%
|
15%
|
15%
|
15%
|
25%
|
25%
|
30%
|

23
Debt Definitions
Debt Measures: We believe that our debt measures are useful because we consider these
measures as a way to evaluate our progress toward our strategic corporate objective of reducing
our overall indebtedness. In addition, many analysts and investors use these measures for
valuation analysis purposes. The most directly comparable GAAP financial measure to the below
measures is GAAP debt.
– “Net Debt” - We define “Net Debt” as total GAAP debt less cash and cash equivalents and restricted cash.
Restricted cash in this case consists only of collateral posted for the credit facility at the end of each
period, and restricted cash related to Plum Point, at the end of each period where applicable.
Restricted cash in this case consists only of collateral posted for the credit facility at the end of each
period, and restricted cash related to Plum Point, at the end of each period where applicable.
– “Net Debt and Other Obligations” - We define “Net Debt and Other Obligations” as total GAAP debt plus
certain operating lease commitments less cash and cash equivalents and restricted cash. Restricted cash in
this case consists only of collateral posted for the credit facility at the end of each period, and restricted
cash related to Plum Point, at the end of each period where applicable.
certain operating lease commitments less cash and cash equivalents and restricted cash. Restricted cash in
this case consists only of collateral posted for the credit facility at the end of each period, and restricted
cash related to Plum Point, at the end of each period where applicable.

24
|
Dynegy Generation Facilities
|
|||||
|
Region/Facility(1)
|
Location
|
Net Capacity(2)
|
Primary Fuel
|
Dispatch Type
|
NERC Region
|
|
MIDWEST
|
|
|
|
|
|
|
Baldwin
|
Baldwin, IL
|
1,800
|
Coal
|
Baseload
|
MISO
|
|
Havana(3)
|
Havana, IL
|
441
|
Coal
|
Baseload
|
MISO
|
|
Hennepin
|
Hennepin, IL
|
293
|
Coal
|
Baseload
|
MISO
|
|
Oglesby
|
Oglesby, IL
|
63
|
Gas
|
Peaking
|
MISO
|
|
Stallings
|
Stallings, IL
|
89
|
Gas
|
Peaking
|
MISO
|
|
Vermilion(4)
|
Oakwood, IL
|
|
|
|
|
|
Units 1-2
|
|
164
|
Coal/Gas
|
Baseload
|
MISO
|
|
Unit 3
|
|
12
|
Oil
|
Peaking
|
MISO
|
|
Wood River(5)
|
Alton, IL
|
446
|
Coal
|
Baseload
|
MISO
|
|
Kendall
|
Minooka, IL
|
1,200
|
Gas - CCGT
|
Intermediate
|
PJM
|
|
Ontelaunee
|
Ontelaunee Township, PA
|
580
|
Gas - CCGT
|
Intermediate
|
PJM
|
|
Midwest TOTAL
|
|
5,088
|
|
|
|
|
NORTHEAST
|
|
|
|
|
|
|
Independence
|
Scriba, NY
|
1,064
|
Gas - CCGT
|
Intermediate
|
NYISO
|
|
Roseton (6)
|
Newburgh, NY
|
1,200
|
Gas/Oil
|
Peaking
|
NYISO
|
|
Casco Bay
|
Veazie, ME
|
540
|
Gas - CCGT
|
Intermediate
|
ISO-NE
|
|
Danskammer
|
Newburgh, NY
|
|
|
|
|
|
Units 1-2
|
|
123
|
Gas/Oil
|
Peaking
|
NYISO
|
|
Units 3-4 (6)
|
|
370
|
Coal/Gas
|
Baseload
|
NYISO
|
|
Northeast TOTAL
|
|
3,297
|
|
|
|
|
WEST
|
|
|
|
|
|
|
Moss Landing
|
Monterey County, CA
|
|
|
|
|
|
Units 1-2
|
|
1,020
|
Gas - CCGT
|
Intermediate
|
CAISO
|
|
Units 6-7
|
|
1,509
|
Gas
|
Peaking
|
CAISO
|
|
Morro Bay (7)
|
Morro Bay, CA
|
650
|
Gas
|
Peaking
|
CAISO
|
|
Oakland
|
Oakland, CA
|
165
|
Oil
|
Peaking
|
CAISO
|
|
Black Mountain (8)
|
Las Vegas, NV
|
43
|
Gas
|
Baseload
|
WECC
|
|
West TOTAL
|
|
3,387
|
|
|
|
|
TOTAL GENERATION
|
11,772
|
|
|||
NOTES:
1)Dynegy owns 100% of each unit
listed except as otherwise indicated.
For each unit in which Dynegy owns
less than a 100% interest, the Total
Net Capacity set forth in this table
includes only Dynegy’s proportionate
share of such unit’s gross generating
capacity.
listed except as otherwise indicated.
For each unit in which Dynegy owns
less than a 100% interest, the Total
Net Capacity set forth in this table
includes only Dynegy’s proportionate
share of such unit’s gross generating
capacity.
2)Unit capabilities are based on winter
capacity.
capacity.
3)Represents Unit 6 generating
capacity. Units 1-5, with a combined
net generating capacity of 228 MW,
are currently in mothball status and
out of operation.
capacity. Units 1-5, with a combined
net generating capacity of 228 MW,
are currently in mothball status and
out of operation.
4)Dynegy has announced plans to
mothball these units at approximately
the end of the first quarter 2011.
mothball these units at approximately
the end of the first quarter 2011.
5)Represents Units 4 and 5 generating
capacity. Units 1-3, with a combined
net generating capacity of 119 MW,
are currently in mothball status and
out of operation.
capacity. Units 1-3, with a combined
net generating capacity of 119 MW,
are currently in mothball status and
out of operation.
6)Dynegy entered into a $920 MM sale
-leaseback transaction for the Roseton
facility and Units 3 and 4 of the
Danskammer facility in 2001. Cash
lease payments extend until 2029 and
include $112 MM in 2011 and $179
MM in 2012. GAAP lease payments
are $50.5 MM through 2030 and
decrease until last GAAP lease
payment in 2035.
-leaseback transaction for the Roseton
facility and Units 3 and 4 of the
Danskammer facility in 2001. Cash
lease payments extend until 2029 and
include $112 MM in 2011 and $179
MM in 2012. GAAP lease payments
are $50.5 MM through 2030 and
decrease until last GAAP lease
payment in 2035.
7)Represents Units 3 and 4 generating
capacity. Units 1 and 2, with a
combined net generating capacity of
352 MW, are currently in mothball
status and out of operation.
capacity. Units 1 and 2, with a
combined net generating capacity of
352 MW, are currently in mothball
status and out of operation.
8)Dynegy owns a 50% interest in this
facility.
facility.
25
26
27
28
29

30