Attached files
| file | filename |
|---|---|
| EX-32.1 - EXHIBIT 32.1 - HERSHA HOSPITALITY TRUST | ex32_1.htm |
| EX-23.1 - EXHIBIT 23.1 - HERSHA HOSPITALITY TRUST | ex23_1.htm |
| EX-12.1 - EXHIBIT 12.1 - HERSHA HOSPITALITY TRUST | ex12_1.htm |
| EX-31.1 - EXHIBIT 31.1 - HERSHA HOSPITALITY TRUST | ex31_1.htm |
| EX-31.2 - EXHIBIT 31.2 - HERSHA HOSPITALITY TRUST | ex31_2.htm |
| EX-32.2 - EXHIBIT 32.2 - HERSHA HOSPITALITY TRUST | ex32_2.htm |
| EX-21.1 - EXHIBIT 21.1 - HERSHA HOSPITALITY TRUST | ex21_1.htm |
UNITED STATES
SECURITIES AND EXCHANGE COMMISSION
WASHINGTON, D.C. 20549
FORM 10-K
(Mark One)
|
x
|
ANNUAL REPORT PURSUANT TO SECTION 13 OR 15(d) OF THE SECURITIES EXCHANGE ACT OF 1934
|
For the fiscal year ended December 31, 2010
OR
|
o
|
TRANSITION REPORT PURSUANT TO SECTION 13 OR 15(d) OF THE SECURITIES EXCHANGE ACT OF 1934
|
For the transition period from _______________ to _______________
Commission file number: 001-14765
HERSHA HOSPITALITY TRUST
(Exact Name of Registrant as Specified in Its Charter)
|
Maryland
|
|
251811499
|
|
(State or Other Jurisdiction of Incorporation or Organization)
|
|
(I.R.S. Employer Identification No.)
|
|
|
|
|
|
44 Hersha Drive, Harrisburg, PA
|
|
17102
|
|
(Address of Registrant’s Principal Executive Offices)
|
|
(Zip Code)
|
Registrant’s telephone number, including area code: (717) 236-4400
Securities registered pursuant to Section 12(b) of the Act:
|
Title of each class
|
|
Name of each exchange on which registered
|
|
Class A Common Shares of Beneficial Interest, par value $.01 per share
|
|
New York Stock Exchange
|
|
Series A Cumulative Redeemable Preferred Shares of Beneficial Interest, par value $.01 per share
|
|
New York Stock Exchange
|
Securities registered pursuant to Section 12(g) of the Act:
None
(Title of class)
Indicate by check mark if the registrant is a well-known seasoned issuer, as defined in Rule 405 of the Securities Act.
x Yes ¨ No
Indicate by check mark if the registrant is not required to file reports pursuant to Section 13 or Section 15(d) of the Act.
¨ Yes x No
Indicate by check mark whether the registrant (i) has filed all reports required to be filed by Section 13 or 15(d) of the Securities Exchange Act of 1934 during the preceding 12 months (or for such shorter period that the registrant was required to file such reports), and (ii) has been subject to such filing requirements for the past 90 days. x Yes o No
Indicate by check mark whether the registrant has submitted electronically and posted on its corporate Web site, if any, every Interactive Data File required to be submitted and posted pursuant to Rule 405 of Regulation S-T (Sec.232.405 of this chapter) during the preceding 12 months (or for such shorter period that the registrant was required to submit and post such files).
¨ Yes ¨ No
Indicate by check mark if disclosure of delinquent filers pursuant to Item 405 of Regulation S-K (§ 229.405) is not contained herein, and will not be contained, to the best of the registrant’s knowledge, in definitive proxy or information statements incorporated by reference in Part III of this Form 10-K or any amendment to this Form 10-K. ¨ Yes x No
Indicate by check mark whether the registrant is a large accelerated filer, an accelerated filer, a non-accelerated filer, or a smaller reporting company. See definition of “large accelerated filer,” “accelerated filer” and “smaller reporting company” in Rule 12b-2 of the Exchange Act. (Check one):
|
Large accelerated filer o
|
Accelerated filer x
|
|
Non-accelerated filer o
|
Smaller reporting company o
|
Indicate by check mark whether the registrant is a shell company (as defined in Rule 12b-2 of the Act). oYes x No
The aggregate market value of the outstanding Class A common shares held by nonaffiliates of the registrant, computed by reference to the closing sale price at which Class A common shares were last sold on June 30, 2010, was approximately $629.3 million.
As of March 2, 2011, the number of Class A common shares outstanding was 169,273,542 and there were no Class B common shares outstanding.
DOCUMENTS INCORPORATED BY REFERENCE
Portions of the registrant’s definitive proxy statement, to be filed with the Commission not later than 120 days after the end of the fiscal year pursuant to Regulation 14A are incorporated herein by reference into Part III.
HERSHA HOSPITALITY TRUST
Table of Contents
|
Item No.
|
Form 10-K Report Page
|
||
| 1 | |||
|
PART I
|
|||
|
ITEM 1.
|
2 | ||
|
ITEM 1A.
|
8 | ||
|
ITEM 1B.
|
18 | ||
|
ITEM 2.
|
19 | ||
|
ITEM 3.
|
21 | ||
|
ITEM 4.
|
21 | ||
|
PART II
|
|||
|
ITEM 5.
|
22 | ||
|
ITEM 6.
|
24 | ||
|
ITEM 7.
|
26 | ||
|
ITEM 8.
|
44 | ||
|
ITEM 9.
|
92 | ||
|
ITEM 9A.
|
92 | ||
|
ITEM 9B.
|
94 | ||
|
PART III
|
|||
|
ITEM 10.
|
95 | ||
|
ITEM 11.
|
95 | ||
|
ITEM 12.
|
95 | ||
|
ITEM 13.
|
95 | ||
|
ITEM 14.
|
95 | ||
|
PART IV
|
|||
|
ITEM 15.
|
96 | ||
CAUTIONARY FACTORS THAT MAY AFFECT FUTURE RESULTS
Unless the context otherwise requires, references in this report to: (1) “we,” “us,” “our,” the “Company” and “Hersha” mean Hersha Hospitality Trust and its consolidated subsidiaries, including Hersha Hospitality Limited Partnership, taken as a whole; (2) “HHLP” and “our operating partnership” mean Hersha Hospitality Limited Partnership; and (3) “common shares” mean our Class A common shares of beneficial interest, $0.01 par value per share.
This report contains forward-looking statements within the meaning of Section 27A of the Securities Act of 1933, as amended, and Section 21E of the Securities Exchange Act of 1934, as amended, including, without limitation, statements containing the words, “believe,” “expect,” “anticipate,” “estimate,” “plan,” “continue,” “intend,” “should,” “may” and words of similar import. Such forward-looking statements relate to future events, our plans, strategies, prospects and future financial performance, and involve known and unknown risks that are difficult to predict, uncertainties and other factors which may cause our actual results, performance or achievements or industry results to be materially different from any future results, performance or achievements expressed or implied by such forward-looking statements. Readers should specifically consider the various factors identified in this report including, but not limited to those discussed in the sections entitled “Risk Factors” and “Management’s Discussion and Analysis of Financial Conditions and Results of Operations” that could cause actual results to differ. Statements regarding the following subjects are forward-looking by their nature:
|
·
|
our business or investment strategy;
|
|
·
|
our projected operating results;
|
|
·
|
our distribution policy;
|
|
·
|
our liquidity;
|
|
·
|
completion of any pending transactions;
|
|
·
|
our ability to obtain future financing arrangements;
|
|
·
|
our understanding of our competition;
|
|
·
|
market trends; and
|
|
·
|
projected capital expenditures.
|
Forward-looking statements are based on our beliefs, assumptions and expectations, taking into account all information currently available to us. These beliefs, assumptions and expectations are subject to risks and uncertainties and can change as a result of many possible events or factors, not all of which are known to us. If a change occurs, our business, financial condition, liquidity and results of operations may vary materially from those expressed in our forward-looking statements. Readers should not place undue reliance on forward-looking statements. The following factors could cause actual results to vary from our forward-looking statements:
|
·
|
general volatility of the capital markets and the market price of our common shares;
|
|
·
|
changes in our business or investment strategy;
|
|
·
|
availability, terms and deployment of capital;
|
|
·
|
availability of qualified personnel;
|
|
·
|
changes in our industry and the market in which we operate, interest rates, or the general economy;
|
|
·
|
the degree and nature of our competition;
|
|
·
|
financing risks, including the risk of leverage and the corresponding risk of default on our mortgage loans and other debt and potential inability to refinance or extend the maturity of existing indebtedness;
|
|
·
|
the depth and duration of the current economic downturn;
|
|
·
|
levels of spending in the business, travel and leisure industries, as well as consumer confidence;
|
|
·
|
declines in occupancy, average daily rate and RevPAR and other hotel operating metrics;
|
|
·
|
hostilities, including future terrorist attacks, or fear of hostilities that affect travel;
|
|
·
|
financial condition of, and our relationships with, our joint venture partners, third-party property managers, franchisors and hospitality joint venture partners;
|
|
·
|
the degree and nature of our competition;
|
|
·
|
increased interest rates and operating costs;
|
|
·
|
risks associated with potential acquisitions, including the ability to ramp up and stabilize newly acquired hotels with limited or no operating history, and dispositions of hotel properties;
|
|
·
|
risks associated with our development loan portfolio, including the ability of borrowers to repay outstanding principal and accrued interest at maturity;
|
|
·
|
availability of and our ability to retain qualified personnel;
|
|
·
|
our failure to maintain our qualification as a real estate investment trust, or REIT, under the Internal Revenue Code of 1986, as amended, or the Internal Revenue Code;
|
|
·
|
environmental uncertainties and risks related to natural disasters;
|
|
·
|
changes in real estate and zoning laws and increases in real property tax rates; and
|
|
·
|
the factors discussed in Item 1A of this report under the heading “Risk Factors” and in other reports we file with the Securities and Exchange Commission from time to time.
|
These factors are not necessarily all of the important factors that could cause our actual results, performance or achievements to differ materially from those expressed in or implied by any of our forward-looking statements. Other unknown or unpredictable factors, many of which are beyond our control, also could harm our results, performance or achievements.
All forward-looking statements contained in this report are expressly qualified in their entirety by the cautionary statements set forth above. Forward-looking statements speak only as of the date they are made, and we do not undertake or assume any obligation to update publicly any of these statements to reflect actual results, new information or future events, changes in assumptions or changes in other factors affecting forward-looking statements, except to the extent required by applicable laws. If we update one or more forward-looking statements, no inference should be drawn that we will make additional updates with respect to those or other forward-looking statements.
PART I
|
Item 1.
|
Business
|
All brand names, trademarks and service marks appearing in this report are the property of their respective owners. This report may contain registered trademarks owned or licensed to companies other than us, including, but not limited to, Candlewood Suites®, Comfort Inn®, Courtyard® by Marriott®, Fairfield Inn®, Fairfield Inn® by Marriott®, Hampton Inn®, Hawthorne Suites®, Hilton®, Hilton Garden Inn®, Hilton Hotels®, Holiday Inn®, Holiday Inn Express®, Hyatt Summerfield Suites®, Hyatt Place®, Marriott®, Marriott Hotels & Resorts®, Residence Inn®, Residence Inn® by Marriott®, Springhill Suites® and Springhill Suites by Marriott®. None of the owners or licensees of any trademarks contained in this report or any of their respective present and future owners, subsidiaries, affiliates, officers, directors, agents or employees shall have any liability or responsibility for any financial statements or other financial information contained in this report.
OVERVIEW
Hersha Hospitality Trust is a self-advised Maryland real estate investment trust that was organized in 1998 and completed its initial public offering in January of 1999. Our common shares are traded on the New York Stock Exchange under the symbol “HT.” We invest primarily in institutional grade hotels in central business districts, primary suburban office markets and stable destination and secondary markets in the Northeastern United States and select markets on the West Coast. Our primary strategy is to continue to acquire high quality, upscale, mid-scale and extended-stay hotels in metropolitan markets with high barriers to entry in the Northeastern United States and other markets with similar characteristics. We have operated and intend to continue to operate so as to qualify as a REIT for federal income tax reporting purposes.
In addition to the direct acquisition of hotels, historically we have made investments in hotels through joint ventures with strategic partners or through equity contributions, secured mezzanine loans and land leases. Although we may invest in hotels through secured development loans and land leases, we do not expect to continue to originate any new secured mezzanine loans or enter into any new land leases as part of our hotel investment strategy.
We seek to identify acquisition candidates located in markets with economic, demographic and supply dynamics favorable to hotel owners and operators. Through our extensive due diligence process, we select those acquisition targets where we believe selective capital improvements and intensive management will increase the hotel’s ability to attract key demand segments, enhance hotel operations and increase long-term value.
As of December 31, 2010, our portfolio consisted of 62 wholly owned limited and full service properties and interests in 15 limited and full service properties owned through joint venture investments. Of the 15 limited and full service properties owned through our investment in joint ventures, three are consolidated with us for financial reporting purposes. These 77 properties, with a total of 10,262 rooms, are located in Arizona, California, Connecticut, Delaware, District of Columbia, Maryland, Massachusetts, New Jersey, New York, North Carolina, Pennsylvania, Rhode Island and Virginia and operate under leading brands, such as Candlewood Suites®, Comfort Inn®, Courtyard® by Marriott®, Fairfield Inn®, Fairfield Inn® by Marriott®, Hampton Inn®, Hawthorne Suites®, Hilton®, Hilton Garden Inn®, Hilton Hotels®, Holiday Inn®, Holiday Inn Express®, Hyatt Summerfield Suites®, Hyatt Place®, Marriott®, Marriott Hotels & Resorts®, Residence Inn®, Residence Inn® by Marriott®, Springhill Suites® and Springhill Suites by Marriott®. In addition, some of our hotels operate as independent boutique hotels.
We are structured as an umbrella partnership REIT, or UPREIT, and we own our hotels and our investments in joint ventures through our operating partnership, Hersha Hospitality Limited Partnership, for which we serve as general partner. As of December 31, 2010, we owned an approximate 95.8% partnership interest in our operating partnership.
Our wholly-owned hotels are managed by independent, third party qualified management companies, including Hersha Hospitality Management, L.P. (“HHMLP”), a private management company owned by certain of our affiliated trustees and executive officers and other unaffiliated third party investors. Third party qualified management companies, including HHMLP, manage the hotels that we own through joint venture interests. We lease our wholly-owned hotels to 44 New England Management Company (“44 New England”), our wholly-owned taxable REIT subsidiary (“TRS”). Each of the hotels that we own through a joint venture investment is leased to another TRS that is owned by the respective joint venture or an entity owned in part by 44 New England.
Our principal executive office is located at 44 Hersha Drive, Harrisburg, Pennsylvania 17102. Our telephone number is (717) 236-4400. Our website address is www.hersha.com. The information found on, or otherwise accessible through, our website is not incorporated into, and does not form a part of, this report.
AVAILABLE INFORMATION
We make available free of charge through our website (www.hersha.com) our code of ethics, annual report on Form 10-K, quarterly reports on Form 10-Q, current reports on Form 8-K and amendments to those reports filed or furnished pursuant to Section 13(a) or 15(d) of the Securities Exchange Act of 1934, as amended, as soon as reasonably practicable after such documents are electronically filed with, or furnished to, the SEC. The information available on our website is not, and shall not be deemed to be, a part of this report or incorporated into any other filings we make with the SEC.
INVESTMENT IN HOTEL PROPERTIES
Our operating strategy focuses on increasing hotel performance for our portfolio. The key elements of this strategy are:
|
|
·
|
working together with our hotel management companies to increase occupancy levels and revenue per available room, or "RevPAR", through active property-level management, including intensive marketing efforts to tour groups, corporate and government extended stay customers and other wholesale customers and expanded yield management programs, which are calculated to better match room rates to room demand; and
|
|
|
·
|
maximizing our earnings by managing costs and positioning our hotels to capitalize on increased demand in the high quality, upper-upscale, upscale, mid-scale and extended-stay lodging segment, which we believe can be expected to follow from improving economic conditions.
|
As of December 31, 2010, our portfolio included 62 wholly owned limited and full service properties, with a total of 7,686 rooms.
INVESTMENT IN JOINT VENTURES
In addition to the direct acquisition of hotels, we may make investments in hotels through joint ventures with strategic partners. We have historically identified acquisition candidates located in markets with economic, demographic and supply dynamics favorable to hotel owners and operators. We are not actively pursuing additional joint venture investments.
As of December 31, 2010, we maintain ownership interests in 15 hotels with a total of 2,576 rooms through joint ventures with third parties. Of the 15 hotels owned through interests in joint ventures, 3 are consolidated for financial reporting purposes.
DEVELOPMENT LOANS
We take advantage of our relationships with hotel developers, including entities controlled by our officers or affiliated trustees, to identify development and renovation projects that may be attractive to us. While these developers have borne the risk of construction, we have historically invested in hotel development projects by providing secured mortgage or mezzanine financing to hotel developers. In many instances, we maintain a first right of refusal or right of first offer to purchase, at fair market value, the hotel for which we have provided development loan financing. We are not actively pursuing additional development loan investments.
As of December 31, 2010, we had an investment of $41.7 million in six loans, three loans which are collateralized by operating hotels and three of which relate to hotel development projects.
ACQUISITIONS
Our primary growth strategy is to selectively acquire high quality branded upper-upscale, upscale, mid-scale and extended-stay hotels in metropolitan markets with high barriers-to-entry and independent boutique hotels in similar markets. Through our due diligence process, we select those acquisition targets where we believe selective capital improvements and intensive management will increase the hotel’s ability to attract key demand segments, enhance hotel operations and increase long-term value. We believe that current market conditions are creating opportunities to acquire hotels at attractive prices. In executing our disciplined acquisition program, we will consider acquiring hotels that meet the following additional criteria:
|
|
·
|
nationally-franchised hotels operating under popular brands, such as Marriott Hotels & Resorts, Hilton Hotels, Courtyard by Marriott, Residence Inn by Marriott, Spring Hill Suites by Marriott, Hilton Garden Inn, Hampton Inn, Sheraton Hotels & Resorts, DoubleTree, Embassy Suites, Hyatt Summerfield Suites, Hyatt Place, TownePlace Suites and Holiday Inn Express;
|
|
|
·
|
hotels in locations with significant barriers-to-entry, such as high development costs, limited availability of land and lengthy entitlement processes;
|
|
|
·
|
hotels in our target markets where we can realize operating efficiencies and economies of scale; and
|
|
|
·
|
independent boutique hotels in similar markets
|
Since our initial public offering in January 1999 and through December 31, 2010, we have acquired, wholly or through joint ventures, a total of 92 hotels, including 28 hotels acquired from entities controlled by certain of our affiliated trustees and executive officers. Of the 28 acquisitions from entities controlled by certain of our affiliated trustees and executive officers, 26 were newly constructed or substantially renovated by these entities prior to our acquisition. Because we do not develop properties, we take advantage of our relationships with entities that are developing or substantially renovating hotels, including entities controlled by certain of our affiliated trustees and executive officers, to identify future hotel acquisitions that we believe may be attractive to us. We intend to continue to acquire hotels from entities controlled by certain of our affiliated trustees and executive officers if approved by a majority of our independent trustees in accordance with our related party transaction policy.
DISPOSITIONS
We evaluate our hotels on a periodic basis to determine if these hotels continue to satisfy our investment criteria. We may sell hotels opportunistically based upon management’s forecast and review of the cash flow potential for the hotel and re-deploy the proceeds into debt reduction or acquisitions of hotels. We utilize several criteria to determine the long-term potential of our hotels. Hotels are identified for sale based upon management’s forecast of the strength of the hotel’s cash flows and its ability to remain accretive to our portfolio. Our decision to sell an asset is often predicated upon the size of the hotel, strength of the franchise, property condition and related costs to renovate the property, strength of market demand generators, projected supply of hotel rooms in the market, probability of increased valuation and geographic profile of the hotel. All asset sales are comprehensively reviewed by our Board of Trustees, including our independent trustees. A majority of the independent trustees must approve the terms of all asset sales. During the time since our initial public offering in 1999 through December 31, 2010, we have sold a total of 23 hotels.
FINANCING
The relative stability of the mid-scale, upscale and upper-upscale segments of the limited service lodging industry allows us to increase returns to our shareholders through the prudent application of leverage. We may employ a higher amount of leverage at a specific hotel to achieve a desired return when warranted by that hotel's historical operating performance and may use greater leverage across our portfolio if and when warranted by prevailing market conditions.
PROPERTY MANAGEMENT
We work closely with our hotel management companies to operate our hotels and increase same hotel performance for our portfolio. Through our TRS and our investment in joint ventures, we have retained the following management companies to operate our hotels, as of December 31, 2010:
|
Wholly Owned
|
Joint Ventures
|
Total
|
||||||||||||||||||||||
|
Manager
|
Hotels
|
Rooms
|
Hotels
|
Rooms
|
Hotels
|
Rooms
|
||||||||||||||||||
|
HHMLP
|
55 | 6,681 | 4 | 586 | 59 | 7,267 | ||||||||||||||||||
|
Waterford Hotel Group
|
- | - | 9 | 1,708 | 9 | 1,708 | ||||||||||||||||||
|
LodgeWorks
|
7 | 1,005 | - | - | 7 | 1,005 | ||||||||||||||||||
|
Jiten Management
|
- | - | 2 | 282 | 2 | 282 | ||||||||||||||||||
|
Total
|
62 | 7,686 | 15 | 2,576 | 77 | 10,262 | ||||||||||||||||||
Each management agreement provides for a set term and is subject to early termination upon the occurrence of defaults and certain other events described therein. As required under the REIT qualification rules, all managers, including HHMLP, must qualify as an “eligible independent contractor” during the term of the management agreements.
Under the management agreements, the manager generally pays the operating expenses of our hotels. All operating expenses or other expenses incurred by the manager in performing its authorized duties are reimbursed or borne by our TRS to the extent the operating expenses or other expenses are incurred within the limits of the applicable approved hotel operating budget. Our managers are not obligated to advance any of their own funds for operating expenses of a hotel or to incur any liability in connection with operating a hotel.
For their services, the managers receive a base management fee, and if a hotel meets and exceeds certain thresholds, an additional incentive management fee. The base management fee for a hotel is due monthly and is generally equal to 3% of the gross revenues associated with that hotel for the related month.
CAPITAL IMPROVEMENTS, RENOVATION AND REFURBISHMENT
We have established capital reserves for our hotels to maintain the hotels in a condition that complies with their respective franchise licenses among other requirements. In addition, we may upgrade the hotels in order to capitalize on opportunities to increase revenue, and, as deemed necessary by our management, to seek to meet competitive conditions and preserve asset quality. We will also renovate hotels when we believe the investment in renovations will provide an attractive return to us through increased revenues and profitability and is in the best interests of our shareholders. We maintain a capital expenditures policy by which replacements and renovations are monitored to determine whether they qualify as capital improvements. All items that are deemed to be repairs and maintenance costs are expensed and recorded in Hotel Operating Expenses in the Consolidated Statements of Operations.
OPERATING PRACTICES
Our hotel managers utilize centralized accounting and data processing systems, which facilitate financial statement and budget preparation, payroll management, quality control and other support functions for the on-site hotel management team. Our hotel managers also provide centralized control over purchasing and project management (which can create economies of scale in purchasing) while emphasizing local discretion within specific guidelines.
DISTRIBUTIONS
We have made forty-eight consecutive quarterly distributions to the holders of our common shares since our initial public offering in January 1999 and intend to continue to make regular quarterly distributions to our shareholders as approved by our Board of Trustees. The following table sets forth distribution information for the last two calendar years.
|
Quarter to which Distribution Relates
|
Class A
Common Shares and Limited Partnership Unit Per Share Distribution Amount
|
Record Date
|
Payment Date
|
Series A Preferred
Per Share Distribution Amount
|
Record Date
|
Payment Date
|
|||||||||
|
2010
|
|||||||||||||||
|
Fourth Quarter
|
$ | 0.05 |
1/4/2011
|
1/17/2011
|
$ | 0.50 |
1/1/2011
|
1/17/2011
|
|||||||
|
Third Quarter
|
$ | 0.05 |
9/30/2010
|
10/15/2010
|
$ | 0.50 |
10/1/2010
|
10/15/2010
|
|||||||
|
Second Quarter
|
$ | 0.05 |
6/30/2010
|
7/15/2010
|
$ | 0.50 |
7/1/2010
|
7/15/2010
|
|||||||
|
First Quarter
|
$ | 0.05 |
4/1/2010
|
4/15/2010
|
$ | 0.50 |
4/1/2010
|
4/15/2010
|
|||||||
|
2009
|
|||||||||||||||
|
Fourth Quarter
|
$ | 0.05 |
1/4/2010
|
1/15/2010
|
$ | 0.50 |
1/1/2010
|
1/15/2010
|
|||||||
|
Third Quarter
|
$ | 0.05 |
9/30/2009
|
10/15/2009
|
$ | 0.50 |
10/1/2009
|
10/15/2009
|
|||||||
|
Second Quarter
|
$ | 0.05 |
6/30/2009
|
7/15/2009
|
$ | 0.50 |
7/1/2009
|
7/15/2009
|
|||||||
|
First Quarter
|
$ | 0.18 |
3/31/2009
|
4/15/2009
|
$ | 0.50 |
4/1/2009
|
4/15/2009
|
|||||||
Our Board of Trustees will determine the amount of our future distributions in its sole discretion and its decision will depend on a number of factors, including the amount of funds from operations, our partnership’s financial condition, debt service requirements, capital expenditure requirements for our hotels, the annual distribution requirements under the REIT provisions of the Internal Revenue Code and such other factors as the trustees deem relevant. Our ability to make distributions will depend on the profitability of and cash flow available from our hotels. There can be no assurance we will continue to pay distributions at the rates above or any other rate. Additionally, we may, if necessary and allowable, pay taxable dividends of our shares or debt securities to meet the distribution requirements. There are no assurances we will be able to continue to make quarterly distributions at the current rate.
SEASONALITY
Our hotels’ operations historically have been seasonal in nature, reflecting higher occupancy rates during the second and third quarters. This seasonality causes fluctuations in our quarterly operating revenues and profitability. Hotel revenue is generally greater in the second and third quarters than in the first and fourth quarters.
COMPETITION
The upper-upscale, upscale and mid-scale, limited service segments of the hotel business are highly competitive. Among many other factors, our hotels compete on the basis of location, room rates, quality, service levels, reputation, and reservation systems. There are many competitors in our market segments and new hotels are routinely being constructed. Additions to supply create new competitors, in some cases without corresponding increases in demand for hotel rooms.
We also compete for hotel acquisitions with entities that have investment objectives similar to ours. This competition could limit the number of suitable investment opportunities offered to us. It may also increase the bargaining power of property owners seeking to sell to us, making it more difficult for us to acquire new properties on attractive terms.
EMPLOYEES
As of December 31, 2010, we had 28 employees who were principally engaged in managing the affairs of the company unrelated to property management. Our relations with our employees are satisfactory.
FRANCHISE AGREEMENTS
We believe that the public’s perception of quality associated with a franchisor is an important feature in the operation of a hotel. Franchisors provide a variety of benefits for franchisees, which include national advertising, publicity and other marketing programs designed to increase brand awareness, training of personnel, continuous review of quality standards and centralized reservation systems. Most of our hotels operate under franchise licenses from national hotel franchisors, including:
|
Franchisor
|
Franchises
|
|
|
Marriott International
|
Marriott, Residence Inn, Springhill Suites, Courtyard by Marriott, Fairfield Inn, TownePlace Suites
|
|
|
Hilton Hotels Corporation
|
Hilton, Hilton Garden Inn, Hampton Inn, Homewood Suites
|
|
|
Intercontinental Hotel Group
|
Holiday Inn, Holiday Inn Express, Holiday Inn Express & Suites, Candlewood Suites
|
|
|
Hyatt Hotels Corporation
|
Hyatt Summerfield Suites, Hawthorn Suites
|
|
|
Starwood Hotels
|
Sheraton Hotels
|
|
|
Choice Hotels International
|
Comfort Inn, Comfort Suites, Sleep Inn, Mainstay Suites
|
We anticipate that most of the hotels in which we invest will be operated pursuant to franchise licenses.
The franchise licenses generally specify certain management, operational, record-keeping, accounting, reporting and marketing standards and procedures with which the franchisee must comply. The franchise licenses obligate our lessees to comply with the franchisors’ standards and requirements with respect to training of operational personnel, safety, maintaining specified insurance, the types of services and products ancillary to guest room services that may be provided by our lessees, display of signage, and the type, quality and age of furniture, fixtures and equipment included in guest rooms, lobbies and other common areas. In general, the franchise licenses require us to pay the franchisor a fee typically ranging between 6.0% and 9.3% of our hotel revenues.
TAX STATUS
We have elected to be taxed as a REIT under Sections 856 through 860 of the Internal Revenue Code, commencing with our taxable year ended December 31, 1999. As long as we qualify for taxation as a REIT, we generally will not be subject to federal income tax on the portion of our income that is currently distributed to our shareholders. If we fail to qualify as a REIT in any taxable year and do not qualify for certain statutory relief provisions, we will be subject to federal income tax (including any applicable alternative minimum tax) on our taxable income at regular corporate tax rates. Even if we qualify for taxation as a REIT, we will be subject to certain state and local taxes on our income and property and to federal income and excise taxes on our undistributed income.
We own interests in several TRSs. We may own up to 100% of the stock of a TRS. A TRS is a taxable corporation that may lease hotels under certain circumstances, provide services to us, and perform activities such as third party management, development, and other independent business activities. Overall, no more than 25% of the value of our assets may consist of securities of one or more TRSs. In addition, no more than 25% of our gross income for any year may consist of dividends from one or more TRSs and income from certain non-real estate related sources.
A TRS is permitted to lease hotels from us as long as the hotels are operated on behalf of the TRS by a third party manager that qualifies as an "eligible independent contractor." To qualify for that treatment, the manager must satisfy the following requirements:
|
|
1.
|
such manager is, or is related to a person who is, actively engaged in the trade or business of operating “qualified lodging facilities” for any person unrelated to us and the TRS;
|
|
|
2.
|
such manager does not own, directly or indirectly, more than 35% of our shares;
|
|
|
3.
|
no more than 35% of such manager is owned, directly or indirectly, by one or more persons owning 35% or more of our shares; and
|
|
|
4.
|
we do not directly or indirectly derive any income from such manager.
|
The deductibility of interest paid or accrued by a TRS to us is limited to assure that the TRS is subject to an appropriate level of corporate taxation. A 100% excise tax is imposed on transactions between a TRS and us or our tenants that are not on an arm’s-length basis.
FINANCIAL INFORMATION ABOUT SEGMENTS
We are in the business of acquiring equity interests in hotels, and we manage our hotels as individual operating segments that meet the aggregation criteria and are therefore disclosed as one reportable segment. See “Note 1 Organization and Summary of Significant Accounting Policies” in Item 8 of this Annual Report on Form 10-K for segment financial information.
|
Item 1A.
|
Risk Factors
|
You should carefully consider the following risks, together with the other information included in this Annual Report on Form 10-K. If any of the following risks actually occur, our business, financial condition or results of operations may suffer. As a result, the trading price of our securities could decline, and you may lose all or part of any investment you have in our securities.
RISKS RELATED TO THE HOTEL INDUSTRY
Current economic conditions have adversely impacted the lodging industry.
The U.S. economy has been negatively impacted by financial industry turmoil, high unemployment and poor consumer sentiment over the past two years. As a result, the lodging industry had experienced negative growth which had a negative impact on our results of operations and financial condition. A return to these market conditions could reduce revenues of our hotels and could adversely affect our ability to make distributions to our shareholders.
Our hotels are subject to general hotel industry operating risks, which may impact our ability to make distributions to shareholders.
Our hotels are subject to all operating risks common to the hotel industry. The hotel industry has experienced volatility in the past, as have our hotels, and there can be no assurance that such volatility will not occur in the future. These risks include, among other things: competition from other hotels; over-building in the hotel industry that could adversely affect hotel revenues and hotel values; increases in operating costs due to inflation and other factors, which may not be offset by increased room rates; reduction in business and commercial travel and tourism; strikes and other labor disturbances of hotel employees; increases in energy costs and other expenses of travel; adverse effects of general and local economic conditions; and adverse political conditions. These factors could reduce revenues of the hotels and adversely affect our ability to make distributions to our shareholders.
The value of our hotels depends on conditions beyond our control.
Our hotels are subject to varying degrees of risk generally incident to the ownership of hotels. The underlying value of our hotels, our income and ability to make distributions to our shareholders are dependent upon the operation of the hotels in a manner sufficient to maintain or increase revenues in excess of operating expenses. Hotel revenues may be adversely affected by adverse changes in national economic conditions, adverse changes in local market conditions due to changes in general or local economic conditions and neighborhood characteristics, competition from other hotels, changes in interest rates and in the availability, cost and terms of mortgage funds, the impact of present or future environmental legislation and compliance with environmental laws, the ongoing need for capital improvements, particularly in older structures, changes in real estate tax rates and other operating expenses, adverse changes in governmental rules and fiscal policies, civil unrest, acts of terrorism, acts of God, including earthquakes, hurricanes and other natural disasters, acts of war, adverse changes in zoning laws, and other factors that are beyond our control. In particular, general and local economic conditions may be adversely affected by the previous terrorist incidents in New York and Washington, D.C. Our management is unable to determine the long-term impact, if any, of these incidents or of any acts of war or terrorism in the United States or worldwide, on the U.S. economy, on us or our hotels or on the market price of our common shares.
Our investments are concentrated in a single segment of the hotel industry.
Our primary business strategy is to continue to acquire high quality, upscale and mid-scale limited service and extended-stay hotels in metropolitan markets with high barriers to entry in the Northeastern United States and other markets with similar characteristics. We are subject to risks inherent in concentrating investments in a single industry and in a specific market segment within that industry. The adverse effect on amounts available for distribution to shareholders resulting from a downturn in the hotel industry in general or the mid-scale segment in particular could be more pronounced than if we had diversified our investments outside of the hotel industry or in additional hotel market segments.
Operating costs and capital expenditures for hotel renovation may be greater than anticipated and may adversely impact distributions to shareholders.
Hotels generally have an ongoing need for renovations and other capital improvements, particularly in older structures, including periodic replacement of furniture, fixtures and equipment. Under the terms of our management agreements, we are obligated to pay the cost of expenditures for items that are classified as capital items under GAAP that are necessary for the continued operation of our hotels.
If these expenses exceed our estimate, the additional cost could have an adverse effect on amounts available for distribution to shareholders. In addition, we may acquire hotels in the future that require significant renovation. Renovation of hotels involves certain risks, including the possibility of environmental problems, construction cost overruns and delays, uncertainties as to market demand or deterioration in market demand after commencement of renovation and the emergence of unanticipated competition from hotels.
The hotel industry is highly competitive.
The hotel industry is highly competitive. Our hotels compete with other existing and new hotels in their geographic markets. Many of our competitors have substantially greater marketing and financial resources than we do. Effective marketing by our competitors may reduce our hotel revenue and adversely impact our ability to make distributions to our shareholders.
Risks of operating hotels under franchise licenses, which may be terminated or not renewed, may impact our ability to make distributions to shareholders.
The continuation of the franchise licenses is subject to specified operating standards and other terms and conditions. All of the franchisors of our hotels periodically inspect our hotels to confirm adherence to their operating standards. The failure to maintain such standards or to adhere to such other terms and conditions could result in the loss or cancellation of the applicable franchise license. It is possible that a franchisor could condition the continuation of a franchise license on the completion of capital improvements that the trustees determine are too expensive or otherwise not economically feasible in light of general economic conditions, the operating results or prospects of the affected hotel. In that event, the trustees may elect to allow the franchise license to lapse or be terminated.
There can be no assurance that a franchisor will renew a franchise license at each option period. If a franchisor terminates a franchise license, we may be unable to obtain a suitable replacement franchise, or to successfully operate the hotel independent of a franchise license. The loss of a franchise license could have a material adverse effect upon the operations or the underlying value of the related hotel because of the loss of associated name recognition, marketing support and centralized reservation systems provided by the franchisor. Our loss of a franchise license for one or more of the hotels could have a material adverse effect on our partnership’s revenues and our amounts available for distribution to shareholders.
The hotel industry is seasonal in nature.
The hotel industry is seasonal in nature. Generally, hotel revenues are greater in the second and third quarters than in the first and fourth quarters. Our hotels’ operations historically reflect this trend. As a result, our results of operations may vary on a quarterly basis, impairing comparability of operating data and financial performance on a quarter to quarter basis.
Future terrorist attacks or changes in terror alert levels could adversely affect travel and hotel demand.
Previous terrorist attacks and subsequent terrorist alerts have adversely affected the U.S. travel and hospitality industries over the past several years, often disproportionately to the effect on the overall economy. The impact that terrorist attacks in the U.S. or elsewhere could have on domestic and international travel and our business in particular cannot be determined but any such attacks or the threat of such attacks could have a material adverse effect on our business, our ability to finance our business, our ability to insure our properties and our results of operations and financial condition.
The outbreak of influenza or other widespread contagious disease could reduce travel and adversely affect hotel demand.
The widespread outbreak of infectious or contagious disease in the U.S., such as the H1N1 influenza (swine flu), could reduce travel and adversely affect the hotel industry generally and our business in particular.
RISKS RELATING TO OUR BUSINESS AND OPERATIONS
A general economic recession or depression could have a serious adverse economic impact on us.
In 2010, general worldwide economic conditions suffered due to sequential effects of the sub prime lending crisis, general credit market crisis, collateral effects on the finance and banking industries, concerns about inflation, slower economic activity, decreased consumer confidence, reduced corporate profits and capital spending, adverse business conditions and liquidity concerns. Our business plans for 2011 and beyond depend on the general state of the global economy and specifically on the economies of the locations of our hotels. We cannot assure you that favorable economic conditions will exist in the future. A prolonged general economic recession could have a serious adverse economic impact on us.
We face risks associated with the use of debt, including refinancing risk.
At December 31, 2010, we had outstanding long-term debt, excluding capital leases, of $694.7 million. We may borrow additional amounts from the same or other lenders in the future. Some of these additional borrowings may be secured by our hotels. Our declaration of trust (as amended and restated, our “Declaration of Trust”) does not limit the amount of indebtedness we may incur. We cannot assure you that we will be able to meet our debt service obligations and, to the extent that we cannot, we risk the loss of some or all of our hotels to foreclosure. Our indebtedness contains various financial and non-financial event of default covenants customarily found in financing arrangements. Our mortgages payable typically require that specified debt service coverage ratios be maintained with respect to the financed properties before we can exercise certain rights under the loan agreements relating to such properties. If the specified criteria are not satisfied, the lender may be able to escrow cash flow from the applicable hotels.
There is also a risk that we may not be able to refinance existing debt or that the terms of any refinancing will not be as favorable as the terms of the existing debt. If principal payments due at maturity cannot be refinanced, extended or repaid with proceeds from other sources, such as new equity capital or sales of properties, we may be forced to use operating income to repay such indebtedness, which would have a material adverse effect on our cash available for distribution in years when significant “balloon” payments come due. In some such cases, we may lose the applicable hotels to foreclosure. This risk is particularly significant. See Item 7A for a detailed schedule of debt principal repayments.
Tightening credit markets have made financing development projects and acquiring new hotel properties more difficult.
The turmoil in the financial industry has caused credit to significantly tighten making it more difficult for hotel developers to obtain financing for development projects or for hotels without an operating history. This could have a negative impact on the collectability of our portfolio of development loans receivable, which as of December 31, 2010 was approximately $41.7 million, if the hotel developers are unable to find financing to repay our development loans when development is complete. In addition, the tightening credit markets have made it more difficult to finance the acquisition of new hotel properties. These factors could have a negative impact on our future results of operations and financial condition.
If we cannot access the capital markets, we may not be able to grow the Company at our historical growth rates.
We may not be able to access the capital markets to obtain capital to fund future acquisitions and investments. The market for real estate related debt and equity capital could endure a prolonged period of volatility which may limit our ability to access new capital for acquisitions, investments and joint ventures. Because we must distribute annually at least 90% of our taxable income each year to maintain our qualification as a REIT, our ability to rely upon income or cash flow from operations to finance our growth and acquisition activities will be limited. Accordingly, were we unable to obtain funds from borrowings or the capital markets to finance our growth and acquisition activities, our ability to grow could be curtailed, amounts available for distribution to shareholders could be adversely affected and we could be required to reduce distributions.
We face high levels of competition for the acquisition of hotel properties and other assets, which may impede our ability to make future acquisitions or may increase the cost of these acquisitions.
We face competition for investment opportunities in high quality, upscale and mid-scale limited service and extended-stay hotels from entities organized for purposes substantially similar to our objectives, as well as other purchasers of hotels. We compete for such investment opportunities with entities that have substantially greater financial resources than we do, including access to capital or better relationships with franchisors, sellers or lenders. Our competitors may generally be able to accept more risk than we can manage prudently and may be able to borrow the funds needed to acquire hotels. Competition may generally reduce the number of suitable investment opportunities offered to us and increase the bargaining power of property owners seeking to sell.
We do not operate our hotels and, as a result, we do not have complete control over implementation of our strategic decisions.
In order for us to satisfy certain REIT qualification rules, we cannot directly or indirectly operate or manage any of our hotels. Instead, we must engage an independent management company to operate our hotels. As of December 31, 2010, our TRSs and our joint venture partnerships have engaged independent management companies as the property managers for all of our wholly owned hotels leased to our TRSs and the respective hotels for the joint ventures, as required by the REIT qualification rules. The management companies operating the hotels make and implement strategic business decisions with respect to these hotels, such as decisions with respect to the repositioning of a franchise or food and beverage operations and other similar decisions. Decisions made by the management companies operating the hotels may not be in the best interests of a particular hotel or of our company. Accordingly, we cannot assure you that the management companies will operate our hotels in a manner that is in our best interests. In addition, the financial condition of the management companies could impact their future ability to operate our hotels.
Our acquisitions may not achieve expected performance, which may harm our financial condition and operating results.
We anticipate that acquisitions will largely be financed with the net proceeds of securities offerings and through externally generated funds such as borrowings under credit facilities and other secured and unsecured debt financing. Acquisitions entail risks that investments will fail to perform in accordance with expectations and that estimates of the cost of improvements necessary to acquire and market properties will prove inaccurate, as well as general investment risks associated with any new real estate investment. As a result, we may not be able to generate enough cash from these hotels to make debt service payments or pay operating expenses.
Acquisition of hotels with limited operating history may not achieve desired results.
Many of our recent acquisitions are newly-developed hotels. Newly-developed or newly-renovated hotels do not have the operating history that would allow our management to make pricing decisions in acquiring these hotels based on historical performance. The purchase prices of these hotels are based upon management’s expectations as to the operating results of such hotels, subjecting us to risks that such hotels may not achieve anticipated operating results or may not achieve these results within anticipated time frames. As a result, we may not be able to generate enough cash flow from these hotels to make debt payments or pay operating expenses. In addition, room revenues may be less than that required to provide us with our anticipated return on investment. In either case, the amounts available for distribution to our shareholders could be reduced.
We may be unable to integrate acquired hotels into our operations or otherwise manage our planned growth, which may adversely affect our operating results.
We have recently acquired a substantial number of hotels. We cannot assure you that we or HHMLP will be able to adapt our management, administrative, accounting and operational systems and arrangements, or hire and retain sufficient operational staff to successfully integrate these investments into our portfolio and manage any future acquisitions of additional assets without operational disruptions or unanticipated costs. Acquisition of hotels generates additional operating expenses that we will be required to pay. As we acquire additional hotels, we will be subject to the operational risks associated with owning new lodging properties. Our failure to integrate successfully any future acquisitions into our portfolio could have a material adverse effect on our results of operations and financial condition and our ability to pay dividends to shareholders or make other payments in respect of securities issued by us.
Most of our hotels are located in the Eastern United States and many are located in the area from Washington, DC to Boston, MA, which may increase the effect of any regional or local economic conditions.
Most of our hotels are located in the area from Washington, DC to Boston, MA. Forty-one of our wholly owned hotels and eleven of our joint venture hotels are located in the states of Pennsylvania, New Jersey, New York, Rhode Island and Connecticut. As a result, regional or localized adverse events or conditions, such as an economic recession, could have a significant adverse effect on our operations, and ultimately on the amounts available for distribution to shareholders.
Our ownership of hotels in the New York City market exposes us to concentration risk, which may lead to increased volatility in our results of operations.
Our consolidated portfolio of hotels in New York City have historically accounted for approximately 35%-40% of our consolidated earnings before income taxes, depreciation and amortization, or EBITDA, and this percentage is expected to increase going forward with our 2010 acquisitions located in the Times Square and Wall Street area. The three Times Square hotels are newly-constructed hotels that opened for business in July 2009 and have limited operating history. The Wall Street hotel was also newly-constructed and has limited operating history prior to our purchase. As a result, our ability to forecast future operations accurately is limited and there is considerable risk the Times Square and Wall Street hotels may not generate sufficient revenue to cover the costs of their operations or provide attractive returns on our investment. The operations of our consolidated portfolio of hotels in New York City will have a material impact on our overall results of operations. Concentration risk with respect to our ownership of hotels in the New York City market may lead to increased volatility in our overall results of operations. Our overall results of operations may be adversely affected and our ability to pay distributions to our shareholders could be negatively impacted in the event:
|
|
·
|
the current downturn in lodging fundamentals is more severe or prolonged in New York City compared to the United States as a whole;
|
|
|
·
|
negative economic conditions generally are more severe or prolonged in New York City compared to other areas, due to concentration of the financial industry in New York or otherwise;
|
|
|
·
|
we adopt an unsuccessful strategy to ramp up and stabilize operations at our newly acquired New York hotels; or
|
|
|
·
|
New York City is impacted by other unforeseen events beyond our control, including, among others, terrorist attacks and travel related health concerns including pandemics and epidemics such as H1N1 influenza (swine flu), avian bird flu and SARS.
|
We own a limited number of hotels and significant adverse changes at one hotel may impact our ability to make distributions to shareholders.
As of December 31, 2010, our portfolio consisted of 62 wholly-owned limited and full service properties and joint venture investments in 15 hotels with a total of 10,262 rooms. However, certain larger hotels or hotels in certain locations disproportionately impact our performance. Accordingly, significant adverse changes in the operations of any one of these hotels could have a material adverse effect on our financial performance and on our ability to make expected distributions to our shareholders.
We focus on acquiring hotels operating under a limited number of franchise brands, which creates greater risk as the investments are more concentrated.
We place particular emphasis in our acquisition strategy on hotels similar to our current hotels. We invest in hotels operating under a few select franchises and therefore will be subject to risks inherent in concentrating investments in a particular franchise brand, which could have an adverse effect on amounts available for distribution to shareholders. These risks include, among others, the risk of a reduction in hotel revenues following any adverse publicity related to a specific franchise brand or the failure of the franchisor to maintain a certain brand.
We depend on key personnel.
We depend on the services of our existing senior management team, including Jay H. Shah, Neil H. Shah, Ashish R. Parikh and Michael R. Gillespie, to carry out our business and investment strategies. As we expand, we will continue to need to attract and retain qualified additional senior management. We have employment agreements with certain of our senior management; however, the employment agreements may be terminated under certain circumstances. The termination of an employment agreement and the loss of the services of any of our key management personnel, or our inability to recruit and retain qualified personnel in the future, could have an adverse effect on our business and financial results.
We may engage in hedging transactions, which can limit our gains and increase exposure to losses.
We may enter into hedging transactions intended to protect us from the effects of interest rate fluctuations on floating rate debt and also intended to protect our portfolio of mortgage assets from interest rate and prepayment rate fluctuations. Our hedging transactions may include entering into interest rate swaps, caps, and floors, options to purchase such items, and futures and forward contracts. Hedging activities may not have the desired beneficial impact on our results of operations or financial condition. No hedging activity can completely insulate us from the risks associated with changes in interest rates and prepayment rates. Moreover, interest rate hedging could fail to protect us or could adversely affect us because, among other things:
|
|
·
|
Available interest rate hedging may not correspond directly with the interest rate risk for which protection is sought.
|
|
|
·
|
The duration of the hedge may not match the duration of the related liability.
|
|
|
·
|
The party at risk in the hedging transaction may default on its obligation to pay.
|
|
|
·
|
The credit quality of the party owing money on the hedge may be downgraded to such an extent that it impairs our ability to sell or assign our side of the hedging transaction.
|
|
|
·
|
The value of derivatives used for hedging may be adjusted from time to time in accordance with accounting rules to reflect changes in fair value.
|
Downward adjustments, or “mark-to-market losses,” relating to hedging instruments may reduce our shareholders’ equity.
Hedging involves risk and typically involves costs, including transaction costs, which may reduce returns on our investments. These costs increase as the period covered by the hedging increases and during periods of rising and volatile interest rates. These costs will also limit the amount of cash available for distribution to shareholders. The REIT qualification rules may also limit our ability to enter into hedging transactions. We generally intend to hedge as much of our interest rate risk as our management determines is in our best interests given the cost of such hedging transactions and the requirements applicable to REITs. If we are unable to hedge effectively because of the cost of such hedging transactions or the limitations imposed by the REIT rules, we will face greater interest risk exposure than may be commercially prudent.
RISKS RELATED TO REAL ESTATE INVESTMENT GENERALLY
Illiquidity of real estate investments could significantly impede our ability to respond to adverse changes in the performance of our properties and harm our financial condition.
Real estate investments are relatively illiquid. Our ability to vary our portfolio in response to changes in operating, economic and other conditions will be limited. No assurances can be given that the fair market value of any of our hotels will not decrease in the future.
If we suffer losses that are not covered by insurance or that are in excess of our insurance coverage limits, we could lose investment capital and anticipated profits.
We require comprehensive insurance to be maintained on each of the our hotels, including liability and fire and extended coverage in amounts sufficient to permit the replacement of the hotel in the event of a total loss, subject to applicable deductibles. However, there are certain types of losses, generally of a catastrophic nature, such as earthquakes, floods, hurricanes and acts of terrorism, that may be uninsurable or not economically insurable. Inflation, changes in building codes and ordinances, environmental considerations and other factors also might make it impracticable to use insurance proceeds to replace the applicable hotel after such applicable hotel has been damaged or destroyed. Under such circumstances, the insurance proceeds received by us might not be adequate to restore our economic position with respect to the applicable hotel. If any of these or similar events occur, it may reduce the return from the attached property and the value of our investment.
Real estate is subject to property taxes.
Each hotel is subject to real and personal property taxes. The real and personal property taxes on hotel properties in which we invest may increase as property tax rates change and as the properties are assessed or reassessed by taxing authorities. Many state and local governments are facing budget deficits that have led many of them, and may in the future lead others to, increase assessments and/or taxes. If property taxes increase, our ability to make expected distributions to our shareholders could be adversely affected.
Environmental matters could adversely affect our results.
Operating costs may be affected by the obligation to pay for the cost of complying with existing environmental laws, ordinances and regulations, as well as the cost of future legislation. Under various federal, state and local environmental laws, ordinances and regulations, a current or previous owner or operator of real property may be liable for the costs of removal or remediation of hazardous or toxic substances on, under or in such property. Such laws often impose liability whether or not the owner or operator knew of, or was responsible for, the presence of such hazardous or toxic substances. The cost of complying with environmental laws could materially adversely affect amounts available for distribution to shareholders. Phase I environmental assessments have been obtained on all of our hotels. Nevertheless, it is possible that these reports do not reveal all environmental liabilities or that there are material environmental liabilities of which we are unaware.
Costs associated with complying with the Americans with Disabilities Act may adversely affect our financial condition and operating results.
Under the Americans with Disabilities Act of 1993 (ADA), all public accommodations are required to meet certain federal requirements related to access and use by disabled persons. While we believe that our hotels are substantially in compliance with these requirements, a determination that we are not in compliance with the ADA could result in imposition of fines or an award of damages to private litigants. In addition, changes in governmental rules and regulations or enforcement policies affecting the use and operation of the hotels, including changes to building codes and fire and life-safety codes, may occur. If we were required to make substantial modifications at the hotels to comply with the ADA or other changes in governmental rules and regulations, our ability to make expected distributions to our shareholders could be adversely affected.
RISKS RELATING TO CONFLICTS OF INTEREST
Due to conflicts of interest, many of our existing agreements may not have been negotiated on an arm’s-length basis and may not be in our best interest.
Some of our officers and affiliated trustees have ownership interests in HHMLP and in entities with which we have entered into transactions, including hotel acquisitions and dispositions and certain financings. Consequently, the terms of our agreements with those entities, including hotel contribution or purchase agreements, the Option Agreement between our operating partnership and some of the affiliated trustees and officers and our property management agreements with HHMLP may not have been negotiated on an arm’s-length basis and may not be in the best interest of all our shareholders.
Conflicts of interest with HHMLP may result in decisions that do not reflect our best interests.
The following officers and affiliated trustees own collectively approximately 37% of HHMLP: Hasu P. Shah, Jay H. Shah, Neil H. Shah, David L. Desfor and Kiran P. Patel. Conflicts of interest may arise with respect to the ongoing operation of our hotels including, but not limited to, the enforcement of the contribution and purchase agreements, the Option Agreement and our property management agreements with HHMLP. These officers and affiliated trustees also make decisions for our company with respect to property management. Consequently, these officers and affiliated trustees may not act solely in the best interests of our shareholders relating to property management by HHMLP.
Conflicts of interest relating to sales or refinancing of hotels acquired from some of our affiliated trustees and officers may lead to decisions that are not in our best interest.
Some of our non-independent trustees and officers have unrealized gains associated with their interests in the hotels we have acquired from them and, as a result, any sale of these hotels or refinancing or prepayment of principal on the indebtedness assumed by us in purchasing these hotels may cause adverse tax consequences to such affiliated trustees and officers. Therefore, our interests and the interests of these individuals may be different in connection with the disposition or refinancing of these hotels.
Agreements to provide financing of hotel development projects owned by some of our affiliated trustees and officers may not have been negotiated on an arm’s-length basis and may not be in our best interest.
Some of our officers and affiliated trustees have ownership interests in projects to develop hotel properties with which we have entered into agreements to provide financing. Consequently, the terms of our agreements with those entities, including interest rates and other key terms, may not have been negotiated on an arm’s-length basis and may not be in the best interest of all our shareholders.
Competing hotels owned or acquired by some of our affiliated trustees and officers may hinder these individuals from spending adequate time on our business.
Some of our affiliated trustees and officers own hotels and may develop or acquire new hotels, subject to certain limitations. Such ownership, development or acquisition activities may materially affect the amount of time these officers and affiliated trustees devote to our affairs. Some of our affiliated trustees and officers operate hotels that are not owned by us, which may materially affect the amount of time that they devote to managing our hotels. Pursuant to the Option Agreement, as amended, we have an option to acquire any hotels developed by our officers and affiliated trustees.
Need for certain consents from the limited partners may not result in decisions advantageous to shareholders.
Under our operating partnership’s amended and restated partnership agreement, the holders of at least two-thirds of the interests in the partnership must approve a sale of all or substantially all of the assets of the partnership or a merger or consolidation of the partnership. Some of our officers and affiliated trustees own an approximately 2.5% interest in the operating partnership on a fully-diluted basis. Their large ownership percentage may make it less likely that a merger or sale of our company that would be in the best interests of our shareholders would be approved.
RISKS RELATING TO OUR CORPORATE STRUCTURE
There are no assurances of our ability to make distributions in the future.
We intend to pay quarterly dividends and to make distributions to our shareholders in amounts such that all or substantially all of our taxable income in each year, subject to certain adjustments, is distributed. However, our ability to pay dividends may be adversely affected by the risk factors described in this annual report. All distributions will be made at the discretion of our Board of Trustees and will depend upon our earnings, our financial condition, maintenance of our REIT status and such other factors as our board may deem relevant from time to time. There are no assurances of our ability to pay dividends in the future.
An increase in market interest rates may have an adverse effect on the market price of our securities.
One of the factors that investors may consider in deciding whether to buy or sell our securities is our dividend rate as a percentage of our share or unit price, relative to market interest rates. If market interest rates increase, prospective investors may desire a higher dividend or interest rate on our securities or seek securities paying higher dividends or interest. The market price of our common shares likely will be based primarily on the earnings and return that we derive from our investments and income with respect to our properties and our related distributions to shareholders, and not from the market value or underlying appraised value of the properties or investments themselves. As a result, interest rate fluctuations and capital market conditions can affect the market price of our common shares. For instance, if interest rates rise without an increase in our dividend rate, the market price of our common shares could decrease because potential investors may require a higher dividend yield on our common shares as market rates on interest-bearing securities, such as bonds, rise. In addition, rising interest rates would result in increased interest expense on our variable rate debt, thereby adversely affecting cash flow and our ability to service our indebtedness and pay dividends.
Holders of our outstanding Series A preferred shares have dividend, liquidation and other rights that are senior to the rights of the holders of our common shares.
Our Board of Trustees has the authority to designate and issue preferred shares with liquidation, dividend and other rights that are senior to those of our common shares. As of December 31, 2010, 2,400,000 shares of our Series A preferred shares were issued and outstanding. The aggregate liquidation preference with respect to the outstanding preferred shares is approximately $60.0 million, and annual dividends on our outstanding preferred shares are approximately $4.8 million. Holders of our Series A preferred shares are entitled to cumulative dividends before any dividends may be declared or set aside on our common shares. Upon our voluntary or involuntary liquidation, dissolution or winding up, before any payment is made to holders of our common shares, holders of our Series A preferred shares are entitled to receive a liquidation preference of $25.00 per share plus any accrued and unpaid distributions. This will reduce the remaining amount of our assets, if any, available to distribute to holders of our common shares. In addition, holders of our Series A preferred shares have the right to elect two additional trustees to our Board of Trustees whenever dividends are in arrears in an aggregate amount equivalent to six or more quarterly dividends, whether or not consecutive.
Future offerings of equity securities, which would dilute our existing shareholders and may be senior to our common shares for the purposes of dividend distributions, may adversely affect the market price of our common shares.
In the future, we may attempt to increase our capital resources by making additional offerings of equity securities, including classes of preferred or common shares. Upon liquidation, holders of our preferred shares and lenders with respect to other borrowings will receive a distribution of our available assets prior to the holders of our common shares. Additional equity offerings may dilute the holdings of our existing shareholders or reduce the market price of our common shares, or both. Our preferred shares, if issued, could have a preference on liquidating distributions or a preference on dividend payments that could limit our ability to make a dividend distribution to the holders of our common shares. Because our decision to issue securities in any future offering will depend on market conditions and other factors beyond our control, we cannot predict or estimate the amount, timing or nature of our future offerings. Thus, our shareholders bear the risk of our future offerings reducing the market price of our common shares and diluting their share holdings in us.
Future sales of our common shares by IRSA Inversiones y Representaciones Sociedad Anonima, or IRSA, and its affiliates, could depress the market price of our common shares.
We cannot predict whether future sales of our common shares or securities convertible into or exchangeable or exercisable for our commons shares or the availability of these securities for resale in the open market will decrease the market price of our common shares. Based on information known by us as of March 2, 2011, IRSA and its affiliates beneficially own 18,134,548 common shares, including 5,700,000 common shares issuable by us upon exercise of outstanding options. These shares, which represent approximately 10.7% our common shares outstanding as of March 2, 2011, may be resold by IRSA and its affiliates in the public market pursuant to a shelf registration statement that has become effective under the Securities Act, or pursuant to any available exemption from registration. Sales of a substantial number of common shares by IRSA and its affiliates, or the perception that such sales could occur, could adversely affect prevailing market prices of the common shares.
IRSA and its affiliates beneficially own a significant percentage of our common shares, which could result in significant influence over the outcome of matters submitted to the vote of our shareholders.
Based on information known by us as of March 2, 2011, IRSA and its affiliates beneficially own approximately 10.7% of our common shares outstanding as of this date. In addition, Real Estate Investment Group, L.P., or REIG, an affiliate of IRSA, has certain preemptive rights to acquire additional shares of beneficial interest. Eduardo Elsztain, the Chairman and Chief Executive Officer of IRSA, also serves on our Board of Trustees. Accordingly, IRSA and its affiliates have significant influence over us and the ownership level of IRSA and its affiliates may discourage or prevent others from trying to acquire control of us and increase the difficulty of consummating any offer, including potential acquisitions that might involve a premium price for our common shares or otherwise be in the best interest of our shareholders. This concentration of ownership may result in decisions affecting us that may not serve the best interest of all shareholders.
Our Board of Trustees may issue additional shares that may cause dilution or prevent a transaction that is in the best interests of our shareholders.
Our Declaration of Trust authorizes the Board of Trustees, without shareholder approval, to:
|
|
·
|
amend the Declaration of Trust to increase or decrease the aggregate number of shares of beneficial interest or the number of shares of beneficial interest of any class or series that we have the authority to issue;
|
|
|
·
|
cause us to issue additional authorized but unissued common shares or preferred shares; and
|
|
|
·
|
classify or reclassify any unissued common or preferred shares and to set the preferences, rights and other terms of such classified or reclassified shares, including the issuance of additional common shares or preferred shares that have preference rights over the common shares with respect to dividends, liquidation, voting and other matters
|
Any one of these events could cause dilution to our common shareholders, delay, deter or prevent a transaction or a change in control that might involve a premium price for the common shares or otherwise not be in the best interest of holders of common shares.
The Declaration of Trust contains a provision that creates staggered terms for our Board of Trustees.
Our Board of Trustees is divided into two classes, the terms of which expire every two years. Trustees of each class are elected for two-year terms upon the expiration of their current terms and each year one class of trustees will be elected by the shareholders. The staggered terms of trustees may delay, deter or prevent a tender offer, a change in control of us or other transaction, even though such a transaction might be in the best interest of the shareholders.
Maryland Business Combination Law may discourage a third party from acquiring us.
Under the Maryland General Corporation Law, as amended (MGCL), as applicable to REITs, certain “business combinations” (including certain issuances of equity securities) between a Maryland REIT and any person who beneficially owns ten percent or more of the voting power of the trust’s shares, or an affiliate thereof, are prohibited for five years after the most recent date on which such shareholder acquired at least ten percent of the voting power of the trust’s shares. Thereafter, any such business combination must be approved by two super-majority shareholder votes unless, among other conditions, the trust’s common shareholders receive a minimum price (as defined in the MGCL) for their shares and the consideration is received in cash or in the same form as previously paid by the interested shareholder for its common shares. These provisions could delay, deter or prevent a change of control or other transaction in which holders of our equity securities might receive a premium for their shares above then-current market prices or which such shareholders otherwise might believe to be in their best interests.
Our Board of Trustees may change our investment and operational policies without a vote of the common shareholders.
Our major policies, including our policies with respect to acquisitions, financing, growth, operations, debt limitation and distributions, are determined by our Board of Trustees. The Trustees may amend or revise these and other policies from time to time without a vote of the holders of the common shares.
Our Board of Trustees and management make decisions on our behalf, and shareholders have limited management rights.
Our shareholders have no right or power to take part in our management except through the exercise of voting rights on certain specified matters. The board of trustees is responsible for our management and strategic business direction, and our management is responsible for our day-to-day operations. Certain policies of our board of trustees may not be consistent with the immediate best interests of our shareholders.
RISKS RELATED TO OUR TAX STATUS
If we fail to qualify as a REIT, our dividends will not be deductible to us, and our income will be subject to taxation, which would reduce the cash available for distribution to our shareholders.
We have operated and intend to continue to operate so as to qualify as a REIT for federal income tax purposes. However, the federal income tax laws governing REITs are extremely complex, and interpretations of the federal income tax laws governing REITs are limited. Our continued qualification as a REIT will depend on our continuing ability to meet various requirements concerning, among other things, the ownership of our outstanding shares of beneficial interest, the nature of our assets, the sources of our income, and the amount of our distributions to our shareholders. Moreover, new tax legislation, administrative guidance or court decisions, in each instance potentially with retroactive effect, could make it more difficult or impossible for us to qualify as a REIT. If we were to fail to qualify as a REIT in any taxable year and did not qualify for certain statutory relief provisions, we would not be allowed a deduction for distributions to our shareholders in computing our taxable income and would be subject to federal income tax (including any applicable alternative minimum tax) on our taxable income at regular corporate rates. Any such corporate tax liability could be substantial and would reduce the amount of cash available for distribution to our shareholders, which in turn could have an adverse impact on the value of, and trading prices for, our shares. Unless entitled to relief under certain Internal Revenue Code provisions, we also would be disqualified from treatment as a REIT for the four taxable years following the year during which qualification was lost. As a result, amounts available for distribution to shareholders would be reduced for each of the years involved. Although we currently intend to operate in a manner so as to qualify as a REIT, it is possible that future economic, market, legal, tax or other considerations may cause our Board of Trustees, with the consent of holders of two-thirds of the outstanding shares, to revoke our REIT election.
Failure to make required distributions would subject us to tax, which would reduce the cash available for distribution to our shareholders.
In order to qualify as a REIT, each year we must distribute to our shareholders at least 90% of our REIT taxable income determined without regard to the deduction for dividends paid and excluding net capital gain. To the extent that we satisfy the 90% distribution requirement, but distribute less than 100% of our taxable income, we will be subject to federal corporate income tax on our undistributed income. In addition, we will incur a 4% nondeductible excise tax on the amount, if any, by which our actual distributions in any year are less than the sum of:
|
|
·
|
85% of our REIT ordinary income for that year;
|
|
|
·
|
95% of our REIT capital gain net income for that year; and
|
|
|
·
|
100% of our undistributed taxable income required to be distributed from prior years.
|
We have distributed, and intend to continue to distribute, our income to our shareholders in a manner intended to satisfy the 90% distribution requirement and to avoid corporate income tax and the 4% nondeductible excise tax. Differences in timing between the recognition of income and the related cash receipts or the effect of required debt amortization payments could require us to borrow money or sell assets to pay out enough of our taxable income to satisfy the distribution requirement and to avoid corporate income tax and the 4% nondeductible excise tax in a particular year. In the past we have borrowed, and in the future we may borrow, to pay distributions to our shareholders and the limited partners of our operating partnership. Such borrowings subject us to risks from borrowing as described herein. Additionally, we may, if necessary and allowable, pay taxable dividends of our shares or debt securities to meet the distribution requirements.
Under Internal Revenue Service, or IRS, guidance, we may pay taxable dividends of our common shares and cash, in which case shareholders may sell our common shares to pay tax on such dividends, placing downward pressure on the market price of our common shares.
Under IRS guidance, we may distribute taxable dividends that are payable in cash and common shares at the election of each shareholder. Under Revenue Procedure 2010-12, or the Revenue Procedure, up to 90% of any such taxable dividend paid with respect to our 2011 taxable year could be payable in shares of our common shares. Taxable shareholders receiving such dividends will be required to include the full amount of the dividend as ordinary income to the extent of our current and accumulated earnings and profits, as determined for federal income tax purposes. As a result, shareholders may be required to pay income tax with respect to such dividends in excess of the cash dividends received. If a U.S. shareholder sells the common shares that it receives as a dividend in order to pay this tax, the sales proceeds may be less than the amount included in income with respect to the dividend, depending on the market price of our common shares at the time of the sale. Furthermore, with respect to certain non-U.S. shareholders, we may be required to withhold federal income tax with respect to such dividends, including in respect of all or a portion of such dividend that is payable in common shares. If we utilize the Revenue Procedure and a significant number of our shareholders determine to sell our common shares in order to pay taxes owed on dividends, it may put downward pressure on the trading price of our common shares. We do not currently intend to utilize the Revenue Procedure.
Dividends payable by REITs do not qualify for the reduced tax rates available for some dividends.
The maximum tax rate applicable to income from “qualified dividends” payable to domestic stockholders taxed at individual rates has been reduced by legislation to 15% through the end of 2012. Dividends payable by REITs, however, generally are not eligible for the reduced rates. Although this legislation does not adversely affect the taxation of REITs or dividends payable by REITs, the more favorable rates applicable to regular corporate qualified dividends could cause investors who are taxed at individual rates to perceive investments in REITs to be relatively less attractive than investments in the stocks of non-REIT corporations that pay dividends, which could adversely affect the value of the stock of REITs, including our common shares.
If the leases of our hotels to our TRSs are not respected as true leases for federal income tax purposes, we would fail to qualify as a REIT.
To qualify as a REIT, we must satisfy two gross income tests, under which specified percentages of our gross income must be derived from certain sources, such as “rents from real property.” Rents paid to our operating partnership by our TRSs pursuant to the lease of our hotels constitute substantially all of our gross income. In order for such rent to qualify as “rents from real property” for purposes of the gross income tests, the leases must be respected as true leases for federal income tax purposes and not be treated as service contracts, joint ventures or some other type of arrangement. If our leases are not respected as true leases for federal income tax purposes, we would fail to qualify as a REIT.
The federal income tax laws governing REITs are complex.
We intend to continue to operate in a manner that will qualify us as a REIT under the federal income tax laws. The REIT qualification requirements are extremely complex, however, and interpretations of the federal income tax laws governing qualification as a REIT are limited. Accordingly, we cannot be certain that we will be successful in operating so we can continue to qualify as a REIT. At any time, new laws, interpretations, or court decisions may change the federal tax laws or the federal income tax consequences of our qualification as a REIT.
Complying with REIT requirements may force us to sell otherwise attractive investments.
To qualify as a REIT, we must satisfy certain requirements with respect to the character of our assets. If we fail to comply with these requirements at the end of any calendar quarter, we must correct such failure within 30 days after the end of the calendar quarter (by, possibly, selling assets notwithstanding their prospects as an investment) to avoid losing our REIT status. If we fail to comply with these requirements at the end of any calendar quarter, and the failure exceeds a de minimis threshold, we may be able to preserve our REIT status if (a) the failure was due to reasonable cause and not to willful neglect, (b) we dispose of the assets causing the failure within six months after the last day of the quarter in which we identified the failure, (c) we file a schedule with the IRS describing each asset that caused the failure, and (d) we pay an additional tax of the greater of $50,000 or the product of the highest applicable tax rate multiplied by the net income generated on those assets. As a result, we may be required to liquidate otherwise attractive investments.
The prohibited transactions tax may limit our ability to engage in transactions, including dispositions of assets, that would be treated as sales for federal income tax purposes.
A REIT's net income from prohibited transactions is subject to a 100% tax. In general, prohibited transactions are sales or other dispositions of property, other than foreclosure property, held primarily for sale to customers in the ordinary course of business. We may be subject to the prohibited transaction tax upon a disposition of real property. Although a safe harbor to the characterization of the sale of real property by a REIT as a prohibited transaction is available, we cannot assure you that we can comply with the safe harbor or that we will avoid owning property that may be characterized as held primarily for sale to customers in the ordinary course of business. Consequently, we may choose not to engage in certain sales of real property or may conduct such sales through a TRS.
Our share ownership limitation may prevent certain transfers of our shares.
In order to maintain our qualification as a REIT, not more than 50% in value of our outstanding shares of beneficial interest may be owned, directly or indirectly, by five or fewer individuals (as defined in the Internal Revenue Code to include certain entities). Our Declaration of Trust prohibits direct or indirect ownership (taking into account applicable ownership provisions of the Internal Revenue Code) of more than (a) 9.9% of the aggregate number of outstanding common shares of any class or series or (b) 9.9% of the aggregate number of outstanding preferred shares of any class or series of outstanding preferred shares by any shareholder or group (the “Ownership Limitation”). Generally, the shares of beneficial interest owned by related or affiliated owners will be aggregated for purposes of the Ownership Limitation. The ownership limitation could have the effect of delaying, deterring or preventing a change in control or other transaction in which holders of shares might receive a premium for their shares over the then prevailing market price or which such holders might believe to be otherwise in their best interests. Any transfer of shares of beneficial interest that would violate the Ownership Limitation, cause us to have fewer than 100 shareholders, cause us to be “closely held” within the meaning of Section 856(h) of the Internal Revenue Code or cause us to own, directly or indirectly, 10% or more of the ownership interest in any tenant (other than a TRS) will be void, the intended transferee of such shares will be deemed never to have had an interest in such shares, and such shares will be designated “shares-in-trust.” Further, we will be deemed to have been offered shares-in-trust for purchase at the lesser of the market price (as defined in the Declaration of Trust) on the date we accept the offer and the price per share in the transaction that created such shares-in-trust (or, in the case of a gift, devise or non-transfer event (as defined in the Declaration of Trust), the market price on the date of such gift, devise or non-transfer event). Therefore, the holder of shares of beneficial interest in excess of the Ownership Limitation will experience a financial loss when such shares are purchased by us, if the market price falls between the date of purchase and the date of redemption.
We have, in limited instances from time to time, permitted certain owners to own shares in excess of the Ownership Limitation. The Board of Trustees has waived the Ownership Limitation for such owners after following procedures set out in our Declaration of Trust, under which the owners requesting the waivers provided certain information and our counsel provided certain legal opinions. These waivers established levels of permissible share ownership for the owners requesting the waivers that are higher than the Ownership Limitation. If the owners acquire shares in excess of the higher limits, those shares are subject to the risks described above in the absence of further waivers. The Board of Trustees is not obligated to grant such waivers and has no current intention to do so with respect to any owners who (individually or aggregated as the Declaration of Trust requires) do not currently own shares in excess of the Ownership Limitation.
|
Item 1B.
|
Unresolved Staff Comments
|
None.
|
Item 2.
|
Properties
|
The following table sets forth certain information with respect to the 62 hotels we wholly owned as of December 31, 2010, all of which are consolidated on the Company’s financial statements.
|
Name
|
Year Opened
|
Number of Rooms
|
|
|
Candlewood Suites
|
|||
|
Times Square, NY
|
2009
|
188
|
|
|
Comfort Inn
|
|||
|
North Dartmouth, MA
|
1986
|
84
|
|
|
Harrisburg, PA
|
1998
|
81
|
|
|
Courtyard
|
|||
|
Alexandria, VA
|
2006
|
203
|
|
|
Scranton, PA
|
1996
|
120
|
|
|
Langhorne, PA
|
2002
|
118
|
|
|
Brookline/Boston, MA*
|
2003
|
188
|
|
|
Wilmington, DE
|
1999
|
78
|
|
|
Fairfield Inn
|
|||
|
Bethlehem, PA
|
1997
|
103
|
|
|
Laurel, MD
|
1999
|
109
|
|
|
Hampton Inn
|
|||
|
Brookhaven, NY
|
2002
|
161
|
|
|
Chelsea/Manhattan, NY
|
2003
|
144
|
|
|
Hershey, PA
|
1999
|
110
|
|
|
Carlisle, PA
|
1997
|
95
|
|
|
Danville, PA
|
1998
|
72
|
|
|
Selinsgrove, PA
|
1996
|
75
|
|
|
Herald Square, Manhattan, NY
|
2005
|
136
|
|
|
Philadelphia, PA
|
2001
|
250
|
|
|
Seaport, NY
|
2006
|
65
|
|
|
Smithfield, RI
|
2008
|
101
|
|
|
Times Square, NY
|
2009
|
184
|
|
|
West Haven, CT
|
2009
|
98
|
|
|
Washington, DC
|
2005
|
228
|
|
|
Hawthorn Suites
|
|||
|
Franklin, MA
|
1999
|
100
|
|
|
Hilton Garden Inn
|
|||
|
JFK Airport, NY*
|
2005
|
188
|
|
|
TriBeCa, NY
|
2009
|
151
|
|
|
Edison, NJ*
|
2003
|
132
|
|
|
Glastonbury, CT
|
2003
|
150
|
|
|
Holiday Inn
|
|||
|
Norwich, CT
|
2006
|
134
|
|
|
Wall Street, NY
|
2010
|
113
|
|
|
Holiday Inn Express
|
|||
|
Hauppauge, NY
|
2001
|
133
|
|
|
Cambridge, MA
|
1997
|
112
|
|
|
Hershey, PA
|
1997
|
85
|
|
|
Malvern, PA
|
2004
|
88
|
|
|
Oxford Valley, PA
|
2004
|
88
|
|
|
Chester, NY
|
2006
|
80
|
|
|
Camp Springs, MD
|
2008
|
127
|
|
|
Times Square, NY
|
2009
|
210
|
|
|
Holiday Inn Express & Suites
|
|||
|
Harrisburg, PA
|
1997
|
77
|
|
|
King of Prussia, PA
|
2004
|
155
|
|
|
Hyatt Place
|
|||
|
King of Prussia, PA
|
2010
|
129
|
|
|
Independent
|
|||
|
Wilmington, DE
|
1999
|
71
|
|
|
Fifth Ave, NY
|
2007
|
70
|
|
|
TriBeCa, NY
|
2008
|
45
|
|
|
Brooklyn, NY
|
2008
|
93
|
|
|
Name
|
Year Opened
|
Number of Rooms
|
|
|
Residence Inn
|
|||
|
North Dartmouth, MA
|
2002
|
96
|
|
|
Tysons Corner, VA
|
1984
|
96
|
|
|
Framingham, MA
|
2000
|
125
|
|
|
Greenbelt, MD
|
2002
|
120
|
|
|
Norwood, MA
|
2006
|
96
|
|
|
Langhorne, PA
|
2007
|
100
|
|
|
Carlisle,PA
|
2007
|
78
|
|
|
Sheraton Hotel
|
|||
|
JFK Airport, NY*
|
2008
|
150
|
|
|
New Castle, DE
|
2011
|
191
|
|
|
Summerfield Suites
|
|||
|
White Plains, NY
|
2000
|
159
|
|
|
Bridgewater, NJ
|
1998
|
128
|
|
|
Gaithersburg, MD
|
1998
|
140
|
|
|
Pleasant Hill, CA
|
2003
|
142
|
|
|
Pleasanton, CA
|
1998
|
128
|
|
|
Scottsdale, AZ
|
1999
|
164
|
|
|
Charlotte, NC
|
1989
|
144
|
|
|
TownePlace Suites
|
|||
|
Harrisburg, PA
|
2008
|
107
|
|
|
TOTAL ROOMS
|
7,686
|
*Our interests in these hotels are subject to ground leases which, in most cases, require monthly rental payment as determined by the applicable ground lease agreement. These ground lease agreements typically have terms of between 75 and 99 years.
The following table sets forth certain information with respect to the 15 hotels we owned through joint ventures with third parties as of December 31, 2010. Of the 15 properties owned through interests in joint ventures, three are consolidated.
|
Name
|
Year Opened
|
Number of Rooms
|
HHLP Ownership in Asset
|
HHLP Preferred Return
|
Consolidated/
Unconsolidated
|
||||||||||
|
Courtyard
|
|||||||||||||||
|
Norwich, CT
|
1997
|
144 | 66.7 | % | 8.5 | % |
Unconsolidated
|
||||||||
|
South Boston, MA**
|
2005
|
164 | 50.0 | % | N/A |
Consolidated
|
|||||||||
|
Warwick, RI
|
2003
|
92 | 66.7 | % | 8.5 | % |
Unconsolidated
|
||||||||
|
Ewing/Princeton, NJ
|
2004
|
130 | 50.0 | % | 11.0 | % |
Unconsolidated
|
||||||||
|
Hilton
|
|||||||||||||||
|
Hartford, CT
|
2005
|
393 | 8.8 | % | 8.5 | % |
Unconsolidated
|
||||||||
|
Marriott
|
|||||||||||||||
|
Mystic, CT
|
2001
|
285 | 66.7 | % | 8.5 | % |
Unconsolidated
|
||||||||
|
Hartford, CT
|
2005
|
409 | 15.0 | % | 8.5 | % |
Unconsolidated
|
||||||||
|
Residence Inn
|
|||||||||||||||
|
Danbury, CT
|
1999
|
78 | 66.7 | % | 8.5 | % |
Unconsolidated
|
||||||||
|
Mystic, CT
|
1996
|
133 | 66.7 | % | 8.5 | % |
Unconsolidated
|
||||||||
|
Southington, CT
|
2002
|
94 | 44.7 | % | 8.5 | % |
Unconsolidated
|
||||||||
|
Williamsburg, VA
|
2002
|
108 | 75.0 | % | 12.0 | % |
Consolidated
|
||||||||
|
Holiday Inn Express
|
|||||||||||||||
|
South Boston, MA**
|
1998
|
118 | 50.0 | % | N/A |
Unconsolidated
|
|||||||||
|
Manhattan, NY
|
2006
|
228 | 50.0 | % | N/A |
Unconsolidated
|
|||||||||
|
Springhill Suites
|
|||||||||||||||
|
Waterford, CT
|
1998
|
80 | 66.7 | % | 8.5 | % |
Unconsolidated
|
||||||||
|
Williamsburg, VA
|
2002
|
120 | 75.0 | % | 12.0 | % |
Consolidated
|
||||||||
|
TOTAL ROOMS
|
2,576 | ||||||||||||||
**The joint ventures interests in these hotels are subject to ground leases which, in most cases, require monthly rental payment as determined by the applicable ground lease agreements. These ground lease agreements typically have terms of between 75 and 99 years.
|
Item 3.
|
Legal Proceedings
|
We are not presently subject to any material litigation nor, to our knowledge, is any other litigation threatened against us, other than routine actions for negligence or other claims and administrative proceedings arising in the ordinary course of business, some of which are expected to be covered by liability insurance and all of which collectively are not expected to have a material adverse effect on our liquidity, results of operations or business or financial condition.
|
Item 4.
|
[Removed and Reserved]
|
PART II
|
Item 5.
|
Market for Registrant’s Common Equity, Related Stockholder Matters and Issuer Purchases of Equity Securities
|
MARKET INFORMATION
Our common shares began trading on the New York Stock Exchange on May 5, 2008 under the symbol “HT.” As of March 2, 2011, the last reported closing price per common share on the New York Stock Exchange was $6.44. The following table sets forth the high and low sales price per common share reported on the New York Stock Exchange as traded and the dividends paid on the common shares for each of the quarters indicated.
|
Year Ended December 31, 2010
|
High
|
Low
|
Dividend Per Common Share
|
|||||||||
|
Fourth Quarter
|
$ | 6.69 | $ | 5.05 | $ | 0.05 | ||||||
|
Third Quarter
|
$ | 5.65 | $ | 4.16 | $ | 0.05 | ||||||
|
Second Quarter
|
$ | 5.98 | $ | 4.20 | $ | 0.05 | ||||||
|
First Quarter
|
$ | 5.41 | $ | 3.14 | $ | 0.05 | ||||||
|
Year Ended December 31, 2009
|
High
|
Low
|
Dividend Per Common Share
|
|||||||||
|
Fourth Quarter
|
$ | 3.29 | $ | 2.33 | $ | 0.05 | ||||||
|
Third Quarter
|
$ | 3.43 | $ | 2.16 | $ | 0.05 | ||||||
|
Second Quarter
|
$ | 3.74 | $ | 1.64 | $ | 0.05 | ||||||
|
First Quarter
|
$ | 3.05 | $ | 1.08 | $ | 0.18 | ||||||
SHAREHOLDER INFORMATION
At December 31, 2010 we had approximately 14,795 holders of record of our common shares. Units of limited partnership interest in our operating partnership (which are redeemable for common shares on a one for one basis subject to certain limitations) were held by approximately 41 entities and persons.
Our Declaration of Trust, subject to certain exceptions, provides that no person may own, or be deemed to own by virtue of the attribution provisions of the Internal Revenue Code, more than 9.9% of the number of outstanding common shares of any class or series of common shares or the number of outstanding preferred shares of any class or series of preferred shares. For this purpose, a person includes a “group” and a “beneficial owner” as those terms are used for purposes of Section 13(d)(3) of the Securities Exchange Act of 1934, as amended (the “Exchange Act”). Any transfer of common or preferred shares that would result in any person owning, directly or indirectly, common or preferred shares in excess of the ownership limitation, result in the common and preferred shares being owned by fewer than 100 persons (determined without reference to any rules of attribution), result in our being “closely held” within the meaning of Section 856(h) of the Code, or cause us to own, actually or constructively, 10% or more of the ownership interests in a tenant (other than a TRS) of our or our operating partnership’s real property, within the meaning of Section 856(d)(2)(B) of the Code, will be null and void, and the intended transferee will acquire no rights in such common or preferred shares.
Any person who acquires or attempts to acquire common or preferred shares in violation of the foregoing restrictions, or any person who owned common or preferred shares that were transferred to a trust, will be required to give written notice immediately to us of such event and provide us with such other information as we may request in order to determine the effect, if any, of such transfer on our status as a REIT.
In addition, the trustees, upon receipt of advice of counsel or other evidence satisfactory to the trustees, in their sole and absolute discretion, may, in their sole and absolute discretion, exempt a person from the ownership limitation under certain circumstances. The foregoing restrictions continue to apply until the trustees determine that it is no longer in our best interests to attempt to qualify, or to continue to qualify, as a REIT and there is an affirmative vote of two-thirds of the number of common and preferred shares entitled to vote on such matter at a regular or special meeting of our shareholders.
All certificates representing common or preferred shares bear a legend referring to the restrictions described above.
The restrictions on ownership and transfer described above could have the effect of delaying, deterring or preventing a change in control or other transaction in which holders of some, or a majority, of our common shares might receive a premium for their shares over the then-prevailing market price or which such holders might believe to be otherwise in their best interest.
EQUITY COMPENSATION PLAN
See Part III, Item 12, for a description of securities authorized for issuance under our 2008 Equity Incentive Plan.
DISTRIBUTION INFORMATION
Future distributions, if any, will be at the discretion of our Board of Trustees and will depend on our actual cash flow, financial condition, capital requirements, the annual distribution requirements under the REIT provisions of the Internal Revenue Code and such other factors as we may deem relevant. Our ability to make distributions will depend on our receipt of distributions from our operating partnership and lease payments from our lessees with respect to the hotels. We rely on the profitability and cashflows of our hotels to generate sufficient cash flow for distributions. Additionally, we may, if necessary and allowable, pay taxable dividends of our shares or debt securities to meet the distribution requirements.
SHARE PERFORMANCE GRAPH
The following graph compares the yearly change in our cumulative total shareholder return on our common shares for the period beginning December 31, 2005 and ending December 31, 2010, with the yearly changes in the Standard & Poor’s 500 Stock Index (the S&P 500 Index), the Russell 2000 Index, and the SNL Hotel REIT Index (“Hotel REIT Index”) for the same period, assuming a base share price of $100.00 for our common shares, the S&P 500 Index, the Russell 2000 Index and the Hotel REIT Index for comparative purposes. The Hotel REIT Index is comprised of publicly traded REITs which focus on investments in hotel properties. Total shareholder return equals appreciation in stock price plus dividends paid and assumes that all dividends are reinvested. The performance graph is not indicative of future investment performance. We do not make or endorse any predictions as to future share price performance.
|
Period Ending December 31,
|
||||||||||||||||||||||||
|
2005
|
2006
|
2007
|
2008
|
2009
|
2010
|
|||||||||||||||||||
|
Hersha Hospitality Trust
|
$ | 100.00 | $ | 135.29 | $ | 118.89 | $ | 43.40 | $ | 52.35 | $ | 114.23 | ||||||||||||
|
Russell 2000
|
100.00 | 118.37 | 116.51 | 77.15 | 98.11 | 124.46 | ||||||||||||||||||
|
Hotel REITs Index
|
100.00 | 128.62 | 100.10 | 40.04 | 66.32 | 93.27 | ||||||||||||||||||
|
S&P 500
|
100.00 | 115.79 | 122.15 | 76.96 | 97.33 | 111.99 | ||||||||||||||||||
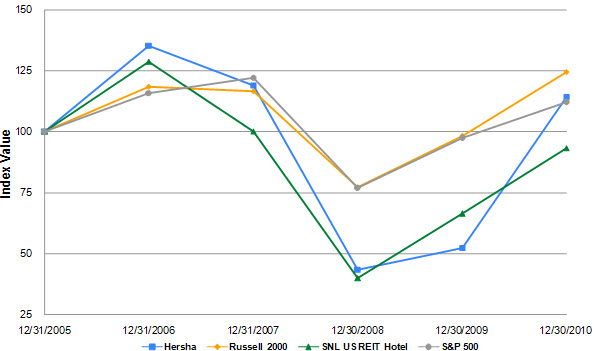
|
Item 6.
|
Selected Financial Data
|
The following sets forth selected financial and operating data on a historical consolidated basis. The following data should be read in conjunction with the financial statements and notes thereto and Management’s Discussion and Analysis of Financial Condition and Results of Operations included elsewhere in this Form 10-K. Where applicable, the operating results of certain real estate assets which have been sold or otherwise qualify as held for disposition are included in discontinued operations for all periods presented.
HERSHA HOSPITALITY TRUST
SELECTED FINANCIAL DATA
(In thousands, except per share data)
|
2010
|
2009
|
2008
|
2007
|
2006
|
||||||||||||||||
|
Revenue:
|
||||||||||||||||||||
|
Hotel Operating Revenues
|
$ | 277,708 | $ | 212,352 | $ | 236,247 | $ | 215,110 | $ | 117,572 | ||||||||||
|
Interest Income From Development Loans
|
4,686 | 7,411 | 7,890 | 6,046 | 2,487 | |||||||||||||||
|
Other Revenues
|
381 | 1,981 | 3,984 | 3,518 | 1,860 | |||||||||||||||
|
Total Revenue
|
282,775 | 221,744 | 248,121 | 224,674 | 121,919 | |||||||||||||||
|
Operating Expenses:
|
||||||||||||||||||||
|
Hotel Operating Expenses
|
158,717 | 124,294 | 133,762 | 119,559 | 65,700 | |||||||||||||||
|
Hotel Ground Rent
|
1,374 | 1,166 | 1,040 | 856 | 804 | |||||||||||||||
|
Real Estate and Personal Property Taxes and Property Insurance
|
19,335 | 14,060 | 12,559 | 10,902 | 5,516 | |||||||||||||||
|
General and Administrative
|
10,263 | 5,891 | 7,208 | 7,094 | 5,527 | |||||||||||||||
|
Stock Based Compensation
|
6,649 | 2,143 | 1,502 | 852 | 293 | |||||||||||||||
|
Acquisition and Terminated Transaction Costs
|
4,827 | 328 | 380 | 149 | 316 | |||||||||||||||
|
Loss from Impairment of Assets
|
2,433 | 39,111 | 21,004 | - | - | |||||||||||||||
|
Depreciation and Amortization
|
52,012 | 43,187 | 38,989 | 31,974 | 16,737 | |||||||||||||||
|
Total Operating Expenses
|
255,610 | 230,180 | 216,444 | 171,386 | 94,893 | |||||||||||||||
|
Operating Income
|
27,165 | (8,436 | ) | 31,677 | 53,288 | 27,026 | ||||||||||||||
|
Interest Income
|
169 | 208 | 306 | 686 | 1,182 | |||||||||||||||
|
Interest Expense
|
45,868 | 45,183 | 43,306 | 41,980 | 24,183 | |||||||||||||||
|
Other Expense
|
464 | 165 | 129 | 83 | 102 | |||||||||||||||
|
Loss on Debt Extinguishment
|
932 | - | 1,552 | - | 1,485 | |||||||||||||||
|
(Loss) Income before Income (Loss) from Unconsolidated Joint Venture Investments and Discontinued Operations
|
(19,930 | ) | (53,576 | ) | (13,004 | ) | 11,911 | 2,438 | ||||||||||||
|
(Loss) Income from Unconsolidated Joint Ventures
|
(1,751 | ) | (7,190 | ) | (517 | ) | 3,476 | 1,799 | ||||||||||||
|
Gain from Remeasurement of Investment in Unconsolidated Joint Ventures
|
4,008 | - | - | - | - | |||||||||||||||
|
Net Income (Loss) from Unconsolidated Joint Venture Investments
|
2,257 | (7,190 | ) | (517 | ) | 3,476 | 1,799 | |||||||||||||
|
(Loss) Income from Continuing Operations
|
(17,673 | ) | (60,766 | ) | (13,521 | ) | 15,387 | 4,237 | ||||||||||||
|
Discontinued Operations:
|
||||||||||||||||||||
|
Gain on Disposition of Hotel Properties
|
347 | 1,869 | 2,888 | 4,248 | 784 | |||||||||||||||
|
Income from Discontinued Operations
|
124 | 439 | 204 | 537 | 783 | |||||||||||||||
|
Income from Discontinued Operations
|
471 | 2,308 | 3,092 | 4,785 | 1,567 | |||||||||||||||
|
Net (Loss) Income
|
(17,202 | ) | (58,458 | ) | (10,429 | ) | 20,172 | 5,804 | ||||||||||||
|
Loss (Income) Allocated to Noncontrolling Interests
|
845 | 8,597 | 1,621 | (2,325 | ) | (706 | ) | |||||||||||||
|
Preferred Distributions
|
(4,800 | ) | (4,800 | ) | (4,800 | ) | (4,800 | ) | (4,800 | ) | ||||||||||
|
Net (Loss) Income applicable to Common Shareholders
|
$ | (21,157 | ) | $ | (54,661 | ) | $ | (13,608 | ) | $ | 13,047 | $ | 298 | |||||||
|
Basic (Loss) Income from Continuing Operations applicable to Common Shareholders
|
$ | (0.16 | ) | $ | (1.08 | ) | $ | (0.31 | ) | $ | 0.20 | $ | (0.05 | ) | ||||||
|
Diluted (Loss) Income from Continuing Operations applicable to Common Shareholders (1)
|
(0.16 | ) | (1.08 | ) | (0.31 | ) | 0.20 | (0.05 | ) | |||||||||||
|
Dividends declared per Common Share
|
0.20 | 0.33 | 0.72 | 0.72 | 0.72 | |||||||||||||||
|
2010
|
2009
|
2008
|
2007
|
2006
|
||||||||||||||||
|
Balance Sheet Data
|
||||||||||||||||||||
|
Net investment in hotel properties
|
$ | 1,245,851 | $ | 938,954 | $ | 982,082 | $ | 893,297 | $ | 807,784 | ||||||||||
|
Assets Held for Sale
|
- | 21,073 | - | - | - | |||||||||||||||
|
Noncontrolling Interests Common Units
|
19,410 | 27,126 | 34,781 | 42,845 | 25,933 | |||||||||||||||
|
Redeemable Noncontrolling Interest
|
19,894 | 14,733 | 18,739 | - | - | |||||||||||||||
|
Noncontrolling Interests Consolidated Joint Ventures
|
474 | 267 | 1,854 | 1,908 | 3,092 | |||||||||||||||
|
Shareholder's equity
|
683,434 | 302,197 | 349,963 | 330,405 | 331,619 | |||||||||||||||
|
Total assets
|
1,457,277 | 1,111,044 | 1,178,405 | 1,067,607 | 968,208 | |||||||||||||||
|
Total debt
|
694,720 | 724,551 | 743,781 | 663,008 | 580,542 | |||||||||||||||
|
Debt related to Assets Held for Sale
|
- | 20,892 | - | - | - | |||||||||||||||
|
Other Data
|
||||||||||||||||||||
|
Funds from Operations (2)
|
$ | 31,373 | $ | (15,912 | ) | $ | 31,441 | $ | 49,823 | $ | 25,936 | |||||||||
|
Net cash provided by operating activities
|
$ | 46,246 | $ | 21,532 | $ | 53,894 | $ | 59,300 | $ | 27,217 | ||||||||||
|
Net cash used in investing activities
|
$ | (314,358 | ) | $ | (8,921 | ) | $ | (114,870 | ) | $ | (46,027 | ) | $ | (413,881 | ) | |||||
|
Net cash provided by (used in) financing activities
|
$ | 322,304 | $ | (16,904 | ) | $ | 64,346 | $ | (11,262 | ) | $ | 388,200 | ||||||||
|
Weighted average shares outstanding
|
||||||||||||||||||||
|
Basic
|
134,370,172 | 51,027,742 | 45,184,127 | 40,718,724 | 27,118,264 | |||||||||||||||
|
Diluted (1)
|
134,370,172 | 51,027,742 | 45,184,127 | 40,718,724 | 27,118,264 | |||||||||||||||
(1) Income allocated to noncontrolling interest in HHLP has been excluded from the numerator and Partnership units have been omitted from the denominator for the purpose of computing diluted earnings per share since the effect of including these amounts in the numerator and denominator would have no impact.
(2) See Item 7 “Management’s Discussion and Analysis of Financial Condition and Results of Operations—Funds From Operations” for an explanation of FFO, why we believe FFO is a meaningful measure of our operating performance and a reconciliation of FFO to net income calculated in accordance with GAAP.
|
Item 7.
|
Management’s Discussion and Analysis of Financial Condition and Results of Operations
|
Certain statements appearing in this Item 7 are forward-looking statements within the meaning of the federal securities laws. Our actual results may differ materially. We caution you not to place undue reliance on any such forward-looking statements. See “CAUTIONARY FACTORS THAT MAY AFFECT FUTURE RESULTS” for additional information regarding our forward-looking statements.
BACKGROUND
As of December 31, 2010, we owned interests in 77 hotels, many of which are located in clusters around major markets in the Northeastern Corridor, including 62 wholly-owned hotels and interests in 15 hotels owned through consolidated and unconsolidated joint ventures. We have elected to be taxed as a REIT for federal income tax purposes, beginning with the taxable year ended December 31, 1999. For purposes of the REIT qualification rules, we cannot directly operate any of our hotels. Instead, we must lease our hotels to a third party lessee or to a TRS, provided that the TRS engages an eligible independent contractor to manage the hotels. As of December 31, 2010, we have leased all of our hotels to a wholly-owned TRS, a joint venture owned TRS, or an entity owned by our wholly-owned TRS. Each of these TRS entities will pay qualifying rent, and the TRS entities have entered into management contracts with qualified independent managers, including HHMLP, with respect to our hotels. We intend to lease all newly acquired hotels to a TRS. The TRS structure enables us to participate more directly in the operating performance of our hotels. The TRS directly receives all revenue from, and funds all expenses relating to, hotel operations. The TRS is also subject to income tax on its earnings.
OVERVIEW
We believe 2010 was a transformative year for the lodging industry generally, lodging fundamentals in the markets on which we focus, and for our Company in particular. In mid-2008, U.S. lodging demand started to decline as a result of the economic recession, which led industry RevPAR to decline. Throughout 2009, the decrease in lodging demand accelerated, resulting in one of the largest RevPAR declines ever in the modern lodging industry. The economic recession generally, and turmoil in the financial markets in particular, caused credit to significantly tighten, making it more difficult for hotel developers to obtain financing for development projects or for hotels with limited operating history. Early in 2010, fundamentals in the U.S. lodging industry began showing signs of improvement with demand for rooms increasing in many major markets, as general economic indicators began to experience improvement. As a result, the lodging industry experienced increases in occupancy in the early and middle parts of 2010, and with increasing demand, rates began to rebound in the middle and latter parts of the year, particularly in major urban markets such as New York, Boston and Washington, D.C. These positive trends continued, strengthened and expanded to other markets during the latter part of the year, which we expect positions the lodging industry for continued growth in ADR and RevPAR during 2011.
During this same period, we took steps to better position our portfolio and our Company to take advantage of the anticipated economic recovery. During 2010, we accessed the equity capital markets three times, raising a total of approximately $421.7 million in net proceeds from sales of common shares. In late 2010, we refinanced our primary credit facility with a syndicate of eleven major financial institutions, expanding the facility from $135 million to $250 million of total capacity and extending the maturity into late 2013. These improvements to our overall capitalization improved our financial stability and flexibility coming out of the economic downturn.
We simultaneously repositioned our portfolio to focus more on high barrier to entry and major urban markets -- New York and Washington D.C. in particular. In the latter part of 2009 and throughout 2010, we acquired nine hotels -- including five in New York and one in Washington, D.C., bringing our New York City portfolio to 13 hotels comprising a substantial portion of our overall portfolio performance. Already in 2011, we have committed to acquiring a hotel on Capitol Hill in Washington, D.C. During 2010, we also began renovations programs at nine properties, accelerating those projects in our core markets in an effort to take advantage of what we expect to be stronger market conditions and operating fundamentals in the middle to late part of 2011. These efforts to reposition our portfolio are already showing results. As shown on the tables below under “Summary of Operating Results,” in 2010, we grew occupancy by 3.3 percentage points, ADR by 7.9% and RevPAR by 13.2% across our consolidated hotels. Increases were similar, but less substantial, across our joint venture portfolio.
As we enter 2011, we believe the improvements in our equity and debt capitalization and repositioning of our portfolio better enables us to capitalize on further improvements in lodging fundamentals. During 2011, we expect continued improvements in ADR, RevPAR and operating margins, led by hotels in our core urban markets of New York, Boston and Washington. We will continue to seek acquisition opportunities in urban centers, central business districts, primary suburban markets and stable secondary markets. In addition, we are looking, and will continue to look, for attractive opportunities to dispose of properties in tertiary markets at favorable prices, potentially redeploying that capital in our focus markets. We do not expect to actively pursue acquisitions made through joint ventures; however, we may seek to buyout, or sell our joint venture interest to, select existing joint venture partners. We do not expect to actively pursue additional development loans or land leases. While property joint ventures, development loans and land leases played an important role in our growth over the last five years, we do not expect them to play the same role in our near-term future.
Although we are planning for continued stabilization and improvement in consumer and commercial spending and lodging demand during 2011, the manner in which the economy will recover is not predictable, and certain core economic metrics, including unemployment, are not rebounding as quickly as many had hoped. In addition, the market for hotel level financing for new hotels is not recovering as quickly as the economy or broader financial markets. As a result, there can be no assurances that we will be able to grow hotel revenues, occupancy, ADR or RevPAR at our properties as we hope. Further, we cannot assure that we will not experience defaults under our development loans. The lack of financing for our borrowers and potential buyers may result in borrower defaults or prevent borrowers or us from disposing of properties held for sale. Factors that might contribute to less than anticipated performance include those described under the heading “Item 1A. Risk Factors” and other documents that we may file with the SEC in the future. We will continue to cautiously monitor recovery in lodging demand and rates, our third party hotel managers, our remaining portfolio of hotel development loans and our performance generally.
SUMMARY OF OPERATING RESULTS
The following table outlines operating results for the Company’s portfolio of wholly owned hotels and those owned through joint venture interests that are consolidated in our financial statements for the three years ended December 31, 2010, 2009 and 2008:
CONSOLIDATED HOTELS:
|
Year Ended 2010
|
Year Ended 2009
|
2010 vs. 2009 % Variance
|
Year Ended 2008
|
2009 vs. 2008 % Variance
|
||||||||||||||||
|
Rooms Available
|
2,747,788 | 2,379,919 | 15.5 | % | 2,242,629 | 6.1 | % | |||||||||||||
|
Rooms Occupied
|
1,941,862 | 1,603,264 | 21.1 | % | 1,609,950 | -0.4 | % | |||||||||||||
|
Occupancy
|
70.67 | % | 67.37 | % | 3.3 | % | 71.79 | % | -4.4 | % | ||||||||||
|
Average Daily Rate (ADR)
|
$ | 136.27 | $ | 126.23 | 7.9 | % | $ | 140.51 | -10.2 | % | ||||||||||
|
Revenue Per Available Room (RevPAR)
|
$ | 96.30 | $ | 85.04 | 13.2 | % | $ | 100.87 | -15.7 | % | ||||||||||
|
Room Revenues
|
$ | 264,609,257 | $ | 202,386,640 | 30.7 | % | $ | 226,219,989 | -10.5 | % | ||||||||||
|
Hotel Operating Revenues
|
$ | 277,707,839 | $ | 212,352,643 | 30.8 | % | $ | 236,246,808 | -10.1 | % | ||||||||||
The following table outlines operating results for the three years ended December 31, 2010, 2009 and 2008 for hotels we own through an unconsolidated joint venture interest. These operating results reflect 100% of the operating results of the property including our interest and the interests of our joint venture partners and other noncontrolling interest holders. This table excludes the operations of the Hilton Garden Inn, Glastonbury, CT and Homewood Suites, Glastonbury, CT. On January 1, 2010, we acquired our joint venture partner’s membership interest in PRA Glastonbury, LLC, the owner of the Hilton Garden Inn, Glastonbury, CT, and this hotel became one of our wholly-owned hotels. As a result of this transaction, our joint venture partner acquired our membership interest in PRA Suites at Glastonbury, LLC, the owner of the Homewood Suites, Glastonbury, CT. In addition, this table excludes the operations of the Courtyard South Boston, MA. On April 13, 2010, this hotel became one of our consolidated joint venture properties due to our acquisition of the mortgage note secured by Courtyard South Boston, MA. The acquisition of this mortgage note caused us to be the primary beneficiary of the joint venture that owns the Courtyard South Boston, MA.
UNCONSOLIDATED JOINT VENTURES:
|
Year Ended 2010
|
Year Ended 2009
|
2010 vs. 2009 % Variance
|
Year Ended 2008
|
2009 vs. 2008 % Variance
|
||||||||||||||||
|
Rooms Available
|
797,160 | 797,157 | 0.0 | % | 963,892 | -17.3 | % | |||||||||||||
|
Rooms Occupied
|
537,686 | 510,739 | 5.3 | % | 677,485 | -24.6 | % | |||||||||||||
|
Occupancy
|
67.45 | % | 64.07 | % | 3.4 | % | 70.29 | % | -6.2 | % | ||||||||||
|
Average Daily Rate (ADR)
|
$ | 136.76 | $ | 134.61 | 1.6 | % | $ | 146.91 | -8.4 | % | ||||||||||
|
Revenue Per Available Room (RevPAR)
|
$ | 92.24 | $ | 86.24 | 7.0 | % | $ | 103.26 | -16.5 | % | ||||||||||
|
Room Revenues
|
$ | 73,532,283 | $ | 68,750,708 | 7.0 | % | $ | 99,530,317 | -30.9 | % | ||||||||||
|
Total Revenues
|
$ | 94,826,036 | $ | 90,020,445 | 5.3 | % | $ | 127,874,193 | -29.6 | % | ||||||||||
RevPAR for the year ended December 31, 2010 increased 13.2% for our consolidated hotels and increased 7.0% for our unconsolidated hotels when compared to the same period in 2009. This represents a growth trend in RevPAR experienced during the year ended December 31, 2010 over the same period in 2009. This growth trend in RevPAR is primarily due to improving economic conditions in 2010 and the acquisition of hotel properties in 2010 that are accretive to RevPAR.
COMPARISON OF THE YEAR ENDED DECEMBER 31, 2010 TO DECEMBER 31, 2009
(dollars in thousands, except per share data)
Revenue
Our total revenues for the year ended December 31, 2010 consisted of hotel operating revenues, interest income from our development loan program, and other revenues. Hotel operating revenues are recorded for wholly owned hotels that are leased to our wholly owned TRS and hotels owned through joint venture interests that are consolidated in our financial statements. Hotel operating revenues increased $65,356, or 30.8%, from $212,352 for the year ended December 31, 2009 to $277,708 for the same period in 2010. This increase in hotel operating revenues was primarily attributable to the acquisitions consummated in 2010 and 2009.
We acquired interests in the following six consolidated hotels which contributed the following operating revenues for the year ended December 31, 2010:
|
Brand
|
Location
|
Acquisition Date
|
Rooms
|
Hotel Operating Revenues
|
||||||||
|
Hilton Garden Inn
|
Glastonbury, CT
|
January 1, 2010
|
150 | 5,046 | ||||||||
|
Hampton Inn
|
Times Square, NY
|
February 9, 2010
|
184 | 11,188 | ||||||||
|
Candlewood Suites
|
Times Square, NY
|
February 9, 2010
|
188 | 9,215 | ||||||||
|
Holiday Inn Express
|
Times Square, NY
|
February 9, 2010
|
210 | 12,278 | ||||||||
|
Holiday Inn
|
Wall Street, NY
|
May 7, 2010
|
113 | 4,496 | ||||||||
|
Hampton Inn
|
Washington, DC
|
September 1, 2010
|
228 | 3,923 | ||||||||
| 1,073 | $ | 46,146 | ||||||||||
Revenues for all hotels were recorded from the date of acquisition as hotel operating revenues. Further, hotel operating revenues for the year ended December 31, 2010 included revenues for a full year related to two hotels that were purchased during the year ended December 31, 2009. Hotels acquired during the year ended December 31, 2009 would have a full year of results included in the year ended December 31, 2010 but not necessarily a full year of results during the same period in 2009. We acquired interests in the following two consolidated hotels during the year ended December 31, 2009:
|
Brand
|
Location
|
Acquisition Date
|
Rooms
|
2010 Hotel Operating Revenues
|
2009 Hotel Operating Revenues
|
|||||||||||
|
Hilton Garden Inn
|
TriBeCa, New York, NY
|
May 1, 2009 * | 151 | $ | 11,675 | $ | 6,761 | |||||||||
|
Hampton Inn & Suites
|
West Haven, CT
|
November 4, 2009
|
98 | 2,746 | 374 | |||||||||||
| 249 | $ | 14,421 | $ | 7,135 | ||||||||||||
*We acquired a 49% interest in the entity that owns the property on May 1, 2009 and acquired the remaining 51% interest on June 30, 2009.
In addition, our existing portfolio experienced improvement in ADR and occupancy during the year ended December 31, 2010 when compared to the same period in 2009. Occupancy in our consolidated hotels increased 340 basis points from approximately 67.4% during the year ended December 31, 2009 to approximately 70.7% for the same period in 2010. ADR improved 7.9%, increasing from $126.23 for the year ended December 31, 2009 to $136.27 during the same period in 2010. These improvements were due to improvements in lodging trends in the markets in which we operate.
We have invested in hotel development projects by providing mortgage or mezzanine financing to hotel developers and through the acquisition of land that is then leased to hotel developers. Interest income is earned on our development loans at rates ranging between 10.0% and 20.0%. Interest income from development loans receivable was $4,686 for the year ended December 31, 2010 compared to $7,411 for the same period in 2009. The decrease in interest income from development loans receivable was due to a decrease in the average balance of development loans receivable outstanding in 2010 due primarily to the settlement of $7.0 million in development loans receivable which was converted into equity in a hotel acquisition. Also contributing to the decrease in interest income from development loans was the impairment of certain loans in 2009.
As hotel developers are engaged in constructing new hotels or renovating existing hotels the hotel properties are typically not generating revenue. It is common for the developers to require construction type loans to finance the projects whereby interest incurred on the loan is not paid currently; rather it is added to the principal borrowed and repaid at maturity. On June 30, 2009, we amended four development loans, with an aggregate principal balance of $40,000 prior to the amendment, to allow the borrower to elect, quarterly, to pay accrued interest in-kind by adding the accrued interest to the principal balance of the loan. As a result, $5,653 in accrued interest on these loans was added to principal since July 1, 2009.
Of the $41,653 in development loans receivable outstanding as of December 31, 2010, $8,000, or 19.2%, is invested in hotels that are currently operating and generating revenue and $33,653, or 80.8%, is invested in hotel construction projects with significant progress made toward completion.
Other revenue consists primarily of fees earned for asset management services provided to properties owned by certain of our unconsolidated joint ventures and land lease revenue. These fees are earned as a percentage of the revenues of the unconsolidated joint ventures’ hotels. Other revenues decreased from $1,981 for the year ended December 31, 2009 to $381 during the year ended December 31, 2010 primarily due to the exit of our two remaining land leases. Because of the economic challenges facing hotel development projects, especially those that are in the early phase of development, we decided during the quarter ended September 30, 2009 to exit our two remaining land leases and dispose of the related land parcels.
Expenses
Total hotel operating expenses increased 27.7% to approximately $158,717 for the year ended December 31, 2010 from $124,294 for the year ended December 31, 2009. Consistent with the increase in hotel operating revenues, hotel operating expenses increased primarily due to the acquisitions consummated since the comparable period in 2009, as mentioned above. The acquisitions also resulted in an increase in depreciation and amortization from $43,187 for the year ended December 31, 2009 to $52,012 for the year ended December 31, 2010. Similarly, real estate and personal property tax and property insurance increased $5,275, or 37.5%, in the year ended December 31, 2010 when compared to the same period in 2009 due to numerous New York acquisitions which carry a high tax rate along with a general overall increase in tax assessments and tax rates as the economy improves.
General and administrative expense increased by approximately $4,372 from $5,891 in 2009 to $10,263 in 2010. Discretionary incentive compensation related to the 2009 fiscal year was determined subsequent to December 31, 2009. As result, incentive compensation of $1,256 earned for the year ended December 31, 2009 was recorded in 2010. Incentive compensation of $1,720 earned for the year ended December 31, 2010 was accrued in the fourth quarter of 2010. In addition, compensation expense increased in 2010 due to increases in employee headcount and increases in base compensation.
Non-cash stock based compensation expense increased $4,506 when comparing the year ended December 31, 2010 to the same period in 2009. In August of 2009, our Compensation Committee established a performance share award program which resulted in $725 in compensation expense during the year ended December 31, 2010 and $140 in compensation expense during the same period in 2009. In April of 2010, our Compensation Committee adopted an annual long term equity incentive program and a multi-year long term equity incentive program. Non-cash compensation expense of $3,397 was recorded in 2010 related to these two programs. Please refer to “Note 9 – Share Based Payments” of the notes to the consolidated financial statements for more information about our stock based compensation.
Included in operating expenses for the year ended December 31, 2009 was an impairment charge of $17,703 recorded on two parcels of land and a hotel. During the year ended December 31, 2010 we determined an additional impairment charge of $2,433 was incurred on one of these parcels of land and the hotel as conditions in these specific markets worsened. Also during the year ended December 31, 2009, we determined that two of our development loans were permanently impaired and, accordingly, we recorded an impairment charge for the remaining principal on these loans in the aggregate amount of $21,408.
Acquisition and terminated transaction costs increased $4,499 from $328 for the year ended December 31, 2009 to $4,827 for the year ended December 31, 2010 due to acquisitions consummated during period ended December 31, 2010. Of these costs incurred, $3,269 related to our acquisition of three hotels acquired in the vicinity of Times Square in New York, NY, $21 related to our acquisition of the Hilton Garden Inn, Glastonbury, CT, $174 related to our acquisition of the Holiday Inn Wall Street in New York, NY, and $1,196 related to our acquisition of the Hampton Inn, Washington, D.C. The remaining costs related to transactions that were terminated during the year. Two acquisitions were consummated during the same period in 2009. Acquisition costs typically consist of transfer taxes, legal fees and other costs associated with acquiring a hotel property.
Unconsolidated Joint Venture Investments
Our interest in the income from unconsolidated joint ventures was $2,257 for the year ended December 31, 2010 compared to a loss of $7,190 for the same period in 2009. Our income from unconsolidated joint ventures for the period ended December 31, 2010 was due, in part, to a $1,818 gain recognized from the remeasurement of our interest in PRA Glastonbury, LLC the owner of the Hilton Garden Inn, Glastonbury, CT, upon our acquisition of our joint venture partner’s 52.0% interest in the venture. In addition, we recorded a $2,190 gain recognized from the remeasurement of our interest in Hiren Boston, LLC, the owner of the Courtyard South Boston, MA. Included in the loss from unconsolidated joint ventures for the year ended December 31, 2009 was an impairment charge of $4,541. Please refer to “Note 3 – Investment in Unconsolidated Joint Ventures” of the notes to the consolidated financial statements for the year ended December 31, 2010 and 2009 for more information about the remeasurement of our interests in PRA Glastonbury, LLC and Hiren Boston, LLC. RevPAR for our unconsolidated hotel portfolio increased 7.0% during the year ended December 31, 2010 when compared to the year ended December 31, 2009, which contributed to the increase in income from unconsolidated joint ventures.
Net Income/Loss
Net loss applicable to common shareholders for the year ended December 31, 2010 was $21,157 compared to net loss applicable to common shareholders of $54,661 for the same period in 2009. This improvement was driven primarily by an increase in operating income. Operating income for the year ended December 31, 2010 was $27,165 compared to operating loss of $8,436 during the same period in 2009. We recorded a gain of $1,869 on the disposition of hotel properties during the year ended December 31, 2009, compared to a $347 gain during the same period in 2010.
Interest expense increased $685 from $45,183 for the year ended December 31, 2009 to $45,868 for the year ended December 31, 2010. Overall, interest expense has remained consistent with our steady debt balance throughout 2010. We incurred $932 of loss on the extinguishment of $54,684 of mortgage indebtedness and notes payable. Proceeds from equity offerings consummated during the year were used to extinguish this debt. The loss on the extinguishment of debt related primarily to write-off of remaining unamortized deferred financing costs at the time of the extinguishment.
COMPARISON OF THE YEAR ENDED DECEMBER 31, 2009 TO DECEMBER 31, 2008
(dollars in thousands, except per share data)
Revenue
Our total revenues for the year ended December 31, 2009 consisted of hotel operating revenues, interest income from our development loan program, and other revenue. Hotel operating revenues are recorded for wholly owned hotels that are leased to our wholly owned TRS and hotels owned through joint venture interests that are consolidated in our financial statements. Hotel operating revenues decreased $23,895, or 10.1%, from $236,247 for the year ended December 31, 2008 to $212,352 for the same period in 2009. This decrease resulted from decreases in both ADR and occupancy. ADR decreased 10.2% from $140.51 for year ended December 31, 2008 to $126.23 during the same period in 2009. Our occupancy rate decreased 439 basis points from approximately 71.8% during the year ended December 31, 2008 to approximately 67.4% for the same period in 2009.
The decrease in hotel operating revenues was only partially offset by the additional hotel operating revenues attributed to the following acquisitions consummated during the year ended December 31, 2009:
|
Brand
|
Location
|
Acquisition Date
|
Rooms
|
2009 Hotel Operating Revenues
|
||||||||
|
Hilton Garden Inn
|
TriBeCa, New York, NY
|
May 1, 2009 * | 151 | $ | 6,761 | |||||||
|
Hampton Inn & Suites
|
West Haven, CT
|
November 4, 2009
|
98 | 374 | ||||||||
| 249 | $ | 7,135 | ||||||||||
*We acquired a 49% interest in the entity that owns the property on May 1, 2009 and acquired the remaining 51% interest on June 30, 2009.
Revenues for both hotels were recorded from the date of acquisition as hotel operating revenues. Further, hotel operating revenues for the year ended December 31, 2009 included revenues for a full year related to six hotels that were purchased during the year ended December 31, 2008. Hotels acquired during the year ended December 31, 2008 would have a full year of results included in the year ended December 31, 2009 but not necessarily a full year of results during the same period in 2008.
We acquired interests in the following six consolidated hotels during the year ended December 31, 2008:
|
Brand
|
Location
|
Acquisition Date
|
Rooms
|
2009 Hotel Operating Revenue
|
2008 Hotel Operating Revenue
|
|||||||||||
|
Duane Street Hotel (TriBeCa)
|
New York, NY
|
1/4/2008
|
45 | $ | 2,836 | $ | 3,688 | |||||||||
|
TownePlace Suites
|
Harrisburg, PA
|
5/8/2008
|
107 | 2,440 | 1,755 | |||||||||||
|
Sheraton Hotel
|
JFK Airport, Jamaica, NY
|
6/13/2008
|
150 | 7,869 | 3,931 | |||||||||||
|
Holiday Inn Express
|
Camp Springs, MD
|
6/26/2008
|
127 | 2,587 | 1,313 | |||||||||||
|
nu Hotel
|
Brooklyn, NY
|
7/7/2008*
|
93 | 4,488 | 2,314 | |||||||||||
|
Hampton Inn & Suites
|
Smithfield, RI
|
8/1/2008
|
101 | 2,033 | 848 | |||||||||||
| 623 | $ | 22,253 | $ | 13,849 | ||||||||||||
* The property was purchased on January 14, 2008 but did not open for business until July 7, 2008.
We have invested in hotel development projects by providing mortgage or mezzanine financing to hotel developers and through the acquisition of land that is then leased to hotel developers. Interest income is earned on our development loans at rates ranging between 10.0% and 20.0%. Interest income from development loans receivable was $7,411 for the year ended December 31, 2009 compared to $7,890 for the same period in 2008. The decrease in interest income from development loans receivable was due to a decrease in the average balance of development loans receivable outstanding in 2009 and cessation of interest accrual on certain loans that were deemed to be impaired, which resulted in a $98, or 32.0% decrease in interest income.
On June 30, 2009, we amended four development loans, with an aggregate principal balance of $40,000 prior to the amendment, to allow the borrower to elect, quarterly, to pay accrued interest in-kind by adding the accrued interest to the principal balance of the loan. As a result, $4,502 in accrued interest on these loans was added to principal for the year ended December 31, 2009.
We monitor our development loan portfolio for indications of impairment considering the current economic environment, the borrowers’ access to other sources of financing to complete their hotel development projects, and the borrowers ability to repay amounts owed to us through the operation or eventual sale of the properties being financed by our loans receivable. Based on our reviews, we determined that our development loans to Brisam East 52, LLC and Brisam Greenwich, LLC, which were secured by the equity interest in each entity, were permanently impaired as of December 31, 2009. We ceased accruing interest on these two loans effective July 1, 2009.
During the year ended December 31, 2008, we recorded an impairment charge for one of our development loans to an unaffiliated developer for the remaining principal of $18,748, which is net of unamortized discount and loan fees in the amount of $1,252. The loan was deemed to be fully impaired when the developer was unable to obtain additional construction financing to complete the project and consequently defaulted under his senior mortgage loan. The project, located in Brooklyn, NY, was to include hotel, residential and retail components, however, the land acquisition financing and our loan were not sufficient to fund the ongoing construction. A receivable for uncollected interest income of $569, which is net of unrecognized deferred loan fees of $143, was also recorded as an impairment charge. In connection with the development loan, we also hold an option to acquire an interest in the hotel upon completion of the development project. This option was valued at $1,687 at its inception and is deemed to be fully impaired. The total impairment charge recorded during the year ended December 31, 2008 related to this development loan and option was $21,004.
Of the $46,094 in development loans receivable outstanding as of December 31, 2009, $15,000, or 32.5%, is invested in hotels that are currently operating and generating revenue and $31,094, or 67.5%, is invested in hotel construction projects with significant progress made toward completion. We have written off and no longer reflect any value for development loans to hotel development projects that are in the early phase of development where development has been limited to land acquisition and site preparation.
Other revenue consists primarily of fees earned for asset management services provided to properties owned by certain of our unconsolidated joint ventures. These fees are earned as a percentage of the revenues of the unconsolidated joint ventures’ hotels. Other revenues decreased from $3,984 for the year ended December 31, 2008 to $1,981 during the year ended December 31, 2009 primarily due to a decrease in asset management as a result of declining revenues at properties owned by certain of our unconsolidated joint ventures.
Expenses
Total hotel operating expenses decreased 7.1% to approximately $124,294 for the year ended December 31, 2009 from $133,762 for the year ended December 31, 2008. As a result of declining hotel operating revenues, our hotel operators implemented cost reduction and cost containment initiatives to reduce hotel operating expenses. Decreases in our hotel operating expenses resulting from lower occupancies and our operators cost reduction initiatives were partially offset by increases in hotel operating expenses due to the acquisitions consummated since January 1, 2008, as mentioned above. The acquisitions also resulted in an increase in depreciation and amortization from $38,989 for the year ended December 31, 2008 to $43,187 for the year ended December 31, 2009. Similarly, real estate and personal property tax and property insurance increased $1,501, or 12.0%, in the year ended December 31, 2009 when compared to the same period in 2008.
General and administrative expense decreased by approximately $1,317 from $7,208 in 2008 to $5,891 in 2009. As of December 31, 2009, discretionary incentive compensation related to 2009 fiscal year had not been determined and, accordingly, no expense had been accrued. General and administrative expense for the year ended December 31, 2008 included a charge of $1,253 for incentive compensation related to the 2008 fiscal year. Non-cash stock based compensation expense increased $641 when comparing the year ended December 31, 2009 to the same period in 2008 as a result of increased vesting of restricted shares and performance shares issued and earned during the year ended December 31, 2009.
Unconsolidated Joint Venture Investments
For the year ended December 31, 2009, we recorded $7,190 in loss from unconsolidated joint ventures compared to $517 in loss from unconsolidated joint ventures for the same period in 2008.
Included in the loss from unconsolidated joint ventures for the year ended December 31, 2009 was an impairment charge of $4,541. Through our investment in Hiren Boston, LLC joint venture, we have a 50% interest the Courtyard, South Boston, MA. We determined that our interest in this hotel was impaired and, as of December 31, 2009, we recorded an impairment loss of approximately $3,500 which represents our entire investment in the hotel. Through our investment in PRA Suites at Glastonbury, LLC joint venture, we have a 48% interest in the Homewood Suites, Glastonbury, CT. In 2009, we entered into an agreement to transfer our interest in this hotel to our joint venture partner as partial consideration for the purchase of our joint venture partner’s 52% interest in PRA Glastonbury, LLC, the owner of the Hilton Garden Inn, Glastonbury, CT. This transaction closed effective January 1, 2010. We determined that the carrying value of our interest in the Homewood Suites, Glastonbury, CT exceeded fair value and, as of December 31, 2009, we recorded an impairment loss of $1,041. As a result of this transaction, as of January 1, 2010 we own a 100% interest in the Hilton Garden Inn, Glastonbury, CT and have no remaining interest in the Homewood Suites, Glastonbury, CT. The purchase of the Hilton Garden Inn, Glastonbury, CT in 2010 resulted in a $1,818 gain as a result of applying purchase accounting and the subsequent remeasurement of our previously held 48% interest was recorded in the first quarter of 2010.
Through our investment in the Mystic Partners, LLC joint venture, we have an 8.8% interest in the Hilton Hotel in Hartford, CT. In 2008, we determined that our interest in this hotel was impaired. As of December 31, 2008, we recorded an impairment loss of approximately $1,890 which represents our entire investment in the hotel.
For the year ended December 31, 2009, loss from our investment in unconsolidated joint ventures, excluding the impairment charges noted above, was $2,649. This compares to income from our investment in unconsolidated joint ventures, excluding the impairment charges noted above, of $1,373 for the same period in 2008. This decrease was the result of deteriorating revenues in the hotels owned by our unconsolidated joint ventures. The operating factors impacting the results of our hotels owned by our unconsolidated joint ventures are consistent with those described above in the discussion of our consolidated hotels, and include declining ADR, occupancy and RevPAR.
Net Income/Loss
Net loss applicable to common shareholders for year ended December 31, 2009 was $54,661 compared to net loss applicable to common shareholders of $13,608 for the same period in 2008.
Operating loss for the year ended December 31, 2009 was $8,436 compared to operating income of $31,677 during the same period in 2008. The $40,113, or 126.6%, decrease in operating income was primarily the result of the impairment charge of $21,408 related to our investment in a development loan and an option to acquire the hotel property upon completion, noted above.
Also contributing to the net loss recorded during the year ended December 31, 2009 was an impairment charge of $17,703 recorded on two parcels of land and a hotel, each of which is classified as held for sale as of December 31, 2009. Due to the economic challenges facing hotel development projects, especially those that are in the early phase of development, we decided during the quarter ended September 30, 2009 to exit our two remaining land leases and dispose of the related land parcels. Effective July 1, 2009, we ceased accruing rents under these leases. We determined that the carrying value of the land exceeded fair value and we recorded an impairment of $14,545. We also determined that accrued rents under the leases were uncollectible and accrued rents receivable of $1,579 was expensed during the year ended December 31, 2009. In addition, we committed to a plan to sell one of our hotels and determined that carrying value of this property exceeded fair value by $1,558 which was recorded as an impairment charge during the year ended December 31, 2009.
In addition, we recorded a gain of $2,888 on the disposition of hotel properties during the year ended December 31, 2008, compared to a $1,869 gain during the same period in 2009.
Interest expense increased $1,877 from $43,306 for the year ended December 31, 2008 to $45,183 for the year ended December 31, 2009. The increase in interest expense is the result of mortgages placed on newly acquired properties and increased average balances on our line of credit.
LIQUIDITY, CAPITAL RESOURCES, AND EQUITY OFFERINGS
(dollars in thousands, except per share data)
Debt and Equity Offerings
The ability to originate or refinance existing loans has become and continues to be very restrictive for all borrowers, even for those borrowers that have strong balance sheets. While we maintain a portfolio of what we believe to be high quality assets and we believe our leverage to be at acceptable levels, the market for new debt origination and refinancing of existing debt remains challenging and visibility on the length of debt terms, the loan to value parameters and loan pricing on new debt originations is limited.
Our organizational documents do not limit the amount of indebtedness that we may incur. In the current economic environment, the fair market value of certain of our hotel properties may have declined causing some of our indebtedness to exceed the percentage of an individual hotel property’s fair market value our Board of Trustees intended at the time we acquired the property.
Our ability to incur additional debt is dependent upon a number of factors, including the current state of the overall credit markets, our degree of leverage and borrowing restrictions imposed by existing lenders. Our ability to raise funds through the issuance of debt and equity securities is dependent upon, among other things, capital market volatility, risk tolerance of investors, general market conditions for REITs and market perceptions related to the Company’s ability to generate cash flow and positive returns on its investments.
Prior to November 5, 2010, we maintained a revolving credit facility with a syndicate of lenders that had committed up to $135,000. On November 5, 2010, we entered into a new revolving credit facility, which provides for a revolving line of credit in the principal amount of up to $250,000. Our previous line of credit, which allowed for borrowings of up to $135,000 was replaced by this new line, and the new line of credit allows us additional borrowing capacity for future acquisitions and working capital. As of December 31, 2010, we had $46,000 in borrowings under the line of credit and $6,927 in letters of credit outstanding under this facility resulting in a remaining borrowing capacity under the line of credit of $197,073. The new line of credit expires on November 5, 2013 and includes an extension of the maturity date until November 5, 2014 at the sole discretion of the lenders. We intend to repay indebtedness incurred under the new line of credit from time to time, for acquisitions or otherwise, out of cash flow from operations and from the proceeds of issuances of additional common shares and other securities. For additional information regarding our revolving credit facility, including important terms, covenants and financial ratios, see “Note 6 – Debt” in our consolidated financial statements included herein.
We will continue to monitor our debt maturities to manage our liquidity needs. However, no assurances can be given that we will be successful in refinancing all or a portion of our future debt obligations due to factors beyond our control or that, if refinanced, the terms of such debt will not vary from the existing terms. As of December 31, 2010, we have $17,861 coming due on or before December 31, 2011. We currently expect that cash requirements for all debt that is not refinanced by our existing lenders will be met through a combination of cash on hand, refinancing the existing debt with new lenders, draws on our credit facility and issuing public debt or equity.
During 2010, we completed three public offerings, in which 108,100,000 common shares were sold by us through several underwriters for net proceeds to us of approximately $421,734 before the payment of offering-related expenses. Immediately upon closing of each offering, we contributed all of the net proceeds of the offering to HHLP in exchange for additional common units of limited partnership in HHLP, or Common Units. Aggregate offering-related expenses associated with these three offerings were approximately $1,293, resulting in net proceeds after expenses of $420,441.
Development Loans Receivable
The current borrowing environment has made it difficult for our development loan borrowers to obtain or renew construction financing to complete certain hotel development projects for which we have provided development loan financing. As of December 31, 2010, we have $41,653 in development loan principal receivable and $3,013 in accrued interest receivable on these loans.
Each of these loans matures at some time within the next twelve to eighteen months. Most of our development loans have options to extend the maturity of the loan for periods up to three years from the original maturity date of the loan. Each of these development loans also provides us with a right of first offer on hotels constructed through the development loan program. We expect most development loan borrowers to take advantage of these extension options. In addition, we may convert the principal and interest due to us on those development loans that are not extended into equity interests in the hotels developed allowing us to acquire new hotel properties without a significant additional outlay of cash.
In addition, the contractual terms of two development loans allow borrowers the option to add accrued interest to the loan principal in lieu of making current interest payments. As a result of these amendments, $2,559 of accrued interest was added to loan principal for year ended December 31, 2010. We do not expect the payments of principal or accrued interest on the development loans to be a significant source of liquidity over the next twelve to eighteen months.
Acquisitions
On January 1, 2010, we acquired our joint venture partner’s 52% membership interest in PRA Glastonbury, LLC, the owner of the Hilton Garden Inn, Glastonbury, CT, and this hotel became one of our wholly-owned hotels.
On February 9, 2010, we completed the acquisition of a Hampton Inn, a Holiday Inn Express and a Candlewood Suites located in the area of Times Square, New York, NY. The total purchase price for the three hotels was $166,089 and consisted of $160,500 in cash, $290 in franchise fees and 1,451,613 Common Units. In addition, we paid closing costs of $3,228 and acquired approximately $63 in net working capital assets. Cash required for this acquisition was generated primarily from the net proceeds of our recently completed public offering of common shares and borrowings under our line of credit.
On May 7, 2010, we entered into a contribution agreement with an unrelated third party and closed on the acquisition of 100% of the membership interests in Maiden Hotel LLC, the owner of the Wall Street Holiday Inn, New York, NY. The aggregate purchase price paid for the membership interests in Maiden Hotel LLC was approximately $34,876. The purchase price paid included the issuance of 200,000 Common Units, valued at $957, the settlement of $7,839 of existing mezzanine financing and accrued interest income, $57 in franchise fees and the payment of approximately $26,023 in cash provided, in part, from borrowings under our existing line of credit. Upon completion of the acquisition of the membership interests, the hotel owned by Maiden Hotel LLC was unencumbered of debt. In addition, we paid closing costs of $151 and acquired approximately $511 in net working capital.
On September 1, 2010, we entered into a purchase and sale agreement with an unrelated third party and closed on the acquisition of Hampton Inn, Washington, DC. The total purchase price for this hotel was $73,096 and consisted of $72,988 in cash and $108 in franchise fees. In addition, we paid closing costs of $1,188 and acquired approximately $304 in net working capital assets.
On December 28, 2010 we closed on the acquisition of a parcel of land which included a multi-story vacant hotel building with an unrelated third party in New Castle, DE. The total purchase price for this hotel was $15,301, which was paid in cash. We have begun the process of converting this hotel building into a Sheraton. The conversion is currently budgeted at $5.5 million and has an estimated completion date of June 2011.
Purchase agreements related to the Holiday Inn Express, Camp Springs, MD and Hampton Inn and Suites, Smithfield, RI hotels contained certain earn-out provisions that entitled the seller to a payment based on operating metrics of the hotel properties. As of December 31, 2010, the earnout period expired for these properties. These properties did not meet the required net operating income thresholds established in the properties’ purchase agreements. As such, no amounts were paid or are payable to the sellers under these earn-out provisions.
We intend to invest in additional hotels only as suitable opportunities arise and adequate sources of financing are available. We expect that future investments in hotels will depend on and will be financed by, in whole or in part, our existing cash, the proceeds from additional issuances of common or preferred shares, issuances of Common Units, issuances of preferred units or other securities or borrowings.
Operating Liquidity and Capital Expenditures
We expect to meet our short-term liquidity requirements generally through net cash provided by operations, existing cash balances and, if necessary, short-term borrowings under our line of credit. We believe that the net cash provided by operations in the coming year will be adequate to fund the Company’s operating requirements, monthly recurring debt service and the payment of dividends in accordance with REIT requirements of the federal income tax laws.
Beginning with our dividend declaration in the second quarter of 2009, the Company reduced its quarterly dividend payment by approximately 72% in order to preserve cash. As noted above, we issued common shares in public offerings and issued Common Units in connection with our acquisition of hotel properties. Assuming we continue to make distributions to our common shareholders and common unitholders at our current rate and assuming no additional common shares or common units are issued, these distributions would approximate $35,325 over the next twelve months. We cannot guarantee that we will continue to make distributions to our shareholders at the current rate or at all. While, due to the seasonality of our business, cash provided by operating activities fluctuates significantly from quarter to quarter, we believe, based on our current estimates, which include the addition of cash provided by hotels acquired in 2010, that our cash provided by operating activities will be sufficient over the next twelve months to fund the payment of our dividend at its current level. However, our Board of Trustees continues to evaluate the dividend policy in the context of our overall liquidity and market conditions and may elect to further reduce or suspend these distributions. Cash provided by operating activities for the year ended December 31, 2010 was $46,246 and cash used for the payment of distributions and dividends for the year ended December 31, 2010 was $30,253.
Owning hotels is a capital intensive enterprise. Hotels are expensive to acquire or build and require regular significant capital expenditures to satisfy guest expectations. However, even with current depressed cash flows, we project that our operating cash flow and credit facility will be sufficient to satisfy almost all of our liquidity and other capital needs over the next twelve to eighteen months.
We make available to the TRS Lessees of our hotels 4% (6% for full service properties) of gross revenues per quarter, on a cumulative basis, for periodic replacement or refurbishment of furniture, fixtures and equipment at each of our hotels. We believe that this reserve is a prudent estimate for future capital expenditure requirements. During 2009, our hotel managers had implemented a policy of limiting capital expenditures to only those projects that impact safety to our guests or preserve the value of our hotel assets. As economic conditions have improved, we have begun to fund addition capital expenditures, including the lobby renovation of several of our hotels. In addition, we completed a renovation converting two of our existing adjoining hotel properties in King of Prussia, PA into one Hyatt Place during the third quarter of 2010. The total cost to complete this conversion was approximately $6,471, net of $1,200 received from the franchisor upon the completion of the conversion. The renovations were completed and the hotel opened on August 17, 2010. The cash required to complete this project was provided by cash from our equity offerings and operations, as well as borrowings under credit facility.
We have increased our spending on capital improvements during the year ended December 31, 2010 when compared to the same period in 2009. During the year ended December 31, 2010 we spent $10,328 on capital expenditures to renovate, improve or replace assets at our hotels. This compares to $6,138 during the same period in 2009. Our increase in capital expenditures is a result of complying with brand mandated improvements and initiating projects that we believe will generate a return on investment as we enter a period of recovery in the lodging sector. We expect further expansion of our capital expenditures in 2011 in an effort to invest in projects that we believe will generate additional returns as economic conditions improve. We may spend amounts in excess of the obligated amounts if necessary to comply with the reasonable requirements of any franchise license under which any of our hotels operate and otherwise to the extent we deem such expenditures to be in our best interests. We are also obligated to fund the cost of certain capital improvements to our hotels. We will use undistributed cash or borrowings under credit facilities to pay for the cost of capital improvements and any furniture, fixture and equipment requirements in excess of the set aside referenced above.
CASH FLOW ANALYSIS
(dollars in thousands, except per share data)
Comparison of Year Ended December 31, 2010 to Year Ended December 31, 2009
Net cash provided by operating activities for the year ended December 31, 2010, and 2009, was $46,246 and $21,532, respectively. Primarily as a result of our acquisitions and improving ADR and occupancy at our wholly owned hotel properties, income before gain on disposition of hotel properties, impairment charges, depreciation and amortization, debt extinguishment and stock based compensation increased $24,495 during the year ended December 31, 2010 when compared to the same period in 2009.
Net cash used in investing activities for the year ended December 31, 2010 increased $305,437, from $8,921 in the year ended December 31, 2009 compared to $314,358 for the year ended December 31, 2010. During the year ended December 31, 2010, we used $280,731 to acquire seven properties. This compares to just $9,315 to acquire two properties during the same period in 2009. We have also funded $6,471 in construction costs for the conversion of two of our existing adjoined hotels into a Hyatt Place and a $5,500 deposit for the acquisition of hotel properties. In addition, we invested $13,750 to purchase a mortgage loan secured by the Courtyard by Marriott, located in South Boston, MA, a hotel which is owned by a joint venture in which we have a 50% ownership interest. Offsetting these increases in cash used in investing activities was a decrease of $2,000 in cash used to invest in development loans receivable for the year ended December 31, 2010 when compared to the same period in 2009.
Net cash provided by financing activities for the year ended December 31, 2010 was $322,304 compared to cash used in financing activities of $16,904 during the same period in 2009. During the year ended December 31, 2010, we issued 108,100,000 common shares resulting in net proceeds of $420,441. Net repayments under our credit facility were $33,200 during the year ended December 31, 2010 compared to net repayments of $9,221 during the same period in 2009. Net repayments of our mortgages and notes payable were $30,274 during the year ended December 31, 2010 compared to net proceeds of $2,923 during the same period in 2009.
Comparison of Year Ended December 31, 2009 to Year Ended December 31, 2008
Net cash provided by operating activities for the year ended December 31, 2009, and 2008, was $21,532 and $53,894, respectively. Primarily as a result of declining ADR and occupancy at our wholly owned hotel properties, income before impairment charges, depreciation and amortization, and debt extinguishment decreased $27,380 during the year ended December 31, 2009 when compared to the same period in 2008. In addition, the modification of four development loans to allow borrowers the option to add accrued interest to the loan principal in lieu of making current interest payments resulted in $3,253 in current year development loan interest income that was added to principal and is not currently a source of operating cash. Cash from operating activities of $3,770 has also been used to fund increases in our escrow deposits. The increase in our escrow deposits is a result of reduced access to these funds due to decreases in our capital expenditures.
Net cash used in investing activities for the year ended December 31, 2009 decreased $105,949, from $114,870 in the year ended December 31, 2008 to $8,921 for the year ended December 31, 2009. During the year ended December 31, 2008, we acquired six properties for a total purchase price of $115,859, including the assumption of $30,790 in mortgage debt, the issuance of a $500 note payable, the assumption of $318 of operating liabilities and the issuance of units in our operating partnership valued at $21,624 resulting in net cash paid for acquisitions of $63,626. During the same period in 2009, we acquired two properties for a total purchase price of $80,000, including the assumption of $37,524 in mortgage debt, the assumption of $3,043 of operating liabilities, the conversion of $20,000 in development loans and accrued interest, the conveyance of land and accrued rent receivable with a net value of $10,118 and cash held back at settlement of $1,200 resulting in net cash paid for acquisitions of $9,315. We used $1,200 of the cash held back at settlement to facilitate the conveyance of land to the seller of the property during the year ended December 31, 2009. We decreased our capital expenditures from $19,226 during the year ended December 31, 2008 to $6,138 during the same period in 2009. This decrease was the result of our initiatives to defer capital expenditures where appropriate, reducing capital expenditures on a year over year basis. In addition, cash used to invest in development loans receivable, net of repayments, was $41,784 for the year ended December 31, 2008 compared to $1,500 for the same period in 2009. In addition, the sale of hotel properties during the year ended December 31, 2009 provided $8,524 in cash proceeds compared to $6,456 provided during 2008. Net cash distributions from unconsolidated joint ventures decreased $2,509 from net distributions received of $2,017 during 2008 to net contributions made of $492 in 2009, primarily as a result of declining operating results in the hotels owned by our unconsolidated joint ventures.
Net cash used in financing activities for the year ended December 31, 2009 was $16,904 compared to cash provided by financing activities of $64,346 for the year ended December 31, 2008. During year ended December 31, 2008, we issued 6,600,000 common shares resulting in net proceeds of $61,845. During the year ended December 31, 2009, we issued 8,442,300 common shares resulting in net proceeds of $21,339. The Company reduced its quarterly common dividend rate by 72% from $0.18 per share to $0.05 per share beginning with the dividend and distribution payment in July of 2009. Total dividends and distributions decreased $11,249 during the year ended December 31, 2009 when compared to the same period in 2008 due to the decrease in the rate of dividends and distributions, partially offset by an increase in dividend due to an increased number of shares outstanding. Net proceeds from mortgages and notes payable were $1,735 during the year ended December 31, 2008 compared to net proceeds of $2,923 for the same period in 2009. Net repayments of our credit facility were $9,221 during the year ended December 31, 2009 compared to net proceeds of $44,721 during the same period in 2008. The decrease in borrowings from our credit facility is a result of a decrease in acquisition activity requiring short term borrowings and an effort to lower debt levels.
OFF BALANCE SHEET ARRANGEMENTS
The Company does not have off balance sheet arrangements that have or are reasonably likely to have a current or future effect on our financial condition, revenues or expenses, results of operations, liquidity, capital expenditures or capital resources.
FUNDS FROM OPERATIONS
(in thousands, except share data)
The National Association of Real Estate Investment Trusts (“NAREIT”) developed Funds from Operations (“FFO”) as a non-GAAP financial measure of performance of an equity REIT in order to recognize that income-producing real estate historically has not depreciated on the basis determined under GAAP. We calculate FFO applicable to common shares and Partnership units in accordance with the April 2002 National Policy Bulletin of NAREIT, which we refer to as the White Paper. The White Paper defines FFO as net income (loss) (computed in accordance with GAAP) excluding extraordinary items as defined under GAAP and gains or losses from sales of previously depreciated assets, plus certain non-cash items, such as depreciation and amortization, and after adjustments for unconsolidated partnerships and joint ventures. Our interpretation of the NAREIT definition is that minority interest in net income (loss) should be added back to (deducted from) net income (loss) as part of reconciling net income (loss) to FFO. Our FFO computation may not be comparable to FFO reported by other REITs that do not compute FFO in accordance with the NAREIT definition, or that interpret the NAREIT definition differently than we do.
The GAAP measure that we believe to be most directly comparable to FFO, net income (loss) applicable to common shares, includes depreciation and amortization expenses, gains or losses on property sales, minority interest and preferred dividends. In computing FFO, we eliminate these items because, in our view, they are not indicative of the results from our property operations.
FFO does not represent cash flows from operating activities in accordance with GAAP and should not be considered an alternative to net income as an indication of Hersha’s performance or to cash flow as a measure of liquidity or ability to make distributions. We consider FFO to be a meaningful, additional measure of operating performance because it excludes the effects of the assumption that the value of real estate assets diminishes predictably over time, and because it is widely used by industry analysts as a performance measure. We show both FFO from consolidated hotel operations and FFO from unconsolidated joint ventures because we believe it is meaningful for the investor to understand the relative contributions from our consolidated and unconsolidated hotels. The display of both FFO from consolidated hotels and FFO from unconsolidated joint ventures allows for a detailed analysis of the operating performance of our hotel portfolio by management and investors. We present FFO applicable to common shares and Partnership units because our Partnership units are redeemable for common shares. We believe it is meaningful for the investor to understand FFO applicable to all common shares and Partnership units.
The following table reconciles FFO for the periods presented to the most directly comparable GAAP measure, net income, for the same periods.
|
Twelve Months Ended
|
||||||||||||
|
December 31, 2010
|
December 31, 2009
|
December 31, 2008
|
||||||||||
|
Net (loss) income applicable to common shares
|
$ | (21,157 | ) | $ | (54,661 | ) | $ | (13,608 | ) | |||
|
(Loss) income allocated to noncontrolling interest
|
(845 | ) | (8,597 | ) | (1,621 | ) | ||||||
|
Loss (income) from unconsolidated joint ventures
|
(2,257 | ) | 7,190 | 517 | ||||||||
|
Gain on sale of assets
|
(347 | ) | (1,869 | ) | (2,888 | ) | ||||||
|
Depreciation and amortization
|
52,012 | 43,187 | 38,989 | |||||||||
|
Depreciation and amortization from discontinued operations
|
87 | 1,098 | 2,429 | |||||||||
|
FFO related to the noncontrolling interest in consolidated joint ventures (1)
|
(307 | ) | (98 | ) | (240 | ) | ||||||
|
Funds from consolidated hotel operations applicable to common shares and Partnership units
|
27,186 | (13,750 | ) | 23,578 | ||||||||
|
(Loss) income from unconsolidated joint ventures
|
2,257 | (7,190 | ) | (517 | ) | |||||||
|
Less:
|
||||||||||||
|
Gain from remeasurement of investment in unconsolidated joint ventures
|
(4,008 | ) | - | - | ||||||||
|
Add:
|
||||||||||||
|
Depreciation and amortization of purchase price in excess of historical cost (2)
|
2,033 | 2,137 | 2,093 | |||||||||
|
Interest in depreciation and amortization of unconsolidated joint venture (3)
|
3,905 | 2,891 | 6,287 | |||||||||
|
Funds from unconsolidated joint ventures operations applicable to common shares and Partnership units
|
4,187 | (2,162 | ) | 7,863 | ||||||||
|
Funds from Operations applicable to common shares and Partnership units
|
$ | 31,373 | $ | (15,912 | ) | $ | 31,441 | |||||
|
Weighted Average Common Shares and Units Outstanding
|
||||||||||||
|
Basic
|
134,370,172 | 51,027,742 | 45,184,127 | |||||||||
|
Diluted
|
146,656,308 | 59,752,467 | 53,218,864 | |||||||||
|
|
(1)
|
Adjustment made to deduct FFO related to the noncontrolling interest in our consolidated joint ventures; represents the portion of net income and depreciation allocated to our joint venture partners.
|
|
|
(2)
|
Adjustment made to add depreciation of purchase price in excess of historical cost of the assets in the unconsolidated joint venture at the time of our investment.
|
|
|
(3)
|
Adjustment made to add our interest in real estate related depreciation and amortization of our unconsolidated joint ventures.
|
Comparison of the year ended December 31, 2010 to December 31, 2009
FFO was $31,373 for the year ended December 31, 2010, which was an increase of $47,285 or 297.2% over FFO in the comparable period in 2009, which was a deficit of $15,912. FFO for the year ended December 31, 2009 was negatively impacted by impairment charges of $39,111 incurred during the twelve months ended December 31, 2009 compared to $2,433 incurred during the same period in 2010. The increase in FFO was also a result of the acquisitions consummated in 2010 and 2009 and a strengthening economy.
Comparison of the year ended December 31, 2009 to December 31, 2008
FFO was a deficit of $15,912 for the year ended December 31, 2009, which was a decrease of $47,353 or 150.6%, over FFO in the comparable period in 2008, which was $31,441. FFO for year ended December 31, 2009 was negatively impacted by impairment charges of $39,111 incurred during the twelve months ended December 31, 2009 compared to $21,004 incurred during the same period in 2008. Other than these impairment charges, the decrease in FFO was primarily a result of worsening economic conditions which has caused occupancies and average daily rates to decline at our hotel properties. The decrease in revenues has only been partially offset by decreases in operating expenses resulting from declines in occupancy and our hotel operators cost reduction initiatives. FFO was also negatively impacted by increases in our interest expense during the year ended December 31, 2009.
CRITICAL ACCOUNTING POLICIES AND ESTIMATES
Our discussion and analysis of our financial condition and results of operations are based upon our consolidated financial statements, which have been prepared in accordance with accounting principles generally accepted in the United States. The preparation of these financial statements requires us to make estimates and judgments that affect the reported amounts of assets, liabilities, revenues and expenses, and related disclosure of contingent assets and liabilities.
On an on-going basis, estimates are evaluated by us, including those related to carrying value of investments in hotel properties. Our estimates are based upon historical experience and on various other assumptions we believe to be reasonable under the circumstances, the results of which form the basis for making judgments about the carrying values of assets and liabilities that are not readily apparent from other sources. Actual results may differ from these estimates under different assumptions or conditions.
We believe the following critical accounting policies affect our more significant judgments and estimates used in the preparation of our consolidated financial statements:
Revenue Recognition
Approximately 95% of our revenues are derived from hotel room revenues and revenue from other hotel operating departments. We directly recognize revenue and expense for all consolidated hotels as hotel operating revenue and hotel operating expense when earned and incurred. These revenues are recorded net of any sales or occupancy taxes collected from our guests. All revenues are recorded on an accrual basis, as earned. We participate in frequent guest programs sponsored by the brand owners of our hotels and we expense the charges associated with those programs, as incurred.
Revenue for interest on development loan financing is recorded in the period earned based on the interest rate of the loan and outstanding balance during the period. Development loans receivable and accrued interest on the development loans receivable are evaluated to determine if outstanding balances are collectible. Interest is recorded only if it is determined the outstanding loan balance and accrued interest balance are collectible.
Other revenues consist primarily of fees earned for asset management services provided to hotels we own through unconsolidated joint ventures. Fees are earned as a percentage of hotel revenue and are recorded in the period earned.
Investment in Hotel Properties
Investments in hotel properties are recorded at cost. Improvements and replacements are capitalized when they extend the useful life of the asset. Costs of repairs and maintenance are expensed as incurred. Depreciation is computed using the straight-line method over the estimated useful life of up to 40 years for buildings and improvements, two to seven years for furniture, fixtures and equipment. We are required to make subjective assessments as to the useful lives of our properties for purposes of determining the amount of depreciation to record on an annual basis with respect to our investments in hotel properties. These assessments have a direct impact on our net income because if we were to shorten the expected useful lives of our investments in hotel properties we would depreciate these investments over fewer years, resulting in more depreciation expense and lower net income on an annual basis.
Most identifiable assets, liabilities, noncontrolling interests, and goodwill related to hotel properties acquired in a business combination are recorded at full fair value. Estimating techniques and assumptions used in determining fair values involve significant estimates and judgments. These estimates and judgments have a direct impact on the carrying value of our assets and liabilities which can directly impact the amount of depreciation expense recorded on an annual basis and could have an impact on our assessment of potential impairment of our investment in hotel properties.
The operations related to properties that have been sold or properties that are intended to be sold are presented as discontinued operations in the statement of operations for all periods presented, and properties intended to be sold are designated as “held for sale” on the balance sheet.
Based on the occurrence of certain events or changes in circumstances, we review the recoverability of the property’s carrying value. Such events or changes in circumstances include the following:
|
|
·
|
a significant decrease in the market price of a long-lived asset;
|
|
|
·
|
a significant adverse change in the extent or manner in which a long-lived asset is being used or in its physical condition;
|
|
|
·
|
a significant adverse change in legal factors or in the business climate that could affect the value of a long-lived asset, including an adverse action or assessment by a regulator;
|
|
|
·
|
an accumulation of costs significantly in excess of the amount originally expected for the acquisition or construction of a long-lived asset;
|
|
|
·
|
a current-period operating or cash flow loss combined with a history of operating or cash flow losses or a projection or forecast that demonstrates continuing losses associated with the use of a long-lived asset; and
|
|
|
·
|
a current expectation that, it is more likely than not that, a long-lived asset will be sold or otherwise disposed of significantly before the end of its previously estimated useful life.
|
We review our portfolio on an on-going basis to evaluate the existence of any of the aforementioned events or changes in circumstances that would require us to test for recoverability. In general, our review of recoverability is based on an estimate of the future undiscounted cash flows, excluding interest charges, expected to result from the property’s use and eventual disposition. These estimates consider factors such as expected future operating income, market and other applicable trends and residual value expected, as well as the effects of hotel demand, competition and other factors. If impairment exists due to the inability to recover the carrying value of a property, an impairment loss is recorded to the extent that the carrying value exceeds the estimated fair value of the property. We are required to make subjective assessments as to whether there are impairments in the values of our investments in hotel properties.
As of December 31, 2010, based on our analysis, we have determined that the future cash flow of each of the properties in our portfolio is sufficient to recover its carrying value.
Investment in Joint Ventures
Properties owned in joint ventures are consolidated if the determination is made that we are the primary beneficiary in a variable interest entity (VIE) or we maintain control of the asset through our voting interest or other rights in the operation of the entity. To determine if we are the primary beneficiary of a VIE, we evaluate whether we have a controlling financial interest in that VIE through means other than voting rights. Our examination of each joint venture consists of reviewing the sufficiency of equity at risk, controlling financial interests, voting rights, and the obligation to absorb expected losses and expected gains, including residual returns. Control can also be demonstrated by the ability of the general partner to manage day-to-day operations, refinance debt and sell the assets of the partnerships without the consent of the limited partners and the inability of the limited partners to replace the general partner. This evaluation requires significant judgment.
If it is determined that we do not have a controlling interest in a joint venture, either through our financial interest in a VIE or our voting interest in a voting interest entity, the equity method of accounting is used. Under this method, the investment, originally recorded at cost, is adjusted to recognize our share of net earnings or losses of the affiliates as they occur rather than as dividends or other distributions are received, limited to the extent of our investment in, advances to and commitments for the investee. Pursuant to our joint venture agreements, allocations of profits and losses of some of our investments in unconsolidated joint ventures may be allocated disproportionately as compared to nominal ownership percentages due to specified preferred return rate thresholds.
The Company periodically reviews the carrying value of its investment in unconsolidated joint ventures to determine if circumstances exist indicating impairment to the carrying value of the investment that is other than temporary. When an impairment indicator is present, we will estimate the fair value of the investment. Our estimate of fair value takes into consideration factors such as expected future operating income, trends and prospects, as well as the effects of demand, competition and other factors. This determination requires significant estimates by management, including the expected cash flows to be generated by the assets owned and operated by the joint venture. Subsequent changes in estimates could impact the determination of whether impairment exists. To the extent impairment has occurred, the loss will be measured as the excess of the carrying amount over the fair value of our investment in the unconsolidated joint venture.
As of December 31, 2010, based on our analysis, we have determined that the fair value of each of our investments in unconsolidated joint ventures exceeds the carrying value of our investment in each joint venture.
Development Loans Receivable
The Company accounts for the credit risk associated with its development loans receivable by monitoring the portfolio for indications of impairment. Our methodology consists of the following:
|
|
·
|
Identifying loans for individual review. In general, these consist of development loans that are not performing in accordance with the contractual terms of the loan.
|
|
|
·
|
Assessing whether the loans identified for review are impaired. That is, whether it is probable that all amounts will not be collected according to the contractual terms of the loan agreement. We determine the amount of impairment by calculating the estimated fair value, discounted cash flows or the value of the underlying collateral.
|
Any charge to earnings necessary based on our review is recorded on our income statement as an impairment of a development loan receivable. Our assessment of impairment is based on information known at the time of the review. Changes in factors underlying the assessment could have a material impact on the amount of impairment to be charged against earnings. Such changes could impact future results.
Based on our reviews, we determined that it is probable that all amounts will be collected according to the contractual terms of each of our development loan agreements.
Accounting for Derivative Financial Investments and Hedging Activities
We use derivatives to hedge, fix and cap interest rate risk and we account for our derivative and hedging activities by recording all derivative instruments at fair value on the balance sheet. Derivative instruments designated in a hedge relationship to mitigate exposure to variability in expected future cash flows, or other types of forecasted transactions, are considered cash flow hedges. We formally document all relationships between hedging instruments and hedged items, as well as our risk-management objective and strategy for undertaking each hedge transaction. Cash flow hedges that are considered highly effective are accounted for by recording the fair value of the derivative instrument on the balance sheet as either an asset or liability, with a corresponding amount recorded in other comprehensive income within shareholders’ equity. Amounts are reclassified from other comprehensive income to the income statements in the period or periods the hedged forecasted transaction affects earnings.
Under cash flow hedges, derivative gains and losses not considered highly effective in hedging the change in expected cash flows of the hedged item are recognized immediately in the income statement. For hedge transactions that do not qualify for the short-cut method, at the hedge’s inception and on a regular basis thereafter, a formal assessment is performed to determine whether changes in the cash flows of the derivative instruments have been highly effective in offsetting changes in cash flows of the hedged items and whether they are expected to be highly effective in the future.
RECENTLY ISSUED ACCOUNTING STANDARDS
Consolidation of Variable Interest Entities
On January 1, 2010, the Company adopted a pronouncement that amends existing US GAAP as follows: (a) to require an enterprise to perform an analysis to determine whether the enterprise’s variable interest or interests give it a controlling financial interest in a variable interest entity and to identify the primary beneficiary of a variable interest entity, (b) to require ongoing reassessment of whether an enterprise is the primary beneficiary of a variable interest entity, rather than only when specific events occur, (c) to eliminate the quantitative approach previously required for determining the primary beneficiary of a variable interest entity, (d) to amend certain guidance for determining whether an entity is a variable interest entity, (e) to add an additional reconsideration event when changes in facts and circumstances pertinent to a variable interest entity occur, (f) to eliminate the exception for troubled debt restructuring regarding variable interest entity reconsideration, and (g) to require advanced disclosures that are intended to provide users of financial statements with more transparent information about an enterprise’s involvement in a variable interest entity. Upon adoption, the Company re-evaluated each of its investments and contractual relationships to determine whether they met the guidelines of consolidation, in light of the amendments described above. Based on the evaluation performed, we have concluded that there is no change from our initial assessment with regard to these investments and contractual relationships.
RELATED PARTY TRANSACTIONS
We have entered into a number of transactions and arrangements that involve related parties. For a description of the transactions and arrangements, please see Note 7, “Commitments and Contingencies and Related Party Transactions,” to the consolidated financial statements.
CONTRACTUAL OBLIGATIONS AND COMMERCIAL COMMITMENTS
The following table summarizes our contractual obligations and commitments to make future payments under contracts, such as debt and lease agreements, as of December 31, 2010.
|
Contractual Obligations
(in thousands)
|
2011
|
2012
|
2013
|
2014
|
2015
|
Thereafter
|
||||||||||||||||||
|
Long Term Debt
|
$ | 47,799 | $ | 33,694 | $ | 32,444 | $ | 42,550 | $ | 88,640 | $ | 404,576 | ||||||||||||
|
Interest Expense on Long Term Debt
|
34,353 | 33,393 | 31,339 | 28,633 | 22,896 | 56,466 | ||||||||||||||||||
|
Credit Facility
|
- | - | 46,000 | - | - | - | ||||||||||||||||||
|
Interest Expense on Credit Facility
|
1,955 | 1,955 | 1,955 | - | - | - | ||||||||||||||||||
|
Hotel Ground Rent
|
1,226 | 1,266 | 1,271 | 1,276 | 1,276 | 97,296 | ||||||||||||||||||
|
Total
|
$ | 103,333 | $ | 52,308 | $ | 113,009 | $ | 72,459 | $ | 112,812 | $ | 558,338 | ||||||||||||
|
Item 7A.
|
Quantitative and Qualitative Disclosures About Market Risk (in thousands, except per share data)
|
Our primary market risk exposure is to changes in interest rates on our variable rate debt. As of December 31, 2010, we are exposed to interest rate risk with respect to variable rate borrowings under our revolving line of credit and certain variable rate mortgages and notes payable. As of December 31, 2010, we had total variable rate debt outstanding of $137,409. At December 31, 2010, our variable rate debt outstanding had a weighted average interest rate of 3.92%. The effect of a 100 basis point increase or decrease in the interest rate on our variable rate debt outstanding as of December 31, 2010 would be an increase or decrease in our interest expense for the year ended December 31, 2010 of $1,064.
Our interest rate risk objectives are to limit the impact of interest rate fluctuations on earnings and cash flows and to lower our overall borrowing costs. To achieve these objectives, we manage our exposure to fluctuations in market interest rates for a portion of our borrowings through the use of fixed rate debt instruments to the extent that reasonably favorable rates are obtainable with such arrangements. We have also entered into derivative financial instruments such as interest rate swaps or caps, and in the future may enter into treasury options or locks, to mitigate our interest rate risk on a related financial instrument or to effectively lock the interest rate on a portion of our variable rate debt. Currently, we have two interest rate caps related to debt on the Hotel 373, New York, NY and our two subordinated notes payable. We do not intend to enter into derivative or interest rate transactions for speculative purposes.
As of December 31, 2010 approximately 80.2% of our outstanding mortgages and notes payable are subject to fixed rates, including variable rate debt that is effectively fixed through our use of an interest rate swap, while approximately 19.8% of our outstanding mortgages payable are subject to floating rates.
Changes in market interest rates on our fixed-rate debt impact the fair value of the debt, but such changes have no impact on interest expense incurred. If interest rates rise 100 basis points and our fixed rate debt balance remains constant, we expect the fair value of our debt to decrease. The sensitivity analysis related to our fixed-rate debt assumes an immediate 100 basis point move in interest rates from their December 31, 2010 levels, with all other variables held constant. A 100 basis point increase in market interest rates would cause the fair value of our fixed-rate debt outstanding at December 31, 2010 to be approximately $487,571 and a 100 basis point decrease in market interest rates would cause the fair value of our fixed-rate debt outstanding at December 31, 2010 to be approximately $541,061.
We regularly review interest rate exposure on our outstanding borrowings in an effort to minimize the risk of interest rate fluctuations. For debt obligations outstanding as of December 31, 2010, including liabilities related to assets held for sale, the following table presents expected principal repayments and related weighted average interest rates by expected maturity dates (in thousands):
|
Mortgages & Notes Payable
|
2011
|
2012
|
2013
|
2014
|
2015
|
Thereafter
|
Total
|
|||||||||||||||||||||
|
Fixed Rate Debt
|
$ | 7,938 | $ | 33,694 | $ | 32,444 | $ | 42,550 | $ | 88,640 | $ | 353,028 | $ | 558,294 | ||||||||||||||
|
Weighted Average Interest Rate
|
6.04 | % | 6.14 | % | 6.13 | % | 6.10 | % | 6.01 | % | 6.01 | % | 6.07 | % | ||||||||||||||
|
Floating Rate Debt
|
39,861 | - | - | - | - | 51,548 | 91,409 | |||||||||||||||||||||
|
Weighted Average Interest Rate
|
3.26 | % | 3.26 | % | 3.26 | % | 3.26 | % | 3.26 | % | 3.26 | % | 3.26 | % | ||||||||||||||
| $ | 47,799 | $ | 33,694 | $ | 32,444 | $ | 42,550 | $ | 88,640 | $ | 404,576 | $ | 649,703 | |||||||||||||||
|
Credit Facility
|
||||||||||||||||||||||||||||
| - | - | 46,000 | - | - | - | $ | 46,000 | |||||||||||||||||||||
|
Weighted Average Interest Rate
|
4.25 | % | 4.25 | % | ||||||||||||||||||||||||
|
TOTAL
|
$ | 47,799 | $ | 33,694 | $ | 78,444 | $ | 42,550 | $ | 88,640 | $ | 404,576 | $ | 695,703 | ||||||||||||||
The table incorporates only those exposures that existed as of December 31, 2010, and does not consider exposure or positions that could arise after that date. As a result, our ultimate realized gain or loss with respect to interest rate fluctuations will depend on the exposures that arise during the future period, prevailing interest rates, and our hedging strategies at that time.
The following table illustrates expected principal repayments and certain adjustments to reflect:
|
|
·
|
the Company’s exercise of each of the extension options within its discretion or upon lender approval
|
|
|
·
|
the lender’s extension of the maturity of the revolving line of credit extension options, and
|
|
|
·
|
the refinance of mortgage debt on the hotel properties.
|
|
2011
|
2012
|
2013
|
2014
|
2015
|
Thereafter
|
Total
|
||||||||||||||||||||||
|
Principal repayments due as of December 31, 2010, as noted above
|
$ | 47,799 | $ | 33,694 | $ | 78,444 | $ | 42,550 | $ | 88,640 | $ | 404,576 | $ | 695,703 | ||||||||||||||
|
Adustments (1)
|
||||||||||||||||||||||||||||
|
Extension Options
|
||||||||||||||||||||||||||||
|
Hotel 373 - 5th Avenue, New York, NY (2)
|
(22,000 | ) | 22,000 | - | - | - | - | - | ||||||||||||||||||||
|
Hampton Inn - West Haven, CT (3)
|
- | (7,552 | ) | - | - | 7,552 | - | - | ||||||||||||||||||||
|
Residence Inn - Carlisle (4)
|
- | - | (6,732 | ) | - | - | 6,732 | - | ||||||||||||||||||||
|
Line of Credit Facility (5)
|
- | - | (46,000 | ) | 46,000 | - | - | |||||||||||||||||||||
|
Refinance
|
||||||||||||||||||||||||||||
|
NU Hotel Brooklyn - New York, NY (6)
|
- | (18,000 | ) | 18,000 | - | - | - | - | ||||||||||||||||||||
|
Pro Forma Principal Repayments (7)
|
$ | 25,799 | $ | 30,142 | $ | 43,712 | $ | 88,550 | $ | 96,192 | $ | 411,308 | $ | 695,703 | ||||||||||||||
|
|
(1)
|
Adjustments reflect principal balances as of December 31, 2010. Adjustments do not include amortization of principal scheduled to occur subsequent to December 31, 2010 through maturity date or extended maturity date if options are exercised.
|
|
|
(2)
|
Represents mortgage debt on the Hotel 373, 5th Avenue, New York, NY which contains a one-year extension option, which can be exercised at our discretion, effectively extending the maturity from May of 2011 to May of 2012.
|
|
|
(3)
|
Represents the mortgage debt on the Hampton Inn, West Haven, CT, which contains a three-year extension option, which is subject to the lender’s approval in its discretion, which, if granted, effectively extends the maturity from November of 2012 to November of 2015.
|
|
|
(4)
|
Represents mortgage debt on Residence Inn, Carlisle, PA, which contains a three-year extension option, which is subject to the lenders’ approval in its discretion, which, if granted, effectively extends the maturity from January of 2013 to January of 2016.
|
|
|
(5)
|
Represents the revolving line of credit agreement, which contains a one-year extension option, which is subject to the lender’s approval in its discretion, which, if granted, effectively extends the maturity date from September of 2013 to September of 2014.
|
|
|
(6)
|
Represents the mortgage debt on the Nu Hotel, Brooklyn, NY, which contains a one-year extension option, which can be exercised at out discretion, effectively extending the maturity date from January 2012 to January 2013.
|
|
|
(7)
|
Reflects principal balances as of December 31, 2010 unless otherwise noted. Figures do not include amortization of principal scheduled to occur subsequent to December 31, 2010 through maturity date or extended maturity date if options are exercised.
|
|
Item 8.
|
Financial Statements and Supplementary Data
|
Hersha Hospitality Trust
|
Page
|
|
|
Report of Independent Auditors
|
45 |
|
Consolidated Balance Sheets as of December 31, 2010 and 2009
|
46 |
|
Consolidated Statement of Operations for the years ended December 31, 2010, 2009, and 2008
|
47-48 |
|
Consolidated Statements of Equity and Comprehensive Income for the years ended December 31, 2010, 2009 and 2008
|
49 |
|
Consolidated Statements of Cash Flows for the years ended December 31, 2010, 2009 and 2008
|
50 |
|
Notes to Consolidated Financial Statements
|
51-88 |
|
Schedule III - Real Estate and Accumulated Depreciation for the year ended December 31, 2010
|
89-91 |
The Board of Trustees and Stockholders of
Hersha Hospitality Trust:
We have audited the accompanying consolidated balance sheets of Hersha Hospitality Trust and subsidiaries as of December 31, 2010 and 2009, and the related consolidated statements of operations, equity and comprehensive income, and cash flows for each of the years in the three-year period ended December 31, 2010. In connection with our audits of the consolidated financial statements, we have also audited the financial statement schedule as listed in the accompanying index. These consolidated financial statements and financial statement schedule are the responsibility of Hersha Hospitality Trust’s management. Our responsibility is to express an opinion on these consolidated financial statements and financial statement schedule based on our audits.
We conducted our audits in accordance with the standards of the Public Company Accounting Oversight Board (United States). Those standards require that we plan and perform the audits to obtain reasonable assurance about whether the financial statements are free of material misstatement. An audit includes examining, on a test basis, evidence supporting the amounts and disclosures in the financial statements. An audit also includes assessing the accounting principles used and significant estimates made by management, as well as evaluating the overall financial statement presentation. We believe that our audits provide a reasonable basis for our opinions.
In our opinion, the consolidated financial statements referred to above present fairly, in all material respects, the financial position of Hersha Hospitality Trust and subsidiaries as of December 31, 2010 and 2009, and the results of their operations and their cash flows for each of the years in the three-year period ended December 31, 2010, in conformity with U.S. generally accepted accounting principles. Also in our opinion, the related financial statement schedule, when considered in relation to the basic consolidated financial statements taken as a whole, presents fairly, in all material respects, the information set forth therein.
We have also audited, in accordance with the standards of the Public Company Accounting Oversight Board (United States), Hersha Hospitality Trust and subsidiaries’ internal control over financial reporting as of December 31, 2010, based on criteria established in Internal Control - Integrated Framework issued by the Committee of Sponsoring Organizations of the Treadway Commission (COSO), and our report dated March 3, 2011, expressed an unqualified opinion on the effectiveness of the Company’s internal control over financial reporting.
/s/ KPMG LLP
Philadelphia, Pennsylvania
March 3, 2011
CONSOLIDATED BALANCE SHEETS
AS OF DECEMBER 31, 2010 AND 2009
[IN THOUSANDS, EXCEPT SHARE AMOUNTS]
|
December 31, 2010
|
December 31, 2009
|
|||||||
|
Assets:
|
||||||||
|
Investment in Hotel Properties, net of Accumulated Depreciation
|
$ | 1,245,851 | $ | 938,954 | ||||
|
Investment in Unconsolidated Joint Ventures
|
35,561 | 39,182 | ||||||
|
Development Loans Receivable
|
41,653 | 46,094 | ||||||
|
Cash and Cash Equivalents
|
65,596 | 11,404 | ||||||
|
Escrow Deposits
|
17,384 | 16,174 | ||||||
|
Hotel Accounts Receivable, net of allowance for doubtful accounts of $31 and $34
|
9,611 | 7,103 | ||||||
|
Deferred Financing Costs, net of Accumulated Amortization of $5,852 and $4,262
|
10,204 | 8,696 | ||||||
|
Due from Related Parties
|
5,069 | 2,394 | ||||||
|
Intangible Assets, net of Accumulated Amortization of $1,084 and $794
|
7,934 | 7,542 | ||||||
|
Other Assets
|
18,414 | 12,428 | ||||||
|
Assets Held for Sale
|
- | 21,073 | ||||||
|
Total Assets
|
$ | 1,457,277 | $ | 1,111,044 | ||||
|
Liabilities and Equity:
|
||||||||
|
Line of Credit
|
$ | 46,000 | $ | 79,200 | ||||
|
Mortgages and Notes Payable, net of unamortized discount of $983 and $49
|
648,720 | 645,351 | ||||||
|
Accounts Payable, Accrued Expenses and Other Liabilities
|
28,601 | 16,216 | ||||||
|
Dividends and Distributions Payable
|
9,805 | 4,293 | ||||||
|
Due to Related Parties
|
939 | 769 | ||||||
|
Liabilities Related to Assets Held for Sale
|
- | 20,892 | ||||||
|
Total Liabilities
|
734,065 | 766,721 | ||||||
|
Redeemable Noncontrolling Interests - Common Units (Note 1)
|
$ | 19,894 | $ | 14,733 | ||||
|
Equity:
|
||||||||
|
Shareholders' Equity:
|
||||||||
|
Preferred Shares - 8% Series A, $.01 Par Value, 29,000,000 shares authorized, 2,400,000 Shares Issued and Outstanding (Aggregate Liquidation Preference $60,000) at December 31, 2010 and 2009
|
24 | 24 | ||||||
|
Common Shares - Class A, $.01 Par Value, 300,000,000 and 150,000,000 Shares Authorized at December 31, 2010 and 2009, 169,205,638 and 57,682,917 Shares Issued and Outstanding at December 31, 2010 and 2009, respectively
|
1,692 | 577 | ||||||
|
Common Shares - Class B, $.01 Par Value, 1,000,000 Shares Authorized, None Issued and Outstanding
|
- | - | ||||||
|
Accumulated Other Comprehensive Loss
|
(338 | ) | (160 | ) | ||||
|
Additional Paid-in Capital
|
918,215 | 487,481 | ||||||
|
Distributions in Excess of Net Income
|
(236,159 | ) | (185,725 | ) | ||||
|
Total Shareholders' Equity
|
683,434 | 302,197 | ||||||
|
Noncontrolling Interests (Note 1):
|
||||||||
|
Noncontrolling Interests - Common Units
|
19,410 | 27,126 | ||||||
|
Noncontrolling Interests - Consolidated Joint Ventures
|
474 | 267 | ||||||
|
Total Noncontrolling Interests
|
19,884 | 27,393 | ||||||
|
Total Equity
|
703,318 | 329,590 | ||||||
|
Total Liabilities and Equity
|
$ | 1,457,277 | $ | 1,111,044 | ||||
The Accompanying Notes Are an Integral Part of These Consolidated Financial Statements.
HERSHA HOSPITALITY TRUST AND SUBSIDIARIES
CONSOLIDATED STATEMENTS OF OPERATIONS
FOR THE YEARS ENDED DECEMBER 31, 2010, 2009 AND 2008
[IN THOUSANDS, EXCEPT SHARE/UNIT AND PER SHARE AMOUNTS]
|
2010
|
2009
|
2008
|
||||||||||
|
Revenue:
|
||||||||||||
|
Hotel Operating Revenues
|
$ | 277,708 | $ | 212,352 | $ | 236,247 | ||||||
|
Interest Income from Development Loans
|
4,686 | 7,411 | 7,890 | |||||||||
|
Other Revenues
|
381 | 1,981 | 3,984 | |||||||||
|
Total Revenues
|
282,775 | 221,744 | 248,121 | |||||||||
|
Operating Expenses:
|
||||||||||||
|
Hotel Operating Expenses
|
158,717 | 124,294 | 133,762 | |||||||||
|
Hotel Ground Rent
|
1,374 | 1,166 | 1,040 | |||||||||
|
Real Estate and Personal Property Taxes and Property Insurance
|
19,335 | 14,060 | 12,559 | |||||||||
|
General and Administrative
|
10,263 | 5,891 | 7,208 | |||||||||
|
Stock Based Compensation
|
6,649 | 2,143 | 1,502 | |||||||||
|
Acquisition and Terminated Transaction Costs
|
4,827 | 328 | 380 | |||||||||
|
Loss from Impairment of Assets
|
2,433 | 39,111 | 21,004 | |||||||||
|
Depreciation and Amortization
|
52,012 | 43,187 | 38,989 | |||||||||
|
Total Operating Expenses
|
255,610 | 230,180 | 216,444 | |||||||||
|
Operating Income (Loss)
|
27,165 | (8,436 | ) | 31,677 | ||||||||
|
Interest Income
|
169 | 208 | 306 | |||||||||
|
Interest Expense
|
45,868 | 45,183 | 43,306 | |||||||||
|
Other Expense
|
464 | 165 | 129 | |||||||||
|
Loss on Debt Extinguishment
|
932 | - | 1,552 | |||||||||
|
Loss before Income (Loss) from Unconsolidated Joint Venture Investments and Discontinued Operations
|
(19,930 | ) | (53,576 | ) | (13,004 | ) | ||||||
|
Loss from Unconsolidated Joint Ventures
|
(1,751 | ) | (7,190 | ) | (517 | ) | ||||||
|
Gain from Remeasurement of Investment in Unconsolidated Joint Venture
|
4,008 | - | - | |||||||||
|
Income (Loss) from Unconsolidated Joint Venture Investments
|
2,257 | (7,190 | ) | (517 | ) | |||||||
|
Loss from Continuing Operations
|
(17,673 | ) | (60,766 | ) | (13,521 | ) | ||||||
|
Discontinued Operations (Note 12):
|
||||||||||||
|
Gain on Disposition of Hotel Properties
|
347 | 1,869 | 2,888 | |||||||||
|
Income from Discontinued Operations
|
124 | 439 | 204 | |||||||||
|
Income from Discontinued Operations
|
471 | 2,308 | 3,092 | |||||||||
|
Net Loss
|
(17,202 | ) | (58,458 | ) | (10,429 | ) | ||||||
|
Loss Allocated to Noncontrolling Interests
|
845 | 8,597 | 1,621 | |||||||||
|
Preferred Distributions
|
(4,800 | ) | (4,800 | ) | (4,800 | ) | ||||||
|
Net Loss applicable to Common Shareholders
|
$ | (21,157 | ) | $ | (54,661 | ) | $ | (13,608 | ) | |||
The Accompanying Notes Are an Integral Part of These Consolidated Financial Statements.
HERSHA HOSPITALITY TRUST AND SUBSIDIARIES
CONSOLIDATED STATEMENTS OF OPERATIONS
FOR THE YEARS ENDED DECEMBER 31, 2010, 2009 AND 2008
[IN THOUSANDS, EXCEPT SHARE/UNIT AND PER SHARE AMOUNTS]
|
2010
|
2009
|
2008
|
||||||||||
|
Earnings Per Share:
|
||||||||||||
|
BASIC
|
||||||||||||
|
(Loss) from Continuing Operations applicable to Common Shareholders
|
$ | (0.16 | ) | $ | (1.12 | ) | $ | (0.37 | ) | |||
|
Income from Discontinued Operations applicable to Common Shareholders
|
$ | - | 0.04 | 0.06 | ||||||||
|
Net (Loss) applicable to Common Shareholders
|
$ | (0.16 | ) | $ | (1.08 | ) | $ | (0.31 | ) | |||
|
DILUTED
|
||||||||||||
|
(Loss) from Continuing Operations applicable to Common Shareholders
|
$ | (0.16 | ) * | $ | (1.12 | ) * | $ | (0.37 | ) * | |||
|
Income from Discontinued Operations applicable to Common Shareholders
|
$ | - | * | 0.04 | * | 0.06 | * | |||||
|
Net (Loss) applicable to Common Shareholders
|
$ | (0.16 | ) * | $ | (1.08 | ) * | $ | (0.31 | ) * | |||
|
Weighted Average Common Shares Outstanding:
|
||||||||||||
|
Basic
|
134,370,172 | 51,027,742 | 45,184,127 | |||||||||
|
Diluted
|
134,370,172 | * | 51,027,742 | * | 45,184,127 | * | ||||||
|
*
|
Income allocated to noncontrolling interest in Hersha Hospitality Limited Partnership has been excluded from the numerator and units of limited partnership interest in Hersha Hospitality Limited Partnership have been omitted from the denominator for the purpose of computing diluted earnings per share since the effect of including these amounts in the numerator and denominator would have no impact. Weighted average units of limited partnership interest in Hersha Hospitality Limited Partnership outstanding for the year ended December 31, 2010, 2009 and 2008 were 8,628,492, 8,724,725 and 8,034,737, respectively.
|
Unvested stock awards, contingently issuable share awards and options to acquire our common shares have been omitted from the denominator for the purpose of computing diluted earnings per share for the year ended December 31, 2010, since the effect of including these awards in the denominator would be anti-dilutive to loss from continuing operations applicable to common shareholders. For the year ended December 31, 2010, there were 396,328 anti-dilutive unvested stock awards outstanding, 934,097 anti-dilutive contingently issuable share awards outstanding, and 2,327,219 anti-dilutive options to acquire our common shares outstanding. As a result of the application of the treasury stock method, there were no potentially dilutive securities to be considered for inclusion in the denominator for purpose of computing diluted earnings per share for years ended December 31, 2009 and 2008.
The Accompanying Notes are an Integral Part of These Consolidated Financial Statements.
HERSHA HOSPITALITY TRUST AND SUBSIDIARIES
CONSOLIDATED STATEMENTS OF EQUITY AND COMPREHENSIVE INCOME
FOR THE YEARS ENDED DECEMBER 31, 2010, 2009 AND 2008
[IN THOUSANDS, EXCEPT PER SHARE AMOUNTS]
|
Shareholders' Equity
|
Noncontrolling Interests
|
Redeemable Noncontrolling Interests
|
||||||||||||||||||||||||||||||||||||||||||||||||||||||||||||||||||
|
Class A Common Shares
|
Class B Common Shares
|
Series A Preferred Shares
|
Common Units
|
Common Units
|
||||||||||||||||||||||||||||||||||||||||||||||||||||||||||||||||
|
Shares
|
Dollars
|
Shares
|
Dollars
|
Shares
|
Dollars
|
Additional Paid-In Capital
|
Other Comprehensive Income
|
Distributions in Excess of Net Earnings
|
Total Shareholders' Equity
|
Shares
|
Dollars
|
Consolidated Joint Ventures
|
Total Noncontrolling Interests
|
Total Equity
|
Shares
|
Dollars
|
||||||||||||||||||||||||||||||||||||||||||||||||||||
|
Balance at December 31, 2007
|
41,203,612 | $ | 412 | - | $ | - | 2,400,000 | $ | 24 | $ | 397,127 | $ | (23 | ) | $ | (67,135 | ) | $ | 330,405 | 6,424,915 | $ | 42,845 | $ | 1,908 | $ | 44,753 | $ | 375,158 | - | $ | - | |||||||||||||||||||||||||||||||||||||
|
Common Stock Issuance
|
6,600,000 | 66 | - | - | - | - | 62,007 | - | - | 62,073 | - | - | - | - | 62,073 | - | - | |||||||||||||||||||||||||||||||||||||||||||||||||||
|
Issuance Costs
|
- | - | - | - | - | - | (228 | ) | - | - | (228 | ) | - | - | - | - | (228 | ) | - | - | ||||||||||||||||||||||||||||||||||||||||||||||||
|
Unit Conversion
|
175,843 | 2 | - | - | - | - | 1,370 | - | - | 1,372 | (175,843 | ) | (1,372 | ) | - | (1,372 | ) | - | - | - | ||||||||||||||||||||||||||||||||||||||||||||||||
|
Common Units Issued for Acquisitions
|
- | - | - | - | - | - | - | - | - | - | 2,497,228 | 21,624 | - | 21,624 | 21,624 | - | - | |||||||||||||||||||||||||||||||||||||||||||||||||||
|
Reallocation of Noncontrolling Interest
|
- | - | - | - | - | - | 1,966 | - | - | 1,966 | - | (683 | ) | - | (683 | ) | 1,283 | - | (1,283 | ) | ||||||||||||||||||||||||||||||||||||||||||||||||
|
Reclassification of Noncontrolling Interests
|
- | - | - | - | - | - | - | - | - | - | (3,064,252 | ) | (20,670 | ) | - | (20,670 | ) | (20,670 | ) | 3,064,252 | 20,670 | |||||||||||||||||||||||||||||||||||||||||||||||
|
Dividends declared:
|
||||||||||||||||||||||||||||||||||||||||||||||||||||||||||||||||||||
|
Common Stock ($0.72 per share)
|
- | - | - | - | - | - | - | - | (33,464 | ) | (33,464 | ) | - | (5,492 | ) | - | (5,492 | ) | (38,956 | ) | - | (552 | ) | |||||||||||||||||||||||||||||||||||||||||||||
|
Preferred Stock ($2.00 per share)
|
- | - | - | - | - | - | - | - | (4,800 | ) | (4,800 | ) | - | - | - | - | (4,800 | ) | - | - | ||||||||||||||||||||||||||||||||||||||||||||||||
|
Dividend Reinvestment Plan
|
5,092 | - | - | - | - | - | 31 | - | - | 31 | - | - | - | - | 31 | - | - | |||||||||||||||||||||||||||||||||||||||||||||||||||
|
Stock Based Compensation
|
||||||||||||||||||||||||||||||||||||||||||||||||||||||||||||||||||||
|
Restricted Share Award Grants
|
281,675 | 3 | - | - | - | - | (3 | ) | - | - | - | - | - | - | - | - | - | - | ||||||||||||||||||||||||||||||||||||||||||||||||||
|
Restricted Share Award Amortization
|
- | - | - | - | - | - | 1,411 | - | - | 1,411 | - | - | - | - | 1,411 | - | - | |||||||||||||||||||||||||||||||||||||||||||||||||||
|
Share Grants to Trustees
|
10,000 | - | - | - | - | - | 91 | - | - | 91 | - | - | - | - | 91 | - | - | |||||||||||||||||||||||||||||||||||||||||||||||||||
|
Comprehensive Income (Loss):
|
||||||||||||||||||||||||||||||||||||||||||||||||||||||||||||||||||||
|
Other Comprehensive Loss
|
- | - | - | - | - | - | - | (86 | ) | - | (86 | ) | - | - | - | - | (86 | ) | - | - | ||||||||||||||||||||||||||||||||||||||||||||||||
|
Net Loss
|
- | - | - | - | - | - | - | - | (8,808 | ) | (8,808 | ) | - | (1,471 | ) | (54 | ) | (1,525 | ) | (10,333 | ) | - | (96 | ) | ||||||||||||||||||||||||||||||||||||||||||||
|
Total Comprehensive Loss
|
(8,894 | ) | - | (1,471 | ) | (54 | ) | (1,525 | ) | (10,419 | ) | - | (96 | ) | ||||||||||||||||||||||||||||||||||||||||||||||||||||||
|
Balance at December 31, 2008
|
48,276,222 | $ | 483 | - | $ | - | 2,400,000 | $ | 24 | $ | 463,772 | $ | (109 | ) | $ | (114,207 | ) | $ | 349,963 | 5,682,048 | $ | 34,781 | $ | 1,854 | $ | 36,635 | $ | 386,598 | 3,064,252 | $ | 18,739 | |||||||||||||||||||||||||||||||||||||
|
Common Stock Issuance
|
8,442,300 | 84 | - | - | - | - | 22,423 | - | - | 22,507 | - | - | - | - | 22,507 | - | - | |||||||||||||||||||||||||||||||||||||||||||||||||||
|
Issuance Costs
|
- | - | - | - | - | - | (1,165 | ) | - | - | (1,165 | ) | - | - | - | - | (1,165 | ) | - | - | ||||||||||||||||||||||||||||||||||||||||||||||||
|
Unit Conversion
|
44,490 | - | - | - | - | - | 255 | - | - | 255 | (44,490 | ) | (255 | ) | - | (255 | ) | - | - | - | ||||||||||||||||||||||||||||||||||||||||||||||||
|
Dividends and Distributions declared:
|
||||||||||||||||||||||||||||||||||||||||||||||||||||||||||||||||||||
|
Distribution to Noncontrolling Interest in Consolidated Joint Ventures
|
- | - | - | - | - | - | - | - | - | - | - | - | (124 | ) | (124 | ) | (124 | ) | - | - | ||||||||||||||||||||||||||||||||||||||||||||||||
|
Common Stock ($0.33 per share)
|
- | - | - | - | - | - | - | - | (16,857 | ) | (16,857 | ) | - | (1,871 | ) | - | (1,871 | ) | (18,728 | ) | - | (1,010 | ) | |||||||||||||||||||||||||||||||||||||||||||||
|
Preferred Stock ($2.00 per share)
|
- | - | - | - | - | - | - | - | (4,800 | ) | (4,800 | ) | - | - | - | - | (4,800 | ) | - | - | ||||||||||||||||||||||||||||||||||||||||||||||||
|
Dividend Reinvestment Plan
|
9,943 | - | - | - | - | - | 25 | - | - | 25 | - | - | - | - | 25 | - | - | |||||||||||||||||||||||||||||||||||||||||||||||||||
|
Stock Based Compensation
|
||||||||||||||||||||||||||||||||||||||||||||||||||||||||||||||||||||
|
Restricted and Performance Share Award Grants
|
862,462 | 9 | - | - | - | - | (9 | ) | - | - | - | - | - | - | - | - | - | - | ||||||||||||||||||||||||||||||||||||||||||||||||||
|
Restricted Share Award Amortization
|
- | - | - | - | - | - | 2,039 | - | - | 2,039 | - | - | - | - | 2,039 | - | - | |||||||||||||||||||||||||||||||||||||||||||||||||||
|
Share Grants to Trustees
|
47,500 | 1 | - | - | - | - | 141 | - | - | 142 | - | - | - | - | 142 | - | - | |||||||||||||||||||||||||||||||||||||||||||||||||||
|
Disposition of Consolidated Joint Venture
|
- | - | - | - | - | - | - | - | - | - | - | - | (1,391 | ) | (1,391 | ) | (1,391 | ) | - | - | ||||||||||||||||||||||||||||||||||||||||||||||||
|
Comprehensive Income (Loss):
|
||||||||||||||||||||||||||||||||||||||||||||||||||||||||||||||||||||
|
Other Comprehensive Loss
|
- | - | - | - | - | - | - | (51 | ) | - | (51 | ) | - | - | - | - | (51 | ) | - | - | ||||||||||||||||||||||||||||||||||||||||||||||||
|
Net Loss
|
- | - | - | - | - | - | - | - | (49,861 | ) | (49,861 | ) | - | (5,529 | ) | (72 | ) | (5,601 | ) | (55,462 | ) | - | (2,996 | ) | ||||||||||||||||||||||||||||||||||||||||||||
|
Total Comprehensive Loss
|
(49,912 | ) | - | (5,529 | ) | (72 | ) | (5,601 | ) | (55,513 | ) | - | (2,996 | ) | ||||||||||||||||||||||||||||||||||||||||||||||||||||||
|
Balance at December 31, 2009
|
57,682,917 | $ | 577 | - | $ | - | 2,400,000 | $ | 24 | $ | 487,481 | $ | (160 | ) | $ | (185,725 | ) | $ | 302,197 | 5,637,558 | $ | 27,126 | $ | 267 | $ | 27,393 | $ | 329,590 | 3,064,252 | $ | 14,733 | |||||||||||||||||||||||||||||||||||||
|
Common Stock Issuance
|
108,100,000 | 1,081 | - | - | - | - | 420,653 | - | - | 421,734 | - | - | - | - | 421,734 | - | - | |||||||||||||||||||||||||||||||||||||||||||||||||||
|
Issuance Costs
|
- | - | - | - | - | - | (1,293 | ) | - | - | (1,293 | ) | - | - | - | - | (1,293 | ) | - | - | ||||||||||||||||||||||||||||||||||||||||||||||||
|
Unit Conversion
|
2,934,511 | 29 | - | - | - | - | 12,405 | - | - | 12,434 | (2,884,511 | ) | (12,203 | ) | - | (12,203 | ) | 231 | (50,000 | ) | (230 | ) | ||||||||||||||||||||||||||||||||||||||||||||||
|
Common Units Issued for Acquisitions
|
- | - | - | - | - | - | - | - | - | - | 1,651,613 | 6,256 | - | 6,256 | 6,256 | - | - | |||||||||||||||||||||||||||||||||||||||||||||||||||
|
Reallocation of Noncontrolling Interest
|
- | - | - | - | - | - | (6,374 | ) | - | - | (6,374 | ) | - | - | - | - | (6,374 | ) | - | 6,374 | ||||||||||||||||||||||||||||||||||||||||||||||||
|
Dividends and Distributions declared:
|
||||||||||||||||||||||||||||||||||||||||||||||||||||||||||||||||||||
|
Distribution to Noncontrolling Interest in Consolidated Joint Ventures
|
- | - | - | - | - | - | - | - | - | - | - | - | - | - | - | - | - | |||||||||||||||||||||||||||||||||||||||||||||||||||
|
Common Stock ($0.20 per share)
|
- | - | - | - | - | - | - | - | (29,277 | ) | (29,277 | ) | - | (1,090 | ) | - | (1,090 | ) | (30,367 | ) | - | (610 | ) | |||||||||||||||||||||||||||||||||||||||||||||
|
Preferred Stock ($2.00 per share)
|
- | - | - | - | - | - | - | - | (4,800 | ) | (4,800 | ) | - | - | - | - | (4,800 | ) | - | - | ||||||||||||||||||||||||||||||||||||||||||||||||
|
Dividend Reinvestment Plan
|
2,655 | - | - | - | - | - | 12 | - | - | 12 | - | - | - | - | 12 | - | - | |||||||||||||||||||||||||||||||||||||||||||||||||||
|
Stock Based Compensation
|
||||||||||||||||||||||||||||||||||||||||||||||||||||||||||||||||||||
|
Restricted and Performance Share Award Grants
|
437,555 | 4 | - | - | - | - | (4 | ) | - | - | - | - | - | - | - | - | - | - | ||||||||||||||||||||||||||||||||||||||||||||||||||
|
Restricted Share Award Amortization
|
- | - | - | - | - | - | 5,072 | - | - | 5,072 | - | - | - | - | 5,072 | - | - | |||||||||||||||||||||||||||||||||||||||||||||||||||
|
Share Grants to Trustees
|
48,000 | 1 | - | - | - | - | 263 | - | - | 264 | - | - | - | - | 264 | - | - | |||||||||||||||||||||||||||||||||||||||||||||||||||
|
Comprehensive Income (Loss):
|
||||||||||||||||||||||||||||||||||||||||||||||||||||||||||||||||||||
|
Other Comprehensive Loss
|
- | - | - | - | - | - | - | (178 | ) | - | (178 | ) | - | - | - | - | (178 | ) | - | - | ||||||||||||||||||||||||||||||||||||||||||||||||
|
Net Loss
|
- | - | - | - | - | - | - | - | (16,357 | ) | (16,357 | ) | - | (679 | ) | 207 | (472 | ) | (16,829 | ) | - | (373 | ) | |||||||||||||||||||||||||||||||||||||||||||||
|
Total Comprehensive Loss
|
(16,535 | ) | - | (679 | ) | 207 | (472 | ) | (17,007 | ) | - | (373 | ) | |||||||||||||||||||||||||||||||||||||||||||||||||||||||
|
Balance at December 31, 2010
|
169,205,638 | $ | 1,692 | - | $ | - | 2,400,000 | $ | 24 | $ | 918,215 | $ | (338 | ) | $ | (236,159 | ) | $ | 683,434 | 4,404,660 | $ | 19,410 | $ | 474 | $ | 19,884 | $ | 703,318 | 3,014,252 | $ | 19,894 | |||||||||||||||||||||||||||||||||||||
The Accompanying Notes Are an Integral Part of These Consolidated Financial Statements.
HERSHA HOSPITALITY TRUST AND SUBSIDIARIES
CONSOLIDATED STATEMENTS OF CASH FLOWS
FOR THE YEARS ENDED DECEMBER 31, 2010, 2009, AND 2008
[IN THOUSANDS]
|
2010
|
2009
|
2008
|
||||||||||
|
Operating activities:
|
||||||||||||
|
Net loss
|
$ | (17,202 | ) | $ | (58,458 | ) | $ | (10,429 | ) | |||
|
Adjustments to reconcile net (loss) income to net cash provided by operating activities:
|
||||||||||||
|
Gain on disposition of hotel properties
|
(347 | ) | (1,869 | ) | (2,888 | ) | ||||||
|
Impairment of assets
|
2,410 | 39,111 | 21,004 | |||||||||
|
Acquisition costs
|
4,676 | - | - | |||||||||
|
Depreciation
|
51,823 | 44,002 | 41,219 | |||||||||
|
Amortization
|
2,975 | 2,285 | 1,958 | |||||||||
|
Debt extinguishment
|
725 | - | 1,587 | |||||||||
|
Development loan interest added to principal
|
(2,559 | ) | (3,253 | ) | - | |||||||
|
Equity in (income) loss of unconsolidated joint ventures
|
(2,257 | ) | 7,190 | 517 | ||||||||
|
Distributions from unconsolidated joint ventures
|
- | 400 | 3,036 | |||||||||
|
Loss (gain) recognized on change in fair value of derivative instrument
|
12 | (172 | ) | 71 | ||||||||
|
Stock based compensation expense
|
6,649 | 2,143 | 1,502 | |||||||||
|
Change in assets and liabilities:
|
||||||||||||
|
(Increase) decrease in:
|
||||||||||||
|
Hotel accounts receivable
|
(1,694 | ) | (312 | ) | 420 | |||||||
|
Escrows
|
(1,210 | ) | (3,770 | ) | 1,302 | |||||||
|
Other assets
|
(273 | ) | (3,727 | ) | (1,132 | ) | ||||||
|
Due from related party
|
(2,514 | ) | 2,159 | (3,251 | ) | |||||||
|
Increase (decrease) in:
|
||||||||||||
|
Due to related party
|
(131 | ) | (634 | ) | (1,115 | ) | ||||||
|
Accounts payable and accrued expenses
|
5,163 | (3,563 | ) | 93 | ||||||||
|
Net cash provided by operating activities
|
46,246 | 21,532 | 53,894 | |||||||||
|
Investing activities:
|
||||||||||||
|
Purchase of hotel property assets
|
(280,731 | ) | (9,315 | ) | (63,626 | ) | ||||||
|
Deposits on hotel acquisitions
|
(5,500 | ) | - | - | ||||||||
|
Capital expenditures
|
(10,328 | ) | (6,138 | ) | (19,226 | ) | ||||||
|
Cash paid for hotel development project
|
(6,471 | ) | - | - | ||||||||
|
Proceeds from disposition of hotel properties
|
2,863 | 8,524 | 6,456 | |||||||||
|
Distributions from unconsolidated joint venture
|
100 | 261 | 2,113 | |||||||||
|
Advances and capital contributions to unconsolidated joint ventures
|
(14,291 | ) | (753 | ) | (96 | ) | ||||||
|
Investment in development loans receivable
|
- | (2,000 | ) | (64,200 | ) | |||||||
|
Repayment of development loans receivable
|
- | 500 | 22,416 | |||||||||
|
Repayment of notes receivable
|
- | - | 1,350 | |||||||||
|
Cash paid for franchise fee intangible
|
- | - | (57 | ) | ||||||||
|
Net cash used in investing activities
|
(314,358 | ) | (8,921 | ) | (114,870 | ) | ||||||
|
Financing activities:
|
||||||||||||
|
Proceeds (repayments of) from borrowings under line of credit, net
|
(33,200 | ) | (9,221 | ) | 44,721 | |||||||
|
Principal repayment of mortgages and notes payable
|
(61,779 | ) | (39,232 | ) | (57,421 | ) | ||||||
|
Proceeds from mortgages and notes payable
|
31,505 | 42,155 | 59,156 | |||||||||
|
Cash paid for deferred financing costs
|
(4,016 | ) | (362 | ) | (1,244 | ) | ||||||
|
Proceeds from issuance of common stock, net
|
420,441 | 21,342 | 61,845 | |||||||||
|
Acquisition of interest rate cap
|
(394 | ) | - | - | ||||||||
|
Distributions to partners in consolidated joint ventures
|
- | (124 | ) | - | ||||||||
|
Dividends paid on common shares
|
(23,688 | ) | (22,640 | ) | (32,169 | ) | ||||||
|
Dividends paid on preferred shares
|
(4,800 | ) | (4,800 | ) | (4,800 | ) | ||||||
|
Distributions paid on common partnership units
|
(1,765 | ) | (4,022 | ) | (5,742 | ) | ||||||
|
Net cash provided by (used in) financing activities
|
322,304 | (16,904 | ) | 64,346 | ||||||||
|
Net increase (decrease) in cash and cash equivalents
|
54,192 | (4,293 | ) | 3,370 | ||||||||
|
Cash and cash equivalents - beginning of year
|
11,404 | 15,697 | 12,327 | |||||||||
|
Cash and cash equivalents - end of year
|
$ | 65,596 | $ | 11,404 | $ | 15,697 | ||||||
The Accompanying Notes Are an Integral Part of These Consolidated Financial Statements.
HERSHA HOSPITALITY TRUST AND SUBSIDIARIES
NOTES TO THE CONSOLIDATED FINANCIAL STATEMENTS
FOR THE YEARS ENDED DECEMBER 31, 2010, 2009, AND 2008
[IN THOUSANDS, EXCEPT SHARE/UNIT AND PER SHARE AMOUNTS]
NOTE 1 - ORGANIZATION AND SUMMARY OF SIGNIFICANT ACCOUNTING POLICIES
Hersha Hospitality Trust (“we” or the “Company”) was formed in May 1998 as a self-administered, Maryland real estate investment trust. We have elected to be taxed and expect to continue to elect to be taxed as a real estate investment trust, or REIT, for federal income tax purposes.
The Company owns a controlling general partnership interest in Hersha Hospitality Limited Partnership (“HHLP” or the “Partnership”), which owns a 99% limited partnership interest in various subsidiary partnerships. Hersha Hospitality, LLC (“HHLLC”), a Virginia limited liability company, owns a 1% general partnership interest in the subsidiary partnerships and the Partnership is the sole member of HHLLC.
The Partnership owns a taxable REIT subsidiary (“TRS”), 44 New England Management Company (“44 New England” or “TRS Lessee”), to lease certain of the Company’s hotels.
Hersha’s common shares of beneficial interest trade on the New York Stock Exchange (“the NYSE”) under the ticker symbol "HT" and its 8.0% Series A preferred shares of beneficial interest trade on the NYSE under the ticker symbol "HT PR A."
As of December 31, 2010, the Company, through the Partnership and subsidiary partnerships, wholly owned sixty-two limited and full service hotels. All of the wholly owned hotel facilities are leased to the Company’s TRS, 44 New England.
In addition to the wholly owned hotel properties, as of December 31, 2010, the Company owned joint venture interests in another fifteen properties. The properties owned by the joint ventures are leased to a TRS owned by the joint venture or to an entity owned by the joint venture partners and 44 New England. The following table lists the properties owned by these joint ventures:
|
Joint Venture
|
Ownership
|
Property
|
Location
|
Lessee/Sublessee
|
||||
|
Unconsolidated Joint Ventures
|
||||||||
|
Inn America Hospitality at Ewing, LLC
|
50.0%
|
Courtyard
|
Ewing/Princeton, NJ
|
Hersha Inn America TRS Inc.
|
||||
|
Mystic Partners, LLC
|
66.7%
|
Marriott
|
Mystic, CT
|
Mystic Partners Leaseco, LLC
|
||||
|
8.8%
|
Hilton
|
Hartford, CT
|
Mystic Partners Leaseco, LLC
|
|||||
|
66.7%
|
Courtyard
|
Norwich, CT
|
Mystic Partners Leaseco, LLC
|
|||||
|
66.7%
|
Courtyard
|
Warwick, RI
|
Mystic Partners Leaseco, LLC
|
|||||
|
66.7%
|
Residence Inn
|
Danbury, CT
|
Mystic Partners Leaseco, LLC
|
|||||
|
66.7%
|
Residence Inn
|
Mystic, CT
|
Mystic Partners Leaseco, LLC
|
|||||
|
44.7%
|
Residence Inn
|
Southington, CT
|
Mystic Partners Leaseco, LLC
|
|||||
|
66.7%
|
Springhill Suites
|
Waterford, CT
|
Mystic Partners Leaseco, LLC
|
|||||
|
15.0%
|
Marriott
|
Hartford, CT
|
Mystic Partners Leaseco, LLC
|
|||||
|
SB Partners, LLC
|
50.0%
|
Holiday Inn Express
|
South Boston, MA
|
South Bay Sandeep, LLC
|
||||
|
Metro 29th Street Associates, LLC.
|
50.0%
|
Holiday Inn Express
|
New York, NY
|
Metro 29th Sublessee, LLC
|
||||
|
Consolidated Joint Ventures
|
||||||||
|
Hiren Boston, LLC
|
50.0%
|
Courtyard
|
South Boston, MA
|
South Bay Boston, LLC
|
||||
|
LTD Associates One, LLC
|
75.0%
|
Springhill Suites
|
Williamsburg, VA
|
HT LTD Williamsburg One LLC
|
||||
|
LTD Associates Two, LLC
|
75.0%
|
Residence Inn
|
Williamsburg, VA
|
HT LTD Williamsburg Two LLC
|
Mystic Partners, LLC owns an interest in nine hotel properties. Our interest in Mystic Partners, LLC is relative to our interest in each of the nine properties owned by the joint venture as defined in the joint venture’s governing documents. Each of the nine properties owned by Mystic Partners, LLC is leased to a separate entity that is consolidated in Mystic Partners Leaseco, LLC which is owned by 44 New England and our joint venture partner in Mystic Partners, LLC.
The properties are managed by eligible independent management companies, including Hersha Hospitality Management, LP (“HHMLP”). HHMLP is owned in part by three of the Company’s executive officers, two of its affiliated trustees and other third party investors.
HERSHA HOSPITALITY TRUST AND SUBSIDIARIES
NOTES TO THE CONSOLIDATED FINANCIAL STATEMENTS
FOR THE YEARS ENDED DECEMBER 31, 2010, 2009, AND 2008
[IN THOUSANDS, EXCEPT SHARE/UNIT AND PER SHARE AMOUNTS]
NOTE 1 - ORGANIZATION AND SUMMARY OF SIGNIFICANT ACCOUNTING POLICIES (continued)
Principles of Consolidation and Presentation
The accompanying consolidated financial statements have been prepared in accordance with U.S. generally accepted accounting principles and include all of our accounts as well as accounts of the Partnership, subsidiary partnerships and our wholly owned TRS Lessee. All significant inter-company amounts have been eliminated.
Consolidated properties are either wholly owned or owned less than 100% by the Partnership and are controlled by the Company as general partner of the Partnership. Properties owned in joint ventures are also consolidated if the determination is made that we are the primary beneficiary in a variable interest entity (VIE) or we maintain control of the asset through our voting interest in the entity. Control can be demonstrated when the general partner has the power to impact the economic performance of the partnership, which includes the ability of the general partner to manage day-to-day operations, refinance debt and sell the assets of the partnerships without the consent of the limited partners and the inability of the limited partners to replace the general partner. Control can be demonstrated by the limited partners if the limited partners have the right to dissolve or liquidate the partnership or otherwise remove the general partner without cause or have rights to participate in the significant decisions made in the ordinary course of the partnership’s business.
We evaluate each of our investments and contractual relationships to determine whether they meet the guidelines of consolidation. Our examination consists of reviewing the sufficiency of equity at risk, controlling financial interests, voting rights, and the obligation to absorb expected losses and expected gains, including residual returns. Based on our examination, the following entities were determined to be VIE’s: Mystic Partners, LLC; Mystic Partners Leaseco, LLC; South Bay Boston, LLC; HT LTD Williamsburg One LLC; HT LTD Williamsburg Two LLC; Metro 29th Sublessee, LLC; Hersha Statutory Trust I; and Hersha Statutory Trust II. Mystic Partners, LLC is a VIE entity, however because we are not the primary beneficiary it is not consolidated by the Company. Our maximum exposure to losses due to our investment in Mystic Partners, LLC is limited to our investment in the joint venture which is $25,935 as of December 31, 2010. Also, Mystic Partners Leaseco, LLC; South Bay Boston, LLC; HT LTD Williamsburg One LLC; HT LTD Williamsburg Two LLC, and Metro 29th Sublessee, LLC lease hotel properties from our joint venture interests and are VIEs. These entities are consolidated by the lessors, the primary beneficiaries of each entity. Hersha Statutory Trust I and Hersha Statutory Trust II are VIEs but HHLP is not the primary beneficiary in these entities. The accounts of Hersha Statutory Trust I and Hersha Statutory Trust II are not consolidated with and into HHLP.
We have consolidated the operations of LTD Associates One, LLC; and LTD Associates Two, LLC joint ventures because each entity is a voting interest entity and the Company owns a majority voting interest in the venture. In addition, we have consolidated the operations of the Hiren Boston, LLC joint venture beginning on April 13, 2010, due to debt restructuring event which caused Hiren Boston, LLC to become a VIE. Since HHLP is considered the primary beneficiary of this VIE, we have consolidated this joint venture.
We allocate resources and assess operating performance based on individual hotels and consider each one of our hotels to be an operating segment. All of our individual operating segments meet the aggregation criteria. All of our other real estate investment activities are immaterial and meet the aggregation criteria, and thus, we report one segment: investment in hotel properties.
Use of Estimates
The preparation of financial statements in conformity with accounting principles generally accepted in the United States (US GAAP) requires management to make estimates and assumptions that affect the reported amount of assets and liabilities and disclosure of contingent assets and liabilities at the date of the financial statements and the reported amounts of revenue and expenses during the reporting period. Actual results could differ from those estimates.
Although we believe the assumptions and estimates we made are reasonable and appropriate, as discussed in the applicable sections throughout these Consolidated Financial Statements, different assumptions and estimates could materially impact our reported results. The current economic environment has increased the degree of uncertainty inherent in these estimates and assumptions and changes in market conditions could impact our future operating results.
HERSHA HOSPITALITY TRUST AND SUBSIDIARIES
NOTES TO THE CONSOLIDATED FINANCIAL STATEMENTS
FOR THE YEARS ENDED DECEMBER 31, 2010, 2009, AND 2008
[IN THOUSANDS, EXCEPT SHARE/UNIT AND PER SHARE AMOUNTS]
NOTE 1 - ORGANIZATION AND SUMMARY OF SIGNIFICANT ACCOUNTING POLICIES (continued)
Investment in Hotel Properties
The Company allocates the purchase price of hotel properties acquired based on the fair value of the acquired real estate, furniture, fixtures and equipment, and intangible assets and the fair value of liabilities assumed, including debt. The Company’s investments in hotel properties are carried at cost and are depreciated using the straight-line method over the following estimated useful lives:
|
Building and Improvements
|
|
7 to 40 Years
|
|
Furniture, Fixtures and Equipment
|
|
2 to 7 Years
|
The Company periodically reviews the carrying value of each hotel to determine if circumstances indicate impairment to the carrying value of the investment in the hotel or that depreciation periods should be modified. If facts or circumstances support the possibility of impairment, the Company will prepare an estimate of the undiscounted future cash flows, without interest charges, of the specific hotel. Based on the properties undiscounted future cash flows, the Company will determine if the investment in such hotel is recoverable. If impairment is indicated, an adjustment will be made to reduce the carrying value of the hotel to reflect the hotel at fair value.
We consider a hotel to be held for sale when management and our independent trustees commit to a plan to sell the property, the property is available for sale, management engages in an active program to locate a buyer for the property and it is probable the sale will be completed within a year of the initiation of the plan to sell.
Investment in Unconsolidated Joint Ventures
If it is determined that we do not have a controlling interest in a joint venture, either through our financial interest in a VIE or our voting interest in a voting interest entity, the equity method of accounting is used. Under this method, the investment, originally recorded at cost, is adjusted to recognize our share of net earnings or losses of the affiliates as they occur rather than as dividends or other distributions are received, limited to the extent of our investment in, advances to and commitments for the investee. Pursuant to our joint venture agreements, allocations of profits and losses of some of our investments in unconsolidated joint ventures may be allocated disproportionately as compared to the ownership percentages due to specified preferred return rate thresholds.
The Company periodically reviews the carrying value of its investment in unconsolidated joint ventures to determine if circumstances indicate impairment to the carrying value of the investment that is other than temporary. When an impairment indicator is present, we will estimate the fair value of the investment. Our estimate of fair value takes into consideration factors such as expected future operating income, trends and prospects, as well as the effects of demand, competition and other factors. This determination requires significant estimates by management, including the expected cash flows to be generated by the assets owned and operated by the joint venture. To the extent impairment has occurred, the loss will be measured as the excess of the carrying amount over the fair value of our investment in the unconsolidated joint venture.
Development Loans Receivable
The Company provides secured first-mortgage and mezzanine financing to hotel developers. Development loans receivable are recorded at cost and are reviewed for potential impairment on an on-going basis. The Company’s development loans receivable are each secured by various hotel or hotel development properties or partnership interests in hotel or hotel development properties. We have determined that development loans receivable do not constitute a financial interest in a VIE and do not consolidate the operating results of the borrower in our consolidated financial statements. Our evaluation consists of reviewing the sufficiency of the borrower’s equity at risk, controlling financial interests in the borrower, voting rights of the borrower, and the borrower’s obligation to absorb expected losses and expected gains, including residual returns. The analysis utilized by the Company in evaluating the development loans receivable involves considerable management judgment and assumptions.
A development loan receivable is considered impaired when it becomes probable, based on current information, that the Company will be unable to collect all amounts due according to the loan’s contractual terms. The amount of impairment, if any, is measured by comparing the recorded amount of the loan to the present value of the expected cash flows or the fair value of the collateral. If a loan was deemed to be impaired, the Company would record a charge to income for any shortfall.
HERSHA HOSPITALITY TRUST AND SUBSIDIARIES
NOTES TO THE CONSOLIDATED FINANCIAL STATEMENTS
FOR THE YEARS ENDED DECEMBER 31, 2010, 2009, AND 2008
[IN THOUSANDS, EXCEPT SHARE/UNIT AND PER SHARE AMOUNTS]
NOTE 1 - ORGANIZATION AND SUMMARY OF SIGNIFICANT ACCOUNTING POLICIES (continued)
Cash and Cash Equivalents
Cash and cash equivalents represent cash on hand and in banks plus short-term investments with an initial maturity of three months or less when purchased.
Escrow Deposits
Escrow deposits include reserves for debt service, real estate taxes, and insurance and reserves for furniture, fixtures, and equipment replacements, as required by certain mortgage debt agreement restrictions and provisions.
Hotel Accounts Receivable
Hotel accounts receivable consists primarily of meeting and banquet room rental and hotel guest receivables. The Company generally does not require collateral. Ongoing credit evaluations are performed and an allowance for potential losses from uncollectible accounts is provided against the portion of accounts receivable that is estimated to be uncollectible.
Deferred Costs
Deferred loan costs are recorded at cost and amortized over the terms of the related indebtedness using the effective interest method.
Due from/to Related Parties
Due from/to Related Parties represents current receivables and payables resulting from transactions related to hotel management and project management with affiliated entities. Due from related parties results primarily from advances of shared costs incurred and interest receivable on development loans made to related parties. Due to affiliates results primarily from hotel management and project management fees incurred. Both due to and due from related parties are generally settled within a period not to exceed one year.
Intangible Assets
Intangible assets consist of leasehold intangibles for above-market and below-market value of in-place leases and deferred franchise fees. The leasehold intangibles are amortized over the remaining lease term. Deferred franchise fees are amortized using the straight-line method over the life of the franchise agreement.
Noncontrolling Interest
Noncontrolling interest in the Partnership represents the limited partner’s proportionate share of the equity of the Partnership. Income (loss) is allocated to noncontrolling interest in accordance with the weighted average percentage ownership of the Partnership during the period. At the end of each reporting period the appropriate adjustments to the income (loss) are made based upon the weighted average percentage ownership of the Partnership during the period. Our ownership interest in the Partnership as of December 31, 2010, 2009 and 2008 was 95.8%, 86.9%, and 84.5%, respectively.
Effective January 1, 2009, we adopted a new accounting standard which defines a noncontrolling interest as the portion of equity in a subsidiary not attributable, directly or indirectly, to a parent. Under this standard, such noncontrolling interests are reported on the consolidated balance sheets within equity, but separately from the shareholders’ equity. Revenues, expenses and net income or loss attributable to both the Company and noncontrolling interests are reported on the consolidated statements of operations.
HERSHA HOSPITALITY TRUST AND SUBSIDIARIES
NOTES TO THE CONSOLIDATED FINANCIAL STATEMENTS
FOR THE YEARS ENDED DECEMBER 31, 2010, 2009, AND 2008
[IN THOUSANDS, EXCEPT SHARE/UNIT AND PER SHARE AMOUNTS]
NOTE 1 - ORGANIZATION AND SUMMARY OF SIGNIFICANT ACCOUNTING POLICIES (continued)
In accordance with US GAAP, we classify securities that are redeemable for cash or other assets at the option of the holder, or not solely within the control of the issuer, outside of permanent equity in the consolidated balance sheet. The Company makes this determination based on terms in applicable agreements, specifically in relation to redemption provisions. Additionally, with respect to noncontrolling interests for which the Company has a choice to settle the contract by delivery of its own shares, the Company considers the guidance in US GAAP to evaluate whether the Company controls the actions or events necessary to issue the maximum number of common shares that could be required to be delivered at the time of settlement of the contract.
We classify the noncontrolling interests of our consolidated joint ventures within equity on our consolidated balance sheets. These noncontrolling interests totaled $474 as of December 31, 2010 and $267 as of December 31, 2009. In addition, certain common units of limited partnership interests in HHLP (“Nonredeemable Common Units”) are reclassified from the mezzanine section of our consolidated balance sheets to equity. These noncontrolling interests of Nonredeemable Common Units totaled $19,410 as of December 31, 2010 and $27,126 as of December 31, 2009. As of December 31, 2010, there were 4,404,660 Nonredeemable Common Units outstanding with a fair market value of $29,071, based on the price per share of our common shares on the NYSE on such date. These units are only redeemable by the unit holders for common shares on a one-for-one basis or, at our option, cash.
Certain common units of limited partnership interests in HHLP (“Redeemable Common Units”) have been pledged as collateral in connection with a pledge and security agreement entered into by the Company and the holders of the Redeemable Common Units. The redemption feature contained in the pledge and security agreement where the Redeemable Common Units serve as collateral contains a provision that could result in a net cash settlement outside of the control of the Company. As a result, the Redeemable Common Units will continue to be classified in the mezzanine section of the consolidated balance sheets as they do not meet the requirements for equity classification under US GAAP. The carrying value of the Redeemable Common Units equals the greater of carrying value based on the accumulation of historical cost or the redemption value. As of December 31, 2010, there were 3,014,252 Redeemable Common Units outstanding with a redemption value equal to the fair value of the Redeemable Common Units, or $19,894. The redemption value of the Redeemable Common Units is based on the price per share of our common shares on the NYSE on such date. As of December 31, 2010, the Redeemable Common Units were valued on the consolidated balance sheets at redemption value since the Redeemable Common Units redemption value was greater than historical cost of $13,521. As of December 31, 2009, the Redeemable Common Units were valued on the consolidated balance sheets at carrying value based on historical cost of $14,733 since historical cost exceeded the Redeemable Common Units redemption value of $9,622.
We also maintain noncontrolling interests for the equity interest owned by third parties in LTD Associates One, LLC and LTD Associates Two, LLC. Third parties own a 25% interest in each of LTD Associates One, LLC and LTD Associates Two, LLC. In addition, we maintain noncontrolling interest for the equity interest owned by third parties in Hiren Boston, LLC. A third party owns a 50% interest in Hiren Boston, LLC. We allocate the income (loss) of these joint ventures to the noncontrolling interest in consolidated joint ventures based upon the ownership of the entities, preferences in distributions of cash available and the terms of each venture agreement.
Net income or loss attributed to Nonredeemable Common Units and Redeemable Common Units (collectively, “Common Units”), as well as the net income or loss related to the noncontrolling interests of our consolidated joint ventures, is included in net income or loss in the consolidated statements of operations. Net income or loss attributed to the Common Units and the noncontrolling interests of our consolidated joint ventures is excluded from net income or loss applicable to common shareholders in the consolidated statements of operations.
Shareholders’ Equity
On January 21, 2010, we completed a public offering in which 51,750,000 common shares, including 6,750,000 common shares subject to an overallotment option exercised by the underwriters, were sold by us through several underwriters for net proceeds to us of approximately $148,955 before the payment of offering-related expenses. Immediately upon closing the offering, we contributed all of the net proceeds of the offering to HHLP in exchange for additional common units of limited partnership in HHLP.
On March 24, 2010, we completed a public offering in which 27,600,000 common shares, including 3,600,000 common shares subject to an overallotment option exercised by the underwriters, were sold by us through several underwriters for net proceeds to us of approximately $112,762 before the payment of offering-related expenses. Immediately upon closing the offering, we contributed all of the net proceeds of the offering to the Partnership in exchange for additional common units of limited partnership in HHLP.
HERSHA HOSPITALITY TRUST AND SUBSIDIARIES
NOTES TO THE CONSOLIDATED FINANCIAL STATEMENTS
FOR THE YEARS ENDED DECEMBER 31, 2010, 2009, AND 2008
[IN THOUSANDS, EXCEPT SHARE/UNIT AND PER SHARE AMOUNTS]
NOTE 1 - ORGANIZATION AND SUMMARY OF SIGNIFICANT ACCOUNTING POLICIES (continued)
On October 22, 2010, we completed a public offering in which 28,750,000 common shares, including 3,750,000 common shares subject to an overallotment option exercised by the underwriters, were sold by us through several underwriters for net proceeds to us of approximately $160,017 before the payment of offering-related expenses. Immediately upon closing the offering, we contributed all of the net proceeds of the offering to HHLP in exchange for additional common units of limited partnership in HHLP. HHLP used the net proceeds of this offering to reduce some of the indebtedness outstanding under our revolving line of credit facility and secured debt on several of our existing assets and intends to use the remainder for general corporate purposes, including repayment of debt and and future acquisitions.
Aggregate offering-related expenses associated with these three public offerings were approximately $1,293, resulting in net proceeds after expenses of $420,441.
On August 4, 2009, we entered into a purchase agreement with Real Estate Investment Group L.P. (“REIG”), pursuant to which we sold 5,700,000 Class A common shares of beneficial interest at a price of $2.50 per share to REIG for gross proceeds of $14,250. REIG is a Bermuda limited partnership, whose general partner and majority limited partner wholly-owned by IRSA Inversiones y Representaciones Sociedad Anуnima, a stock corporation organized under the laws of the Republic of Argentina (“IRSA”). We also granted REIG the option to buy up to an additional 5,700,000 common shares at a price of $3.00 per share, which is exercisable through August 4, 2014. If at any time after August 4, 2011 the closing price for our common shares on the NYSE exceeds $5.00 for 20 consecutive trading days, we may call in and cancel the option in exchange for issuance of common shares to REIG with an aggregate value equal to the volume weighted average price per common share for the 20 trading days prior to the exercise of the option, less the $3.00 option price, multiplied by the number of common shares remaining under the option.
On June 12, 2009, we entered into a sales agreement with a broker-dealer acting as a sales agent, under which it may offer and sell up to 15,000,000 Class A common shares of beneficial interest. Sales of shares under this agreement, if any, may be made by any method permitted by law deemed to be an “at the market offering” and in privately negotiated transactions. The sales agent is to use its commercially reasonable efforts consistent with its normal trading and sales practice to sell the shares as directed by the Company. The sales agent is entitled to compensation equal to 2.75% of the gross sales price per share for any shares sold under the agreement. Under the sales agreement, during the year ended December 31, 2009, we sold 2,742,300 shares with net proceeds of $8,258.
On May 16, 2008, we completed a public offering of 6,000,000 common shares at $9.90 per share. On May 20, 2008, the underwriters exercised a portion of their over-allotment option with respect to that offering, and we issued an additional 600,000 common shares at $9.90 per share. Proceeds to us, net of underwriting discounts and commissions and expenses, were approximately $61,845. Immediately upon closing the offering, we contributed all of the net proceeds of the offering to the Partnership in exchange for additional Partnership interests. The net offering proceeds were used to repay indebtedness.
Stock Based Compensation
We measure the cost of employee service received in exchange for an award of equity instruments based on the grant-date fair value of the award. The compensation cost is amortized on a straight line basis over the period during which an employee is required to provide service in exchange for the award. The compensation cost related to performance awards that are contingent upon market based criteria being met is recorded at the fair value of the award on the date of the grant and amortized over the performance period.
Derivatives and Hedging
The Company’s objective in using derivatives is to add stability to interest expense and to manage its exposure to interest rate movements or other identified risks. To accomplish this objective, the Company primarily uses interest rate swaps and interest rate caps as part of its cash flow hedging strategy. Interest rate swaps designated as cash flow hedges involve the receipt of variable-rate amounts in exchange for fixed-rate payments over the life of the agreements without exchange of the underlying principal amount. Interest rate caps designated as cash flow hedges limit the Company’s exposure to increased cash payments due to increases in variable interest rates.
HERSHA HOSPITALITY TRUST AND SUBSIDIARIES
NOTES TO THE CONSOLIDATED FINANCIAL STATEMENTS
FOR THE YEARS ENDED DECEMBER 31, 2010, 2009, AND 2008
[IN THOUSANDS, EXCEPT SHARE/UNIT AND PER SHARE AMOUNTS]
NOTE 1 - ORGANIZATION AND SUMMARY OF SIGNIFICANT ACCOUNTING POLICIES (continued)
Revenue Recognition
We recognize revenue and expense for all consolidated hotels as hotel operating revenue and hotel operating expense when earned
and incurred. These revenues are recorded net of any sales or occupancy taxes collected from our guests. We participate in frequent guest programs sponsored by the brand owners of our hotels and we expense the charges associated with those programs, as incurred.
Interest income on development loan financing is recorded in the period earned based on the interest rate of the loan and outstanding balance during the period. Development loans receivable and accrued interest on the development loans receivable are evaluated to determine if outstanding balances are collectible. Interest is recorded only if it is determined the outstanding loan
balance and accrued interest balance are collectible.
Other revenues consist primarily of fees earned for asset management services provided to hotels we own through unconsolidated joint ventures. Fees are earned as a percentage of hotel revenue and are recorded in the period earned to the extent of the noncontrolling interest ownership.
Income Taxes
The Company qualifies as a REIT under applicable provisions of the Internal Revenue Code, as amended, and intends to continue to qualify as a REIT. In general, under such provisions, a trust which has made the required election and, in the taxable year, meets certain requirements and distributes to its shareholders at least 90% of its REIT taxable income will not be subject to Federal income tax to the extent of the income which it distributes. Earnings and profits, which determine the taxability of dividends to shareholders, differ from net income reported for financial reporting purposes due primarily to differences in depreciation of hotel properties for Federal income tax purposes.
Deferred income taxes relate primarily to the TRS Lessee and are accounted for using the asset and liability method. Under this method, deferred income taxes are recognized for temporary differences between the financial reporting bases of assets and liabilities of the TRS Lessee and their respective tax bases and for their operating loss and tax credit carry forwards based on enacted tax rates expected to be in effect when such amounts are realized or settled. However, deferred tax assets are recognized only to the extent that it is more likely than not that they will be realized based on consideration of available evidence, including tax planning strategies and other factors.
Although the TRS Lessee is expected to operate at a profit for Federal income tax purposes in future periods, the utilization of the deferred tax asset is not determinable. Therefore, any deferred tax assets have been reserved as we have not concluded that it is more likely than not that these deferred tax assets will be realizable.
Reclassification
Certain amounts in the prior year financial statements have been reclassified to conform to the current year presentation.
Recent Accounting Pronouncements
Disclosures about the Credit Quality of Financing Receivables and the Allowance for Credit Costs
In July 2010, the FASB issued a new accounting standard that expands existing disclosures about the credit quality of financial receivables and the related allowance for credit losses. The expanded disclosure requirements, which are effective for ending balances as of December 31, 2010, are applicable to our Development Loans Receivable, and have been included in Note 4. Disclosures regarding activity that occurs during the reporting period will be effective beginning January 1, 2011.
HERSHA HOSPITALITY TRUST AND SUBSIDIARIES
NOTES TO THE CONSOLIDATED FINANCIAL STATEMENTS
FOR THE YEARS ENDED DECEMBER 31, 2010, 2009, AND 2008
[IN THOUSANDS, EXCEPT SHARE/UNIT AND PER SHARE AMOUNTS]
NOTE 2 – INVESTMENT IN HOTEL PROPERTIES
Investment in hotel properties consists of the following at December 31, 2010 and 2009:
|
December 31, 2010
|
December 31, 2009
|
|||||||
|
Land
|
$ | 233,869 | $ | 161,449 | ||||
|
Buildings and Improvements
|
1,057,344 | 814,461 | ||||||
|
Furniture, Fixtures and Equipment
|
150,723 | 122,174 | ||||||
|
Construction in Progress
|
15,301 | - | ||||||
| 1,457,237 | 1,098,084 | |||||||
|
Less Accumulated Depreciation
|
(211,386 | ) | (159,130 | ) | ||||
|
Total Investment in Hotel Properties
|
$ | 1,245,851 | $ | 938,954 | ||||
Depreciation expense was $51,823, $44,002 and $41,219 for the years ended December 31, 2010, 2009 and 2008, respectively.
Acquisitions
During the year ended December 31, 2010 we acquired the following wholly owned hotel properties:
|
Hotel
|
Acquisition Date
|
Land
|
Buildings and Improvements
|
Furniture Fixtures and Equipment
|
Franchise Fees, Loan Costs, and Leasehold Intangible
|
Construction in Progress
|
Total Purchase Price
|
Fair Value of Assumed Debt
|
||||||||||||||||||||||
|
Hilton Garden Inn, Glastonbury, CT
|
1/1/2010
|
$ | 1,898 | $ | 12,981 | $ | 2,223 | $ | 27 | $ | - | $ | 17,129 | $ | 11,937 | |||||||||||||||
|
Hampton Inn, Times Square, NY
|
2/9/2010
|
10,691 | 41,637 | 3,939 | 89 | - | 56,356 | - | ||||||||||||||||||||||
|
Holiday Inn Express, Times Square, NY
|
2/9/2010
|
11,075 | 43,113 | 4,078 | 105 | - | 58,371 | - | ||||||||||||||||||||||
|
Candlewood Suites, Times Square, NY
|
2/9/2010
|
10,281 | 36,687 | 4,298 | 96 | - | 51,362 | - | ||||||||||||||||||||||
|
Holiday Inn, Wall Street, NY
|
5/7/2010
|
12,152 | 21,100 | 1,567 | 57 | - | 34,876 | - | ||||||||||||||||||||||
|
Hampton Inn, Washington, DC
|
9/1/2010
|
9,335 | 58,048 | 5,605 | 108 | - | 73,096 | - | ||||||||||||||||||||||
|
Sheraton, New Castle, DE
|
12/28/2010
|
- | - | - | - | 15,301 | 15,301 | - | ||||||||||||||||||||||
|
Total
|
$ | 55,432 | $ | 213,566 | $ | 21,710 | $ | 482 | $ | 15,301 | $ | 306,491 | $ | 11,937 | ||||||||||||||||
On January 1, 2010, we acquired our joint venture partner’s 52.0% membership interest in PRA Glastonbury, LLC, the owner of the Hilton Garden Inn, Glastonbury, CT, and as a result, this hotel became one of our wholly-owned properties. We assumed $13,141 in mortgage debt with the acquisition of this property bearing interest at 5.98% which was determined on the date of acquisition to be below market rates. We recorded a discount of $1,204 related to the assumption of this debt which will be amortized through the date of the debt’s maturity in April 2016. Amortization of the discount is recorded as interest expense on our consolidated statement of operations. See “Note 3 – Investment in Unconsolidated Joint Ventures” for further discussion of this transaction.
On February 9, 2010, we acquired a Hampton Inn, a Holiday Inn Express and a Candlewood Suites in the area of Times Square, New York, NY. The sellers of the three hotels were related to each other, but not the Company. The total purchase price for the three hotels was $166,089 and consisted of $160,790 in cash and 1,451,613 Common Units, valued at $5,299. In addition, we paid closing costs of $3,228 and acquired approximately $63 in net working capital assets.
HERSHA HOSPITALITY TRUST AND SUBSIDIARIES
NOTES TO THE CONSOLIDATED FINANCIAL STATEMENTS
FOR THE YEARS ENDED DECEMBER 31, 2010, 2009, AND 2008
[IN THOUSANDS, EXCEPT SHARE/UNIT AND PER SHARE AMOUNTS]
NOTE 2 – INVESTMENT IN HOTEL PROPERTIES (continued)
On May 7, 2010, we entered into a contribution agreement with an unrelated third party and closed on the acquisition of 100% of the membership interests in Maiden Hotel LLC, the owner of the Wall Street Holiday Inn, New York, NY. The aggregate purchase price paid for the membership interests in Maiden Hotel LLC was approximately $34,876. The purchase price paid included the issuance of 200,000 Common Units, valued at $957, the settlement of $7,839 of existing mezzanine financing and accrued interest income, and the payment of approximately $26,080 in cash provided, in part, from borrowings under our existing line of credit. The property was purchased unencumbered of debt. In addition, we paid closing costs of $151 and acquired approximately $511 in net working capital.
On September 1, 2010, we entered into a purchase and sale agreement with an unrelated third party and closed on the acquisition of the Hampton Inn, Washington, DC. The total purchase price for this hotel was $73,096, which was paid in cash provided by borrowings under our revolving line of credit. In addition, we paid closing costs of $1,188 and acquired approximately $304 in net working capital assets.
On December 28, 2010 we closed on the acquisition of a parcel of land which includes a multi-story vacant hotel building with an unrelated third party in New Castle, DE. The total purchase price for this hotel was $15,301, which was paid in cash. We have begun the process of converting this hotel building into a branded hotel. The conversion has an estimated completion date of June 2011.
As shown in the table below, included in the consolidated statements of operations for the year ended December 31, 2010 are total revenues of $46,147 and total net income of $7,518 for the hotels we acquired a 100% interest in since January 1, 2010. These amounts represent the results of operations for such hotels since the date of acquisition of our 100% interest in such hotels.
|
Twelve Months Ended,
|
||||||||
|
December 31, 2010
|
||||||||
|
Hotel
|
Revenue
|
Net (Loss) Income
|
||||||
|
Hilton Garden Inn, Glastonbury, CT
|
$ | 5,046 | $ | (142 | ) | |||
|
Hampton Inn, Holiday Inn Express, Candlewood Suites, Times Square, NY
|
32,681 | 7,025 | ||||||
|
Holiday Inn, Wall Street, NY
|
4,496 | 962 | ||||||
|
Hampton Inn, Washington, DC
|
3,924 | (327 | ) | |||||
|
Total
|
$ | 46,147 | $ | 7,518 | ||||
During the year ended December 31, 2009 we acquired the following wholly owned hotel properties:
|
Hotel
|
Acquisition Date
|
Land
|
Buildings and Improvements
|
Furniture Fixtures and Equipment
|
Franchise Fees, Loan Costs, and Leasehold Intangible
|
Construction in Progress
|
Total Purchase Price
|
Fair Value of Assumed Debt
|
||||||||||||||||||||||
|
Hilton Garden Inn, TriBeCa, New York, NY
|
6/30/2009
|
$ | 21,077 | $ | 42,955 | $ | 2,668 | $ | 300 | $ | - | $ | 67,000 | $ | 29,824 | |||||||||||||||
|
Hampton Inn, West Haven, CT
|
11/4/2009
|
1,053 | 10,751 | 1,196 | - | - | 13,000 | 7,700 | ||||||||||||||||||||||
|
Total
|
$ | 22,130 | $ | 53,706 | $ | 3,864 | $ | 300 | $ | - | $ | 80,000 | $ | 37,524 | ||||||||||||||||
On May 1, 2009, we acquired, from an unaffiliated seller, a 49% membership interest in York Street, LLC, the owner of the Hilton Garden Inn, TriBeCa, New York, NY. In connection with the acquisition of our 49% interest in York Street, LLC, we also entered into an option agreement to acquire the seller’s remaining 51% interest in York Street, LLC. On June 30, 2009, we exercised the option and acquired the remaining 51% interest in York Street, LLC making the Hilton Garden Inn, TriBeCa, New York, NY, wholly owned. Consideration given as of the purchase date to acquire our 100% interest in York Street, LLC included:
HERSHA HOSPITALITY TRUST AND SUBSIDIARIES
NOTES TO THE CONSOLIDATED FINANCIAL STATEMENTS
FOR THE YEARS ENDED DECEMBER 31, 2010, 2009, AND 2008
[IN THOUSANDS, EXCEPT SHARE/UNIT AND PER SHARE AMOUNTS]
NOTE 2 – INVESTMENT IN HOTEL PROPERTIES (continued)
|
Cash paid to seller
|
$ | 4,794 | ||
|
Amounts payable to seller
|
1,387 | (1) | ||
|
Settlement of development loans receivable and accrued interest income on development loans
|
19,555 | (2) | ||
|
Land and mortgage transferred to seller
|
10,118 | (3) | ||
|
Assumption of York Street, LLC mortgage loan payable
|
29,824 | (4) | ||
|
Net hotel working capital liabilities assumed
|
1,322 | |||
|
Total consideration given
|
$ | 67,000 |
|
|
(1)
|
“Cash payable to the seller” of $1,387 was held back at settlement pending the seller’s completion of certain capital expenditures and the delivery on the Company’s obligation to transfer land to the seller.
|
|
|
(2)
|
“Settlement of development loans receivable and accrued interest income on development loans” consists of principal and accrued interest receivable reductions with respect to development loans made to York Street, LLC and Maiden Hotel, LLC, an entity controlled by the seller. See “Note 4 – Development Loans Receivable and Land Leases” for more information related to the development loans made to York Street, LLC and Maiden Hotel, LLC.
|
|
|
(3)
|
“Land and mortgage transferred to seller” consisted of our investment in real property at 440 West 41st Street, New York, NY, and related land lease revenue receivable. This parcel was acquired on July 28, 2006 and leased to Metro Forty First Street, LLC, an entity controlled by the seller. In connection with our acquisition of the membership interests in York Street, LLC, we transferred this property to Metro Forty First Street, LLC, and that entity assumed our obligations under the $12,100 mortgage loan encumbering the property.
|
|
|
(4)
|
The mortgage loan assumed in connection with the acquisition of York Street, LLC, which is secured by the Hilton Garden Inn, TriBeCa, New York, NY, was refinanced on August 7, 2009 with a $29,824 first mortgage loan which matures in July 2012 and bears interest at the Wall Street Journal variable prime rate plus 2.0% subject to an interest rate floor of 8.75%.
|
We recorded an intangible asset for the lease of restaurant space located in the Hilton Garden Inn, TriBeCa, New York, NY that was in place at the time of acquisition. The lease is with an unrelated third party and has 15 years remaining until expiration with one five year extension option. We earn fixed rent under this lease at a minimum of $300 per annum for the first five years of the lease and a minimum of $336 and $376 per annum for the second and third five-year periods of the lease, respectively.
On November 4, 2009, we entered into a contribution agreement and closed on the acquisition of 100% of the membership interests in 44 West Haven Hospitality, LLC, the owner of the Hampton Inn and Suites, West Haven, CT. The aggregate purchase price paid for the membership interests in 44 West Haven Hospitality, LLC was approximately $13,000, including the assumption of $7,700 of existing mortgage debt secured by a first lien on the Hampton Inn and Suites, West Haven, CT, the release of $2,000 of existing mezzanine financing provided by us to 44 West Haven Hospitality, LLC, the cancellation of approximately $200 in accrued interest related to the existing mezzanine financing and approximately $3,100 of cash. The assumed mortgage debt bears interest at a fixed rate of 6.0% and matures in November 2012, with a three year extension subject to approval by the lenders. In addition, we paid the lenders a modification fee of $39. Certain of our officers and affiliated trustees had direct or indirect interests in 44 West Haven Hospitality, LLC. As a related party transaction, the transaction was approved by all of our independent trustees. HHMLP will continue to manage the Hampton Inn and Suites, West Haven, CT.
HERSHA HOSPITALITY TRUST AND SUBSIDIARIES
NOTES TO THE CONSOLIDATED FINANCIAL STATEMENTS
FOR THE YEARS ENDED DECEMBER 31, 2010, 2009, AND 2008
[IN THOUSANDS, EXCEPT SHARE/UNIT AND PER SHARE AMOUNTS]
NOTE 2 – INVESTMENT IN HOTEL PROPERTIES (continued)
Pro Forma Results (Unaudited)
The following condensed pro forma financial data is presented as if all acquisitions had been completed on January 1, 2009. Properties acquired without any operating history are excluded from the condensed pro forma operating results. The condensed pro forma information is not necessarily indicative of what actual results of operations of the Company would have been assuming the acquisitions had been consummated on January 1, 2009 at the beginning of the year presented, nor does it purport to represent the results of operations for future periods.
|
For the Year Ended December 31,
|
||||||||
|
2010
|
2009
|
|||||||
|
Pro Forma Total Revenues
|
$ | 294,049 | $ | 260,145 | ||||
|
Pro Forma (Loss) income from Continuing Operations
|
$ | (13,698 | ) | $ | (53,548 | ) | ||
|
Income (Loss) from Discontinued Operations
|
471 | 2,308 | ||||||
|
Pro Forma Net (Loss) income
|
(13,227 | ) | (51,240 | ) | ||||
|
Loss (Income) allocated to Noncontrolling Interest
|
605 | 7,543 | ||||||
|
Preferred Distributions
|
(4,800 | ) | (4,800 | ) | ||||
|
Pro Forma Net (Loss) income applicable to Common Shareholders
|
$ | (17,422 | ) | $ | (48,497 | ) | ||
|
Pro Forma (Loss) income applicable to Common Shareholders per Common Share
|
||||||||
|
Basic
|
$ | (0.16 | ) | $ | (0.95 | ) | ||
|
Diluted
|
$ | (0.16 | ) | $ | (0.95 | ) | ||
|
Weighted Average Common Shares Outstanding
|
||||||||
|
Basic
|
134,370,172 | 51,027,742 | ||||||
|
Diluted
|
134,370,172 | 51,027,742 | ||||||
Renovation
On April 2, 2010, we commenced renovations to convert two of our existing adjoining hotel properties in King of Prussia, PA into a Hyatt Place. The hotels previously operated as a Mainstay Suites and a Sleep Inn and were closed at the time renovations commenced. As such, we ceased recording depreciation expense on the two existing properties and we capitalized the cost of construction, including interest, during the period of time the hotel was under renovation. On August 17, 2010, the renovations were completed and the hotel opened. We capitalized approximately $6,471 in renovation costs, which are included in Investment in Hotel Properties on the consolidated balance sheet.
Earn-out Provisions
Purchase agreements related to the Holiday Inn Express, Camp Springs, MD and Hampton Inn and Suites, Smithfield, RI hotels contained certain earn-out provisions that entitled the seller to a payment based on operating metrics of the hotel properties. As of December 31, 2010, the earnout period expired for these properties. These properties did not meet the required net operating income thresholds established in the properties’ purchase agreements. As such, no amounts were paid or are payable to the sellers under these earn-out provisions.
HERSHA HOSPITALITY TRUST AND SUBSIDIARIES
NOTES TO THE CONSOLIDATED FINANCIAL STATEMENTS
FOR THE YEARS ENDED DECEMBER 31, 2010, 2009, AND 2008
[IN THOUSANDS, EXCEPT SHARE/UNIT AND PER SHARE AMOUNTS]
NOTE 3 — INVESTMENT IN UNCONSOLIDATED JOINT VENTURES
As of December 31, 2010 and December 31, 2009 our investment in unconsolidated joint ventures consisted of the following:
|
Joint Venture
|
Hotel Properties
|
Percent Owned
|
Preferred Return
|
December 31, 2010
|
December 31, 2009
|
||||||||||||
|
PRA Glastonbury, LLC
|
Hilton Garden Inn, Glastonbury, CT
|
48.0 | % |
11.0% cumulative
|
$ | - | $ | 561 | |||||||||
|
Inn American Hospitality at Ewing, LLC
|
Courtyard by Marriott, Ewing, NJ
|
50.0 | % |
11.0% cumulative
|
28 | 459 | |||||||||||
|
Hiren Boston, LLC*
|
Courtyard by Marriott, Boston, MA
|
50.0 | % | N/A | - | - | |||||||||||
|
SB Partners, LLC
|
Holiday Inn Express, Boston, MA
|
50.0 | % | N/A | 1,852 | 1,934 | |||||||||||
|
Mystic Partners, LLC
|
Hilton and Marriott branded hotels in CT and RI
|
8.8%-66.7 | % |
8.5%
non-cumulative
|
25,935 | 27,043 | |||||||||||
|
PRA Suites at Glastonbury, LLC**
|
Homewood Suites, Glastonbury, CT
|
48.0 | % |
10.0%
non-cumulative
|
- | 1,754 | |||||||||||
|
Metro 29th Street Associates, LLC
|
Holiday Inn Express, New York, NY
|
50.0 | % | N/A | 7,746 | 7,431 | |||||||||||
| $ | 35,561 | $ | 39,182 | ||||||||||||||
*During the year ended December 31, 2009, we determined that our investment in the Courtyard by Marriott, Boston, MA was impaired. As a result, the Company recorded an impairment charge of $3,500 which is included in loss from unconsolidated joint venture investments on the Company’s consolidated statements of operations. This charge reduced our investment in the Courtyard by Marriott, Boston, MA to $0.
**During the year ended December 31, 2009, we determined that our investment in the Homewood Suites, Glastonbury, was impaired. As result, the Company recorded an impairment charge of $1,041 which is included in loss from unconsolidated joint venture investments on the Company’s consolidated statements of operations. This charged reduced our investment in the Homewood Suites, Glastonbury, to $1,754.
On January 1, 2010, we acquired our joint venture partner’s 52.0% membership interest in PRA Glastonbury, LLC, the owner of the Hilton Garden Inn, Glastonbury, CT, and this hotel became one of our wholly-owned hotels. The consideration provided to our joint venture partner in exchange for its 52.0% membership interest consisted of:
|
|
·
|
cash of $253;
|
|
|
·
|
our 48% minority membership interest in PRA Suites at Glastonbury, LLC, the owner of the Homewood Suites, Glastonbury, CT;
|
|
|
·
|
settlement of a note receivable and accrued interest made to our former joint venture partner with a principal balance of $1,267 and accrued interest receivable of $141; and
|
|
|
·
|
our assumption of the outstanding mortgage debt secured by the Hilton Garden Inn, Glastonbury, CT which had an outstanding principal balance of $13,141 as of December 31, 2009, bears interest at a fixed rate of 5.98% per annum and has an anticipated maturity date of April 1, 2016.
|
As a result of this transaction, our joint venture partner acquired our 48.0% minority membership interest in PRA Suites at Glastonbury, LLC, the entity owning the Homewood Suites, Glastonbury, CT, and assumed the outstanding mortgage debt secured by the Homewood Suites, Glastonbury, CT.
Due to the increase in our ownership interest in PRA Glastonbury, LLC, the value of our existing 48.0% interest was remeasured resulting in a $1,818 gain which was recorded upon our acquisition of the remaining interests in the Hilton Garden Inn, Glastonbury, CT.
HERSHA HOSPITALITY TRUST AND SUBSIDIARIES
NOTES TO THE CONSOLIDATED FINANCIAL STATEMENTS
FOR THE YEARS ENDED DECEMBER 31, 2010, 2009, AND 2008
[IN THOUSANDS, EXCEPT SHARE/UNIT AND PER SHARE AMOUNTS]
NOTE 3 — INVESTMENT IN UNCONSOLIDATED JOINT VENTURES (continued)
Hiren Boston, LLC, a joint venture that owns the 164-room Courtyard by Marriott located in South Boston, MA, had been pursuing discussions with its lender to refinance a $16,200 mortgage loan secured by the hotel property, which had originally matured in September 2009. On April 13, 2010, we purchased this mortgage loan from the lender, which had an unamortized principal balance of $15,628, for a purchase price of $13,750, and amended the terms of the note. As amended, this $13,750 mortgage loan now requires the joint venture to make monthly interest payments beginning on May 1, 2010, bears interest at a fixed rate of 10% per annum and matures on April 13, 2012. As a result of the purchase of this mortgage loan, we have determined that we are the primary beneficiary of Hiren Boston, LLC. As of April 13, 2010, we no longer accounted for our investment in Hiren Boston, LLC under the equity method of accounting and began accounting for Hiren Boston, LLC as a consolidated subsidiary. Hiren Boston, LLC’s results of operations are included in our consolidated statement of operations for the period from April 13, 2010 through December 31, 2010 and its balance sheet is included in our consolidated balance sheet as of December 31, 2010. Our interest in Hiren Boston, LLC was remeasured, and as a result, we recorded a gain of approximately $2,190.
During the year ended December 31, 2008, we determined that our investment in the Hartford Hilton, part of the Mystic Partners joint venture portfolio, was impaired. As a result, the Company recorded an impairment charge of $1,890 which is included in loss from unconsolidated joint venture investments on the Company’s consolidated statements of operations. This charge reduced our investment in the Hartford Hilton to $0.
Income or loss from our unconsolidated joint ventures is allocated to us and our joint venture partners consistent with the allocation of cash distributions in accordance with the joint venture agreements. Any difference between the carrying amount of these investments and the underlying equity in net assets is amortized over the expected useful lives of the properties and other intangible assets. Income (loss) recognized during the years ended December 31, 2010, 2009, and 2008 for our Investments in Unconsolidated Joint Ventures is as follows:
|
Twelve Months Ended December 31,
|
||||||||||||
|
2010
|
2009
|
2008
|
||||||||||
|
PRA Glastonbury, LLC
|
$ | - | $ | (77 | ) | $ | 94 | |||||
|
Inn American Hospitality at Ewing, LLC
|
(331 | ) | (127 | ) | 20 | |||||||
|
Hiren Boston, LLC
|
- | (460 | ) | (189 | ) | |||||||
|
SB Partners, LLC
|
(83 | ) | (156 | ) | 80 | |||||||
|
Mystic Partners, LLC
|
(1,650 | ) | (1,686 | ) | (345 | ) | ||||||
|
PRA Suites at Glastonbury, LLC
|
- | (6 | ) | (8 | ) | |||||||
|
Metro 29th Street Associates, LLC
|
313 | (137 | ) | 1,721 | ||||||||
| (1,751 | ) | (2,649 | ) | 1,373 | ||||||||
|
Gain from Remeasurement of Investment in Unconsolidated Joint Venture
|
4,008 | - | - | |||||||||
|
Less: Impairment of Investment in Unconsolidated Joint Venture
|
- | (4,541 | ) | (1,890 | ) | |||||||
|
Income (Loss) from Unconsolidated Joint Venture Investments
|
$ | 2,257 | $ | (7,190 | ) | $ | (517 | ) | ||||
The Mystic Partners, LLC joint venture agreement provides for an 8.5% non-cumulative preferred return based on our contributed equity interest in the venture. Cash distributions will be made from cash available for distribution, first, to us to provide an 8.5% annual non-compounded return on our unreturned capital contributions and then to our joint venture partner to provide an 8.5% annual non-compounded return of their unreturned contributions. Any remaining cash available for distribution will be distributed to us 10.5% with respect to the net cash flow from the Hartford Marriott, 7.0% with respect to the Hartford Hilton and 56.7%, with respect to the remaining seven properties. Mystic Partners, LLC allocates income to us and our joint venture partner consistent with the allocation of cash distributions in accordance with the joint venture agreements.
Each of the Mystic Partners, LLC hotel properties, except the Hartford Hilton, is under an Asset Management Agreement with 44 New England to provide asset management services. Fees for these services are paid monthly to 44 New England and recognized as income in the amount of 1% of operating revenues, except for the Hartford Marriott which is 0.25% of operating revenues.
The Company and our joint venture partner in Mystic Partners, LLC jointly and severally guarantee the performance of the terms of a loan to Adriaen’s Landing Hotel, LLC, owner of the Hartford Marriott, in the amount of $50,000, and 315 Trumbull Street Associates, LLC, owner of the Hartford Hilton, in the amount of $27,000, if at any time during the term of the note and during such time as the net worth of Mystic Partners falls below the amount of the guarantee. We have determined that the probability of incurring loss under this guarantee is remote and the value attributed to the guarantee is de minimis.
HERSHA HOSPITALITY TRUST AND SUBSIDIARIES
NOTES TO THE CONSOLIDATED FINANCIAL STATEMENTS
FOR THE YEARS ENDED DECEMBER 31, 2010, 2009, AND 2008
[IN THOUSANDS, EXCEPT SHARE/UNIT AND PER SHARE AMOUNTS]
NOTE 3 — INVESTMENT IN UNCONSOLIDATED JOINT VENTURES (continued)
The following tables set forth the total assets, liabilities, equity and components of net income, including the Company’s share, related to the unconsolidated joint ventures discussed above as of December 31, 2010 and December 31, 2009 and for the years ended December 31, 2010, 2009, and 2008.
|
Balance Sheets
|
||||||||
|
December 31,
|
December 31,
|
|||||||
|
2010
|
2009
|
|||||||
|
Assets
|
||||||||
|
Investment in hotel properties, net
|
$ | 144,675 | $ | 196,842 | ||||
|
Other Assets
|
27,970 | 28,473 | ||||||
|
Total Assets
|
$ | 172,645 | $ | 225,315 | ||||
|
Liabilities and Equity
|
||||||||
|
Mortgages and notes payable
|
$ | 156,976 | $ | 218,116 | ||||
|
Other liabilities
|
37,797 | 18,219 | ||||||
|
Equity:
|
||||||||
|
Hersha Hospitality Trust
|
38,394 | 44,178 | ||||||
|
Joint Venture Partner(s)
|
(60,522 | ) | (55,198 | ) | ||||
|
Total Equity
|
(22,128 | ) | (11,020 | ) | ||||
|
Total Liabilities and Equity
|
$ | 172,645 | $ | 225,315 | ||||
|
Statements of Operations
|
||||||||||||
|
Twelve Months Ended December 31,
|
||||||||||||
|
2010
|
2009
|
2008
|
||||||||||
|
Room Revenue
|
$ | 74,817 | $ | 81,718 | $ | 99,530 | ||||||
|
Other Revenue
|
21,298 | 22,427 | 28,344 | |||||||||
|
Operating Expenses
|
(63,113 | ) | (68,389 | ) | (82,327 | ) | ||||||
|
Interest Expense
|
(11,817 | ) | (16,326 | ) | (13,442 | ) | ||||||
|
Loss on Impairment of Building and Equipment
|
- | (7 | ) | (9,171 | ) | |||||||
|
Lease Expense
|
(5,363 | ) | (5,647 | ) | (5,538 | ) | ||||||
|
Property Taxes and Insurance
|
(6,827 | ) | (6,596 | ) | (6,459 | ) | ||||||
|
Federal and State Income Taxes
|
- | - | 121 | |||||||||
|
General and Administrative
|
(7,025 | ) | (7,332 | ) | (7,835 | ) | ||||||
|
Loss Allocated to Noncontrolling Interests
|
478 | 705 | - | |||||||||
|
Depreciation and Amortization
|
(10,345 | ) | (14,423 | ) | (16,171 | ) | ||||||
|
Net loss
|
$ | (7,897 | ) | $ | (13,870 | ) | $ | (12,948 | ) | |||
HERSHA HOSPITALITY TRUST AND SUBSIDIARIES
NOTES TO THE CONSOLIDATED FINANCIAL STATEMENTS
FOR THE YEARS ENDED DECEMBER 31, 2010, 2009, AND 2008
[IN THOUSANDS, EXCEPT SHARE/UNIT AND PER SHARE AMOUNTS]
NOTE 3 — INVESTMENT IN UNCONSOLIDATED JOINT VENTURES (continued)
The following table is a reconciliation of the Company’s share in the unconsolidated joint ventures’ equity to the Company’s investment in the unconsolidated joint ventures as presented on the Company’s balance sheets as of December 31, 2010 and 2009.
|
December 31,
|
December 31,
|
|||||||
|
2010
|
2009
|
|||||||
|
Company's share of equity recorded on the joint ventures' financial statements
|
$ | 38,394 | $ | 44,178 | ||||
|
Adjustment to reconcile the Company's share of equity recorded on the joint ventures' financial statements to our investment in unconsoldiated joint ventures(1)
|
(2,833 | ) | (4,996 | ) | ||||
|
Investment in Unconsolidated Joint Ventures
|
$ | 35,561 | $ | 39,182 | ||||
(1) Adjustment to reconcile the Company's share of equity recorded on the joint ventures' financial statements to our investment in unconsolidated joint ventures consists of the following:
- cumulative impairment of our investment in joint ventures not reflected on the joint ventures' financial statements,
- our basis in the investment in joint ventures not recorded on the joint ventures' financial statements, and
- accumulated amortization of our equity in joint ventures that reflects our portion of the excess of the fair value of joint ventures' assets on the date of our investment over the carrying value of the assets recorded on the joint ventures financial statements. This excess investment is amortized over the life of the properties, and the amortization is included in Income (Loss) from Unconsolidated Joint Venture Investments on our consolidated statement of operations.
HERSHA HOSPITALITY TRUST AND SUBSIDIARIES
NOTES TO THE CONSOLIDATED FINANCIAL STATEMENTS
FOR THE YEARS ENDED DECEMBER 31, 2010, 2009, AND 2008
[IN THOUSANDS, EXCEPT SHARE/UNIT AND PER SHARE AMOUNTS]
NOTE 4 - DEVELOPMENT LOANS RECEIVABLE
Development Loans
Historically, we provided first mortgage and mezzanine loans to hotel developers, including entities in which our executive officers and affiliated trustees own an interest that enabled such entities to construct hotels and conduct related improvements on specific hotel projects at interest rates ranging from 10% to 20%. These loans were initially originated as part of our acquisition strategy. During the year ended December 31, 2010, no such loans were originated by us. Interest income from development loans was $4,686, $7,411 and $7,890 for the years ended December 31, 2010, 2009, and 2008, respectively. Accrued interest on our development loans receivable was $3,013 as of December 31, 2010 and $2,451 as of December 31, 2009. Accrued interest on our development loans receivable as of December 31, 2010 does not include cumulative interest income of $5,653 which has been accrued and paid in kind by adding it to the principal balance of certain loans as indicated in the table below.
As of December 31, 2010 and 2009, our development loans receivable consisted of the following:
|
Hotel Property
|
Borrower
|
Principal Outstanding December 31, 2010
|
Principal Outstanding December 31, 2009
|
Interest Rate
|
Maturity Date (1)
|
|||||||||||
|
Operational Hotels
|
||||||||||||||||
|
Holiday Inn - New York, NY
|
Maiden Hotel, LLC
|
- | $ | 7,000 | 20 | % | ||||||||||
|
Renaissance by Marriott - Woodbridge, NJ
|
Hersha Woodbridge Associates, LLC
|
5,000 | 5,000 | 11 | % | April 1, 2011 | * | |||||||||
|
Element Hotel - Ewing, NJ
|
American Properties @ Scotch Road, LLC
|
2,000 | 2,000 | 11 | % | August 6, 2011 | * | |||||||||
|
Hilton Garden Inn - Dover, DE
|
44 Aasha Hospitality Associates, LLC
|
1,000 | 1,000 | 10 | % | November 1, 2011 | * | |||||||||
|
Construction Hotels
|
||||||||||||||||
|
Hyatt 48Lex - New York, NY
|
44 Lexington Holding, LLC
|
12,939 | (2) | 11,591 | 11 | % | December 31, 2011 | * | ||||||||
|
Hyatt Union Square - New York, NY
|
Risingsam Union Square, LLC
|
12,714 | (2) | 11,503 | 10 | % |
December 31, 2011
|
|||||||||
|
Hampton Inn - New York, NY
|
SC Waterview, LLC
|
8,000 | 8,000 | 10 | % |
December 31, 2011
|
||||||||||
|
Total Development Loans Receivable
|
|
$ | 41,653 | $ | 46,094 | |||||||||||
* Indicates borrower is a related party
|
(1)
|
Represents current maturity date in effect. Agreements for our development loans receivable typically allow for two one-year extensions which can be exercised by the borrower if the loan is not in default. As these loans typically finance hotel development projects, it is common for the borrower to exercise their options to extend the loans, in whole or in part, until the project has been completed and the project provides cash flow to the developer or is refinanced by the developer.
|
|
(2)
|
We amended the following development loans to allow the borrower to elect, quarterly, to pay accrued interest in-kind by adding the accrued interest to the principal balance of the loan as of December 31, 2010 and 2009:
|
|
Interest Income
Year Ended December 31,
|
||||||||||||
|
Borrower
|
2010
|
2009
|
Cumulative Interest Income Paid In Kind
|
|||||||||
|
Risingsam Union Square, LLC
|
$ | 1,211 | $ | 1,069 | $ | 2,714 | ||||||
|
44 Lexington Holding, LLC
|
1,348 | 1,178 | 2,939 | |||||||||
|
Total
|
$ | 2,559 | $ | 2,247 | $ | 5,653 | ||||||
HERSHA HOSPITALITY TRUST AND SUBSIDIARIES
NOTES TO THE CONSOLIDATED FINANCIAL STATEMENTS
FOR THE YEARS ENDED DECEMBER 31, 2010, 2009, AND 2008
[IN THOUSANDS, EXCEPT SHARE/UNIT AND PER SHARE AMOUNTS]
NOTE 4 - DEVELOPMENT LOANS RECEIVABLE (continued)
Advances and repayments on our development loans receivable consisted of the following for the years ended December 31, 2010, 2009, and 2008:
|
2010
|
2009
|
2008
|
||||||||||
|
Balance at January 1,
|
$ | 46,094 | $ | 81,500 | $ | 58,183 | ||||||
|
New advances
|
- | 2,000 | 64,200 | |||||||||
|
Interest added to principal
|
2,559 | 4,502 | - | |||||||||
|
Repayments
|
- | (500 | ) | (22,416 | ) | |||||||
|
Principal exchanged for interest in hotel properties
|
(7,000 | ) | (20,000 | ) | - | |||||||
|
Amortization of discount
|
- | - | 281 | |||||||||
|
Impairments, net of discount
|
- | (21,408 | ) | (18,748 | ) | |||||||
|
Balance at December 31,
|
$ | 41,653 | $ | 46,094 | $ | 81,500 | ||||||
Impairment of Development Loans
We monitor our portfolio of development loans on an on-going basis to determine collectability of the loan principal and accrued interest. We determined that our development loans to Brisam East 52, LLC and Brisam Greenwich, LLC, which were secured by the equity interest in each entity, were permanently impaired. We ceased accruing interest on the loans effective July 1, 2009. As of December 31, 2009, we determined that the fair value of each loan receivable is $0 and have incurred an impairment charge for the remaining principal on these loans in the aggregate amount of $21,408, which includes $1,408 of interest income that had been added to the principal balance of the loan.
In 2008, we determined that the developer of the Hilton Garden Inn/Homewood Suites – Brooklyn, NY had failed to make payments to the senior lender on the property’s first mortgage. After discussions with the developer and the senior lender, we determined that the fair value of the loan receivable and discount was $0 as of December 31, 2008. As a result, we incurred an impairment charge for the remaining principal of $18,748, which is net of unamortized discount in the amount of $1,252. A receivable for uncollected interest income of $569, which is net of unrecognized deferred loan fees of $143, was also recorded as an impairment charge.
HERSHA HOSPITALITY TRUST AND SUBSIDIARIES
NOTES TO THE CONSOLIDATED FINANCIAL STATEMENTS
FOR THE YEARS ENDED DECEMBER 31, 2010, 2009, AND 2008
[IN THOUSANDS, EXCEPT SHARE/UNIT AND PER SHARE AMOUNTS]
NOTE 5 — OTHER ASSETS
Other Assets consisted of the following at December 31, 2010 and 2009:
|
December 31, 2010
|
December 31, 2009
|
|||||||
|
Transaction Costs
|
$ | 340 | $ | 292 | ||||
|
Investment in Statutory Trusts
|
1,548 | 1,548 | ||||||
|
Notes Receivable
|
- | 1,412 | ||||||
|
Deposits on Hotel Acquisitions
|
5,500 | 20 | ||||||
|
Prepaid Expenses
|
6,986 | 4,468 | ||||||
|
Interest Receivable from Development Loans to Non-Related Parties
|
1,767 | 1,573 | ||||||
|
Deposit on Property Improvement Plans
|
167 | 167 | ||||||
|
Hotel Purchase Option
|
933 | 933 | ||||||
|
Other
|
1,173 | 2,015 | ||||||
| $ | 18,414 | $ | 12,428 | |||||
Transaction Costs - Transaction costs include legal fees and other third party transaction costs incurred relative to entering into debt facilities and issuances of equity securities which are recorded in other assets prior to the closing of the respective transactions.
Investment in Statutory Trusts - We have an investment in the common stock of Hersha Statutory Trust I and Hersha Statutory Trust II. Our investment is accounted for under the equity method.
Notes Receivable – Notes receivable as of December 31, 2009 included a loan, and related accrued interest, made to one of our unconsolidated joint venture partners. The $1,267 note accrued interest at 11% and matured on December 31, 2009. The principal and accrued interest receivable under this note was settled in connection with our acquisition of the remaining interest in PRA Glastonbury, LLC as noted in “Note 3 – Investment in Unconsolidated Joint Ventures.”
Deposits on Hotel Acquisitions - Deposits paid in connection with the acquisition of hotels, including accrued interest, are recorded in other assets. As of December 31, 2010 and 2009, we had $5,500 and $20, respectively, in non-interest bearing deposits related to the acquisition of hotel properties.
Prepaid Expenses - Prepaid expenses include amounts paid for property tax, insurance and other expenditures that will be expensed in the next twelve months.
Interest Receivable from Development Loans to Non-Related Parties– Interest receivable from development loans to non-related parties represents interest income receivable from loans extended to non-related parties that are used to enable such entities to construct hotels and conduct related improvements on specific hotel projects. This excludes interest receivable from development loans extended to related parties in the amounts of $1,246 and $878 as of December 31, 2010 and 2009, respectively, which is included in due from related parties on the consolidated balance sheets.
Deposits on Property Improvement Plans – Deposits on property improvement plans consists of amounts advanced to HHMLP that are to be used to fund capital expenditures as part of our property improvement programs at certain properties.
Hotel Purchase Option – We have an option to acquire a 50% interest in the entity that owns the Holiday Inn Express – Manhattan. This option is exercisable after February 1, 2012 or upon termination of Metro 29th Street’s lease of the hotel and expires at the end of the lease term.
HERSHA HOSPITALITY TRUST AND SUBSIDIARIES
NOTES TO THE CONSOLIDATED FINANCIAL STATEMENTS
FOR THE YEARS ENDED DECEMBER 31, 2010, 2009, AND 2008
[IN THOUSANDS, EXCEPT SHARE/UNIT AND PER SHARE AMOUNTS]
NOTE 6 - DEBT
Mortgages and Notes Payable
We had total mortgages payable at December 31, 2010 and 2009, of $596,949 and $614,401, respectively. These balances consisted of mortgages with fixed and variable interest rates, which ranged from 2.26% to 8.25% as of December 31, 2010. Aggregate interest expense incurred under the mortgage loans payable totaled $37,600, $35,878, and $34,855 during 2010, 2009, and 2008, respectively. The mortgages are secured by first deeds of trust on various hotel properties with a combined net book value of $1,179,052 and $892,825 as of December 31, 2010, and 2009, respectively. Our mortgage indebtedness contains various financial and non-financial covenants customarily found in secured, non-recourse financing arrangements. Our mortgage loans payable typically require that specified debt service coverage ratios be maintained with respect to the financed properties before we can exercise certain rights under the loan agreements relating to such properties. If the specified criteria are not satisfied, the lender may be able to escrow cash flow generated by the property securing the applicable mortgage loan. We have determined that certain debt service coverage ratio covenants contained in the loan agreements securing fifteen of our hotel properties were not met as of December 31, 2010 due to recent economic conditions. These covenants do not constitute an event of default for these loans. As of December 31, 2010 we were in compliance with all events of default covenants under the applicable loan agreements. As of December 31, 2010, the maturities for the outstanding mortgage loans ranged from May 2011 to September 2023.
Subordinated Notes Payable
We have two junior subordinated notes payable in the aggregate amount of $51,548 to the Hersha Statutory Trusts pursuant to indenture agreements which will mature on July 30, 2035, but may be redeemed at our option, in whole or in part, beginning on July 30, 2010 in accordance with the provisions of the indenture agreement. Effective July 30, 2010, the $25,774 notes issued to Hersha Statutory Trust I and Hersha Statutory Trust II bear interest at a variable rate of LIBOR plus 3% per annum. This rate resets two business days prior to each quarterly payment. For the period October 30, 2010, to January 29, 2011, we incur interest expense at a variable rate of 3.29%. Prior to this, the $25,774 note issued to Hersha Statutory Trust I incurred interest at a fixed rate of 7.34% per annum through July 30, 2010, and the $25,774 note issued to Hersha Statutory Trust II incurred interest at a fixed rate of 7.173% per annum through July 30, 2010. On April 19, 2010, we purchased an interest rate cap that effectively limits interest payments when LIBOR exceeds 2.00% on our two subordinated notes payable. See “Note 8 - Fair Value Measurements and Derivative Instruments” for more information. Interest expense in the amount of $2,934, $3,766, $3,729 was recorded for the years ended 2010, 2009, and 2008, respectively.
Other Notes Payable
HHLP has entered into a management agreement with an unaffiliated hotel manager that has extended a $498 interest-free loan to HHLP for working capital contributions that are due at either the termination or expiration of the management agreement. A discount was recorded on the note payable which reduced the principal balances recorded in the mortgages and notes payable. The discount is being amortized over the remaining life of the loan and is recorded as interest expense. On December 31, 2010, we terminated the management agreement with Lodgeworks, L.P. (“Lodgeworks”), for the management services they provided for the two Hyatt Summerfield Suites located in White Plains, NY, and Gaithersburg, MD. In connection with this termination, we repaid $149 as a partial repayment of the interest free loan due to Lodgeworks as a result of our acquisition of the Summerfield Suites portfolio. The remaining balance of the note payable, net of unamortized discount, was $223 as of December 31, 2010 and $294 as of December 31, 2009.
Aggregate annual principal payments for the Company’s mortgages and notes payable for the five years following December 31, 2010 and thereafter are as follows:
|
Year Ending December 31,
|
Amount
|
|||
|
2011
|
47,799 | |||
|
2012
|
33,694 | |||
|
2013
|
32,444 | |||
|
2014
|
42,550 | |||
|
2015
|
88,640 | |||
|
Thereafter
|
404,576 | |||
|
Net Unamortized Discount
|
(983 | ) | ||
| $ | 648,720 | |||
HERSHA HOSPITALITY TRUST AND SUBSIDIARIES
NOTES TO THE CONSOLIDATED FINANCIAL STATEMENTS
FOR THE YEARS ENDED DECEMBER 31, 2010, 2009, AND 2008
[IN THOUSANDS, EXCEPT SHARE/UNIT AND PER SHARE AMOUNTS]
NOTE 6 – DEBT (continued)
Revolving Line of Credit
On October 14, 2008, we entered into a Revolving Credit Loan and Security Agreement with T.D. Bank, NA and various other lenders, which provided for a revolving line of credit in the principal amount of up to $175,000, including a sub-limit of $25,000 for irrevocable stand-by letters of credit. The bank group had committed $135,000, and the credit agreement was structured to allow for an increase of an additional $40,000 under the line of credit, provided that additional collateral was supplied and additional lenders joined the bank group.
On December 11, 2009, we amended the credit agreement to modify certain financial covenants, resulting in changes to the annual interest rate incurred on prime rate and LIBOR rate loans borrowed under the line of credit. Hersha paid the lenders a fee of $338 in connection with the amendment the credit agreement. As amended, the credit agreement included certain financial covenants and required that we maintain (1) a minimum tangible net worth of $300,000; (2) maximum accounts and other receivables from affiliates of $125,000; (3) annual distributions not to exceed 95% of adjusted funds from operations; (4) maximum variable rate indebtedness to total debt of 30%; and (5) certain financial ratios.
On November 5, 2010, we entered into a Revolving Credit Loan and Security Agreement with T.D. Bank, NA and various other lenders. The credit agreement provides for a revolving line of credit in the principal amount of up to $250,000, including a sub-limit of $25,000 for irrevocable stand-by letters of credit and a $10,000 sub-limit for the swing line loans. On November 5, 2010, our previous line of credit was terminated and replaced by the new line of credit and as a result all amounts outstanding under our previous credit facility were repaid with borrowings from our new credit facility. Additional borrowings under the line of credit provided by T.D. Bank, NA may be used for working capital and general corporate purposes and for the future purchase of additional hotels. The line of credit expires on November 1, 2013, and, provided no event of default has occurred and remains uncured, we may request that T.D. Bank, NA and the other lenders renew the line of credit for an additional one-year period.
The line of credit is collateralized by a first lien-security interest in all existing and future unencumbered assets of HHLP, a collateral assignment of all hotel management contracts of the management companies in the event of default, and title-insured, first-lien mortgages on the following hotel properties:
|
- Hampton Inn, Danville, PA
|
- Residence Inn, Langhorne, PA
|
|
|
- Hampton Inn, Philadelphia, PA
|
- Residence Inn, Norwood, MA
|
|
|
- Hampton Inn, Carlisle, PA
|
- Sheraton Hotel, JFK Airport, New York, NY
|
|
|
- Hampton Inn, Selinsgrove, PA
|
- Holiday Inn Express, Times Square, NY
|
|
|
- Holiday Inn, Norwich, CT
|
- Hampton Inn, Washington, DC
|
|
|
- Towneplace Suites, Harrisburg, PA
|
- Hyatt Place, King of Prussia, PA
|
|
|
- Holiday Inn Express and Suites, Harrisburg, PA
|
At our option, the interest rate on loans provided under the line of credit will be either (i) the Wall Street Journal variable prime rate plus an applicable margin ranging between 150 and 175 basis points per annum or (ii) LIBOR plus an applicable margin ranging between 350 and 375 basis points per year, subject to a floor of 4.25%.
The credit agreement providing for the line of credit includes certain financial covenants and requires that we maintain: (1) a minimum tangible net worth of $500,000, which is subject to increases under certain circumstances; (2) maximum accounts and other receivables from affiliates of $125,000; (3) annual distributions not to exceed 95% of adjusted funds from operations; (4) maximum variable rate indebtedness to total debt of 30%; and (5) certain financial ratios, including the following:
|
-
|
a fixed charge coverage ratio of not less than 1.25 to 1.00 which will increase to 1.35 to 1.00 as of September 30, 2011, and 1.45 to 1.00 as of September 30, 2012; and
|
|
-
|
a total funded liabilities to gross asset value ratio of not more than 0.65 to 1.00
|
The Company is in compliance with each of the covenants listed above as of December 31, 2010.
The outstanding principal balance under the line of credit was $46,000 at December 31, 2010 and $79,200 at December 31, 2009. The Company recorded interest expense of $2,737, $3,235, and $3,094 related to the line of credit borrowings, for the years ended December 31, 2010, 2009, and 2008, respectively. The weighted average interest rate on our Line of Credit during the years ended December 31, 2010, 2009, and 2008 was 4.29%, 3.25%, and 5.07%, respectively.
HERSHA HOSPITALITY TRUST AND SUBSIDIARIES
NOTES TO THE CONSOLIDATED FINANCIAL STATEMENTS
FOR THE YEARS ENDED DECEMBER 31, 2010, 2009, AND 2008
[IN THOUSANDS, EXCEPT SHARE/UNIT AND PER SHARE AMOUNTS]
NOTE 6 – DEBT (continued)
As of December 31, 2010 we had $6,927 in irrevocable letters of credit issued and our remaining borrowing capacity under the Line of Credit was $197,073.
Fair Value of Debt
The Company estimates the fair value of its fixed rate debt and the credit spreads over variable market rates on its variable rate debt by discounting the future cash flows of each instrument at estimated market rates or credit spreads consistent with the maturity of the debt obligation with similar credit policies. Credit spreads take into consideration general market conditions and maturity. As of December 31, 2010, the carrying value and estimated fair value of the Company’s debt was $694,720 and $658,487, respectively. As of December 31, 2009, the carrying value and estimated fair value of the Company’s debt was $745,443 and $688,662 respectively.
Capitalized Interest
We utilize mortgage debt and our revolving line of credit to finance on-going capital improvement projects at our properties. Interest incurred on mortgages and the revolving line of credit that relates to our capital improvement projects is capitalized through the date when the assets are placed in service. For the years ended December 31, 2010, 2009, and 2008, we capitalized $46, $10 and $544, respectively, of interest expense related to these projects.
Deferred Costs
Costs associated with entering into mortgages and notes payable and our revolving line of credit are deferred and amortized over the life of the debt instruments. Amortization of deferred costs is recorded in interest expense. As of December 31, 2010, deferred costs were $10,204, net of accumulated amortization of $5,852. As of December 31, 2009, deferred costs were $8,696, net of accumulated amortization of $4,262. Amortization of deferred costs for the years ended December 31, 2010, 2009, and 2008 was $2,381, $2,059 and $2,030, respectively.
Debt Extinguishment and Principal Paydowns
During 2008, we repaid one mortgage and settled on the defeasance of loans associated with four of our properties. In addition, we replaced our previous line of credit with Commerce Bank and various other lenders with a new credit facility with T.D. Bank, NA and various other lenders. As a result of these extinguishments, we expensed $1,552 in unamortized deferred costs and defeasance premiums, which are included in the Loss on Debt Extinguishment caption on the consolidated statements of operations for the year ended December 31, 2008.
During 2010, we repaid seven mortgages and two notes payable. In addition, we replaced our previous line of credit with a new credit facility with T.D. Bank, NA and various other lenders. As a result of these extinguishments, we expensed $932 in unamortized deferred costs and fees, which are included in the Loss on Debt Extinguishment caption on the consolidated statements of operations for the year ended December 31, 2010.
HERSHA HOSPITALITY TRUST AND SUBSIDIARIES
NOTES TO THE CONSOLIDATED FINANCIAL STATEMENTS
FOR THE YEARS ENDED DECEMBER 31, 2010, 2009, AND 2008
[IN THOUSANDS, EXCEPT SHARE/UNIT AND PER SHARE AMOUNTS]
NOTE 7 - COMMITMENTS AND CONTINGENCIES AND RELATED PARTY TRANSACTIONS
Management Agreements
Our wholly-owned TRS, 44 New England, engages eligible independent contractors in accordance with the requirements for qualification as a REIT under the Federal income tax laws, including HHMLP, as the property managers for hotels it leases from us pursuant to management agreements. HHMLP is owned, in part, by certain executives and affiliated trustees of the Company. Our management agreements with HHMLP provide for five-year terms and are subject to early termination upon the occurrence of defaults and certain other events described therein. As required under the REIT qualification rules, HHMLP must qualify as an “eligible independent contractor” during the term of the management agreements. Under the management agreements, HHMLP generally pays the operating expenses of our hotels. All operating expenses or other expenses incurred by HHMLP in performing its authorized duties are reimbursed or borne by our TRS to the extent the operating expenses or other expenses are incurred within the limits of the applicable approved hotel operating budget. HHMLP is not obligated to advance any of its own funds for operating expenses of a hotel or to incur any liability in connection with operating a hotel. Management agreements with other unaffiliated hotel management companies have similar terms.
For its services, HHMLP receives a base management fee, and if a hotel exceeds certain thresholds, an incentive management fee. The base management fee for a hotel is due monthly and is equal to 3% of gross revenues associated with each hotel managed for the related month. The incentive management fee, if any, for a hotel is due annually in arrears on the ninetieth day following the end of each fiscal year and is based upon the financial performance of the hotels. For the years ended December 31, 2010, 2009 and 2008, base management fees incurred totaled $7,099, $5,485 and $6,136, respectively and are recorded as Hotel Operating Expenses. For the years ended December 31, 2010, 2009 and 2008, incentive management fees of $0, $0, and $363, respectively, were recorded as Hotel Operating Expenses.
On December 3, 2010, we terminated the management agreement held with Marriott International Inc. for the management services they provided for the Courtyard by Marriott, Alexandria, VA. In connection with this termination, we paid $250 in termination fees. Effective December 4, 2010, this hotel is now managed by HHMLP. Also, on December 31, 2010, we terminated the management agreement held with Lodgeworks, L.P. for the management services they provided for the Hyatt Summerfield Suites, White Plains, NY and Hyatt Summerfield Suites, Gaithersburg, MD. In connection with this termination, we repaid $149 as a partial repayment of the interest free loan due to Lodgeworks, L.P. as a result of our acquisition of the Hyatt Summerfield Suites portfolio. See “Note 6 – Debt” for more information.
Franchise Agreements
Our branded hotel properties are operated under franchise agreements assumed by the hotel property lessee. The franchise agreements have 10 to 20 year terms but may be terminated by either the franchisee or franchisor on certain anniversary dates specified in the agreements. The franchise agreements require annual payments for franchise royalties, reservation, and advertising services, and such payments are based upon percentages of gross room revenue. These payments are paid by the hotels and charged to expense as incurred. Franchise fee expense for the years ended December 31, 2010, 2009, and 2008 was $18,560, $14,019 and $17,041 respectively. The initial fees incurred to enter into the franchise agreements are amortized over the life of the franchise agreements.
Accounting and Information Technology Fees
Each of the wholly owned hotels and consolidated joint venture hotel properties managed by HHMLP incurs a monthly accounting and information technology fee. Monthly fees for accounting services are $2 per property and monthly information technology fees are $0.5 per property. In addition, each of the wholly owned hotels not managed by HHMLP, but for which the accounting is provided by HHMLP incurs a monthly accounting fee of $3. For the years ended December 31, 2010, 2009 and 2008, the Company incurred accounting fees of $1,537, $1,459 and $1,426, respectively. For the years ended December 31, 2010, 2009 and 2008, the Company incurred information technology fees of $347, $325 and $316, respectively. Accounting fees and information technology fees are included in General and Administrative expenses.
HERSHA HOSPITALITY TRUST AND SUBSIDIARIES
NOTES TO THE CONSOLIDATED FINANCIAL STATEMENTS
FOR THE YEARS ENDED DECEMBER 31, 2010, 2009, AND 2008
[IN THOUSANDS, EXCEPT SHARE/UNIT AND PER SHARE AMOUNTS]
NOTE 7 - COMMITMENTS AND CONTINGENCIES AND RELATED PARTY TRANSACTIONS (continued)
Capital Expenditure Fees
HHMLP charges a 5% fee on all capital expenditures and pending renovation projects at the properties as compensation for procurement services related to capital expenditures and for project management of renovation projects. For the years ended December 31, 2010, 2009 and 2008, we incurred fees of $257, $158, and $271, respectively, which were capitalized with the cost of fixed asset additions.
Acquisitions from Affiliates
We have entered into an option agreement with each of our officers and affiliated trustees such that we obtain a right of first refusal to purchase any hotel owned or developed in the future by these individuals or entities controlled by them at fair market value. This right of first refusal would apply to each party until one year after such party ceases to be an officer or trustee of our Company. Our Acquisition Committee of the Board of Trustees is comprised solely of independent trustees, and the purchase prices and all material terms of the purchase of hotels from related parties are approved by the Acquisition Committee.
Hotel Supplies
For the years ended December 31, 2010, 2009, and 2008, we incurred charges for hotel supplies of $156, $73, and $41, respectively. For the years ended December 31, 2010, 2009 and 2008, we incurred charges for capital expenditure purchases of $6,755, $824, and $1,547 respectively. These purchases were made from Hersha Purchasing and Design, a hotel supply company owned, in part, by certain executives and affiliated trustees of the Company. Hotel supplies are expenses included in hotel operating expenses on our consolidated statements of operations, and capital expenditure purchases are included in investment in hotel properties on our consolidated balance sheets. Approximately $22 and $32 is included in accounts payable at December 31, 2010 and 2009, respectively.
Due From Related Parties
The due from related parties balance as of December 31, 2010 and 2009 was approximately $5,069 and $2,394 respectively. The balances primarily consisted of accrued interest due on our development loans, and the remaining due from related party balances are receivables owed from our unconsolidated joint ventures.
Due to Related Parties
The due to related parties balance as of December 31, 2010 and 2009 was approximately $939 and $769, respectively. The balances consisted of amounts payable to HHMLP for administrative, management, and benefit related fees.
Hotel Ground Rent
For the years ended December 31, 2010, 2009, and 2008, we incurred $1,374, $1,166, and $1,040, respectively, of rent expense related to these ground leases.
HERSHA HOSPITALITY TRUST AND SUBSIDIARIES
NOTES TO THE CONSOLIDATED FINANCIAL STATEMENTS
FOR THE YEARS ENDED DECEMBER 31, 2010, 2009, AND 2008
[IN THOUSANDS, EXCEPT SHARE/UNIT AND PER SHARE AMOUNTS]
NOTE 7 - COMMITMENTS AND CONTINGENCIES AND RELATED PARTY TRANSACTIONS (continued)
Future minimum lease payments (without reflecting future applicable Consumer Price Index increases) under these agreements are as follows:
|
Year Ending December 31,
|
Amount
|
|||
|
2011
|
$ | 1,226 | ||
|
2012
|
1,266 | |||
|
2013
|
1,271 | |||
|
2014
|
1,276 | |||
|
2015
|
1,276 | |||
|
Thereafter
|
97,296 | |||
| $ | 103,611 | |||
Litigation
We are not presently subject to any material litigation nor, to our knowledge, is any other litigation threatened against us, other than routine actions for negligence or other claims and administrative proceedings arising in the ordinary course of business, some of which are expected to be covered by liability insurance and all of which collectively are not expected to have a material adverse effect on our liquidity, results of operations or business or financial condition.
HERSHA HOSPITALITY TRUST AND SUBSIDIARIES
NOTES TO THE CONSOLIDATED FINANCIAL STATEMENTS
FOR THE YEARS ENDED DECEMBER 31, 2010, 2009, AND 2008
[IN THOUSANDS, EXCEPT SHARE/UNIT AND PER SHARE AMOUNTS]
NOTE 8 — FAIR VALUE MEASUREMENTS AND DERIVATIVE INSTRUMENTS
Fair Value Measurements
Our determination of fair value measurements are based on the assumptions that market participants would use in pricing the asset or liability. As a basis for considering market participant assumptions in fair value measurements, we utilize a fair value hierarchy that distinguishes between market participant assumptions based on market data obtained from sources independent of the reporting entity (observable inputs that are classified within Levels 1 and 2 of the hierarchy) and the reporting entity’s own assumptions about market participant assumptions (unobservable inputs classified within Level 3 of the hierarchy).
Level 1 inputs utilize quoted prices (unadjusted) in active markets for identical assets or liabilities that the Company has the ability to access. Level 2 inputs are inputs other than quoted prices included in Level 1 that are observable for the asset or liability, either directly or indirectly. Level 2 inputs may include quoted prices for similar assets and liabilities in active markets, as well as inputs that are observable for the asset or liability (other than quoted prices), such as interest rates, foreign exchange rates and yield curves that are observable at commonly quoted intervals. Level 3 inputs are unobservable inputs for the asset or liability, which are typically based on an entity’s own assumptions, as there is little, if any, related market activity. In instances where the determination of the fair value measurement is based on inputs from different levels of the fair value hierarchy, the level in the fair value hierarchy within which the entire fair value measurement falls is based on the lowest level input that is significant to the fair value measurement in its entirety. The Company’s assessment of the significance of a particular input to the fair value measurement in its entirety requires judgment, and considers factors specific to the asset or liability.
As of December 31, 2010, the Company’s derivative instruments represented the only financial instruments measured at fair value. Currently, the Company uses derivative instruments, such as interest rate swaps and caps, to manage its interest rate risk. The valuation of these instruments is determined using widely accepted valuation techniques, including discounted cash flow analysis on the expected cash flows of each derivative. This analysis reflects the contractual terms of the derivatives, including the period to maturity, and uses observable market-based inputs.
We incorporate credit valuation adjustments to appropriately reflect both our own nonperformance risk and the respective counterparty’s nonperformance risk in the fair value measurements. In adjusting the fair value of its derivative contracts for the effect of nonperformance risk, we have considered the impact of netting and any applicable credit enhancements, such as collateral postings, thresholds, mutual puts and guarantees.
Although we have determined that the majority of the inputs used to value our derivatives fall within Level 2 of the fair value hierarchy, the credit valuation adjustments associated with our derivatives utilize Level 3 inputs, such as estimates of current credit spreads, to evaluate the likelihood of default by us and the counterparties. However, as of December 31, 2010 we have assessed the significance of the effect of the credit valuation adjustments on the overall valuation of our derivative positions and have determined that the credit valuation adjustments are not significant to the overall valuation of our derivatives. As a result, we have determined that our derivative valuations in their entirety are classified in Level 2 of the fair value hierarchy.
Derivative Instruments
We maintain an interest rate cap that effectively fixes interest payments when LIBOR exceeds 5.75% on our debt financing related to Hotel 373, New York, NY. The notional amount of the interest rate cap is $22,000 and equals the principal of the variable interest rate debt being hedged. This interest rate cap matured on May 9, 2010 and was replaced by a new interest rate cap with identical terms that matures on May 9, 2011.
On April 19, 2010, we purchased an interest rate cap for $379 that effectively limits variable rate interest payments on the subordinated notes payable to Hersha Statutory Trust I and Hersha Statutory Trust II when LIBOR exceeds 2.00%. The notional amount of the interest rate cap is $51,548 and equals the principal of the variable interest rate debt being hedged. The effective date of the interest rate cap is July 30, 2010, which correlates with the end of the fixed interest rate period on the notes payable.
We maintain an interest rate swap agreement that effectively fixes the interest rate on a variable rate mortgage on the nu Hotel, Brooklyn, NY, which bears interest at one month U.S. dollar LIBOR plus 2.0%. Under the terms of the interest rate swap, we pay fixed rate interest of 1.1925% on the $18,000 notional amount and we receive floating rate interest equal to the one month U.S. dollar LIBOR, effectively fixing our interest on the mortgage debt at a rate of 3.1925%. This interest rate swap agreement matured on January 10, 2011, and we did not replace it with another agreement.
HERSHA HOSPITALITY TRUST AND SUBSIDIARIES
NOTES TO THE CONSOLIDATED FINANCIAL STATEMENTS
FOR THE YEARS ENDED DECEMBER 31, 2010, 2009, AND 2008
[IN THOUSANDS, EXCEPT SHARE/UNIT AND PER SHARE AMOUNTS]
NOTE 8 — FAIR VALUE MEASUREMENTS AND DERIVATIVE INSTRUMENTS (continued)
We maintained an interest rate swap agreement that effectively fixes the interest rate on a variable rate mortgage, bearing interest at one month U.S. dollar LIBOR plus 3.0%, originated upon the refinance of the debt associated with the Hilton Garden Inn, Edison, NJ. Under the terms of this interest rate swap, we pay fixed rate interest of 1.37% and we receive floating rate interest equal to the one month U.S. dollar LIBOR, effectively fixing our interest at a rate of 4.37%. The notional amount amortized in tandem with the amortization of the underlying hedged debt. This interest rate swap agreement was terminated upon the repayment of the principal balance of the underlying hedged debt in October 2010. As a result of this termination, we repaid the fair value of the interest rate swap of $21.
We maintained an interest rate swap agreement that fixes the interest rate on a $40,000 portion of our floating revolving credit facility with Commerce Bank, which bears interest at one month U.S. dollar LIBOR plus 2.5%. Under the terms of this interest rate swap, we pay fixed rate interest of 2.6275% on the $40,000 notional amount and we receive floating rate interest equal to the one month U.S. dollar LIBOR, effectively fixing our interest on this portion of the line of credit at a rate of 5.1275%. This interest rate swap agreement matured on February 1, 2009, and we did not replace it with another agreement.
We maintained an interest rate swap that fixed our interest rate on a variable rate mortgage on the Sheraton Four Points, Revere, MA. Under the terms of this interest rate swap, we paid fixed rate interest of 4.73% of the notional amount and we received floating rate interest equal to the one month U.S. dollar LIBOR. Prior to January 1, 2008, the hedge relationship was deemed to be effective and the change in fair value related to the effective portion of the interest rate swap was recorded in Accumulated Other Comprehensive Income on the Balance Sheet. Subsequent to January 1, 2008, the hedge relationship was no longer deemed to be effective. This swap matured on July 23, 2009. The change in fair value of the interest rate swap for the twelve months ended December 31, 2009 resulted in a gain of $172 and was recorded in income (loss) from discontinued operations.
At December 31, 2010 and December 31, 2009, the fair value of the interest rate swaps and cap were:
|
Estimated Fair Value
|
||||||||||||||
|
Date of Transaction
|
Hedged Debt
|
Type
|
Maturity Date
|
December 31, 2010
|
December 31, 2009
|
|||||||||
|
May 9, 2010
|
Variable Rate Mortgage - Hotel 373, New York, NY
|
Cap
|
May 9, 2011
|
$ | - | $ | - | |||||||
|
December 31, 2008
|
Variable Rate Mortgage - Hilton Garden Inn, Edison, NJ
|
Swap
|
January 1, 2011
|
- | (53 | ) | ||||||||
|
January 9, 2009
|
Variable Rate Mortgage - Nu Hotel, Brooklyn, NY
|
Swap
|
January 10, 2011
|
(4 | ) | (103 | ) | |||||||
|
April 19, 2010
|
Subordinated Notes Payable
|
Cap
|
July 30, 2012
|
50 | - | |||||||||
| $ | 46 | $ | (156 | ) | ||||||||||
The fair value of the derivative instrument is included in Accounts Payable, Accrued Expenses and Other Liabilities at December 31, 2010 and December 31, 2009.
The change in fair value of derivative instruments designated as cash flow hedges was a gain of $178, a loss of $51, and a loss of $86 for the years ended December 31, 2010, 2009, and 2008, respectively. These unrealized gains and losses were reflected on our Balance Sheet in Accumulated Other Comprehensive Income. Hedge ineffectiveness of $0, $1, and $1 on cash flow hedges was recognized in interest expense for the years ended December 31, 2010, 2009, and 2008, respectively.
Amounts reported in accumulated other comprehensive income related to derivatives will be reclassified to interest expense as interest payments are made on the Company’s variable-rate debt. The change in net unrealized gains/losses on cash flow hedges reflects a reclassification of $252 of net unrealized gains/losses from accumulated other comprehensive income as an increase to interest expense during 2009. During 2010, the Company estimates that an additional $128 will be reclassified as an increase to interest expense.
HERSHA HOSPITALITY TRUST AND SUBSIDIARIES
NOTES TO THE CONSOLIDATED FINANCIAL STATEMENTS
FOR THE YEARS ENDED DECEMBER 31, 2010, 2009, AND 2008
[IN THOUSANDS, EXCEPT SHARE/UNIT AND PER SHARE AMOUNTS]
NOTE 9 - SHARE-BASED PAYMENTS
In May 2008, the Company established the Hersha Hospitality Trust 2008 Equity Incentive Plan (the “2008 Plan”) for the purpose of attracting and retaining executive officers, employees, trustees and other persons and entities that provide services to the Company. Prior to the 2008 Plan, the Company made awards pursuant to the 2004 Equity Incentive Plan (the “2004 Plan”). Upon approval of the 2008 Plan by the Company’s shareholders on May 22, 2008, the Company terminated the 2004 Plan. Termination of the 2004 Plan did not have any effect on equity awards and grants previously made under that plan.
Executives
2010 Long-Term Equity Incentive
On May 7, 2010, the Compensation Committee adopted an annual long-term equity incentive plan for the executive officers, pursuant to which the executive officers are eligible to earn equity awards in the form of stock awards or performance shares. The equity awards for 2010 will be made pursuant to the 2008 Plan or any other equity incentive plan approved by the Company’s shareholders. Half of the award will be made, subject to the sole discretion of the Committee, if the executive officer is employed by the Company on the date awards are determined, and the remainder of the award will be based on absolute and relative RevPar growth, with 25% of the award based on RevPAR growth in 2010 on an absolute basis and 25% of the award based on RevPAR growth in 2010 relative to a group of peer companies. The number of shares to be issued will be determined by dividing the dollar value of the award by the 20-day volume weighted average closing price of the Company’s common shares on the New York Stock Exchange as of December 31 for the applicable performance year. The Company accounts for these grants as performance awards for which the Company assesses the probability of achievement of the grant at the end of each period. As of December 31, 2010, the Company concluded that it was probable that the grants under this plan would be achieved, and, as such, the Company recognized stock based compensation expense of $1,314 for the year ended December 31, 2010, for the equity awards potentially issuable pursuant to the 2010 long-term equity incentive program.
Multi-Year Long-Term Equity Incentive
On May 7, 2010, the Compensation Committee also adopted a multi-year long-term equity incentive plan. This plan has a three-year performance period, which commenced on January 1, 2010 and will end on December 31, 2012. The awards to be granted are based upon the Company’s achievement of a certain level of (1) absolute total shareholder return (75% of the award), and (2) relative total shareholder return as compared to the Company’s peer group (25% of the award). The number of equity awards to be issued under this program is determined by dividing the dollar value of the award by the 20-day volume weighted average closing price of the Company’s common shares on the New York Stock Exchange as of December 31, 2009. If shares are issued under this program, half will vest immediately on December 31, 2012 while the other half will vest on December 31, 2013 if the executive remains employed by the Company. The Company accounts for these grants as market based awards where the Company estimates unearned compensation at the grant date fair value which is amortized into compensation cost over the vesting period. The fair value of these market based awards is estimated using a simulation or Monte Carlo method. For the purpose of the simulation, on the grant date we made the following assumptions:
|
|
·
|
volatility of our shares within a range of 53% to 71% over three year performance period which is calculated based on the volatility of our stock price over the last three years and an implied volatility;
|
|
|
·
|
volatility of our peer group’s shares within a range of 15% to 117% over three year performance period which is calculated based on the volatility of our peers’ stock prices over the last three years and an implied volatility; and
|
|
|
·
|
risk-free interest rates ranging from 0.13% to 1.34%, which reflects the yield on zero-coupon risk free instruments ranging from 3 months to 3 years maturity.
|
Stock based compensation expense of $2,084 was recorded for the year ended December 31, 2010, for the multi-year long-term equity incentive program. Unearned compensation related to the multi-year program as of December 31, 2010 was $9,575.
Performance Share Awards
On August 5, 2009, the Company’s Compensation Committee awarded an aggregate of 354,250 performance shares pursuant to the 2008 Plan to our executive officers. Performance shares are not considered to be outstanding at the time of grant, but are earned based on the Company’s common shares maintaining a closing price in excess of defined thresholds over a defined period of time and then settled in an equivalent number of common shares. As of December 31, 2010, the performance shares have been earned in full and a total of 354,250 commons shares have been issued upon settlement of the performance shares. On March 22, 2010, an aggregate of 81,250 common shares were issued upon settlement of an equivalent number of earned performance shares. On May 18, 2010, an aggregate of 78,000 common shares were issued upon settlement of an equivalent number of earned performance shares. On September 13, 2010, the Compensation Committee determined that the remaining performance shares had been earned and the Company issued an aggregate of 86,666 common shares upon settlement of an equivalent number of earned performance shares. The Company accounts for these grants as market based awards where the Company estimates the unearned compensation at grant date fair value which is amortized into compensation cost over the vesting of the performance share awards. Stock based compensation expense of $725 and $140 was incurred during the years ended December 31, 2010 and 2009, respectively. Unearned compensation related to the awards as of December 31, 2010 was $0.
HERSHA HOSPITALITY TRUST AND SUBSIDIARIES
NOTES TO THE CONSOLIDATED FINANCIAL STATEMENTS
FOR THE YEARS ENDED DECEMBER 31, 2010, 2009, AND 2008
[IN THOUSANDS, EXCEPT SHARE/UNIT AND PER SHARE AMOUNTS]
NOTE 9 - SHARE-BASED PAYMENTS (continued)
Restricted Share Awards
Stock based compensation expense related to the restricted share awards, consisting of restricted common shares issued to executives of the Company, of $2,263, $1,899, and $1,411 was incurred during the years ended December 31, 2010, 2009, and 2008, respectively. Unearned compensation related to the restricted share awards as of December 31, 2010 and 2009 was $2,960 and $4,334, respectively. The following table is a summary of all unvested share awards issued to executives under the 2004 and 2008 Plans:
|
Shares Vested
|
Unearned Compensation
|
||||||||||||||||||||||||||
|
Original Issuance Date
|
Shares Issued
|
Share Price on date of grant
|
Vesting Period
|
Vesting Schedule
|
December 31, 2010
|
December 31, 2009
|
December 31, 2010
|
December 31, 2009
|
|||||||||||||||||||
|
June 1, 2006
|
89,500 | $ | 9.40 |
4 years
|
25%/year
|
89,500 | 67,125 | $ | - | $ | 87 | ||||||||||||||||
|
June 1, 2007
|
214,582 | $ | 12.32 |
4 years
|
25%/year
|
160,933 | 107,291 | 275 | 935 | ||||||||||||||||||
|
June 2, 2008
|
278,059 | $ | 8.97 |
4 years
|
25%/year
|
139,028 | 69,515 | 883 | 1,506 | ||||||||||||||||||
|
September 30, 2008
|
3,616 | $ | 7.44 |
1-4 years
|
25-100%/year
|
2,308 | 654 | 9 | 6 | ||||||||||||||||||
|
June 1, 2009
|
744,128 | $ | 2.80 |
4 years
|
25%/year
|
186,241 | - | 1,258 | 1,780 | ||||||||||||||||||
|
September 25, 2009
|
10,000 | $ | 3.06 |
1 year
|
100%/year
|
10,000 | - | - | 20 | ||||||||||||||||||
|
March 25, 2010
|
6,000 | $ | 5.02 |
2 years
|
50%/year
|
- | - | 20 | - | ||||||||||||||||||
|
June 1, 2010
|
185,639 | $ | 4.63 |
0-3 years
|
25-100%/year
|
46,115 | - | 515 | - | ||||||||||||||||||
|
Total
|
1,531,524 | 634,125 | 244,585 | $ | 2,960 | $ | 4,334 | ||||||||||||||||||||
HERSHA HOSPITALITY TRUST AND SUBSIDIARIES
NOTES TO THE CONSOLIDATED FINANCIAL STATEMENTS
FOR THE YEARS ENDED DECEMBER 31, 2010, 2009, AND 2008
[IN THOUSANDS, EXCEPT SHARE/UNIT AND PER SHARE AMOUNTS]
NOTE 9 - SHARE-BASED PAYMENTS (continued)
Trustees
Compensation expense related to stock awards issued to the Board of Trustees of $263, $104, and $91 was incurred during the years ended December 31, 2010, 2009, and 2008, respectively and is recorded in stock based compensation on the statement of operations. All shares issued to the Board of Trustees are immediately vested. The following table is a summary of all of the grants issued to trustees during the years ended 2010, 2009, and 2008.
|
Date of Award Issuance
|
Shares Issued
|
Share Price on date of grant
|
||||||
|
January 2, 2008
|
4,000 | 9.33 | ||||||
|
June 2, 2008
|
6,000 | 8.97 | ||||||
|
January 2, 2009
|
12,500 | 2.96 | ||||||
|
June 1, 2009
|
17,000 | 2.80 | ||||||
|
December 31, 2009
|
18,000 | 3.14 | ||||||
|
June 1, 2010
|
27,000 | 4.63 | ||||||
|
December 31, 2010
|
21,000 | 6.60 | ||||||
HERSHA HOSPITALITY TRUST AND SUBSIDIARIES
NOTES TO THE CONSOLIDATED FINANCIAL STATEMENTS
FOR THE YEARS ENDED DECEMBER 31, 2010, 2009, AND 2008
[IN THOUSANDS, EXCEPT SHARE/UNIT AND PER SHARE AMOUNTS]
NOTE 10 - EARNINGS PER SHARE
The following table is a reconciliation of the income or loss (numerator) and the weighted average shares (denominator) used in the calculation of basic and diluted earnings per common share. The computation of basic and diluted earnings per share is presented below.
|
Year Ended
|
||||||||||||
|
December 31, 2010
|
December 31, 2009
|
December 31, 2008
|
||||||||||
|
Numerator:
|
||||||||||||
|
BASIC AND DILUTED*
|
||||||||||||
|
(Loss) from Continuing Operations
|
$ | (17,673 | ) | $ | (60,766 | ) | $ | (13,521 | ) | |||
|
Loss from Continuing Operations allocated to Noncontrolling Interests
|
873 | 8,884 | 2,036 | |||||||||
|
Distributions to 8.0% Series A Preferred Shareholders
|
(4,800 | ) | (4,800 | ) | (4,800 | ) | ||||||
|
Dividends Paid on Unvested Restricted Shares
|
(189 | ) | (255 | ) | (329 | ) | ||||||
|
(Loss) from Continuing Operations applicable to Common Shareholders
|
(21,789 | ) | (56,937 | ) | (16,614 | ) | ||||||
|
Discontinued Operations
|
||||||||||||
|
Income from Discontinued Operations
|
471 | 2,308 | 3,092 | |||||||||
|
(Income) from Discontinued Operations allocated to Noncontrolling Interests
|
(28 | ) | (287 | ) | (415 | ) | ||||||
|
Income from Discontinued Operations applicable to Common Shareholders
|
443 | 2,021 | 2,677 | |||||||||
|
Net (Loss) applicable to Common Shareholders
|
$ | (21,346 | ) | $ | (54,916 | ) | $ | (13,937 | ) | |||
|
Denominator:
|
||||||||||||
|
Weighted average number of common shares - basic
|
134,370,172 | 51,027,742 | 45,184,127 | |||||||||
|
Effect of dilutive securities:
|
||||||||||||
|
Restricted Stock Awards
|
- | - | ** | - | ||||||||
|
Contingently Issued Shares
|
- | - | ** | - | ||||||||
|
Option to acquire common shares
|
- | - | ** | - | ||||||||
|
Partnership Units
|
- | * | - | * | - | |||||||
|
Weighted average number of common shares - diluted
|
134,370,172 | 51,027,742 | 45,184,127 | |||||||||
|
Earnings Per Share:
|
||||||||||||
|
BASIC
|
||||||||||||
|
(Loss) from Continuing Operations applicable to Common Shareholders
|
$ | (0.16 | ) | $ | (1.12 | ) | $ | (0.37 | ) | |||
|
Income from Discontinued Operations applicable to Common Shareholders
|
- | 0.04 | 0.06 | |||||||||
|
Net (Loss) applicable to Common Shareholders
|
$ | (0.16 | ) | $ | (1.08 | ) | $ | (0.31 | ) | |||
|
DILUTED*
|
||||||||||||
|
(Loss) from Continuing Operations applicable to Common Shareholders
|
$ | (0.16 | ) | $ | (1.12 | ) | $ | (0.37 | ) | |||
|
Income from Discontinued Operations applicable to Common Shareholders
|
- | 0.04 | 0.06 | |||||||||
|
Net (Loss) applicable to Common Shareholders
|
$ | (0.16 | ) | $ | (1.08 | ) | $ | (0.31 | ) | |||
* Income (Loss) allocated to noncontrolling interest in Hersha Hospitality Limited Partnership has been excluded from the numerator, and units of limited partnership interest in Hersha Hospitality Limited Partnership have been omitted from the denominator, for the purpose of computing diluted earnings per share since the effect of including these amounts in the numerator and denominator would have no impact. Weighted average units of limited partnership interest in Hersha Hospitality Limited Partnership outstanding for the year ended December 31, 2010, 2009 and 2008 were 8,628,492, 8,724,725 and 8,034,737, respectively.
** Unvested stock awards, contingently issuable share awards and options to acquire our common shares have been omitted from the denominator for the purpose of computing diluted earnings per share for the year ended December 31, 2010, since the effect of including these awards in the denominator would be anti-dilutive to loss from continuing operations applicable to common shareholders. For the year ended December 31, 2010, there were 396,328 anti-dilutive unvested stock awards outstanding, 934,097 anti-dilutive contingently issuable share awards outstanding, and 2,327,219 anti-dilutive options to acquire our common shares outstanding. As a result of the application of the treasury stock method, there were no potentially dilutive securities to be considered for inclusion in the denominator for purpose of computing diluted earnings per share for years ended December 31, 2009 and 2008.
HERSHA HOSPITALITY TRUST AND SUBSIDIARIES
NOTES TO THE CONSOLIDATED FINANCIAL STATEMENTS
FOR THE YEARS ENDED DECEMBER 31, 2010, 2009, AND 2008
[IN THOUSANDS, EXCEPT SHARE/UNIT AND PER SHARE AMOUNTS]
NOTE 11 - CASH FLOW DISCLOSURES AND NON-CASH INVESTING AND FINANCING ACTIVITIES
Interest paid in 2010, 2009 and 2008 totaled $43,756, $42,471 and $41,797, respectively. The following non-cash investing and financing activities occurred during 2010, 2009 and 2008:
|
2010
|
2009
|
2008
|
||||||||||
|
Common Shares issued as part of the Dividend Reinvestment Plan
|
$ | 12 | $ | 25 | $ | 31 | ||||||
|
Issuance of Common Shares to the Board of Trustees
|
264 | 142 | 91 | |||||||||
|
Acquisitions of hotel properties
|
||||||||||||
|
Issuance of Common Units
|
6,256 | - | 21,624 | |||||||||
|
Debt assumed, net of discount
|
11,937 | 37,524 | 30,790 | |||||||||
|
Settlement of development loans receivable principal and accrued interest revenue receivable
|
7,839 | 21,760 | - | |||||||||
|
Land and Mortgage transferred to Seller
|
- | 10,118 | - | |||||||||
|
Development loan accrued interest revenue receivable paid in-kind by adding balance to development loan principal
|
2,559 | 4,502 | - | |||||||||
|
Conversion of Common Units to Common Shares
|
12,434 | 255 | 1,372 | |||||||||
|
Reallocation of noncontrolling interest
|
(6,374 | ) | - | 1,966 | ||||||||
|
Accrued payables for fixed assets placed in service
|
3,997 | - | - | |||||||||
HERSHA HOSPITALITY TRUST AND SUBSIDIARIES
NOTES TO THE CONSOLIDATED FINANCIAL STATEMENTS
FOR THE YEARS ENDED DECEMBER 31, 2010, 2009, AND 2008
[IN THOUSANDS, EXCEPT SHARE/UNIT AND PER SHARE AMOUNTS]
NOTE 12 - DISCONTINUED OPERATIONS
The operating results of certain real estate assets which have been sold or otherwise qualify as held for disposition are included in discontinued operations in the statements of operations for all periods presented.
The following real estate assets were sold between the period of January 1, 2008 and December 31, 2010. Our Board of Trustees authorized management of the Company to sell each of these assets prior to the final disposition. Based on their disposal date, the operating results for these hotels were reclassified to discontinued operations for the years ended December 31, 2010, 2009 and 2008:
|
Hotel
|
Acquisition Date
|
Disposition Date
|
Consideration
|
Gain on Disposition
|
||||||||
|
Holiday Inn New Cumberland, PA
|
January 1999
|
October 2008
|
$ | 6,456 | $ | 2,888 | *** | |||||
|
MainStay Suites, Frederick, MD
|
January 2002
|
July 2009
|
5,125 | 748 | * | |||||||
|
Comfort Inn, Frederick, MD
|
May 2004
|
July 2009
|
5,125 | 748 | * | |||||||
|
Sheraton Four Points, Revere, MD
|
March 2004
|
July 2009
|
2,500 | 165 | ** | |||||||
|
Hilton Garden Inn, Gettysburg, PA
|
July 2004
|
July 2009
|
7,750 | 208 | * | |||||||
|
Holiday Inn Express, New Columbia, PA
|
December 1997
|
July 2010
|
3,000 | 347 | * | |||||||
|
Total
|
$ | 29,956 | $ | 5,104 | ||||||||
* Property was sold to an unrelated buyer
** Interest in the joint venture was sold to our joint venture partner
***Leased hotel to an unrelated party which had a purchase provision by the lessee in the lease agreement
Assets Held for Sale
The following real estate assets were held for sale as of December 31, 2009. Our Board of Trustees authorized management of the Company to sell each of these assets in the third quarter of 2009. Based on changing market conditions and the inability to find a suitable buyer, these assets were no longer considered held for sale as of December 31, 2010. As such, the operating results of these assets are included in continuing operations in the consolidated statements of operations for the years ended December 31, 2010, 2009 and 2008. Assets held for sale and liabilities related to assets held for sale consisted of the following as of December 31, 2009:
|
December 31, 2009
|
||||
|
Land
|
$ | 18,389 | ||
|
Buildings and Improvements
|
2,912 | |||
|
Furniture, Fixtures and Equipment
|
531 | |||
|
Intangible Assets
|
50 | |||
| 21,882 | ||||
|
Less Accumulated Depreciation & Amortization
|
(809 | ) | ||
|
Assets Held for Sale
|
$ | 21,073 | ||
|
Liabilities Related to Assets Held for Sale
|
$ | 20,892 | ||
HERSHA HOSPITALITY TRUST AND SUBSIDIARIES
NOTES TO THE CONSOLIDATED FINANCIAL STATEMENTS
FOR THE YEARS ENDED DECEMBER 31, 2010, 2009, AND 2008
[IN THOUSANDS, EXCEPT SHARE/UNIT AND PER SHARE AMOUNTS]
NOTE 12 - DISCONTINUED OPERATIONS (continued)
Impairment of Assets Previously Held for Sale
We determined that the carrying value of the following properties exceeded fair value and as such we recorded an impairment charge as noted below during the years ended December 31, 2010 and 2009. The fair value of these properties was determined using Level 3 inputs, which are typically unobservable and are based on our own assumptions, as there is little, if any, related market activity.
|
For the Year Ended December 31,
|
||||||||||
|
2010
|
2009
|
|||||||||
|
Asset
|
Asset Type
|
Impairment Charge
|
||||||||
|
Comfort Inn, North Dartmouth, MA
|
Hotel Property
|
$ | 944 | $ | 1,577 | |||||
|
39th Street and 8th Avenue, New York, NY
|
Land Parcel
|
16 | 4,702 | |||||||
|
Nevins Street, Brooklyn, NY
|
Land Parcel
|
1,473 | 9,843 | |||||||
We allocate to income or loss from discontinued operations interest expense debt that is to be assumed or that is required to be repaid as a result of the disposal transaction. We allocated $0, $1,121 and $2,425 of interest expense to discontinued operations for the years ended December 31, 2010, 2009, and 2008, respectively.
The following table sets forth the components of discontinued operations for the years ended December 31, 2010, 2009 and 2008:
|
2010
|
2009
|
2008
|
||||||||||
|
Revenue:
|
||||||||||||
|
Hotel Operating Revenues
|
$ | 822 | $ | 8,100 | $ | 14,525 | ||||||
|
Hotel Lease Revenues
|
- | - | 628 | |||||||||
|
Other Revenue
|
- | 1,086 | 2,125 | |||||||||
|
Total Revenues
|
822 | 9,186 | 17,278 | |||||||||
|
Expenses:
|
||||||||||||
|
Hotel Operating Expenses
|
580 | 6,341 | 11,210 | |||||||||
|
Real Estate and Personal Property Taxes and Property Insurance
|
32 | 649 | 968 | |||||||||
|
Depreciation and Amortization
|
87 | 1,098 | 2,429 | |||||||||
|
General and Administrative
|
3 | (462 | ) | 7 | ||||||||
|
Other Expense
|
(4 | ) | - | - | ||||||||
|
Interest Expense
|
- | 1,121 | 2,425 | |||||||||
|
Loss on Debt Extinguishment
|
- | - | 35 | |||||||||
|
Total Expenses
|
698 | 8,747 | 17,074 | |||||||||
|
Income from Discontinued Operations
|
$ | 124 | $ | 439 | $ | 204 | ||||||
HERSHA HOSPITALITY TRUST AND SUBSIDIARIES
NOTES TO THE CONSOLIDATED FINANCIAL STATEMENTS
FOR THE YEARS ENDED DECEMBER 31, 2010, 2009, AND 2008
[IN THOUSANDS, EXCEPT SHARE/UNIT AND PER SHARE AMOUNTS]
NOTE 13 - SHAREHOLDERS’ EQUITY AND NONCONTROLLING INTERESTS IN PARTNERSHIP
Common Shares
The Company’s common shares are duly authorized, fully paid and non-assessable. Common shareholders are entitled to receive dividends if and when authorized and declared by the Board of Trustees of the Company out of assets legally available and to share ratably in the assets of the Company legally available for distribution to its shareholders in the event of its liquidation, dissolution or winding up after payment of, or adequate provision for, all known debts and liabilities of the Company.
Preferred Shares
The Declaration of Trust authorizes our Board of Trustees to classify any unissued preferred shares and to reclassify any previously classified but unissued preferred shares of any series from time to time in one or more series, as authorized by the Board of Trustees. Prior to issuance of shares of each series, the Board of Trustees is required by Maryland REIT Law and our Declaration of Trust to set for each such series, subject to the provisions of our Declaration of Trust regarding the restriction on transfer of shares of beneficial interest, the terms, the preferences, conversion or other rights, voting powers, restrictions, limitations as to dividends or other distributions, qualifications and terms or conditions of redemption for each such series. Thus, our Board of Trustees could authorize the issuance of additional preferred shares with terms and conditions which could have the effect of delaying, deferring or preventing a transaction or a change in control in us that might involve a premium price for holders of common shares or otherwise be in their best interest.
Common Units
Units of interest in our limited partnership, or Common Units are issued in connection with the acquisition of wholly owned hotels and joint venture interests in hotel properties. The total number of Common Units outstanding as of December 31, 2010, 2009 and 2008 was 7,418,912, 8,701,810 and 8,746,300 respectively. These units can be converted to common shares which are issuable to the limited partners upon exercise of their redemption rights. The number of shares issuable upon exercise of the redemption rights will be adjusted upon the occurrence of stock splits, mergers, consolidation or similar pro rata share transactions, that otherwise would have the effect of diluting the ownership interest of the limited partners or our shareholders. During 2010, 2009 and 2008, 2,934,511, 44,490 and 175,843 common units were converted to Class A Common Shares, respectively.
HERSHA HOSPITALITY TRUST AND SUBSIDIARIES
NOTES TO THE CONSOLIDATED FINANCIAL STATEMENTS
FOR THE YEARS ENDED DECEMBER 31, 2010, 2009, AND 2008
[IN THOUSANDS, EXCEPT SHARE/UNIT AND PER SHARE AMOUNTS]
NOTE 14 - INCOME TAXES
The Company has elected to be taxed as a REIT under Sections 856 through 860 of the Internal Revenue Code commencing with its taxable year ended December 31, 1999. To qualify as a REIT, the Company must meet a number of organizational and operational requirements, including a requirement that it currently distribute at least 90% of its REIT taxable income to its shareholders. It is the Company’s current intention to adhere to these requirements and maintain the Company’s qualification for taxation as a REIT. As a REIT, the Company generally will not be subject to federal corporate income tax on that portion of its net income that is currently distributed to shareholders. If the Company fails to qualify for taxation as a REIT in any taxable year, it will be subject to federal income taxes at regular corporate rates (including any applicable alternative minimum tax) and may not be able to qualify as a REIT for four subsequent taxable years. Even if the Company qualifies for taxation as a REIT, the Company may be subject to certain state and local taxes on its income and property, and to federal income and excise taxes on its undistributed taxable income.
Taxable income from non-REIT activities managed through taxable REIT subsidiaries is subject to federal, state and local income taxes. 44 New England is subject to income taxes at the applicable federal, state and local tax rates. On June 23, 2009, we sold our interest in Revere Hotel Group(“Revere”), a 55% owned taxable REIT subsidiary. Prior to this sale, Revere was subject to income taxes at the applicable federal, state and local tax rates.
In 2010, 2009 and 2008, 44 New England generated net operating losses of $4,726, $6,555, and $2,554, respectively. In 2008, Revere generated net operating income of $5. There was no income tax expense (benefit) recognized by 44 New England or Revere for 2010, 2009 and 2008.
The provision for income taxes differs from the amount of income tax determined by applying the applicable U.S. statutory federal income tax rate to pretax income as a result of the following differences:
|
For the year ended December 31,
|
||||||||||||
|
2010
|
2009
|
2008
|
||||||||||
|
Computed "Expected" federal tax expense (benefit) of TRS, at 35%
|
$ | (1,875 | ) | $ | (1,061 | ) | $ | (1,251 | ) | |||
|
State income taxes, net of federal income tax effect
|
(304 | ) | (421 | ) | (181 | ) | ||||||
|
Changes in valuation allowance
|
2,179 | 1,482 | 1,432 | |||||||||
|
Total income tax expense
|
$ | - | $ | - | $ | - | ||||||
The components of consolidated TRS’s deferred tax assets as of December 31, 2010 and 2009 were as follows:
|
As of December 31,
|
||||||||
|
2010
|
2009
|
|||||||
|
Deferred tax assets:
|
||||||||
|
Net operating loss carryforward
|
$ | 5,755 | $ | 3,558 | ||||
|
Depreciation
|
(66 | ) | (48 | ) | ||||
|
Net deferred tax assets
|
5,689 | 3,510 | ||||||
|
Valuation allowance
|
(5,689 | ) | (3,510 | ) | ||||
|
Deferred tax assets
|
$ | - | $ | - | ||||
Upon the sale of our interest in Revere in 2009, we relinquished deferred tax assets related to Revere’s net operating loss carry forwards of $1,128 and a valuation allowance in the same amount.
In assessing the realizability of deferred tax assets, management considers whether it is more likely than not that some portion or all of the deferred tax assets will not be realized. Based on the level of historical taxable income and projections for future taxable income over the periods in which the deferred tax assets are deductible, management believes it is more likely than not that 44 New England will not realize the benefits of these deferred tax assets at December 31, 2010.
HERSHA HOSPITALITY TRUST AND SUBSIDIARIES
NOTES TO THE CONSOLIDATED FINANCIAL STATEMENTS
FOR THE YEARS ENDED DECEMBER 31, 2010, 2009, AND 2008
[IN THOUSANDS, EXCEPT SHARE/UNIT AND PER SHARE AMOUNTS]
NOTE 14 - INCOME TAXES (continued)
Earnings and profits, which will determine the taxability of distributions to shareholders, will differ from net income reported for financial reporting purposes due to the differences for federal tax purposes in the estimated useful lives and methods used to compute depreciation. The following table sets forth certain per share information regarding the Company’s common and preferred share distributions for the years ended December 31, 2010, 2009 and 2008.
|
2010
|
2009
|
2008
|
||||||||||
|
Preferred Shares - 8% Series A
|
||||||||||||
|
Ordinary income
|
0.00 | % | 0.00 | % | 86.46 | % | ||||||
|
Return of Capital
|
100.00 | % | 100.00 | % | 0.00 | % | ||||||
|
Capital Gain Distribution
|
0.00 | % | 0.00 | % | 13.54 | % | ||||||
|
Common Shares - Class A
|
||||||||||||
|
Ordinary income
|
0.00 | % | 0.00 | % | 44.61 | % | ||||||
|
Return of Capital
|
100.00 | % | 100.00 | % | 48.40 | % | ||||||
|
Capital Gain Distribution
|
0.00 | % | 0.00 | % | 6.99 | % | ||||||
HERSHA HOSPITALITY TRUST AND SUBSIDIARIES
NOTES TO THE CONSOLIDATED FINANCIAL STATEMENTS
FOR THE YEARS ENDED DECEMBER 31, 2010, 2009, AND 2008
[IN THOUSANDS, EXCEPT SHARE/UNIT AND PER SHARE AMOUNTS]
NOTE 15 – SELECTED QUARTERLY FINANCIAL DATA (UNAUDITED)
|
Year Ended December 31, 2010
|
||||||||||||||||
|
First Quarter
|
Second Quarter
|
Third Quarter
|
Fourth Quarter
|
|||||||||||||
|
Total Revenues
|
$ | 50,857 | $ | 76,234 | $ | 81,129 | $ | 74,724 | ||||||||
|
Total Expenses
|
67,935 | 72,706 | 79,685 | 82,548 | ||||||||||||
|
Income (Loss) from Unconsolidated Joint Ventures
|
778 | 2,059 | (243 | ) | (337 | ) | ||||||||||
|
(Loss) Income from Continuing Operations
|
(16,300 | ) | 5,587 | 1,201 | (8,161 | ) | ||||||||||
|
(Loss) Income from Discontinued Operations (including Gain on Disposition of Hotel Properties)
|
(37 | ) | 120 | 401 | (13 | ) | ||||||||||
|
Net (Loss) Income
|
(16,337 | ) | 5,707 | 1,602 | (8,174 | ) | ||||||||||
|
(Loss) Income Allocated to Noncontrolling Interests in Continuing Operations
|
(1,715 | ) | 1,151 | 263 | (544 | ) | ||||||||||
|
Preferred Distributions
|
1,200 | 1,200 | 1,200 | 1,200 | ||||||||||||
|
Net (Loss) Income applicable to Common Shareholders
|
$ | (15,822 | ) | $ | 3,356 | $ | 139 | $ | (8,830 | ) | ||||||
|
Basic and diluted earnings per share:
|
||||||||||||||||
|
(Loss) Income from continuing operations applicable to common shareholders
|
$ | (0.16 | ) | $ | 0.02 | $ | - | $ | (0.05 | ) | ||||||
|
Discontinued Operations
|
- | - | - | - | ||||||||||||
|
Net (Loss) Income applicable to Common Shareholders
|
$ | (0.16 | ) | $ | 0.02 | $ | - | $ | (0.05 | ) | ||||||
|
Weighted Average Common Shares Outstanding
|
||||||||||||||||
|
Basic
|
99,311,523 | 137,200,796 | 138,636,206 | 161,600,788 | ||||||||||||
|
Diluted
|
99,311,523 | 140,351,846 | 142,066,649 | 161,600,788 | ||||||||||||
|
Year Ended December 31, 2009
|
||||||||||||||||
|
First Quarter
|
Second Quarter
|
Third Quarter
|
Fourth Quarter
|
|||||||||||||
|
Total Revenues
|
$ | 45,799 | $ | 60,771 | $ | 61,834 | $ | 53,548 | ||||||||
|
Total Expenses
|
54,836 | 59,297 | 101,353 | 60,042 | ||||||||||||
|
(Loss) Income from Unconsolidated Joint Ventures
|
(1,329 | ) | (395 | ) | (606 | ) | (4,860 | ) | ||||||||
|
(Loss) Income from Continuing Operations
|
(10,366 | ) | 1,079 | (40,125 | ) | (11,354 | ) | |||||||||
|
(Loss) Income from Discontinued Operations (including Gain on Disposition of Hotel Properties)
|
(317 | ) | 405 | 2,190 | 30 | |||||||||||
|
Net (Loss) Income
|
(10,683 | ) | 1,484 | (37,935 | ) | (11,324 | ) | |||||||||
|
(Loss) Income Allocated to Noncontrolling Interests in Continuing Operations
|
(2,053 | ) | 451 | (5,560 | ) | (1,435 | ) | |||||||||
|
Preferred Distributions
|
1,200 | 1,200 | 1,200 | 1,200 | ||||||||||||
|
Net (Loss) Income applicable to Common Shareholders
|
$ | (9,830 | ) | $ | (167 | ) | $ | (33,575 | ) | $ | (11,089 | ) | ||||
|
Basic and diluted earnings per share:
|
||||||||||||||||
|
(Loss) Income from continuing operations applicable to common shareholders
|
$ | (0.21 | ) | $ | - | $ | (0.39 | ) | $ | (0.20 | ) | |||||
|
Discontinued Operations
|
- | - | (0.26 | ) | - | |||||||||||
|
Net Loss (Income) applicable to Common Shareholders
|
$ | (0.21 | ) | $ | - | $ | (0.65 | ) | $ | (0.20 | ) | |||||
|
Weighted Average Common Shares Outstanding
|
||||||||||||||||
|
Basic
|
47,786,503 | 47,964,818 | 51,878,482 | 56,488,607 | ||||||||||||
|
Diluted
|
47,786,503 | 47,964,818 | 51,878,482 | 56,488,607 | ||||||||||||
HERSHA HOSPITALITY TRUST AND SUBSIDIARIES
NOTES TO THE CONSOLIDATED FINANCIAL STATEMENTS
FOR THE YEARS ENDED DECEMBER 31, 2010, 2009, AND 2008
[IN THOUSANDS, EXCEPT SHARE/UNIT AND PER SHARE AMOUNTS]
NOTE 16 – SUBSEQUENT EVENTS
The following events occurred subsequent to December 31, 2010:
Acquisition
On January 20, 2011, the Company entered into a purchase and sale agreement to acquire the Capitol Hill Suites, Washington, DC for approximately $47,500. The closing of this acquisition is expected to occur by the end of the first quarter 2011.
HERSHA HOSPITALITY TRUST AND SUBSIDIARIES
SCHEDULE III - REAL ESTATE AND ACCUMULATED DEPRECIATION AS OF DECEMBER 31, 2010 (continued)
[IN THOUSANDS]
|
Initial Costs
|
Costs Capitalized Subsequent to Acquisition
|
Gross Amounts at which Carrried at Close of Period
|
Accumulated
|
Net Book Value
|
|||||||||||||||||||||||||||||||||||||
|
Depreciation
|
Land
|
||||||||||||||||||||||||||||||||||||||||
|
Description
|
Encumbrances
|
Land
|
Buildings & Improvements
|
Land
|
Buildings & Improvements
|
Land
|
Buildings & Improvements
|
Total
|
Buildings & Improvements*
|
Buildings & Improvements
|
Date of Acquisition
|
||||||||||||||||||||||||||||||
|
Hampton Inn, Carlisle, PA
|
$ | - | $ | 300 | $ | 3,109 | $ | 200 | $ | 2,394 | $ | 500 | $ | 5,503 | $ | 6,003 | $ | (1,819 | ) | $ | 4,184 |
06/01/97
|
|||||||||||||||||||
|
Holiday Inn Exp, Hershey, PA
|
(5,874 | ) | 426 | 2,645 | 410 | 4,043 | 836 | 6,688 | 7,524 | (2,249 | ) | 5,275 |
10/01/97
|
||||||||||||||||||||||||||||
|
Comfort Inn, Harrisburg, PA
|
- | - | 2,720 | 214 | 1,203 | 214 | 3,923 | 4,137 | (1,277 | ) | 2,860 |
05/15/98
|
|||||||||||||||||||||||||||||
|
Hampton Inn, Selinsgrove, PA
|
- | 157 | 2,511 | 93 | 2,507 | 250 | 5,018 | 5,268 | (1,861 | ) | 3,407 |
09/12/96
|
|||||||||||||||||||||||||||||
|
Hampton Inn, Danville, PA
|
- | 300 | 2,787 | 99 | 1,267 | 399 | 4,054 | 4,453 | (1,283 | ) | 3,170 |
08/28/97
|
|||||||||||||||||||||||||||||
|
Holiday Inn Exp & Suites, Harrisburg, PA
|
- | 213 | 1,934 | 81 | 1,414 | 294 | 3,348 | 3,642 | (999 | ) | 2,643 |
03/06/98
|
|||||||||||||||||||||||||||||
|
Hampton Inn, Hershey, PA
|
- | 807 | 5,714 | 4 | 1,067 | 811 | 6,781 | 7,592 | (2,141 | ) | 5,451 |
01/01/00
|
|||||||||||||||||||||||||||||
|
Hilton Garden Inn, Edison, NJ
|
- | - | 12,159 | - | 333 | - | 12,492 | 12,492 | (2,347 | ) | 10,145 |
10/01/03
|
|||||||||||||||||||||||||||||
|
Residence Inn, Framingham, MA
|
(8,409 | ) | 1,325 | 12,737 | - | 869 | 1,325 | 13,606 | 14,931 | (2,529 | ) | 12,402 |
03/26/04
|
||||||||||||||||||||||||||||
|
Hampton Inn, New York, NY
|
(25,303 | ) | 5,472 | 23,280 | - | 664 | 5,472 | 23,944 | 29,416 | (3,587 | ) | 25,829 |
04/01/05
|
||||||||||||||||||||||||||||
|
Residence Inn, Greenbelt, MD
|
(11,482 | ) | 2,615 | 14,815 | - | 784 | 2,615 | 15,599 | 18,214 | (2,535 | ) | 15,679 |
07/16/04
|
||||||||||||||||||||||||||||
|
Courtyard South Boston, MA
|
- | - | 19,939 | - | (2,061 | ) | - | 17,878 | 17,878 | (2,723 | ) | 15,155 |
09/30/05
|
||||||||||||||||||||||||||||
|
Fairfield Inn, Laurel, MD
|
(7,196 | ) | 927 | 6,120 | - | 997 | 927 | 7,117 | 8,044 | (1,289 | ) | 6,755 |
01/31/05
|
||||||||||||||||||||||||||||
|
Holiday Inn Exp, Langhorne, PA
|
(6,275 | ) | 1,088 | 6,573 | - | 158 | 1,088 | 6,731 | 7,819 | (962 | ) | 6,857 |
05/26/05
|
||||||||||||||||||||||||||||
|
Holiday Inn Exp, Malvern, PA
|
(3,899 | ) | 2,639 | 5,324 | 654 | 171 | 3,293 | 5,495 | 8,788 | (781 | ) | 8,007 |
05/24/05
|
||||||||||||||||||||||||||||
|
Holiday Inn Exp, King of Prussia, PA
|
(12,406 | ) | 2,557 | 13,339 | - | 848 | 2,557 | 14,187 | 16,744 | (2,001 | ) | 14,743 |
05/23/05
|
||||||||||||||||||||||||||||
|
Courtyard Inn, Wilmington, DE
|
(12,195 | ) | 988 | 10,295 | - | 1,178 | 988 | 11,473 | 12,461 | (1,770 | ) | 10,691 |
06/17/05
|
||||||||||||||||||||||||||||
|
McIntosh Inn, Wilmington, DE
|
- | 898 | 4,515 | - | 786 | 898 | 5,301 | 6,199 | (982 | ) | 5,217 |
06/17/05
|
|||||||||||||||||||||||||||||
|
Residence Inn, Williamsburg, VA
|
(6,921 | ) | 1,911 | 11,625 | - | 615 | 1,911 | 12,240 | 14,151 | (2,843 | ) | 11,308 |
11/22/05
|
||||||||||||||||||||||||||||
|
Springhill Suites, Williamsburg, VA
|
(4,712 | ) | 1,430 | 10,293 | - | 117 | 1,430 | 10,410 | 11,840 | (2,349 | ) | 9,491 |
11/22/05
|
||||||||||||||||||||||||||||
|
Courtyard Inn, Brookline, MA
|
(38,710 | ) | - | 47,414 | - | 1,524 | - | 48,938 | 48,938 | (6,896 | ) | 42,042 |
06/15/05
|
||||||||||||||||||||||||||||
|
Courtyard Inn, Scranton, PA
|
(5,987 | ) | 761 | 7,193 | - | 1,598 | 761 | 8,791 | 9,552 | (1,347 | ) | 8,205 |
02/01/06
|
||||||||||||||||||||||||||||
|
Courtyard Inn, Langhorne, PA
|
(14,791 | ) | 3,064 | 16,068 | - | 920 | 3,064 | 16,988 | 20,052 | (2,180 | ) | 17,872 |
01/03/06
|
||||||||||||||||||||||||||||
|
Fairfield Inn, Bethlehem, PA
|
(5,912 | ) | 1,399 | 6,778 | - | 343 | 1,399 | 7,121 | 8,520 | (1,019 | ) | 7,501 |
01/03/06
|
||||||||||||||||||||||||||||
|
Residence Inn, Tyson's Corner, VA
|
(8,588 | ) | 4,283 | 14,475 | - | 307 | 4,283 | 14,782 | 19,065 | (1,880 | ) | 17,185 |
02/02/06
|
||||||||||||||||||||||||||||
|
Hilton Garden Inn, JFK Airport, NY
|
(20,838 | ) | - | 25,018 | - | 861 | - | 25,879 | 25,879 | (3,330 | ) | 22,549 |
02/16/06
|
||||||||||||||||||||||||||||
|
Hawthorne Suites, Franklin, MA
|
(8,165 | ) | 1,872 | 8,968 | - | 201 | 1,872 | 9,169 | 11,041 | (1,109 | ) | 9,932 |
04/25/06
|
||||||||||||||||||||||||||||
|
Comfort Inn, Dartmouth, MA (1)
|
(2,968 | ) | 902 | 3,525 | (447 | ) | (1,470 | ) | 455 | 2,055 | 2,510 | (536 | ) | 1,974 |
05/01/06
|
||||||||||||||||||||||||||
|
Residence Inn, Dartmouth, MA
|
(8,268 | ) | 1,933 | 10,434 | - | 266 | 1,933 | 10,700 | 12,633 | (1,291 | ) | 11,342 |
05/01/06
|
||||||||||||||||||||||||||||
|
Holiday Inn Exp, Cambridge, MA
|
(10,604 | ) | 1,956 | 9,793 | - | 1,056 | 1,956 | 10,849 | 12,805 | (1,389 | ) | 11,416 |
05/03/06
|
||||||||||||||||||||||||||||
|
Residence Inn, Norwood, MA
|
- | 1,970 | 11,761 | - | 156 | 1,970 | 11,917 | 13,887 | (1,329 | ) | 12,558 |
07/27/06
|
|||||||||||||||||||||||||||||
|
Hampton Inn, Brookhaven, NY
|
(14,085 | ) | 3,130 | 17,345 | 1 | 871 | 3,131 | 18,216 | 21,347 | (2,196 | ) | 19,151 |
09/06/06
|
||||||||||||||||||||||||||||
|
Holiday Inn Exp, Hauppauge, NY
|
(9,415 | ) | 2,737 | 14,080 | - | 853 | 2,737 | 14,933 | 17,670 | (1,815 | ) | 15,855 |
09/01/06
|
||||||||||||||||||||||||||||
|
Residence Inn, Langhorne, PA
|
- | 1,463 | 12,094 | 94 | 889 | 1,557 | 12,983 | 14,540 | (1,282 | ) | 13,258 |
01/08/07
|
|||||||||||||||||||||||||||||
1) Costs capitalized subsequent to acquisition include reductions of asset value due to impairment.
HERSHA HOSPITALITY TRUST AND SUBSIDIARIES
SCHEDULE III - REAL ESTATE AND ACCUMULATED DEPRECIATION AS OF DECEMBER 31, 2010 (continued)
[IN THOUSANDS]
|
Initial Costs
|
Costs Capitalized Subsequent to Acquisition
|
Gross Amounts at which Carrried at Close of Period
|
Accumulated
|
Net Book Value
|
|||||||||||||||||||||||||||||||||||||
|
Depreciation
|
Land
|
||||||||||||||||||||||||||||||||||||||||
|
Description
|
Encumbrances
|
Land
|
Buildings & Improvements
|
Land
|
Buildings & Improvements
|
Land
|
Buildings & Improvements
|
Total
|
Buildings & Improvements*
|
Buildings & Improvements
|
Date of Acquisition
|
||||||||||||||||||||||||||||||
|
Hampton Inn, Chelsea, NY
|
$ | (35,543 | ) | $ | 8,905 | $ | 33,500 | $ | - | $ | 1,213 | $ | 8,905 | $ | 34,713 | $ | 43,618 | $ | (3,870 | ) | $ | 39,748 |
09/29/06
|
||||||||||||||||||
|
Hyatt Summerfield Suites, Bridgewater, NJ
|
(14,492 | ) | 3,373 | 19,685 | - | 271 | 3,373 | 19,956 | 23,329 | (2,006 | ) | 21,323 |
12/28/06
|
||||||||||||||||||||||||||||
|
Hyatt Summerfield Suites, Charlotte, NC
|
(7,330 | ) | 770 | 7,315 | - | 1,647 | 770 | 8,962 | 9,732 | (1,372 | ) | 8,360 |
12/28/06
|
||||||||||||||||||||||||||||
|
Hyatt Summerfield Suites, Gaithersburg, MD
|
(13,720 | ) | 2,912 | 16,001 | - | 363 | 2,912 | 16,364 | 19,276 | (1,752 | ) | 17,524 |
12/28/06
|
||||||||||||||||||||||||||||
|
Hyatt Summerfield Suites, Pleasant Hills, CA
|
(20,160 | ) | 6,216 | 17,229 | - | 148 | 6,216 | 17,377 | 23,593 | (1,753 | ) | 21,840 |
12/28/06
|
||||||||||||||||||||||||||||
|
Hyatt Summerfield Suites, Pleasanton, CA
|
(14,490 | ) | 3,941 | 12,560 | - | 155 | 3,941 | 12,715 | 16,656 | (1,291 | ) | 15,365 |
12/28/06
|
||||||||||||||||||||||||||||
|
Hyatt Summerfield Suites, Scottsdale, AZ
|
(16,778 | ) | 3,060 | 19,968 | - | 218 | 3,060 | 20,186 | 23,246 | (2,044 | ) | 21,202 |
12/28/06
|
||||||||||||||||||||||||||||
|
Hyatt Summerfield Suites, White Plains, NY
|
(33,030 | ) | 8,823 | 30,273 | - | 1,558 | 8,823 | 31,831 | 40,654 | (3,102 | ) | 37,552 |
12/28/06
|
||||||||||||||||||||||||||||
|
Holiday Inn Exp & Suites, Chester, NY
|
(6,640 | ) | 1,500 | 6,671 | - | 105 | 1,500 | 6,776 | 8,276 | (667 | ) | 7,609 |
01/25/07
|
||||||||||||||||||||||||||||
|
Residence Inn, Carlisle, PA
|
(6,732 | ) | 1,015 | 7,511 | - | 28 | 1,015 | 7,539 | 8,554 | (755 | ) | 7,799 |
01/10/07
|
||||||||||||||||||||||||||||
|
Hampton Inn, Seaport, NY
|
(19,349 | ) | 7,816 | 19,040 | - | 158 | 7,816 | 19,198 | 27,014 | (1,903 | ) | 25,111 |
02/01/07
|
||||||||||||||||||||||||||||
|
Hotel 373-5th Ave, New York, NY
|
(22,000 | ) | 14,239 | 16,778 | - | 82 | 14,239 | 16,860 | 31,099 | (1,526 | ) | 29,573 |
06/01/07
|
||||||||||||||||||||||||||||
|
Holiday Inn, Norwich, CT
|
- | 1,984 | 12,037 | - | 562 | 1,984 | 12,599 | 14,583 | (1,138 | ) | 13,445 |
07/01/07
|
|||||||||||||||||||||||||||||
|
Sheraton Hotel, JFK Airport, NY
|
- | - | 27,315 | - | 264 | - | 27,579 | 27,579 | (1,793 | ) | 25,786 |
06/13/08
|
|||||||||||||||||||||||||||||
|
Hampton Inn, Philadelphia, PA
|
- | 3,490 | 24,382 | - | 3,458 | 3,490 | 27,840 | 31,330 | (5,967 | ) | 25,363 |
02/15/06
|
|||||||||||||||||||||||||||||
|
Duane Street, Tribeca, NY
|
(15,000 | ) | 8,213 | 12,869 | - | 559 | 8,213 | 13,428 | 21,641 | (1,088 | ) | 20,553 |
01/04/08
|
||||||||||||||||||||||||||||
|
NU Hotel, Brooklyn, NY
|
(18,000 | ) | - | 22,042 | - | 50 | - | 22,092 | 22,092 | (1,372 | ) | 20,720 |
01/14/08
|
||||||||||||||||||||||||||||
|
Towneplace Suites, Harrisburg, PA
|
- | 1,237 | 10,136 | - | 45 | 1,237 | 10,181 | 11,418 | (675 | ) | 10,743 |
05/08/08
|
|||||||||||||||||||||||||||||
|
Holiday Inn Express, Camp Springs, MD
|
- | 1,629 | 11,094 | - | 295 | 1,629 | 11,389 | 13,018 | (768 | ) | 12,250 |
06/26/08
|
|||||||||||||||||||||||||||||
|
Hampton Inn, Smithfield, RI
|
(6,684 | ) | 2,057 | 9,486 | - | 40 | 2,057 | 9,526 | 11,583 | (575 | ) | 11,008 |
08/01/08
|
||||||||||||||||||||||||||||
|
Hilton Garden Inn, Tribeca, NY
|
(32,000 | ) | 21,077 | 42,955 | - | 74 | 21,077 | 43,029 | 64,106 | (1,799 | ) | 62,307 |
05/01/09
|
||||||||||||||||||||||||||||
|
Hampton Inn, West Haven, CT
|
(7,552 | ) | 1,053 | 10,751 | - | 34 | 1,053 | 10,785 | 11,838 | (315 | ) | 11,523 |
11/04/09
|
||||||||||||||||||||||||||||
|
Hilton Garden Inn, Glastonbury, CT
|
(11,902 | ) | 1,898 | 12,981 | - | 5 | 1,898 | 12,986 | 14,884 | (325 | ) | 14,559 |
01/01/10
|
||||||||||||||||||||||||||||
|
Hampton Inn, Times Square, NY
|
- | 10,691 | 41,637 | - | - | 10,691 | 41,637 | 52,328 | (924 | ) | 51,404 |
02/09/10
|
|||||||||||||||||||||||||||||
|
Holiday Inn Express, Times Square, NY
|
- | 11,075 | 43,113 | - | 1 | 11,075 | 43,114 | 54,189 | (957 | ) | 53,232 |
02/09/10
|
|||||||||||||||||||||||||||||
|
Candlewood Suites, Times Square, NY
|
- | 10,281 | 36,687 | - | 1 | 10,281 | 36,688 | 46,969 | (815 | ) | 46,154 |
02/09/10
|
|||||||||||||||||||||||||||||
|
Hyatt Place, KOP, PA
|
- | 1,133 | 7,267 | - | 3,762 | 1,133 | 11,029 | 12,162 | (1,863 | ) | 10,299 |
08/17/10
|
|||||||||||||||||||||||||||||
|
Holiday Inn Express, Wall Street, NY
|
- | 12,152 | 21,100 | - | 1 | 12,152 | 21,101 | 33,253 | (344 | ) | 32,909 |
05/09/10
|
|||||||||||||||||||||||||||||
|
Hampton Inn, Washington, DC
|
- | 9,335 | 58,048 | - | - | 9,335 | 58,048 | 67,383 | (484 | ) | 66,899 |
09/01/10
|
|||||||||||||||||||||||||||||
|
Courtyard Inn, Alexandria, VA
|
(24,683 | ) | 6,376 | 26,089 | - | 510 | 6,376 | 26,599 | 32,975 | (2,927 | ) | 30,048 |
09/29/06
|
||||||||||||||||||||||||||||
|
8th Ave Land, New York City, NY (1)
|
(11,913 | ) | 21,575 | - | (9,365 | ) | 108 | 12,210 | 108 | 12,318 | (65 | ) | 12,253 |
06/28/06
|
|||||||||||||||||||||||||||
|
Nevins Street Land, Brooklyn, NY (1)
|
(5,948 | ) | 10,650 | - | (6,168 | ) | - | 4,482 | - | 4,482 | - | 4,482 |
6/11/07 &
07/11/07
|
||||||||||||||||||||||||||||
|
Total Real Estate
|
$ | (596,949 | ) | $ | 247,999 | $ | 1,013,900 | $ | (14,130 | ) | $ | 43,444 | $ | 233,869 | $ | 1,057,344 | $ | 1,291,213 | $ | (112,161 | ) | $ | 1,179,052 | ||||||||||||||||||
(1) Costs capitalized subsequent to acquisition include reductions of asset value due to impairment.
* Assets are depreciated over a 7 to 40 year life, upon which the latest income statement is computed
HERSHA HOSPITALITY TRUST AND SUBSIDIARIES
SCHEDULE III - REAL ESTATE AND ACCUMULATED DEPRECIATION AS OF DECEMBER 31, 2010 (continued)
[IN THOUSANDS]
|
2010
|
2009
|
2008
|
||||||||||
|
Reconciliation of Real Estate
|
||||||||||||
|
Balance at beginning of year
|
$ | 997,212 | $ | 987,639 | $ | 878,099 | ||||||
|
Additions during the year
|
297,450 | 79,170 | 114,596 | |||||||||
|
Dispositions during the year
|
(3,449 | ) | (53,493 | ) | (5,056 | ) | ||||||
|
Changes in Assets Held for Sale
|
- | (37,406 | ) | - | ||||||||
|
Investment in Real Estate
|
1,291,213 | 975,910 | 987,639 | |||||||||
|
Assets Held for Sale, net of impairment
|
- | 21,302 | - | |||||||||
|
Total Real Estate
|
$ | 1,291,213 | $ | 997,212 | $ | 987,639 | ||||||
|
Reconciliation of Accumulated Depreciation
|
||||||||||||
|
Balance at beginning of year
|
$ | 83,556 | $ | 67,824 | $ | 49,091 | ||||||
|
Depreciation for year
|
29,654 | 22,667 | 20,965 | |||||||||
|
Accumulated depreciation on assets sold
|
(1,049 | ) | (6,935 | ) | (2,232 | ) | ||||||
|
Balance at the end of year
|
$ | 112,161 | $ | 83,556 | $ | 67,824 | ||||||
The aggregate cost of land, buildings and improvements for Federal income tax purposes for the years ended December 31, 2010, 2009 and 2008 is approximately $1,183,694, $911,634, and $894,596 respectively.
Depreciation is computed for buildings and improvements using a useful life for these assets of 7 to 40 years.
See Accompanying Report of Independent Registered Public Accounting Firm
|
Item 9.
|
Changes in and Disagreements with Accountants on Accounting and Financial Disclosure
|
None.
|
Item 9A.
|
Controls and Procedures
|
EVALUATION OF DISCLOSURE CONTROLS AND PROCEDURES
Under the supervision and with the participation of our management, including our Chief Executive Officer and Chief Financial Officer, we conducted an evaluation of our disclosure controls and procedures, as such term is defined under Rule 13a-15(e) promulgated under the Securities Exchange Act of 1934, as amended (the Exchange Act), as of the end of the period covered by this report. Based on that evaluation, the Chief Executive Officer and Chief Financial Officer concluded that our disclosure controls and procedures as of the end of the period covered by this report are functioning effectively to provide reasonable assurance that the information required to be disclosed by us in reports filed under the Securities Exchange Act of 1934 is (i) recorded, processed, summarized and reported within the time periods specified in the SEC’s rules and forms and (ii) accumulated and communicated to our management, including the Chief Executive Officer and Chief Financial Officer, as appropriate to allow timely decisions regarding disclosure. A control system cannot provide absolute assurance, however, that the objectives of the controls system are met, and no evaluation of controls can provide absolute assurance that all control issues and instances of fraud, if any, within a company have been detected.
MANAGEMENT’S ANNUAL REPORT ON INTERNAL CONTROL OVER FINANCIAL REPORTING
The Company’s management is responsible for establishing and maintaining adequate internal control over financial reporting, as defined within Exchange Act Rules 13a-15(f) and 15d-15(f). Internal control over financial reporting refers to the processes designed to provide reasonable assurance regarding the reliability of financial reporting and the preparation of financial statements for external purposes in accordance with generally accepted accounting principles, and includes policies and procedures that:
|
·
|
pertain to the maintenance of records that, in reasonable detail, accurately and fairly reflect the transactions and dispositions of the assets of the Company;
|
|
·
|
provide reasonable assurance that transactions are recorded as necessary to permit preparation of financial statements in accordance with generally accepted accounting principles, and that receipts and expenditures of the Company are being made only in accordance with authorizations of management and directors of the Company; and
|
|
·
|
provide reasonable assurance regarding prevention or timely detection of unauthorized acquisition, use, or disposition of the Company’s assets that could have a material effect on the financial statements.
|
Because of its inherent limitations, internal control over financial reporting may not prevent or detect misstatements. Also, projections of any evaluation of effectiveness to future periods are subject to the risk that controls may become inadequate because of changes in conditions, or that the degree of compliance with the policies or procedures may deteriorate.
Management conducted an evaluation of the effectiveness of the Company’s internal control over financial reporting based on the criteria contained in Internal Control — Integrated Framework issued by the Committee of Sponsoring Organizations (COSO) of the Treadway Commission as of December 31, 2010. Based on that evaluation, management has concluded that, as of December 31, 2010, the Company’s internal control over financial reporting was effective based on those criteria. The effectiveness of our internal control over financial reporting as of December 31, 2010 has been audited by KPMG LLP, an independent registered public accounting firm, as stated in their attestation report which is included herein.
Report of Independent Registered Public Accounting Firm
The Board of Trustees and Shareholders of
Hersha Hospitality Trust:
We have audited Hersha Hospitality Trust and subsidiaries’ internal control over financial reporting as of December 31, 2010, based on criteria established in Internal Control - Integrated Framework issued by the Committee of Sponsoring Organizations of the Treadway Commission (COSO). Hersha Hospitality Trust's management is responsible for maintaining effective internal control over financial reporting and for its assessment of the effectiveness of internal control over financial reporting, included in the accompanying Management’s Annual Report on Internal Control Over Financial Reporting. Our responsibility is to express an opinion on the Company’s internal control over financial reporting based on our audit.
We conducted our audit in accordance with the standards of the Public Company Accounting Oversight Board (United States). Those standards require that we plan and perform the audit to obtain reasonable assurance about whether effective internal control over financial reporting was maintained in all material respects. Our audit included obtaining an understanding of internal control over financial reporting, assessing the risk that a material weakness exists, and testing and evaluating the design and operating effectiveness of internal control based on the assessed risk. Our audit also included performing such other procedures as we considered necessary in the circumstances. We believe that our audit provides a reasonable basis for our opinion.
A company's internal control over financial reporting is a process designed to provide reasonable assurance regarding the reliability of financial reporting and the preparation of financial statements for external purposes in accordance with generally accepted accounting principles. A company's internal control over financial reporting includes those policies and procedures that (1) pertain to the maintenance of records that, in reasonable detail, accurately and fairly reflect the transactions and dispositions of the assets of the company; (2) provide reasonable assurance that transactions are recorded as necessary to permit preparation of financial statements in accordance with generally accepted accounting principles, and that receipts and expenditures of the company are being made only in accordance with authorizations of management and directors of the company; and (3) provide reasonable assurance regarding prevention or timely detection of unauthorized acquisition, use, or disposition of the company’s assets that could have a material effect on the financial statements.
Because of its inherent limitations, internal control over financial reporting may not prevent or detect misstatements. Also, projections of any evaluation of effectiveness to future periods are subject to the risk that controls may become inadequate because of changes in conditions, or that the degree of compliance with the policies or procedures may deteriorate.
In our opinion, Hersha Hospitality Trust maintained, in all material respects, effective internal control over financial reporting as of December 31, 2010, based on criteria established in Internal Control - Integrated Framework issued by the Committee of Sponsoring Organizations of the Treadway Commission.
We also have audited, in accordance with the standards of the Public Company Accounting Oversight Board (United States), the consolidated balance sheets of Hersha Hospitality Trust and subsidiaries as of December 31, 2010 and 2009, and the related consolidated statements of operations, equity and comprehensive income, and cash flows for each of the years in the three-year period ended December 31, 2010, and our report dated March 3, 2011 expressed an unqualified opinion on those consolidated financial statements.
/s/ KPMG LLP
Philadelphia, Pennsylvania
March 3, 2011
CHANGES IN INTERNAL CONTROL OVER FINANCIAL REPORTING
There were no changes in our internal control over financial reporting during the quarter ended December 31, 2010, that have materially affected, or are reasonably likely to materially affect, our internal control over financial reporting.
|
Item 9B.
|
Other Information
|
None.
PART III
|
Item 10.
|
Trustees, Executive Officers and Corporate Governance
|
The required information is incorporated herein by reference from our definitive proxy statement to be filed with the Securities and Exchange Commission within 120 days after the end of the year covered by this Annual Report on Form 10-K with respect to our 2011 Annual Meeting of Shareholders.
|
Item 11.
|
Executive Compensation
|
The required information is incorporated herein by reference from our definitive proxy statement to be filed with the Securities and Exchange Commission within 120 days after the end of the year covered by this Annual Report on Form 10-K with respect to our 2011 Annual Meeting of Shareholders.
|
Item 12.
|
Security Ownership of Certain Beneficial Owners and Management and Related Stockholder Matters
|
Certain of the required information is incorporated herein by reference from our definitive proxy statement to be filed with the Securities and Exchange Commission within 120 days after the end of the year covered by this Annual Report on Form 10-K with respect to our 2011 Annual Meeting of Shareholders.
SECURITIES ISSUABLE PURSUANT TO EQUITY COMPENSATION PLANS
As of December 31, 2010, no options or warrants to acquire our securities pursuant to equity compensation plans were outstanding. The following table sets forth the number of securities to be issued upon exercise of outstanding options, warrants and rights; weighted average exercise price of outstanding options, warrants and rights; and the number of securities remaining available for future issuance under our equity compensation plans as of December 31, 2010:
|
Plan Category
|
Number of securities to be issued upon exercise of outstanding options, warrants and rights
|
Weighted average exercise price of outstanding options, warrants and rights
|
Number of securities remaining available for future issuance under equity compensation plans(1)
|
|||
|
(a)
|
(b)
|
(c)
|
||||
|
Equity compensation plans approved by security holders
|
-
|
-
|
1,217,593
|
|||
|
Equity compensation plans not approved by security holders
|
-
|
-
|
-
|
|||
|
Total
|
-
|
-
|
1,217,593
|
|
|
(1)
|
Shares indicated are the aggregate of those issuable under the Company’s 2008 Equity Incentive Plan.
|
|
Item 13.
|
Certain Relationships and Related Transactions, and Trustee Independence
|
The required information is incorporated herein by reference from our definitive proxy statement to be filed with the Securities and Exchange Commission within 120 days after the end of the year covered by this Annual Report on Form 10-K with respect to our 2010 Annual Meeting of Shareholders.
|
Item 14.
|
Principal Accountant Fees and Services
|
The required information is incorporated herein by reference from our definitive proxy statement to be filed with the Securities and Exchange Commission within 120 days after the end of the year covered by this Annual Report on Form 10-K with respect to our 2011 Annual Meeting of Shareholders.
PART IV
|
Item 15.
|
Exhibits and Financial Statement Schedules
|
|
(a)
|
Documents filed as part of this report.
|
|
1.
|
Financial Statements:
|
The following financial statements are included in this report on pages 45 to 88:
Report of Independent Registered Public Accounting Firm
Consolidated Balance Sheets as of December 31, 2010 and 2009
Consolidated Statements of Operations for the years ended December 31, 2010, 2009 and 2008
Consolidated Statements of Equity and Comprehensive Income for the years ended December 31, 2010, 2009 and 2008
Consolidated Statements of Cash Flows for the years ended December 31, 2010, 2009 and 2008
Notes to Consolidated Financial Statements
|
2.
|
Financial Statement Schedules:
|
The following financial statement schedule is included in this report on pages 89 to 91: Schedule III - Real Estate and Accumulated Depreciation for the year ended December 31, 2010
|
3.
|
Exhibits
|
The following exhibits listed are filed as a part of this report:
|
Exhibit
|
|
|
No.
|
Description
|
|
3.1
|
Articles of Amendment and Restatement of the Declaration of Trust of Hersha Hospitality Trust, as amended and supplemented (filed as Exhibit 3.1 to the Quarterly Report on Form 10-Q for the quarter ended March 31, 2010, filed by Hersha Hospitality Trust on May 10, 2010 and incorporated by reference herein).
|
|
3.2
|
Amended and Restated Bylaws of Hersha Hospitality Trust (filed as Exhibit 3.2 to the Annual Report on Form 10-K for the year ended December 31, 2009, filed by Hersha Hospitality Trust on March 5, 2010 and incorporated by reference herein)
|
|
4.1
|
Form of Common Share Certificate.*
|
|
4.2
|
Junior Subordinated Indenture, dated as of May 13, 2005, between Hersha Hospitality Limited Partnership and JPMorgan Chase Bank, National Association, as trustee (filed as Exhibit 4.1 to the Current Report on Form 8-K filed by Hersha Hospitality Trust on May 17, 2005 and incorporated by reference herein).
|
|
4.3
|
Form of Junior Subordinated Note (included in Exhibit 4.2).
|
|
4.4
|
Amended and Restated Trust Agreement of Hersha Statutory Trust I, dated as of May 13, 2005, among Hersha Hospitality Limited Partnership, as depositor, JPMorgan Chase Bank, National Association, as property trustee, Chase Bank USA, National Association, as Delaware trustee, the Administrative Trustees named therein and the holders of undivided beneficial interests in the assets of Hersha Statutory Trust I (filed as Exhibit 4.2 to the Current Report on Form 8-K filed by Hersha Hospitality Trust on May 17, 2005 and incorporated by reference herein).
|
|
4.5
|
Form of Trust Preferred Security Certificate (included in Exhibit 4.4).
|
|
4.6
|
Junior Subordinated Indenture, dated as of May 31, 2005, between Hersha Hospitality Limited Partnership and Wilmington Trust Company, as trustee (filed as Exhibit 4.1 to the Current Report on Form 8-K filed by Hersha Hospitality Trust on June 6, 2005 and incorporated by reference herein).
|
|
4.7
|
Form of Junior Subordinated Note (included in Exhibit 4.6 hereto).
|
|
4.8
|
Amended and Restated Trust Agreement of Hersha Statutory Trust II, dated as of May 31, 2005, among Hersha Hospitality Limited Partnership, as depositor, Wilmington Trust Company, as property trustee and as Delaware trustee, the Administrative Trustees named therein and the holders of undivided beneficial interests in the assets of Hersha Statutory Trust II (filed as Exhibit 4.2 to the Current Report on Form 8-K filed by Hersha Hospitality Trust on June 6, 2005 and incorporated by reference herein).
|
|
4.9
|
Form of Trust Preferred Security Certificate (included in Exhibit 4.8 hereto).
|
|
Exhibit
|
|
|
No.
|
Description
|
|
4.10
|
Form of 8.00% Series A Cumulative Redeemable Preferred Share Certificate (filed as Exhibit 3.4 to the Form 8-A filed by Hersha Hospitality Trust on August 3, 2005 and incorporated by reference herein).
|
|
4.11
|
Investor Rights and Option Agreement, dated August 4, 2009, by and among Hersha Hospitality Trust, Real Estate Investment Group L.P. and IRSA Inversiones y Representaciones Sociedad Anonima (filed as Exhibit 10.2 to the Current Report on Form 8-K filed by Hersha Hospitality Trust on August 6, 2009 and incorporated by reference herein).†
|
|
4.12
|
Trustee Designation Agreement, dated August 4, 2009, by and among Hersha Hospitality Trust, Real Estate Investment Group L.P. and IRSA Inversiones y Representaciones Sociedad Anonima (filed as Exhibit 10.4 to the Current Report on Form 8-K filed by Hersha Hospitality Trust on August 6, 2009 and incorporated by reference herein).†
|
|
4.13
|
Amended and Restated Registration Rights Agreement, dated June 30, 2010, by and among Hersha Hospitality Trust, Real Estate Investment Group L.P., IRSA Inversiones y Representaciones Sociedad Anonima, Dolphin Fund Ltd. and Citibank, N.A. (filed as Exhibit 10.1 to the Current Report on Form 8-K filed by Hersha Hospitality Trust on June 30, 2010 and incorporated by reference herein).†
|
|
10.1
|
Amended and Restated Agreement of Limited Partnership of Hersha Hospitality Limited Partnership.*
|
|
10.2
|
Option Agreement, dated as of June 3, 1998, among Hasu P. Shah, Jay H. Shah, Neil H. Shah, Bharat C. Mehta, K.D. Patel, Rajendra O. Gandhi, Kiran P. Patel, David L. Desfor, Madhusudan I. Patni, Manhar Gandhi and Hersha Hospitality Limited Partnership.*†
|
|
10.3
|
Amendment to Option Agreement, dated December 4, 1998 (filed as Exhibit 10.19(a) to the Registration Statement on Form S-11/A filed by Hersha Hospitality Trust on December 7, 1998 and incorporated by reference herein).†
|
|
10.4
|
Administrative Services Agreement, dated January 26, 1999, between Hersha Hospitality Trust and Hersha Hospitality Management, L.P.*†
|
|
10.5
|
Second Amendment to the Amended and Restated Agreement of Limited Partnership of Hersha Hospitality Limited Partnership, dated as of April 21, 2003 (filed as Exhibit 10.2 to the Current Report on Form 8-K filed by Hersha Hospitality Trust on April 23, 2003 and incorporated by reference herein).
|
|
10.6
|
Second Amendment to Option Agreement (filed as Exhibit 10.15 to the Registration Statement on Form S-3 filed by Hersha Hospitality Trust on February 24, 2004 and incorporated by reference herein).
|
|
10.7
|
Membership Interests Contribution Agreement, dated June 15, 2005, by and among Waterford Hospitality Group, LLC, Mystic Hotel Investors, LLC and Hersha Hospitality Limited Partnership (Filed as Exhibit 10.1 to the Current Report on Form 8-K filed by Hersha Hospitality Trust on June 21, 2005 and incorporated by reference herein).
|
|
10.8
|
Form of Limited Liability Company Agreement of Mystic Partners, LLC (filed as Exhibit 10.2 to the Current Report on Form 8-K filed by Hersha Hospitality Trust on June 21, 2005 and incorporated by reference herein).
|
|
10.9
|
Form of Management Agreement between the lessee entity and Waterford Hotel Group, Inc. (filed as Exhibit 10.3 to the Current Report on Form 8-K filed by Hersha Hospitality Trust on June 21, 2005 and incorporated by reference herein).
|
|
10.10
|
Form of Limited Liability Company Agreement of Leaseco, LLC (filed as Exhibit 10.4 to the Current Report on Form 8-K filed by Hersha Hospitality Trust on June 21, 2005 and incorporated by reference herein.
|
|
10.11
|
Third Amendment to Agreement of Limited Partnership of Hersha Hospitality Limited Partnership, dated August 5, 2005 (filed as Exhibit 10.1 to the Current Report on Form 8-K filed by Hersha Hospitality Trust on August 8, 2005 and incorporated by reference herein).
|
|
10.12
|
Sixth Amendment to Membership Interests Contribution Agreement, dated February 8, 2006, by and among Hersha Hospitality Limited Partnership, Mystic Hotel Investors, LLC, Waterford Hospitality Group LLC and First American Title Insurance Company (filed as Exhibit 10.5 to the Current Report on Form 8-K filed by Hersha Hospitality Trust on February 14, 2006 and incorporated by reference herein).
|
|
10.13
|
First Amendment to Limited Liability Company Operating Agreement of Mystic Partners Leaseco, LLC, dated February 8, 2006 (filed as Exhibit 10.7 to the Current Report on Form 8-K filed by Hersha Hospitality Trust on February 14, 2006 and incorporated by reference herein).
|
|
Exhibit
|
|
|
No.
|
Description
|
|
10.14
|
Conditional Payment Guaranty, dated February 8, 2006, made by Hersha Hospitality Limited Partnership and Mystic Hotel Investors, LLC to and for the benefit of Merrill Lynch Capital (filed as Exhibit 10.8 to the Current Report on Form 8-K filed by Hersha Hospitality Trust on February 14, 2006 and incorporated by reference herein).
|
|
10.15
|
Conditional Payment Guaranty, dated February 8, 2006, made by Hersha Hospitality Limited Partnership and Mystic Hotel Investors, LLC to and for the benefit of Merrill Lynch Capital (filed as Exhibit 10.9 to the Current Report on Form 8-K filed by Hersha Hospitality Trust on February 14, 2006 and incorporated by reference herein).
|
|
10.16
|
Supplemental Limited Joinder, dated February 8, 2006, made by Hersha Hospitality Limited Partnership and Mystic Hotel Investors LLC (filed as Exhibit 10.10 to the Current Report on Form 8-K filed by Hersha Hospitality Trust on February 14, 2006 and incorporated by reference herein).
|
|
10.17
|
Amended and Restated Employment Agreement, dated June 28, 2007, by and between the Company and Hasu P. Shah (filed as Exhibit 10.1 to the Current Report on Form 8-K filed by Hersha Hospitality Trust on July 3, 2007 and incorporated by reference herein).†
|
|
10.18
|
Amended and Restated Employment Agreement, dated June 28, 2007, by and between the Company and Jay H. Shah (filed as Exhibit 10.2 to the Current Report on Form 8-K filed by Hersha Hospitality Trust on July 3, 2007 and incorporated by reference herein).†
|
|
10.19
|
Amended and Restated Employment Agreement, dated June 28, 2007, by and between the Company and Neil H. Shah (filed as Exhibit 10.3 to the Current Report on Form 8-K filed by Hersha Hospitality Trust on July 3, 2007 and incorporated by reference herein).†
|
|
10.20
|
Amended and Restated Employment Agreement, dated June 28, 2007, by and between the Company and Ashish R. Parikh (filed as Exhibit 10.4 to the Current Report on Form 8-K filed by Hersha Hospitality Trust on July 3, 2007 and incorporated by reference herein).†
|
|
10.21
|
Amended and Restated Employment Agreement, dated June 28, 2007, by and between the Company and Michael R. Gillespie (filed as Exhibit 10.4 to the Current Report on Form 8-K filed by Hersha Hospitality Trust on July 3, 2007 and incorporated by reference herein).†
|
|
10.22
|
Hersha Hospitality Trust 2008 Equity Incentive Plan (filed as Appendix B to the Company’s Definitive Proxy Statement on Schedule 14A, filed by Hersha Hospitality Trust on April 18, 2008 and incorporated by reference herein).†
|
|
10.23
|
Form of Stock Award Agreement under the Hersha Hospitality Trust 2008 Equity Incentive Plan (filed as Exhibit 10.2 to the Current Report on Form 8-K filed on May 29, 2008 and incorporated by reference herein).†
|
|
10.24
|
Form of Performance Share Award Agreement under the Hersha Hospitality Trust 2008 Equity Incentive Plan (filed as Exhibit 10.1 to the Quarterly Report on Form 10-Q for the quarter ended September 30, 2009 filed by Hersha Hospitality Trust on November 5, 2009 and incorporated by reference herein).†
|
|
10.25
|
Amendment No. 1 to the Hersha Hospitality Trust 2008 Equity Incentive Plan (filed as Appendix A to the Definitive Proxy Statement on Schedule 14A filed by Hersha Hospitality Trust on April 15, 2010 and incorporated by reference herein).†
|
|
10.26
|
Revolving Credit Loan and Security Agreement, dated November 5, 2010, by and among Hersha Hospitality Limited Partnership, as Borrower, Hersha Hospitality Trust, as Guarantor, each of the other Guarantors party thereto, each of the financial institutions identified as Lenders on Schedule A thereto, TD Bank, N.A., as Lender and as administrative agent for the Lenders thereunder, and TD Securities (USA) LLC, as arranger (filed as Exhibit 10.2 to the Quarterly Report on Form 10-Q for the quarter ended September 30, 2010 filed by Hersha Hospitality Trust on November 5, 2010 and incorporated by reference herein).
|
|
Statement Regarding Computation of Ratio of Per Statement Regarding the Computation of Ratio of Earnings to Combined Fixed Charges and Preferred Share Dividends.**
|
|
Exhibit
|
|
|
No.
|
Description
|
|
List of Subsidiaries of the Registrant.**
|
|
|
Consent of KPMG LLP.**
|
|
|
Certification of Chief Executive Officer pursuant to Section 302 of the Sarbanes-Oxley Act of 2002.**
|
|
|
Certification of Chief Financial Officer pursuant to Section 302 of the Sarbanes-Oxley Act of 2002.**
|
|
|
Certification of Chief Executive Officer pursuant to Section 906 of the Sarbanes-Oxley Act of 2002.**
|
|
|
Certification of Chief Financial Officer pursuant to Section 906 of the Sarbanes-Oxley Act of 2002.**
|
|
|
*
|
Filed as an exhibit to Hersha Hospitality Trust’s Registration Statement on Form S-11, as amended, filed June 5, 1998 and incorporated by reference herein.
|
|
**
|
Filed herewith.
|
|
†
|
Indicates management contract or compensatory plan or arrangement.
|
SIGNATURES
Pursuant to the requirements of Section 13 or 15(d) of the Securities Exchange Act of 1934, the registrant has duly caused this report to be signed on its behalf by the undersigned, thereunto duly authorized.
|
|
HERSHA HOSPITALITY TRUST
|
|
|
|
|
|
|
March 3, 2011
|
/s/ Jay H. Shah
|
|
|
|
Jay H. Shah
|
|
|
|
Chief Executive Officer
|
|
Pursuant to the requirements of the Securities Exchange Act of 1934, this report has been signed below by the following persons on behalf of the registrant and in the capacities and on the dates indicated.
|
Signature
|
Title
|
Date
|
||
|
/s/ Hasu P. Shah
|
Chairman and Trustee
|
March 3, 2011
|
||
|
Hasu P. Shah
|
||||
|
/s/ Jay H. Shah
|
Chief Executive Officer and Trustee
(Principal Executive Officer)
|
March 3, 2011
|
||
|
Jay H. Shah
|
||||
|
/s/ Neil H. Shah
|
President and Chief Operating Officer
(Chief Operating Officer)
|
March 3, 2011
|
||
|
Neil H. Shah
|
||||
|
/s/ Ashish R. Parikh
|
Chief Financial Officer
(Principal Financial Officer)
|
March 3, 2011
|
||
|
Ashish R. Parikh
|
||||
|
/s/ Michael R. Gillespie
|
Chief Accounting Officer
(Principal Accounting Officer)
|
March 3, 2011
|
||
|
Michael R. Gillespie
|
||||
|
/s/ Donald J. Landry
|
Trustee
|
March 3, 2011
|
||
|
Donald J. Landry
|
||||
|
/s/ Thomas S. Capello
|
Trustee
|
March 3, 2011
|
||
|
Thomas S. Capello
|
||||
|
/s/ Eduardo S. Elsztain
|
Trustee
|
March 3, 2011
|
||
|
Eduardo S. Elsztain
|
||||
|
/s/ Thomas J. Hutchison III
|
Trustee
|
March 3, 2011
|
||
|
Thomas J. Hutchison III
|
||||
|
/s/ Dianna F. Morgan
|
Trustee
|
March 3, 2011
|
||
|
Dianna F. Morgan
|
||||
|
/s/ Kiran P. Patel
|
Trustee
|
March 3, 2011
|
||
|
Kiran P. Patel
|
||||
|
/s/ John M. Sabin
|
Trustee
|
March 3, 2011
|
||
|
John M. Sabin
|
100