Attached files
| file | filename |
|---|---|
| EX-99.3 - EX-99.3 - ROSETTA STONE INC | a11-6886_1ex99d3.htm |
| EX-99.1 - EX-99.1 - ROSETTA STONE INC | a11-6886_1ex99d1.htm |
| 8-K - 8-K - ROSETTA STONE INC | a11-6886_18k.htm |
Exhibit 99.2
|
|
Fourth Quarter and Full-Year Results February 28, 2011 |
|
|
Our presentation today contains forward-looking statements about our plans for development and release of new products and for business expansion, as well as other subjects. These statements relate to future events and involve known and unknown risks and uncertainties that may cause our actual results to be materially different from those expressed or implied by these forward-looking statements. You should not place undue reliance on forward-looking statements because they involve factors that are, in some cases, beyond our control and that could materially affect actual results, levels of activity, performance, or achievements. Factors that could materially affect actual results include those listed under the caption “Risk Factors” of Rosetta Stone’s Form 10-K dated March 10, 2010. We encourage you to review those factors before making any investment decision. Today’s presentation and discussion reflect our views as of February 28, 2011, and Rosetta Stone assumes no duty to update the information. Today’s presentation and discussion also contains references to non-GAAP financial measures. The full definition and reconciliation of those measures is available in our Form 8-K filed with the SEC on February 28, 2011. Management uses these non-GAAP measures to compare the company's performance to that of prior periods for trend analyses, for purposes of determining executive incentive compensation, and for budgeting and planning purposes. Management believes that the use of these non-GAAP financial measures provides an additional tool for investors to use in evaluating ongoing operating results and trends. Our definitions of non-GAAP measures may not be comparable to the definitions used by other companies, and we encourage you to review and understand all our financial reporting before making any investment decision. Reminder |
|
|
Tom Adams President and CEO February 28, 2011 |
|
|
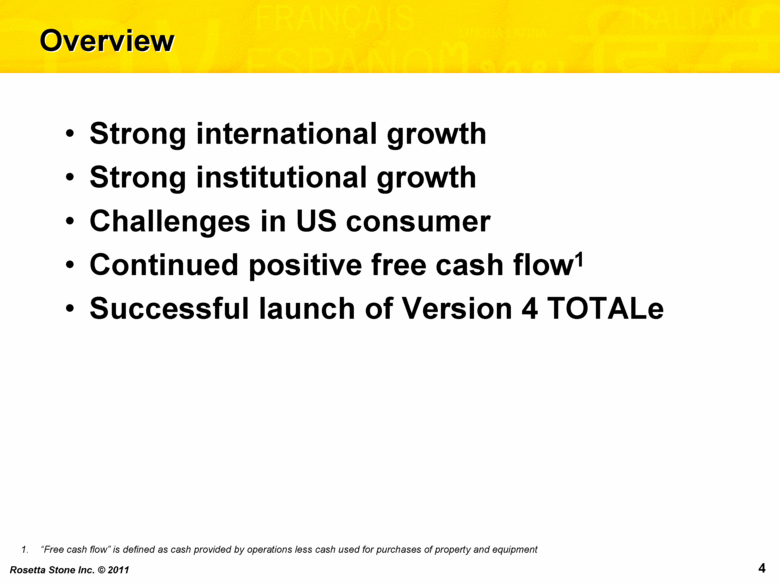
Overview Strong international growth Strong institutional growth Challenges in US consumer Continued positive free cash flow1 Successful launch of Version 4 TOTALe “Free cash flow” is defined as cash provided by operations less cash used for purchases of property and equipment |
|
|
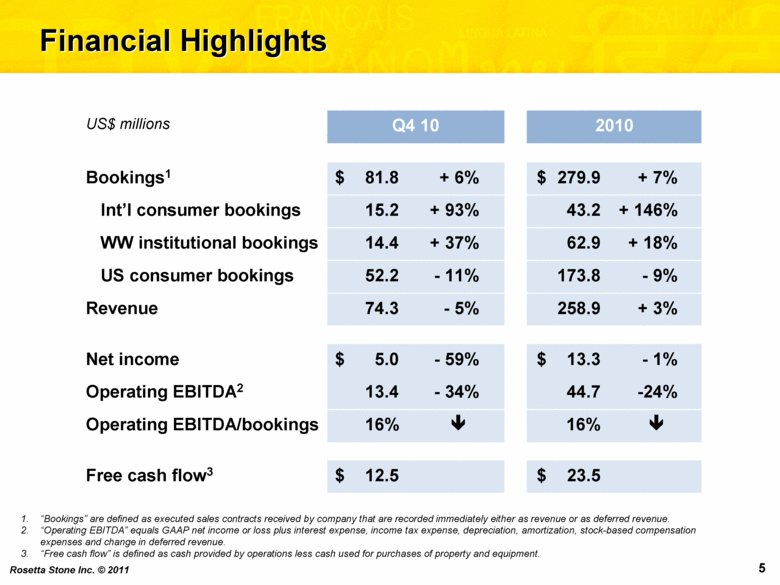
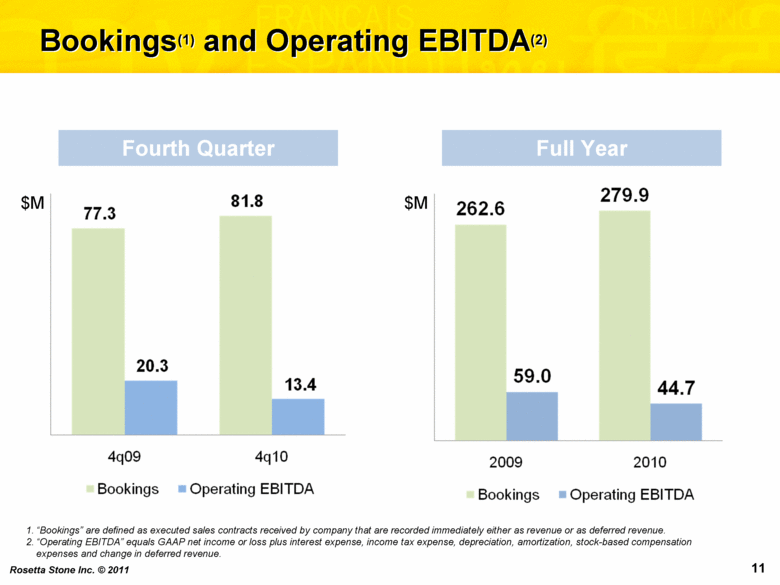
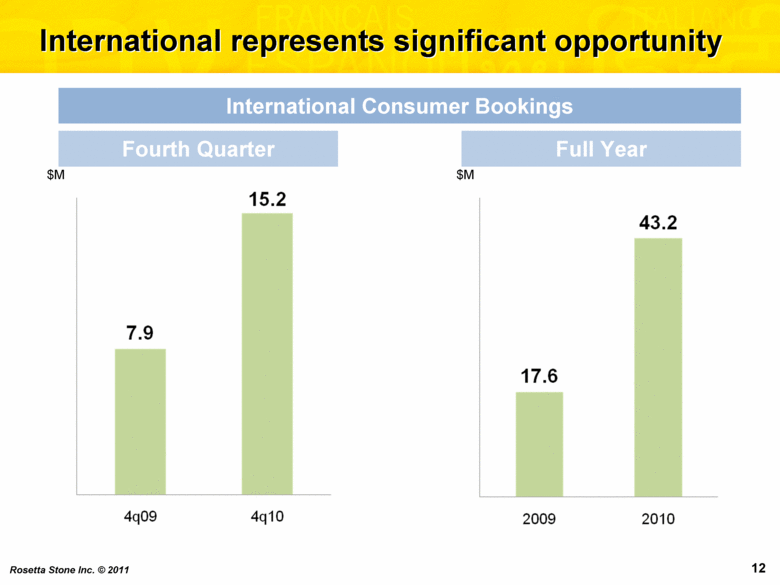
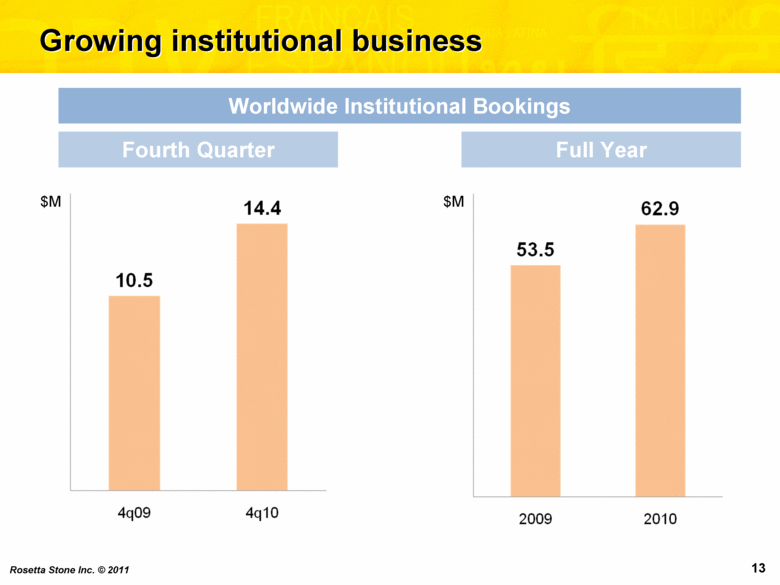
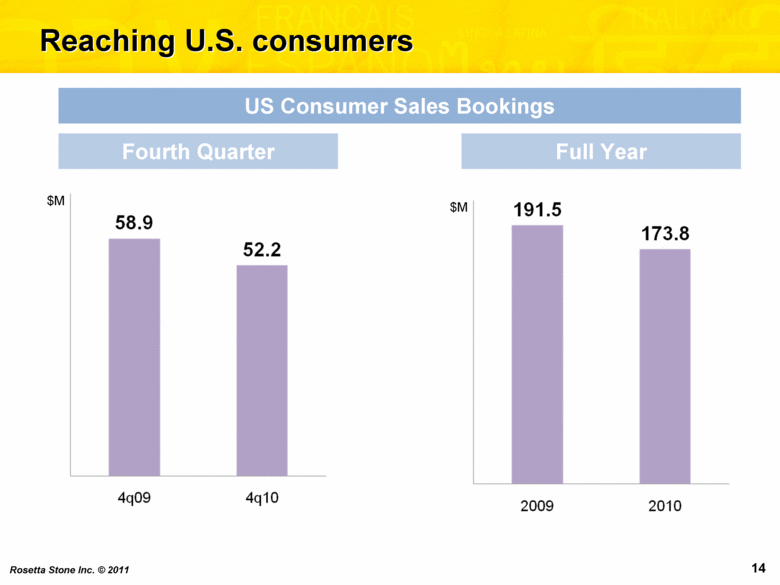
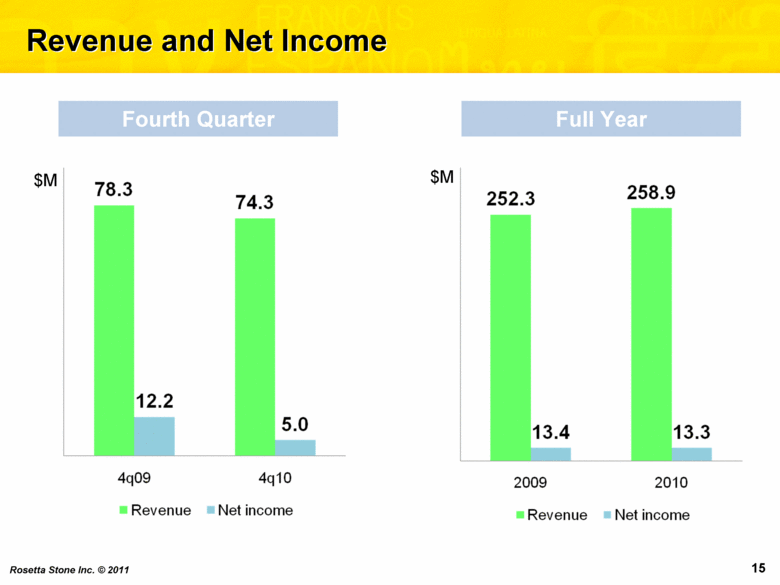
Financial Highlights US$ millions Q4 10 2010 Bookings1 $ 81.8 + 6% $ 279.9 + 7% Int’l consumer bookings 15.2 + 93% 43.2 + 146% WW institutional bookings 14.4 + 37% 62.9 + 18% US consumer bookings 52.2 - 11% 173.8 - 9% Revenue 74.3 - 5% 258.9 + 3% Net income $ 5.0 - 59% $ 13.3 - 1% Operating EBITDA2 13.4 - 34% 44.7 -24% Operating EBITDA/bookings 16% 16% Free cash flow3 $ 12.5 $ 23.5 “Bookings” are defined as executed sales contracts received by company that are recorded immediately either as revenue or as deferred revenue. “Operating EBITDA” equals GAAP net income or loss plus interest expense, income tax expense, depreciation, amortization, stock-based compensation expenses and change in deferred revenue. “Free cash flow” is defined as cash provided by operations less cash used for purchases of property and equipment. |
|
|
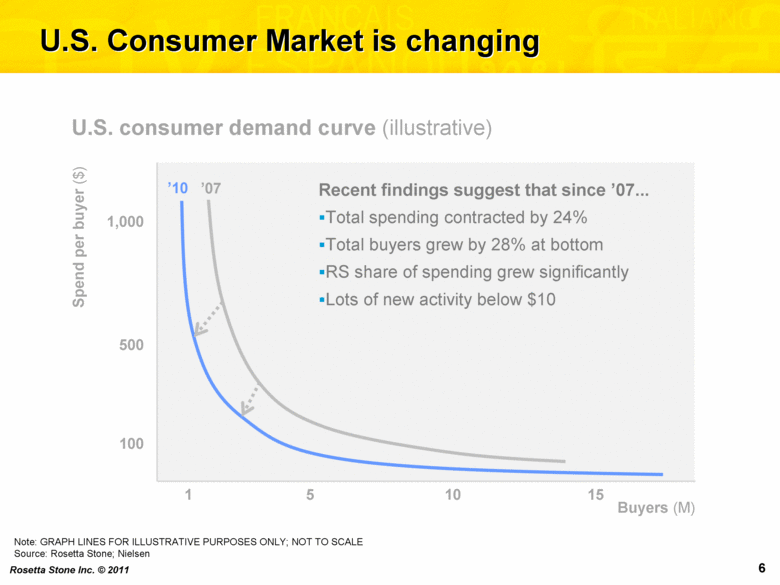
U.S. Consumer Market is changing Buyers (M) Spend per buyer ($) U.S. consumer demand curve (illustrative) 1,000 500 100 Note: GRAPH LINES FOR ILLUSTRATIVE PURPOSES ONLY; NOT TO SCALE Source: Rosetta Stone; Nielsen 1 5 10 15 Recent findings suggest that since ’07 Total spending contracted by 24% Total buyers grew by 28% at bottom RS share of spending grew significantly Lots of new activity below $10 ’10 ’07 |
|
|
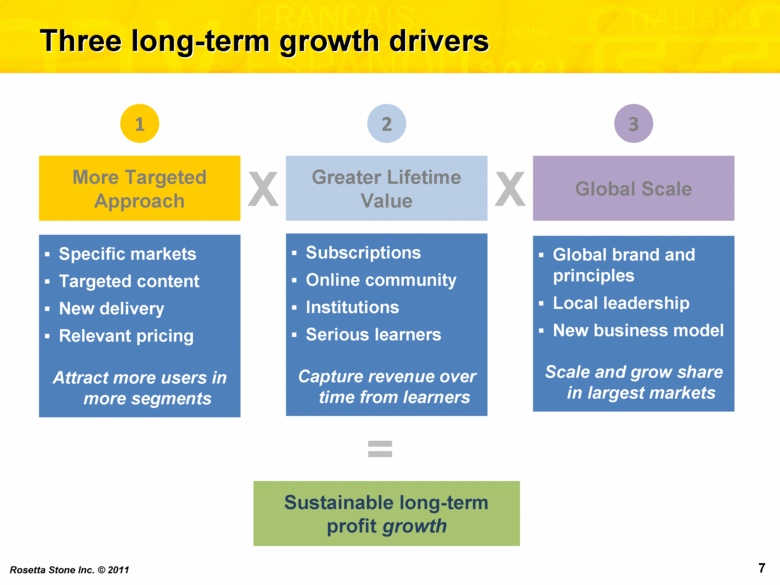
Three long-term growth drivers More Targeted Approach Greater Lifetime Value Global Scale X X Specific markets Targeted content New delivery Relevant pricing Attract more users in more segments = Sustainable long-term profit growth 1 2 3 Global brand and principles Local leadership New business model Scale and grow share in largest markets Subscriptions Online community Institutions Serious learners Capture revenue over time from learners |
|
|
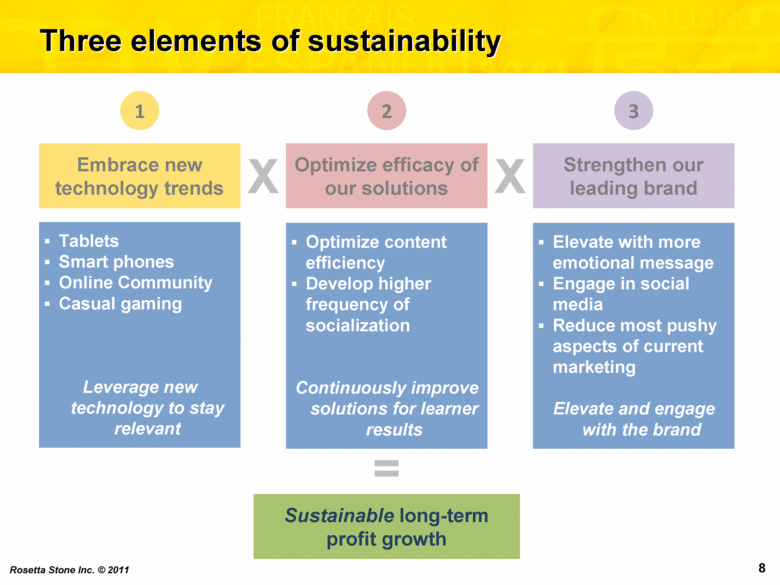
Three elements of sustainability Embrace new technology trends Optimize efficacy of our solutions Strengthen our leading brand X X Tablets Smart phones Online Community Casual gaming Leverage new technology to stay relevant = Optimize content efficiency Develop higher frequency of socialization Continuously improve solutions for learner results 1 2 3 Elevate with more emotional message Engage in social media Reduce most pushy aspects of current marketing Elevate and engage with the brand Sustainable long-term profit growth |
|
|
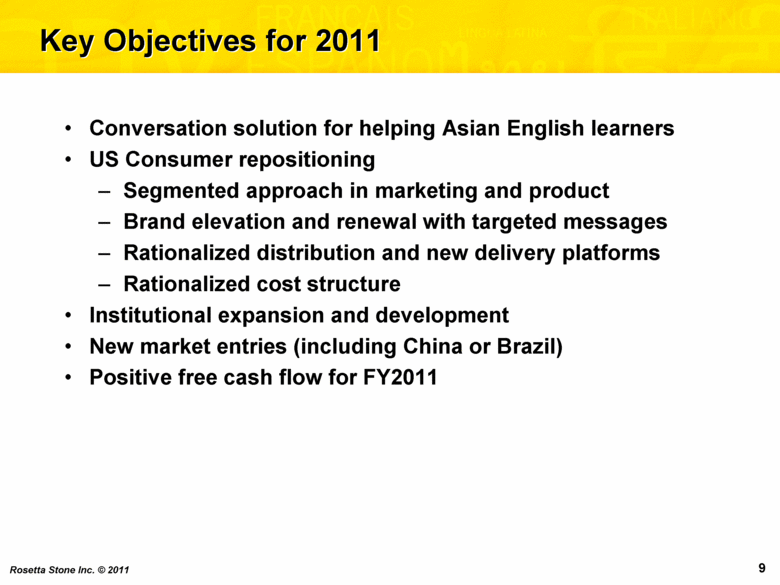
Key Objectives for 2011 Conversation solution for helping Asian English learners US Consumer repositioning Segmented approach in marketing and product Brand elevation and renewal with targeted messages Rationalized distribution and new delivery platforms Rationalized cost structure Institutional expansion and development New market entries (including China or Brazil) Positive free cash flow for FY2011 |
|
|
Steve Swad Chief Financial Officer February 28, 2011 |
|
|
Bookings(1) and Operating EBITDA(2) $M $M Full Year Fourth Quarter “Bookings” are defined as executed sales contracts received by company that are recorded immediately either as revenue or as deferred revenue. “Operating EBITDA” equals GAAP net income or loss plus interest expense, income tax expense, depreciation, amortization, stock-based compensation expenses and change in deferred revenue. |
|
|
International represents significant opportunity $M Full Year Fourth Quarter $M International Consumer Bookings |
|
|
Growing institutional business $M Full Year Fourth Quarter $M Worldwide Institutional Bookings |
|
|
Reaching U.S. consumers $M Full Year Fourth Quarter $M US Consumer Sales Bookings |
|
|
Revenue and Net Income $M Fourth Quarter $M Full Year |
|
|
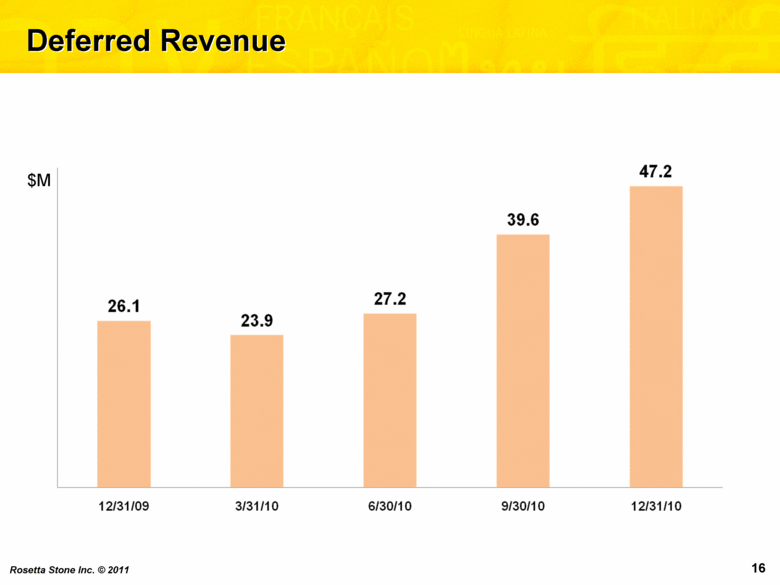
Deferred Revenue $M |
|
|
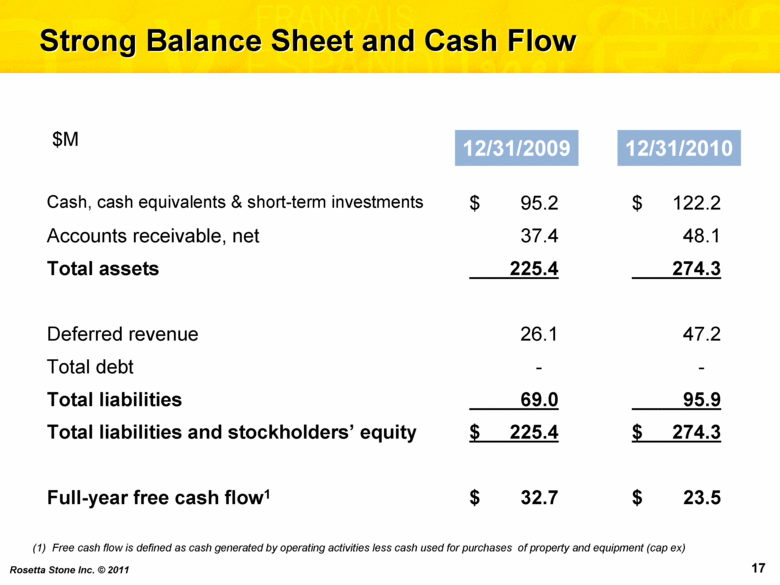
Strong Balance Sheet and Cash Flow 12/31/2009 12/31/2010 Cash, cash equivalents & short-term investments $ 95.2 $ 122.2 Accounts receivable, net 37.4 48.1 Total assets 225.4 274.3 Deferred revenue 26.1 47.2 Total debt - - Total liabilities 69.0 95.9 Total liabilities and stockholders’ equity $ 225.4 $ 274.3 Full-year free cash flow1 $ 32.7 $ 23.5 $M Free cash flow is defined as cash generated by operating activities less cash used for purchases of property and equipment (cap ex) |
|
|
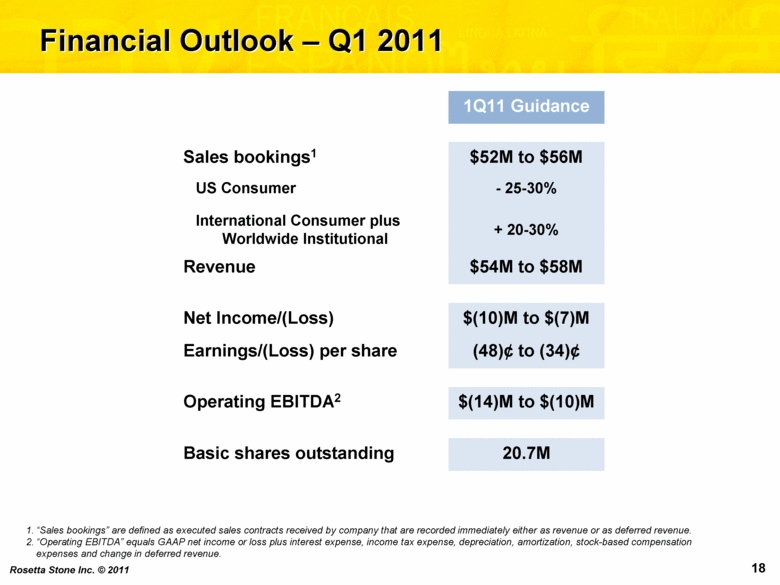
Financial Outlook – Q1 2011 1Q11 Guidance Sales bookings1 $52M to $56M US Consumer - 25-30% International Consumer plus Worldwide Institutional + 20-30% Revenue $54M to $58M Net Income/(Loss) $(10)M to $(7)M Earnings/(Loss) per share (48)¢ to (34)¢ Operating EBITDA2 $(14)M to $(10)M Basic shares outstanding 20.7M “Sales bookings” are defined as executed sales contracts received by company that are recorded immediately either as revenue or as deferred revenue. “Operating EBITDA” equals GAAP net income or loss plus interest expense, income tax expense, depreciation, amortization, stock-based compensation expenses and change in deferred revenue. |
|
|
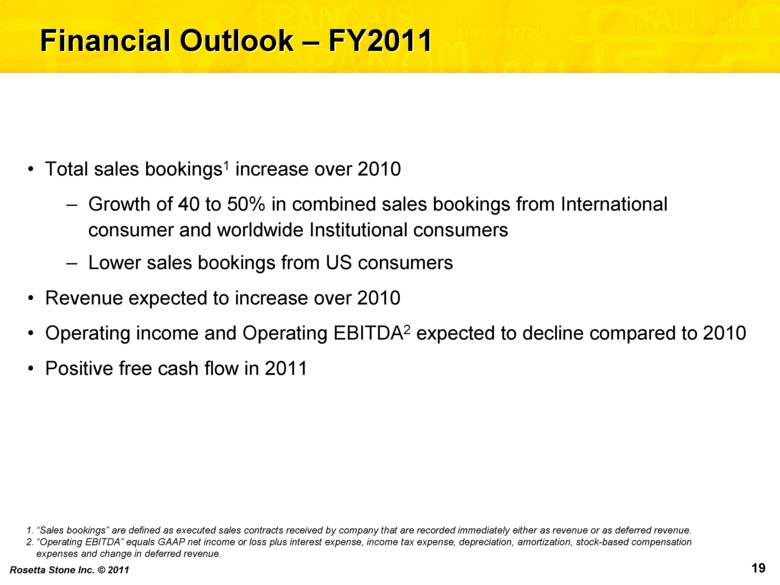
Financial Outlook – FY2011 Total sales bookings1 increase over 2010 Growth of 40 to 50% in combined sales bookings from International consumer and worldwide Institutional consumers Lower sales bookings from US consumers Revenue expected to increase over 2010 Operating income and Operating EBITDA2 expected to decline compared to 2010 Positive free cash flow in 2011 “Sales bookings” are defined as executed sales contracts received by company that are recorded immediately either as revenue or as deferred revenue. “Operating EBITDA” equals GAAP net income or loss plus interest expense, income tax expense, depreciation, amortization, stock-based compensation expenses and change in deferred revenue. |


