Attached files
| file | filename |
|---|---|
| 8-K - FORM 8-K - Mattersight Corp | d8k.htm |
| EX-99.1 - PRESS RELEASE, DATED FEBRUARY 16, 2011 - Mattersight Corp | dex991.htm |
 REVOLUTIONARY
ANALYTICS.
BREAKTHROUGH
RESULTS.™
eLoyalty
Q4 2010
Earnings Webinar
February 16, 2011
Exhibit 99.2 |
 REVOLUTIONARY
ANALYTICS.
BREAKTHROUGH
RESULTS.™
eLoyalty
Confidential
and
Restricted
©
2010
eLoyalty
Corporation
2
Safe Harbor Language
During today’s call we will be making both historical and
forward-looking statements in order to help you better
understand our business. These forward-looking statements
include references to our plans, intentions, expectations,
beliefs, strategies and objectives. Any forward-looking
statements speak only as of today’s date. In addition, these
forward-looking statements are subject to risks and
uncertainties that could cause actual results to differ
materially from those stated or implied by the forward-
looking statements. The risks and uncertainties associated
with our business are highlighted in our filings with the SEC,
including our Annual Report filed on Form 10-K for the year
ended December 26, 2009, our quarterly reports on Form
10-Q, as well as our press release issued earlier today.
eLoyalty
undertakes no obligation to publicly update or
revise any forward-looking statements in this call. Also, be
advised that this call is being recorded and is copyrighted by
eLoyalty
Corporation. |
 Agenda
Q4 Overview
Behavioral Analytics Overview
Q1 Guidance
Q&A |
 REVOLUTIONARY
ANALYTICS.
BREAKTHROUGH
RESULTS.™
eLoyalty
Confidential
and
Restricted
©
2010
eLoyalty
Corporation
Q4 Overview…Strong Performance Across the Board
Signed $37.9 million of Managed Services contracts in the
fourth quarter
Increased
Managed
Services
Backlog
2
to
a
record
$130.3
million, up 49% on year over year basis
Grew Services revenues 3% on an adjusted sequential basis
Grew Managed Services revenues 3% on an adjusted
sequential basis
Achieved
$0.4
million
of
Adjusted
Earnings
1
Generated $5.5 million of cash
4 |
 REVOLUTIONARY
ANALYTICS.
BREAKTHROUGH
RESULTS.™
eLoyalty
Confidential
and
Restricted
©
2010
eLoyalty
Corporation
Business Unit Highlights
Behavioral
Analytics™
Service
Highlights
–
$32.7 million in bookings
–
Contract for an initial deployment with a leading energy retailer
–
Contracts with three new business units of existing customers
–
Two contracts for new applications with existing customers
–
Expansion contracts at two existing customers
–
Two large renewal contracts
ICS Highlights
–
Achieved significant Business Unit profitability
–
Signed $5.2 million of Managed Services contracts
–
Grew Services revenues 3%
on an adjusted sequential basis
–
Grew Managed Services revenues 6% on an adjusted sequential
basis
5 |
 REVOLUTIONARY
ANALYTICS.
BREAKTHROUGH
RESULTS.™
eLoyalty
Confidential
and
Restricted
©
2010
eLoyalty
Corporation
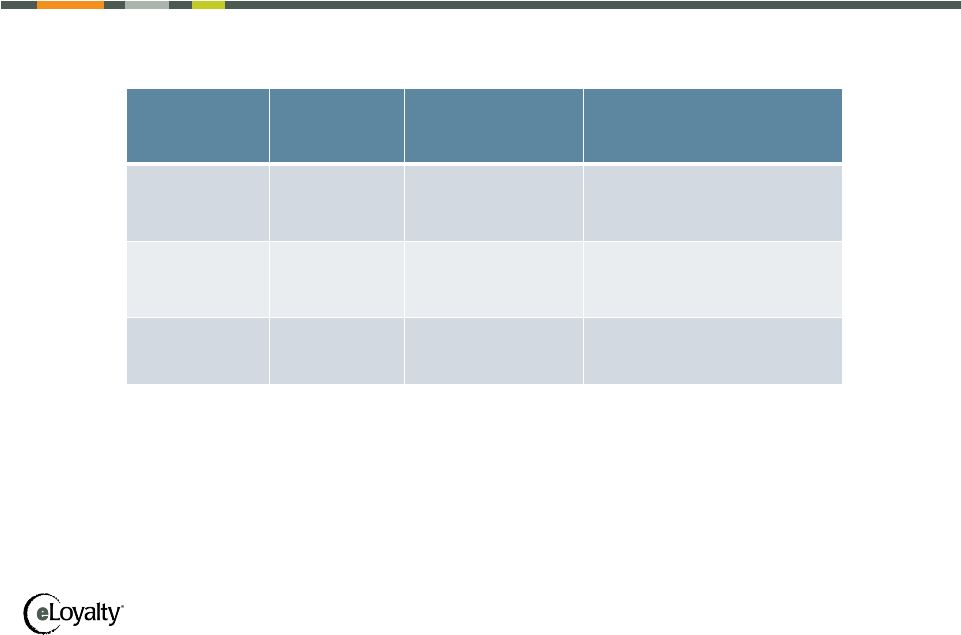
Impact of a 14 Week Quarter
Background
–
Our normal quarterly accounting cycle is 13 weeks
–
As this cycle does not exactly line up with a calendar year, every
6
th
year
we
have
a
14
th
week
in
our
4
th
quarter
Impact on Q4 Results
6
Q4
As
Reported
“14th
Week”
Impact
Adjusted
Results
Comments
Managed
Services
Revenues
$14.7m
$0.7m
$14.0m
Grew
3%
sequentially,
net
of
14
th
week
Consulting
Revenues
$4.7m
$0.1m
$4.6m
Grew
2%
sequentially,
net
of
14
th
week
Adjusted
Earnings¹
$0.4m
$(0.3)m
$0.7m |
 REVOLUTIONARY
ANALYTICS.
BREAKTHROUGH
RESULTS.™
eLoyalty
Confidential
and
Restricted
©
2010
eLoyalty
Corporation
Cash Flow and Headcount
Increased total cash $5.5 million in the fourth quarter
–
$5.5 million increase in Unearned Revenues due to client
prepayments of Managed Services contracts
–
$1.5 million decrease in A/R driven by a reduction in our DSO
from 39 to 34 days
–
$1.8 million decrease in A/P
Headcount
–
Ending headcount was 369 employees
–
Headcount was down 17 from the end of the third quarter
–
The reduction in headcount was principally driven by attrition
associated with declining legacy revenues
7 |
 REVOLUTIONARY
ANALYTICS.
BREAKTHROUGH
RESULTS.™
eLoyalty
Confidential
and
Restricted
©
2010
eLoyalty
Corporation
8
Managed Services Backlog²
Review
Metric
Q4
Sequential 2010
Change
Year/Year Change
Behavioral
Analytics™
Service
$84.5m
44%
34%
ICS
$45.8m
-5%
86%
Total
Backlog²
$130.3m
22%
49%
Q4 Managed Services Backlog²
Factors Impacting Q4 Backlog²
-
Signed $32.7 million of Behavioral Analytics™
Managed
Services
contracts in Q4
-
Signed $5.2 million of ICS Managed Services contracts in Q4 |
 Agenda
Behavioral Analytics Overview
Q1 Guidance
Q&A
Q4 Overview |
 REVOLUTIONARY
ANALYTICS.
BREAKTHROUGH
RESULTS.™
eLoyalty
Confidential
and
Restricted
©
2010
eLoyalty
Corporation
Behavioral
Analytics™
Service:
An
Enterprise
Managed Analytics Service
10
Capture
Conversations
Desktop Data
Context Data
Analyze
~2 million algorithms…growing 1%/week
Delivered as a Service
Managed in a highly secure environment
Create Value
Contact Center
Service, Sales
and Desktop
Analytics
Customer
Retention
Fraud
Back Office
Analytics
Collections |
 REVOLUTIONARY
ANALYTICS.
BREAKTHROUGH
RESULTS.™
eLoyalty
Confidential
and
Restricted
©
2010
eLoyalty
Corporation
Key Q4 Deals
Customer
Type
Application
Amount
Comment
Utilities
Service
New Logo
and Collections
$3.1m
$1 million Prepayment
HMO
Service and Desktop New Business Unit
Analytics
$4.5m
First Entrée into Provider
Area and is
Important to Penetrating the Back Office
P&C
New Business Unit
Customer Retention
$0.8m
First Entrée Into Claims Area Which Has
5,000+ Seats
P&C
New Application
Desktop Analytics
$1.4m
Gaining Momentum with Desktop Analytics
Banking
Expansion
Collections
$1.4m
Approved Based on Strong Year 1 Results
HMO
Renewal
Service
$10.7m
Renews Contract Through 2014…~$3 million
Annual Prepayment in January
PBM
Renewal
Service
$6.1m
Renews Contract Through 2013
11 |
 REVOLUTIONARY
ANALYTICS.
BREAKTHROUGH
RESULTS.™
eLoyalty
Confidential
and
Restricted
©
2010
eLoyalty
Corporation
Growth Strategies
Goal
Target
Strategy
One
Strategy
Two
Strategy
Three
Create Mega
Accounts
($5m -$10m Per
Year)
1.
P&C 1
2.
P&C 2
3.
P&C 3
4.
Retail Bank 1
5.
HMO 1
6.
HMO 2
7.
Gov’t
Agency
8.
PBM 1
Create Enterprise
Applications
(Fraud; Retention)
Sell Significant
Add Ons
(Desktop Analytics;
Back Office)
Expand Account
Teams at Key
Accounts
Penetrate New
Logos in Target
Verticals
1.
P&C
2.
HMO
3.
Banking
4.
Brokerage
5.
Telco
Expand Sales Force
Leverage New
Applications
(Fraud; Back Office;
Customer Retention)
Explore Strategic
Partnerships
Open Up New
Geographies
1.
Canada
2.
UK
3.
Other English
Leverage Fraud
Application
Penetrate Target
Accounts
Explore Strategic
Partnerships
12 |
 REVOLUTIONARY
ANALYTICS.
BREAKTHROUGH
RESULTS.™
eLoyalty
Confidential
and
Restricted
©
2010
eLoyalty
Corporation
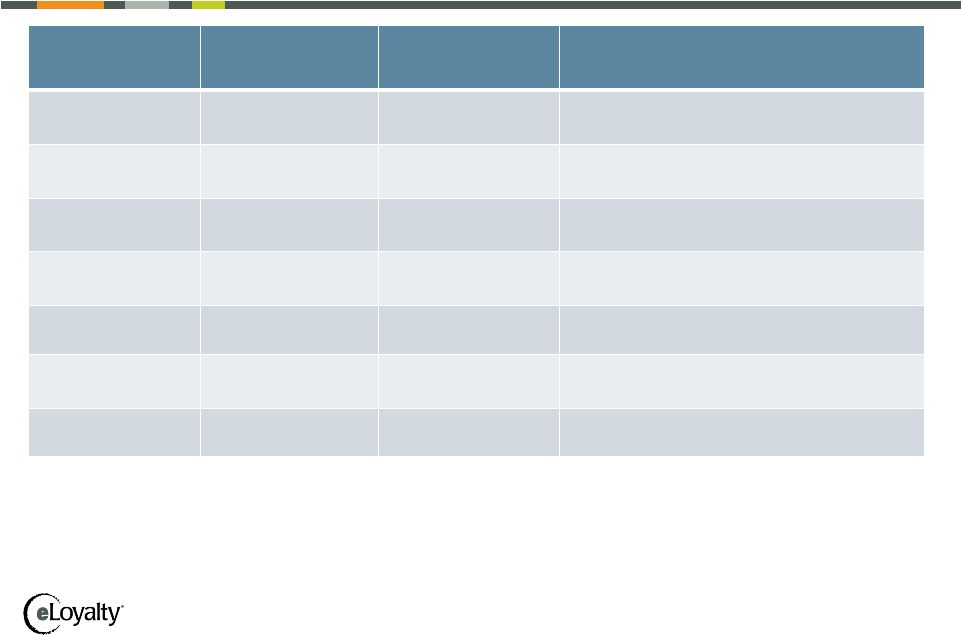
Continued Solution Adoption and Expansion
Significant Account Penetration & Value Creation
Expanding Large Accounts and Driving Huge Business
Value
13
Customer
Service
Sales
Collections
Desktop
Analytics
Predictive
Modeling
FCR
Fraud
Back
Office
Top 3 P&C
X
X
X
X
Top 3 Retail
Bank
X
X
X
X
X
X
X
Top 3 HMO
X
X
X
X
X
Initial
Deployment
Total
Bookings
Est. 2011
Revenue
Est. Annual
Benefit
Top 3 P&C
2009
$15.2M
$3.5M
$20M
Top 3 Retail
Bank
2007
$10.7M
$3.5M
$25M
Top 3 HMO
2005
$20.6M
$2.5M
$20M |
 REVOLUTIONARY
ANALYTICS.
BREAKTHROUGH
RESULTS.™
eLoyalty
Confidential
and
Restricted
©
2010
eLoyalty
Corporation
Driving Business Value is the Core of Our Service
Application
Seats
Results
HMO Service
3,600
Reduced
Average Talk Time by 1:17
Reduced callbacks by 11% in 6 months
Generated $20m/year cost savings
Large Government
Agency Service
4,500
Reduced
Average Talk Time by 1:25
Used calls and customer date to highlight medical fraud
P&C Sales
900
Increased sales acceptance rate by 45% in 6 months
Generating $1m/month incremental revenues
Banking
Collections
200
Improved Collector throughput by ~15%
Increased Collections by ~$20k/Collector
Generated $3.8m in incremental collections in Year 1
Banking Fraud
700
Identified that ~1:7,000 callers are fraudsters
Generated 3X+ return in first 2 months of deployment
14 |
 REVOLUTIONARY
ANALYTICS.
BREAKTHROUGH
RESULTS.™
eLoyalty
Confidential
and
Restricted
©
2010
eLoyalty
Corporation
BA Milestones Accomplished, Challenges Ahead
15
Closed P&C 2
Closed 1st Fraud Deal
Closed Medicare Fraud Deal
Signed HMO Renewal
Booked $32.7m
Closed Large Expansions
Opened New Opportunities
Signed 2 Large Renewals
Hired 1 BD
Deploy Q4 Deals
Close Key Deals
Deploy Back Office Pilot
Hire 6-9 BDs
Q3
2010
Q4
2010
Q1/Q2
2011 |
 Agenda
Q4 Overview
Behavioral Analytics Overview
Q1 Guidance
Q&A |
 REVOLUTIONARY
ANALYTICS.
BREAKTHROUGH
RESULTS.™
eLoyalty
Confidential
and
Restricted
©
2010
eLoyalty
Corporation
Q1 2011 Guidance
Background on Q1 Outlook
–
Sequential revenue comparisons will be impacted by Q4 having
14 weeks
–
Consulting revenues will be down sequentially related to the
impact of normal project cycles
–
The impact of the new Behavioral Analytics contracts will begin in
Q2 and are expected to be fully ramped up by Q3
We currently expect that our Q1 Services revenues will be
$17.5 million
17 |
 Agenda
Q4 Overview
Behavioral Analytics Overview
Q1 Guidance
Q&A |
 REVOLUTIONARY
ANALYTICS.
BREAKTHROUGH
RESULTS.™
eLoyalty
Confidential
and
Restricted
©
2010
eLoyalty
Corporation
19
Thank You
Kelly Conway
–
(847) 582-7200
–
Kelly_Conway@eLoyalty.com
Bill Noon
–
(847) 582-7019
–
Bill_Noon@eLoyalty.com |
 REVOLUTIONARY
ANALYTICS.
BREAKTHROUGH
RESULTS.™
eLoyalty
Confidential
and
Restricted
©
2010
eLoyalty
Corporation
20
Notes
1
eLoyalty
presents
Adjusted
Earnings,
a
non-GAAP
measure
that
represents
cash
earnings
performance,
excluding
the
impact
of
non-cash
expenses
and
expense
reduction
activities,
because
management
believes
that
Adjusted
Earnings
provide
investors
with
a
better
understanding
of
the
results
of
eLoyalty’s
operations.
Management
believes
that
Adjusted
Earnings
reflect
eLoyalty’s
resources
available
to
invest
in
its
business
and
strengthen
its
balance
sheet.
In
addition,
expense
reduction
activities
can
vary
significantly
between
periods
on
the
basis
of
factors
that
management
does
not
believe
reflect
current
period
operating
performance.
Although
similar
adjustments
for
expense
reduction
activities
may
be
recorded
in
future
periods,
the
size
and
frequency
of
these
adjustments
cannot
be
predicted.
The
Adjusted
Earnings
measure
should
be
considered
in
addition
to,
not
as
a
substitute
for
or
superior
to,
operating
income,
cash
flows
or
other
measures
of
financial
performance
prepared
in
accordance
with
GAAP.
2
eLoyalty
uses
the
term
“backlog”
to
reflect
the
estimated
future
amount
of
Managed
services
revenue
related
to
its
Managed
services
contracts.
The
value
of
these
contracts
is
based
on
anticipated
usage
volumes
over
the
anticipated
term
of
the
agreement.
The
anticipated
term
of
the
agreement
is
based
on
the
contractually
agreed
fixed
term
of
the
contract,
plus
agreed
upon,
but
optional,
extension
periods.
Anticipated
volumes
may
be
greater
or
less
than
anticipated.
In
addition,
these
contracts
typically
are
cancellable
without
cause
based
on
the
customer
making
a
substantial
early
termination
payment
or
forfeiture
of
prepaid
contract
amounts.
The
reported
backlog
is
expected
to
be
recognized
as
follows:
$50.6m
in
2011;
$39.2m
in
2012;
$23.9m
in
2013;
$16.6m
in
2014
and
thereafter. |