Attached files
 Exhibit 99.3
February 10, 2011
2010 Full-Year and Fourth-Quarter
Results
1 |
 2
Introduction
Unless otherwise stated, we will be talking about results for the full-year or
fourth-quarter 2010 and comparing them with the same period in 2009
References to PMI volumes refer to PMI shipment data, unless otherwise
stated
Industry volume and market shares are the latest data available from a
number of internal and external sources
Acquisitions, for the purposes of this presentation, also include our business
combination with Fortune Tobacco Corporation in the Philippines
Organic volume refers to volume excluding acquisitions
Net revenues exclude excise taxes
OCI stands for Operating Companies Income, which is defined as operating
income before general corporate expenses and the amortization of
intangibles. OCI growth rates are on an adjusted basis which excludes asset
impairment, exit and other costs
Data tables showing adjustments to net revenues and Operating Companies
Income, or “OCI”, for currency, acquisitions, asset impairment, exit and
other costs, free cash flow calculations, adjustments to EPS, and
reconciliations to U.S. GAAP measures are at the end of today’s web
cast slides and are posted on our web site |
 3
Forward-Looking and Cautionary Statements
This presentation and related discussion contain statements that, to the
extent they do not relate strictly to historical or current facts, constitute
“forward-looking statements”
within the meaning of the Private Securities
Litigation Reform Act of 1995. Such forward-looking statements are
based on current plans, estimates and expectations, and are not
guarantees of future performance. They are based on management’s
expectations that involve a number of business risks and uncertainties,
any of which could cause actual results to differ materially from those
expressed in or implied by the forward-looking statements. PMI
undertakes no obligation to publicly update or revise any forward-looking
statements, except in the normal course of its public disclosure
obligations. The risks and uncertainties relating to the forward-looking
statements in this presentation include those described under Item 1A.
“Risk Factors”
in PMI’s Form 10-Q for the quarter ended September 30,
2010, filed with the Securities and Exchange Commission.
|
 4
2010 PMI Highlights
Solid financial performance, given:
Unprecedented excise tax increases in six markets
Continued economic uncertainty and high unemployment
Consumer downtrading in some markets
More pronounced patterns of heightened price competition
Surge in illicit trade in markets where disruptive tax increases
were implemented
Robust increases in EPS and cash flow
Outperformed our international competitors in terms of
organic volume and market share growth
Source: PMI Financials and PMI estimates
•
•
•
–
–
–
–
– |
 5
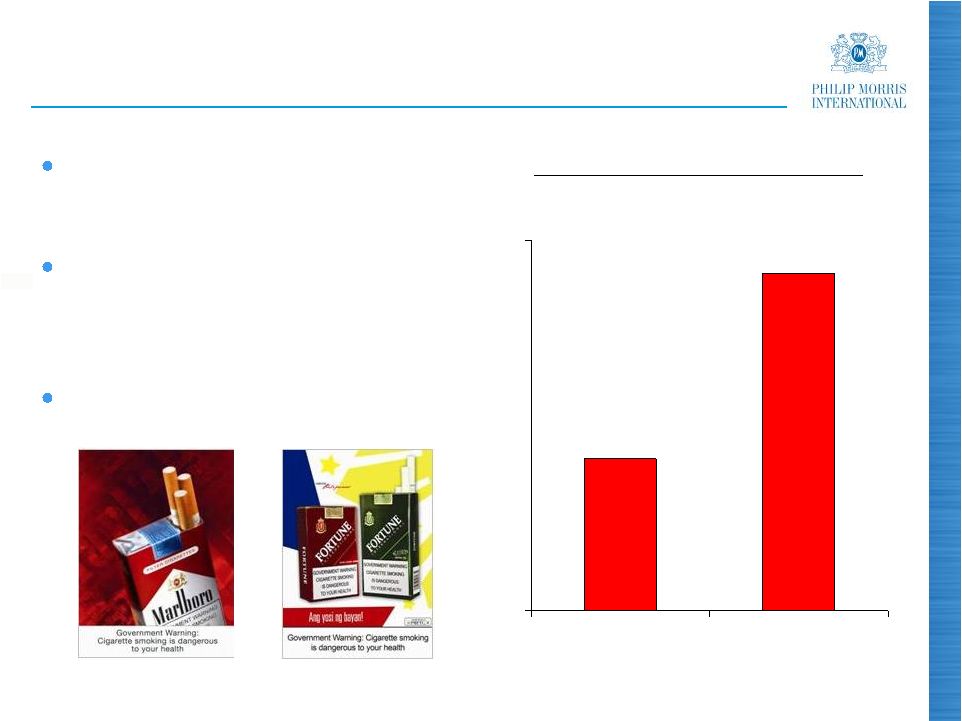
2010 Strategic Highlight -
Philippines
Business combination with
Fortune Tobacco in February
2010
101 billion unit market,
characterized by favorable
demographics and increasing
purchasing power
Strong potential for solid income
growth
(a) Excluding China
Source: PMI estimates
19.1
24.1
15
25
2009
2010
(%)
PMI Asia Region Market Share
(a) |
 6
PMI Results
Source: PMI Financials
-
5.1%
+ 3.1%
-
2.5%
+ 4.1%
Cigarette Volume
Excl.
Acquisitions
Actual
Excl.
Acquisitions
Actual
Fourth-Quarter 2010
Full-Year 2010
(% Growth vs. same
period in 2009) |
 7
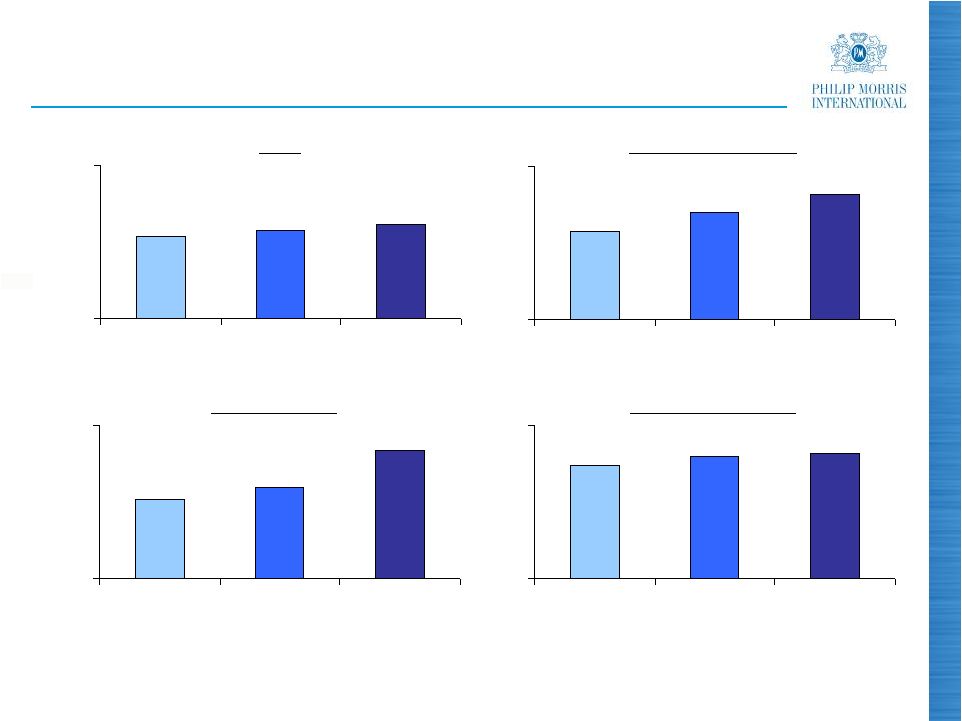
34.6
35.0
36.2
32
37
2009
2010
Q4
34.9
35.5
36.1
32
37
2009
2010
Q4
PMI Market Share Developments
(a)
(a)
Excluding USA and China. Historical data adjusted for pro-forma inclusion of
business combination with FTC in the Philippines (b)
Also excluding duty-free
(c)
List of Organisation for Economic Co-operation and Development (OECD) member
countries are listed on their website (www.oecd.org) Source: PMI
estimates (%)
23.7
24.0
24.1
20
25
2009
2010
Q4
Non-OECD
Markets
(b)
(%)
2010
2010
27.7
27.9
28.1
25
30
2009
2010
Q4
Total
(%)
Top
30
OCI
Markets
(%)
2010
2010
OECD Markets
(b)(c) |
 8
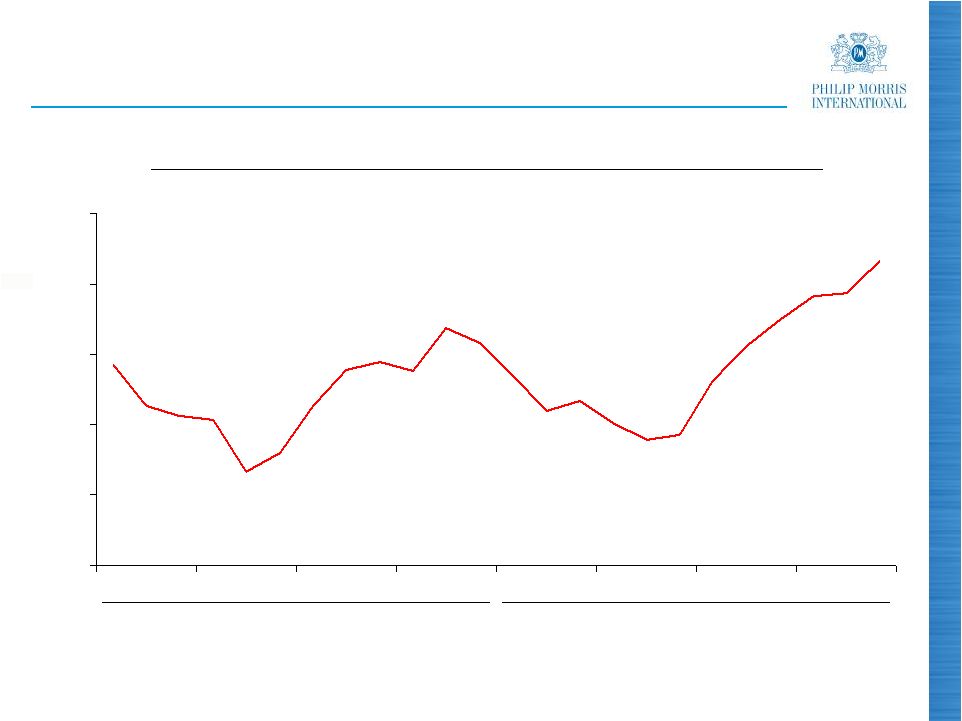
Marlboro
–
Market Share
8.8
8.9
9.0
9.1
9.2
9.3
2009
2010
Marlboro
Global
Share
of
Market
(a)
–
6
Months
Moving
Average
(%)
(a)
Excluding China and USA
Source: PMI estimates
Q4
Q3
Q2
Q1
Q4
Q3
Q2
Q1 |
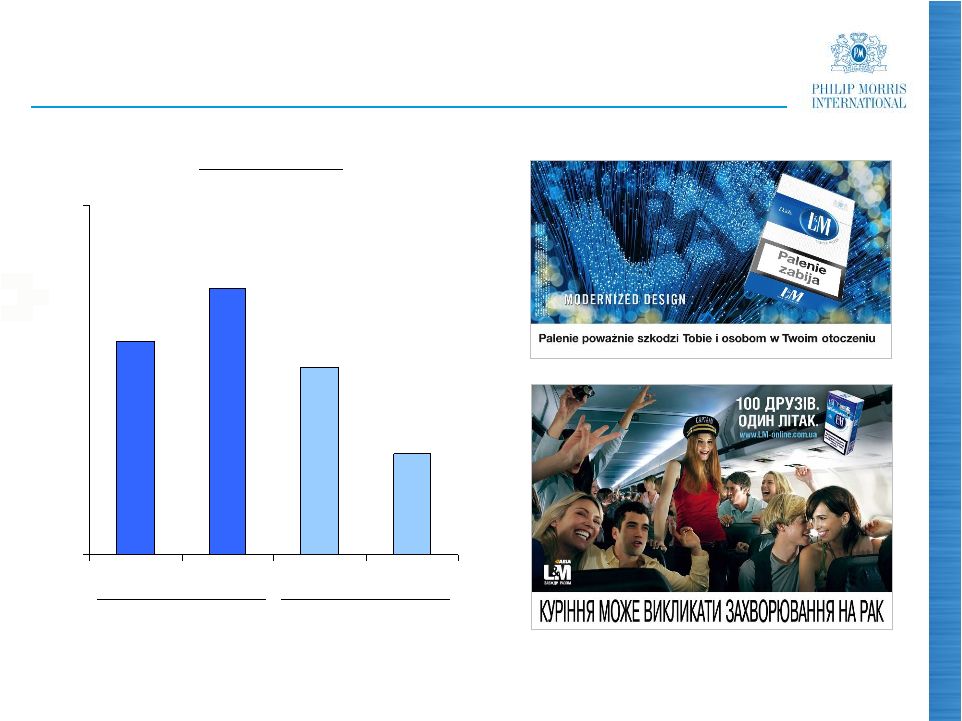 9
4.9
6.1
4.3
2.3
0
8
2007
2010
2007
2010
L&M
Market Share
(%)
(a)
Eastern Europe markets are: Armenia, Azerbaijan, Belarus, Georgia, Kazakhstan,
Kyrgyzstan, Moldova, Mongolia, Russia, Tadjikistan, Turkmenistan, Ukraine
and Uzbekistan Source: PMI estimates
EU Region
Eastern Europe
(a) |
 10
PMI Results
Source: PMI Financials
+ 2.8%
+ 4.8%
+ 3.4%
+ 8.7%
Net Revenues
Excl. Curr. &
Acquisitions
Actual
Excl. Curr. &
Acquisitions
Actual
Fourth-Quarter 2010
Full-Year 2010
(% Growth vs. same
period in 2009) |
 11
PMI Results
Source: PMI Financials
+ 9.9%
+ 12.2%
+ 5.8%
+ 10.3%
Adjusted OCI
+ 2.8%
+ 4.8%
+ 3.4%
+ 8.7%
Net Revenues
Excl. Curr. &
Acquisitions
Actual
Excl. Curr. &
Acquisitions
Actual
Fourth-Quarter 2010
Full-Year 2010
(% Growth vs. same
period in 2009) |
 12
Pricing Variance
1,082
580
1,223
1,984
1,662
0
2,000
2008
2009
2010
($ million)
Q4
YTD
Sep
35%
Source: PMI Financials |
 13
Operating Margins
Adjusted OCI Margins
2.6
37.7
40.3
0.9
41.7
42.6
Total
0.7
28.0
28.7
0.3
30.0
30.3
LA&C
8.9
29.3
38.2
1.4
37.3
38.7
Asia
0.7
36.4
37.1
2.4
39.2
41.6
EEMA
0.7 pp
48.0 %
48.7 %
0.2 pp
50.2 %
50.4 %
EU
Variance
2009
2010
(a)
Variance
2009
2010
(a)
Fourth-Quarter
Full-Year
(a)
Excluding currency and acquisitions
Source: PMI Financials |
 14
PMI Results
+ 18.5%
(a)
+ 19.8%
+ 14.0%
(a)
+ 17.6%
Adjusted diluted EPS
+ 9.9%
+ 12.2%
+ 5.8%
+ 10.3%
Adjusted OCI
+ 2.8%
+ 4.8%
+ 3.4%
+ 8.7%
Net Revenues
Excl. Curr. &
Acquisitions
Actual
Excl. Curr. &
Acquisitions
Actual
Fourth-Quarter 2010
Full-Year 2010
(% Growth vs. same
period in 2009)
(a)
Only excludes currency
Source: PMI Financials |
 15
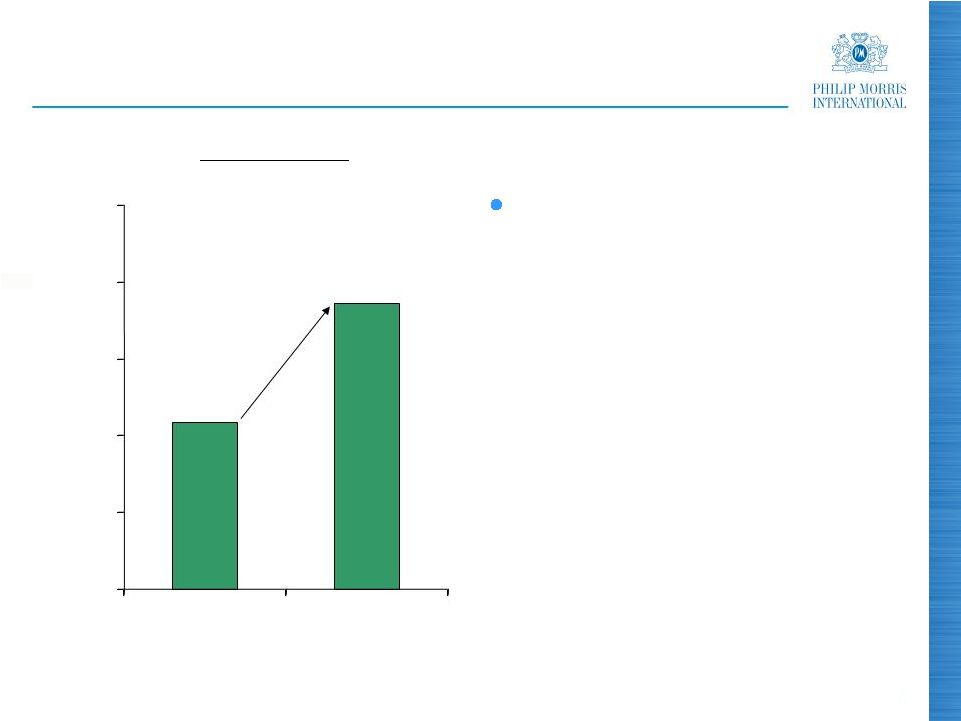
Cash Flow
(a)
Free cash flow equals net cash provided by operating activities less capital
expenditures Source: PMI Financials
Free Cash Flow
(a)
($ million)
+21.7%
Improvement driven in
large part by the strict
management of our
working capital, and in
particular a reduction in
our receivables and in
inventories
7,169
8,724
5,000
6,000
7,000
8,000
9,000
10,000
2009
2010 |
 16
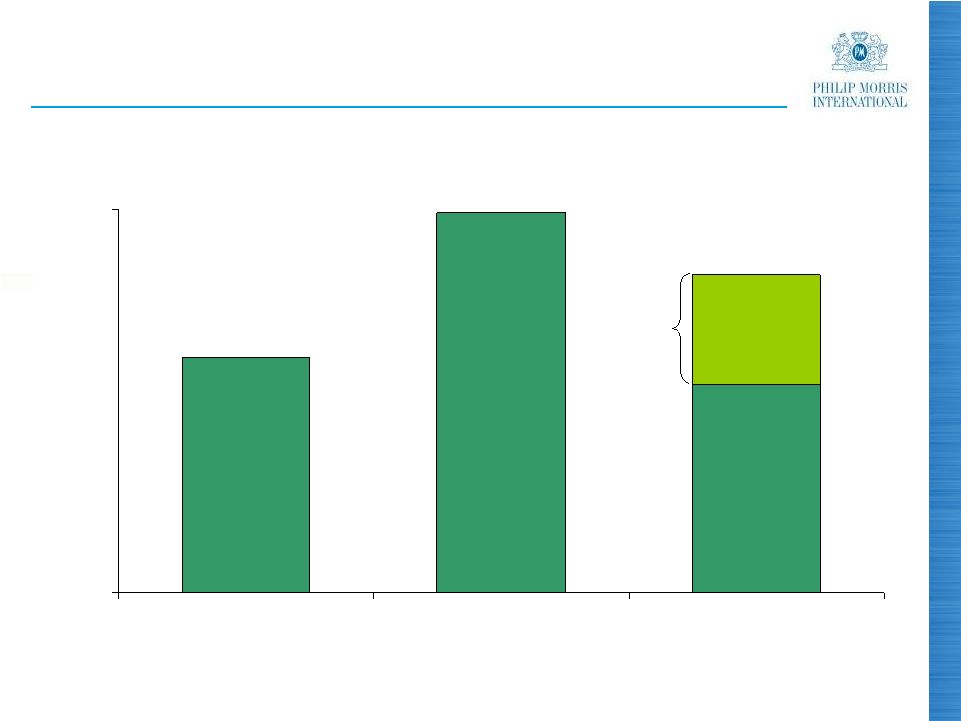
Cumulative Operating Cash Flow (2008-2010)
6.6
7.9
7.3
7.9
7.8
9.4
21.7
25.2
March 2008
Actual
2008
2009
2010
($ billion)
Source: PMI Financials
Forecast
Results |
 17
Shareholder Returns
Cumulative increase in dividend of 39.1% since March
2008 spin-off
By the end of December 2010, total of 334 million shares
had been repurchased, representing 15.8% of shares
outstanding at that time, at an average price of $47.83
•
• |
 18
2011 EPS Guidance
At prevailing exchange rates, reported diluted EPS
guidance for 2011 is $4.35 to $4.45, versus $3.92 in 2010
On an adjusted basis, compared to $3.87 in 2010, this
corresponds to a growth rate of approximately 12.5% to
15% at prevailing exchange rates, or approximately 10%
to 12.5% on a currency neutral basis
2011 guidance assumes an effective underlying tax rate
that is expected to be some 70 basis points higher than
that incurred in 2010
Source: PMI Forecasts
•
•
• |
 19
Excise Taxation
Disruptive excise tax increases remain the key risk to our
business
Outlook is for reasonable increases in 2011 other than in
Mexico
•
• |
 20
Excise Taxation
Disruptive excise tax increases remain the key risk to our
business
Outlook is for reasonable increases in 2011 other than in
Mexico
New EU excise tax directive since January 2011
Important structural improvements in excise tax systems
in France, Greece, the Netherlands and Sweden
Visibility in Germany for five-year period |
 21
2011 Business Outlook
Reasonable excise tax increases, except Mexico
High unemployment continuing to impact industry volumes
and mix
Recent
events
in
North
Africa
likely
to
impact
our
performance
there, but hope this will be a temporary phenomenon |
 22
2011 Business Outlook
Reasonable excise tax increases, except Mexico
High unemployment continuing to impact industry volumes
and mix
Recent
events
in
North
Africa
likely
to
impact
our
performance
there, but hope this will be a temporary phenomenon
Organic
volume
performance
expected
to
be
in
line
with
2010 |
 23
2011 Business Outlook
Reasonable excise tax increases, except Mexico
High unemployment continuing to impact industry volumes
and mix
Recent
events
in
North
Africa
likely
to
impact
our
performance
there, but hope this will be a temporary phenomenon
Organic
volume
performance
expected
to
be
in
line
with
2010
Anticipate a solid market share performance |
 24
2011 Business Outlook
Reasonable excise tax increases, except Mexico
High unemployment continuing to impact industry volumes
and mix
Recent
events
in
North
Africa
likely
to
impact
our
performance
there, but hope this will be a temporary phenomenon
Organic
volume
performance
expected
to
be
in
line
with
2010
Anticipate a solid market share performance
Pricing
will
continue
to
be
the
key
driver
of
profitability
growth |
 25
2011 Business Outlook
Reasonable excise tax increases, except Mexico
High unemployment continuing to impact industry volumes
and mix
Recent
events
in
North
Africa
likely
to
impact
our
performance
there, but hope this will be a temporary phenomenon
Organic
volume
performance
expected
to
be
in
line
with
2010
Anticipate a solid market share performance
Pricing
will
continue
to
be
the
key
driver
of
profitability
growth
Some continued pressure on costs |
 26
2011 Business Outlook
Reasonable excise tax increases, except Mexico
High unemployment continuing to impact industry volumes
and mix
Recent
events
in
North
Africa
likely
to
impact
our
performance
there, but hope this will be a temporary phenomenon
Organic
volume
performance
expected
to
be
in
line
with
2010
Anticipate a solid market share performance
Pricing
will
continue
to
be
the
key
driver
of
profitability
growth
Some continued pressure on costs
$250 million pretax target for cost savings in 2011 |
 27
2011 Business Outlook
Reasonable excise tax increases, except Mexico
High unemployment continuing to impact industry volumes
and mix
Recent events in North Africa likely to impact our performance
there, but hope this will be a temporary phenomenon
Organic volume performance expected to be in line with 2010
Anticipate a solid market share performance
Pricing will continue to be the key driver of profitability growth
Some continued pressure on costs
$250 million pretax target for cost savings in 2011
Forecast strong cash flow performance
$5 billion in share repurchases anticipated in 2011
•
•
•
•
•
•
•
•
•
• |
 28
2011 Business Outlook
Reasonable excise tax increases, except Mexico
High unemployment continuing to impact industry volumes
and mix
Recent events in North Africa likely to impact our performance
there, but hope this will be a temporary phenomenon
Organic volume performance expected to be in line with 2010
Anticipate a solid market share performance
Pricing will continue to be the key driver of profitability growth
Some continued pressure on costs
$250 million pretax target for cost savings in 2011
Forecast strong cash flow performance
$5 billion in share repurchases anticipated in 2011
2011: another solid year of growth expected for PMI |
 29
Questions & Answers
2010 Full-Year and Fourth-Quarter
Results |
 30
PHILIP MORRIS INTERNATIONAL INC. and Subsidiaries
Reconciliation of Non-GAAP Measures
Adjustments for the Impact of Currency and Acquisitions
For the Quarters Ended December 31,
($ in millions)
(Unaudited)
(1)
Represents the business combination in the Philippines
(2)
Represents the business combination in the Philippines, including $20 million of
asset impairment and exit costs due to a contract termination Reported Net
Revenues
Less
Excise
Taxes
Reported Net
Revenues
excluding
Excise Taxes
Less
Currency
Reported Net
Revenues
excluding
Excise Taxes &
Currency
Less
Acquisi-
tions
Reported Net
Revenues
excluding
Excise Taxes,
Currency &
Acquisitions
Reported Net
Revenues
Less
Excise
Taxes
Reported Net
Revenues
excluding
Excise Taxes
Reported
Reported
excluding
Currency
Reported
excluding
Currency &
Acquisitions
6,997
$
4,804
$
2,193
$
(166)
$
2,359
$
-
$
2,359
$
European Union
7,562
$
5,196
$
2,366
$
(7.3)%
(0.3)%
(0.3)%
4,263
2,385
1,878
(29)
1,907
-
1,907
EEMA
3,912
2,039
1,873
0.3%
1.8%
1.8%
4,141
2,035
2,106
127
1,979
171
(1)
1,808
Asia
3,439
1,725
1,714
22.9%
15.5%
5.5%
2,406
1,546
860
28
832
-
832
Latin America & Canada
2,095
1,331
764
12.6%
8.9%
8.9%
17,807
$
10,770
$
7,037
$
(40)
$
7,077
$
171
$
6,906
$
PMI Total
17,008
$
10,291
$
6,717
$
4.8%
5.4%
2.8%
Reported
Operating
Companies
Income
Less
Currency
Reported
Operating
Companies
Income
excluding
Currency
Less
Acquisi-
tions
Reported
Operating
Companies
Income
excluding
Currency &
Acquisitions
Reported
Operating
Companies
Income
Reported
Reported
excluding
Currency
Reported
excluding
Currency &
Acquisitions
1,031
$
(110)
$
1,141
$
-
$
1,141
$
European Union
1,109
$
(7.0)%
2.9%
2.9%
740
33
707
-
707
EEMA
681
8.7%
3.8%
3.8%
790
79
711
21
(2)
690
Asia
503
57.1%
41.4%
37.2%
254
16
238
(1)
239
Latin America & Canada
214
18.7%
11.2%
11.7%
2,815
$
18
$
2,797
$
20
$
2,777
$
PMI Total
2,507
$
12.3%
11.6%
10.8%
2010
2009
% Change in Reported Operating
Companies Income
2010
2009
% Change in Reported Net Revenues
excluding Excise Taxes |
 31
Reported
Operating
Companies
Income
Less
Asset
Impairment &
Exit Costs
Adjusted
Operating
Companies
Income
Less
Currency
Adjusted
Operating
Companies
Income
excluding
Currency
Less
Acquisi-
tions
Adjusted
Operating
Companies
Income
excluding
Currency &
Acquisitions
Reported
Operating
Companies
Income
Less
Asset
Impairment &
Exit Costs
Adjusted
Operating
Companies
Income
Adjusted
Adjusted
excluding
Currency
Adjusted
excluding
Currency &
Acquisitions
1,031
$
(7)
$
1,038
$
(110)
$
1,148
$
-
$
1,148
$
European Union
1,109
$
(26)
$
1,135
$
(8.5)%
1.1%
1.1%
740
-
740
33
707
-
707
EEMA
681
-
681
8.7%
3.8%
3.8%
790
(20)
810
79
731
41
(1)
690
Asia
503
-
503
61.0%
45.3%
37.2%
254
-
254
16
238
(1)
239
Latin America & Canada
214
-
214
18.7%
11.2%
11.7%
2,815
$
(27)
$
2,842
$
18
$
2,824
$
40
$
2,784
$
PMI Total
2,507
$
(26)
$
2,533
$
12.2%
11.5%
9.9%
% Points Change
Adjusted
Operating
Companies
Income
excluding
Currency
Net Revenues
excluding
Excise Taxes &
Currency
(2)
Adjusted
Operating
Companies
Income
Margin
excluding
Currency
Adjusted
Operating
Companies
Income
excluding
Currency &
Acquisitions
Net Revenues
excluding
Excise Taxes,
Currency &
Acquisitions
(2)
Adjusted
Operating
Companies
Income
Margin
excluding
Currency &
Acquisitions
Adjusted
Operating
Companies
Income
Net Revenue
excluding
Excise
Taxes
(2)
Adjusted
Operating
Companies
Income
Margin
Adjusted
Operating
Companies
Income
Margin
excluding
Currency
Adjusted
Operating
Companies
Income
Margin
excluding
Currency &
Acquisitions
1,148
$
2,359
$
48.7%
1,148
$
2,359
$
48.7%
European Union
1,135
$
2,366
$
48.0%
0.7
0.7
707
1,907
37.1%
707
1,907
37.1%
EEMA
681
1,873
36.4%
0.7
0.7
731
1,979
36.9%
690
1,808
38.2%
Asia
503
1,714
29.3%
7.6
8.9
238
832
28.6%
239
832
28.7%
Latin America & Canada
214
764
28.0%
0.6
0.7
2,824
$
7,077
$
39.9%
2,784
$
6,906
$
40.3%
PMI Total
2,533
$
6,717
$
37.7%
2.2
2.6
% Change in Adjusted Operating
Companies Income
2009
2010
2009
2010
PHILIP MORRIS INTERNATIONAL INC. and Subsidiaries
Reconciliation of Non-GAAP Measures
Reconciliation of Reported Operating Companies Income to Adjusted Operating
Companies Income & Reconciliation of Adjusted Operating Companies Income
Margin, excluding Currency and Acquisitions For the Quarters Ended December
31, ($ in millions)
(Unaudited)
(1)
Represents the business combination in the Philippines
(2)
For the calculation of net revenues excluding excise taxes, currency and
acquisitions refer to previous slide |
 32
PHILIP MORRIS INTERNATIONAL INC. and Subsidiaries
Reconciliation of Non-GAAP Measures
Reconciliation of Reported Diluted EPS to Adjusted Diluted EPS and Adjusted
Diluted EPS, excluding Currency For the Quarters Ended December 31,
(Unaudited)
2010
2009
% Change
Reported Diluted EPS
0.96
$
0.80
$
20.0%
Adjustments:
Asset impairment and exit costs
0.01
0.01
Adjusted Diluted EPS
0.97
$
0.81
$
19.8%
Less:
Currency Impact
0.01
Adjusted Diluted EPS, excluding Currency
0.96
$
0.81
$
18.5% |
 33
PHILIP MORRIS INTERNATIONAL INC. and Subsidiaries
Reconciliation of Non-GAAP Measures
Reconciliation of Reported Diluted EPS to Reported Diluted EPS, excluding
Currency For the Quarters Ended December 31,
(Unaudited)
2010
2009
% Change
Reported Diluted EPS
0.96
$
0.80
$
20.0%
Less:
Currency Impact
0.01
Reported Diluted EPS, excluding Currency
0.95
$
0.80
$
18.8% |
 34
Reported Net
Revenues
Less
Excise
Taxes
Reported Net
Revenues
excluding
Excise Taxes
Less
Currency
Reported Net
Revenues
excluding
Excise Taxes &
Currency
Less
Acquisi-
tions
Reported Net
Revenues
excluding
Excise Taxes,
Currency &
Acquisitions
Reported
Net
Revenues
Less
Excise
Taxes
Reported Net
Revenues
excluding
Excise Taxes
Reported
Reported
excluding
Currency
Reported
excluding
Currency &
Acquisitions
28,050
$
19,239
$
8,811
$
(172)
$
8,983
$
3
$
8,980
$
European Union
28,550
$
19,509
$
9,041
$
(2.5)%
(0.6)%
(0.7)%
15,928
8,519
7,409
76
7,333
80
7,253
EEMA
13,865
7,070
6,795
9.0%
7.9%
6.7%
15,235
7,300
7,935
611
7,324
548
(1)
6,776
Asia
12,413
5,885
6,528
21.6%
12.2%
3.8%
8,500
5,447
3,053
179
2,874
-
2,874
Latin America & Canada
7,252
4,581
2,671
14.3%
7.6%
7.6%
67,713
$
40,505
$
27,208
$
694
$
26,514
$
631
$
25,883
$
PMI Total
62,080
$
37,045
$
25,035
$
8.7%
5.9%
3.4%
Reported
Operating
Companies
Income
Less
Currency
Reported
Operating
Companies
Income
excluding
Currency
Less
Acquisi-
tions
Reported
Operating
Companies
Income
excluding
Currency &
Acquisitions
Reported
Operating
Companies
Income
Reported
Reported
excluding
Currency
Reported
excluding
Currency &
Acquisitions
4,311
$
(191)
$
4,502
$
2
$
4,500
$
European Union
4,506
$
(4.3)%
(0.1)%
(0.1)%
3,152
107
3,045
28
3,017
EEMA
2,663
18.4%
14.3%
13.3%
3,049
342
2,707
84
(2)
2,623
Asia
2,436
25.2%
11.1%
7.7%
953
85
868
(3)
871
Latin America & Canada
666
43.1%
30.3%
30.8%
11,465
$
343
$
11,122
$
111
$
11,011
$
PMI Total
10,271
$
11.6%
8.3%
7.2%
% Change in Reported Net Revenues
excluding Excise Taxes
2010
2009
% Change in Reported Operating
Companies Income
2010
2009
PHILIP MORRIS INTERNATIONAL INC. and Subsidiaries
Reconciliation of Non-GAAP Measures
Adjustments for the Impact of Currency and Acquisitions
For the Years Ended December 31,
($ in millions)
(Unaudited)
(1)
Represents the business combination in the Philippines
(2)
Represents the business combination in the Philippines, including $20 million of
asset impairment and exit costs due to a contract termination |
 35
Reported
Operating
Companies
Income
Less
Asset
Impairment &
Exit Costs
Adjusted
Operating
Companies
Income
Less
Currency
Adjusted
Operating
Companies
Income
excluding
Currency
Less
Acquisi-
tions
Adjusted
Operating
Companies
Income
excluding
Currency &
Acquisitions
Reported
Operating
Companies
Income
Less
Asset
Impairment /
Exit Costs &
Other
Adjusted
Operating
Companies
Income
Adjusted
Adjusted
excluding
Currency
Adjusted
excluding
Currency &
Acquisitions
4,311
$
(27)
$
4,338
$
(191)
$
4,529
$
2
$
4,527
$
European Union
4,506
$
(29)
$
4,535
$
(4.3)%
(0.1)%
(0.2)%
3,152
-
3,152
107
3,045
28
3,017
EEMA
2,663
-
2,663
18.4%
14.3%
13.3%
3,049
(20)
3,069
342
2,727
104
(1)
2,623
Asia
2,436
-
2,436
26.0%
11.9%
7.7%
953
-
953
85
868
(3)
871
Latin America & Canada
666
(135)
(2)
801
19.0%
8.4%
8.7%
11,465
$
(47)
$
11,512
$
343
$
11,169
$
131
$
11,038
$
PMI Total
10,271
$
(164)
$
10,435
$
10.3%
7.0%
5.8%
% Points Change
Adjusted
Operating
Companies
Income
excluding
Currency
Net Revenues
excluding Excise
Taxes &
Currency
(3)
Adjusted
Operating
Companies
Income
Margin
excluding
Currency
Adjusted
Operating
Companies
Income
excluding
Currency &
Acquisitions
Net Revenues
excluding
Excise Taxes,
Currency &
Acquisitions
(3)
Adjusted
Operating
Companies
Income
Margin
excluding
Currency &
Acquisitions
Adjusted
Operating
Companies
Income
Net Revenues
excluding
Excise
Taxes
(3)
Adjusted
Operating
Companies
Income
Margin
Adjusted
Operating
Companies
Income
Margin
excluding
Currency
Adjusted
Operating
Companies
Income
Margin
excluding
Currency &
Acquisitions
4,529
$
8,983
$
50.4%
4,527
$
8,980
$
50.4%
European Union
4,535
$
9,041
$
50.2%
0.2
0.2
3,045
7,333
41.5%
3,017
7,253
41.6%
EEMA
2,663
6,795
39.2%
2.3
2.4
2,727
7,324
37.2%
2,623
6,776
38.7%
Asia
2,436
6,528
37.3%
(0.1)
1.4
868
2,874
30.2%
871
2,874
30.3%
Latin America & Canada
801
2,671
30.0%
0.2
0.3
11,169
$
26,514
$
42.1%
11,038
$
25,883
$
42.6%
PMI Total
10,435
$
25,035
$
41.7%
0.4
0.9
2009
2010
2009
2010
% Change in Adjusted Operating
Companies Income
PHILIP MORRIS INTERNATIONAL INC. and Subsidiaries
Reconciliation of Non-GAAP Measures
Reconciliation of Reported Operating Companies Income to Adjusted Operating
Companies Income & Reconciliation of Adjusted Operating Companies Income
Margin, excluding Currency and Acquisitions For the Years Ended December
31, ($ in millions)
(Unaudited)
(1)
Represents the business combination in the Philippines
(2)
Represents the 2009 Colombian investment and cooperation agreement charge
(3)
For the calculation of net revenues excluding excise taxes, currency and
acquisitions refer to previous slide |
 36
PHILIP MORRIS INTERNATIONAL INC. and Subsidiaries
Reconciliation of Non-GAAP Measures
Reconciliation of Reported Diluted EPS to Adjusted Diluted EPS and Adjusted
Diluted EPS, excluding Currency For the Years Ended December 31,
(Unaudited)
2010
2009
% Change
Reported Diluted EPS
3.92
$
3.24
$
21.0%
Adjustments:
Colombian investment and cooperation agreement charge
-
0.04
Tax items
(0.07)
-
Asset impairment and exit costs
0.02
0.01
Adjusted Diluted EPS
3.87
$
3.29
$
17.6%
Less:
Currency Impact
0.12
Adjusted Diluted EPS, excluding Currency
3.75
$
3.29
$
14.0% |
 37
PHILIP MORRIS INTERNATIONAL INC. and Subsidiaries
Reconciliation of Non-GAAP Measures
Reconciliation of Reported Diluted EPS to Reported Diluted EPS, excluding
Currency For the Years Ended December 31,
(Unaudited)
2010
2009
% Change
Reported Diluted EPS
3.92
$
3.24
$
21.0%
Less:
Currency Impact
0.12
Reported Diluted EPS, excluding Currency
3.80
$
3.24
$
17.3% |
 38
PHILIP MORRIS INTERNATIONAL INC. and Subsidiaries
Reconciliation of Non-GAAP Measures
Reconciliation
of
Operating
Cash
Flow
to
Free
Cash
Flow
and
Free
Cash
Flow,
excluding
Currency
Reconciliation of Operating Cash Flow to Operating Cash Flow, excluding
Currency For the Quarters and Years Ended December 31,
($ in millions)
(Unaudited)
(a) Operating Cash Flow
For the Quarters Ended
For the Years Ended
December 31,
December 31,
2010
2009
% Change
2010
2009
% Change
Net
cash
provided
by
operating
activities
(a)
1,581
$
1,465
$
7.9%
9,437
$
7,884
$
19.7%
Less:
Capital expenditures
230
232
713
715
Free cash flow
1,351
$
1,233
$
9.6%
8,724
$
7,169
$
21.7%
Less:
Currency impact
6
(2)
Free cash flow, excluding Currency
1,345
$
1,233
$
9.1%
8,726
$
7,169
$
21.7%
For the Quarters Ended
For the Years Ended
December 31,
December 31,
2010
2009
% Change
2010
2009
% Change
Net
cash
provided
by
operating
activities
(a)
1,581
$
1,465
$
7.9%
9,437
$
7,884
$
19.7%
Less:
Currency impact
5
23
Net cash provided by operating activities,
excluding Currency
1,576
$
1,465
$
7.6%
9,414
$
7,884
$
19.4% |
 2010
Full-Year and Fourth-Quarter Results
February 10, 2011
39 |