Attached files
| file | filename |
|---|---|
| 8-K - 8-K - Agiliti Health, Inc. | a11-2910_18k.htm |
Exhibit 99.1
|
|
Universal Hospital Services, Inc. Investor Presentation 2011 First Quarter |
|
|
2 Forward Looking Statements 2 Safe Harbor Statement under the Private Securities Litigation Reform Act of 1995: Universal Hospital Services, Inc. believes statements in this presentation looking forward in time involve risks and uncertainties based on management’s current views and assumptions. Actual events may differ materially. Please refer to the cautionary statement regarding forward-looking statements and risk factors that appear in the Company’s Annual Report on Form 10-K for the year ended December 31, 2009, and other filings with the SEC, which can be accessed at www.UHS.com under “Financials.” This presentation contains non-GAAP measures as defined by SEC rules. Reconciliations of these measures to the most directly comparable GAAP measures are contained in the appendix. |
|
|
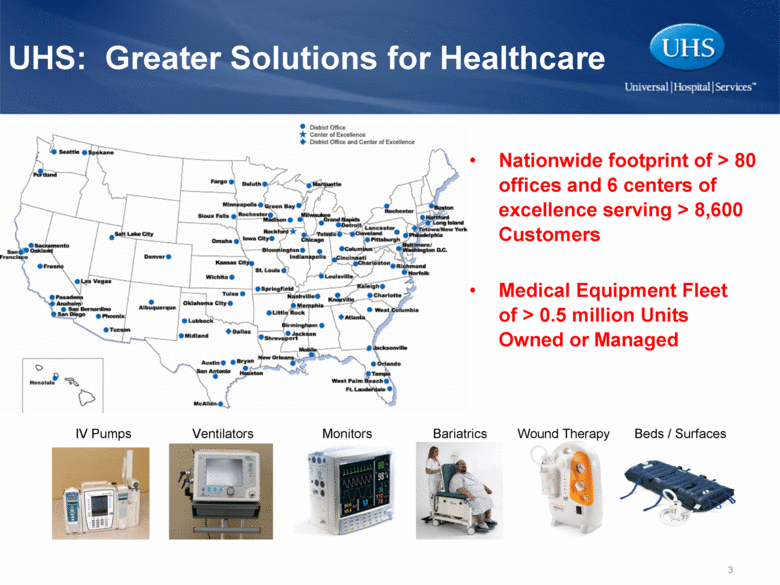
3 UHS: Greater Solutions for Healthcare 3 Monitors Bariatrics Ventilators IV Pumps Beds / Surfaces Wound Therapy Medical Equipment Fleet of > 0.5 million Units Owned or Managed Nationwide footprint of > 80 offices and 6 centers of excellence serving > 8,600 Customers |
|
|
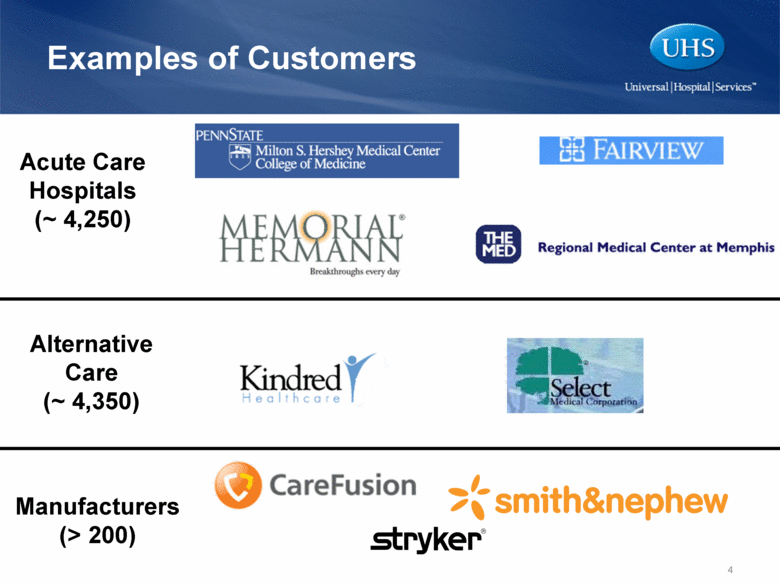
Examples of Customers Acute Care Hospitals (~ 4,250) Alternative Care (~ 4,350) Manufacturers (> 200) |
|
|
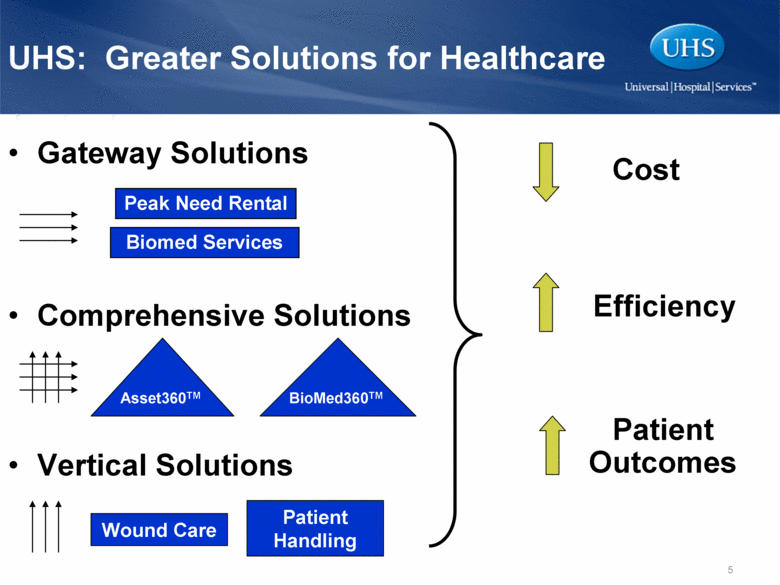
UHS: Greater Solutions for Healthcare Gateway Solutions Comprehensive Solutions Vertical Solutions Efficiency Cost Patient Outcomes Peak Need Rental Biomed Services Asset360TM BioMed360TM Wound Care Patient Handling |
|
|
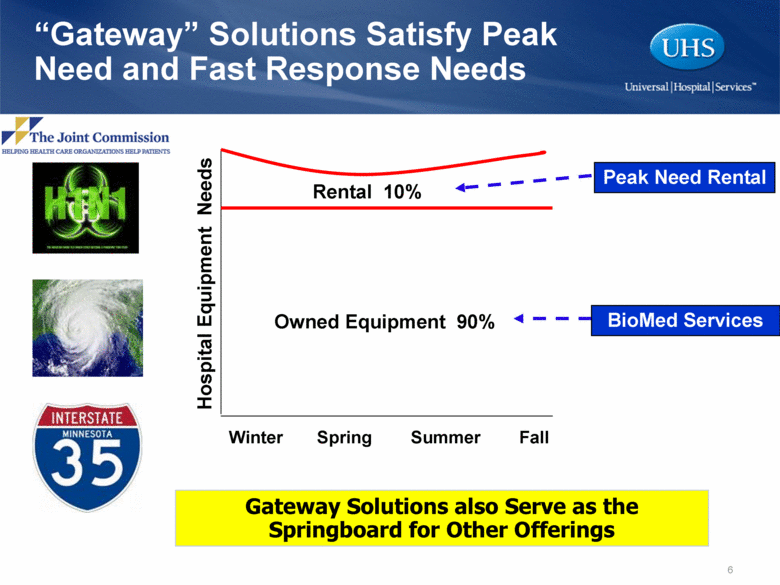
“Gateway” Solutions Satisfy Peak Need and Fast Response Needs Rental 10% Owned Equipment 90% Winter Spring Summer Fall Hospital Equipment Needs Peak Need Rental BioMed Services Gateway Solutions also Serve as the Springboard for Other Offerings |
|
|
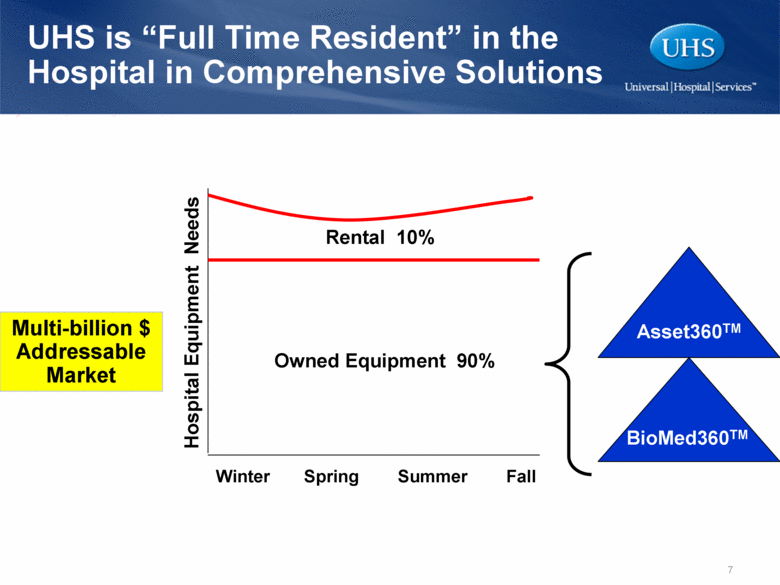
UHS is “Full Time Resident” in the Hospital in Comprehensive Solutions Rental 10% Owned Equipment 90% Winter Spring Summer Fall Hospital Equipment Needs Asset360TM BioMed360TM Multi-billion $ Addressable Market |
|
|
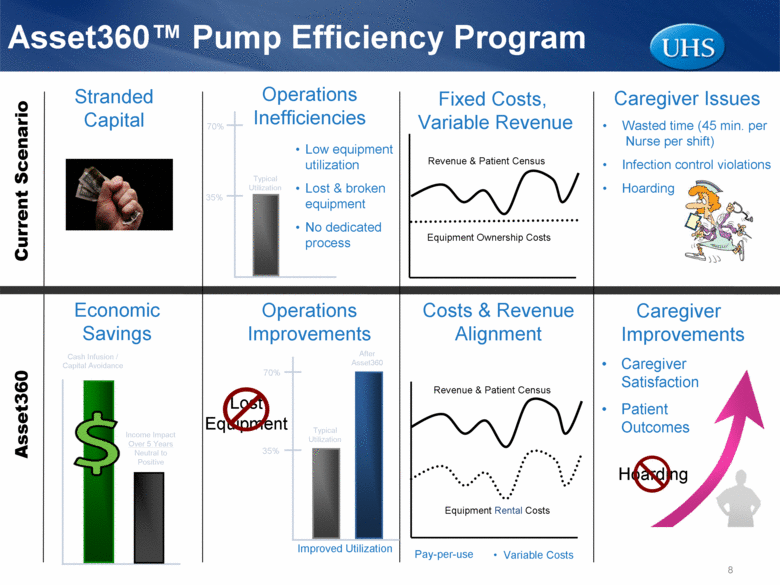
Asset360™ Pump Efficiency Program Operations Inefficiencies Stranded Capital Current Scenario Asset360 Economic Savings Caregiver Improvements Caregiver Satisfaction Patient Outcomes Costs & Revenue Alignment Operations Improvements Caregiver Issues Wasted time (45 min. per Nurse per shift) Infection control violations Hoarding Fixed Costs, Variable Revenue Equipment Ownership Costs Revenue & Patient Census Hoarding Low equipment utilization Lost & broken equipment No dedicated process Equipment Rental Costs Revenue & Patient Census Pay-per-use Variable Costs Lost Equipment Improved Utilization Typical Utilization 35% 70% Typical Utilization 35% 70% After Asset360 Cash Infusion / Capital Avoidance Income Impact Over 5 Years Neutral to Positive |
|
|
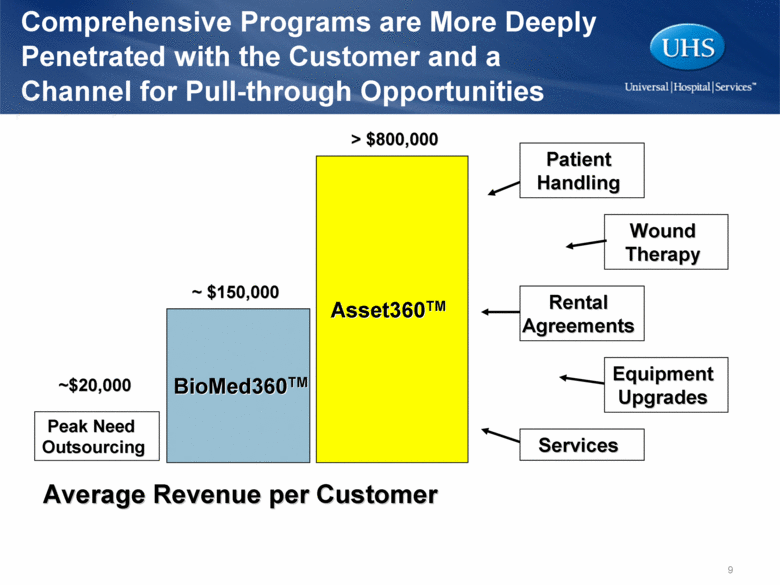
Comprehensive Programs are More Deeply Penetrated with the Customer and a Channel for Pull-through Opportunities Peak Need Outsourcing Asset360TM BioMed360TM Average Revenue per Customer ~$20,000 > $800,000 ~ $150,000 Wound Therapy Services Patient Handling Rental Agreements Equipment Upgrades |
|
|
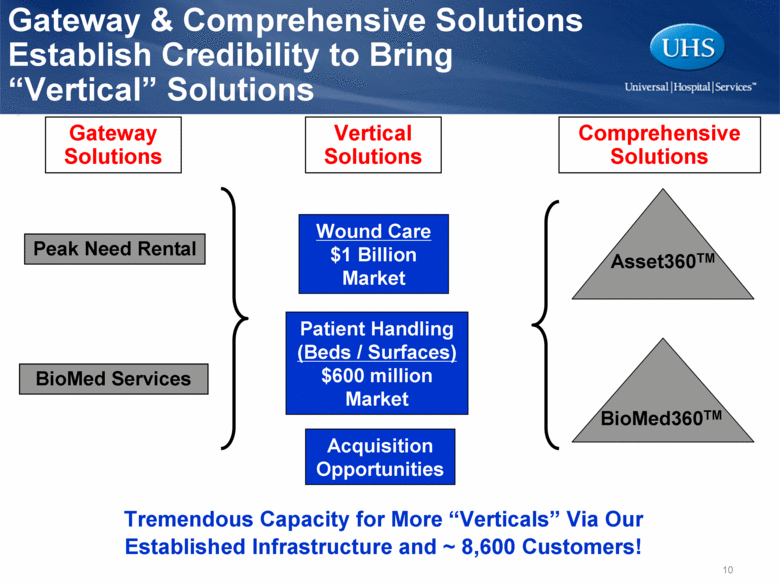
Gateway & Comprehensive Solutions Establish Credibility to Bring “Vertical” Solutions Wound Care $1 Billion Market Patient Handling (Beds / Surfaces) $600 million Market Asset360TM BioMed360TM Peak Need Rental BioMed Services Gateway Solutions Vertical Solutions Comprehensive Solutions Acquisition Opportunities Tremendous Capacity for More “Verticals” Via Our Established Infrastructure and ~ 8,600 Customers! |
|
|
2010 Performance & Outlook Rex Clevenger, EVP & CFO |
|
|
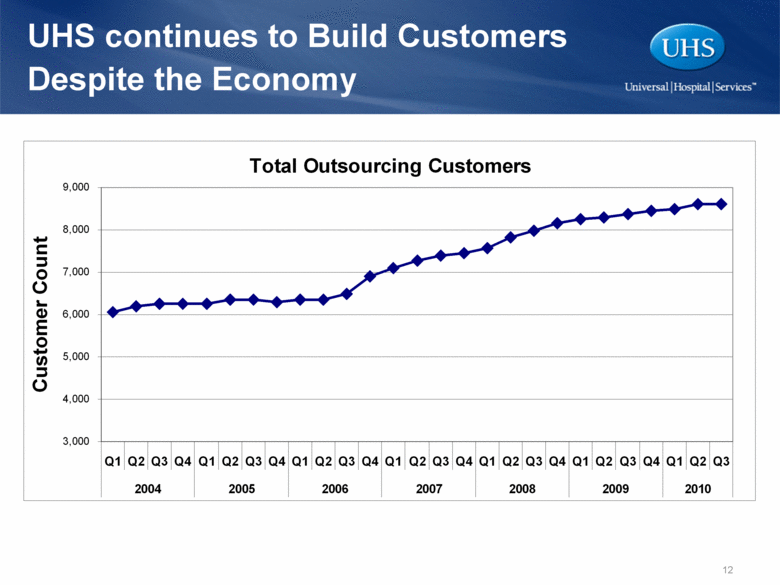
UHS continues to Build Customers Despite the Economy Total Outsourcing Customers 3,000 4,000 5,000 6,000 7,000 8,000 9,000 Q1 Q2 Q3 Q4 Q1 Q2 Q3 Q4 Q1 Q2 Q3 Q4 Q1 Q2 Q3 Q4 Q1 Q2 Q3 Q4 Q1 Q2 Q3 Q4 Q1 Q2 Q3 2004 2005 2006 2007 2008 2009 2010 Customer Count |
|
|
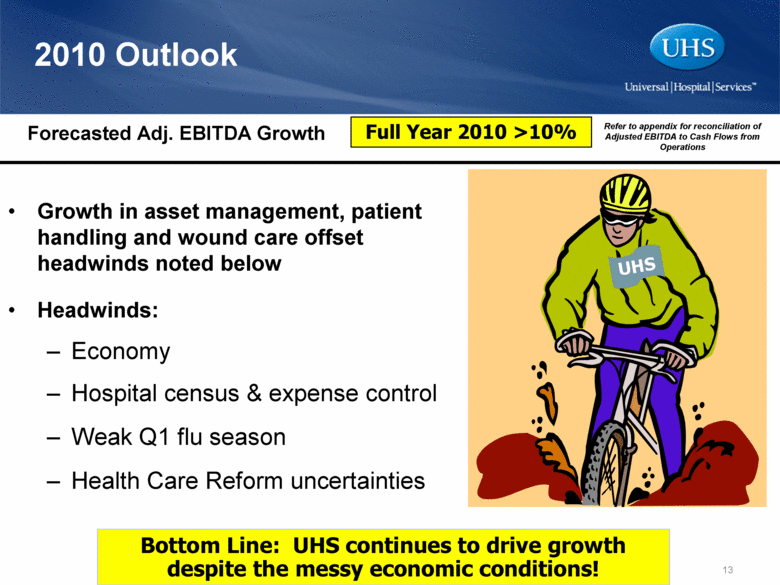
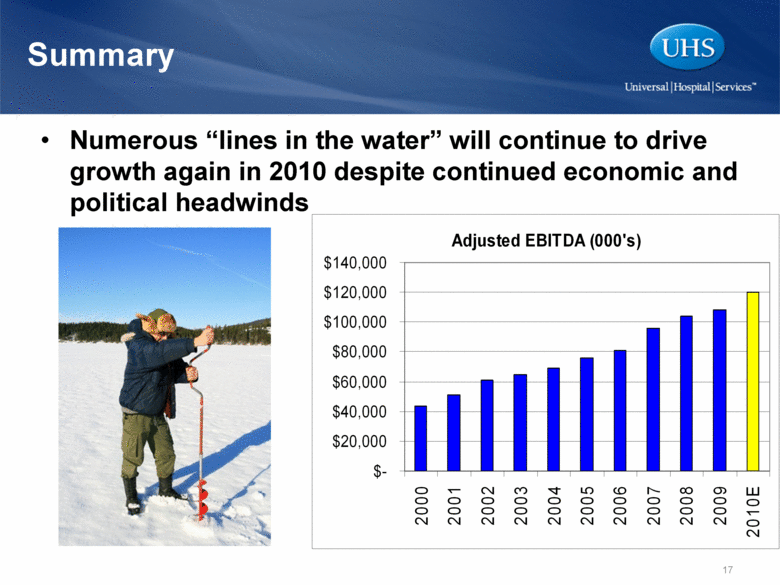
2010 Outlook Growth in asset management, patient handling and wound care offset headwinds noted below Headwinds: Economy Hospital census & expense control Weak Q1 flu season Health Care Reform uncertainties Bottom Line: UHS continues to drive growth despite the messy economic conditions! Forecasted Adj. EBITDA Growth Full Year 2010 >10% Refer to appendix for reconciliation of Adjusted EBITDA to Cash Flows from Operations UHS |
|
|
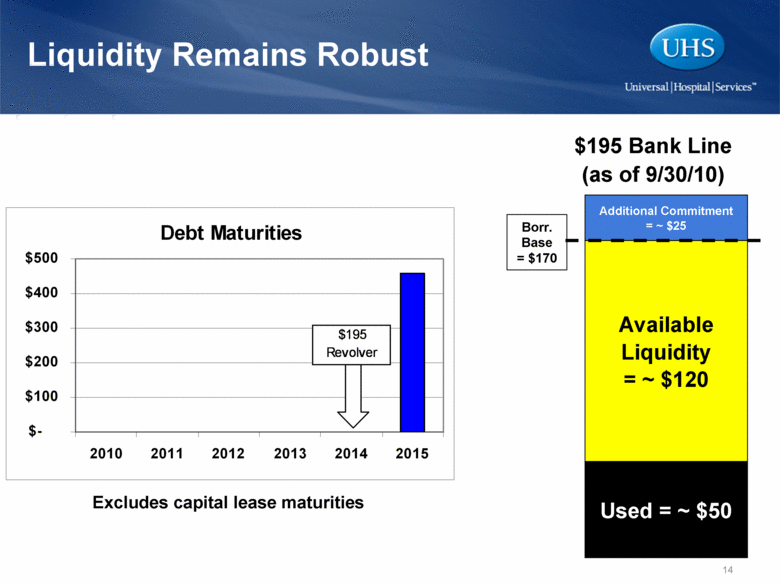
Liquidity Remains Robust Additional Commitment = ~ $25 $195 Bank Line (as of 9/30/10) Available Liquidity = ~ $120 Used = ~ $50 Borr. Base = $170 Excludes capital lease maturities Debt Maturities $- $100 $200 $300 $400 $500 2010 2011 2012 2013 2014 2015 $195 Revolver |
|
|
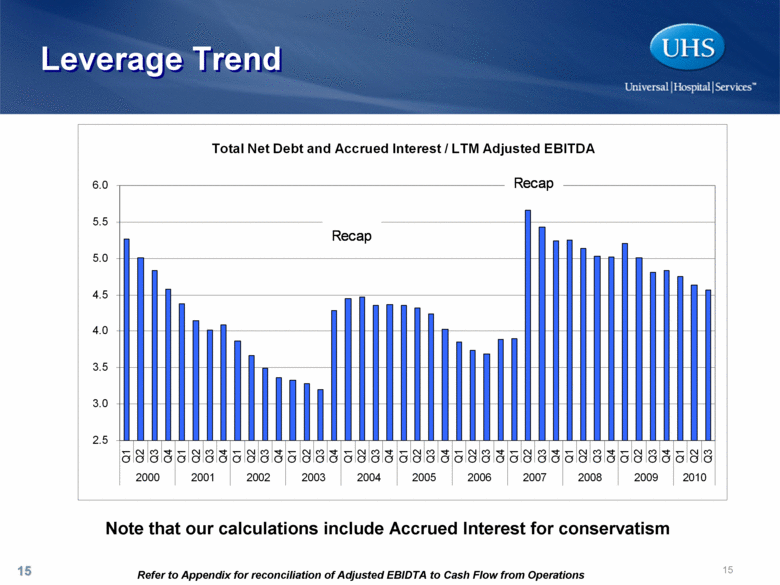
Leverage Trend 15 Refer to Appendix for reconciliation of Adjusted EBIDTA to Cash Flow from Operations Note that our calculations include Accrued Interest for conservatism |
|
|
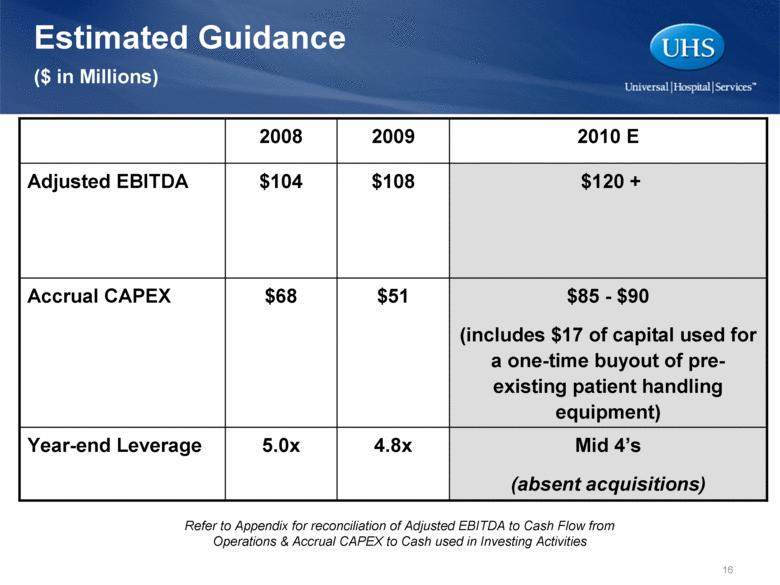
Estimated Guidance ($ in Millions) 4.8x $51 $108 2009 Mid 4’s (absent acquisitions) 5.0x Year-end Leverage $68 $104 2008 $85 - $90 (includes $17 of capital used for a one-time buyout of pre-existing patient handling equipment) Accrual CAPEX $120 + 2010 E Adjusted EBITDA Refer to Appendix for reconciliation of Adjusted EBITDA to Cash Flow from Operations & Accrual CAPEX to Cash used in Investing Activities |
|
|
Summary Numerous “lines in the water” will continue to drive growth again in 2010 despite continued economic and political headwinds Adjusted EBITDA (000’s) $140,000 $120,000 $100,000 $80,000 $60,000 $40,000 $20,000 $- 2000 2001 2002 2003 2004 2005 2006 2007 2008 2009 2010E |
|
|
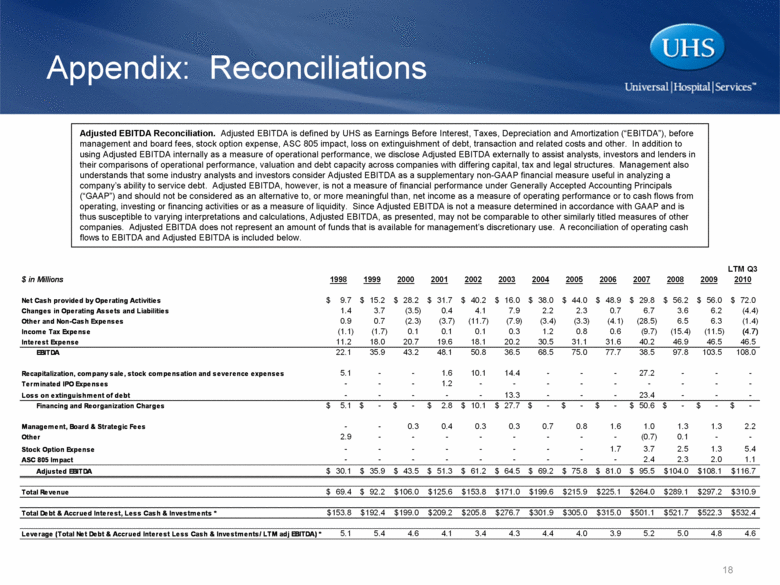
Appendix: Reconciliations Adjusted EBITDA Reconciliation. Adjusted EBITDA is defined by UHS as Earnings Before Interest, Taxes, Depreciation and Amortization (“EBITDA”), before management and board fees, stock option expense, ASC 805 impact, loss on extinguishment of debt, transaction and related costs and other. In addition to using Adjusted EBITDA internally as a measure of operational performance, we disclose Adjusted EBITDA externally to assist analysts, investors and lenders in their comparisons of operational performance, valuation and debt capacity across companies with differing capital, tax and legal structures. Management also understands that some industry analysts and investors consider Adjusted EBITDA as a supplementary non-GAAP financial measure useful in analyzing a company’s ability to service debt. Adjusted EBITDA, however, is not a measure of financial performance under Generally Accepted Accounting Principals (“GAAP”) and should not be considered as an alternative to, or more meaningful than, net income as a measure of operating performance or to cash flows from operating, investing or financing activities or as a measure of liquidity. Since Adjusted EBITDA is not a measure determined in accordance with GAAP and is thus susceptible to varying interpretations and calculations, Adjusted EBITDA, as presented, may not be comparable to other similarly titled measures of other companies. Adjusted EBITDA does not represent an amount of funds that is available for management’s discretionary use. A reconciliation of operating cash flows to EBITDA and Adjusted EBITDA is included below. |
|
|
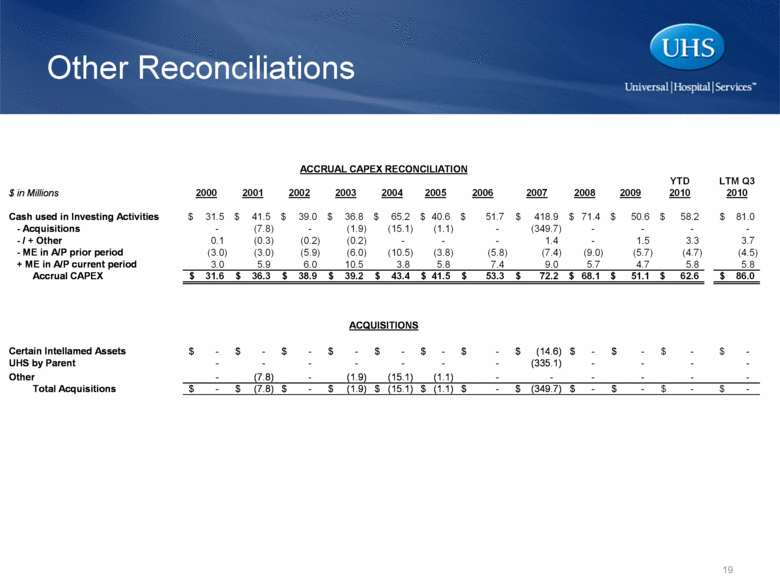
Other Reconciliations |

