Attached files
| file | filename |
|---|---|
| 8-K - DYNEGY INC 8-K 11-08-2010 - DYNEGY INC. | form8k.htm |
| EX-99.1 - EXHIBIT 99.1 - DYNEGY INC. | ex99_1.htm |

Third Quarter 2010 Results
November 8, 2010
Investor Relations | Norelle Lundy, Vice President | Laura Hrehor, Senior Director | 713-507-6466 | ir@dynegy.com

Cautionary Statement Regarding Forward-Looking Statements
This presentation contains statements reflecting assumptions, expectations, projections, intentions or beliefs about future events that are intended as “forward looking statements.” Discussion
of risks and uncertainties that could cause actual results to differ materially from current projections, forecasts, estimates and expectations of Dynegy Inc. (“Dynegy”) is contained in Dynegy’s
filings with the Securities and Exchange Commission (the “SEC”). Specifically, Dynegy makes reference to, and incorporates herein by reference, the section entitled “Risk Factors” in its 2009
Form 10-K and first, second and third quarter 2010 Form 10-Qs, and the section entitled “Cautionary Statement Regarding Forward-Looking Statements” in its most recent definitive proxy
statement filed with the SEC on October 4, 2010. In addition to the risks and uncertainties set forth in Dynegy’s SEC filings, the forward-looking statements described in this presentation
could be affected by, among other things, (i) the timing and anticipated benefits to be achieved through Dynegy’s 2010-2013 company-wide cost savings program; (ii) beliefs and assumptions
relating to liquidity, available borrowing capacity and capital resources generally; (iii) expectations regarding environmental matters, including costs of compliance, availability and adequacy
of emission credits, and the impact of ongoing proceedings and potential regulations or changes to current regulations, including those relating to climate change, air emissions, cooling water
intake structures, coal combustion byproducts, and other laws and regulations to which Dynegy is, or could become, subject; (iv) beliefs about commodity pricing and generation volumes; (v)
anticipated liquidity in the regional power and fuel markets in which Dynegy transacts, including the extent to which such liquidity could be affected by poor economic and financial market
conditions or new regulations and any resulting impacts on financial institutions and other current and potential counterparties; (vi) sufficiency of, access to and costs associated with coal,
fuel oil and natural gas inventories and transportation thereof; (vii) beliefs and assumptions about market competition, generation capacity and regional supply and demand characteristics of
the wholesale power generation market, including the potential for a market recovery over the longer term; (viii) the effectiveness of Dynegy’s strategies to capture opportunities presented
by changes in commodity prices and to manage its exposure to energy price volatility; (ix) beliefs and assumptions about weather and general economic conditions; (x) beliefs regarding the
U.S. economy, its trajectory and its impacts, as well as Dynegy’s stock price; (xi) projected operating or financial results, including anticipated cash flows from operations, revenues and
profitability; (xii) beliefs and expectations regarding the Plum Point Project; (xiii) expectations regarding Dynegy’s revolver capacity, credit facility compliance, collateral demands, capital
expenditures, interest expense and other payments; (xiv) Dynegy’s focus on safety and its ability to efficiently operate its assets so as to maximize its revenue generating opportunities and
operating margins; (xv) beliefs about the outcome of legal, regulatory, administrative and legislative matters; (xvi) expectations and estimates regarding capital and maintenance
expenditures, including the Midwest Consent Decree and its associated costs; and (xvii) uncertainties associated with the proposed transaction between Dynegy and an affiliate of Blackstone
(the “Merger”), including uncertainties relating to the anticipated timing of filings and approvals relating to the Merger and the sale by an affiliate of Blackstone of certain assets to NRG
Energy, Inc. (the “NRG Sale”), the outcome of legal proceedings that have been or may be instituted against Dynegy and/or others relating to the merger agreement and/or the NRG Sale, the
expected timing of completion of the Merger, the satisfaction of the conditions to the consummation of the Merger with an affiliate of Blackstone and the NRG Sale and the ability to
complete the Merger. Any or all of Dynegy’s forward-looking statements may turn out to be wrong. They can be affected by inaccurate assumptions or by known or unknown risks,
uncertainties and other factors, many of which are beyond Dynegy’s control.
Non-GAAP Financial Measures: This presentation contains non-GAAP financial measures including EBITDA, Adjusted EBITDA, Adjusted Cash Flow from Operations, Adjusted Free Cash Flow, Net
Debt and Adjusted Gross Margin. Reconciliations of these measures to the most directly comparable GAAP measures to the extent available without unreasonable effort are contained
herein. To the extent required, statements disclosing the utility and purposes of these measures are set forth in Item 2.02 to our Current Report on Form 8-K filed with the SEC on November
8, 2010, which is available on our website free of charge, www.dynegy.com.
WHERE YOU CAN FIND MORE INFORMATION
In connection with the Merger, Dynegy filed a definitive proxy statement with the SEC on October 4, 2010 and commenced mailing the definitive proxy statement and form of proxy to the
stockholders of Dynegy. BEFORE MAKING ANY VOTING DECISION, DYNEGY’S STOCKHOLDERS ARE URGED TO READ THE PROXY STATEMENT REGARDING THE MERGER CAREFULLY AND IN ITS
ENTIRETY BECAUSE IT CONTAINS IMPORTANT INFORMATION ABOUT THE PROPOSED MERGER. Dynegy’s stockholders are able to obtain, without charge, a copy of the definitive proxy
statement and other relevant documents filed with the SEC from the SEC’s website at http://www.sec.gov. Dynegy’s stockholders are also able to obtain, without charge, a copy of the
definitive proxy statement and other relevant documents by directing a request by mail or telephone to Dynegy Inc., Attn: Corporate Secretary, 1000 Louisiana Street, Suite 5800, Houston,
Texas 77002, telephone: (713) 507-6400, or from the Dynegy’s website, http://www.dynegy.com.
PARTICIPANTS IN THE SOLICITATION
Dynegy and its directors and officers may be deemed to be participants in the solicitation of proxies from Dynegy’s stockholders with respect to the Merger. Information about Dynegy’s directors
and executive officers and their ownership of Dynegy’s common stock is set forth in the proxy statement for Dynegy’s 2010 Annual Meeting of Stockholders, which was filed with the SEC on
April 2, 2010. Stockholders may obtain additional information regarding the interests of Dynegy and its directors and executive officers in the Merger, which may be different than those of
Dynegy’s stockholders generally, by reading the definitive proxy statement and other relevant documents regarding the Merger.
Forward-looking Statements
2

Financial Review

Capital & Liquidity (as of 9/30/10)
• Net debt and other obligations(1) of $4.0 billion
– Net cash-on-hand and short-term investments of
$673 million
$673 million
– Restricted cash of $850 million(2)
• Collateral of $557 million posted(4)
• Liquidity of ~$2.1 billion(5)
Financial Results
4
Quarterly Adjusted EBITDA ($MM)
3Q Net Loss attributable to Dynegy
Inc.
Inc.
• Net Loss of $24 million for 3Q10 reflects after-
tax impairment charges of $81 million and after-
tax net mark-to-market gains of $79 million
tax impairment charges of $81 million and after-
tax net mark-to-market gains of $79 million
• This compares to a Net Loss for 3Q09 of $212
million which reflects after-tax impairment
charges of $235 million and after-tax net mark-
to-market losses of $78 million
million which reflects after-tax impairment
charges of $235 million and after-tax net mark-
to-market losses of $78 million
(1) Net debt and other obligations is a non-GAAP measure, please see the reconciliation on the Capital
Structure page in the Appendix; and for definition and uses, please see the Debt Definitions page in the
Appendix; (2) Restricted cash consists of $850 million related to Term Letter of Credit Facility; (3) For
2010 year-to-date, includes a receipt of approximately $350 million in cash from our futures clearing
manager. This is due to lower commodity prices, reduction of margin requirements and the posting of
short-term investments and a letter of credit in substitute of cash; (4) For additional information see the
Collateral page in the Appendix; (5) Does not include the $150MM contingent liquidity facility, which
becomes available based on increases in spark spreads and power prices for 2012 positions
|
Year-to-Date Results ($MM)
|
2009
|
2010
|
|
Adjusted EBITDA
|
$698
|
$436
|
|
Interest payments
|
(231)
|
(195)
|
|
Working capital/Non-cash
adjustments/Other(3) |
(131)
|
442
|
|
Adjusted cash flow from operations
|
$336
|
$683
|
|
Maintenance capital expenditures
|
(108)
|
(106)
|
|
Environmental capital expenditures
|
(241)
|
(164)
|
|
Adjusted free cash flow
|
$(13)
|
$413
|
|
|
|
|
|
Net Loss attributable to Dynegy Inc.
|
$(892)
|
$(70)
|
|
|
|
|
|
Net cash provided by operating activities
|
$304
|
$670
|
|
Net cash used in investing activities
|
$(341)
|
$(614)
|
|
Net cash provided by/(used in) financing activities
|
$47
|
($36)
|

Summary of 3Q 2010 Year-Over-Year
Regional Performance Drivers
Regional Performance Drivers
(1) Energy contributions include both physical and financial transactions. Physical transactions can be defined as generation sales, while financial transactions refer to hedging activities that
include financial swaps and options activity
include financial swaps and options activity
(2) 3Q09 volumes include assets sold in 4Q09
|
Midwest
|
• Adjusted EBITDA decreased 54%
– Energy contributions(1) from financial transactions declined due to lower value received on
hedging activity; partially offset by less premium expense due to fewer options purchased – Energy contributions from physical transactions increased due to improved prices and spark
spreads, offset by receipt in 3Q09 of $50 million for a contract sale and assignment – Less capacity revenue due to lower pricing in MISO and from assets sold in 4Q09
• Production volumes increased 11%
– Increase in volumes due to increased prices and spark spreads
• Midwest coal fleet achieved in-market-availability of 91%
|
3Q Volumes 2009 vs 2010 (MM Mwh) (2)
|
|
West
|
• Adjusted EBITDA decreased 50%
– Energy contributions from financial transactions declined as a result of less premium revenue
due to fewer options sold – Less tolling revenue due to assets sold in 4Q09
– Less revenue from South Bay due to timing for RMR payments in 2010 versus tolling payments
in 2009 • Production volumes decreased 72%
– Two CCGT facilities sold in 4Q09
– Compressed spark spreads
|
|
|
Northeast
|
• Adjusted EBITDA decreased 44%
– Energy contributions from financial transactions declined due to lower value received on
hedging activity and less premium revenue due to fewer options sold – Energy contributions from physical transactions increased due to increased prices and spark
spreads due to warmer weather – Less energy and capacity revenues due to asset sold in 4Q09
• Production volumes increased 14%
– Increase in volumes due to increased prices and spark spreads
• Danskammer achieved in-market-availability of 96%
|
5

6
|
Average Actual On-Peak Power Prices
|
||
|
($/MWh)
|
3Q09
|
3Q10
|
|
CIN Hub
|
$31
|
$48
|
|
PJM West
|
$40
|
$65
|
|
NI Hub
|
$31
|
$49
|
|
Average On-Peak Spark Spread ($/MWh)
|
||
|
PJM West/TetM3
|
$16
|
$33
|
|
NI Hub/ChiCG
|
$9
|
$19
|
|
Operating Income ($MM)
|
||
|
|
3Q09
|
3Q10
|
|
Midwest Segment
|
$5
|
$135
|
Midwest - Regional Results 3Q10
Develop.
Maint.
Enviro.
$241
$394
$ Million
Adjusted EBITDA
CapEx
• Adjusted EBITDA decreased by 54% period-over-period:
– Energy contributions from financial transactions were reduced due to
lower value received on hedging activity; partially offset by ~$20MM
due to less premium expense as a result of buying fewer options in
3Q10
lower value received on hedging activity; partially offset by ~$20MM
due to less premium expense as a result of buying fewer options in
3Q10
– Energy contributions from physical transactions increased due to
improved power prices and spark spreads, offset by receipt in 3Q09
of $50 million from a contract sale and assignment
improved power prices and spark spreads, offset by receipt in 3Q09
of $50 million from a contract sale and assignment
– Less capacity/tolling revenue of ~$20MM as a result of lower
capacity prices and expiration of Kendall toll
capacity prices and expiration of Kendall toll
– Less capacity revenue of ~$15MM as a result of sale of assets in 4Q09
– Improved CIN-Avg Gen basis 3Q10 of $3.36/MWh compared to
$4.08/MWh for 3Q09
$4.08/MWh for 3Q09
• Overall volumes increased 11% period-over-period primarily
due to:
due to:
– 15% greater coal volumes and 9% greater CCGT volumes due to
increased power prices and spark spreads
increased power prices and spark spreads
– 85% and 40% capacity factors for the coal fleet and CCGTs
respectively compared to 75% and 37% capacity factors for the coal
fleet and CCGTs respectively in 3Q09
respectively compared to 75% and 37% capacity factors for the coal
fleet and CCGTs respectively in 3Q09
• YTD CapEx decreased due to reduced Consent Decree spending and
removal of Plum Point project expenditures due to deconsolidation
removal of Plum Point project expenditures due to deconsolidation
• Operating Income 3Q10 reflects pre-tax MTM gains of $90 million.
Operating Income 3Q09 reflects a pre-tax MTM loss of $44 million and a
$147 million pre-tax asset impairment charge related to assets sold in
4Q09
Operating Income 3Q09 reflects a pre-tax MTM loss of $44 million and a
$147 million pre-tax asset impairment charge related to assets sold in
4Q09
Discret.

7
West - Regional Results 3Q10
|
Average On-Peak Spark Spread ($/MWh)
|
||
|
|
3Q09
|
3Q10
|
|
North Path 15
|
$12
|
$8
|
|
Operating Income ($MM)
|
||
|
|
3Q09
|
3Q10
|
|
West Segment
|
$34
|
$61
|
• Adjusted EBITDA decreased 50% period-over-period:
– Energy contributions from financial transactions reduced due to
~$20MM less premium revenue as a result of selling fewer
options
~$20MM less premium revenue as a result of selling fewer
options
– Less tolling revenue due to assets sold in 4Q09 of ~$35MM
– Less revenue from South Bay of ~$10MM due to timing for RMR
payments in 2010 versus tolling payments in 2009
payments in 2010 versus tolling payments in 2009
• Overall volumes decreased 72% period-over-period
primarily due to sale of assets in 4Q09, compressed spark
spreads and unplanned outage at Moss Landing
primarily due to sale of assets in 4Q09, compressed spark
spreads and unplanned outage at Moss Landing
– 3Q10 capacity factor for Moss Landing of 19% compared to 3Q09
capacity factor of 37%
capacity factor of 37%
• YTD CapEx increased due to maintenance at Moss Landing
• Operating Income 3Q10 includes a $22 million pre-tax
MTM gain. Operating Income 3Q09 reflects a pre-tax $39
million MTM loss and a $235 million asset impairment
charge related to assets sold in 4Q09
MTM gain. Operating Income 3Q09 reflects a pre-tax $39
million MTM loss and a $235 million asset impairment
charge related to assets sold in 4Q09
$ Million
Adjusted EBITDA
CapEx

8
Northeast - Regional Results 3Q10
|
Average Actual On-Peak Power Prices
|
||
|
($/MWh)
|
3Q09
|
3Q10
|
|
NY - Zone G
|
$44
|
$70
|
|
Average On-Peak Spark Spread ($/MWh)
|
||
|
Fuel Oil
|
$(72)
|
$(59)
|
|
NY - Zone A
|
$4
|
$19
|
|
Mass Hub
|
$13
|
$34
|
|
Operating Income/(Loss)($MM)
|
||
|
|
3Q09
|
3Q10
|
|
Northeast Segment
|
$1
|
$(90)
|
• Adjusted EBITDA decreased 44% period-over-period primarily
due to :
due to :
– Energy contributions from financial transactions declined due to
lower value received on hedging activity and less premium revenue
of ~$12MM as a result of selling fewer options
lower value received on hedging activity and less premium revenue
of ~$12MM as a result of selling fewer options
– Energy contributions from physical transactions increased due to
improved spark spreads and power prices due to warmer weather
improved spark spreads and power prices due to warmer weather
– Less energy and capacity revenues of ~$15MM due to the sale of the
Bridgeport facility in 4Q09
Bridgeport facility in 4Q09
• Production volume increased 14% period-over-period due to
increased spark spreads at combined cycle facilities,
additional ancillary service sales at Independence and
improved gas supply to Roseton
increased spark spreads at combined cycle facilities,
additional ancillary service sales at Independence and
improved gas supply to Roseton
– Capacity factors were 63% for Danskammer, 76% Casco Bay and 59% for
Independence versus 3Q09 capacity factors of 77% for Danskammer, 56% for
Casco Bay and 23% for Independence
Independence versus 3Q09 capacity factors of 77% for Danskammer, 56% for
Casco Bay and 23% for Independence
– Increase in production volume partially offset by decreased runtime from
Danskammer due to reduced dispatch
Danskammer due to reduced dispatch
• YTD CapEx decreased due to fewer outages
• Operating Loss 3Q10 reflects a $134 million pre-tax
impairment charge for Casco Bay and a pre-tax $20 million
MTM gain versus a pre-tax $45 million MTM loss in 3Q09.
impairment charge for Casco Bay and a pre-tax $20 million
MTM gain versus a pre-tax $45 million MTM loss in 3Q09.
$ Million
Adjusted EBITDA
CapEx

9
Narrowing 2010 Guidance Estimates
|
2010 Guidance - GAAP Measures
|
($MM)
|
||
|
Net loss
|
|
$
|
(200) - (180)
|
|
Net cash provided by operating activities
|
|
$
|
245 - 275
|
|
Net cash used in investing activities
|
|
$
|
(685)
|
|
Net cash used by financing activities
|
|
$
|
(65)
|
(1) Based on an average of 2010 actual and forward natural gas price of $4.80/MMBtu as of 7/6/2010; (2) Based on an average 2010 actual and forward natural gas price of $4.39/MMBtu as of
10/04/2010
10/04/2010
|
($MM)
|
8/6/2010 Guidance(1)
|
Change
|
10/4/2010 Guidance(2)
|
|||
|
Adjusted EBITDA
|
$
|
465 - 530
|
$
|
35 - 0
|
$
|
500 - 530
|
|
Interest payments
|
|
(380)
|
|
20
|
|
(360)
|
|
Working capital/Non-cash adjustments/Other
|
|
115
|
|
-
|
|
115
|
|
Adjusted Cash Flows from Operations
|
$
|
200 - 265
|
$
|
55-20
|
$
|
255 - 285
|
|
Maintenance capital expenditures
|
|
(120)
|
|
-
|
|
(120)
|
|
Environmental capital expenditures
|
|
(200)
|
|
-
|
|
(200)
|
|
Capitalized Interest
|
|
(25)
|
|
-
|
|
(25)
|
|
Adjusted Free Cash Flow
|
$
|
(145) - (80)
|
$
|
55 - 20
|
$
|
(90) - (60)
|
|
Table above is not intended as a GAAP reconciliation; reconciliation located in the Appendix.
|
||||||
• 2010 forward natural gas prices used for guidance estimates declined from $4.87/MMBtu to $3.82/MMBtu over a three month period
• Commodity prices fluctuate throughout year which creates changes to cash collateral postings. Therefore, we do not adjust our guidance estimate for
working capital until prices settle at year-end.
working capital until prices settle at year-end.
⁻ Changes in collateral postings are reported in working capital. As a result of lower commodity prices and reduced margin requirements, Dynegy has
received ~$175 million in cash previously posted as collateral with Dynegy’s futures clearing manager. Our guidance estimate for working capital has not
been adjusted to reflect receipt of this amount. Cash received to date will be partially offset by reduced future cash flows due to lower values of the
underlying generation.
⁻ In addition, Dynegy also received $175 million in second quarter 2010 as collateral postings were replaced with short-term investments and letters of
credit. Our guidance estimate for working capital has been adjusted to reflect the receipt of this amount.
credit. Our guidance estimate for working capital has been adjusted to reflect the receipt of this amount.
• Guidance estimates are forward-looking in nature, however, they do not include any potential impacts related to the Merger such as transaction costs or
termination fees in the event the Merger is not completed; actual results may vary materially from these estimates
termination fees in the event the Merger is not completed; actual results may vary materially from these estimates

Appendix
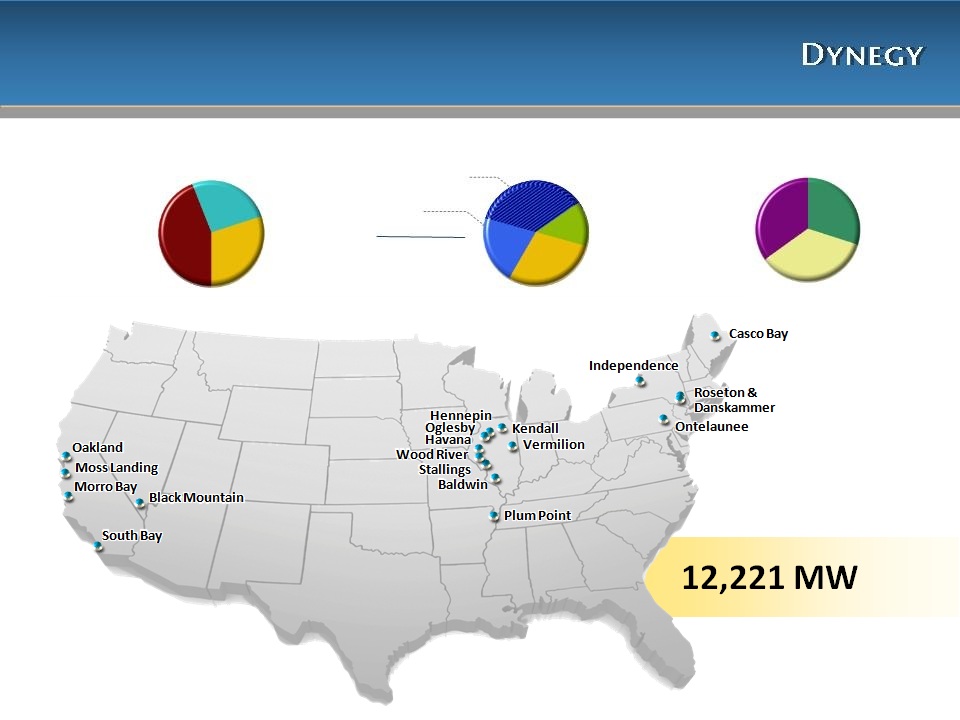
Dynegy’s Diversified Asset Portfolio
Dispatch Diversity
Peaking
34%
Intermediate
36%
Baseload
30%
Geographic Diversity
Midwest
43%
Northeast
27%
West
30%
Fuel Diversity
Combined Cycle
36%
Peaking
22%
Total Gas-Fired
58%
Coal
30%
Fuel Oil
12%
11
Note: An agreement to sell Dynegy’s interest in Plum Point is expected to close in November 2010

Significant Environmental Progress
12
On target to further reduce emissions in the Midwest
• Estimate of remaining cash spend is ~$272 million from
9/30/10 through 2013
9/30/10 through 2013
• Approximately 25% of remaining costs are firm
• Labor and material prices are assumed to escalate 4%
annually
annually
• All projects include installing baghouses and scrubbers
with the exception of Hennepin and Vermilion, which
have baghouses only
with the exception of Hennepin and Vermilion, which
have baghouses only
Labor
~60%
Rental Equipment
& Other ~4%
& Other ~4%
Estimated Go Forward
Cost Composition
Materials
~36%
2008
2010
2009
2011
2012
2007
Vermilion
Hennepin
Baldwin 3
Baldwin 1
Baldwin 2
Havana
Projects complete
Cash outflow
continues
through 2013
continues
through 2013

13
Mark-to-Market (Pre-tax)
|
($ Million)
|
3 Months Ending 9/30/09
|
3 Months Ending 9/30/10
|
||||||
|
Quarter
|
Midwest
|
West
|
Northeast
|
TOTAL
|
Midwest
|
West
|
Northeast
|
TOTAL
|
|
MTM for positions settled or to
be settled in the current year |
(92)
|
(9)
|
(31)
|
(132)
|
15
|
0
|
3
|
18
|
|
MTM gain/(losses) for future
period positions |
48
|
(30)
|
(14)
|
4
|
75
|
22
|
17
|
114
|
|
Total MTM adjustment
|
(44)
|
(39)
|
(45)
|
(128)
|
90
|
22
|
20
|
132
|
• To the extent MTM positions settled or to be settled in the current year were entered into prior to current year, MTM
gains/(losses) were also recognized in prior year
gains/(losses) were also recognized in prior year
• Option premiums are recognized in period received (paid) and are excluded from MTM impacts shown above
• A significant amount of MTM for future period positions has been settled in cash through a brokerage account
|
($ Million)
|
YTD Ending 9/30/09
|
YTD Ending 9/30/10
|
||||||
|
Year-to-Date
|
Midwest
|
West
|
Northeast
|
TOTAL
|
Midwest
|
West
|
Northeast
|
TOTAL
|
|
MTM for positions settled or to
be settled in the current year |
(53)
|
(17)
|
7
|
(63)
|
(20)
|
11
|
9
|
0
|
|
MTM gain/(losses) for future
period positions |
49
|
(33)
|
(15)
|
1
|
106
|
10
|
7
|
123
|
|
Total MTM adjustment
|
(4)
|
(50)
|
(8)
|
(62)
|
86
|
21
|
16
|
123
|
Note: Table includes MTM for both continuing and discontinued operations

14
2010 Commodity Pricing
Cin Hub/Cinergy ($/MWh)
New York Zone G ($/MWh)
NP-15 ($/MWh)
Natural Gas ($/MMBtu)
2010 A/F (Jul): $42.03
2010 A/F (Oct): $41.19
2009A: $34.67
2010 A/F (Jul): $57.95
2010 A/F (Oct): $56.99
2009A: $49.83
2010 A/F (Jul): $43.70
2010 A/F (Oct): $39.90
2009A: $39.27
2010 A/F (Jul): $4.80
2010 A/F (Oct): $4.39
2009A: $3.92
(1) Pricing as of 7/6/2010, which was the basis for estimates as presented 8/6/10. Prices reflect actual day ahead on-peak monthly prices for 1/1/10 - 7/6/2010 and quoted forward on-peak monthly prices for
7/7/2010-12/31/10; (2) Pricing as of 10/4/10. Prices reflect actual day ahead on-peak settlement prices for 1/1/10 - 10/4/2010 and quoted forward on-peak monthly prices for 10/5/2010-12/31/10
7/7/2010-12/31/10; (2) Pricing as of 10/4/10. Prices reflect actual day ahead on-peak settlement prices for 1/1/10 - 10/4/2010 and quoted forward on-peak monthly prices for 10/5/2010-12/31/10
2010 Actual/Forward as of
10/4/2010(2)
10/4/2010(2)
2010 Forward as of 7/6/2010(1)
2009 Actual

15
2010 Spark Spreads
PJM West ($/MWh)
Mass Hub ($/MWh)
NI Hub ($/MWh)
NP-15 ($/MWh)
2010 A/F (Jul): $17.12
2010 A/F (Oct): $18.45
2009A: $12.19
2010 A/F (Jul): $15.83
2010 A/F (Oct):$18.23
2009A: $12.10
2010 A/F (Jul): $7.97
2010 A/F (Oct): $9.50
2009A: $7.08
2010 A/F (Jul): $7.70
2010 A/F (Oct): $6.22
2009A: $8.28
2010 Actual/Forward as of 10/4/2010(2)
2010 Forward as of 7/6/2010(1)
2009 Actual
(1) Pricing as of 7/6/2010, which was the basis for estimates as presented 8/6/10. Prices reflect actual day ahead on-peak monthly prices for 1/1/10 - 7/6/2010 and quoted forward on-peak monthly prices for
7/7/2010-12/31/10; (2) Pricing as of 10/4/10. Prices reflect actual day ahead on-peak settlement prices for 1/1/10 - 10/4/2010 and quoted forward on-peak monthly prices for 10/5/2010-12/31/10
7/7/2010-12/31/10; (2) Pricing as of 10/4/10. Prices reflect actual day ahead on-peak settlement prices for 1/1/10 - 10/4/2010 and quoted forward on-peak monthly prices for 10/5/2010-12/31/10

16
• Total balance sheet debt as of 9/30/10 is ~$4.8B
• $850 million due in 2013 is a synthetic letter of credit facility supported by $850 million of
restricted cash
restricted cash
• Excludes $649 million related to Central Hudson lease
Debt Maturity Profile (as of 9/30/10, $MM)
$998

17
Central Hudson Lease - Northeast Segment
Central Hudson Cash Payments (remaining as of 9/30/10, $MM)
Imputed Debt Equivalent at PV (10%) of
future lease payments = $649MM(1)
future lease payments = $649MM(1)
$73
$112
$179
$142
$143
$143
$77
• Chart represents total cash lease payments, which are included in Operating Cash Flows
• Lease expense is approximately $50 million per year and included in Operating Expense
Central Hudson treated as Lease (2)
(as currently shown in GAAP financials):
(as currently shown in GAAP financials):
• Income Statement - $50 million lease expense included in
Adjusted EBITDA; no interest expense or depreciation &
amortization expense
Adjusted EBITDA; no interest expense or depreciation &
amortization expense
• Cash Flow Statement - $95 million cash payment included in
Operating Cash Flows
Operating Cash Flows
• Balance Sheet - lease obligation not included in debt balance
Central Hudson treated as Debt (2)
(would require the following adjustments to GAAP financials):
(would require the following adjustments to GAAP financials):
•Income Statement - Add back $50 million lease expense to Adjusted EBITDA; add $60
million imputed interest expense to Interest Expense; add $23 million estimated
depreciation & amortization expense; adjust tax expense for net difference
million imputed interest expense to Interest Expense; add $23 million estimated
depreciation & amortization expense; adjust tax expense for net difference
– Depreciation & Amortization calculated using purchase price of $920 million divided by 40 years
•Cash Flow Statement - Add back $35 million of imputed principal to Operating Cash Flows
– $95 million cash payment split between $60 million imputed interest payment (Operating Cash
Flows) and $35 million imputed principal payment (Financing Cash Flows)
Flows) and $35 million imputed principal payment (Financing Cash Flows)
•Balance Sheet - Include $649 million total PV (10%) of future lease payments
(1) PV of payments calculated as of 9/30/2010 ; (2) Calculated on an annual basis
Accrual Lease Expense (2)
$27

18
Capital Structure
Debt & Other Obligations as of 9/30/2010
Dynegy Power Corp.
Central Hudson(2) $649
Dynegy Holdings Inc.
$1,080 Million Revolver(1) $0
Term L/C Facility $850
Tranche B Term $68
Sr. Unsec. Notes/Debentures $3,450
Sub.Cap.Inc.Sec (“SKIS”) $200
Dynegy Inc.
Senior Debentures $257
Sithe Energies
|
TOTALS ($ Million)
|
9/30/2010
|
|
Secured
|
$918
|
|
Secured Non-Recourse
|
$257
|
|
Unsecured
|
$3,650
|
|
Lease Obligation
|
$649
|
|
($ Million)
|
9/30/2010
|
|
Total Obligations
|
$5,474
|
|
Less: Cash & short-term investments
|
673
|
|
Less: Restricted cash(3)
|
850
|
|
Net Debt & Other Obligations
|
$3,951
|
|
Less: Central Hudson Lease Obligation
|
649
|
|
Net Debt
|
$3,302
|
(1) Represents drawn amounts under the revolver; actual amount of revolver was $1.08 Billion as of 9/30/2010;
(2) Represents PV (10%) of future lease payments. Central Hudson lease payments are unsecured obligations of
Dynegy Inc., but are a secured obligation of an unrelated third party (“lessor”) under the lease. DHI has
guaranteed the lease payments on a senior unsecured basis; (3) Restricted cash includes $850MM related to the
Synthetic Letter of Credit facility

19
Collateral Excluding Clearing Settlements
|
($MM)
|
6/30/2010
|
|
9/30/2010
|
|
11/1/2010
|
|
Generation
|
$ 459
|
|
$ 469
|
|
$ 482
|
|
Other
|
88
|
|
88
|
|
88
|
|
Total
|
$ 547
|
|
$ 557
|
|
$ 570
|
|
|
|
|
|
|
|
|
Cash and short-term investments
|
$ 112
|
|
$ 104
|
|
$ 86
|
|
LCs
|
435
|
|
453
|
|
484
|
|
Total
|
$ 547
|
|
$ 557
|
|
$ 570
|
• Other collateral primarily includes Sithe Debt Service Reserve of $83 million
• In addition to cash and LC’s posted as collateral, we have granted additional permitted first priority liens on the assets currently
subject to first priority liens under our Credit Facility. The fair value collateralized by first priority liens, netted by counterparty,
includes liabilities of $60 million, $33 million and $17 million at 6/30/10, 9/30/10 and 11/1/10, respectively
subject to first priority liens under our Credit Facility. The fair value collateralized by first priority liens, netted by counterparty,
includes liabilities of $60 million, $33 million and $17 million at 6/30/10, 9/30/10 and 11/1/10, respectively

20
From 6/30/10 to 9/30/10:
• Increase in cash and short-term
investments was primarily attributable
to cash received from operating
activities
investments was primarily attributable
to cash received from operating
activities
• Due to covenant limitations, decrease
in revolver availability of $53 million at
09/30/10
in revolver availability of $53 million at
09/30/10
– Further reduction in capacity may
occur at 12/31/10
occur at 12/31/10
• Additional decrease in availability is
mostly attributable to increased
collateral postings around fuel
requirements
mostly attributable to increased
collateral postings around fuel
requirements
• Currently there is no availability under
the $150MM contingent letter of
credit facility
the $150MM contingent letter of
credit facility
– Under terms of this facility, up to
$150 million of capacity can become
available based on increases in spark
spreads and power prices for 2012
positions
$150 million of capacity can become
available based on increases in spark
spreads and power prices for 2012
positions
Liquidity

21
Contracted Generation Volumes - 2011 & 2012
|
2011 Contracted Generation Volumes as of:
|
|
|
|
|
|
|||||
|
|
Dec 08
|
Feb 09
|
May 09
|
Aug 09
|
Nov 09
|
Jan 10
|
Feb 10
|
May 10
|
Jul 10
|
Oct 10
|
|
Midwest
|
5%
|
5%
|
5%
|
15%
|
50%
|
75%
|
75%
|
90%
|
100%
|
95%
|
|
West
|
20%
|
20%
|
20%
|
40%
|
50%
|
>95%
|
>95%
|
>95%
|
100%
|
100%
|
|
Northeast
|
10%
|
5%
|
5%
|
15%
|
60%
|
>95%
|
>95%
|
>95%
|
100%
|
85%
|
|
Consolidated
|
10%
|
10%
|
10%
|
20%
|
50%
|
85%
|
85%
|
95%
|
100%
|
95%
|
|
2012 Contracted Generation Volumes as of:
|
|
|
||||
|
|
Nov 09
|
Jan 10
|
Feb 10
|
May 10
|
Jul 10
|
Oct 10
|
|
Midwest
|
0%
|
0%
|
0%
|
5%
|
15%
|
20%
|
|
West
|
15%
|
50%
|
50%
|
50%
|
50%
|
40%
|
|
Northeast
|
10%
|
10%
|
15%
|
25%
|
40%
|
35%
|
|
Consolidated
|
5%
|
15%
|
15%
|
15%
|
25%
|
25%
|

22
Debt Definitions
Debt Measures: We believe that our debt measures are useful because we consider these
measures as a way to re-evaluate our progress toward our strategic corporate objective of
reducing our overall indebtedness. In addition, many analysts and investors use these measures
for valuation analysis purposes. The most directly comparable GAAP financial measure to the
below measures is GAAP debt.
– “Net Debt” - We define “Net Debt” as total GAAP debt less cash and cash equivalents and restricted cash.
Restricted cash in this case consists only of collateral posted for the credit facility at the end of each
period, and the Sithe debt reserve, at the end of each period where applicable.
Restricted cash in this case consists only of collateral posted for the credit facility at the end of each
period, and the Sithe debt reserve, at the end of each period where applicable.
– “Net Debt and Other Obligations” - We define “Net Debt and Other Obligations” as total GAAP debt plus
certain operating lease commitments less cash and cash equivalents and restricted cash. Restricted cash in
this case consists only of collateral posted for the credit facility at the end of each period.
certain operating lease commitments less cash and cash equivalents and restricted cash. Restricted cash in
this case consists only of collateral posted for the credit facility at the end of each period.

23
|
Dynegy Generation Facilities
|
|||||
|
Region/Facility(1)
|
Location
|
Net Capacity(2)
|
Primary Fuel
|
Dispatch Type
|
NERC Region
|
|
MIDWEST
|
|
|
|
|
|
|
Baldwin
|
Baldwin, IL
|
1,800
|
Coal
|
Baseload
|
MISO
|
|
Havana
|
Havana, IL
|
|
|
|
|
|
Unit 6
|
|
441
|
Coal
|
Baseload
|
MISO
|
|
Hennepin
|
Hennepin, IL
|
293
|
Coal
|
Baseload
|
MISO
|
|
Oglesby
|
Oglesby, IL
|
63
|
Gas
|
Peaking
|
MISO
|
|
Stallings
|
Stallings, IL
|
89
|
Gas
|
Peaking
|
MISO
|
|
Vermilion
|
Oakwood, IL
|
|
|
|
|
|
Units 1-2
|
|
164
|
Coal/Gas
|
Baseload
|
MISO
|
|
Unit 3
|
|
12
|
Oil
|
Peaking
|
MISO
|
|
Wood River
|
Alton, IL
|
|
|
|
|
|
Units 4-5
|
|
446
|
Coal
|
Baseload
|
MISO
|
|
Kendall
|
Minooka, IL
|
1,200
|
Gas - CCGT
|
Intermediate
|
PJM
|
|
Ontelaunee
|
Ontelaunee Township, PA
|
580
|
Gas - CCGT
|
Intermediate
|
PJM
|
|
Plum Point (3)
|
Osceola, AR
|
140
|
Coal
|
Baseload
|
SERC
|
|
Midwest TOTAL
|
|
5,228
|
|
|
|
|
NORTHEAST
|
|
|
|
|
|
|
Independence
|
Scriba, NY
|
1,064
|
Gas - CCGT
|
Intermediate
|
NYISO
|
|
Roseton (4)
|
Newburgh, NY
|
1,200
|
Gas/Oil
|
Peaking
|
NYISO
|
|
Casco Bay
|
Veazie, ME
|
540
|
Gas - CCGT
|
Intermediate
|
ISO-NE
|
|
Danskammer
|
Newburgh, NY
|
|
|
|
|
|
Units 1-2
|
|
123
|
Gas/Oil
|
Peaking
|
NYISO
|
|
Units 3-4 (4)
|
|
370
|
Coal/Gas
|
Baseload
|
NYISO
|
|
Northeast TOTAL
|
|
3,297
|
|
|
|
|
WEST
|
|
|
|
|
|
|
Moss Landing
|
Monterey County, CA
|
|
|
|
|
|
Units 1-2
|
|
1,020
|
Gas - CCGT
|
Intermediate
|
CAISO
|
|
Units 6-7
|
|
1,509
|
Gas
|
Peaking
|
CAISO
|
|
Morro Bay (5)
|
Morro Bay, CA
|
650
|
Gas
|
Peaking
|
CAISO
|
|
South Bay (6)
|
Chula Vista, CA
|
309
|
Gas
|
Peaking
|
CAISO
|
|
Oakland
|
Oakland, CA
|
165
|
Oil
|
Peaking
|
CAISO
|
|
Black Mountain (7)
|
Las Vegas, NV
|
43
|
Gas
|
Baseload
|
WECC
|
|
West TOTAL
|
|
3,696
|
|
|
|
|
TOTAL GENERATION
|
12,221
|
|
|||
NOTES:
1)Dynegy owns 100% of each unit
listed except as otherwise indicated.
For each unit in which Dynegy owns
less than a 100% interest, the Total
Net Capacity set forth in this table
includes only Dynegy’s proportionate
share of such unit’s gross generating
capacity.
listed except as otherwise indicated.
For each unit in which Dynegy owns
less than a 100% interest, the Total
Net Capacity set forth in this table
includes only Dynegy’s proportionate
share of such unit’s gross generating
capacity.
2)Unit capabilities are based on winter
capacity.
capacity.
3)Represents net ownership of 21%.
An agreement to sell Dynegy’s interest
in Plum Point is expected to close in
November 2010.
An agreement to sell Dynegy’s interest
in Plum Point is expected to close in
November 2010.
4)Dynegy entered into a $920 MM sale
-leaseback transaction for the Roseton
facility and units 3 and 4 of the
Danskammer facility in 2001. Cash
lease payments extend until 2029 and
include $95 MM in 2010 and $112 MM
in 2011. GAAP lease payments are
$50.5 MM through 2030 and decrease
until last GAAP lease payment in 2035.
-leaseback transaction for the Roseton
facility and units 3 and 4 of the
Danskammer facility in 2001. Cash
lease payments extend until 2029 and
include $95 MM in 2010 and $112 MM
in 2011. GAAP lease payments are
$50.5 MM through 2030 and decrease
until last GAAP lease payment in 2035.
5)Represents operating capacity of
Units 3 & 4. Units 1 & 2, with a
combined net generating capacity of
352 MW, are currently in layup status
and out of operation.
Units 3 & 4. Units 1 & 2, with a
combined net generating capacity of
352 MW, are currently in layup status
and out of operation.
6)Represents operating capacity of
Units 1 & 2 and CT. Units 3 & 4, with a
combined net generating capacity of
397 MW, did not receive RMR status
from CAISO for 2010 and are currently
out of operation and in the process of
being decommissioned.
Units 1 & 2 and CT. Units 3 & 4, with a
combined net generating capacity of
397 MW, did not receive RMR status
from CAISO for 2010 and are currently
out of operation and in the process of
being decommissioned.
7)Dynegy owns a 50% interest in this
facility and the remaining 50% interest
is held by Chevron.
facility and the remaining 50% interest
is held by Chevron.

24

25
Reg G Reconciliation -3rd Quarter 2010 Adjusted EBITDA

26

27

28

29