Attached files
| file | filename |
|---|---|
| 8-K - AMERICAN CAMPUS COMMUNITIES, INC. 8-K - AMERICAN CAMPUS COMMUNITIES INC | a6484386.htm |
| EX-99.1 - EXHIBIT 99.1 - AMERICAN CAMPUS COMMUNITIES INC | a6484386_ex991.htm |
Exhibit 99.2
Supplemental Analyst Package - 3q 2010 October 27, 2010 American Campus Communities
Table of contents :: American Campus Communities Financial Highlights 1 Consolidated Balance Sheets 2 Consolidated Statements of Operations 3 Consolidated Statements of Funds from Operations 4 Wholly-owned Property Results of Operations 5 Seasonality of Operations 6 Capital Structure 7 Portfolio Overview 8 Owned Development Update 13 Third-party Development Update 14 Management Services Update 15 Investor Information 16
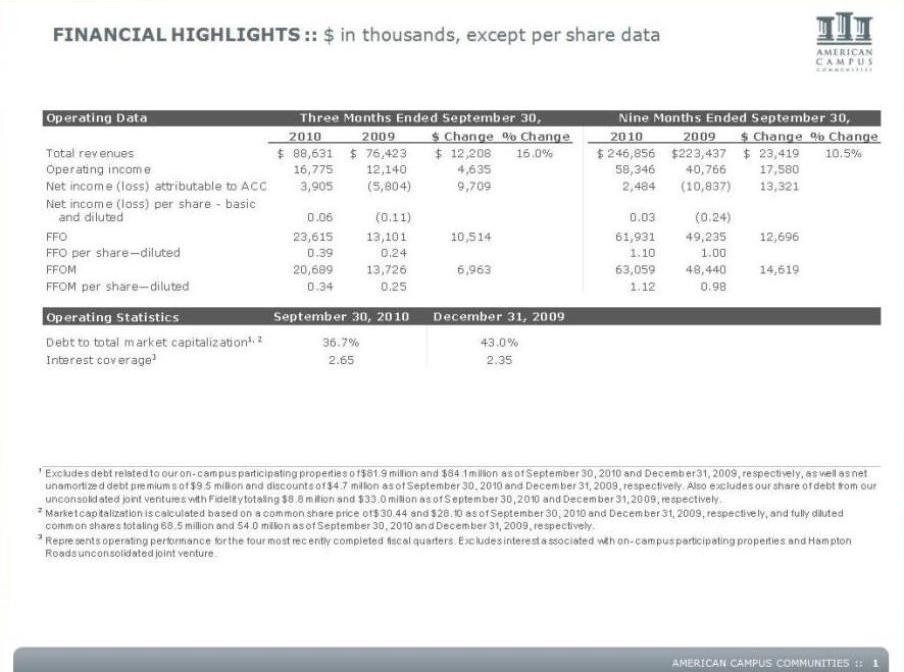
FINANCIAL highlights :: $ in thousands, except per share data American Campus Communities 2010 2009 $ Change % Change 2010 2009 $ Change % Change Total revenues $ 8 8,631 $ 76,423 $ 12,208 16.0% $ 246,856 $ 223,437 $ 2 3,419 10.5% Operating income 16,775 12,140 4,635 58,346 40,766 17,580 Net income (loss) attributable to ACC 3,905 (5,804) 9,709 2,484 (10,837) 13,321 Net income (loss) per share – basic and diluted 0 .06 (0.11) 0 .03 (0.24) FFO 23,615 13,101 10,514 61,931 49,235 12,696 FFO per share—diluted 0.39 0.24 1.10 1.00 FFOM 20,689 13,726 6,963 63,059 48,440 14,619 FFOM per share—diluted 0.34 0.25 1.12 0.98 Debt to total market capitalization1, 2 Interest coverage3 36.7% 2.65 43.0% 2.35 1 Excludes debt related to our on- campus participating properties of $81.9 million and $84.1 million as of September 30, 2010 and December 31, 2009, respectively, as well as net unamortized debt premiums of $9.5 million and discounts of $4.7 million as of September 30, 2010 and December 31, 2009, respectively. Also excludes our share of debt from our unconsolidated joint ventures with Fidelity totaling $8.8 million and $33.0 million as of September 30, 2010 and December 31, 2009, respectively. 2 Market capitalization is calculated based on a common share price of $30.44 and $28.10 as of September 30, 2010 and December 31, 2009, respectively, and fully diluted common shares totaling 68.5 million and 54.0 million as of September 30, 2010 and December 31, 2009, respectively. 3 Represents operating performance for the four most recently completed fiscal quarters. Excludes interest associated with on- campus participating properties and Hampton Roads unconsolidated joint venture. Three Months Ended September 30, Nine Months Ended September 30, September 30, 2010 December 31, 2009 Operating Data Operating Statistics 1
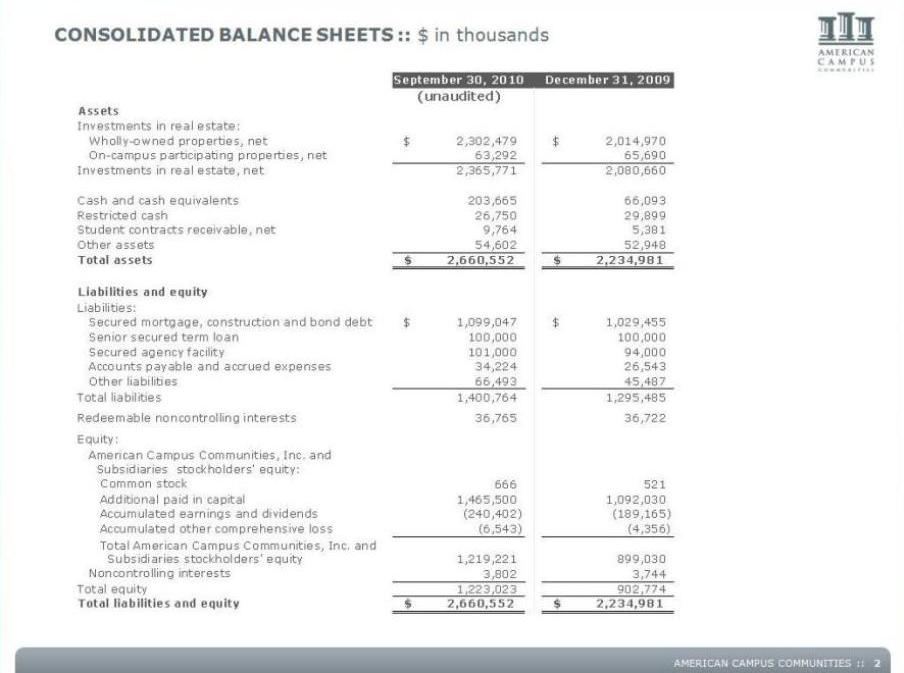
Consolidated balance sheets :: $ in thousands American Campus Communities September 30, 2010 December 31, 2009 (unaudited) Assets Investments in real estate: Wholly-owned properties, net $2,302,479 $2,014,970 On-campus participating properties, net 63,292 65,690 Investments in real estate, net 2,365,771 2,080,660 Cash and cash equivalents 203,665 66,093 Restricted cash 26,750 29,899 Student contracts receivable, net 9,764 5,381 Other assets 54,602 52,948 Total assets $2,660,552 $2,234,981 Liabilities and equity Liabilities: Secured mortgage, construction and bond debt $1,099,047 $1,029,455 Senior secured term loan 100,000 100,000 Secured agency facility 101,000 94,000 Accounts payable and accrued expenses 34,224 26,543 Other liabilities 66,493 45,487 Total liabilities 1,400,764 1,295,485 Redeemable noncontrolling interests 36,765 36,722 Equity: American Campus Communities, Inc. and Subsidiaries stockholders' equity: Common stock 666 521 Additional paid in capital 1,465,500 1,092,030 Accumulated earnings and dividends (240,402) (189,165) Accumulated other comprehensive loss (6,543) (4,356) 1,219,221 899,030 Noncontrolling interests 3,802 3,744 Total American Campus Communities, Inc. and Subsidiaries stockholders' equity 3,802 3,744 Total equity 1,223,023 902,774 Total liabilities and equity $2,660,552 $2,234,981 2
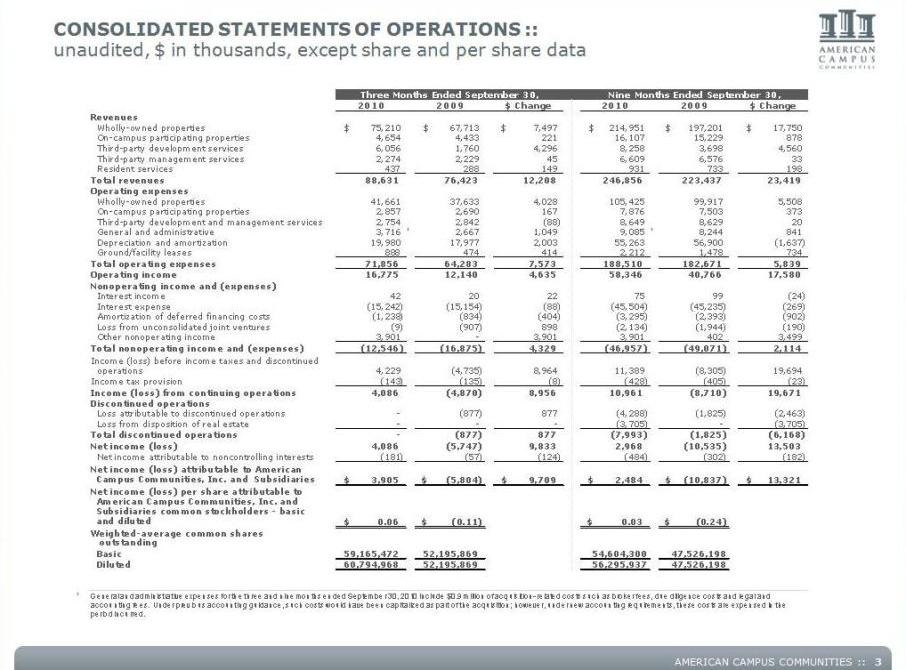
Consolidated statements of operations :: American Campus Communities unaudited, $ in thousands, except share and per share data 2010 2009 $ Change 2010 2009 $ Change Revenues Wholly-owned properties $75,210 $67,713 $7 ,497 $214,951 $197,201 $17,750 On-campus participating properties 4,654 4,433 2 21 16,107 15,229 8 78 Third-party development services 6,056 1,760 4,296 8,258 3,698 4,560 Third-party management services 2,274 2,229 45 6,609 6,576 3 3 Resident services 437 288 1 49 931 7 33 198 Total revenues 88,631 76,423 12,208 2 46,856 223,437 23,419 Three Months Ended September 30, Nine Months Ended September 30, Operating expenses Wholly-owned properties 41,661 37,633 4,028 105,425 99,917 5 ,508 On-campus participating properties 2,857 2,690 1 67 7,876 7,503 373 Third-party development and management services 2,754 2,842 (88) 8,649 8,629 2 0 General and administrative 3,716 1 2,667 1 ,049 9,085 1 8,244 8 41 Depreciation and amortization 19,980 17,977 2,003 55,263 56,900 (1,637) Ground/facility leases 888 474 4 14 2,212 1,478 734 Total operating expenses 71,856 64,283 7,573 1 88,510 182,671 5,839 Operating income 16,775 12,140 4,635 58,346 4 0,766 17,580 Nonoperating income and (expenses) Interest income 42 20 2 2 75 99 ( 24) Interest expense (15,242) (15,154) (88) (45,504) (45,235) ( 269) Amortization of deferred financing costs (1,238) (834) (404) (3,295) (2,393) ( 902) Loss from unconsolidated joint ventures (9) (907) 8 98 (2,134) (1,944) ( 190) Other nonoperating income 3,901 - 3,901 3,901 402 3,499 Total nonoperating income and (expenses) (12,546) (16,875) 4,329 (46,957) ( 49,071) 2,114 Income (loss) before income taxes and discontinued operations 4,229 (4,735) 8,964 11,389 (8,305) 19,694 Income tax provision (143) (135) (8) (428) (405) (23) Income (loss) from continuing operations 4,086 (4,870) 8 ,956 10,961 (8,710) 19,671 Discontinued operations Loss attributable to discontinued operations - (877) 877 (4,288) (1,825) (2,463) Loss from disposition of real estate - - - (3,705) - (3,705) Total discontinued operations - (877) 877 (7,993) ( 1,825) (6,168) Net income (loss) 4,086 (5,747) 9,833 2,968 (10,535) 13,503 Net income attributable to noncontrolling interests (181) ( 57) (124) (484) (302) ( 182) Net income (loss) attributable to American Campus Communities, Inc. and Subsidiaries $3,905 $(5,804) $9,709 $2,484 $(10,837) $13,321 Net income (loss) per share attributable to American Campus Communities, Inc. and Subsidiaries common stockholders – basic and diluted $0 .06 $(0.11) $0.03 $(0.24) Weighted-average common shares outstanding Basic 59,165,472 52,195,869 54,604,300 47,526,198 Diluted 60,794,968 52,195,869 56,295,937 47,526,198 1 General and administrative expenses for the three and nine months ended September 30, 2010 include $0.9 million of acquisition- related costs such as broker fees, due diligence costs and legal and accounting fees. Under previous accounting guidance, such costs would have been capitalized as part of the acquisition; however, under new accounting requirements, these costs are expensed in the period incurred. 3
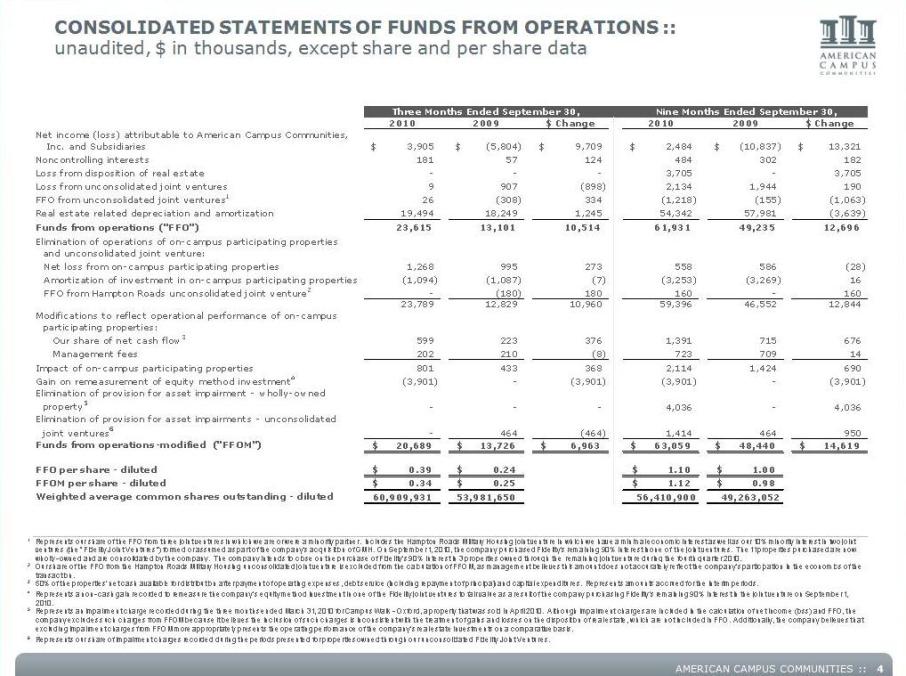
American Campus Communities Consolidated statements of funds from operations :: unaudited, $ in thousands, except share and per share data 2010 2009 $ Change 2010 2009 $ Change Net income (loss) attributable to American Campus Communities, Inc. and Subsidiaries $3,905 $(5,804) $9,709 $2,484 $(10,837) $13,321 Noncontrolling interests 181 5 7 124 484 302 182 Loss from disposition of real estate - - - 3,705 - 3,705 Loss from unconsolidated joint ventures 9 907 (898) 2,134 1 ,944 190 FFO from unconsolidated joint ventures1 26 (308) 334 (1,218) (155) (1,063) Real estate related depreciation and amortization 19,494 18,249 1 ,245 54,342 57,981 (3,639) Funds from operations ("FFO") 23,615 13,101 10,514 61,931 49,235 12,696 Elimination of operations of on-campus participating properties and unconsolidated joint venture: Net loss from on campus participating properties 1 ,268 995 273 558 586 (28) Amortization of investment in on-campus participating properties (1,094) (1,087) (7) (3,253) (3,269) 16 FFO from Hampton Roads unconsolidated joint venture2 - (180) 180 160 – 160 23,789 12,829 10,960 59,396 46,552 12,844 Modifications to reflect operational performance of on-campus participating properties: Our share of net cash flow3 599 223 376 1,391 715 676 Management fees 202 210 (8) 723 709 14 Impact of on-campus participating properties 801 433 368 2,114 1 ,424 690 Gain on remeasurement of equity method investment4 (3,901) - (3,901) (3,901) - (3,901) Elimination of provision for asset impairment - wholly-owned property5 - - - 4,036 - 4,036 Elimination of provision for asset impairments – unconsolidated joint ventures6 - 464 (464) 1,414 4 64 950 Funds from operations-modified ("FFOM") $20,689 $13,726 $6,963 $63,059 $48,440 $14,619 FFO per share - diluted $0.39 $0.24 $1.10 $1.00 FFOM per share - diluted $0.34 $0.25 $1.12 $0.98 Weighted average common shares outstanding - diluted 60,909,931 53,981,650 56,410,900 49,263,052 1 Represents our share of the FFO from three joint ventures in which we are or were a minority partner. Includes the Hampton Roads Military Housing joint venture in which we have a minimal economic interest as well as our 10% minority interest in two joint ventures (the "Fidelity Joint Ventures") formed or assumed as part of the company's acquisition of GMH. On September 1, 2010, the company purchased Fidelity's remaining 90% interest inone of the joint ventures. The 11 properties purchased are now wholly- owned and are consolidated by the company. The company intends to close on the purchase of Fidelity's 90% interest in 3 properties owned through the remaining joint venture during the fourth quarter 2010. 2 Our share of the FFO from the Hampton Roads Military Housing unconsolidated joint venture is excluded from the calculation of FFOM, as management believes this amount does not accurately reflect the company's participation in the economics of the transaction. 3 50% expenses capital expenditures interim periods 4 5 6 Represents our share of impairment charges recorded during the periods presented for properties owned through our unconsolidated Fidelity Joint Ventures. of the properties' net cash available for distribution after payment of operating expenses, debt service (including repayment of principal) and expenditures. Represents amounts accrued for the interimperiods. Represents a non- cash gain recorded to remeasure the company's equity method investment in one of the Fidelity joint ventures to fair value as a result of the company purchasing Fidelity's remaining 90% interest in the joint venture on September 1, 2010. Represents an impairment charge recorded during the three months ended March 31, 2010 for Campus Walk - Oxford, a property that was sold in April 2010. Although impairment charges are included in the calculation of net income (loss) and FFO, the company excludes such charges from FFOM because it believes the inclusion of such charges is inconsistent with the treatment of gains and losses on the disposition of real estate, which are not included in FFO. Additionally, the company believes that excluding impairment charges from FFOM more appropriately presents the operating performance of the company's real estate investments on a comparative basis. 4
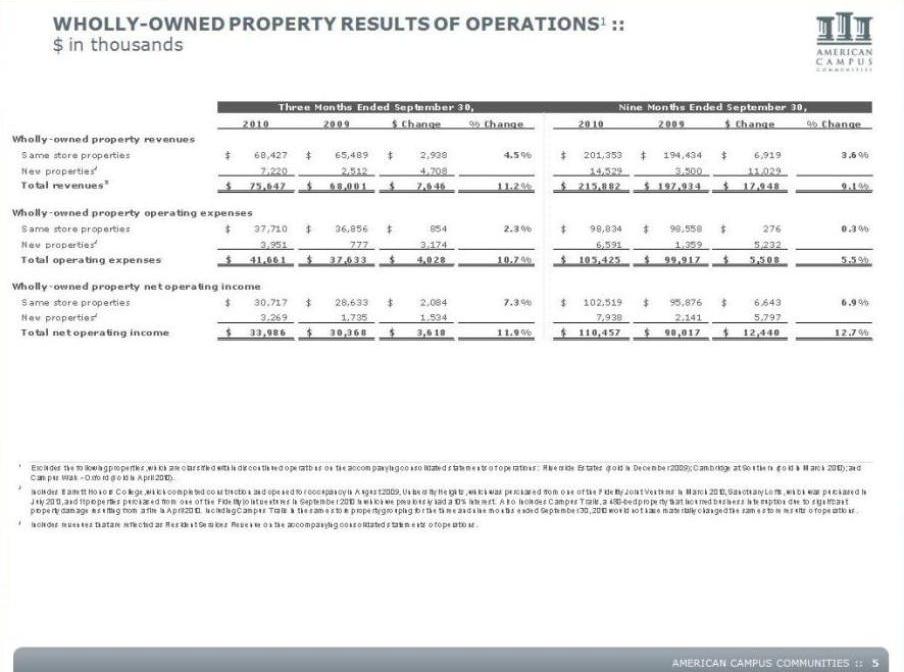
American Campus Communities Wholly-owned property results of operations1 :: $ in thousands 2010 2009 $ Change % Change 2010 2009 $ Change % Change Wholly-owned property revenues Same store properties $68,427 $65,489 $2,938 4.5% $201,353 $194,434 $6,919 3.6% New properties2 7,220 2,512 4,708 14,529 3,500 11,029 Total revenues3 $75,647 $68,001 $7,646 11.2% $215,882 $197,934 $17,948 9.1% Wholly-owned property operating expenses Same store properties $37,710 $36,856 $854 2.3% $98,834 $98,558 $276 0.3% New properties2 3,951 777 3,174 6,591 1,359 5,232 Total operating expenses $41,661 $37,633 $4 ,028 10.7% $105,425 $99,917 $5,508 5.5% Wholly-owned property net operating income Same store properties $30,717 $28,633 $2,084 7.3% $102,519 $95,876 $6,643 6.9% New properties2 3,269 1,735 1,534 7,938 2,141 5,797 Total net operating income $33,986 $30,368 $3,618 11.9% $10,457 $98,017 $12,440 12.7% 1 Excludes the following properties, which are classified within discontinued operations on the accompanying consolidated statements of operations: Riverside Estates (sold in December 2009); Cambridge at Southern (sold in March 2010); and -Oxford (sold 2 3 Campus Walk in April 2010). Includes Barrett Honors College, which completed construction and opened for occupancy in August 2009, University Heights, which was purchased from one of the Fidelity Joint Ventures in March 2010, Sanctuary Lofts, which was purchased in July 2010, and 11 properties purchased from one of the Fidelity joint ventures in September 2010 in which we previously had a 10% interest. A lso includes Campus Trails, a 480-bed property that incurred business interruptio n due to significant property damage resulting from a fire in April 2010. Including Campus Trails in the same store pro perty gro uping for the three and nine months ended September 30, 2010 would not have materially changed the same store results o f operations. Includes revenues that are reflected as Resident Services Revenue on the accompanying consolidated statements o f operations. 5
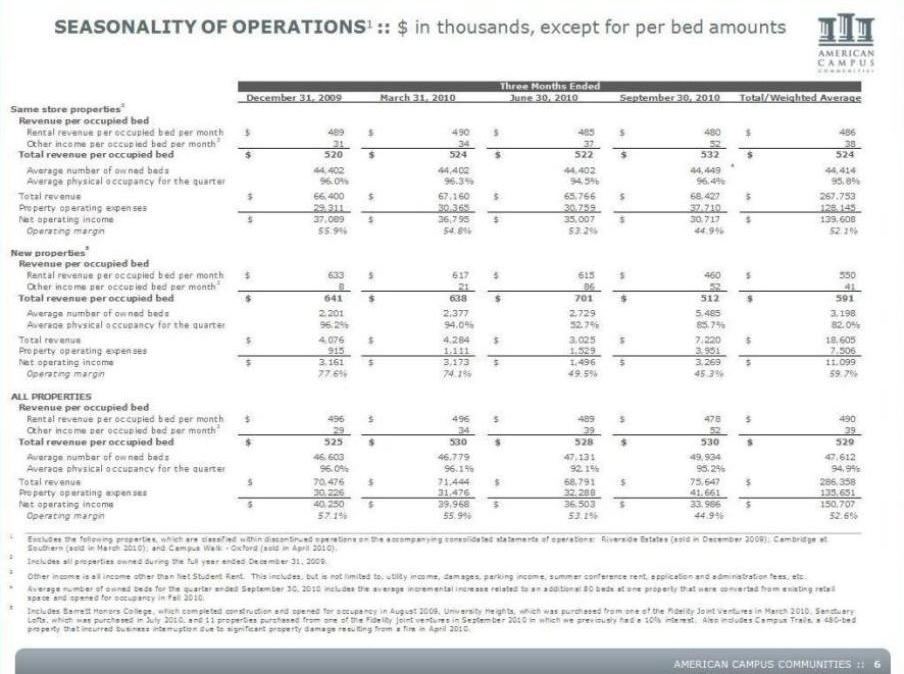
Seasonality of operations1 :: $ in thousands, except for per bed amounts Three Months Ended December 31, March 31, June 30, September 30, 2010 Total/Weighted Average Same store properties2 Revenue per occupied bed Rental revenue per occupied bed per month $489 $490 $485 $480 $486 Other income per occupied bed per month3 31 34 37 52 38 Total revenue per occupied bed $520 $524 $522 $532 $524 Average number of owned beds 44,402 44,402 44,402 44,449 4 44,414 Average physical occupancy for the quarter 96.0% 96.3% 94.5% 96.4% 95.8% Total revenue $66,400 $67,160 $65,766 $68,427 $267,753 Property operating expenses 29,311 30,365 30,759 37,710 128,145 Net operating income $37,089 $36,795 $35,007 $30,717 $139,608 Operating margin 55.9% 54.8% 53.2% 44.9% 52.1% New properties5 Revenue per occupied bed Rental revenue per occupied bed per month $633 $617 $615 $460 $550 Other income per occupied bed per month3 8 21 86 52 41 Total revenue per occupied bed $641 $638 $701 $512 $91 Average number of owned beds 2,201 2,377 2,729 5,485 3,198 Average physical occupancy for the quarter 96.2% 94.0% 52.7% 85.7% 82.0% Total revenue $4,076 $4,284 $3,025 $7,220 $18,605 Property operating expenses 915 1,111 1,529 3,951 7,506 Net operating income $3,161 $3,173 $1,496 $3,269 $11,099 Operating margin 77.6% 74.1% 49.5% 45.3% 59.7% ALL PROPERTIES Revenue per occupied bed Rental revenue per occupied bed per month $496 $496 $489 $478 $490 Other income per occupied bed per month3 29 34 39 52 39 Total revenue per occupied bed $525 $530 $528 $530 $529 Average number of owned beds 46,603 46,779 47,131 49,934 47,612 Average physical occupancy for the quarter 96.0% 96.1% 92.1% 95.2% 94.9% Total revenue $70,476 $71,444 $68,791 $75,647 $286,358 Property operating expenses 30,226 31,476 32,288 41,661 135,651 Net operating income $40,250 $39,968 $36,503 $33,986 $150,707 Operating margin 57.1% 55.9% 53.1% 44.9% 52.6% 1 2 3 Excludes the following properties, which are classified within discontinued operations on the accompanying consolidated statements of operations: Riverside Estates (sold in December 2009); Cambridge at Southern (sold in March 2010); and Campus Walk - Oxford (sold in April 2010). Other income is all income other than Net Student Rent. This includes, but is not limited to, utility income, damages, parking income, summer conference rent, application and administration fees, etc. Includes all properties owned during the full year ended December 31, 2009. AMERICAN CAMPUS COMMUNITIES :: 4 5 Includes Barrett Honors College, which completed construction and opened for occupancy in August 2009, University Heights, which was purchased from one of the Fidelity Joint Ventures in March 2010, Sanctuary Lofts, which was purchased in July 2010, and 11 properties purchased from one of the Fidelity joint ventures in September 2010 in which we previously had a 10% interest. Also includes Campus Trails, a 480-bed property that incurred business interruption due to significant property damage resulting from a fire in April 2010. Average number of owned beds for the quarter ended September 30, 2010 includes the average incremental increase related to an additional 80 beds at one property that were converted from existing retail space and opened for occupancy in Fall 2010. 6
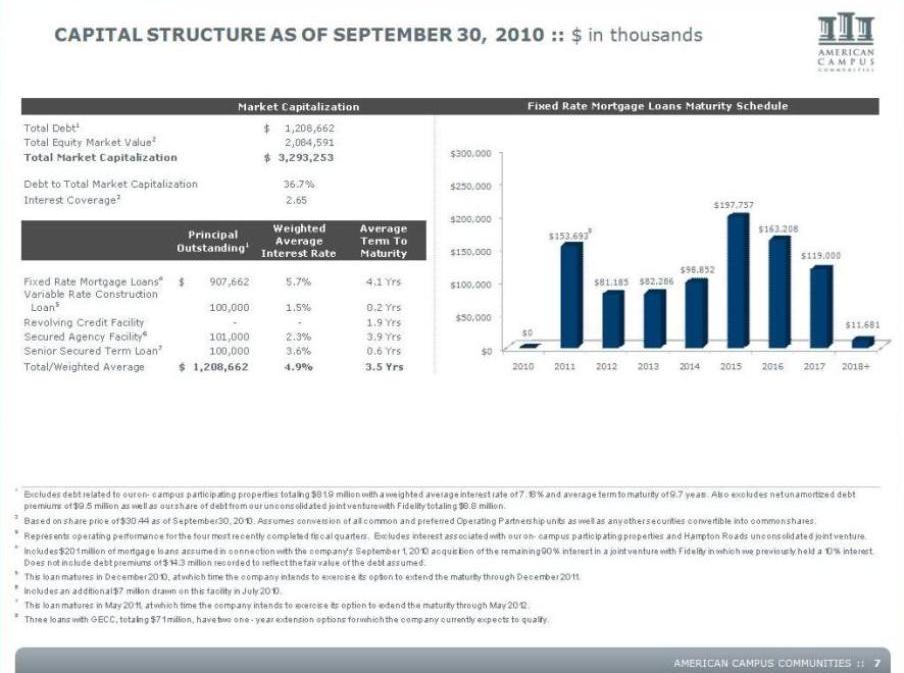
CAPITAL STRUCTURE AS OF September 30, 2010 :: $ in thousands Market Capitalization Total Debt1 $1,208,662 Total Equity Market Value2 2,084,591 Total Market Capitalization $3,293,253 Debt to Total Market Capitalization 36.7% Fixed Rate Mortgage Loans Maturity Schedule $250,000 $300,000 Interest Coverage3 2.65 Principal Outstanding1 Weighted Average Interest Rate Average Term To Maturity Fixed Rate Mortgage Loans4 $907,662 5.7% 4.1 Yrs $100,000 $150,000 $200,000, $153,693 $81,185 $82,286 $98,852 $197,757 $163,208 $119,000 8 Variable Rate Construction Loan5 100,000 1.5% 0.2 Yrs Revolving Credit Facility - - 1.9 Yrs Secured Agency Facility6 101,000 2.3% 3.9 Yrs Senior Secured Term Loan7 100,000 3.6% 0.6 Yrs Total/Weighted Average $1,208,662 4.9% 3.5 Yrs 2018+ $0 $50,000 100,000 2010 2011 2012 2013 2014 2015 2016 2017 2018+ $0 $11,681 1 2 3 4 5 This 2010 2011 Excludes debt related to our on- campus participating properties totaling $81.9 million with a weighted average interest rate of 7.18% and average term to maturity of 9.7 years. Also excludes net unamortized debt premiums of $9.5 million as well as our share of debt from our unconsolidated joint venture with Fidelity totaling $8.8 million. Based on share price of $30.44 as of September 30, 2010. Assumes conversion of all common and preferred Operating Partnership units as well as any other securities convertible into common shares. Represents operating performance for the four most recently completed fiscal quarters. Excludes interest associated with our on- campus participating properties and Hampton Roads unconsolidated joint venture. Includes $201 million of mortgage loans assumed in connection with the company's September 1, 2010 acquisition of the remaining 90% interest in a joint venture with Fidelity in which we previously held a 10% interest. Does not include debt premiums of $14.3 million recorded to reflect the fair value of the debt assumed. AMERICAN CAMPUS COMMUNITIES :: 6 7 8 Three loans with GECC, totaling $71 million, have two one - year extension options for which the company currently expects to qualify. loan matures in December 2010, at which time the company intends to exercise its option to extend the maturity through December 2011. This loan matures in May 2011, at which time the company intends to exercise its option to extend the maturity through May 2012. Includes an additional $7 million drawn on this facility in July 2010. 7
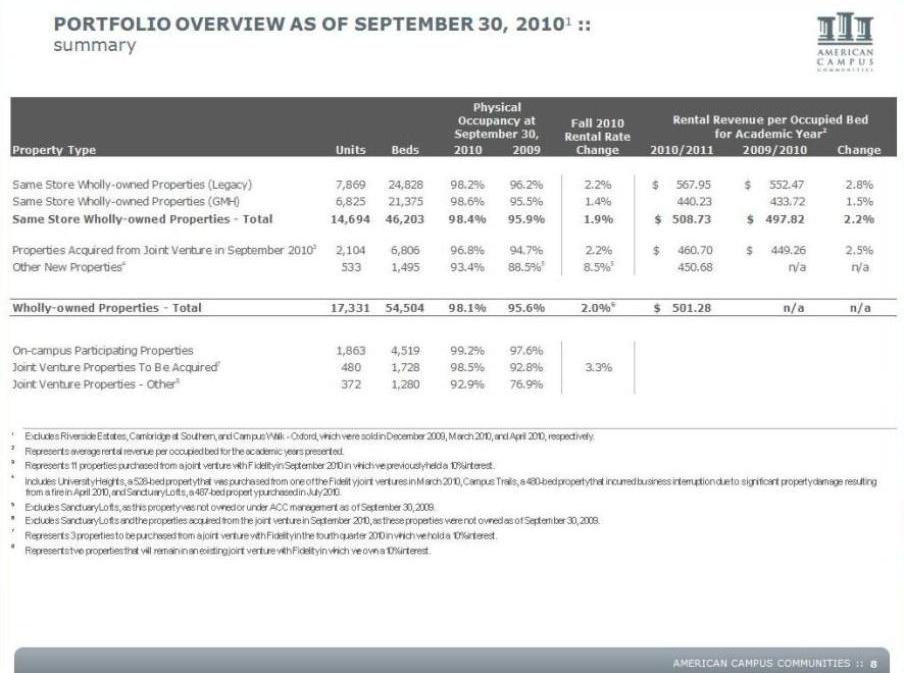
Portfolio overview as of September 30, 20101 :: summary Units Beds 2010 2009 2010/2011 2009/2010 Change Same Store Wholly-owned Properties Legacy) 7,869 24,828 98.2% 96.2% 2.2% $ 567.95 $552.47 2.8% Physical Occupancy at September 30, Property Type Fall 2010 Rental Rate Change Rental Revenue per Occupied Bed for Academic Year2 Same Store Wholly-owned Properties (GMH) 6,825 21,375 98.6% 95.5% 1.4% 440.23 433.72 1.5% Same Store Wholly-owned Properties - Total 14,694 46,203 98.4% 95.9% 1.9% $ 508.73 $ 497.82 2.2% Properties Acquired from Joint Venture in September 20103 2,104 6,806 96.8% 94.7% 2.2% $ 460.70 $ 449.26 2.5% Other New Properties4 533 1,495 93.4% 88.5%5 8.5%5 4 50.68 n/a n/a Wholly-owned Properties – Total 17,331 54,504 98.1% 95.6% 2.0%6 $ 501.28 n/a n/a On-campus Participating Properties 1,863 4,519 99.2% 97.6% Joint Venture Properties To Be Acquired7 480 1,728 98.5% 92.8% 3.3% Joint Venture Properties - Other8 372 1,280 92.9% 76.9% 1 2 3 4 Represents 11 properties purchased from a joint venture with Fidelity in September 2010 in which we previously held a 10% interest. Includes UniversityHeights 528 fromone of inMarch 2010 Trails 480 Represents average rental revenue per occupied bed for the academic years presented. Excludes Riverside Estates, Cambridge at Southern, and Campus Walk - Oxford, which were sold in December 2009, March 2010, and April 2010, respectively. 5 6 7 Represents 3 properties to be purchased from a joint venture with Fidelity in the fourth quarter 2010 in which we hold a 10% interest. 8 Represents two properties that will remain in an existing joint venture with Fidelity in which we own a 10% interest. Excludes Sanctuary Lofts and the properties acquired from the joint venture in September 2010, as these properties were not owned as of September 30, 2009. Excludes Sanctuary Lofts, as this property was not owned or under ACC management as of September 30, 2009. University Heights, a 528-bed property that was purchased from one of the Fidelity joint ventures in March 2010, Campus Trails, a 480-bed property that incurred business interruption due to significant property damage resulting from a fire in April 2010, and Sanctuary Lofts, a 487-bed property purchased in July 2010. AMERICAN CAMPUS COMMUNITIES 8
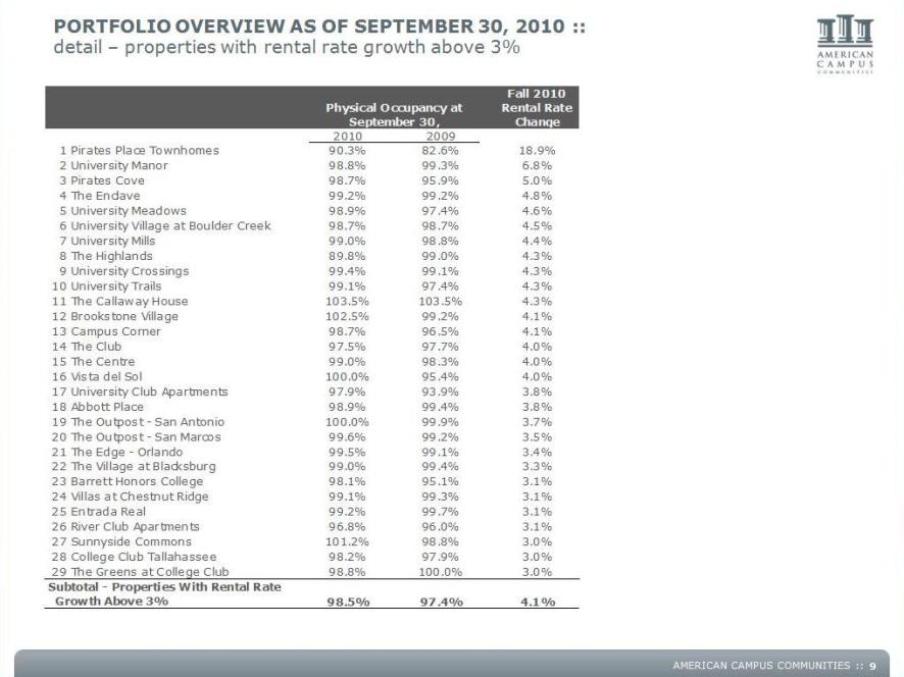
Portfolio overview as of September 30, 2010 :: detail – properties with rental rate growth above 3% Rental Rate Change 2010 2009 1 Pirates Place Townhomes 90.3% 82.6% 18.9% 2 University Manor 98.8% 99.3% 6.8% 3 Pirates Cove 98.7% 95.9% 5.0% 4 99 2% 99 2% 4 8% Physical Occupancy at September 30, The Enclave 99.2% 99.2% 4.8% 5 University Meadows 98.9% 97.4% 4.6% 6 University Village at Boulder Creek 98.7% 98.7% 4.5% 7 University Mills 99.0% 98.8% 4.4% 8 The Highlands 89.8% 99.0% 4.3% 9 University Crossings 99.4% 99.1% 4.3% 10 University Trails 99.1% 97.4% 4.3% 11 The Callaway House 103.5% 103.5% 4.3% 12 Brookstone Village 102.5% 99.2% 4.1% 13 Campus Corner 98.7% 96.5% 4.1% 14 The Club 97.5% 97.7% 4.0% 15 The Centre 99.0% 98.3% 4.0% 16 Vista del Sol 100.0% 95.4% 4.0% 17 University Club Apartments 97.9% 93.9% 3.8% 18 Abbott Place 98.9% 99.4% 3.8% 19 The Outpost - San Antonio 100.0% 99.9% 3.7% 20 The Outpost - San Marcos 99.6% 99.2% 3.5% 21 The Edge - Orlando 99.5% 99.1% 3.4% 22 The Village at Blacksburg 99.0% 99.4% 3.3% 23 Barrett Honors College 98.1% 95.1% 3.1% 24 Villas at Chestnut Ridge 99.1% 99.3% 3.1% 25 Entrada Real 99.2% 99.7% 3.1% 26 River Club Apartments 96.8% 96.0% 3.1% 27 Sunnyside Commons 101.2% 98.8% 3.0% 28 College Club Tallahassee 98.2% 97.9% 3.0% 29 The Greens at College Club 98.8% 100.0% 3.0% AMERICAN CAMPUS COMMUNITIES :: 98.5% 97.4% 4.1% Subtotal - Properties With Rental Rate Growth Above 3% 9
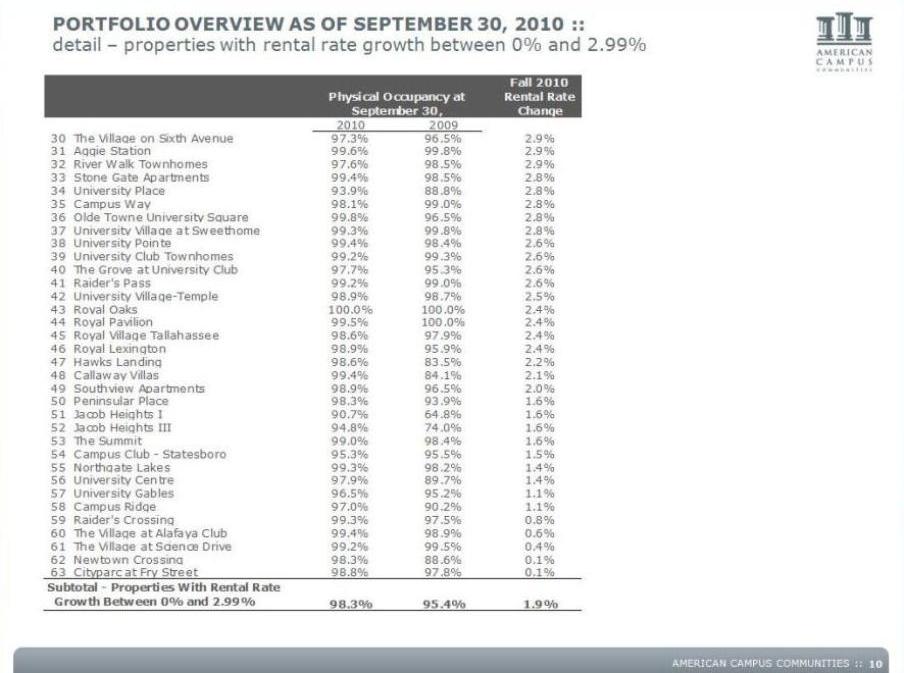
Portfolio overview as of September 30, 2010 :: detail – properties with rental rate growth between 0% and 2.99% Fall 2010 Rental Rate Change 2010 2009 30 The Village on Sixth Avenue 97.3% 96.5% 2.9% 31 Aggie Station 99.6% 99.8% 2.9% 32 River Walk Townhomes 97.6% 98.5% 2.9% 33 Stone Gate Apartments 99.4% 98.5% 2.8% 34 University Place 93 9% 88 8% 2 8% Physical Occupancy at September 30, 93.9% 88.8% 2.8% 35 Campus Way 98.1% 99.0% 2.8% 36 Olde Towne University Square 99.8% 96.5% 2.8% 37 University Village at Sweethome 99.3% 99.8% 2.8% 38 University Pointe 99.4% 98.4% 2.6% 39 University Club Townhomes 99.2% 99.3% 2.6% 40 The Grove at University Club 97.7% 95.3% 2.6% 41 Raider's Pass 99.2% 99.0% 2.6% 42 University Village Temple 98.9% 98.7% 2.5% 43 Royal Oaks 100.0% 100.0% 2.4% 44 Royal Pavilion 99.5% 100.0% 2.4% 45 Royal Village Tallahassee 98.6% 97.9% 2.4% 46 Royal Lexington 98.9% 95.9% 2.4% 47 Hawks Landing 98.6% 83.5% 2.2% 48 Callaway Villas 99.4% 84.1% 2.1% 49 Southview Apartments 98.9% 96.5% 2.0% 50 Peninsular Place 98.3% 93.9% 1.6% 51 Jacob Heights I 90.7% 64.8% 1.6% 52 Jacob Heights III 94.8% 74.0% 1.6% 53 The Summit 99.0% 98.4% 1.6% 54 Campus Club - Statesboro 95.3% 95.5% 1.5% 55 Northgate Lakes 99.3% 98.2% 1.4% 56 University Centre 97.9% 89.7% 1.4% 57 University Gables 96.5% 95.2% 1.1% 58 Campus Ridge 97.0% 90.2% 1.1% 59 Raider's Crossing 99.3% 97.5% 0.8% 60 The Village at Alafaya Club 99.4% 98.9% 0.6% 61 The Village at Science Drive 99.2% 99.5% 0.4% 62 Newtown Crossing 98.3% 88.6% 0.1% 63 Cityparc at Fry Street 98.8% 97.8% 0.1% AMERICAN CAMPUS COMMUNITIES :: 98 8% 9 8% 0 % 98.3% 95.4% 1.9% Subtotal - Properties With Rental Rate Growth Between 0% and 2.99% 10
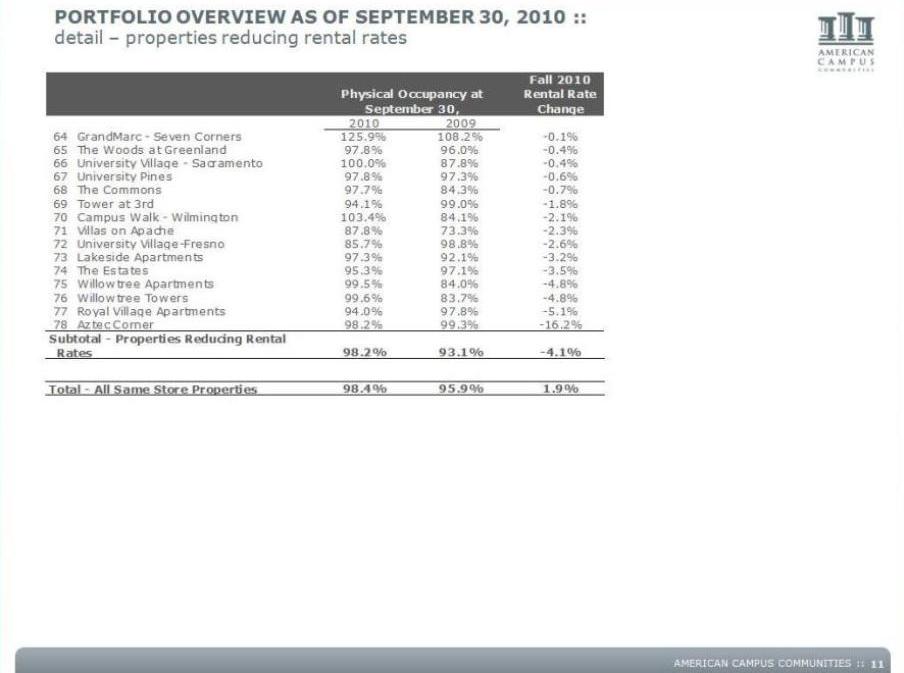
Portfolio overview as of September 30, 2010 :: detail – properties reducing rental rates Fall 2010 Physical Occupancy at Rental Rate Change 2010 2009 64 GrandMarc - Seven Corners 125.9% 108.2% -0.1% 65 The Woods at Greenland 97.8% 96.0% -0.4% 66 University Village - Sacramento 100.0% 87.8% -0.4% 67 University Pines 97.8% 97.3% -0.6% 68 The Commons 97 7% 84 3% 0 7% September 30, 97.7% 84.3% -0.7% 69 Tower at 3rd 94.1% 99.0% -1.8% 70 Campus Walk - Wilmington 103.4% 84.1% -2.1% 71 Villas on Apache 87.8% 73.3% -2.3% 72 University Village-Fresno 85.7% 98.8% -2.6% 73 Lakeside Apartments 97.3% 92.1% -3.2% 74 The Estates 95.3% 97.1% -3.5% 75 Willowtree Apartments 99.5% 84.0% -4.8% 76 Willowtree Towers 99.6% 83.7% -4.8% 77 Royal Village Apartments 94.0% 97.8% -5.1% 78 Aztec Corner 98.2% 99.3% -16.2% 98.2% 93.1% -4.1% Subtotal - Properties Reducing Rental Rates Total - All Same Store Properties 98.4% 95.9% 1.9% AMERICAN CAMPUS COMMUNITIES :: 11
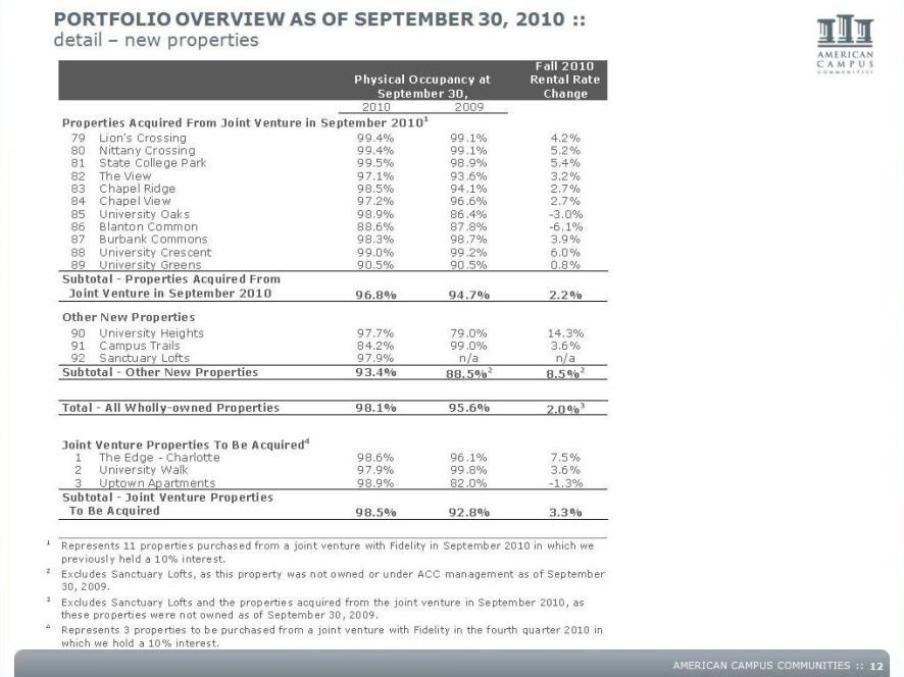
Portfolio overview as of September 30, 2010 :: detail – new properties Fall 2010 Rental Rate Change Physical Occupancy at September 30 2010 2009 Properties Acquired From Joint Venture in September 20101 79 Lion's Crossing 99.4% 99.1% 4.2% 80 Nittany Crossing 99.4% 99.1% 5.2% 81 State College Park 99.5% 98.9% 5.4% 82 The View 97.1% 93.6% 3.2% 83 Chapel Ridge 98.5% 94.1% 2.7% 30, 84 Chapel View 97.2% 96.6% 2.7% 85 University Oaks 98.9% 86.4% -3.0% 86 Blanton Common 88.6% 87.8% -6.1% 87 Burbank Commons 98.3% 98.7% 3.9% 88 University Crescent 99.0% 99.2% 6.0% 89 University Greens 90.5% 90.5% 0.8% Subtotal - Properties Acquired From 96.8% 94.7% 2.2% Other New Properties 90 University Heights 97.7% 79.0% 14.3% 91 Campus Trails 84.2% 99.0% 3.6% 92 Sanctuary Lofts 97.9% n/a n/a Subtotal - Other New Properties 93.4% 88.5%2 8.5%2 Joint Venture in September 2010 98.1% 95.6% 2.0%3 Joint Venture Properties To Be Acquired4 1 The Edge - Charlotte 98.6% 96.1% 7.5% 2 University Walk 97.9% 99.8% 3.6% 3 Uptown Apartments 98 9% 82 0% 1 3% Total - All Wholly-owned Properties 98.9% 82.0% -1.3% 98.5% 92.8% 3.3% 1 2 Represents 11 properties purchased from a joint venture with Fidelity in September 2010 in which we previously held a 10% interest. Subtotal - Joint Venture Properties To Be Acquired Excludes Sanctuary Lofts, as this property was not owned or under ACC management as of September AMERICAN CAMPUS COMMUNITIES :: 3 4 Represents 3 properties to be purchased from a joint venture with Fidelity in the fourth quarter 2010 in which we hold a 10% interest. 30, 2009. Excludes Sanctuary Lofts and the properties acquired from the joint venture in September 2010, as these properties were not owned as of September 30, 2009. 12
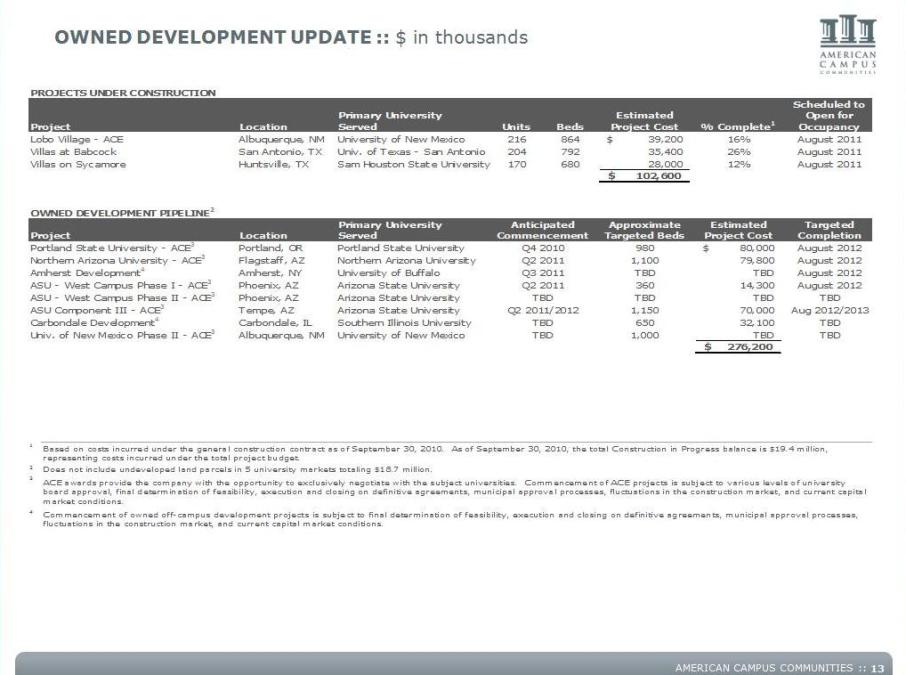
Owned development update :: $ in thousands PROJECTS UNDER CONSTRUCTION Location Primary University Served Units Beds Estimated Project Cost % Complete1 Scheduled to Open for Occupancy Lobo Village - ACE Albuquerque, NM University of New Mexico 216 864 $39,200 16% August 2011 Villas at Babcock San Antonio, TX Univ. of Texas - San Antonio 204 792 35,400 26% August 2011 Villas on Sycamore Huntsville, TX Sam Houston State University 170 680 28,000 12% August 2011 $102,600 Project OWNED DEVELOPMENT PIPELINE2 Location Primary University Served Approximate Targeted Beds Estimated Project Cost Targeted Completion Portland State University - ACE3 Portland, OR Portland State University 980 $80,000 August 2012 Northern Arizona University - ACE3 Flagstaff, AZ Northern Arizona University 1,100 79,800 August 2012 Amherst Development4 Amherst, NY University of Buffalo TBD TBD August 2012 ASU - West Campus Phase I - ACE3 Phoenix, AZ Arizona State University 360 1 4,300 August 2012 Q3 2011 Anticipated Project Commencement Q4 2010 Q2 2011 Q2 2011 ASU - West Campus Phase II - ACE3 Phoenix, AZ Arizona State University TBD TBD TBD ASU Component III - ACE3 Tempe, AZ Arizona State University 1,150 70,000 Aug 2012/2013 Carbondale Development4 Carbondale, IL Southern Illinois University 650 32,100 TBD Univ. of New Mexico Phase II - ACE3 Albuquerque, NM University of New Mexico 1,000 TBD TBD $276,200 TBD TBD Q2 2011/2012 Q TBD 1 2 3 Does not include undeveloped land parcels in 5 university markets totaling $18.7 million. Based on costs incurred under the general construction contract as of September 30, 2010. As of September 30, 2010, the total Construction in Progress balance is $19.4 million, representing costs incurred under the total project budget. awards provide the company universities Commencement of ACE university 4 Commencement of owned off-campus development projects is subject to final determination of feasibility, execution and closing on definitive agreements, municipal approval processes, fluctuations in the construction market, and current capital market conditions. ACE with the opportunity to exclusively negotiate with the subject universities. projects is subject to various levels of board approval, final determination of feasibility, execution and closing on definitive agreements, municipal approval processes, fluctuations in the construction market, and current capital market conditions. AMERICAN CAMPUS COMMUNITIES :: 13
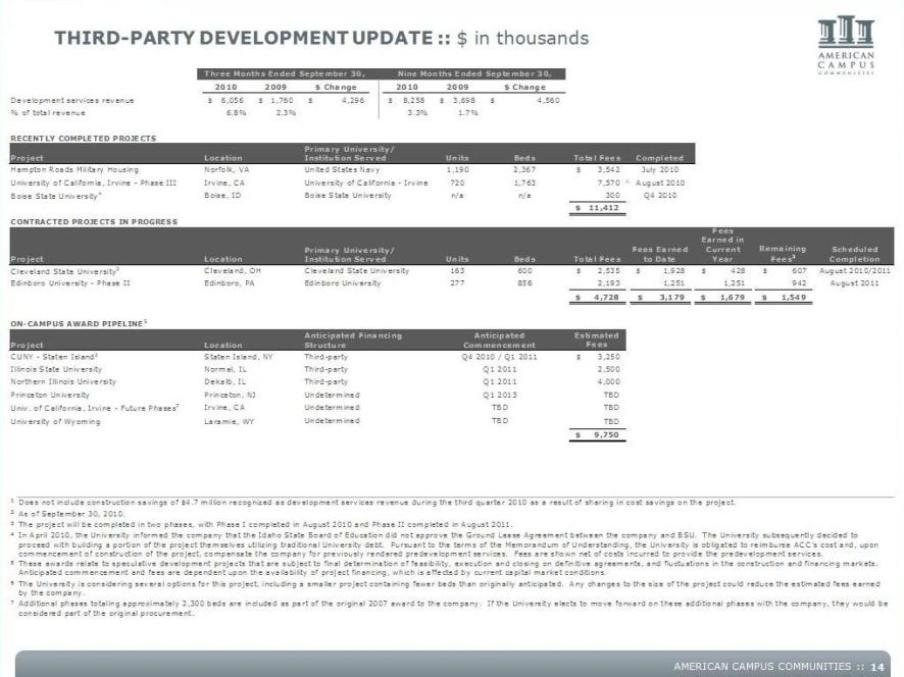
Third-party development update :: $ in thousands 2010 2009 $ Change 2010 2009 $ Change Nine Three Months Ended September 30, Months Ended September 30, Development services revenue $6,056 $1,760 $4,296 $8,258 $3,698 $4,560 % of total revenue 6.8% 2.3% 3.3% 1.7% RECENTLY COMPLETED PROJECTS Project Units Beds Total Fees Completed Hampton Roads Military Housing Norfolk, VA United States Navy 1,190 2,367 $ 3,542 July 2010 University of California, Irvine - Phase III Irvine, CA University of California - Irvine 720 1,763 7,570 1 August 2010 4 300 Q4 2010 Location Primary University/ Institution Served Boise State University4 Boise, Boise State University n/a n/a $11,412 CONTRACTED PROJECTS IN PROGRESS Project Units Beds Total Fees Fees Earned to Date Fees Earned in Current Year Remaining Fees2 Scheduled Completion Cleveland State University3 Cleveland, OH Cleveland State University 163 600 $2,535 $1,928 $428 $607 August 2010/2011 Edinboro University - Phase II Edinboro, PA Edinboro University 277 856 2,193 1 ,251 1,251 9 42 August 2011 Location Primary University/Institution Served $4 ,728 $3,179 $1,679 $1 ,549 ON-CAMPUS AWARD PIPELINE5 Project Estimated Fees CUNY - Staten Island6 Staten Island, NY $3 ,250 Illinois State University Normal, IL 2,500 Northern Illinois University Dekalb, IL 4,000 Anticipated Financing Structure Third-party Location Third-party Q4 2010 / Q1 2011 Anticipated Commencement Third-party Q1 2011 Q1 2011 Princeton University Princeton, NJ Undetermined TBD Univ. of California, Irvine - Future Phases7 Irvine, CA TBD University of Wyoming Laramie, WY TBD $9,750 Undetermined Q1 2013 TBD Undetermined TBD 1 2 As of September 30, 2010. 3 4 5 In April 2010, the University informed the company that the Idaho State Board of Education did not approve the Ground Lease Agreement between the company and BSU. The University subsequently decided to proceed with building a portion of the project themselves utilizing traditional University debt. Pursuant to the terms of the Memorandum of Understanding, the University is obligated to reimburse ACC’s cost and, upon commencement of construction of the project, compensate the company for previously rendered predevelopment services. Fees are shown net of costs incurred to provide the predevelopment services. These awards relate to speculative development projects that are subject to final determination of feasibility, execution and closing on definitive agreements, and fluctuations in the construction and financing markets. Anticipated commencement and fees are dependent upon the availability of project financing, which is affected by current capital market conditions. Does not include construction savings of $4.7 million recognized as development services revenue during the third quarter 2010 as a result of sharing in cost savings on the project. The project will be completed in two phases, with Phase I completed in August 2010 and Phase II completed in August 2011. AMERICAN CAMPUS COMMUNITIES :: 6 7 The University is considering several options for this project, including a smaller project containing fewer beds than originally anticipated. Any changes to the size of the project could reduce the estimated fees earned by the company. Additional phases totaling approximately 2,300 beds are included as part of the original 2007 award to the company. If the University elects to move forward on these additional phases with the company, they would be considered part of the original procurement. 14
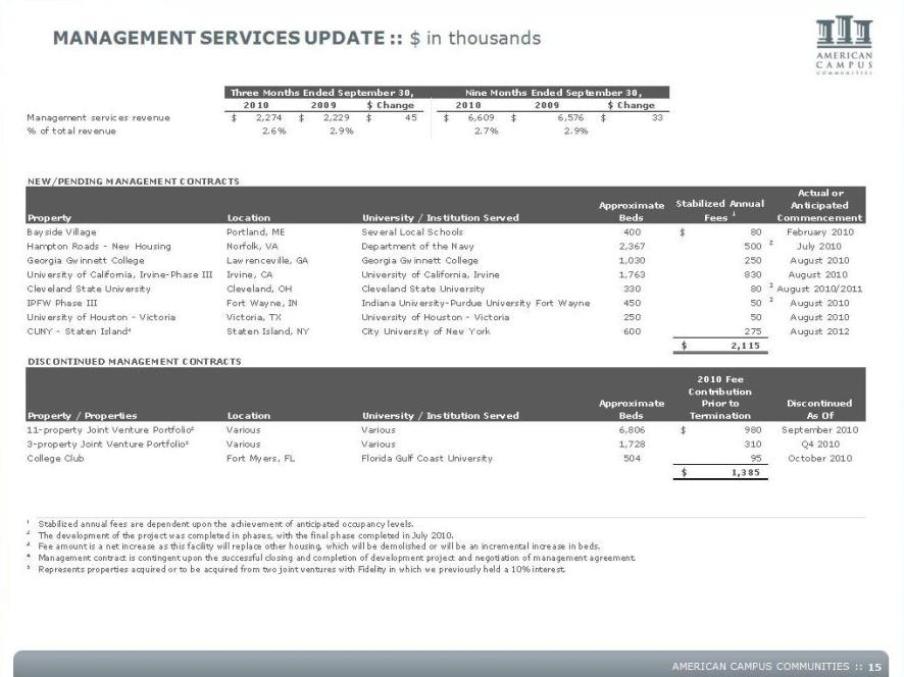
Management services update :: $ in thousands Three Months Ended September 30, Nine Months Ended September 30, 2010 2009 $ Change 2010 2009 $ Change Management services revenue $2,274 $2,229 $45 $6,609 $6,576 $33 % of total revenue 2.6% 2.9% 2.7% 2.9% NEW/PENDING MANAGEMENT CONTRACTS Actual or Property Approximate Beds Stabilized Annual Fees 1 Anticipated Commencement Bayside Village Portland, ME Several Local Schools 400 $ 80 February 2010 Hampton Roads - New Housing Norfolk, VA Department of the Navy 2,367 500 2 July 2010 Georgia Gwinnett College Lawrenceville, GA Georgia Gwinnett College 1,030 250 August 2010 University of California, Irvine-Phase III Irvine, CA University of California, Irvine 1,763 830 August 2010 Cleveland State University Cleveland OH Cleveland State University 330 80 3 August 2010/2011 Location University / Institution Served Cleveland, IPFW Phase III Fort Wayne, IN Indiana University-Purdue University Fort Wayne 450 50 3 August 2010 University of Houston - Victoria Victoria, TX University of Houston – Victoria 250 5 0 August 2010 CUNY - Staten Island⁴ Staten Island, NY City University of New York 600 275 August 2012 $2,115 DISCONTINUED MANAGEMENT CONTRACTS 2010 Fee Property / Properties Approximate Beds Contribution Prior to Termination Discontinued As Of 11-property Joint Venture Portfolio⁵ Various Various 6,806 $980 September 2010 3-property Joint Venture Portfolio⁵ Various Various 1,728 310 Q4 2010 College Club Fort Myers, FL Florida Gulf Coast University 504 9 5 October 2010 $1,385 Location University / Institution Served 1 Stabilized annual fees are dependent upon the achievement of anticipated occupancy levels. 2 The development of the project was completed in phases, with the final phase completed in July 2010. 3 4 5 Represents properties acquired or to be acquired from two joint ventures with Fidelity in which we previously held a 10% interest. Fee amount is a net increase as this facility will replace other housing, which will be demolished or will be an incremental increase in beds. Management contract is contingent upon the successful closing and completion of development project and negotiation of management agreement. AMERICAN CAMPUS COMMUNITIES :: 15
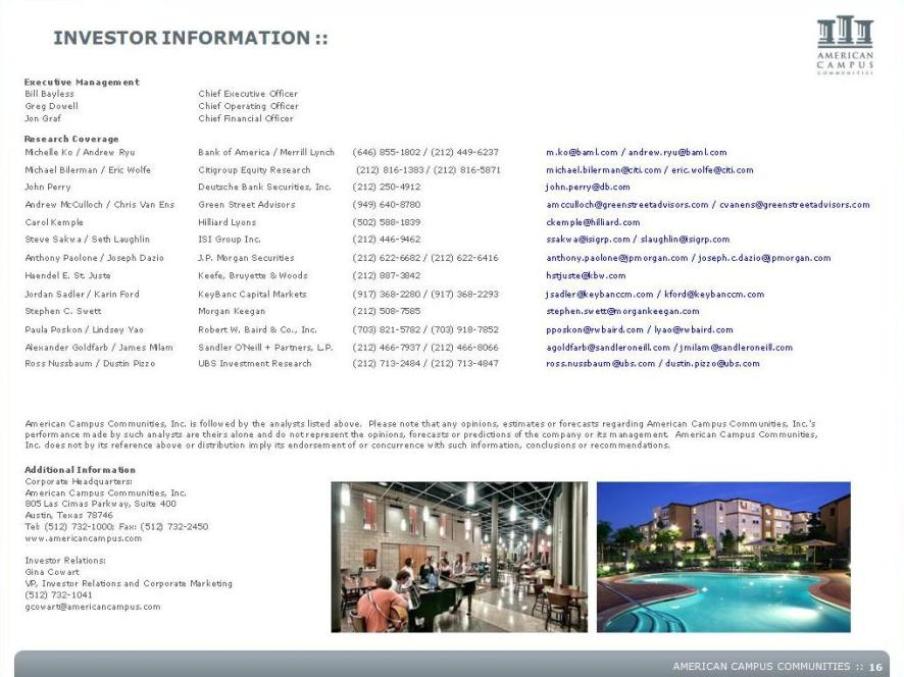
Investor information :: Executive Management Bill Bayless Chief Executive Officer Greg Dowell Chief Operating Officer Jon Graf Chief Financial Officer Research Coverage Michelle Ko / Andrew Ryu Bank of America / Merrill Lynch (646) 855-1802 / (212) 449-6237 m.ko@baml.com / andrew.ryu@baml.com Michael Bilerman / Eric Wolfe Citigroup Equity Research (212) 816-1383 / (212) 816-5871 michael.bilerman@citi.com / eric.wolfe@citi.com John Perry Deutsche Bank Securities, Inc. (212) 250-4912 john.perry@db.com Andrew McCulloch / Chris Van Ens Green Street Advisors (949) 640-8780 amcculloch@greenstreetadvisors.com / cvanens@greenstreetadvisors.com Carol Kemple Hilliard Lyons (502) 588-1839 ckemple@hilliard.com Steve Sakwa / Seth Laughlin ISI Group Inc. (212) 446-9462 ssakwa@isigrp.com / slaughlin@isigrp.com Anthony Paolone / Joseph Dazio J.P. Morgan Securities (212) 622-6682 / (212) 622-6416 anthony.paolone@jpmorgan.com / joseph.c.dazio@jpmorgan.com Haendel E. St. Juste Keefe, Bruyette & Woods (212) 887-3842 hstjuste@kbw.com Jordan Sadler / Karin Ford KeyBanc Capital Markets (917) 368-2280 / (917) 368-2293 jsadler@keybanccm.com / kford@keybanccm.com Stephen C. Swett Morgan Keegan (212) 508-7585 stephen.swett@morgankeegan.com Paula Poskon / Lindsey Yao Robert W. Baird & Co., Inc. (703) 821-5782 / (703) 918-7852 pposkon@rwbaird.com / lyao@rwbaird.com Alexander Goldfarb / James Milam Sandler O'Neill + Partners, L.P. (212) 466-7937 / (212) 466-8066 agoldfarb@sandleroneill.com / jmilam@sandleroneill.com Ross Nussbaum / Dustin Pizzo UBS Investment Research (212) 713-2484 / (212) 713-4847 ross.nussbaum@ubs.com / dustin.pizzo@ubs.com American Campus Communities, Inc. is followed by the analysts listed above. Please note that any opinions, estimates or forecasts regarding American Campus Communities, Inc.'s performance made by such analysts are theirs alone and do not represent the opinions, forecasts or predictions of the company or its management. American Campus Communities, Inc. does not by its reference above or distribution imply its endorsement of or concurrence with such information, conclusions or recommendations. Additional Information Corporate Headquarters: Investor Relations: Gina Cowart 805 Las Cimas Parkway, Suite 400 Austin, Texas 78746 Tel: (512) 732-1000; Fax: (512) 732-2450 www.americancampus.com American Campus Communities, Inc. AMERICAN CAMPUS COMMUNITIES :: VP, Investor Relations and Corporate Marketing (512) 732-1041 gcowart@americancampus.com 16
Forward-looking statement :: In addition to historical information, this supplemental package contains forward-looking statements under the federal securities law. These statements are based on current expectations, estimates and projections about the industry and markets in which American Campus operates, management's beliefs, and assumptions made by management. Forward-looking statements are not guarantees of future performance and involve certain risks and uncertainties, which are difficult to predict.