Attached files
| file | filename |
|---|---|
| 8-K - FORM 8-K - CenterState Bank Corp | d8k.htm |
 Rodman & Renshaw
Annual Global
Investment Conference
September 13, 2010
Exhibit 99.1 |
 This presentation contains forward-looking statements, as defined by Federal
Securities Laws, relating to present or future trends or factors affecting
the operations, markets and products
of
CenterState
Banks,
Inc.
(CSFL).
These
statements
are
provided
to
assist
in
the
understanding of future financial performance. Any such statements are based on
current expectations and involve a number of risks and uncertainties. For a
discussion of factors that may cause such forward-looking statements to
differ materially from actual results, please refer to CSFL’s
most recent Form 10-Q and Form 10-K filed with the Securities
Exchange Commission.
CSFL undertakes no obligation to release revisions to these forward-looking
statements or reflect events or circumstances after the date of this
presentation. Forward Looking Statement
2 |
 Birmingham
Atlanta
Winston-Salem
Tampa
Winter Haven
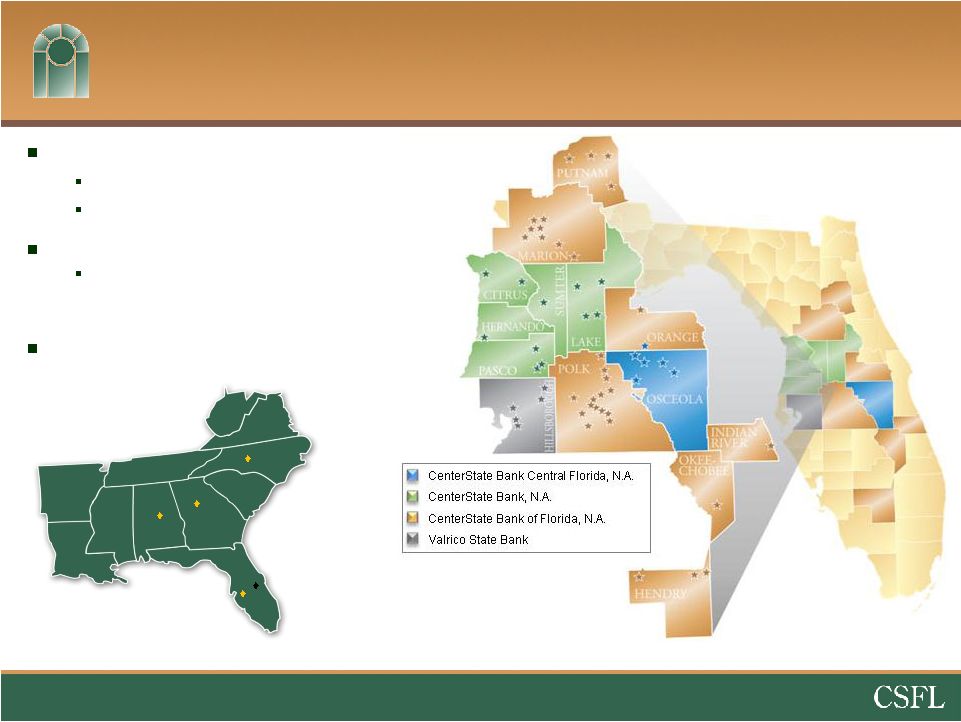
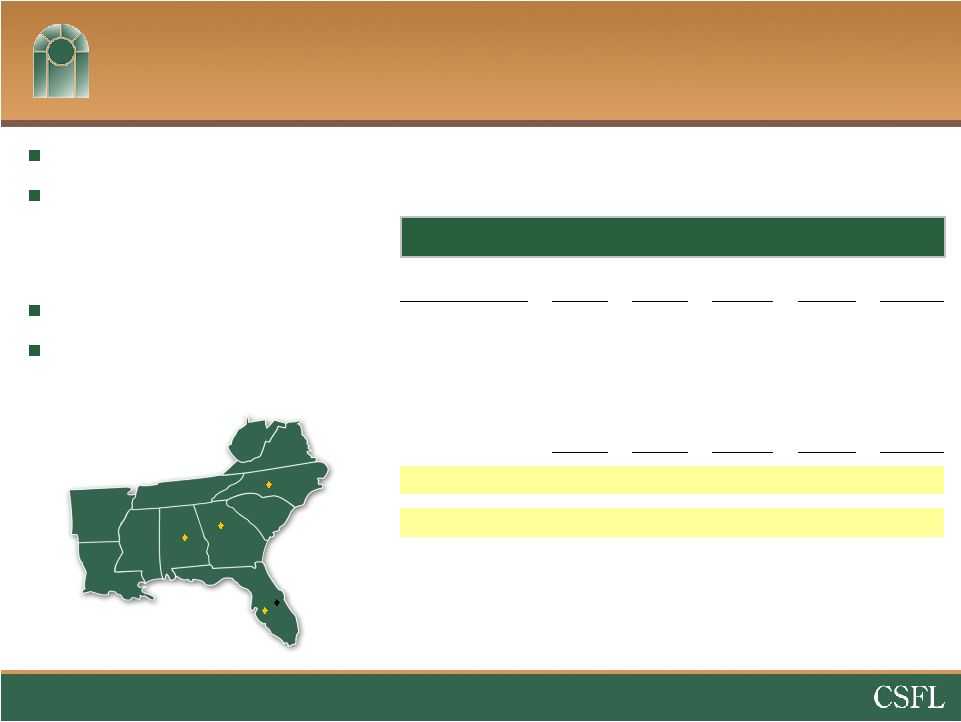
Corporate Overview
Headquartered in Davenport, FL
$2.3 billion in assets
$1.9 billion in deposits
Company formed: June 2000
4 Subsidiary Banks; 54 banking
offices in 14 counties throughout
Central Florida
6 of 14 counties of operation rank in the
top 15 fastest growing counties in Florida
3
Data
pro
forma
for
the
P&A
agreement
with
TD
and
the
acquisitions
of
Olde
Cypress
Community
Bank,
Independent
National
Bank,
and
Community
National
Bank
at
Bartow,
excluding
purchase
accounting
adjustments. |
 Recent Initiatives
4
June 2010 –
Opened branch in Vero Beach, Florida to house recently hired team
–
Team led by Andy Beindorf, former CEO of ALAB subsidiary Indian River National
Bank July 16, 2010 –
Announced the acquisition of Olde
Cypress Community Bank, Clewiston, FL ($163mm in assets) from
the FDIC
–
Will serve as base for team led by John Williams, former CEO of Riverside National
Bank and Okeechobee Market President
July 22, 2010 –
Capital Raise -
$35 Million
August 8, 2010 –
Entered into P&A agreement with TD Bank
–
Will acquire four branches in Putnam County, FL with approx. $113mm in deposits
and purchase up to $125mm in loans August 20, 2010 –
Announced the acquisition of Independent National Bank, Ocala FL and Community
National Bank at Bartow, Bartow, FL ($210mm in assets) from the FDIC
September 3, 2010 –
Announced intention to combine our three national chartered subsidiary banks,
subject to regulatory approval
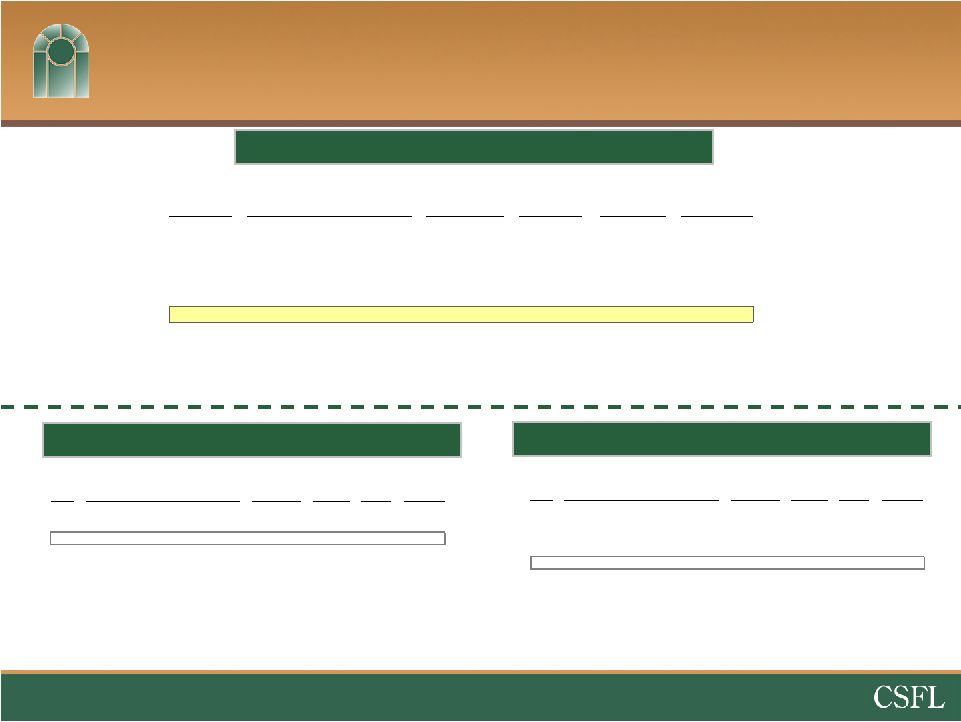
Capital Ratios
CSFL 6/30/10
w/ Cap. Raise
Peer
Average
Leverage Ratio
11.30
%
12.90
%
8.01
%
Tang. Common Equity / Tang. Assets
11.06
12.67
5.47
Total Risk-Based Capital Ratio
18.88
21.75
14.71
Source: SNL Financial, data as of most recent quarter
available. Florida peers include publicly traded banks and thrifts
headquartered in Florida with $1 billion or more in total assets.
Assumes net proceeds from capital raise are initially invested in 0%
risk-weighted assets. |
 5
Management Lift Outs –
Team Building
RETAIL/COMMERCIAL BANKING
Vero
Beach
–
Andy
Beindorf
(former
CEO
of
the
$800
million
Indian
River
National
Bank
,subsidiary
of
ALAB)
and
team
of
commercial,
retail,
and
residential
lenders
–
1Q
2010
Okeechobee
–
John
Williams
(former
CEO
of
the
$3
billion
Riverside
National
Bank
and
Market
President
of
Okeechobee
Region)
and
team
of
commercial,
retail,
and
residential
lenders
–
2Q
2010
Lakeland
-
Mike
Crowell
(former
Chief
Credit
Officer
of
the
$800
million
Citrus
&
Chemical
Bank
in
Lakeland,
FL)
–
1Q
2010
Residential
Mortgage
–
Dave
Kopec
(former
director
of
residential
lending
at
an
$800
million
thrift
in
Lakeland)
–
1Q
2010
CORRESPONDENT DIVISION
Silverton
Capital
Markets
and
Operations
Team
–
Atlanta,
GA
and
Winston-Salem,
NC
–
3Q
2009
WEALTH MANAGEMENT
Joe
Keating
(former
CIO
of
ALAB)
and
team
of
two
private
bankers
in
Orlando.
Joe
is
a
regular
contributor
to
CNBC
and
Bloomberg,
and
previously
was
responsible
for
the
Broker
Dealer,
Trust
Dept.
and
Correspondent
Banking
divisions
at
Alabama
National
Bank
–
2Q
2010
SPECIAL ASSETS
Dan
Bockhorst
–
former
special
assets
manager
for
the
State
of
Florida
for
RBC
Bank
FINANCE
Jennifer
Geckler
–
former
CFO
of
Bank
of
Florida
Southeast
and
Bank
of
Florida
Southwest
and
Treasurer
of
holding
company
(BOFL)
–
3Q 2010
PREPAID CARD BUSINESS
Tommy
McCulley
–
President
of
Prepaid
Technologies
with
nearly
a
decade
of
experience
in
prepaid
card
space
–
2Q
2010 |
 CSFL Combined Counties of Operation
Market Share Opportunity
6
Indian River County, FL
Okeechobee County, FL
Rank
Institution
Deposits
Market
Share
Branches
Deposits per
Branch
($000)
1
Bank of America Corp.
10,920,662
19.38
%
122
89,514
2
SunTrust Banks, Inc.
9,574,486
16.99
153
62,578
3
Wells Fargo & Co.
9,226,693
16.38
121
76,254
4
BB&T Corp.
3,916,987
6.95
73
53,657
5
Regions Financial Corp.
3,344,588
5.94
92
36,354
6
CenterState
Banks, Inc.
1,675,262
2.97
52
32,217
7
Toronto-Dominion Bank
1,605,970
2.85
38
42,262
8
Fifth Third Bancorp
1,131,031
2.01
30
37,701
9
Villages BanCorp., Inc.
817,150
1.45
9
90,794
10
Tampa Banking Co.
786,536
1.40
9
87,393
Source: FDIC and SNL Financial
Deposit data as of 6/30/09
Market share data for CSFL’s
combined counties of operation, excluding Orange County. Pro
forma to include agreement with TD and acquisitions of Olde
Cypress Community Bank, Community National Bank at Bartow, and
Independent National Bank. Excludes Orange County in which CSFL
has $20.0 million in deposits and 1 branch. Deposits per
Deposits
Market
Branch
Rank
Institution
($000)
Share
Branches
($000)
1
Bank of America Corp.
$111,795
22.13
%
2
$55,898
2
Seacoast Banking Corp. of Florida
106,171
21.01
3
35,390
3
Riverside Banking Co.
97,898
19.38
1
97,898
4
PNC Financial Services Group Inc.
79,337
15.70
1
79,337
5
SunTrust Banks Inc.
69,003
13.66
1
69,003
6
Regions Financial Corp.
32,668
6.47
1
32,668
7
First Bank and Trust Co. of Indiantown
8,356
1.65
1
8,356
Deposits per
Deposits
Market
Branch
Rank
Institution
($000)
Share
Branches
($000)
1
Wells Fargo & Co.
$1,106,210
28.96
%
8
$138,276
2
PNC Financial Services Group Inc.
486,570
12.74
7
69,510
3
Bank of America Corp.
426,851
11.18
7
60,979
4
SunTrust Banks Inc.
309,454
8.10
6
51,576
5
Royal Bank of Canada
308,047
8.06
6
51,341
6
Northern Trust Corp.
288,825
7.56
2
144,413
7
Seacoast Banking Corp. of Florida
207,751
5.44
8
25,969
8
Riverside Banking Co.
184,591
4.83
4
46,148
9
BU Financial Corp.
169,623
4.44
2
84,812
10
Marine Bank & Trust Co.
120,832
3.16
2
60,416 |
 Priorities and Goals
Achieve Return on Average Assets of 1.00%
Surpass $5 billion in assets
Expand into new markets with demographics similar to
Central Florida
Remain highly capitalized
Strategic Goals
(3 –
5 Years)
Near-Term
(18 –
24 Months)
Acquire banking institutions through FDIC assisted transactions
Reduce the level of problem assets
Leverage Correspondent Banking Division
Evaluating future strategic whole-bank opportunities
7 |
 NEAR-TERM DRIVERS
1.
Home sales up significantly
2.
Foreclosure filings down
3.
Consumer and commercial
deleveraging continues
Florida Outlook –
Long Slow Recovery
Source: Florida Legislature Office of Economic and Demographic Research
8
Florida Home Sales -
YoY % Change
1995-2009
Debt Overhang
+
Low Loan
Growth
Opportunities
=
Bank Consolidation |
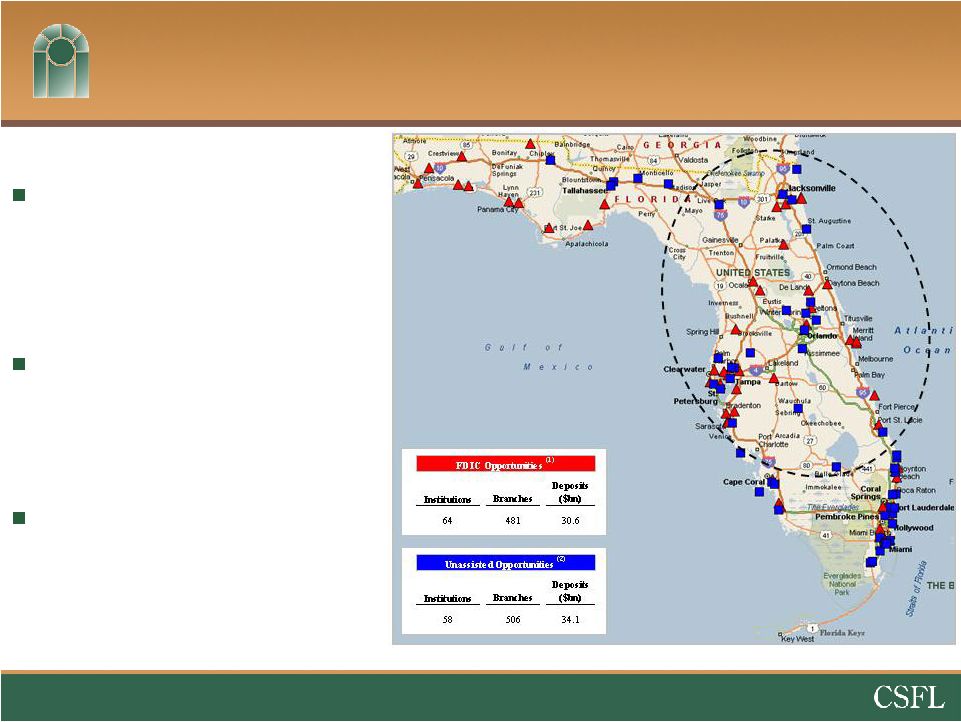 Positioned for FDIC Transaction Opportunities
9
Source: SNL Financial, data as of most recent quarter
available. (1)FDIC Opportunities include banks and thrifts in
Florida with Texas Ratios greater than 100%. (2)Unassisted
Opportunities include banks and thrifts in Florida with Texas Ratios between 50% and 100%.
Prior FDIC acquisition experience
–
Ocala National Bank
–
Olde
Cypress
–
Community National Bank at Bartow
–
Independent National Bank
Many seasoned executive teams within
the Holding Company –
12 bankers
with prior community bank CEO
experience
Recent hires with significant
executive and workout experience |
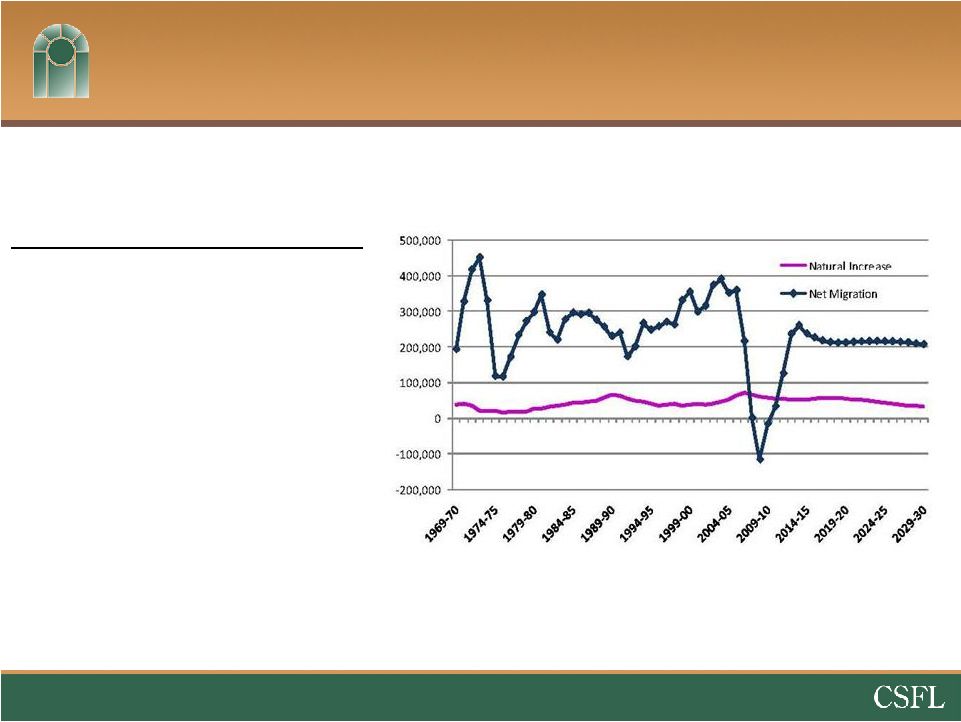 LONG-TERM DRIVERS
1.
Housing more affordable
2.
Baby-Boomers nearing
retirement age
3.
Net migration to return
4.
72 degrees in January
Florida Outlook
Long-Term Future Still Bright
Source: Florida Legislature Office of Economic and Demographic Research
10
Florida’s Population Growth |
 Birmingham
Atlanta
Winston-Salem
Tampa
Winter Haven
Correspondent Banking Division
Primary business lines
–
Bond Sales
–
Fed funds
–
Safekeeping, bond accounting, and
asset/liability consulting services
Customer base –
508 community banks
Opportunity
–
Bank Clearing & Cash Management
–
Talent Recruiting / M&A
Division Contribution
11
($000s, except per share)
2Q09
3Q09
4Q09
1Q10
2Q10
Net Interest Income
$1,975
$1,813
$1,656
$1,526
$1,319
Non-Interest Income
2,670
6,011
7,468
6,622
7,758
Non-Interest Expense
(2,038)
(5,312)
(6,512)
(6,164)
(6,740)
Income Tax Expense
(881)
(967)
(1,006)
(764)
(900)
Net Income Impact
$1,726
$1,545
$1,606
$1,220
$1,437
EPS Impact
$0.14
$0.07
$0.06
$0.05
$0.05
Management
lift
out
from
RBC
(formerly
ALAB)
and
Capital
Markets
Division
of
Silverton
(66
employees) |
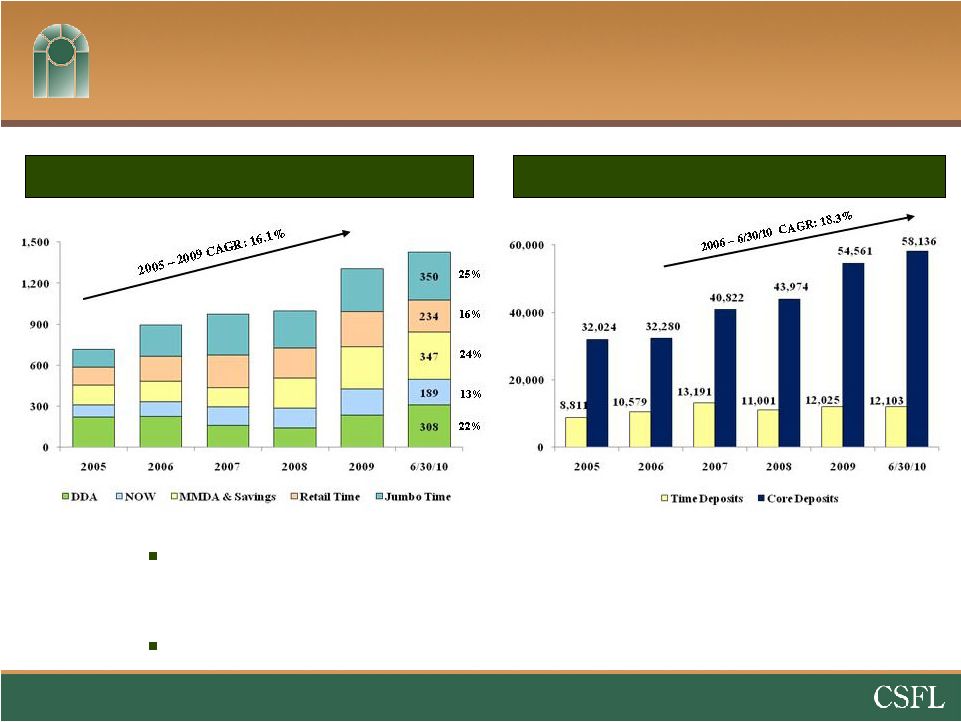 Core Deposit Focus
Approximately 70,239 total accounts -
$20,322 average balance per
account
Ocala National Bank (FDIC assisted) –
Core deposits up 22%
Total Deposits ($MM)
Number of Deposit Accounts
Core deposits defined as non-time deposits.
12 |
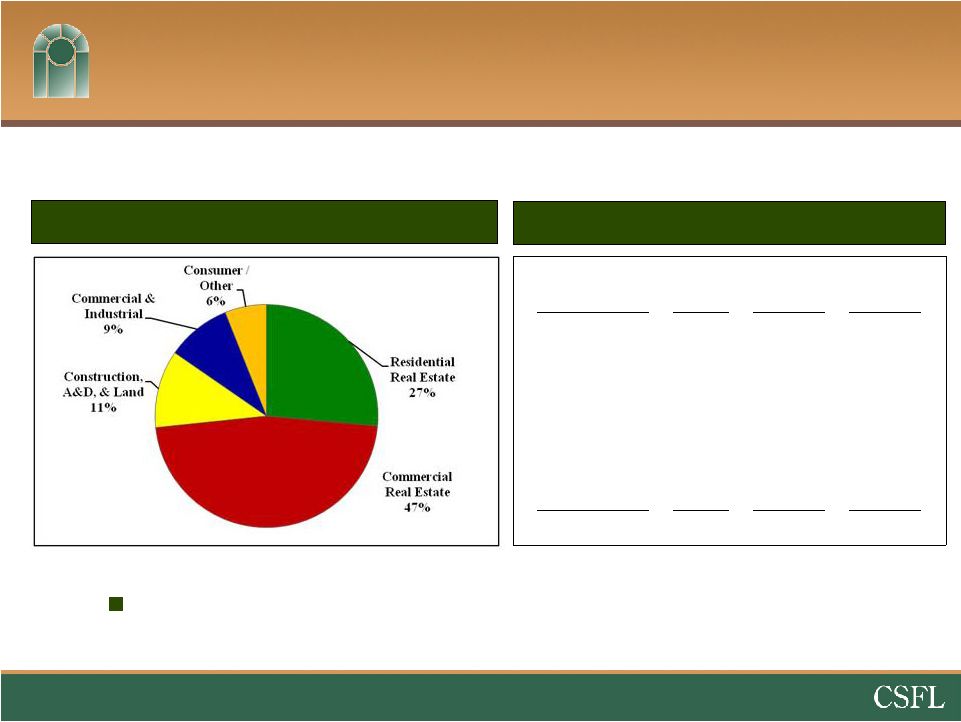 Loan Portfolio
Total Loans by Type (%)
Total Loans Detail
Construction, Development, & land represents only 11% of the total
portfolio 13
Loan Type
No. of
Loans
6/30/10
Balance
Avg
Loan
Balance
Residential Real
Estate
2,619
$249MM
$95,000
Commercial Real
Estate
1,073
442MM
412,000
Construction,
A&D, & Land
565
106MM
188,000
Commercial &
Industrial
971
88MM
90,000
Consumer /Other
2,117
57MM
27,000
Total
7,345
$942MM
$128,000 |
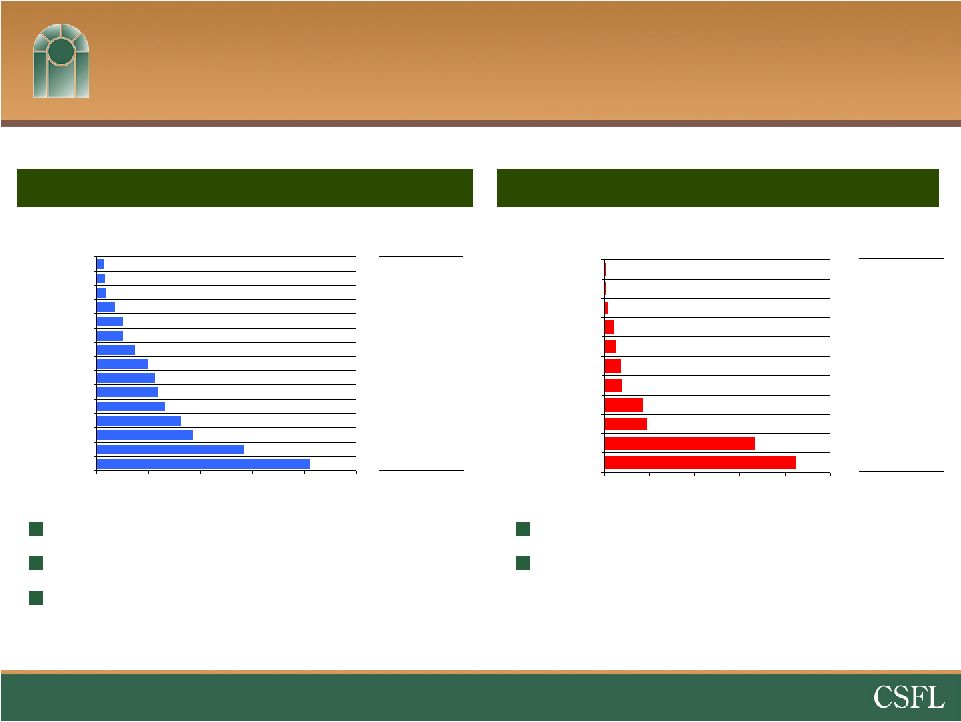 Commercial Real Estate & Construction Loans
Commercial Real Estate by Type
Construction Loans by Type
$442 million (47% of total loan portfolio)
5% Non-Accrual
55% owner-occupied
* CRE concentration –
143% vs
300%
$106 million (11% of total loan portfolio)
10% Non-Accrual
* C&D concentration –
40% vs
100%
14
Data as of 6/30/10.
% of
Average
Total
Size
Loans
($000)
0.0
%
$294
0.0
332
0.1
135
0.2
130
0.3
1,186
0.4
315
0.4
1,285
0.9
288
1.0
715
3.5
93
4.5
333
11.3
%
$188
$42.4
$33.3
$9.3
$8.4
$3.9
$3.5
$2.4
$2.1
$0.8
$0.3
$0.3
$0mm
$10mm
$20mm
$30mm
$40mm
$50mm
Raw Land – Commercial
SF Building Lots
Developed Land
Raw Land – Residential
Const. – Church/Education
Const. – SF Owner
Const. – Industrial
Raw Land – Agriculture
Const. – Spec Home
Const. – Other
Const. – Restaurant
% of
Average
Total
Size
Loans
($000)
0.4
%
$709
0.4
831
0.5
360
0.9
246
1.4
612
1.4
357
1.9
253
2.6
540
3.0
493
3.1
600
3.5
547
4.3
583
4.9
457
7.5
400
10.9
318
46.9
%
$412
$3.5
$4.2
$4.7
$8.9
$12.9
$12.9
$18.2
$24.8
$28.1
$29.4
$32.8
$40.8
$46.6
$71.1
$102.8
$0mm
$25mm
$50mm
$75mm
$100mm
$125mm
Office Buildings
Retail
All Other CRE
Church and Education
Warehouse
Strip Center
Industrial
Medical
Multi-family Residential
Restaurant
Mini Warehouse
Agriculture
Mobile Home Park
Hotel/Lodging
Aviation |
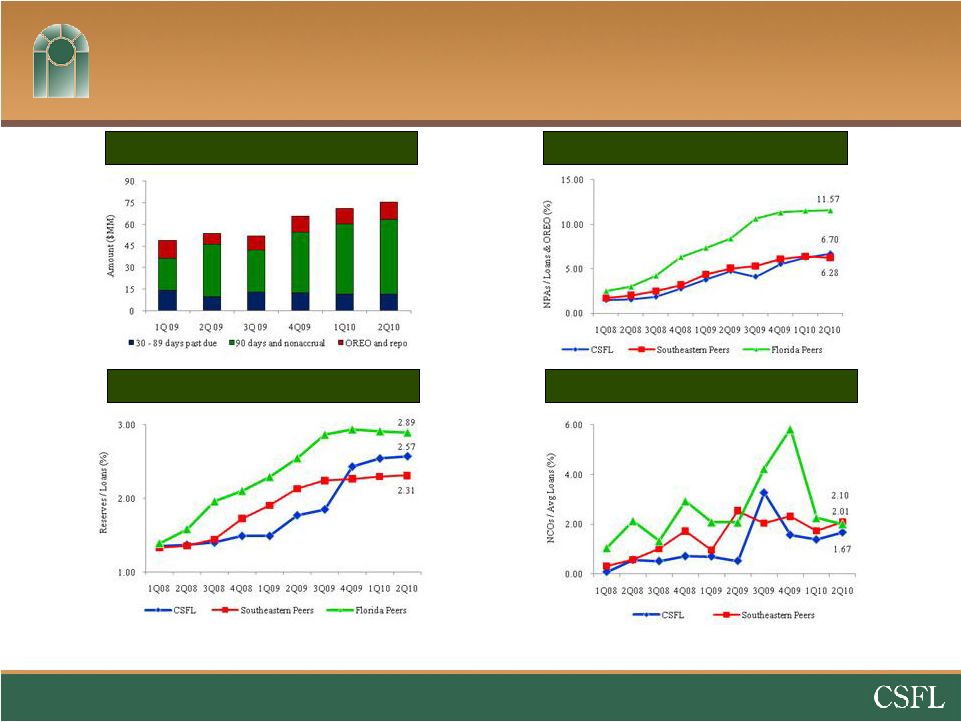 Credit Quality Trends
NPAs
/ Loans & OREO (%)
Net Charge-Offs / Avg. Loans (%)
Problem Loan Trends ($MM)
Reserves / Loans (%)
•
ALLL / NPL ratio of 46% versus 36% for Florida Peers (MRQ)
15
Source: SNL Financial and Company filings.
Nonperforming assets include 90 days or more past due.
Southeastern peers include ABCB, BTFG, GRNB, PNFP, RNST, SCBT, UBSH and
UCBI. Florida peers include publicly traded banks and thrifts
headquartered in Florida with $1 billion or more in total assets. |
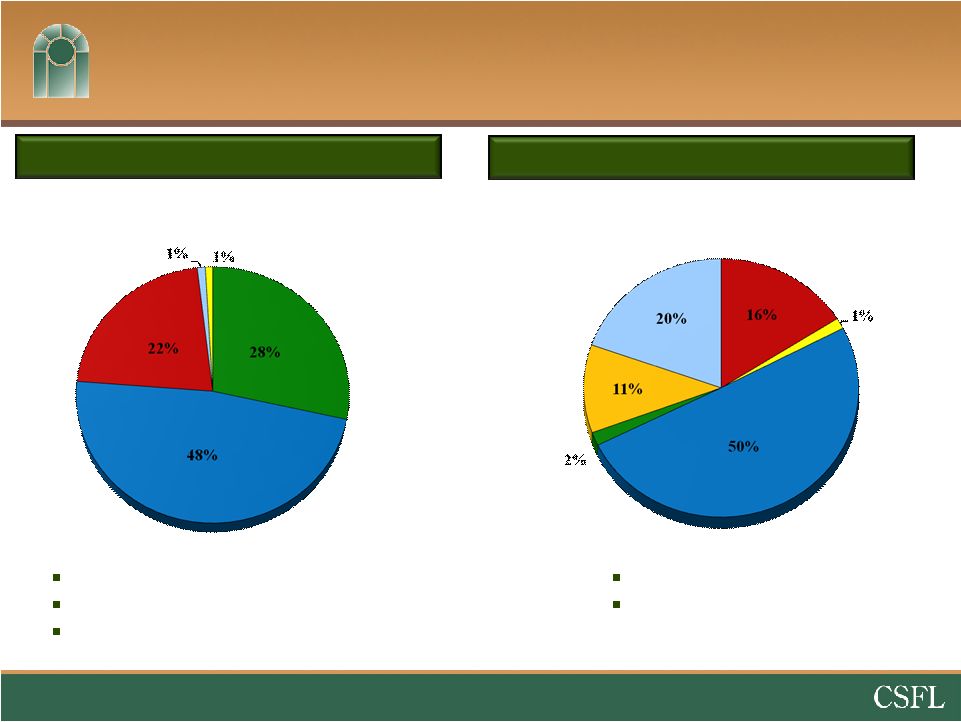 Non-Performing Loans
Other Real Estate Owned
$52,070,000 (5.53% of Gross Loans)
30% of NPLs
are current
79% of legal unpaid loan balance, net of specific reserves
$11,144,000
57% of legal unpaid loan balance at
repossession date
Residential Real
Estate
$14,844K
(87 loans)
Commercial Real Estate
$24,848K
(55 loans)
Construction,
A&D, & Land
$11,401K
(46 loans)
Commercial
$512K
(19 loans)
Consumer / Other
$465K
(27 loans)
16
Commercial Buildings
(15)
$5,609K
Mobile Homes
w/ Land
(6)
$151K
Vacant Land
(14 parcels of land)
$2,185K
Mixed Properties
$187K
Single Family Homes
(22)
$1,783K
Residential Lots
(50)
$1,229K
Data as of 6/30/10
NonPerforming
Assets |
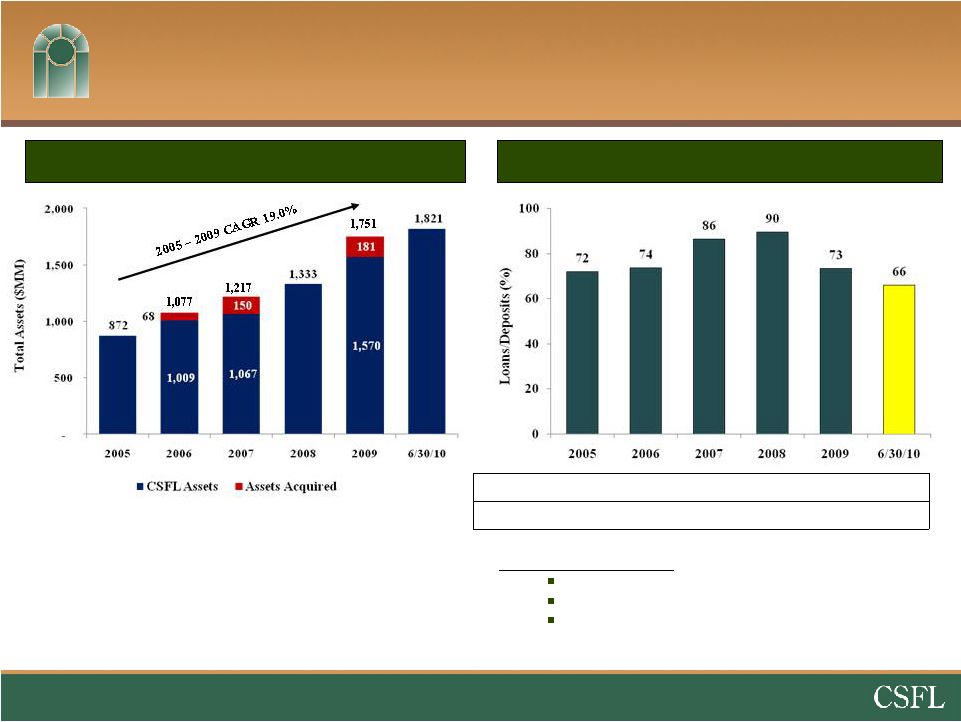 17
Organic Growth & Earnings Potential
Total Asset Growth
Loans / Deposits (%)
Loans / Deposits ratio
CenterState
Banks, Inc. –
66%
Southeastern Peers Average –
86%
Florida Peers Average –
84%
Loans
$517
$658
$841
$892
$959
$942
Deposits
717
893
973
994
1,305
1,427
Source: SNL Financial and Company filings, data as of most recent
quarter available. Southeastern peers include ABCB, BTFG, GRNB,
PNFP, RNST, SCBT, UBSH and UCBI. Florida peers include publicly
traded banks and thrifts headquartered in Florida with $1 billion or more in total assets. |
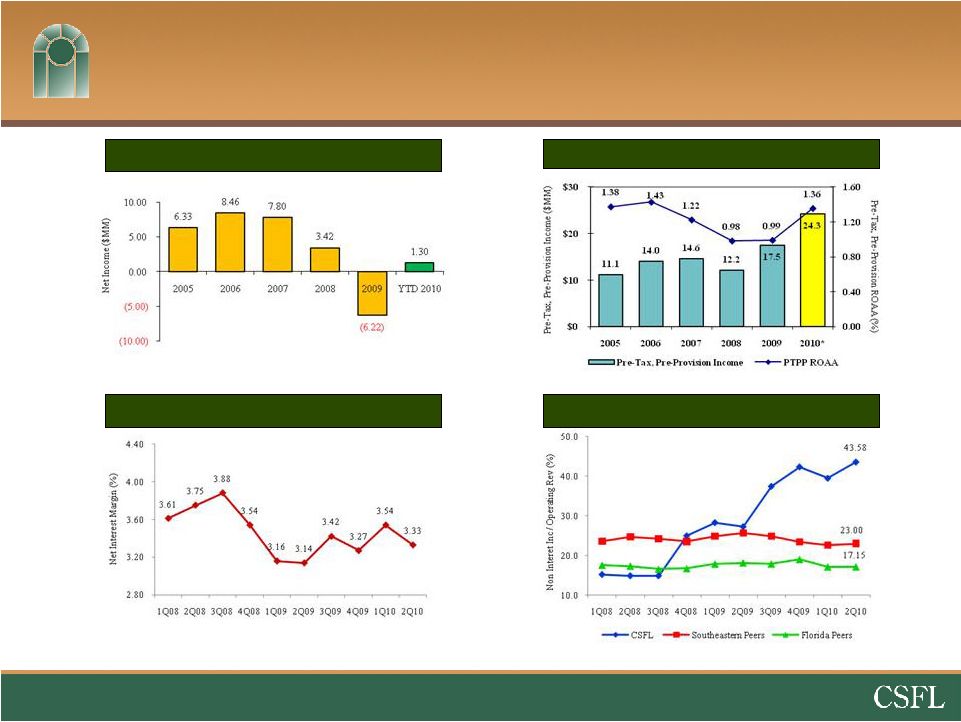 Profitability
Pre-
Tax, Pre-Provision Income & ROAA
(%)
Non Interest Inc / Op. Revenue (%)
Net Income ($MM)
Net Interest Margin (%)
18
Source: SNL Financial and Company filings.
Southeastern peers include ABCB, BTFG, GRNB, PNFP, RNST, SCBT, UBSH and
UCBI. Florida peers include publicly traded banks and thrifts
headquartered in Florida with $1 billion or more in total assets.
*Annualized |
 Conservative Balance Sheet
Loans / Assets of 52%
as of 06/30/10
Constr/A&D/Land loans represent 11% of total loans
versus 21% for Southeastern peers and 12% for Florida peers
NPAs
/ Assets of 3.51% versus 4.44% for Southeastern peers
and 5.77% for Florida peers
Robust capital position
*
•
TCE and Tier 1 leverage ratios of 12.7% and
12.9% at 06/30/10
Source: SNL Financial and Company filings, data as of most recent
quarter available. Southeastern peers include ABCB, BTFG, GRNB,
PNFP, RNST, SCBT, UBSH and UCBI. Florida peers include publicly
traded banks and thrifts headquartered in Florida with $1 billion or more in total assets.
*Proforma
to include capital raise of $35 million
19 |
 Summary
Energetic, experienced local management team taking
advantage of opportunities
Significant organic growth opportunities
Increased FDIC-assisted deals coming to our market in the next
6 –
9 months
Unprecedented opportunities to add shareholder value
20 |