Attached files
| file | filename |
|---|---|
| EX-99.1 - EX-99.1 - APOLLO EDUCATION GROUP INC | p18085exv99w1.htm |
| 8-K - FORM 8-K - APOLLO EDUCATION GROUP INC | p18085e8vk.htm |
Exhibit 99.2

|
August 2010 Apollo Group, Inc. |
Higher Education at a Crossroads
POSITION PAPER
Gregory W. Cappelli
Co-Chief Executive Officer of
Apollo Group and Chairman of
Apollo Global
Co-Chief Executive Officer of
Apollo Group and Chairman of
Apollo Global
The Current State of Higher Education
in America and the Vital Role of Proprietary
Colleges and Universities
| ■ | America is at a crossroads with
respect to how the nation’s higher education
system will adapt to meet the needs of
today’s learners. At Apollo Group, we are
concerned that the country will not meet the
national education goals set forth by
President Obama without an adaptable
postsecondary system that operates
differently than it has in the past–a system
that embraces diversity and innovation. |
|
| ■ | More Americans than ever need a
college degree and are seeking access to
higher education. Jobs today require higher
education, yet out of 132 million people in
the labor force, more than 80 million don’t
have a bachelor’s degree, and 50 million
adults have never even started college.
These individuals are increasingly looking
for ways to remain competitive and advance
in their careers in today’s global economy. |
|
| ■ | Those seeking access to higher
education are less prepared than in the past
and require greater support. High school
dropout rates are now approximately 55%
in many major cities like New York and Los
Angeles. Even more concerning, many students
who do graduate cannot perform at the
twelfth grade level in reading or math. |
|
| ■ | Over 70% of today’s students are
now categorized as “non-traditional”
students. Our colleges and universities must
meet the needs of today’s learners who have
families and professional obligations that
make it incrementally challenging to pursue
a college degree. |
|
| ■ | Traditional colleges and
universities are the backbone of the U.S.
higher education system, but they alone
cannot meet the country’s needs. This
system, which is exclusive by design, was
built to meet the needs of a different era
when only a small portion of the nation’s
workforce needed a college degree. Today’s
globally competitive, knowledge-based
economy requires a more broadly educated
society. |
|
| ■ | President Obama has set forth
three important goals for the U.S. higher
education system which are critical to the
country regaining its standing as a global
leader in education. On a sobering note, we
estimate that without proprietary schools,
meeting these goals would cost U.S.
taxpayers more than $800 billion over the
next ten years. |
|
| ■ | Accredited, degree-granting
proprietary institutions, which have been a
strong source of innovation, play a critical
role in the future of education. These
institutions provide access to students who
previously have been left behind by or
excluded from the traditional higher
education system. Well managed proprietary
institutions can meet the demand for
education at a significantly lower cost to
society. |
|
| ■ | At Apollo Group, we strive to
demonstrate responsible, ethical leadership
in higher education. We agree that
thoughtful and consistent regulation is
critical to the future success of the higher
education system. Apollo Group is focused on
ensuring regulatory compliance at University
of Phoenix and our other institutions,
providing robust student protections for our
current and prospective students, and
delivering quality educational offerings to
today’s non-traditional learners. |
Legal Disclosure: The statements and claims made are the position of
Apollo Group, Inc. based on information and analysis from various sources
referenced in the Appendix of this report, including the U.S. Department of
Education, various independent third-parties, and Apollo Group company data.
For more information, please refer to the Appendix of this report.

|
August 2010 |
Table of Contents
Executive Summary |
3 | |||
The Current State of Higher Education |
8 | |||
Why Does Higher Education Matter? |
8 | |||
Can the Higher Education System Stand Still When the World is Changing Around It? |
8 | |||
What is Needed for America to Remain Competitive? |
10 | |||
Why is the Solution Easier Said than Done? |
10 | |||
Can America’s Higher Education System Rise to Meet These Challenges? |
12 | |||
The Role of Proprietary Institutions |
14 | |||
What are the Realities of Today’s “Non-traditional” Students? |
14 | |||
Do Students at Proprietary Institutions Receive a Disproportionate Share of Student Aid Funding? |
16 | |||
Do Proprietary Institutions Overburden Students with Debt? |
18 | |||
Do Students of Proprietary Institutions Default Too Frequently? |
19 | |||
Are Proprietary Institutions a Good Investment for Taxpayers? |
20 | |||
Can America Meet Its Educational Goals Without Proprietary Institutions? |
22 | |||
Apollo Group is Leading by Example |
24 | |||
Aligning Our Educational Offerings with the Realities of Today’s “Non-traditional” Students |
24 | |||
Embracing Ethical Enrollment Practices |
24 | |||
Implementing Enhanced Student Protections throughout the Student Experience |
26 | |||
Offering a Quality Education that is Valued by Employers |
27 | |||
Investing in the Future of Higher Learning |
30 | |||
Recognizing the Importance of Regulatory Compliance |
31 | |||
What is Management’s Philosophy? |
32 | |||
Conclusion |
33 | |||
Appendix |
34 |
| Apollo Group, Inc. | Higher Education at a Crossroads | 2 |
|
|
August 2010 |
Executive Summary
What kind of nation will we be a decade or two from now? Will our system of higher
education be the bridge that takes us to a safer, stronger future, or will it be a burden that
holds us back? We will address these questions in this report.
---
At Apollo Group, we believe America is at a crossroads with respect to the future direction of
higher education. We find ourselves at a point in time when we—as a nation, as citizens, as
policy makers and as leaders in education—must make a choice between defining ourselves as a
nation in the 21st century with a limited, educated elite class who enjoy the
benefits of a college degree (and all of the corresponding professional, financial and
personal benefits that a degree brings) or a society with a broadly educated, productive and
globally competitive workforce.
The choice is clear. It is imperative to recognize that the world and the labor force of today
is much different than the one of a century ago when much of the traditional higher education
system was established and when the United States was still a largely agrarian economy, or
even several decades ago when it was the world’s manufacturing powerhouse.
Salient evidence supports this position. In 1950 (when the U.S. economy was largely driven by
manufacturing and assembly line workers) only about 20% of jobs required a skilled or educated
worker. Today, with knowledge as the backbone of our information-based economy, more than 60%
of jobs require advanced skills training or education.1 And not surprisingly, it is
expected that the fastest growing jobs in the coming decade will require a college level
degree or higher.2
As a result, more Americans than ever need a college degree and are seeking access to higher
education in order to remain competitive and advance in their careers. However, despite the
shift in educational requirements for jobs over the years, currently only 35% of American
workers over the age of 25 have achieved a four-year degree. There are approximately 132
million Americans in the U.S. labor force over the age of 25, of whom over 80 million do not
have a bachelor’s degree. What’s worse, 50 million Americans have never started college and
more than 30 million have never completed their degree.3 According to the World
Economic Forum’s Global Competitiveness Report, the U.S. has lost its number one competitive
ranking in the world.4
Recognizing this problem, the Obama administration last year set forth three important goals
for the U.S. higher education system5 that are critical to the country regaining
its standing as a leader in education and to remain competitive in an increasingly global
economy. Those goals include:
| ■ | To have every American receive at least one year of college education; | |
| ■ | To once again have the highest graduation rate among developed countries by 2020; and | |
| ■ | To encourage lifelong learning. |
We applaud these goals and agree with the President’s recognition of the importance of
fostering a broadly educated society in order to keep America competitive as a nation.
---
Unfortunately, the country faces numerous challenges in achieving these goals.
First among them is a K-12 system that is not preparing students for college-level study as
well as it once did. The nationwide dropout rate of high school students in 2008-2009 was
“Let me be crystal clear: for-profit
institutions play a vital role in training young
people and adults for jobs. They are critical to
helping America meet the President’s 2020 goal.
They are helping us meet the explosive demand for
skills that public institutions cannot always
meet.”
- Secretary of Education Arne Duncan, May 11, 2010
“At the start of my administration I set a goal
for America: by 2020, this nation will once again
have the highest proportion of college graduates
in the world. We used to have that. We’re going to
have it again.”
- President Barack Obama,
July 14, 2010
July 14, 2010
| Apollo Group, Inc. | Higher Education at a Crossroads | 3 |
|
|
August 2010 |
approximately 30% and it was significantly higher in major urban areas, reaching 55% in both
New York City and Los Angeles.6 Equally striking, of students who make it to the
twelfth grade, 65% of them cannot read at a twelfth grade level and 77% are not proficient in
math at a twelfth grade level.7
Despite the U.S. spending more on K-12 education per pupil than almost any other
country,8 deficiencies at the K-12 level have caused the U.S. position in
international testing to slip when compared to other nations, and we now rank 21st
out of 30 OECD (Organization for Economic Co-operation and Development) countries in science
scores and 25th out of the same 30 countries in math scores (both measured at age
15).9
In addition to more students being inadequately prepared for college-level study, increasing
numbers of working learners who never started or never completed their college education (many
of whom have not been in a classroom environment in years) are now recognizing the need for a
college degree in order to retool their skills or advance in their careers.
Both of these factors—a greater number of less prepared high school graduates and a greater
number of working adults now looking to attain a degree—are placing burdens on a higher
education system that was not built to accommodate the needs of these individuals. And these
burdens come at a time when public funding for higher education is under pressure and budgets
and capacity are being cut at traditional schools. Without the skills essential to a
knowledge-driven economy, America will continue to lose ground in its economic
competitiveness.
---
At Apollo Group, we are concerned that our country will not meet the national education goals
set forth by the President without a postsecondary system that can serve the needs of more
non-traditional students than was originally intended.
Traditional schools—public and independent private colleges and universities—are the backbone
of the U.S. higher education system, but they alone cannot meet the demands of our society. We
believe innovation and new alternatives are required to adapt to our rapidly changing world.
In order to meet just one of President Obama’s national education goals—ensuring that every
American receives one year of college—we estimate it would require the traditional education
system to provide access to more than 50 million first-time students, hire and train 500,000
new faculty members, create 1-2 million additional classes, and build the equivalent of
thousands of new colleges and universities.10 Furthermore, we estimate that
utilizing public institutions alone would cost the taxpayers more than $800 billion over the
next ten years to educate the additional 13.1 million graduates necessary to meet President
Obama’s goal of America once again having the highest graduation rate among developed
countries by 2020.11
Achieving this feat would be monumental in itself, but to do so at a time when traditional
schools’ resources are under pressure makes the task a near impossibility. Thirty-nine states
have cut funding to public colleges and universities in the past year alone12 and
schools are being forced to cut faculty positions and student seat capacity just to remain
viable.
---
Accredited, degree-granting proprietary institutions (also known as for-profit institutions)
play a critical role in the future of education by providing access to students who previously
have been left behind by or excluded from the traditional higher education system in the U.S.
Today’s students have families and professional obligations that make it challenging to pursue
a college degree and successfully make it through to graduation. Already, 73% of U.S.
| Apollo Group, Inc. | Higher Education at a Crossroads | 4 |
|
|
August 2010 |
students
are classified as non-traditional by the Department of Education,13 meaning they
have risk factors that make it more difficult to reach graduation, such as working while
attending school or having dependents of their own. Proprietary institutions like University
of Phoenix (a subsidiary of Apollo Group) are meeting the needs of today’s working learners,
and students are responding to the value proposition of this educational offering. We do this
by providing flexible scheduling, a choice of online or campus-based classrooms, small class
sizes, degree programs relevant to today’s workforce, faculty who have professional experience
in their field of instruction, and high levels of student support to help students succeed.
These adaptations and innovations have enabled University of Phoenix to provide strong
academic outcomes as well as career enhancement opportunities to students who in many cases
carry a higher level of educational risk as defined by the Department of Education. This does
not mean that these students are less talented or incapable of learning, but rather it’s a
recognition that sometimes life gets in the way.
Funding for education is provided directly to students, and students are choosing to attend
certain proprietary institutions because of the factors mentioned above. By questioning
whether proprietary institutions are the recipients of too much financial aid funding, critics
are actually questioning whether non-traditional and socioeconomically disadvantaged
individuals deserve the right to have access to the same student financial aid funds, and thus
access to an education, as more affluent students do. If we are to meet any of President
Obama’s goals, we believe the answer must be yes.
It is important to note that proprietary institutions do not burden the taxpayer nearly as
much as traditional publicly funded or independent private universities, as they do not
receive direct state subsidies and do not benefit from tax-free endowment contributions.
Rather, proprietary institutions pay significant taxes back to the public coffers. We estimate
the annual net cost to society, inclusive of defaults on student loans, is approximately
$1,509 per student at University of Phoenix compared with a cost of $7,051 per student at
independent private institutions and $11,340 per student at public institutions.14
Given these figures, we estimate that having a properly regulated and healthy proprietary
postsecondary education system in this country would allow the President to reach his higher
education goals while spending less than half the $800 billion necessary to do the same thing
through the traditional college system alone.15
---
Apollo Group is playing a leadership role in higher education, and we are proud of our
heritage in helping to pioneer higher education for the working learner over 35 years ago,
followed by the introduction of online education over 20 years ago. In addition, we are
currently investing hundreds of millions of dollars into the next-generation of learners by
developing a world-class adaptive learning platform designed for the classroom of tomorrow.
Critics of the proprietary postsecondary sector have raised concerns about industry recruiting
practices, student outcomes and student debt levels. While Apollo Group and University of
Phoenix strive for excellence in all of these areas, we recognize that we can continue to
improve. In this paper, we discuss some of the misperceptions about University of Phoenix and
our students, as well as some of the initiatives we have undertaken to deliver continued
improvement. Importantly, we are committed to delivering a quality education to those who are
willing to work hard enough to realize its benefits. Recognizing that we were experiencing an
increasing number of students who were less prepared for the rigors of our degree programs, in
early 2009 University of Phoenix began testing and recently announced the full implementation
of a University Orientation program. This three week program will be offered at no cost to
students and is designed to ensure that prospective students understand the time and
commitment required to be successful in our rigorous programs of study prior to
| Apollo Group, Inc. | Higher Education at a Crossroads | 5 |
|
|
August 2010 |
enrolling in
our University. This is especially important as it allows students to make a fully informed
decision about attending our University before taking on college debt.
Apollo Group and University of Phoenix strive to always act in the best interests of our
students. Our goal is to help educate some of the 50 million Americans in our labor force
today who have never attempted college either because they didn’t realize it was available to
them or didn’t think it was possible. And, importantly, we understand that simply enrolling
students for the sake of financial gains will never prove successful in the end. Why? Because
we believe that only by consistently providing a strong value proposition to our students can
our shareholders generate sustainable returns over time. It’s that simple.
To that end, we’ve implemented a series of additional student protections including financial
literacy tools such as our Responsible Borrower Calculator, which encourages students to
borrow only the amount they need for their education. Critics are right to point out that the
cost of college has increased dramatically over the past several decades, causing students in
certain institutions to take on unusually high levels of debt. At University of Phoenix, the
majority of our degree granting programs are either at or below the federal Title IV loan
limits set by Congress. And, importantly, despite the fact that we cannot restrict a
student’s ability to borrow up to the federally set Title IV limits, total student debt levels
at University of Phoenix are within national averages when compared to both public and
independent private four-year colleges and universities.
Robust and enforced regulatory compliance is critical to the future of any university, and our
universities are no exception. Our students have access to a compliance hotline 24 hours per
day, and we monitor over 30,000 conversations per day between our current as well as
prospective students and our counselors. To further reinforce that our counselors are not
pressured in any way to enroll a student who is not ready or prepared for University of
Phoenix, we have announced that a new evaluation and compensation plan for our counselors will
be rolled out University wide beginning this fall. In this new plan, no part of a counselor’s
compensation will have any link to the number of students they enroll at our University.
Rather, our counselors will be evaluated on and compensated for always acting in the best
interest of the student—essentially, advising the student the way they would a brother,
sister, son, daughter, or close friend. We feel strongly that the new plan will further
solidify our goal of always putting the student first.
At Apollo Group, we strive to demonstrate responsible, ethical leadership in higher education.
We recognize that it is Apollo Group’s role to ensure regulatory compliance at University of
Phoenix and our other institutions. To help ensure this, we have a large dedicated team of
full-time compliance professionals at Apollo Group. Compliance starts at the top, and we are
striving to be the best in this critical area. Further, on occasions where we find mistakes or
compliance violations, we strive to handle them with the urgency, care and attention they
deserve.
---
Above all, University of Phoenix invests heavily in its students’ education and student
services, as well as in building the learning environment of tomorrow. Educational and
instructional spending is by far our highest category of expenditure, while our marketing
costs to enroll a new student are generally in-line with the average of all schools in the
U.S.16
Ultimately, the value of the education we deliver to our students is the determinant of the
long-term success of our institution, as positive outcomes yield success for our graduates.
The University delivers value to its students and transparently publishes its outcomes so that
students can make informed decisions. We are proud of our record and highlight the following
achievements:
| Apollo Group, Inc. | Higher Education at a Crossroads | 6 |
|
|
August 2010 |
| § | University of Phoenix students enter with lower average assessment scores than the national average but substantially close that gap by their senior year, meaning they demonstrate a greater rate of learning compared to national averages;17 | |
| § | University of Phoenix associate students graduate at a slightly higher rate than the national average, and bachelor’s students graduate below the national average owing, in part, to the greater numbers of risk factors (as defined by the Department of Education) that non-traditional students like ours exhibit;18 | |
| § | University of Phoenix students’ two-year loan default rate for the 2008 cohort is estimated to be just 6.7% on a dollar-based calculation;19 | |
| § | For students who have graduated with a University of Phoenix degree, we estimate our cumulative default rate is less than 1% (using the official 2005, 2006 and 2007 cohort files);20 and | |
| § | University of Phoenix students realize average increases in annual compensation of 8.5% for bachelor’s graduates and 9.7% for master’s graduates during the course of their program compared to the 3.8% national average increase during that same period.21 |
---
In today’s world we need on-demand, rapidly deployed, effective education. Today’s working
learners need industry-adaptive faculty and curriculum—faculty who are active in their fields
of instruction and teach curriculum that can immediately be applied in the workforce.
Educational programs need to prepare students for today’s economy, not the economy of
yesterday.
By providing an accessible, high quality education, University of Phoenix is producing
successful outcomes–graduates who are better positioned to enjoy the professional, financial
and personal benefits that a degree brings, as well as a more educated, competitive society as
a whole.
Through a framework of thoughtful and consistent regulation, well managed proprietary colleges
and universities—those that are committed to responsible, ethical practices and regulatory
compliance—play a vital role in the future of America’s higher education system, helping it to
rise to the challenge of meeting the needs of the millions of non-traditional learners and
producing the graduates necessary to achieve the nation’s shared educational and economic
goals. Apollo Group is committed to leading the nation towards this future.
| Apollo Group, Inc. | Higher Education at a Crossroads | 7 |
|
|
August 2010 |
The Current State of Higher Education
We believe America is at a crossroads with respect to the future direction of higher
education in this country. We are standing at a point in time when we—as a nation, as
citizens, as policy makers and as leaders in education—must make a choice. We must either
define ourselves as a nation with only a small, educated elite class who enjoy the benefits of
a college degree (and all of the corresponding professional, financial and personal benefits
that it brings) or as a society with a broadly educated, productive and globally-competitive
workforce.
---
Why Does Higher Education Matter?
In case that choice isn’t clear, it is imperative to recognize that postsecondary
education brings considerable benefits to both individuals who attain higher degrees, as well
as society as a whole. Individuals benefit from greater professional opportunity, higher
earnings potential and a lower incidence of unemployment.22
Exhibit 1: Unemployment Rate and Earnings by Level of Educational Attainment
Unemployment
Rate
Median Weekly Earnings
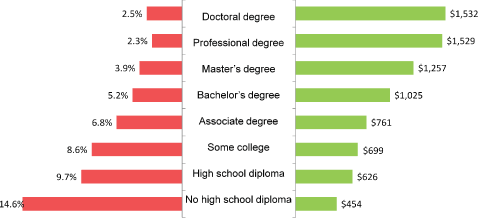
Source: Bureau of Labor Statistics, Current Population Survey.
Data are 2009 annual averages for persons age 25 and over. Earnings are for full-time wage and
salary workers.
Society as a whole benefits from widespread productivity increases, a
higher tax base at the local, state and federal levels from increased earnings, and reduced
dependence on public assistance programs, according to the College Board report Education
Pays.23
---
Can the Higher Education System Stand Still When the World is Changing Around It?
Despite the obvious personal and societal benefits of higher education, it is imperative
to recognize that the world and the labor force of today is much different than the one of a
century ago. The traditional higher education system was originally established when the
United States was still a largely agrarian economy and thrived as America became the
manufacturing powerhouse of the world. The world, and our economy, has changed significantly.
| Apollo Group, Inc. | Higher Education at a Crossroads | 8 |
|
|
August 2010 |
Consider a few facts. In 1950 (when the U.S. economy was largely driven by manufacturing and
assembly line workers) only about 20% of jobs required a skilled or educated worker. But the
days when an individual could raise a family on an unskilled manufacturing or assembly line
job are in rapid decline. Today, with knowledge as the backbone of our information-based
economy, more than 60% of jobs require advanced skills training or education.24
Exhibit 2: Jobs of the Past versus Today
Jobs in 1950
Jobs Today
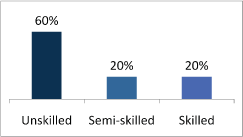
Source: Milken Institute, 2010 Global Conference.
And not surprisingly, it is expected that the fastest growing jobs
in the coming decade are those that will require a college level degree or
higher.25
Exhibit 3: Future Job Growth by Education Level (2008-2018)
Source: U.S. Bureau of Labor Statistics, Occupational Outlook Handbook, 2010-11 Edition.
As a
result, more Americans than ever need a college degree and are seeking access to higher
education in order to remain competitive and advance in their careers. However, despite this
shift, currently only 35% of American workers have achieved a four-year degree. The remaining
two-thirds of all U.S. workers over the age of 25 (more than 80 million people in the labor
force today) do not have a four-year degree. Of those individuals, approximately 50 million
never started college and an additional 30+ million never completed their degree.26
| Apollo Group, Inc. | Higher Education at a Crossroads | 9 |
|
|
August 2010 |
Exhibit 4: Educational Attainment of the U.S. Labor Force
(132 million workers over 25 years of age)
(132 million workers over 25 years of age)
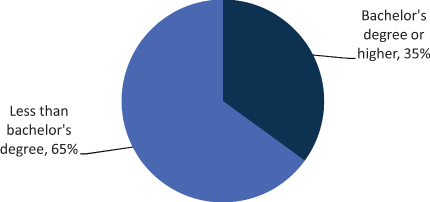
Source: U.S. Bureau of Labor Statistics, Current Population Survey.
Importantly, today’s knowledge-based jobs are
portable across geographic boundaries. If American workers do not have the necessary education
and skills to meet the job requirements, it is likely someone else will. Unfortunately,
according to the World Economic Forum’s Global Competitiveness Report, the U.S. has already
lost its number one competitive ranking in the world.27
---
What is Needed for America to Remain Competitive?
Recognizing this problem, the Obama administration last year set forth three important
goals for the U.S. higher education system28 that are critical to the country
regaining its standing as a leader in education and to remain competitive in an increasingly
global economy. Those goals include:
| § | To have every American receive at least one year of college education; | |
| § | To once again have the highest graduation rate among developed countries by 2020; and | |
| § | To encourage lifelong learning. |
We applaud these goals and agree with the President’s recognition of the importance of
fostering a broadly educated society in order to keep America competitive as a nation.
---
Why is the Solution Easier Said than Done?
Unfortunately, the country faces numerous challenges in achieving these goals.
Students Less Prepared for College Level Study. First among these challenges is a K-12 system
that is not preparing students for college-level study as well as it once did. The nationwide
dropout rate of high school students in 2008-2009 was approximately 30%,29 and
significantly higher in major urban areas.
| Apollo Group, Inc. | Higher Education at a Crossroads | 10 |
|
|
August 2010 |
Exhibit 5: High School Dropout Rates (2008-2009)
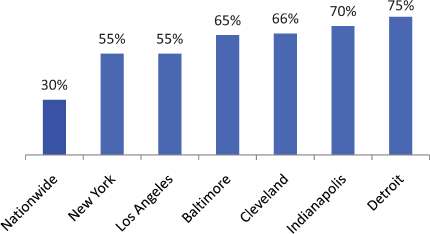
Source: Milken Institute, 2010 Global Conference.
Equally striking, for students who make it to the
twelfth grade, 65% of them cannot read at a twelfth grade level and 77% are not proficient in
math at a twelfth grade level.30
Despite the U.S. spending more on K-12 education per pupil than almost any other
country,31 deficiencies at the K-12 level have caused the U.S. position in
international testing to slip when compared to other nations, and we now rank 21st
out of 30 OECD countries in science scores and 25th out of the same 30 countries in
math scores (both measured at age 15). 32
Exhibit 6: International Science and Mathematics Assessment Scores
| Science scores (at age 15) | Math scores (at age 15) | |||||||||
1. Finland |
563 | 1. Finland | 548 | |||||||
2. Canada |
534 | 2. South Korea | 547 | |||||||
3. Japan |
531 | 3. Netherlands | 531 | |||||||
4. New Zealand |
530 | 4. Switzerland | 530 | |||||||
5. Australia |
527 | 5. Canada | 527 | |||||||
6. Netherlands |
525 | 6. Japan | 523 | |||||||
7. South Korea |
522 | 7. New Zealand | 522 | |||||||
8. Germany |
516 | 8. Belgium | 520 | |||||||
9. United Kingdom |
515 | 9. Australia | 520 | |||||||
10. Czech Republic |
513 | 10. Denmark | 513 | |||||||
11. Switzerland |
512 | 11. Czech Republic | 510 | |||||||
12. Austria |
511 | 12. Iceland | 506 | |||||||
13. Belgium |
510 | 13. Austria | 505 | |||||||
14. Ireland |
508 | 14. Germany | 504 | |||||||
15. Hungary |
504 | 15. Sweden | 502 | |||||||
16. Sweden |
503 | 16. Ireland | 501 | |||||||
-- OECD average |
500 | -- OECD average | 498 | |||||||
17. Poland |
498 | 17. France | 496 | |||||||
18. Denmark |
496 | 18. United Kingdom | 495 | |||||||
19. France |
495 | 19. Poland | 495 | |||||||
20. Iceland |
491 | 20. Slovak Republic | 492 | |||||||
21. United States |
489 | 21. Hungary | 491 | |||||||
22. Slovak Republic |
488 | 22. Luxembourg | 490 | |||||||
23. Spain |
488 | 23. Norway | 490 | |||||||
24. Norway |
487 | 24. Spain | 480 | |||||||
25. Luxembourg |
486 | 25. United States | 474 | |||||||
26. Italy |
475 | 26. Portugal | 466 | |||||||
27. Portugal |
474 | 27. Italy | 462 | |||||||
28. Greece |
473 | 28. Greece | 459 | |||||||
29. Turkey |
424 | 29. Turkey | 424 | |||||||
30. Mexico |
410 | 30. Mexico | 406 | |||||||
Source: U.S. Department of Education, National Center for Education
Statistics, Highlights from Program for International Student Assessment (PISA)
2006.
| Apollo Group, Inc. | Higher Education at a Crossroads | 11 |
|
|
August 2010 |
In addition to more students leaving the K-12 system inadequately prepared for
college-level study, increasing numbers of working learners who never started or never
completed their college education (many of whom have not been in a classroom environment in
years) are now recognizing the need for a college degree in order to retool their skills or
advance in their careers.
---
Can America’s Higher Education System Rise to Meet These Challenges?
Greater numbers of less prepared high school graduates and greater numbers of working
learners now looking to attain a degree are placing burdens on a higher education system that
was not built to accommodate the needs of these individuals, as it requires significantly
expanding capacity to reach greater numbers of students who also require a higher level of
academic and student support services than students of the past.
In addition to this dynamic, these factors are placing increased burdens on the traditional
postsecondary system at a time when public funding for higher education is under pressure and
budgets and capacity are being cut at traditional schools.
Traditional Schools Cannot Meet the Demand Alone. Traditional schools—public and independent
private colleges and universities—are the backbone of the U.S. higher education system, but
they alone cannot meet the demands.
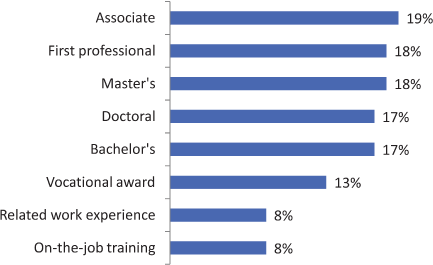
In order to meet just one of President Obama’s national education goals—ensuring that every
American receives one year of college—we estimate the traditional education system would have
to provide access to more than 50 million first-time students, hire and train 500,000 new
faculty members, create 1-2 million additional classes, and build the equivalent of thousands
of new colleges and universities.33 Furthermore, to increase the capacity of public
institutions to meet President Obama’s goal of America once again having the highest
graduation rate among developed countries by 2020, we estimate that it would cost hundreds of
billions of dollars over the next ten years,34 as we detail later in this report.
Exhibit 7: What Obama’s National Education Goals Would Require
Access for over 50 million students |
500,000 new teachers |
1-2 million additional classes |
Thousands of new colleges and universities |

Source: Apollo Group estimates.
Achieving this feat would be monumental in
itself, but to do so at a time when traditional schools’ resources are under pressure makes
the task a near impossibility. Thirty-nine states have cut funding to public colleges and
universities in the past year alone35 and schools are being forced to cut faculty
positions and student seat capacity just to remain viable. During 2010, the California State
University system alone is cutting enrollment by 40,000 students, and University of Illinois
furloughed 11,000 employees earlier in the year when it was
| Apollo Group, Inc. | Higher Education at a Crossroads | 12 |
|
|
August 2010 |
reported that the State of
Illinois owed its flagship University over $400 million in overdue subsidies.36
---
As we discuss in this paper, traditional public and independent private institutions play an
important role within the higher education system; however, due to the physical and financial
limitations of the traditional university model, they do so at a significantly higher cost to
the taxpayer than proprietary institutions (even when considering higher student loan default
rates at proprietary institutions).
For traditional institutions, delivering quality education generally relies upon a high
fixed-cost, ground-based system of learning that requires significant investments in physical
infrastructure—dormitories, cafeterias, athletic centers, parking facilities, etc. It also
requires both locally domiciled students and locally available faculty, meaning that it can
serve only a limited population of students within a limited distance.
This system—whether by design or due to resource constraint— is rigid and, at times,
inflexible in the way that it adapts educational curriculum and incorporates advances in
technology and information systems to meet the needs of today’s working learners. As such, the
economics underlying the traditional schools’ asset-intensive, high cost structure have been
essentially unchanged over time.
We believe it would be extremely difficult to scale the traditional model to meet the
increasing demand for higher education generated by a globally competitive, knowledge-based
economy without either major public funding increases (borne by a tax revenue system currently
under significant budgetary strain) or a dramatic restructuring of the way in which the entire
postsecondary system currently operates.
Given this, we are concerned that the country will not meet the national education goals set
forth by the President without a postsecondary system that operates differently than it has in
the past—one that is able to effectively and efficiently deliver quality academic programs
and student service to best serve the needs of today’s working learners.
Proprietary colleges and universities are playing an increasingly critical role in meeting
these needs.
| Apollo Group, Inc. | Higher Education at a Crossroads | 13 |
|
|
August 2010 |
The Role of Proprietary Institutions
Despite the staggering demand for higher education and the challenges that will need to be met in order to
satisfy it, some industry observers have questioned the role proprietary institutions play in the postsecondary
education system.
The U.S. postsecondary education system is very sizeable with approximately 6,600 schools. Included in this number
are approximately 4,400 degree-granting institutions and 2,200 non-degree granting institutions. The proprietary
sector represents about 2,800 of the total, of which approximately 1,100 are degree-granting and 1,700 are
not.37 This sector is extremely diverse as it includes technical and vocational schools (massage, beauty
and culinary) that are typically nationally accredited, as well as regionally accredited degree-granting
institutions such as University of Phoenix. There are six regional accrediting bodies in the U.S.
We firmly believe that while not all proprietary institutions are the same, accredited, degree-granting schools that
comply with regulations play a critical role in meeting the needs of today’s non-traditional students, and they do
so at a significantly lower cost to the taxpayer than traditional public or private independent schools. Well
managed proprietary institutions provide strong academic quality and career outcomes for their students, providing
them with services and capabilities that are not found at many traditional institutions. These proprietary
institutions have been strong sources of academic and educational innovation deploying new technologies including
online and distance learning, networking and technology infrastructure, new learning models and systems, networked
faculty, distributed campus footprints, and service and support critical to helping working learners complete their
educational degrees.
In fact, without proprietary colleges and universities, we believe America will not be able to meet President
Obama’s national education goals.
---
What are the Realities of Today’s “Non-traditional” Students?
Accredited, degree-granting proprietary institutions play a critical role in the future of education by
providing access to students who previously have been left behind by or excluded from the traditional higher
education system. Today’s students have family and professional obligations that make it challenging to pursue a
college degree and successfully make it through to graduation. Already, 73% of U.S. students are classified as
non-traditional by the Department of Education,38 meaning they have risk factors that make it more
difficult to reach graduation, such as working while attending school or having dependents of their own.
| Apollo Group, Inc. | Higher Education at a Crossroads | 14 |
|
|
August 2010 |
Exhibit 8: Undergraduates with Non-traditional Characteristics
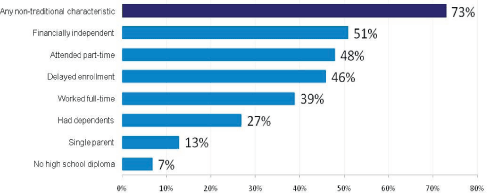
Source: U.S. Department of
Education, National Center for Education Statistics, National Postsecondary Student Aid Study (NPSAS),
2000.
These non-traditional students are typically older, financially independent (meaning they lack
parental financial support), from lower income families, minority and female. These demographic differences largely
drive adverse reported quality metrics, such as lower retention and graduation rates, and higher loan default rates.
Exhibit 9: Student Demographics by Institution Type
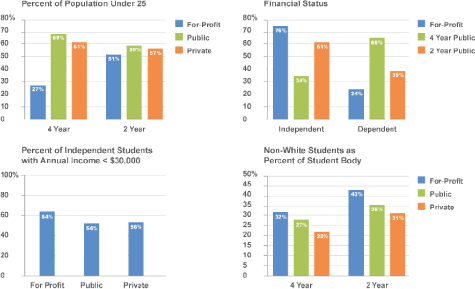
Source: U.S. Department of Education,
National Center for Education Statistics.
| Apollo Group, Inc. | Higher Education at a Crossroads | 15 |
|
|
August 2010 |
Proprietary institutions like University of Phoenix are meeting the needs of today’s working learners by
innovating to provide flexible scheduling, a choice of online or campus-based classrooms, small class sizes, degree
programs relevant to today’s workforce, faculty who have professional experience in their field of instruction, and
high levels of student support to help students succeed.
If we as a nation are to meet President Obama’s goals of once again having the highest proportion of college
graduates in the world by 2020, encouraging every American to have at least one year of college, and encouraging
lifelong learning for all Americans, finding the means and capacity to successfully educate non-traditional students
is essential.
---
Do Students at Proprietary Institutions Receive a Disproportionate Share of Student Aid Funding?
Some industry critics point to the growth in federal aid dollars that have gone to proprietary institutions in
recent years, while not recognizing the fact that student aid dollars follow the students (not the institutions) and
student demographics are a primary determinant of the amount of financial aid and student debt.
Students from lower socioeconomic backgrounds, who are more prevalent at institutions that choose not to focus on
only the elite, disproportionately qualify for need-based Pell Grants. In addition, the recent introduction of the
year-round Pell Grant program creates the potential for the neediest students to receive up to 100% of additional
Pell Grants in the same award year provided they are continuously enrolled. Since many proprietary institutions are
typically based on a continuous enrollment model, it is likely that even more Pell Grant funds will be granted to
students attending these institutions. On the other hand, the traditional term-based institutions generally have
limited numbers of students enrolled continuously (i.e., a small percentage of students attend the summer term).
Additionally, institutions (proprietary or otherwise) have no legal right to limit the amount of debt a student is
entitled to borrow, which inhibits an institution’s ability to put controls on students who over borrow. For many
students at University of Phoenix, this results in their being able to borrow up to the maximum of the Title IV loan
limits, which are set by Congress.
Not surprisingly, financial independence (the lack of parental financial support) of non-traditional students drives
higher borrowing needs among students at proprietary institutions. Despite these needs, students at four-year
proprietary institutions still borrow less, on average, than those at four-year independent private
institutions.39
| Apollo Group, Inc. | Higher Education at a Crossroads | 16 |
|
|
August 2010 |
Exhibit 10: Average Student Debt Levels by Institution Type
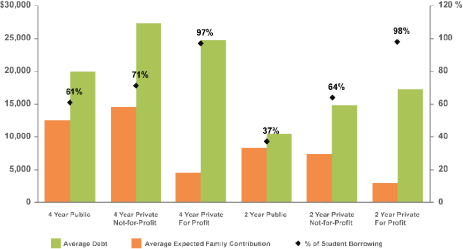
Source: U.S. Department of
Education, National Center for Education Statistics, 2007-2008 National Postsecondary Student Aid Study (NPSAS:
08).
In addition, although total Pell Grant and Stafford loan usage has increased, the amount of total funding from the government per student
relative to average
tuition at proprietary institutions is dramatically
below previous highs.40
Exhibit 11: Federal Loans and Pell Grant Funding at Proprietary Institutions
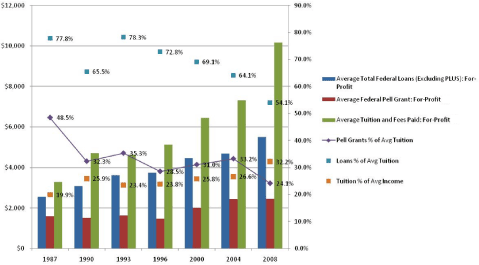
Source: U.S.
Department of Education, National Center for Education Statistics, National Postsecondary Student Aid Study (NPSAS),
Data Analysis System, Undergraduate Survey, 1987, 1990, 1993, 1996, 2000, 2004, 2008.
| Apollo Group, Inc. | Higher Education at a Crossroads | 17 |
|
|
August 2010 |
While the average
Pell Grant per eligible student at all institutions, including University of Phoenix, has increased over time, the
average Pell Grant per eligible student at University of Phoenix is below the average for students at other
institutions ($2,826 in fiscal 2009 compared with $2,971 at all institutions41).
Exhibit 12: Average Pell Grant per Eligible Student
University of Phoenix versus All Institutions
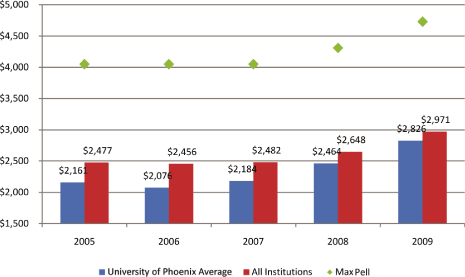
Source: Apollo Group internal analysis; U.S.
Department of Education Common Origination and Disbursement, 2008 — 2009 Federal Pell Grant Program End-of-Year
Report: U.S. Department of Education, Office Postsecondary Education.
By questioning whether proprietary
institutions are the recipients of too much financial aid funding, critics are actually questioning whether
socioeconomically disadvantaged individuals deserve the right to have access to the same student financial aid
funds, and thus access to an education, as more affluent students do. If we are to meet any of President Obama’s
goals, we believe the answer must be yes.
---
Do Proprietary Institutions Overburden Students with Debt?
The average borrowing of students in proprietary bachelor’s degree programs is $24,635,42 which
equates to a monthly loan payment of $283.50 over ten years (assuming the current 6.8% interest rate associated with
most student loans, as set by Congress). The net monthly cost to the student is even lower when taking into
consideration the personal income tax benefit they receive on deductible student loan expenses.
According to the Bureau of Labor Statistics (Current Population Study), the difference in weekly earnings between a
high school graduate and a person with a bachelor’s degree is $399 per week,43 or $1,729 per month, well
in excess of the cost of the average loan repayment. Furthermore, this higher level of earnings for a college
graduate continues beyond just the ten-year loan repayment period.
---
| Apollo Group, Inc. | Higher Education at a Crossroads | 18 |
|
|
August 2010 |
Do Students of Proprietary Institutions Default Too Frequently?
Some industry observers point to higher default rates for students of proprietary schools as evidence that
proprietary institutions are not providing a quality education that is valued in the marketplace. These observers do
not recognize that demographics (not institution type) have a more meaningful impact on default rates.
According to a report by the Government Accountability Office (GAO),44 “Academic researchers have found
that higher default rates at proprietary schools are linked to the characteristics of the students who attend these
schools. Specifically, students who come from low income backgrounds and from families who lack higher education are
more likely to default on their loans, and data shows that students from proprietary schools are more likely to come
from low income families and have parents who do not hold a college degree.” The report went on to say that “student
age was also linked to default rates in some of the research studies, with borrowers who take out student loans at
an older age being more likely to default on their loans...because they tend to have other obligations besides
paying for college. [The GAO] analysis of the Department of Education’s data shows that proprietary schools serve a
higher percentage of older students than public and private non-profit schools and the majority of students at
proprietary schools are 25 years old and older.”
Academic research further indicates that normalizing for demographics would eliminate the reported cohort default
rate (CDR) gap with traditional institutions:
n Herr and Burt45 (2005): “Individual student background characteristics outweighed school
characteristics;”
n Flint46 (1997): “Once one statistically controls for the kinds of students who attend
proprietary schools, that effect
almost completely vanishes;” and
almost completely vanishes;” and
n Jennie Woo47 (2002): “Institutional type only accounts for approximately 5% of the total
contribution to increased
default for high-risk students. The remaining 95% is comprised of student risk factors.”
default for high-risk students. The remaining 95% is comprised of student risk factors.”
Exhibit 13: Relative Contribution of Major Factors to the Higher Default Rates of Riskier
Students
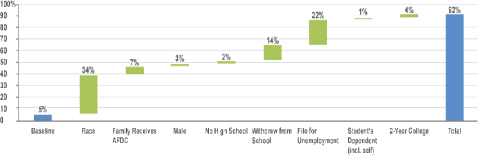
Source: NASFAA Journal of Student Financial Aid, Jennie Woo, Factors Affecting the
Probability of Default: Student Loans in California, 2002.
Note: Baseline is white, female, U.S. citizen, high school graduate, father attended college, completed
postsecondary education at a non-graduate or professional private four-year school, did not study business or
computers, did not file for unemployment, and did not have a loan in deferment or forbearance, sold, rehabilitated,
or repurchased, did not default on a prior loan, and had average family assets, family income, GPA, age, dependents,
delinquency periods, current wages, and number of servicers; two-year college contribution calculated using a
weighted average of two-year public, private, and proprietary and four-year public school change in
probabilities.
| Apollo Group, Inc. | Higher Education at a Crossroads | 19 |
|
|
August 2010 |
Perhaps equally important, the official CDR, as reported by the U.S. Department of
Education, is a measure of default incidence, not a measure of dollar default. Students who drop out drive CDRs, and
based on our experience at University of Phoenix, drop-outs have lower average debt levels since those who drop tend
to do so early in their programs. This is not an excuse or reason to manage an institution of higher learning with
unacceptably high default rates, but we believe the early drop-outs represent well intentioned students who begin
their program and quickly realize that they cannot meet the strict obligations we require to successfully complete
one of our programs given their work or family obligations which can sometimes be overwhelming. As a result, the
dollar-value default percentage (the true economic impact of defaults) is significantly lower than the
incidence-of-default percentage at University of Phoenix. University of Phoenix students’ two-year default rate for
the 2008 cohort is estimated to be just 6.7% on a dollar-based calculation.48
---
Are Proprietary Institutions a Good Investment for Taxpayers?
Beyond the general societal benefits of education, which include a more productive and competitive workforce,
lower unemployment rates and more stable communities—proprietary institutions educate citizens more cost
effectively than traditional institutions.
Despite the fact that socioeconomic and other risk-factors impact the average amount of financial aid borrowed by
non-traditional students and also the rate at which non-traditional students default on that debt, it is important
to note that proprietary institutions do not burden the taxpayer as much as traditional publicly funded or
independent private universities.
Yes, it is true that the taxpayer must bear the losses on defaulted Title IV loans, but according to the recent
budget submitted by the White House, the Department of Education recovers more than 100% of the principal amount on
defaulted loans to students through the federal Title IV programs. After accounting for collection costs and
unaccrued interest, we estimate the net recovery rate ranges between 60-65%.49
The costs of student loans are further offset by corporate income taxes paid by proprietary institutions.
Therefore, it’s hard to imagine that proprietary institutions of higher learning are
producing huge financial liabilities for taxpayers as suggested by critics of the sector. In fact,
proprietary institutions cost the taxpayers significantly less than traditional schools, as they do not receive
direct state subsidies and do not benefit from tax-free endowment contributions, but rather they pay significant
taxes back to the public coffers.
We have undertaken an extensive analysis (detailed below) based on publicly available sources to understand the
relative cost to the taxpayer to educate students at various types of postsecondary institutions. We calculate the
net cost to society, inclusive of defaults on student loans, is approximately $1,509 per student per academic year
at University of Phoenix compared with a cost of $7,051 per student at independent private institutions and $11,340
per student at public institutions.50
| Apollo Group, Inc. | Higher Education at a Crossroads | 20 |
|
|
August 2010 |
Exhibit 14: Annual Per Student Taxpayer Costs by Institution Type
| Independent | ||||||||||||||||||||
| Public | Private | Proprietary | ||||||||||||||||||
| (2- and | (2- and | (2- and | University of | |||||||||||||||||
| 4-year) | 4-year) | 4-year) | Phoenix | |||||||||||||||||
Direct Government Support (Grants,
Appropriations, etc.) |
$ | 10,785 | $ | 5,621 | $ | 3,751 | $ | 1,082 | ||||||||||||
Federal Support on Subsidized Loans |
40 | 85 | 146 | 94 | ||||||||||||||||
Defaults on Title IV Loans |
507 | 1,324 | [vs] | 4,515 | 3,032 | |||||||||||||||
Recovery on Title IV Loans |
(307 | ) | (802 | ) | (2,736 | ) | (1,838 | ) | ||||||||||||
Donor Tax Benefit on Gifts |
315 | 823 | — | — | ||||||||||||||||
Sales and Other Taxes |
— | — | (65 | ) | (38 | ) | ||||||||||||||
Taxes on Corporate Profits |
— | — | (1,092 | ) | (824 | ) | ||||||||||||||
Net Cost to Taxpayer per Student |
$ | 11,340 | $ | 7,051 | $ | 4,519 | $ | 1,509 | ||||||||||||
Source: Apollo Group analysis.
Notes:
Institutions: Analysis includes all U.S, degree granting institutions that are eligible for
Title IV.
Student Enrollment Data: Information obtained from IPEDS for all schools as reported under the
IPEDS definition for Fall 2008 full-time equivalent students.
Direct Government Support: Information obtained from IPEDS for GASB institutions and private
non-profit institutions or public institutions using FASB includes federal/state/local government
operating contracts and appropriations (Pell awards included). Information obtained from IPEDS for
FASB proprietary institutions includes state/local government grants and federal/state/local
government appropriations (Pell awards excluded). Pell award information for FASB proprietary
institutions was obtained from the Department of Education website.
Interest on Subsidized Loans: Subsidized Title IV loan information obtained from the
Department of Education website. The three month Treasury bill rate was used assuming a one year
interest subsidy for amounts loaned.
Loan Defaults: Assumes that although more than 100% is collected on average for each Title IV
dollar loaned by the government, the government could earn the equivalent amount of interest
through the issuance of treasury bills. In addition, data is not available to determine if interest
repayment trends are different between institutional types. However, lifetime default rates vary
significantly between institutional types. The lifetime budgeted default rates for the 2007 cohort
of students, per a report by the Department of Education issued in December 2009, along with 2007
two year cohort default rates, also published by the Department of Education, were used to
determine expected default rates by institutional type.
Public and Private Non-Profit: The lifetime budgeted default rates of 17.2% used for the
public and private non-profit institutions is based on an average of four-year freshman — senior
rates.
Proprietary: The lifetime budgeted default rate of 39.5% used for the proprietary institutions
is based on the two-year proprietary institutions lifetime budgeted default rate. The two-year
proprietary institutions lifetime budgeted default rate of 47% was weighted at 20% based on the
number of full-time equivalent students in the two-year category as a percentage of the total in
the proprietary institutions. The four-year proprietary institutions rate was determined based on
the relationship of the four-year proprietary institutions 2007 cohort default rate of 9.8% as
compared to the two-year proprietary institutions rate of approximately 12.25% and applying this
ratio to the two-year proprietary institutions lifetime budgeted default rate of 47%. This rate for
the expected four-year proprietary institutions lifetime budgeted default rate was then weighted at
80% based on the number of full-time equivalent students in the four-year category as a percentage
of the total in the proprietary institutions.
Recovery on Loans: The recovery rate used for defaulted loans is the same for all
institutions, 60.6%. This was then multiplied by the defaulted loans total to get the recovery
dollar amount. The recovery rate was calculated using information from the Department of Education
- SFA Collections, The White House — Office of Management and Budget (“The President’s Budget
2009”), student loan collection industry’s collection fees, and Apollo Group estimates.
Donor Tax Benefit: Public and private non-profit institutions adjusted for the estimated tax
benefit that donors receive for the gifts at a 35% tax rate. The gift amounts were obtained from
IPEDS.
Sales & Other Taxes: Credit given to proprietary institutions for sales and use tax paid based
on total revenue as reported in IPEDS to make comparable to public and private non-profit
institutions.
Taxes on Corporate Profits: Credit given to proprietary institutions for corporate taxes based
on net income as reported in IPEDS to make comparable to public and private non-profit
institutions.
We note that this analysis is based on the most current, independent third-party data available to
us (much of which comes directly from the Department of Education), and we believe it to be the
most reasonable case scenario for the relative per student costs to taxpayers. Importantly,
however, we would also direct readers to a recent study by Delta Cost Project51 which
reported comparable figures to our calculation for subsidies at public institutions ($10,267 for
federal, state and local appropriations, grants and contracts at public community colleges and
$10,302 for federal, state and local appropriations, grants and contracts at public master’s
institutions), which most closely relates to the Direct Government Support line item for public
institutions in our analysis above. The similarity of our figures to other third-party studies
provides us with greater comfort with the reasonableness of our figures.
---
| Apollo Group, Inc. | Higher Education at a Crossroads | 21 |
|
|
August 2010 |
Can America Meet Its Educational Goals Without Proprietary Institutions?
Meeting President Obama’s national graduation goals would require an additional 13.1 million
college graduates (including five million community college graduates) by 202052
according to the National Center for Higher Education Management Systems. The following graph
shows the cumulative growth needed by state over the next 10 years to reach that goal.
Exhibit 15: Number of Additional Graduates Needed per State by 2020 to Meet President Obama’s
National Education Goals
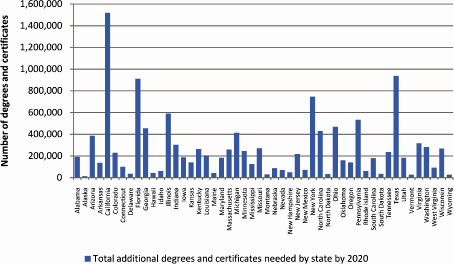
Source: National Center for Higher Education Management Systems and The Chronicle of Higher
Education.
Furthermore, since not all students who start a degree program complete it, the system will need to
accommodate tens of millions of additional new students in order to yield the incremental 13.1
million graduates. At a time when states are having difficulty even maintaining budgetary resources
for higher education and are cutting both faculty positions and student enrollment capacity, how
can states afford to educate tens of millions of additional students and produce 13.1 million
additional college graduates?
Using our previously discussed per student cost to the taxpayer estimate for public institutions of
$11,340 (see Exhibit 14) and publicly available graduation rates, we estimate an additional five
million community college graduates will cost the American taxpayer $214 billion over the next 10
years. In addition, we estimate an incremental 8.1 million four-year college graduates will cost
the American taxpayer $520 billion over the next 10 years.53 (And neither of these
figures includes the capital spending to construct new classrooms and schools, nor cost increases
at all over that 10-year period.)
In total, we estimate the cost to the U.S. taxpayer to educate the additional 13.1 million
graduates necessary to meet the President’s American Graduation Initiative utilizing public
institutions would be an additional $734 billion in federal, state and local support over the next
decade (assuming no cost increases). More realistically, assuming just 2% annual cost increases, we
estimate the cost to the U.S. taxpayer would be more than $800 billion over the next decade.
| Apollo Group, Inc. | Higher Education at a Crossroads | 22 |
|
|
August 2010 |
Exhibit 16: Cost to Government of President Obama’s American Graduation Initiative
Using Only Public Schools
Using Only Public Schools
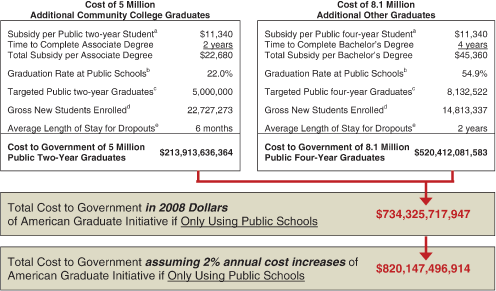
Source: Apollo Group analysis.
| Notes: | ||
| a | Apollo Group estimates (see Exhibit 14: Per Student Taxpayer Costs / (Benefits) by Institution Type). | |
| b | NCES, Enrollment in Postsecondary Institutions, Fall 2008, based on 2004 cohort for associates and 2002 cohort for bachelor’s completing in 150% of normal program completion time. | |
| c | National Center for Higher Education Management Systems. | |
| d | Based on 5 million targeted 2-year graduates at a 22% graduation rate and 8.1 million targeted 4-year graduates at a 54.9% graduation rate. | |
| e | Apollo Group estimate. | |
Using this same framework, but assuming our previously discussed per student cost to the taxpayer
estimate for proprietary institutions of $4,519 (see Exhibit 14), we estimate the comparable cost
to the taxpayer to meet the President’s American Graduation Initiative with proprietary
institutions would be $293 billion in 2008 dollars (assuming no cost increases) or $327 billion
assuming just 2% annual cost increases. Thus, meeting the goal of educating an additional 13.1
million graduates through proprietary institutions instead of public institutions could save
taxpayers nearly $500 billion dollars over the next ten years (assuming 2% annual cost increases).
And as noted previously, the per student cost to the taxpayer of $1,509 for University of Phoenix
(see Exhibit 14) is lower than the proprietary institution average.
Accredited, degree-granting proprietary colleges and universities serving non-traditional students,
alongside the traditional public and private independent institutions, are essential to expanding
capacity within the higher education system and meeting President Obama’s goal of having the
largest percentage of college graduates in the world by 2020.
| Apollo Group, Inc. | Higher Education at a Crossroads | 23 |
|
|
August 2010 |
Apollo Group is Leading by Example
Apollo Group is playing a leadership role in higher education and is an important part of the
future of higher education in America.
Apollo Group is proud of its heritage in helping to pioneer higher education for the working
learner more than 35 years ago and introducing online education 20 years ago, and we are currently
investing hundreds of millions of dollars into the next-generation of learners.
Critics of the proprietary postsecondary sector have raised concerns about industry recruiting
practices, student outcomes and student debt levels. While Apollo Group and University of Phoenix
strive for excellence in all of these areas, we recognize that we can continue to improve. Below,
we discuss some misperceptions about University of Phoenix and our students, as well as some of the
initiatives we have undertaken to deliver continued improvement.
---
Aligning Our Educational Offerings with the Realities of Today’s “Non-traditional” Students
Our students choose to attend University of Phoenix because our learning model and our educational
offering is tailored to the unique educational needs of today’s working learner.
The majority of University of Phoenix students are working, or actively looking for work. If these
students attended school full time at a community college or state university, it would mean a loss
of income, which is simply not an option for most working adults who have rent or mortgage payments
and are raising a family.
To help meet the needs of today’s working learners, University of Phoenix offers:
| n | Flexible scheduling (courses offered throughout the day and evening; classes starting throughout the year rather than just two times per year); | |
| n | Choice of online or campus-based classrooms (over 200 locations conveniently located throughout the U.S.); | |
| n | Small class sizes (average of 15 students); | |
| n | Degree programs relevant to today’s workforce; | |
| n | Faculty who have professional experience in their field of instruction (nearly all of whom have either master’s or doctoral degrees); and | |
| n | High levels of student support to help students succeed. |
---
Embracing Ethical Enrollment Practices
While advertising informs and drives interest, it alone does not drive enrollment. Today, the
internet affords students the opportunity to do a tremendous amount of research about University of
Phoenix and other institutions, enabling them to make more fully informed decisions about their
educational options.
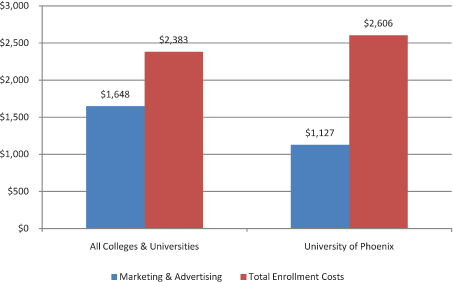
Comparable Marketing Spending. Enrollment costs at University of Phoenix are generally in-line with
those of other institutions. The average cost to enroll a new student at University of Phoenix was
$2,606 in fiscal 200854 compared with
$2,383 for all colleges and universities55 (which excludes certain promotional efforts
used by traditional schools, such as athletic programs that can cost as much as $100 million
annually). More specifically, the average marketing and advertising spend per new enrollment at
University of Phoenix was $1,127 in
| Apollo Group, Inc. | Higher Education at a Crossroads | 24 |
|
|
August 2010 |
fiscal 200856 compared with $1,648 for all colleges
and universities57 (which, again, excludes certain promotional efforts used by
traditional schools).
Exhibit 17: Average Marketing Spend per New Enrollment
Source: National Association for College Admission Counseling, 2009 State of College Admission, and
Apollo Group SEC filings and internal data.
Purpose of Marketing is to Inform. We believe that ethical advertising serves the purpose of
informing students of the options they have in higher education. We view this as an important part
of helping working learners, who may have both professional and family responsibilities, to
understand that there is an option in higher education specifically designed to meet their needs.
We also believe it is critically important for us, as a nation, to ensure that individuals who came
from backgrounds in which they never thought they had an opportunity to go to college, individuals
who for financial reasons had to start working or chose to join the military immediately after high
school, or who simply did not appreciate the value of an education until later in life, recognize
that there is a way for them to attain a college degree, and thus an opportunity to improve their
position in life.
That Being Said, Not Everyone is Prepared for College. University of Phoenix is committed to
delivering a high value education to those who are willing to work hard enough to realize its
benefits. That means that while we are committed to our mission of providing access and
opportunity, we do not want to enroll students who we do not believe have a reasonable chance of
succeeding at our institution. It does not benefit the student, and it does not benefit us.
Students who drop out adversely impact important quality metrics such as cohort default rates and
graduation rates for which we are accountable to our students and our regulators. Furthermore, from
a purely economic standpoint, students who drop out tend to do so early in their programs at
University of Phoenix, which adversely impacts us financially. It is not beneficial to us over the
long term to enroll students who we do not believe will succeed.
Recognizing that, over the past couple of years, we were seeing increasing numbers of students who
were less prepared for college-level study, we began to develop certain initiatives to help deter
unprepared or uninformed students from enrolling in our programs.
| Apollo Group, Inc. | Higher Education at a Crossroads | 25 |
|
|
August 2010 |
Investing in More Sophisticated Evaluation Tools. As a result, a portion of the cost of enrolling a
student for University of Phoenix has gone to enhancing and developing sophisticated tools and data
analytics that we can use to help students identify their likelihood of success.
University Orientation. University Orientation provides prospective students with the opportunity
to make sure college, and specifically University of Phoenix, is right for them without incurring
any extra cost. It is a free, three-week non-credit bearing course that all students with less than
24 credit hours will be required to take. Recognizing that we were experiencing an increasing
number of students who were less prepared for the rigors of our degree programs, in early 2009
University of Phoenix began testing and recently announced the planned implementation of this
program which is designed to ensure that prospective students understand the time and commitment
required to be successful in our degree programs before they enroll and, importantly, before they
take on debt.
After 18 months of testing and preparation with over 30,000 students having gone through our pilot,
we plan to roll out this Orientation program to all incoming students with fewer than 24 credit
hours, as these are the students who have limited experience with college-level study. Based on the
results of our Orientation pilot, approximately 20% of all prospective students going through the
program opt out and do not enroll at University of Phoenix. We are implementing this program
because it is the right thing to do for our students.
Student-centric Advisors. In addition to the University Orientation program, in early 2009, we
initiated a comprehensive review of how our counselors, who advise and enroll students, perform
their duties and how they are evaluated and compensated. We have announced the planned rollout of a
new evaluation and compensation structure for our
counselors this fall that is consistent with our goal of focusing on the student and enhancing the
student experience. We are committed to completely eliminating admission targets as a component of
compensation for our counselors. Our primary goal is to ensure that students receive informative
counseling and advice in a non-pressure environment to help them make wise decisions about their
academic future.
---
Implementing Enhanced Student Protections throughout the Student Experience
The University has proactively implemented several other initiatives focused on student protections
and we will continue to add protections on an ongoing basis.
One tool that we use during the admissions process (in states where it’s allowed) is our digital
call recording system. This system monitors over 30,000 conversations per day between students and
our admissions advisors and counselors for quality control and compliance purposes to help ensure
we are interacting with current and prospective students in a manner that is consistent with our
institutional policies and procedures.
Additionally during the admissions process, we strive to provide prospective students with accurate
and informed advice with respect to their financial aid opportunities (and the corresponding
obligations). To this end, while we cannot legally restrict the amount a student borrows under the
Title IV funding program, we tested and implemented a Responsible Borrower Calculator in 2009,
which teaches and encourages students to borrow only the amount they need for their education.
Since the implementation of this new tool, the percentage of students who choose to borrow the
maximum allowed has significantly declined. We estimate that the percentage of students who now
choose to borrow the maximum amount of student financial aid allowed has dropped from approximately
90% to approximately 60-70%.58
| Apollo Group, Inc. | Higher Education at a Crossroads | 26 |
|
|
August 2010 |
In addition to the Responsible Borrower Calculator, in the coming months we plan to roll out an
enhanced, user-friendly tool, that will transparently show the total program costs (including
tuition and fees) for any of our degree programs at any location, as well as any expected borrowing
costs associated with student loans and the expected interest rates on those loans.
Beyond these student protections, we are also developing a pair of videos for students to view
prior to enrolling, which we expect to roll out in the coming months. These videos—one delivered
during the admissions process that will reinforce the required time commitments and other
information necessary for success in our programs, and the other delivered during the financial aid
process that will explain the key components of financial aid, the importance of responsible
borrowing, and repayment obligations on loans—are intended to ensure that prospective students are
fully informed prior to making an enrollment decision or taking on debt.
Finally, our focus on student protections does not stop once students are enrolled and attending
classes. For example, during the past year we implemented a new self-service withdrawal process so
that students do not feel pressured into remaining enrolled if they determine University of Phoenix
is not right for them.
---
Offering a Quality Education that is Valued by Employers
Investments in Education. University of Phoenix invests heavily in its students’ education and
student services, as well as the learning environment of tomorrow. Educational and instructional
spending is by far our highest category of expenditure. In fiscal 2009, approximately 55% of our
total expenses (or slightly higher when excluding the impact of certain litigation expenses) were
direct educational and instructional costs.59 This compares to 48% for public
institutions and 52% for all traditional institutions (public and independent private schools) for
the 2006-2007 academic year (latest available), according to the Department of Education’s 2009
Digest of Education Statistics.60
We are able to invest significant resources in our students’ education because we operate more
efficiently by utilizing our classroom facilities nearly year round (whereas traditional schools
often have unused facilities during summer and holiday breaks) and not spending our resources on
dormitories, cafeterias, athletic complexes and other non-educational infrastructure that our
students don’t ask for and don’t require.
Ultimately, the value of the education we deliver to our students is the determinant of the
long-term success of our institution, as positive outcomes yield success for our graduates. Our
University delivers value to its students and is one of the few institutions of higher learning in
the country to transparently publish its outcomes, which we do in our Academic Annual
Report.61
Learning Outcomes. For nearly 35 years, University of Phoenix has measured the learning outcomes of
its students in order to verify what they’ve learned. University of Phoenix students typically
enter with lower average assessment scores than the national average but substantially close that
gap by their senior year, meaning they demonstrate similar levels of improvement through the course
of their educational experience and even better improvement in the critical areas of English and
mathematics compared with students from other schools.62 Improvement in MAPP Scores
demonstrates our students’ accomplishments.
| Apollo Group, Inc. | Higher Education at a Crossroads | 27 |
|
|
August 2010 |
Exhibit 18: Percentage Improvement in MAPP Scores: Freshmen to Seniors
Source: Educational Testing Service (ETS), Measure of Proficiency and Progress (MAPP).
Note: Master’s Universities reference institutions that offer baccalaureate through graduate
degrees.
Graduation Rates. As reported in University of Phoenix’s 2009 Academic Annual Report, our associate
students graduate at a slightly higher rate than the national average, and bachelor’s students
graduate below the national average owing, in part, to the greater numbers of risk factors (as
defined by the Department of Education) that non-traditional students like ours
exhibit.63
Exhibit 19: Completion Rates by Various Demographic Characteristics
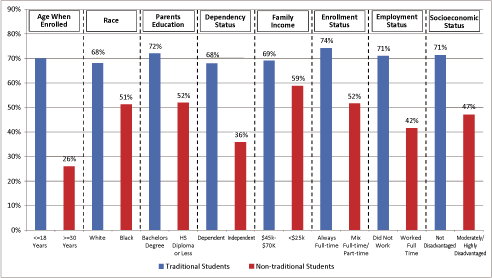
Source: U.S. Department of Education, National Center for Education Statistics.
Normalizing for these demographic differences in non-traditional students helps account for much of
the observed differences in completion rates between proprietary and traditional
schools.64 In addition, proprietary institution completion rates are substantially
higher than community colleges, which have the most similar student mix based on demographics.
Despite the demographic challenges of our non-traditional student base, we are proud that
| Apollo Group, Inc. | Higher Education at a Crossroads | 28 |
|
|
August 2010 |
University of Phoenix produced approximately 90,000 graduates in the past year alone. With more
than 500,000 alumni, our graduates are employed by thousands of companies and organizations—large
and small, including Fortune 500 companies and the White House—within a variety of industries and
in various capacities, including entrepreneurs, senior level executives and CEOs.
Tuition and Student Debt. Tuition increases have historically been in-line with those of other
types of institutions. We estimate that annual tuition and fee increases at University of Phoenix
have generally ranged between 4-6% (depending on degree program) over the past ten years compared
with 7.6% at public four-year institutions, 4.4% at public two-year institutions, and 5.4% at
independent private institutions according to the College Board.65
Student debt levels at University of Phoenix are within national averages compared to both public
and independent private four-year colleges and universities. For University of Phoenix, our
bachelor’s degree students (graduating between July 2007 and June 2008) had student loan debt on
par with independent private four-year institutions. According to the College Board,66
in 2007-08, 28% of bachelor’s degree students in independent private four-year institutions
graduated with no debt, 48% graduated with less than $30,500 in debt, and 24% graduated with more
than $30,500 in debt. During the
same timeframe looking at federal debt incurred while attending University of Phoenix, 21% of our
bachelor’s degree recipients graduated with no debt, 56% graduated with less than $30,500 in debt,
and 23% graduated with more than $30,500 in debt.67
Default Rates. While default rates are a lagging indicator and are likely to go higher over the
near term owing to the economic downturn of the last few years, as well as due to the significant
growth in our associate student population in recent years, the draft 2008 2-year cohort default
rate (CDR) for University of Phoenix students is 13.1% despite the demographic factors previously
mentioned that place non-traditional students at a higher risk of default.
CDRs for our associate students tend to be significantly higher than those of bachelor-level and
graduate students, which, as mentioned, is expected to drive our reported rates up for the next
couple of years. However, we believe our efforts to shift our student mix to bachelor’s and
higher-level students, as well as our new University Orientation program, will favorably impact our
CDRs over time.
Interestingly, as noted earlier, the official CDR metric is a measure of default incidence, not a
measure of dollar default. Students who drop out drive CDRs and drop-outs have lower debt levels as
individuals who drop tend to do so early in their programs. As a result, two additional data points
are worth noting. First, if we only look at students who have graduated with a University of
Phoenix degree, we estimate our cumulative default rate is less than 1% (using the official 2005,
2006 and 2007 cohort files).68 Second, the dollar value default percentage (the true
economic impact of defaults) is about half of the incidence percentage. We estimate that the 2-year
default rate on student loans for students at University of Phoenix in the 2008 cohort was just
6.7% on a dollar-basis calculation,69 despite one of the worst economic recessions in
modern history. Importantly, we expect our University Orientation program to significantly reduce
the number of students who drop out early in a given program, which we would expect over time to
improve the relatively lower dollar loan default rates.
| Apollo Group, Inc. | Higher Education at a Crossroads | 29 |
|
|
August 2010 |
Exhibit 20: University of Phoenix Default Rates (2-Year)
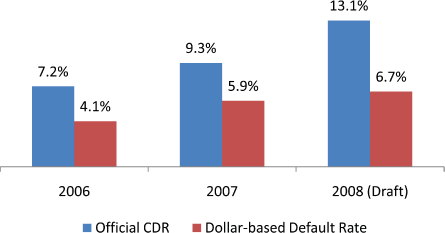
Source: U.S. Department of Education, Apollo Group internal analysis.
Salary Improvement. University of Phoenix students realize average annual salary increases in
annual compensation of 8.5% for bachelor’s graduates and 9.7% for master’s graduates during the
course of their program compared to the 3.8% national average increase during that same
period.70
---
Investing in the Future of Higher Learning
Now that we’ve discussed our learning model as it stands today, we want to highlight some of the
substantial investments we’ve been making into the future of learning at the college level. While
being a for-profit entity in higher education generates some criticism, and in some cases
rightfully so when profit motives drive bad behavior, one undeniable benefit is the fact that
profits often drive innovation in a free market society. We are living proof of this at Apollo
Group, as we helped pioneer education for the working learner over 35 years ago, and we have always
been committed to the use of technology innovation and advances in information systems to improve
the access to and outcomes of education for our students. Like so many industries that have leveraged
technology advances to enhance product, service and productivity, we have invested significantly in
the use of technology to increase our students’ learning experience and to expand the accessibility
of education to working learners in general.
We are currently investing hundreds of millions of dollars in research, development, information
systems, networking infrastructure and data centers. We are making advances in the field of
adaptive learning in order to personalize education so that every individual—no matter what their
learning style—can have a chance at a successful education. We strive to create a system that
learns with each student and adapts the way in which it delivers curriculum to maximize the
learning experience. We are investing in the most current community and networking technologies, so
that we can connect our students, faculty and alumni into learning communities across the country
and the globe in order to create an
environment from diverse communities and gain access to the most relevant and highest quality information
wherever it may physically reside. Importantly, our advancements in distance learning enable a
larger pool of faculty and knowledge workers to bring their skills and techniques in every critical field of the economy
to a global audience of students.
| Apollo Group, Inc. | Higher Education at a Crossroads | 30 |
|
|
August 2010 |
We imagine a future in which learning can happen at any moment in whatever format or modality
an individual needs to be successful, whether it is listening to downloads on their commute to
work on a smart phone or in a traditional classroom. We believe in a world in which the most
relevant information and the most engaging learning experiences inspire millions of citizens to
pursue an education in an environment that instills confidence and accomplishment and empowers
teachers and innovators to invest in learning.
Over the long term, we hope that by integrating technology effectively with innovations in
learning, we can make substantial breakthroughs in the future of education.
---
Recognizing the Importance of Regulatory Compliance
Apollo Group believes that effective regulatory oversight is critical to the postsecondary
system for both traditional and proprietary institutions, and we strive to be leaders in
regulatory compliance.
At the most fundamental level, our institutions’ policies, procedures, actions and outcomes are
reviewed and scrutinized by a regulatory triad consisting of (1) federal agency and federal
law, (2) multiple state regulatory authorities, and (3) regional and various programmatic
accrediting bodies to help ensure quality educational outcomes, effective student protections,
and responsible stewardship of Title IV funding. These are objectives that we share with those
charged with overseeing the postsecondary system in this country.
At the federal level, the U.S. Department of Education, as authorized by Congress through the
Higher Education Act and subsequent reauthorizations, has conducted numerous program reviews
and audits of University of Phoenix over its 35 year history and has, after extensive periodic
reviews, fully recertified the University’s eligibility to participate in student financial aid
programs under Title IV of the Higher Education Act. Additionally, the University is required
to submit annual student financial aid compliance audits conducted by an independent accounting
firm and continuously abide by the terms of our Program Participation Agreement.
In addition, we are subject to numerous state-level regulatory visits, reviews, license
renewals, and various other criteria depending on the state. University of Phoenix has been
approved or has authorization to operate in 43 states and currently does so in 40 of them.
Lastly, University of Phoenix has achieved regional accreditation from the Higher Learning
Commission (HLC) of the North Central Association of Colleges and Schools71—one of
six accrediting bodies considered to be the gold standard of accreditation—in 1978 and has been
subsequently reaffirmed five times based on thorough reviews and site visitations from
academicians at peer institutions charged with scrutinizing our academic quality and student
learning outcomes. In addition, several of our degree programs are accredited by programmatic
accrediting bodies, including our teaching, nursing, counseling and business programs:
| n | Nursing, CCNE (Commission on Collegiate Nursing Education)72 | |
| n | Counseling, CACREP (Council for Accreditation of Counseling and Related Educational Programs)73 | |
| n | Business, ACBSP (Association of Collegiate Business Schools and Programs)74 | |
| n | Education, TEAC (Teacher Education Accreditation Council)75 |
We take our responsibility to our regulators, and ultimately to students, seriously, and while
we will never rest, we have initiated a rigorous process designed to improve oversight of our
policies and procedures. Earlier this year, we hired a new Chief Compliance Officer, who has
| Apollo Group, Inc. | Higher Education at a Crossroads | 31 |
|
|
August 2010 |
more than a decade of experience in senior leadership roles specific to ethics and compliance, to
ensure that the policies and procedures we have in place with respect to the interaction of our
employees, faculty and staff with prospective and current students and our handling of student
funds is fully compliant with the law and our regulators’ directives.
Furthermore, we have an internal team dedicated to identifying cases of potential fraud, and
have self-reported numerous instances of suspected fraud and abuse to the U.S. Department of
Education Office of Inspector General for them to further pursue investigations and take legal
action when appropriate.
Some critics of the proprietary sector have recently pointed to specific instances of
inaccurate or misleading interactions with prospective students as the basis of claiming a
culture of aggressive sales tactics and inappropriate behavior at certain institutions. While
we cannot think of a company or government entity that has zero errors in the area of
compliance, noncompliance is neither acceptable nor permitted at any of our universities. There
are clear consequences for breaches of compliance. To that end, we have instituted
comprehensive compliance training and control processes within our institutions. When we
discover instances of impropriety, they are dealt with quickly and fully—up to, and including,
termination.
Our intent is to ensure that our employees understand
and act on both the letter and the
spirit of the law and the many regulations that are already in place through the regulatory
triad. Simply, we ask our employees to always comply with policies and procedures and do the
right thing for the student. We are committed to fostering a culture within the organization,
advocated and supported by our senior leaders, that aligns our policies and procedures with the
goal of creating a world-class student experience at each of our universities.
---
What is Management’s Philosophy?
Apollo Group is proud of its record of positive student outcomes and our leadership in the
field of higher education with respect to the transparency of those outcomes, as demonstrated
through the publication of our 2008 and 2009 Academic Annual Reports.
Importantly, while we are a publicly traded company with shareholders, for us “for-profit” does
not mean “profits before students.” It does mean that we do not need to ask the taxpayer to
directly subsidize our operations beyond the usage of federal loans and grants for which our
students qualify (using the same criteria that students of all institutions use to qualify).
Our management philosophy is, first and foremost, to always do what is right for the student.
Internally, our senior leaders have explicitly directed faculty, advisors and staff that they
must always be of the mindset of doing the right thing for the student; treat each student as
if he or she were a close friend or family member; and if something does not seem right,
elevate that concern until the concern is resolved. Externally, management has expressed this
philosophy to our shareholders so that they can understand how our leadership team operates
University of Phoenix and our other institutions. We believe this philosophy is borne out not
just by our words, but more importantly by our actions, including responsible enrollment
practices, student protections, and performance management systems to reward the right
behaviors.
Ultimately, our shareholders can only realize
sustainable returns on their investment if we
consistently provide a strong value proposition to our students.
| Apollo Group, Inc. | Higher Education at a Crossroads | 32 |
|
|
August 2010 |
Conclusion
In today’s world we need on-demand, rapidly deployed, effective education.
Today’s working learners need industry-adaptive faculty and curriculum—faculty
who are active in their fields of instruction and teach curriculum that can
immediately be applied in the workforce. Educational programs need to prepare
students for today’s economy, not the economy of the past. We believe that
University of Phoenix through our technological investment, advanced learning
methodologies, and our national reach can dramatically accelerate the
innovation that is essential to transform education in America.
The U.S. higher education system must evolve from one that caters to a small,
selective elite to one that also produces a broadly educated society in order
for the U.S. to remain competitive in today’s global, knowledge-based economy.
While an important part of the higher education system, traditional colleges
and universities cannot meet the Obama administration’s national education
goals alone.
University of Phoenix’s mission is to provide access to high-quality education
through innovation and by delivering consistent, valuable learning outcomes.
| n | We built and manage our differentiated learner model with small class sizes, convenient locations and online 24/7 availability for our working learners. | |
| n | We successfully serve the non-traditional students that now represent 73% of the total student population, as defined by the Department of Education.76 | |
| n | Although non-traditional students assume debt to fund their education, their return upon graduation is very attractive. | |
| n | University of Phoenix continues to aggressively invest in our students’ future with hundreds of millions of dollars spent on innovative technologies, service platforms and products, providing opportunities for our students to achieve their personal and professional goals. |
By providing an accessible, high quality education, University of Phoenix is
producing successful outcomes-graduates who are better positioned to enjoy the
professional, financial and personal benefits that a degree brings, as well as
a more educated, competitive society as a whole.
Through a framework of thoughtful and consistent regulation, well managed
proprietary colleges and universities—those that are committed to responsible,
ethical practices and regulatory compliance—play a vital role in the future of
America’s higher education system, helping it to rise to the challenge of
meeting the needs of the millions of non-traditional learners and producing the
graduates necessary to achieve the nation’s shared educational and economic
goals. Apollo Group is committed to leading the nation towards this future.
| Apollo Group, Inc. | Higher Education at a Crossroads | 33 |
|
|
August 2010 |
Appendix
| 1 | Milken Institute, 2010 Global Conference, Panel on Science, Technology, Engineering + Math (STEM) = Formula for Global Competitiveness, http://www.milkeninstitute.org/presentations/slides/GC10-2329.pdf. | |
| 2 | U.S. Bureau of Labor Statistics, Occupational Outlook Handbook, 2010-11 Edition, http://www.bls.gov/oco/. | |
| 3 | U.S. Bureau of Labor Statistics, Current Population Survey, http://www.bls.gov/web/empsit/cpseea5.pdf. | |
| 4 | World Economic Forum, The Global Competitiveness Report 2009-2010, http://www.weforum.org/en/initiatives/gcp/Global%20Competitiveness%20Report/index.htm. | |
| 5 | President Barack Obama, American Graduation Initiative, July 14, 2009, http://www.whitehouse.gov/the_press_office/Excerpts-of-the-Presidents-remarks-in-Warren-Michigan-and-fact-sheet-on-the-American-Graduation-Initiative/. | |
| 6 | Milken Institute, 2010 Global Conference, Panel on The Next Chapter in Charter Schooling: Taking Reform to Scale, http://www.milkeninstitute.org/presentations/slides/GC10-2096.pdf. | |
| 7 | U.S. Department of Education, National Center for Education Statistics, 12th Grade Reading and Mathematics 2005: National Assessment of Educational Progress, http://nces.ed.gov/nationsreportcard/pdf/main2005/2007468.pdf. | |
| 8 | Organisation for Economic Co-operation and Development, Education at a Glance, 2004. | |
| 9 | U.S. Department of Education, National Center for Education Statistics, Highlights
from PISA 2006: Performance of U.S. 15-Year-Old Students in Science and Mathematics Literacy in an International Context, http://nces.ed.gov/pubs2008/2008016.pdf. |
|
| 10 | Apollo Group estimates based on the number of individuals in the U.S. labor force without any college experience, assumed student to teacher ratio of 100:1 and assumed average class size of 25-50 students. | |
| 11 | Apollo Group estimate (see Exhibit 16 and accompanying notes). | |
| 12 | Center on Budget and Policy Priorities, http://www.cbpp.org/cms/index.cfm?fa=view&id=1214. | |
| 13 | U.S. Department of Education, National Center for Education Statistics, National Postsecondary Student Aid Study (NPSAS), 2000, http://nces.ed.gov/surveys/npsas/index.asp. | |
| 14 | Apollo Group analysis (see Exhibit 14 and accompanying notes). | |
| 15 | Apollo Group analysis (see Exhibit 16 and accompanying notes). | |
| 16 | Apollo Group SEC filings and internal data and National Association for College Admission Counseling, 2009 State of College Admission, http://admin.nacacnet.org/PublicationsResources/Marketplace/research/Pages/StateofCollegeAdmission.aspx. | |
| 17 | Educational Testing Service (ETS), Measure of Proficiency and Progress (MAPP), results published in University of Phoenix Academic Annual Report, http://www.phoenix.edu/about_us/publications/academic-annual-report.html. | |
| 18 | U.S. Department of Education, Integrated Postsecondary Education Data System (IPEDS) and University of Phoenix data reported in University of Phoenix Academic Annual Report, http://www.phoenix.edu/about_us/publications/academic-annual-report.html. | |
| 19 | Apollo Group internal analysis; certain assumptions were made in the preparation of this analysis due to limitations in the source data. | |
| 20 | Apollo Group internal analysis; using the official 2005, 2006 and 2007 cohort files. | |
| 21 | University of Phoenix data based on institutional research on entering student income, registration survey completing student income and end-of-program survey of 2008 graduates; national data from Culpepper and Associates compensation and benefits surveys, published in University of Phoenix Academic Annual Report, http://www.phoenix.edu/about_us/publications/academic-annual-report.html. | |
| 22 | U.S. Bureau of Labor Statistics, Current Population Survey, http://www.bls.gov/emp/ep_chart_001.htm. | |
| 23 | College Board, Education Pays: The Benefits of Higher Education for Individuals and Society 2007, http://www.collegeboard.com/prod_downloads/about/news_info/cbsenior/yr2007/ed-pays-2007.pdf. | |
| 24 | Milken Institute, 2010 Global Conference, Panel on Science, Technology, Engineering + Math (STEM) = Formula for Global Competitiveness, http://www.milkeninstitute.org/presentations/slides/GC10-2329.pdf. | |
| 25 | U.S. Bureau of Labor Statistics, Occupational Outlook Handbook, 2010-11 Edition, http://www.bls.gov/oco/. | |
| 26 | U.S. Bureau of Labor Statistics, Current Population Survey, http://www.bls.gov/web/empsit/cpseea5.pdf. | |
| 27 | World Economic Forum, The Global Competitiveness Report 2009-2010, http://www.weforum.org/en/initiatives/gcp/Global%20Competitiveness%20Report/index.htm. | |
| 28 | President Barack Obama, American Graduation Initiative, July 14, 2009, |
| Apollo Group, Inc. | Higher Education at a Crossroads | 34 |
|
|
August 2010 |
| http://www.whitehouse.gov/the_press_office/Excerpts-of-the-Presidents-remarks-in-Warren-Michigan-and-fact-sheet-on-the-American-Graduation-Initiative/. | ||
| 29 | Milken Institute, 2010 Global Conference, Panel on The Next Chapter in Charter Schooling: Taking Reform to Scale, http://www.milkeninstitute.org/presentations/slides/GC10-2096.pdf. | |
| 30 | U.S. Department of Education, National Center for Education Statistics, 12th Grade Reading and Mathematics 2005: National Assessment of Educational Progress, http://nces.ed.gov/nationsreportcard/pdf/main2005/2007468.pdf. | |
| 31 | Organisation for Economic Co-operation and Development, Education at a Glance, 2004. | |
| 32 | U.S. Department of Education, National Center for Education Statistics, Highlights from PISA 2006: Performance of U.S. 15-Year-Old Students in Science and Mathematics Literacy in an International Context, http://nces.ed.gov/pubs2008/2008016.pdf. | |
| 33 | Apollo Group estimates based on the number of individuals in the U.S. labor force without any college experience, assumed student to teacher ration of 100:1 and assumed average class size of 25-50 students. | |
| 34 | Apollo Group internal analysis (see Exhibit 16 and accompanying notes). | |
| 35 | Center on Budget and Policy Priorities, http://www.cbpp.org/cms/index.cfm?fa=view&id=1214. | |
| 36 | Chicago Tribune, University of Illinois Orders Furloughs, Other Cost-cutting Measures, January 6, 2010. | |
| 37 | U.S. Department of Education, National Center for Education Statistics, Digest of Education Statistics 2009, http://nces.ed.gov/pubs2010/2010013.pdf. | |
| 38 | U.S. Department of Education, National Center for Education Statistics, National Postsecondary Student Aid Study (NPSAS), 2000, http://nces.ed.gov/surveys/npsas/index.asp. | |
| 39 | U.S. Department of Education, National Center for Education Statistics, 2007-2008 National Postsecondary Student Aid Study (NPSAS: 08), http://nces.ed.gov/pubs2009/2009166.pdf. | |
| 40 | U.S. Department of Education, National Center for Education Statistics, National Postsecondary Student Aid Study (NPSAS), Data Analysis System, Undergraduate Survey, 1987, 1990, 1993, 1996, 2000, 2004, 2008. | |
| 41 | Apollo Group internal analysis; U.S. Department of Education Common Origination and Disbursement, 2008 — 2009 Federal Pell Grant Program End-of-Year Report, U.S. Department of Education, Office Postsecondary Education. | |
| 42 | U.S. Department of Education, National Center for Education Statistics, 2007-2008 National Postsecondary Student Aid Study (NPSAS: 08), http://nces.ed.gov/pubs2009/2009166.pdf. | |
| 43 | U.S. Bureau of Labor Statistics, Current Population Survey, http://www.bls.gov/emp/ep_chart_001.htm; figures are based on average earnings all individuals in the labor force at each degree level, not starting salary data. | |
| 44 | U.S. Government Accountability Office, GAO-09-600, August 17, 2009. | |
| 45 | Elizabeth Herr and Larry Burt, Predicting Student Loan Default for the University of Texas at Austin, 2005, http://www.nasfaa.org/Annualpubs/Journal/Vol35N2/Herr_Burt.PDF. | |
| 46 | Thomas A. Flint, Journal of Higher Education, Predicting Student Loan Defaults, 1997. | |
| 47 | NASFAA Journal of Student Financial Aid, Jennie Woo, Factors Affecting the Probability of Default: Student Loans in California, 2002. | |
| 48 | Apollo Group internal analysis; certain assumptions were made in the preparation of this analysis due to limitations in the source data. | |
| 49 | 2011 White House Budget, Table 3, Direct Loans: Assumptions Underlying the 2010 Subsidy Estimates; net recovery rate estimate based on 2011 White House Budget and discussions with industry sources. | |
| 50 | Apollo Group internal analysis (see Exhibit 14 and accompanying notes). | |
| 51 | Delta Cost Project, Trends in College Spending 1998-2008, figures in 2008 dollars, http://www.deltacostproject.org/resources/pdf/Trends-in-College-Spending-98-08.pdf. | |
| 52 | National Center for Higher Education Management Systems, http://www.nchems.org/, and the Chronicle of Higher Education, February 24, 2010, How Far States Have to Go to Meet Obama’s College-Completion Goal, http://chronicle.com/article/Chart-How-Far-States-Have-to/64361/. | |
| 53 | Apollo Group analysis (see Exhibit 16 and accompanying notes). | |
| 54 | Apollo Group SEC filings, internal data. | |
| 55 | National Association for College Admission Counseling, 2009 State of College Admission, http://admin.nacacnet.org/PublicationsResources/Marketplace/research/Pages/StateofCollegeAdmission.aspx. | |
| 56 | Apollo Group SEC filings, internal data. | |
| 57 | National Association for College Admission Counseling, 2009 State of College Admission, http://admin.nacacnet.org/PublicationsResources/Marketplace/research/Pages/StateofCollegeAdmission.aspx; as a proxy |
| Apollo Group, Inc. | Higher Education at a Crossroads | 35 |
|
|
August 2010 |
| for all colleges, the data provided by NACAC Survey for Marketing and Advertising is assumed to be the data offered for admissions budget less salaries and benefits presented. | ||
| 58 | Apollo Group internal data; assumed all students were eligible for the maximum amount. | |
| 59 | Apollo Group SEC filings, internal data. | |
| 60 | U.S. Department of Education, National Center for Education Statistics, Digest of Education Statistics 2008, http://nces.ed.gov/pubs2009/2009020.pdf. | |
| 61 | University of Phoenix Academic Annual Report, http://www.phoenix.edu/about_us/publications/academic-annual-report.html. | |
| 62 | Educational Testing Service (ETS), Measure of Proficiency and Progress (MAPP), results published in University of Phoenix Academic Annual Report, http://www.phoenix.edu/about_us/publications/academic-annual-report.html. | |
| 63 | U.S. Department of Education, Integrated Postsecondary Education Data System (IPEDS) and University of Phoenix data reported in University of Phoenix Academic Annual Report, http://www.phoenix.edu/about_us/publications/academic-annual-report.html. | |
| 64 | U.S. Department of Education, National Center for Education Statistics, Digest of Education Statistics 2009, http://nces.ed.gov/pubs2010/2010013.pdf. | |
| 65 | The College Board, Annual Survey of Colleges, weighted by full-time undergraduate enrollment. | |
| 66 | College Board, Trends in Student Aid 2009, http://www.trends-collegeboard.com/student_aid/pdf/2009_Trends_Student_Aid.pdf. | |
| 67 | Apollo Group internal analysis; certain assumptions were made in the preparation of this analysis due to limitations in the source data; figures include only federal debt incurred while attending University of Phoenix. | |
| 68 | Apollo Group internal analysis; using the official 2005, 2006 and 2007 cohort files. | |
| 69 | Apollo Group internal analysis; certain assumptions were made in the preparation of this analysis due to limitations in the source data. | |
| 70 | University of Phoenix data based on institutional research on entering student income, registration survey completing student income and end-of-program survey of 2008 graduates; national data from Culpepper and Associates compensation and benefits surveys, published in University of Phoenix Academic Annual Report, http://www.phoenix.edu/about_us/publications/academic-annual-report.html. | |
| 71 | University of Phoenix is accredited by The Higher Learning Commission (HLC) and is a member of the North Central Association. The Higher Learning Commission can be reached at http://www.ncahlc.org/ or by phone at (312) 263-0456. | |
| 72 | The Bachelor of Science in Nursing and the Master of Science in Nursing programs are accredited by the Commission on Collegiate Nursing Education (CCNE). Commission on Collegiate Nursing Education (CCNE), One Dupont Circle, NW, Suite 530, Washington, DC 20036-1120. | |
| 73 | The Master of Science in Counseling program in Community Counseling (Phoenix and Tucson, Arizona campuses) and Master of Science in Counseling program in Mental Health Counseling (Utah campuses) are accredited by the Council for Accreditation of Counseling and Related Educational Programs (CACREP). For additional information, visit http://www.cacrep.org. | |
| 74 | University of Phoenix School of Business has achieved voluntary from the Association of Collegiate Business Schools and Programs (ACBSP) demonstrating it has met standards of business education that promote teaching excellence. | |
| 75 | The Master of Arts in Education program with options in Elementary Teacher Education and Secondary Teacher Education is preaccredited by the Teacher Education Accreditation Council (TEAC). | |
| 76 | U.S. Department of Education, National Center for Education Statistics, National Postsecondary Student Aid Study (NPSAS), 2000, http://nces.ed.gov/surveys/npsas/index.asp. |
| Apollo Group, Inc. | Higher Education at a Crossroads | 36 |
|
|
August 2010 |
About Apollo Group, Inc.
Apollo Group, Inc. is one of the world’s largest private education providers and has been in
the education business for more than 35 years. The Company offers innovative and distinctive
educational programs and services both online and on-campus at the high school, undergraduate,
master’s and doctoral levels through its subsidiaries: University of Phoenix, Apollo Global,
Institute for Professional Development, College for Financial Planning and Meritus University. The
Company’s programs and services are provided in 40 states and the District of Columbia; Puerto
Rico; Canada; Latin America; and Europe, as well as online throughout the world.
For more information about Apollo Group, Inc. and its subsidiaries, call (800) 990-APOL or visit
the Company’s website at www.apollogrp.edu.
About University of Phoenix
University of Phoenix is constantly innovating to help students balance education and life in
a rapidly changing world. Through flexible schedules, challenging courses, small classes and highly
interactive learning, students achieve academic and career aspirations without putting their lives
on hold. University of Phoenix serves a diverse student population, offering associate, bachelor’s,
master’s, and doctoral degree programs from campuses and learning centers across the U.S. as well
as online throughout the world. It is accredited by the Higher Learning Commission of the North
Central Association of Colleges and Schools.
Forward Looking Statements Safe Harbor
Statements about Apollo Group and its business in this position paper which are not statements
of historical fact, including statements regarding Apollo Group’s business outlook, future
enrollment and future strategy and plans, are forward-looking statements, and are subject to the
Safe Harbor provisions created by the Private Securities Litigation Reform Act of 1995. These
forward-looking statements are based on current information and expectations and involve a number
of risks and uncertainties. Actual results realized and actual plans implemented may differ
materially from those set forth in such statements due to various factors, including changes in the
overall U.S. or global economy, changes in enrollment or student mix, including as a result of the
roll-out of the Company’s University Orientation program to all eligible students, the impact of
changes in the manner in which the Company evaluates and compensates its counselors that advise and
enroll students, changes in law or regulation affecting the Company’s eligibility to participate in
or the manner in which it participates in U.S. federal student financial aid programs, including
the proposed program integrity regulations published for comment by the U.S. Department of
Education on June 18, 2010, and the proposed regulations relating to “gainful employment” published
for comment by the U.S. Department of Education on July 23, 2010, changes in the Company’s business
necessary to remain in compliance with U.S. federal student financial aid program regulations and
the accrediting criteria of the relevant accrediting bodies, and other regulatory developments.
For a discussion of the various factors that may cause actual results to differ materially from
those projected, please refer to the risk factors and other disclosures contained in Apollo Group’s
Form 10-K for fiscal year 2009 and subsequent Forms 10-Q, and other filings with the Securities and
Exchange Commission, all of which are available on the Company’s website at
www.apollogrp.edu.
| Apollo Group, Inc. | Higher Education at a Crossroads | 37 |