Attached files
UNITED STATES SECURITIES AND EXCHANGE COMMISSION
Washington, D.C. 20549
Form 10-K
(Mark One) | |
þ | ANNUAL REPORT PURSUANT TO SECTION 13 OR 15(d) OF THE SECURITIES EXCHANGE ACT OF 1934 |
For the fiscal year ended: August 31, 2014 | |
OR | |
o | TRANSITION REPORT PURSUANT TO SECTION 13 OR 15(d) OF THE SECURITIES EXCHANGE ACT OF 1934 |
For the transition period from ______ to ______ | |
Commission file number: 0-25232

APOLLO EDUCATION GROUP, INC.
(Exact name of registrant as specified in its charter)
ARIZONA (State or other jurisdiction of incorporation or organization) | 86-0419443 (I.R.S. Employer Identification No.) |
4025 S. RIVERPOINT PARKWAY, PHOENIX, ARIZONA 85040
(Address of principal executive offices, including zip code)
Registrant’s telephone number, including area code: (480) 966-5394
Securities registered pursuant to Section 12(b) of the Act:
(Title of Each Class) | (Name of Each Exchange on Which Registered) | |
Apollo Education Group, Inc. Class A common stock, no par value | The NASDAQ Stock Market LLC | |
Securities registered pursuant to Section 12(g) of the Act:
None
(Title of Class)
Indicate by check mark if the registrant is a well-known seasoned issuer, as defined in Rule 405 of the Securities Act. YES þ NO o
Indicate by check mark if the registrant is not required to file reports pursuant to Section 13 or Section 15(d) of the Act. YES o NO þ
Indicate by check mark whether the registrant (1) has filed all reports required to be filed by Section 13 or 15(d) of the Securities Exchange Act of 1934 during the preceding 12 months (or for such shorter period that the registrant was required to file such reports), and (2) has been subject to such filing requirements for the past 90 days. YES þ NO o
Indicate by check mark whether the registrant has submitted electronically and posted on its corporate Web site, if any, every Interactive Data File required to be submitted and posted pursuant to Rule 405 of Regulation S-T during the preceding 12 months (or for such shorter period that the registrant was required to submit and post such files). YES þ NO o
Indicate by check mark if disclosure of delinquent filers pursuant to Item 405 of Regulation S-K is not contained herein, and will not be contained, to the best of registrant’s knowledge, in definitive proxy or information statements incorporated by reference in Part III of this Form 10-K or any amendment to this Form 10-K. o
Indicate by check mark whether the registrant is a large accelerated filer, an accelerated filer, a non-accelerated filer, or a smaller reporting company. See the definitions of “large accelerated filer,” “accelerated filer” and “smaller reporting company” in Rule 12b-2 of the Exchange Act.
Large accelerated filer þ | Accelerated filer o | Non-accelerated filer o (Do not check if a smaller reporting company) | Smaller reporting company o |
Indicate by check mark whether the registrant is a shell company (as defined in Rule 12b-2 of the Exchange Act). YES o NO þ
No shares of Apollo Education Group, Inc. Class B common stock, its voting stock, are held by non-affiliates. The holders of Apollo Education Group, Inc. Class A common stock are not entitled to any voting rights. The aggregate market value of Apollo Education Group Class A common stock held by non-affiliates as of February 28, 2014 (last business day of the registrant’s most recently completed second fiscal quarter), was approximately $3.2 billion.
The number of shares outstanding for each of the registrant’s classes of common stock as of October 14, 2014 is as follows:
Apollo Education Group, Inc. Class A common stock, no par value | 108,051,000 Shares |
Apollo Education Group, Inc. Class B common stock, no par value | 475,000 Shares |
DOCUMENTS INCORPORATED BY REFERENCE
Portions of the Information Statement for the 2014 Annual Meeting of Class B Shareholders (Part III)
APOLLO EDUCATION GROUP, INC. AND SUBSIDIARIES
FORM 10-K
FOR THE FISCAL YEAR ENDED AUGUST 31, 2014
INDEX
Page | ||
3
Special Note Regarding Forward-Looking Statements
This Annual Report on Form 10-K, including Item 7, Management’s Discussion and Analysis of Financial Condition and Results of Operations (“MD&A”), contains certain forward-looking statements within the meaning of Section 27A of the Securities Act of 1933, as amended, and Section 21E of the Securities Exchange Act of 1934, as amended. All statements other than statements of historical fact may be forward-looking statements. Such forward-looking statements include, among others, those statements regarding future events and future results of Apollo Education Group, Inc. that are based on current expectations, estimates, forecasts, and the beliefs and assumptions of us and our management, and speak only as of the date made and are not guarantees of future performance or results. In some cases, forward-looking statements can be identified by terminology such as “may,” “will,” “should,” “could,” “believe,” “expect,” “anticipate,” “estimate,” “plan,” “predict,” “target,” “potential,” “continue,” “objectives,” or the negative of these terms or other comparable terminology. Such forward-looking statements are necessarily estimates based upon current information and involve a number of risks and uncertainties. Such statements should be viewed with caution. Actual events or results may differ materially from the results anticipated in these forward-looking statements as a result of a variety of factors. While it is impossible to identify all such factors, factors that could cause actual results to differ materially from those estimated by us include but are not limited to:
• | Changes in regulation of the U.S. education industry and eligibility of proprietary schools to participate in U.S. federal student financial aid programs, including the factors discussed in Item 1, Business, under “Accreditation and Jurisdictional Authorizations,” “Financial Aid Programs” and “Regulatory Environment;” |
• | Each of the factors discussed in Item 1A, Risk Factors; and |
• | Those factors set forth in Item 7, Management’s Discussion and Analysis of Financial Condition and Results of Operations. |
The cautionary statements referred to above also should be considered in connection with any subsequent written or oral forward-looking statements that may be issued by us or persons acting on our behalf. We undertake no obligation to publicly update or revise any forward-looking statements, for any facts, events, or circumstances after the date hereof that may bear upon forward-looking statements. Furthermore, we cannot guarantee future results, events, levels of activity, performance, or achievements.
In this report, we refer to Apollo Education Group, Inc. as “the Company,” “Apollo Education Group,” “Apollo,” “APOL,” “we,” “us” or “our.”
4
PART I
Item 1 - Business
Overview
Apollo Education Group, Inc. is one of the world’s largest private education services providers, serving students since 1973. We seek to improve the lives of millions of learners globally by making unemployed learners job-ready and employed learners more productive in their careers and communities. Through the following education platforms, we offer undergraduate, graduate, professional development and other non-degree educational programs and services, online and on-campus, principally to working learners in the U.S. and abroad:
Domestic
• | University of Phoenix, Inc. Founded in 1976, University of Phoenix is one of the largest private universities in the U.S. and has an alumni network of more than 850,000 graduates. The University is composed of eight colleges and offers undergraduate and graduate degrees in a wide range of program areas, including business, education and nursing. The University’s more than 230,000 enrolled students attend classes online and at 110 ground campus locations throughout the U.S. and Puerto Rico. The majority of students attend classes exclusively online. In addition, the University offers a range of non-degree education programs for lifelong learners and students interested in developing skills and knowledge to improve their prospects of employment in their field of choice or advancement within their existing careers. In fiscal year 2014, University of Phoenix represented 87% of our total consolidated net revenue. |
• | Western International University, Inc. Western International University offers undergraduate and graduate degrees in a variety of program areas, including business, information technology and behavioral science. The majority of Western International University’s students attend classes online, and a limited number of courses are offered at its ground campus in Phoenix, Arizona. Western International University’s programs are designed to provide students with a more self-managed, streamlined and affordable higher education solution as they work to achieve their educational goals and advance their careers. |
• | The College for Financial Planning Institutes Corporation (“College for Financial Planning”). College for Financial Planning was founded in 1972 and is the creator of the Certified Financial Planner or CFP designation. College for Financial Planning provides online financial services education programs, including graduate degrees in three majors, certificate programs, Financial Industry Regulatory Authority securities license training, and continuing education courses. |
• | Carnegie Learning, Inc. Carnegie Learning publishes innovative, research-based math curricula and adaptive learning software for middle school and high school students. Carnegie Learning’s solutions are licensed to public and private schools throughout the U.S. Additionally, we have incorporated various adaptive learning tools developed by Carnegie Learning into University of Phoenix’s curricula in selected courses to offer a more individualized approach to learning. |
• | Apollo Lightspeed. Apollo Lightspeed is focused on developing innovative educational offerings and services that enable motivated learners to acquire in-demand job skills via non-degree learning solutions. Apollo Lightspeed operates SkilledUp, an online career skills and learning marketplace designed to connect individuals to online learning offerings where they can acquire skills valued by technology companies. |
International
Our educational programs based outside the U.S. are offered through our Apollo Global, Inc. subsidiary. We are very focused on increasing the extent of our international operations and we believe that our significant experience pioneering and delivering effective, flexible education to working learners can be utilized to successfully offer education in significant and underserved international markets. Our Apollo Global education network includes the following:
• | BPP Holdings Limited (“BPP”). BPP is headquartered in London, England and offers professional training and exam preparation programs in a variety of areas and qualification training, undergraduate and graduate degrees through BPP University, which principally includes BPP Law School and BPP Business School. The majority of BPP’s professional training and exam preparation revenue is generated from accounting and law program areas, and the majority of BPP University’s revenue represents law qualifications and law degree programs. BPP delivers most of its programs through a mix of online and on-ground instruction with locations throughout the United Kingdom and various European countries. |
• | Open Colleges Australia Pty Ltd (“Open Colleges”). Open Colleges is headquartered in Sydney, Australia and offers nationally recognized and government approved certificates, diplomas and other qualifications in a diverse range of disciplines and industries, including health and wellness, business management and services, and community services. The programs are designed for adult learners and provide flexibility through an online, asynchronous delivery model. |
5
• | Universidad Latinoamericana (“ULA”). ULA is headquartered in Mexico City, Mexico and offers graduate and undergraduate degrees, high school and executive education in a variety of program areas and disciplines. ULA delivers instruction through a mix of online and on-ground delivery at its campuses and learning centers, principally in Mexico City. |
• | Milpark Education (Pty) Ltd. (“Milpark Education”). Milpark Education is headquartered in Cape Town, South Africa and offers postsecondary education designed for adult learners, including undergraduate and graduate degrees primarily in business, and non-degree programs. Milpark Education principally delivers instruction through distance education and, in select instances, through learning in the classroom at campuses in Cape Town and Johannesburg. |
• | Apollo Global Chile S.A. (“Apollo Global Chile”). Apollo Global Chile includes Universidad de Artes, Ciencias y Comunicación (“UNIACC”) and Instituto Superior de las Artes y Comunicaciones (“IACC”). UNIACC offers undergraduate and graduate degree programs in a variety of program areas principally at its campus in Santiago, Chile. IACC primarily offers degree and non-degree programs that are delivered online. |
• | India Education Services Private Ltd (“India Education Services”). Apollo Global is developing the Bridge School of Management in India through a 50:50 joint venture with HT Media Limited, an Indian media company. The school offers non-degree management and business programs geared toward adult learners, delivered in a mix of online and on-ground teaching. |
Net Revenue
The following presents net revenue for each of our reportable segments for the respective periods:
Year Ended August 31, | |||||||||||
($ in thousands) | 2014 | 2013 | 2012 | ||||||||
University of Phoenix | $ | 2,632,949 | $ | 3,304,464 | $ | 3,873,098 | |||||
Apollo Global | 338,008 | 275,768 | 269,541 | ||||||||
Other | 53,221 | 55,692 | 50,551 | ||||||||
Net revenue | $ | 3,024,178 | $ | 3,635,924 | $ | 4,193,190 | |||||
University of Phoenix’s net revenue is comprised principally of tuition and related fees. The following table details the University’s student enrollment for the past three years:
Average Degreed Enrollment(1), (2) | Aggregate New Degreed Enrollment(1), (3) | |||||||||||||
Year Ended August 31, | Year Ended August 31, | |||||||||||||
(Rounded to the nearest hundred) | 2014 | 2013 | 2012 | 2014 | 2013 | 2012 | ||||||||
Students | 251,500 | 301,100 | 356,900 | 146,700 | 172,900 | 216,700 | ||||||||
(1) Refer to University of Phoenix below for a description of the manner in which Degreed Enrollment and New Degreed Enrollment are calculated.
(2) Represents the average of quarterly Degreed Enrollment from the beginning to the end of the respective fiscal years.
(3) Represents the sum of the four quarters of New Degreed Enrollment in the respective fiscal years.
General
University of Phoenix was founded in 1976 and Apollo was incorporated in Arizona in 1981. Apollo maintains its principal executive offices at 4025 S. Riverpoint Parkway, Phoenix, Arizona 85040 and also maintains senior executive offices at 227 West Monroe Street, Suite 3600, Chicago, Illinois 60606. Our telephone number is (480) 966-5394 and our website address is www.apollo.edu. The website addresses for our principal education platforms are as follows:
Domestic | International | |||||
University of Phoenix: | www.phoenix.edu | Apollo Global: | www.apolloglobal.us | |||
Western International University: | www.west.edu | BPP: | www.bpp.com | |||
College for Financial Planning: | www.cffp.edu | Open Colleges: | www.opencolleges.edu.au | |||
Carnegie Learning: | www.carnegielearning.com | ULA: | www.ula.edu.mx | |||
Apollo Lightspeed: | www.skilledup.com | Milpark Education: | www.milpark.ac.za | |||
Apollo Global Chile: | www.uniacc.cl; www.iacc.cl | |||||
India Education Services: | www.bridgesom.com | |||||
Our fiscal year is from September 1 to August 31. Unless otherwise noted, references to particular years or quarters refer to our fiscal years and the associated quarters of those fiscal years.
6
Strategy
We seek to improve the lives of millions of learners globally through our educational platforms by making unemployed learners job-ready and employed learners more productive in their careers and communities.
We intend to achieve our strategy and generate attractive returns for our stakeholders by focusing on the following key themes:
• | Student Success and Career Outcomes - We believe that maximizing the value our students garner from their education is critical to our success. We focus our resources on continuously improving educational programs and services and providing the support needed to enable students to successfully complete their programs and achieve their career goals. |
• | Employer Solutions - We intend to continue working with employers, including Fortune 500 companies, to help solve their human capital needs by delivering education that is relevant and impactful for today’s and tomorrow’s workforce and to become a specific source of employees to meet employers’ needs. |
• | Targeted Growth - We intend to focus on areas of high demand for qualified employees and to tailor our programs to meet the needs of students and employers in these areas, including through the increased offering of professional development and other non-degree programs. |
• | Diversify Globally - We intend to continue our expansion in international markets where we believe there is significant unmet demand for quality education. |
• | Operational Excellence - We intend to continue our efforts to streamline operations and improve efficiency, in order to deliver education more effectively and affordably. |
Industry
Domestic
The domestic postsecondary degree-granting education industry was estimated to be a $559 billion industry in 2011, according to the U.S. Department of Education, with approximately 21 million students attending institutions that participate in U.S. federal financial aid programs. Additionally, the Department projects that enrollment in postsecondary degree-granting institutions will grow 13% over the ten-year period ending in the fall of 2021 to approximately 23.8 million students. The degree-granting sector is highly fragmented with more than 4,600 domestic colleges and universities that participate in U.S. federal financial aid programs with no single institution having a significant market share. Approximately half of these colleges and universities are private, proprietary institutions that offer varying educational programs and services.
Domestic higher education also includes a variety of non-degree programs including, but not limited to, education certificate programs, continuing education, professional development and test preparation. While the non-degree sector of higher education currently represents a small portion of the total industry, enrollment in non-degree programs is growing at a faster rate compared to enrollment in degree programs.
The majority of students today have non-traditional characteristics (students who delay enrollment, attend part-time, work full-time, are financially independent for purposes of financial aid eligibility, have dependents other than a spouse, are single parents, or do not have a high school diploma). These non-traditional students (whom we generally refer to as working learners) typically are looking to improve their skills and enhance their earnings potential within the context of their careers or in pursuit of new careers. As the industry has shifted to more students with non-traditional characteristics, an increasing proportion of colleges and universities are addressing the needs of working learners. This includes colleges with well-established brand names that were historically focused on traditional students. See further discussion at Competition below.
The higher education industry is also experiencing unprecedented, rapidly developing changes due to technological developments, evolving needs and objectives of students and employers, economic constraints affecting educational institutions and students, price competition, increased focus on affordability and other factors that challenge many of the core principles underlying the industry. Based in part on these changes, we see several factors impacting the higher education market in the near future:
• | Increased demand for education offerings, including non-degree programs, that directly connect education with jobs and careers; |
• | Increased pressure for more affordable education programs; |
• | Increased focus on programs that require less time to complete; and |
• | Increased demand for proof of learning outcomes and education effectiveness. |
7
International
There were approximately 156 million students enrolled in postsecondary education worldwide in 2010, excluding the U.S., according to the U.S. Department of Education. The international higher education market and associated opportunities often vary significantly by country due to a variety of factors including, but not limited to, the political, cultural and regulatory environments. Additionally, higher education is rapidly evolving and private education is playing an important role in advancing the development of education, specifically higher education and lifelong learning, in many countries around the world. Within the last several years, educational groups have been investing in education institutions and consolidating the market in several countries. However, we believe there continues to be significant unmet demand for quality education in several key international markets that provide growth opportunities for private education as a result of the following:
• | Insufficient public funding to meet demand for education; |
• | Shortcomings in the quality of higher education offerings, resulting in the rise of supplemental training to meet industry demands in the developing world; |
• | Worldwide appreciation of the importance that knowledge plays in economic progress; and |
• | Increased availability and role of technology in education, broadening the accessibility and reach of education. |
University of Phoenix
University of Phoenix was founded in 1976 to provide access to effective higher education for working learners who wanted to advance their knowledge and achieve their professional goals. The University’s mission, purpose and strategy has driven continuous innovation in higher education and produced an alumni network of more than 850,000 graduates. The University delivers undergraduate and graduate degree programs through its eight colleges and a range of non-degree continuing education programs. The majority of the University’s students attend classes exclusively online and the proportion of the University’s online students has increased over recent years, which allows the University to leverage new and emerging technologies and optimize classroom space. For students who attend classes on-campus, the University has a ground campus network of 110 locations throughout the U.S. and Puerto Rico.
The University’s goal is to continuously improve educational programs that retain students and provide skills in high-growth industries with the purpose of increasing employment opportunities within their field of study or advancement within their existing careers. In furtherance of this, the University offers career focused programs, an instructional model designed specifically to meet the educational needs of working learners, which is discussed further below, and new technologies in its educational programs, including:
• | A new online classroom designed to provide more personalized learning to students, improve the overall student experience, and lead to better educational outcomes; |
• | Leveraging research and technology provided by the acquisition of Carnegie Learning; and |
• | A new student relationship and communications management platform designed to streamline student support services and assist students who have limited or no higher education experience or otherwise may be unprepared to succeed in the University’s academic programs. |
The University has also recently implemented enhancements to its instructional model focused on improving new student retention, including, but not limited to, the increased use of full-time faculty, adjusted course lengths, and additional resources dedicated to assisting new students during their first three courses.
In connecting education to careers, University of Phoenix has launched career-oriented tools and continues to increase career relationships with employers. These relationships provide the University with potential working learners for particular programs, serve to increase our reputation among high-profile employers, and provide the University’s students with available job postings. Employers benefit from the relationships by receiving tuition discounts for their employees and having a direct channel to the University’s students for job placement.
8
Colleges and Programs
In fiscal year 2014, the University began emphasizing the distinctiveness of its eight colleges to more effectively address the specific needs of the students and employers they serve. The University’s eight colleges, as detailed below, offer a variety of degree programs. The School of Business, College of Health Sciences and Nursing, and College of Social Sciences represent more than 70% of the University’s Degreed Enrollment, as defined in Students below.
College | Undergraduate Degrees | Master Degrees | Doctoral Degrees | |||
Advanced Studies | X | |||||
Business | X | X | ||||
Criminal Justice and Security | X | X | ||||
Education | X | X | ||||
Health Sciences and Nursing | X | X | ||||
Humanities and Sciences | X | X | ||||
Information Systems and Technology | X | X | ||||
Social Sciences | X | X | ||||
In addition to degree programs, the University offers a range of non-degree continuing education programs, including:
• | Individual, credit bearing courses in a variety of program areas that are typically from the University’s degree programs. These courses often assist students in fulfilling their educational professional goals, maintaining licensures, and earning general elective credits to transfer into a degree program. |
• | Noncredit bearing professional development programs designed to advance career-specific skills and knowledge for working professionals in a variety of program areas. |
• | Test-preparation programs designed to help working professionals achieve industry-recognized certifications and successfully complete content-specific tests. |
• | Certificate programs designed to provide working professionals with relevant knowledge and skills in their applicable field. |
Degree seeking students also have the opportunity to benefit from the University’s non-degree programs by earning up to two credentials and/or certificates that can be used in the workplace as they are working toward their ultimate degree goal with no additional tuition or time.
Instructional Model
The instructional models used by University of Phoenix are designed specifically to meet the educational needs of working learners, who seek accessibility, curriculum consistency, time and cost-effectiveness, and learning that has immediate application to the workplace. The models are structured to enable students who are employed full-time or have other commitments to earn their degrees and still meet their personal and professional responsibilities. Our focus on working, non-traditional, non-residential students minimizes the need for capital-intensive facilities and services like dormitories, student unions, food service, health care, sports and entertainment.
University of Phoenix has campus locations and learning centers throughout the U.S. and Puerto Rico, and offers students the flexibility to attend both on-campus and online classes. The University’s online classes employ a proprietary online learning system and have mandatory participation requirements for both faculty and students.
9
Components of University of Phoenix’s instructional model for both online and on-campus classes include:
• | Curriculum. Faculty content experts design the curriculum for the University’s programs, which enables it to offer current and relevant standardized programs to its students. The curricula are designed to integrate academic theory and professional practice and their application to the workplace. University of Phoenix has incorporated adaptive learning into its curricula in selected courses to offer an individualized approach to learning. |
• | Faculty. Substantially all University of Phoenix faculty possess either a master’s or doctoral degree. Faculty members typically have many years of experience in the field in which they instruct, and most teach on an adjunct basis. |
As part of our strategy to improve student retention, we have recently increased our use of full-time faculty in the initial courses students take at the University.
• | Accessibility. Most of the University’s academic programs may be accessed through a choice of delivery mode (online, campus-based or a blend of both), which make its educational programs accessible, regardless of where students work and live. |
• | Active Learning Environment and Class Schedule. University of Phoenix courses involve collaborative learning activities. Students are enrolled in courses year-round and class schedules generally vary depending on degree level. |
• | Student Education Services. The University offers students and faculty a variety of education services including learning resources for their information and research needs, tutoring, adaptive learning tools, student workshops and PhoenixConnect, the University’s proprietary academic social media network. PhoenixConnect is used to support students in their academic programs and each college has an online community manager who provides oversight and guidance with respect to college-related conversations in the network. |
• | Phoenix Career Services. Through Phoenix Career Services, we are working to expand the traditional concept of career services to include career exploration and planning during both the pre-enrollment phase and the student’s academic journey. Our Phoenix Career Guidance System allows students to clarify their career aspirations prior to enrollment, and then create personalized career plans upon enrollment that will help them develop the skills and competencies relevant to their desired careers during their academic journeys. |
Students and alumni can also access our Phoenix Career Services online portal, which includes career preparation tools such as resume and cover letter development services, interview preparation services and a collection of content to help prepare for a career change or advancement opportunity. Once students are ready to search for a career, Phoenix Career Services also provides personal assistance through a nationwide network of career coaches and an online job board from which students can access current career opportunities.
Marketing and Admissions
University of Phoenix engages in a broad range of advertising and marketing activities to educate students about the options they have in higher learning and convey the University’s value proposition and offerings to connect education to careers. The University is focused on enhancing its brand perception and utilizing different communication channels, which are discussed below, to attract students who are more likely to persist in the University’s programs.
• | Internet. Many prospective students identify their education opportunities online through search engines, information and social network sites, various education portals on the Internet and school-specific sites such as the University’s phoenix.edu. The University advertises on the Internet using search engine keywords, banners, and custom advertising placements on targeted sites, such as education portals, career sites, and industry-specific websites. The University has reduced its use of third-party operated sites and increased its use of branded media channels because the University believes this approach will help better identify students who are more likely to persist in its educational programs. |
• | Brand. Brand advertising is intended to increase potential students’ understanding of the University’s academic quality, commitment to service, academic outcomes, academic community achievements and connection of education to careers. The University’s brand is advertised primarily through national and regional broadcast, radio, online video, social, and print media. Brand advertising also serves to expand the addressable market and establish brand consideration and familiarity with the University’s colleges and programs on both a national and a local basis. |
• | Relationships with Employers and Community Colleges. As discussed further above, we establish relationships with employers in part to provide the University with a source of potential working learners for particular programs. We also establish relationships with community colleges to connect their graduates with the University’s degree programs and other educational programs. |
• | Sponsorships, Corporate Social Responsibility and Other. The University builds its presence in communities through sponsorships, advertising and event marketing to support specific activities, including local and national career events, academic lecture series, workshops and symposiums on various current topics of interest and through its corporate social responsibility outreach program. |
10
After attracting prospective students as described above, the University provides them with access to online tools, information, and resources that answer key questions and concerns prior to admission. This includes assessments of a potential student’s learning style, academic abilities and readiness to pursue higher education, a tuition calculator and information on careers.
Admission to University of Phoenix undergraduate degree programs requires a high school diploma or equivalent, and proficiency in English. Admission to master and doctoral degree programs requires an undergraduate degree, and generally for doctoral programs, a master’s degree, from a regionally or nationally accredited college or university, a minimum grade point average and relevant work experience if applicable for the field of study.
Students
The following details University of Phoenix student enrollment for the respective periods:
Fiscal Year 2012 | Fiscal Year 2013 | Fiscal Year 2014 | ||||||||||||||||||||||||||||||||||
(Rounded to the nearest hundred) | Q1 | Q2 | Q3 | Q4 | Q1 | Q2 | Q3 | Q4 | Q1 | Q2 | Q3 | Q4 | ||||||||||||||||||||||||
Degreed Enrollment(1) | 373,100 | 355,800 | 346,300 | 328,400 | 319,700 | 300,800 | 287,500 | 269,000 | 263,000 | 250,300 | 241,900 | 233,500 | ||||||||||||||||||||||||
New Degreed Enrollment(2) | 63,700 | 48,700 | 51,500 | 52,800 | 54,100 | 38,900 | 38,900 | 41,000 | 41,700 | 32,500 | 33,900 | 38,600 | ||||||||||||||||||||||||
(1) Represents students enrolled in a degree program who attended a credit bearing course during the quarter and had not graduated as of the end of the quarter; students who previously graduated from one degree program and started a new degree program in the quarter (e.g., a graduate of the associate’s degree program returns for a bachelor’s degree); and students participating in certain certificate programs of at least 18 credits with some course applicability into a related degree program.
(2) Represents new students and students who have been out of attendance for more than 12 months who enroll in a degree program and start a credit bearing course in the quarter; students who have previously graduated from a degree program and start a new degree program in the quarter; and students who commence participation in certain certificate programs of at least 18 credits with some course applicability into a related degree program.
11
Apollo Global
Our schools outside of the U.S. offer programs ranging from career oriented, non-degree certificate programs to accredited graduate degrees. BPP, based in the U.K., represents our largest international operation and contributed the majority of Apollo Global’s fiscal year 2014 net revenue. Our other international institutions are spread throughout the world with locations in Australia, North America, Africa, South America and Asia. Apollo Global’s educational network is described in more detail below:
Business and Headquarters | Principal Education Offerings | Students and Delivery Method | ||
BPP; London, England | Substantially all of BPP’s revenue is generated by undergraduate and graduate degree programs at BPP University, and its non-degree programs. BPP University includes the BPP Law School and BPP Business School, with the law school generating the substantial majority of BPP University’s revenue. The non-degree programs primarily represent professional training and exam preparation. | Substantially all BPP students reside in the U.K., and fund their education with personal funds, private loans, government financial aid funding and, in some instances, tuition reimbursement or other forms of assistance from their employers. Depending on the program, students are offered flexible learning models through on-campus, online, or blended delivery methods. | ||
Open Colleges; Sydney, Australia | Open Colleges offers non-degree programs that include certificates, diplomas and other qualifications in a diverse range of disciplines and industries. Open Colleges’ revenue is not concentrated in any particular offering and its largest program areas are health and wellness, business management and services, and community services. | Substantially all Open Colleges’ students reside in Australia and fund their education with personal funds. Open Colleges’ programs are delivered in an online, asynchronous format that provides students with the flexibility to complete programs at their convenience. | ||
ULA; Mexico City, Mexico | ULA offers graduate and undergraduate degrees, high school and executive education in medical, dental and communications programs through a mix of online and on-ground delivery at its campuses and learning centers, principally in Mexico City. | Substantially all ULA students reside in Mexico and fund their education with personal funds. Depending on the program, students are offered flexible learning models through on-campus, online or blended delivery methods. | ||
Milpark Education; Cape Town, South Africa | Milpark Education offers postsecondary education including undergraduate and graduate degrees, and non-degree programs. The substantial majority of Milpark Education’s programs are in business and finance. | Substantially all Milpark Education students reside in South Africa and fund their education with personal funds. Depending on the program, students are offered flexible learning models through distance education and on-campus learning. | ||
Apollo Global Chile; Santiago, Chile | Apollo Global Chile includes UNIACC and IACC, which offer degree programs and non-degree programs in a variety of program areas primarily focused on arts and technology. | Substantially all UNIACC and IACC students reside in Chile and fund their education with personal funds. Students are offered flexible learning models through on-campus or online delivery methods. | ||
Bridge School of Management; India | Apollo Global is developing the Bridge School of Management through a 50:50 joint venture with HT Media Limited, an Indian media company. The school offers non-degree management and business programs. | The Bridge School of Management is focused on attracting students that reside in India and offers flexible learning models through on-campus or online delivery methods. | ||
Competition
Domestic
The U.S. higher education industry is highly fragmented with no single private or public institution having a significant market share. We compete primarily with traditional public and private two-year and four-year degree-granting regionally accredited colleges and universities, other proprietary degree-granting regionally accredited schools and alternatives to higher education. In addition, we face increasing competition from various emerging non-traditional, credit-bearing and noncredit-bearing education programs, offered by both proprietary and not-for-profit providers. Some of our competitors have greater financial and nonfinancial resources than we have and are able to offer programs similar to ours at a lower tuition level for a variety of reasons, including the availability of direct and indirect government subsidies, government and foundation grants, large endowments, tax-deductible contributions and other financial resources not available to proprietary institutions, or by providing fewer student services or larger class sizes.
12
The higher education industry is also experiencing unprecedented, rapidly developing changes due to technological developments, evolving needs and objectives of students and employers, economic constraints affecting educational institutions and students, price competition, increased focus on affordability and other factors that challenge many of the core principles underlying the industry. Related to this, other education providers are testing and adapting new education and operating models focused on reducing costs, time to education outcomes and operational complexity. These recent innovations include competency based and adaptive learning, intensive skill focused bootcamps and career pathways, tools and services. In addition, an increasing number of traditional four-year and community colleges are offering distance learning and other online education programs, including programs that are geared towards the needs of working learners. This trend has been accelerated by private companies that provide and/or manage online learning platforms for traditional four-year colleges and community colleges. As the proportion of traditional colleges providing alternative learning modalities increases, we continue to face increasing competition from traditional colleges, including those with well-established reputations. Already, this type of competition is significant. As the online and distance learning segment of the postsecondary education market matures, we believe that the intensity of the competition we face will continue to increase.
We are working to accelerate the enhancement of our offerings to remain competitive and to more effectively deliver a quality student experience. In addition, we have increased our use of targeted scholarships and discounts to attract students and reward persistence.
We believe that the primary factors on which we compete are the following:
• | Breadth of reliable and high-quality programs and services tied to careers; |
• | Active and relevant curriculum development that considers the needs of employers; |
• | Career assessment and planning, and connecting career opportunities at leading companies to our students and alumni; |
• | The ability to provide flexible and convenient access to programs and classes; |
• | Comprehensive and differentiated student support services such as academic social networking; |
• | Reputation of the institution and its programs; |
• | Qualified and experienced faculty; |
• | Size and engagement of alumni network; |
• | The global geographic reach of our network of institutions; and |
• | Program affordability. |
International
In general, we operate in international markets that are highly competitive. Our international schools compete with other proprietary companies and, in certain instances, with government supported schools and institutions. Competitive factors for our international schools vary by country and, in some cases, by program offering. For example, BPP’s qualifications and law program offerings compete with other providers primarily based on reputation and student outcomes, including placement rates and exam pass rates. Competitive factors for all of our international offerings generally include the following:
• | Active and relevant curriculum development that considers the needs of employers; |
• | Breadth of reliable and high-quality programs and classes; |
• | Reputation of programs and classes; |
• | The ability to provide flexible and convenient access to programs and classes; and |
• | Program affordability. |
Employees
As of August 31, 2014, we had approximately 13,000 non-faculty employees, the substantial majority of which were employed full-time. We also had approximately 26,000 faculty members as of August 31, 2014, which principally represents University of Phoenix faculty who have taught in the last twelve months and are eligible to teach future courses. Most of our faculty are adjunct part-time faculty. We believe that our employee relations are satisfactory.
13
Accreditation and Jurisdictional Authorizations
Domestic
Accreditation
University of Phoenix is regionally accredited by the Higher Learning Commission (“HLC”) of the North Central Association of Colleges and Schools. This accreditation provides the following:
• | Recognition and acceptance by employers, other higher education institutions and governmental entities of the degrees and credits earned by students; |
• | Qualification to participate in student financial aid programs under Title IV of the Higher Education Act (“Title IV”) (in combination with state higher education operating and degree granting authority); and |
• | Qualification for authority to operate in certain states. |
Regional accreditation is accepted nationally as the basis for the recognition of earned credit and degrees for academic purposes, employment, professional licensure and, in some states, as a component of authorization to operate as a degree-granting institution.
In July 2013, the accreditation of University of Phoenix was reaffirmed by the HLC through the 2022-2023 academic year. At the same time, HLC placed the University on Notice status for a two-year period due to concerns regarding governance, student assessment and faculty scholarship/research for doctoral programs. Notice status is a sanction that means that HLC has determined that an institution is on a course of action that, if continued, could lead the institution to be out of compliance with one or more of the HLC Criteria for Accreditation or Core Components. The University was assigned by HLC to the Standard Pathway reaffirmation process, pursuant to which the University will host a comprehensive evaluation visit in 2016-2017 and will undergo its next reaffirmation visit and process in 2022-2023.
The University is required to submit a Notice Report to the HLC by the end of calendar year 2014 providing evidence that the University meets the Criteria for Accreditation, Core Components and Minimum Expectations (Assumed Practices after January 1, 2013) identified as the basis for the Notice sanction and that it has ameliorated the issues that led to the Notice sanction. In addition, in the Notice Report the University is also required to report on its progress in other areas of concern not included in the Notice sanction, including retention and graduation rates, three-year student loan cohort default rates, and credit hour policies and practices relating to learning teams. The University also will be required to host a focused visit by the HLC in January 2015, to validate the contents of the Notice Report. The HLC Board of Trustees will review the University’s Notice Report, together with a report of the focused visit, at a meeting in 2015. During the Notice period, the University is required to disclose its Notice status in connection with any statements regarding its HLC accreditation.
In addition to the above, as a condition of the HLC’s approval of the changes to the voting stock trust which holds approximately 51% of Apollo’s outstanding Class B common shares, the only class of Apollo voting stock, University of Phoenix, Western International University and College for Financial Planning must each host a visit by HLC by January 3, 2015 focused on ascertaining the appropriateness of the approval, implications for succession planning, and the effect, if any, of the change in trust arrangements on Apollo and the respective institution and their ability to continue to meet HLC’s Criteria for Accreditation and Assumed Practices.
14
Accreditation information for University of Phoenix and applicable programs is described below:
Institution/Program | Accrediting Body (Year Accredited)(1) | Status(1) | ||
University of Phoenix | • The Higher Learning Commission of the North Central Association of Colleges and Schools (1978, reaffirmed in 1982, 1987, 1992, 1997, 2002 and 2013) | • Refer above for discussion of Notice status and upcoming reports, evaluations and visits | ||
• Business programs | • Accreditation Council for Business Schools and Programs | • Reaffirmation visit expected in 2017 | ||
• Bachelor of Science in Nursing | • Commission on Collegiate Nursing Education (2005) • Previously accredited by National League for Nursing Accrediting Commission from 1989 to 2005 | • Reaffirmation visit expected in 2020 | ||
• Master of Science in Nursing | • Commission on Collegiate Nursing Education (2005) • Previously accredited by National League for Nursing Accrediting Commission from 1996 to 2005 | • Reaffirmation visit expected in 2020 | ||
• Master of Counseling in Clinical Mental Health (Phoenix and Tucson, Arizona campuses) | • Council for Accreditation of Counseling and Related Educational Programs (2012) | • Reaffirmation visit expected in 2017 or 2018 | ||
• Master of Counseling in Mental Health Counseling (Salt Lake City, Utah campus) | • Council for Accreditation of Counseling and Related Educational Programs (2001, reaffirmed in 2010, and in 2012) | • Reaffirmation visit expected in 2015 or 2016 | ||
• Master of Arts in Education with options in Elementary Teacher Education and Secondary Teacher Education • Candidate for Accreditation in Utah and Hawaii (mandatory for operation) | • Teacher Education Accreditation Council (“TEAC”) (reaffirmed in 2007) • National Council for Accreditation of Teacher Education (“NCATE”) | • The University’s programmatic accreditation from TEAC expired at the end of 2013. TEAC and NCATE have merged and become the Council for the Accreditation of Educator Preparation (“CAEP”). CAEP is finalizing its new accreditation processes. The University has elected to allow the programmatic accreditation from TEAC to expire, and is pursuing NCATE programmatic accreditation in those states where it is mandatory for operation (Utah and Hawaii), and will consider the new CAEP options when they are finalized. | ||
(1) References to years refer to calendar year.
Western International University has been accredited by HLC since 1984. In fiscal year 2013, the accreditation of Western International University was reaffirmed by the HLC through the 2022-2023 academic year. At the same time, HLC placed Western International University on Notice status for a two-year period.
College for Financial Planning has been accredited by HLC since 1994. During fiscal year 2014, College for Financial Planning was informed in writing by HLC that it had addressed HLC’s findings from its most recent accreditation reaffirmation review. The next comprehensive visit from HLC is scheduled during the 2017-2018 school year.
Jurisdictional Authorizations
In addition to accreditation by independent accrediting bodies, our schools must be authorized to operate by the appropriate regulatory authorities in many of the jurisdictions in which they operate. Institutions that participate in Title IV programs must be authorized to operate by the appropriate postsecondary regulatory authority in each state where the institution has a physical presence. University of Phoenix is specifically authorized to operate in all of the domestic jurisdictions in which it operates. Some states assert authority to regulate all degree-granting institutions if their educational programs are available to their residents, whether or not the institutions maintain a physical presence within those states. University of Phoenix has obtained licensure in states which require such licensure and where students are enrolled. Refer to Part I, Item 1A, Risk Factors - Risks Related to the Highly Regulated Industry in Which We Operate - If we fail to maintain any of our state authorizations, we would lose our ability to operate in that state and to participate in Title IV programs there.
15
Our other domestic institutions maintain the requisite authorizations in the jurisdictions in which they operate.
International
Our international businesses must be authorized by the relevant regulatory authorities under applicable local law, which in some cases requires accreditation, as described below:
• | BPP - BPP University Limited has been awarded degree awarding powers by the U.K. Privy Council, and certain of its awards are accredited by professional bodies toward professional qualifications. This designation is expected to require renewal during the 2018-2019 school year. Additionally, BPP Professional Education is an accredited training provider for a number of professional bodies offering training toward those bodies’ professional qualifications. BPP also has additional accreditations by country and/or program as necessary. |
• | Open Colleges - Open Colleges’ operates three registered training organizations as approved by the Australian Skills Quality Authority. All three registrations were recently renewed for the maximum allowable period of five years with the first expiring and requiring renewal in our fiscal year 2018. |
• | ULA - ULA is recognized as a University of Excellence, which is the highest level of institutional accreditation from the Mexican Federation of Private Institutions of Higher Education (Federación de Instituciones Mexicanas Particulares de Educación Superior). ULA operates under additional regional or programmatic regulators in Mexico, as applicable. |
• | Milpark Education - Milpark Education is registered with the South African Department of Higher Education and Training as a Private Higher Education Institution. |
• | Apollo Global Chile - UNIACC and IACC are regulated by the Chilean Ministry of Education (Ministerio de Educación de Chile) and have programmatic accreditations, as applicable. |
• | Bridge School of Management - The Bridge School of Management offers non-accredited programs. |
Financial Aid Programs
Domestic
The principal source of federal student financial aid in the U.S. is Title IV of the Higher Education Act, as it is amended and reauthorized from time to time by the U.S. Congress, and the related regulations adopted by the U.S. Department of Education. We refer to the financial aid programs under this Act as “Title IV” programs. In 2008, the Higher Education Act was reauthorized through September 30, 2013 by the Higher Education Opportunity Act and an automatic one year extension continued the authorization through September 30, 2014. Congress continues to engage in Higher Education Act reauthorization hearings and although the one year automatic extension has expired, Title IV programs remain authorized and functioning.
Financial aid under Title IV programs is awarded annually to eligible students. Some Title IV programs award financial aid on the basis of financial need, generally defined as the difference between the cost of attending an educational institution and the amount the student and/or the student’s family, as the case may be, can reasonably be expected to contribute to that cost. The amount of financial aid awarded to a student each academic year is based on many factors, including, but not limited to, program of study, grade level, Title IV annual loan limits, and financial need. We have substantially no control over the amount of Title IV student loans or grants sought by or awarded to our students. All recipients of Title IV program funds must maintain satisfactory academic progress within the guidelines published by the U.S. Department of Education to remain eligible. Refer to Part I, Item 1A, Risk Factors - Risks Related to the Highly Regulated Industry in Which We Operate - Action by the U.S. Congress to revise the laws governing federal student financial aid programs or reduce funding for those programs, including changes applicable only to proprietary educational institutions, could reduce our enrollment and increase our costs of operation.
In addition to Title IV programs, qualifying U.S. active military and veterans and their family members are eligible for federal student aid from various Departments of Defense and Veterans Affairs programs. We refer to the financial aid programs administered by these Departments as “military benefit” programs.
16
During fiscal year 2014, 81% of University of Phoenix’s cash basis revenue for eligible tuition and fees was derived from the receipt of Title IV program funds, as calculated under the 90/10 Rule described below. These Title IV program funds are principally comprised of federal student loans and Pell Grants:
• | Student loans currently are the most significant component of Title IV program funds and are administered through the Federal Direct Loan Program. Annual and aggregate loan limits apply based on the student’s grade level and other factors. Currently, the maximum annual loan amounts range from $3,500 to $12,500 for undergraduate students and $20,500 for graduate students. There are two types of federal student loans: subsidized loans, which are based on the statutory calculation of student need, and unsubsidized loans, which are not based on student need. Neither type of student loan is based on creditworthiness. Students are not responsible for interest on subsidized loans while enrolled in school. Graduate and professional students are not eligible for subsidized loans. Students are responsible for the interest on unsubsidized loans while enrolled in school, but have the option to defer payment while enrolled. Repayment on federal student loans begins six months after the date the student ceases to be enrolled. The loans are repayable over the course of 10 years and, in some cases, longer. During fiscal year 2014, student loans (both subsidized and unsubsidized) represented approximately 76% of the gross Title IV program funds received by University of Phoenix. |
• | Federal Pell Grants are awarded based on need and only to undergraduate students who have not earned a bachelor’s or professional degree. Unlike loans, Pell Grants do not have to be repaid. During fiscal year 2014, Pell Grants represented approximately 24% of the gross Title IV program funds received by University of Phoenix. The eligibility for and maximum amount of Pell Grants have increased over recent years. Since the 2006-2007 award year, the maximum annual Pell Grant award has increased from $4,050 to $5,730 for the 2014-2015 award year. Because the federal Pell Grant program is one of the largest non-defense discretionary spending programs in the federal budget, it is a target for reduction as Congress seeks to reduce the U.S. budget deficit. A reduction in the maximum annual Pell Grant amount or changes in eligibility could negatively impact enrollment and could result in increased student borrowing, which would make it more difficult for us to comply with other important regulatory requirements such as maintaining student loan cohort default rates below specified levels. |
The remaining funding for tuition and other fees paid by our students primarily consists of state-funded student financial aid, tuition assistance from employers and personal funds.
International
Although students enrolled at certain of our international institutions receive government financial aid funding, such funding is not a material component of our net revenue from international institutions.
Regulatory Environment
Domestic
Our domestic postsecondary institutions are subject to extensive federal and state regulations. The Higher Education Act, as reauthorized, and the related U.S. Department of Education regulations govern all higher education institutions participating in Title IV programs, and provide for a regulatory triad by mandating specific regulatory responsibilities for each of the following:
• | The accrediting agencies recognized by the U.S. Department of Education; |
• | The federal government through the U.S. Department of Education; and |
• | State higher education regulatory bodies. |
To be eligible to participate in Title IV programs, a postsecondary institution must be accredited by an accrediting body recognized by the U.S. Department of Education, must comply with the Higher Education Act, as reauthorized, and all applicable regulations thereunder, and must be authorized to operate by the appropriate regulatory authority in each state where the institution maintains a physical presence. We have summarized below recent material activity in the regulatory environment affecting our business and the most significant regulatory requirements applicable to our domestic postsecondary operations.
Changes in or new interpretations of applicable laws, rules, or regulations could have a material adverse effect on our eligibility to participate in Title IV programs, accreditation, authorization to operate in various states, permissible activities, and operating costs. The failure to maintain or renew any required regulatory approvals, accreditation, or state authorizations could have a material adverse effect on us. Refer to Part I, Item 1A, Risk Factors - Risks Related to the Highly Regulated Industry in Which We Operate.
Financial Aid Funding. In recent years, there has been increased focus by members of the U.S. Congress and federal agencies such as the Consumer Financial Protection Bureau and the Federal Trade Commission on the role that proprietary educational institutions play in higher education. We expect this focus to increase, particularly during the time leading up to the 2014 mid-term elections. Congressional hearings and roundtable discussions have been held regarding various aspects of the education
17
industry, and reports have been issued that are highly critical of proprietary institutions and include a number of recommendations to be considered by Congress in connection with the upcoming reauthorization of the federal Higher Education Act. The current reauthorization expired September 30, 2013 and an automatic one year extension continued the authorization through September 30, 2014. Congress continues to engage in Higher Education Act reauthorization hearings and although the one year automatic extension has expired, Title IV programs remain authorized and functioning.
In addition, Title IV program funding is a potential target for reduction as Congress seeks to reduce the U.S. budget deficit. Because a substantial portion of our revenue is derived from Title IV programs, any action by Congress that reduces Title IV program funding, whether through across-the-board funding reductions, sequestration or otherwise, or alters the eligibility of our institutions or students to participate in Title IV programs could have a material adverse effect on our enrollment and financial condition. Action by Congress or federal agencies could also require us to modify our practices in ways that increase our administrative costs and reduce our operating income.
In addition to possible reductions in Title IV program funding, certain military financial aid may be reduced as military branches address decreased funding. Reductions and/or changes in military financial aid could result in increased student borrowing, decreased enrollment and adverse impacts on our 90/10 Rule percentage, as discussed below.
Gainful Employment. Under the Higher Education Act, as reauthorized, proprietary schools are generally eligible to participate in Title IV programs only in respect of educational programs that lead to “gainful employment in a recognized occupation.” In connection with this requirement, proprietary postsecondary institutions are required to provide prospective students with specified disclosures, including each eligible program’s recognized occupations, cost, completion rate, job placement rate, and median loan debt of program completers. These reporting requirements could adversely impact student enrollment, persistence and retention if our reported program information compares unfavorably with other reporting educational institutions. In addition, the U.S. Department of Education has proposed new rules that would limit program eligibility for Title IV if certain gainful employment metrics are not satisfied. Refer to U.S. Department of Education Rulemaking Initiative below.
U.S. Department of Education Rulemaking Initiative. In March 2014, the U.S. Department of Education issued a Notice of Proposed Rulemaking (“NPRM”) to establish measures for determining whether certain postsecondary educational programs prepare students for gainful employment in a recognized occupation, and the conditions under which these educational programs remain eligible to participate in Title IV programs. The public comment period on the NPRM ended in May 2014 and the Department has submitted its proposed final rule to the Office of Information and Regulatory Affairs for review and approval before the final regulations are published. The effective date of any such regulations cannot be determined until final regulations are published by the Department. If the Department publishes final regulations by November 1, 2014, such regulations could be effective as early as July 1, 2015. Under the proposed rule, if the students who complete a program have high debt-to-earnings ratios or students who complete or withdraw have high program-level cohort default rates, the program would lose its Title IV eligibility for three years. In general, the proposed debt-to-earnings metric requires that students who complete a program must not, on average, spend more than 8% of their annual income, or 20% of their discretionary income, on their student loan payments. The proposed program cohort default metric requires that the student loan default rate for students who completed or withdrew from a particular program during a given year may not exceed 30% measured during the three years after entering repayment. Under the proposed rule, programs would also be obligated to meet necessary programmatic accreditation requirements as well as applicable state licensure standards for any state in the institution’s regional area. Institutions would be required to attest that their programs meet these requirements as part of the program participation agreement with the Department. Additional details are available at
http://www2.ed.gov/policy/highered/reg/hearulemaking/2012/gainfulemployment.html. These regulations, if promulgated as currently proposed, would impose significant new administrative burdens on our operations and could limit our ability to offer certain programs.
Additionally, the Department announced the creation of a rulemaking committee to focus on other topics, including cash management and state authorization. This committee has held negotiated rulemaking sessions, but the committee failed to reach consensus on all topics. These negotiated rulemaking initiatives are expected to produce new regulations in a variety of areas. In May 2014, prior to the final negotiated rulemaking session, the Department issued its proposal for certain new regulations, including those for state authorization. The proposed regulations, if promulgated as drafted, would impose significant new regulatory burdens on postsecondary institutions which provide distance education, regardless of educational sector, including University of Phoenix. The effective date of any such regulations cannot be determined at this time, but it is likely that the rules, if adopted, would be effective on or after July 1, 2015. While the Department is expected to issue final regulations in a number of these areas, the Department has indicated that it does not expect to promulgate additional regulations for state authorization for distance education programs without further study. Additional details are available at
http://www2.ed.gov/policy/highered/reg/hearulemaking/2012/programintegrity.html.
The Department has also conducted listening tours to solicit public feedback building on President Obama’s call for a national college rating system. The Secretary of the Department has publicly stated that a draft ratings system is expected to be issued
18
by the end of calendar year 2014, and the Department has been charged with issuing the ratings for use by students and others for the 2015-2016 school year.
Eligibility and Certification Procedures. The Higher Education Act, as reauthorized, specifies the manner in which the U.S. Department of Education reviews institutions for eligibility and certification to participate in Title IV programs. Every educational institution involved in Title IV programs must be certified to participate and is required to periodically renew this certification.
University of Phoenix was recertified in November 2009 and entered into a new Title IV Program Participation Agreement which expired on December 31, 2012. The University has submitted necessary documentation for re-certification and its eligibility continues on a month-to-month basis until the Department issues its decision on the application. We have no reason to believe that the University’s application will not be renewed in due course, and it is not unusual to be continued on a month-to-month basis until the Department completes its review. We cannot predict whether, or to what extent, the imposition of the Notice sanction by The Higher Learning Commission might have on this process.
Western International University was recertified in May 2010 and its current certification expired on September 30, 2014. Western International University has submitted necessary documentation for re-certification and its eligibility continues on a month-to-month basis until the Department issues its decision on the application.
90/10 Rule. University of Phoenix and Western International University, and all other proprietary institutions of higher education, are subject to the so-called “90/10 Rule” under the Higher Education Act, as reauthorized. Under this rule, a proprietary institution will be ineligible to participate in Title IV programs for at least two fiscal years if for any two consecutive fiscal years it derives more than 90% of its cash basis revenue, as defined in the rule, from Title IV programs. If an institution is determined to be ineligible, any disbursements of Title IV program funds made after the end of the second fiscal year in the measuring period must be repaid to the U.S. Department of Education. An institution that derives more than 90% of its cash basis revenue from Title IV programs for any single fiscal year will be automatically placed on provisional certification for two fiscal years and will be subject to possible additional sanctions determined to be appropriate under the circumstances by the Department. While the Department has broad discretion to impose additional sanctions on such an institution, there is only limited precedent available to predict what those sanctions might be, particularly in the current regulatory environment. For example, the Department could impose conditions in the provisional certification such as:
• | Restrictions on the total amount of Title IV program funds that may be disbursed to students; |
• | Restrictions on programmatic and geographic expansion; |
• | Requirements to obtain and post letters of credit; |
• | Additional reporting requirements such as interim financial reporting; or |
• | Any other conditions deemed appropriate by the Department. |
The 90/10 Rule percentages for University of Phoenix and Western International University were as follows for the respective periods:
Year Ended August 31, | |||||
2014 | 2013 | 2012 | |||
University of Phoenix | 81% | 83% | 84% | ||
Western International University | 62% | 66% | 68% | ||
The decrease in the University of Phoenix 90/10 Rule percentage is attributable to changes in student mix and the associated available sources of tuition funding. As the University’s enrollment has declined in recent years, the proportion of its student body that uses a lower percentage of Title IV program funds for eligible tuition and fees, such as students that receive tuition assistance from employers or that participate in military benefit programs, has increased. The University has also implemented various other measures in recent years intended to reduce the percentage of its cash basis revenue attributable to Title IV program funds, including encouraging students to carefully evaluate the amount of necessary Title IV program borrowing and increased focus on non-degree continuing education programs. The University has very little influence over the amount of Title IV program student loans and grants sought by or awarded to eligible students.
Based on recent trends, we do not expect the 90/10 Rule percentage for University of Phoenix to exceed 90% for fiscal year 2015. However, the 90/10 Rule percentage for the University remains high and could exceed 90% in the future depending on the degree to which its various initiatives are effective, the impact of future changes in its enrollment mix, and regulatory and other factors outside our control, including any reduction in military benefit programs or changes in the treatment of such funding for purposes of the 90/10 Rule calculation.
19
Various legislative proposals have been introduced in Congress that would heighten the requirements of the 90/10 Rule, including proposals that would reduce the 90% maximum under the rule to the pre-1998 level of 85%, cause tuition derived from military benefit programs to be included in the 85% portion under the rule instead of the 10% portion as is the case today, and impose Title IV program ineligibility after one year of noncompliance rather than two. If these or similar proposals are adopted, University of Phoenix would be required to increase efforts and resources dedicated to reducing the percentage of cash basis revenue attributable to Title IV program funds.
Any necessary efforts to reduce the 90/10 Rule percentage for University of Phoenix, especially if the percentage exceeds 90% for a fiscal year, may involve taking measures which reduce our revenue, increase our operating expenses, or both, in each case perhaps significantly. In addition, we may be required to make structural changes to our business in the future in order to remain in compliance, which changes may materially alter the manner in which we conduct our business and materially and adversely impact our business and financial condition. Furthermore, these required changes could make it more difficult to comply with other important regulatory requirements, such as the student loan cohort default rate regulations, which are discussed below.
Student Loan Cohort Default Rates. To remain eligible to participate in Title IV programs, an educational institution’s student loan cohort default rates must remain below certain specified levels. Each cohort is the group of students who first enter into student loan repayment during a federal fiscal year (ending September 30). The cohort default rates are published by the U.S. Department of Education approximately 12 months after the end of the applicable measuring period. Thus, in September 2014, the Department published the three-year cohort default rates for the 2011 cohort.
An educational institution loses eligibility to participate in Title IV programs if its three-year cohort default rate equals or exceeds 40% for any given year or 30% for three consecutive years. If an institution’s three-year cohort default rate equals or exceeds 30% for any given year, it must establish a default prevention task force and develop a default prevention plan with measurable objectives for improving the cohort default rate. We believe that our current repayment management efforts would meet these requirements.
Based on information published by the U.S. Department of Education, the three-year cohort default rates for University of Phoenix, Western International University and for all proprietary postsecondary institutions for the applicable federal fiscal years were as follows:
Three-Year Cohort Default Rates for Cohort Years Ended September 30, | |||||
2011 | 2010 | 2009 | |||
University of Phoenix | 19.0% | 26.0% | 26.4% | ||
Western International University | 12.0% | 10.8% | 13.7% | ||
All proprietary postsecondary institutions | 19.1% | 21.8% | 22.7% | ||
We believe that our efforts to shift our student mix to a higher proportion of students in higher degree level programs and our investment in student protection initiatives and repayment management services have favorably impacted our rates. As part of our repayment management initiatives, we engage third-party service providers to assist our students who are at risk of default. These service providers contact students and offer assistance, which includes providing students with specific loan repayment information such as repayment options and loan servicer contact information, and they attempt to transfer these students to the relevant loan servicer to resolve their delinquency. In addition, we are focused on improving student retention and on enrolling students who are better able to succeed in our programs, in part because the rate of default is higher among students who do not complete their degree program compared to students who graduate.
Based on our most recent trends, we expect the 2012 three-year cohort default rate for University of Phoenix to be lower than the 2011 three-year cohort default rate. However, if our student loan default rates approach the applicable limits, we may be required to increase efforts and resources dedicated to improving these default rates. This is challenging because most borrowers who are in default or at risk of default are no longer students, and we may have only limited contact with them. Furthermore, continued increased attention has been given by members of Congress and others on default aversion activities of proprietary education institutions. If such attention leads to congressional or regulatory action restricting the types of default aversion assistance that educational institutions are permitted to provide, the default rates of our former students may be negatively impacted. Accordingly, there is no assurance that we would be able to effectively improve our default rates or improve them in a timely manner to meet the requirements for continued participation in Title IV programs if we experience a substantial increase in our student loan default rates.
State Authorization. Institutions that participate in Title IV programs must be authorized to operate by the appropriate postsecondary regulatory authority in each state where the institution has a physical presence. University of Phoenix is specifically authorized to operate in all of the domestic jurisdictions in which it operates. In May 2014, the U.S. Department of
20
Education issued a proposal for certain new regulations, including those for state authorization. Refer to U.S. Department of Education Rulemaking Initiative above.
U.S. Department of Education Program Reviews. The U.S. Department of Education periodically reviews institutions participating in Title IV programs for compliance with applicable standards and regulations. In August 2014, the Department commenced an ordinary course program review of University of Phoenix’s administration of Title IV programs covering federal financial aid years 2012-2013 and 2013-2014, as well as compliance with the Jeanne Clery Disclosure of Campus Security Policy and Campus Crime Statistics Act, the Drug-Free Schools and Communities Act and related regulations.
Office of the Inspector General of the U.S. Department of Education (“OIG”) Subpoena. In March 2014, University of Phoenix received a subpoena from the Mid-Atlantic Region of the OIG. The subpoena seeks the production by the University of documents and detailed information regarding a broad spectrum of the activities conducted in the University’s Centralized Service Center for the Northeast Region located in Columbia, Maryland, for the time period of January 1, 2007 to the present, including information relating to marketing, recruitment, enrollment, financial aid processing, fraud prevention, student retention, personnel training, attendance, academic grading and other matters. We are cooperating with these requests but cannot at this time predict the eventual scope, duration or outcome of this matter.
Administrative Capability. The Higher Education Act, as reauthorized, directs the U.S. Department of Education to assess the administrative capability of each institution to participate in Title IV programs. The failure of an institution to satisfy any of the criteria used to assess administrative capability may cause the Department to determine that the institution lacks administrative capability and, therefore, subject the institution to additional scrutiny or deny eligibility for Title IV programs.
Standards of Financial Responsibility. Pursuant to the Title IV program regulations, each eligible higher education institution must satisfy a measure of financial responsibility that is based on a weighted average of the following three annual ratios which assess the financial condition of the institution:
• | Primary Reserve Ratio - measure of an institution’s financial viability and liquidity; |
• | Equity Ratio - measure of an institution’s capital resources and its ability to borrow; and |
• | Net Income Ratio - measure of an institution’s profitability. |
These ratios provide three individual scores which are converted into a single composite score. The maximum composite score is 3.0. If the institution achieves a composite score of at least 1.5, it is considered financially responsible. A composite score from 1.0 to 1.4 is also considered financially responsible, and the institution may continue to participate as a financially responsible institution for up to three years, subject to additional monitoring and other consequences. If an institution does not achieve a composite score of at least 1.0, it can be transferred from the “advance” system of payment of Title IV program funds to cash monitoring status or to the “reimbursement” system of payment, under which the institution must disburse its own funds to students and document the students’ eligibility for Title IV program funds before receiving such funds from the U.S. Department of Education.
The fiscal year 2014 composite scores for Apollo Education Group, University of Phoenix and Western International University were as follows:
Fiscal Year 2014 Composite Score | |
Apollo Education Group | 2.5 |
University of Phoenix | 2.3 |
Western International University | 1.8 |
Limits on Title IV Program Funds. The Title IV regulations place restrictions on the types of programs offered and the amount of Title IV program funds that a student is eligible to receive in any one academic year. Only certain types of educational programs offered by an institution qualify for Title IV program funds. For students enrolled in qualified programs, the Title IV regulations place limits on the amount of Title IV program funds that a student is eligible to receive in any one academic year, as defined by the U.S. Department of Education. An academic year must consist of at least 30 weeks of instructional time and a minimum of 24 credits. University of Phoenix and Western International University’s degree programs meet the academic year minimum definition of 30 weeks of instructional time and 24 credits and qualify for Title IV program funds. Our institutions also have non-degree continuing education programs that do not qualify for Title IV program funds.
Restricted Cash. The U.S. Department of Education places restrictions on Title IV program funds held for students for unbilled educational services. As a trustee of these Title IV program funds, we are required to maintain and restrict these funds pursuant to the terms of our program participation agreement with the Department. These funds are included in restricted cash and cash equivalents in our Consolidated Balance Sheets in Item 8, Financial Statements and Supplementary Data.
21
Branching and Classroom Locations. The Title IV regulations contain specific requirements governing the establishment of new locations at which the eligible institution offers, or could offer, 50% or more of an educational program. The U.S. Department of Education requires that the institution notify the Department of each location offering 50% or more of an educational program prior to disbursing Title IV program funds to students at that location. University of Phoenix has procedures in place to ensure timely notification and acquisition of all necessary location approvals prior to disbursing Title IV program funds to students attending any new location. In addition, The Higher Learning Commission and state regulators have requirements for the establishment of new locations.
There are also certain regulatory requirements associated with closing locations. During fiscal year 2013, University of Phoenix initiated a plan to realign its ground locations throughout the U.S., which included closing 115 locations. Refer to Item 7, Management’s Discussion and Analysis of Financial Condition and Results of Operations.
Change of Ownership or Control. Approximately 51% of our outstanding Class B voting shares, our only class of voting stock, is held by the Apollo Class B Voting Stock Trust No. 1 (the “Class B Trust”), an irrevocable trust of which the current trustees are Peter V. Sperling, Chairman of our Board of Directors, Ms. Terri Bishop, the Vice Chair of our Board of Directors, and Ms. Darby Shupp, a member of our Board of Directors.
Any change of ownership or control of Apollo Education Group, depending on the type of change, may have significant regulatory consequences for University of Phoenix, Western International University and College for Financial Planning. Such a change of ownership or control could require recertification by the U.S. Department of Education, the reevaluation of accreditation by The Higher Learning Commission and/or reauthorization by state licensing agencies. If we experience a change of ownership or control, then University of Phoenix and Western International University may cease to be eligible to participate in Title IV programs until recertified by the Department. There is no assurance that such recertification would be obtained on a timely basis. Under some circumstances, the Department may continue an institution’s participation in Title IV programs on a provisional basis pending completion of the change in ownership approval process.
In addition, University of Phoenix, Western International University and College for Financial Planning would be required to report any material change in stock ownership to their principal institutional accrediting body, The Higher Learning Commission, and would be required to obtain approval prior to undergoing any transaction that affects, or may affect, their corporate control or governance. In the event of any such change, The Higher Learning Commission may undertake an evaluation of the effect of the change on the continuing operations of University of Phoenix, Western International University and College for Financial Planning for purposes of determining if continued accreditation is appropriate, which evaluation may include a comprehensive review.
Also, some states in which University of Phoenix, Western International University or College for Financial Planning are licensed require approval (in some cases, advance approval) of changes in ownership or control in order to remain authorized to operate in those states, and participation in grant programs in some states may be interrupted or otherwise affected by a change in ownership or control.
In July 2014, the Class B Trust was amended to, among other things, make it irrevocable and appoint the three current trustees. These amendments were previously approved by The Higher Learning Commission as an approved change of control, and found by the U.S. Department of Education to be excluded from the Department’s change of control approval process. The Higher Learning Commission’s approval of the amendments is subject to the condition that each accredited Apollo institution hosts a visit by HLC by January 3, 2015 focused on ascertaining the appropriateness of the approval, implications for succession planning, and the effect, if any, of the change in trust arrangements on Apollo and the relevant institution and their ability to continue to meet HLC’s Criteria for Accreditation and Assumed Practices.
Refer to Part I, Item 1A, Risk Factors - Risks Related to the Control Over Our Voting Stock - If regulators do not approve or delay their approval of transactions involving a change of control of our company, our state licenses, accreditation, and ability to participate in Title IV programs and state grant programs may be impaired, which could materially and adversely affect our business.
U.S. Department of Education Reporting and Disclosure Requirements. Based on the rising cost of postsecondary education and an effort for more transparency, the U.S. Department of Education publishes national lists annually disclosing the top five percent in each of nine institutional categories with the highest college costs and largest percentage cost increases. Institutions published on such lists may receive negative media attention that may cause some prospective students to choose educational alternatives. University of Phoenix and Western International University have not been on these lists.
International
Governmental regulations in foreign countries significantly affect our international operations. New or revised interpretations of regulatory requirements could have a material adverse effect on us. Changes in existing or new interpretations of applicable laws, rules, or regulations in the foreign jurisdictions in which we operate could have a material adverse effect on our accreditation, authorization to operate, permissible activities, and costs of doing business outside of the U.S. The failure to
22
maintain or renew any required regulatory approvals, accreditation or state authorizations could have a material adverse effect on our international operations.
Available Information
We file annual, quarterly and current reports with the Securities and Exchange Commission. You may read and copy any document we file at the Securities and Exchange Commission’s Public Reference Room at 100 F Street NE, Washington, D.C. 20549. Please call the Securities and Exchange Commission at 1-800-SEC-0330 for information on the Public Reference Room. The Securities and Exchange Commission maintains a website that contains annual, quarterly and current reports that issuers file electronically with the Securities and Exchange Commission. The Securities and Exchange Commission’s website is www.sec.gov.
Our website address is www.apollo.edu. We make available free of charge on our website our Annual Report on Form 10-K, Quarterly Reports on Form 10-Q, Current Reports on Form 8-K, Information Statements on Schedule 14C, Forms 3, 4, and 5 filed on behalf of directors and executive officers, and all amendments to those reports filed or furnished pursuant to the Securities Exchange Act of 1934, as soon as reasonably practicable after such reports are electronically filed with, or furnished to, the Securities and Exchange Commission.
Item 1A - Risk Factors
You should carefully consider the risks and uncertainties described below and all other information contained in this Annual Report on Form 10-K. In order to help assess the major risks in our business, we have identified many, but not all, of these risks, categorized as Risks Related to the Highly Regulated Industry in Which We Operate, Risks Related to our Business and Risks Related to the Control Over our Voting Stock. Due to the scope of our operations, a wide range of factors could materially affect future developments and performance.
If any of the following risks are realized, our business, financial condition, cash flows or results of operations could be materially and adversely affected, and as a result, the trading price of our Class A common stock could be materially and adversely impacted. These risk factors should be read in conjunction with other information set forth in this Annual Report, including Item 7, Management’s Discussion and Analysis of Financial Condition and Results of Operations, and Item 8, Financial Statements and Supplementary Data, including the related Notes to Consolidated Financial Statements.
Risks Related to the Highly Regulated Industry in Which We Operate
If we fail to comply with the extensive regulatory requirements for our business, we could face significant monetary liabilities, fines and penalties, including loss of access to U.S. federal student loans and grants for our students.
We are subject to extensive U.S. federal and state regulation as a provider of postsecondary education. The principal federal regulatory regime is established under the Higher Education Act of 1965, as it is amended and reauthorized from time to time, and the regulations promulgated under the Act by the U.S. Department of Education. Among other matters, these regulations govern the participation by University of Phoenix and Western International University in federal student financial aid programs under Title IV of the Higher Education Act (“Title IV”), which is the principal source of funding for students at these universities. A substantial majority of our fiscal year 2014 total consolidated net revenue was derived from receipt of Title IV program funds disbursed to our students.
The Higher Education Act, as reauthorized, mandates specific regulatory responsibilities for each of the following components of the higher education regulatory triad: (1) the federal government through the U.S. Department of Education; (2) independent accrediting agencies recognized by the Department of Education; and (3) state higher education regulatory bodies.
The applicable regulatory requirements cover virtually all phases of our U.S. operations, including educational program offerings, branching and classroom locations, instructional and administrative staff, administrative procedures, marketing and recruiting, financial operations, payment of refunds to students who withdraw, maintenance of restricted cash, acquisitions or openings of new schools, commencement of new or cessation of existing educational programs and changes in our corporate structure and ownership.
The applicable regulations, standards and policies of the various regulatory agencies frequently change and often are subject to interpretative uncertainty, particularly where they are crafted for traditional, academic term-based schools rather than our non-term academic delivery model. Changes in, or new interpretations of, applicable laws, regulations, standards or policies could have a material adverse effect on our accreditation, authorization to operate in various states, permissible activities, receipt of funds under Title IV programs, costs of doing business and our ability to implement beneficial changes in our academic or business model. We cannot predict how the requirements administered by these agencies will be applied or interpreted in the future, or whether our schools will be able to comply with any future changes in these requirements.
23
If we are found to have violated any applicable regulations, standards or policies, we may be subject to the following sanctions imposed by any one or more of the relevant regulatory agencies:
• | Monetary fines or penalties; |
• | Limitation or termination of our operations or ability to grant degrees, diplomas and certificates; |
• | Restriction or revocation of our accreditation, licensure or other operating authority; |
• | Limitation, suspension or termination of our eligibility to participate in Title IV programs or state financial aid programs; |
• | Imposition by the U.S. Department of Education of a delay in the disbursement of Title IV program funds or transfer from the Department advance system of receiving Title IV program funds to its reimbursement system, under which a school must disburse its own funds to students and document the students’ eligibility for Title IV program funds before receiving such funds from the Department; |
• | Repayment of funds received under Title IV programs or state financial aid programs; |
• | Requirement to post a letter of credit with the U.S. Department of Education; |
• | Requirement of heightened cash monitoring by the U.S. Department of Education; |
• | Other civil or criminal penalties; and/or |
• | Other forms of censure. |
In addition, in some circumstances of noncompliance or alleged noncompliance, we may be subject to qui tam lawsuits under the Federal False Claims Act or various, similar state false claim statutes. In these actions, private plaintiffs seek to enforce remedies under the Act on behalf of the federal government and, if successful, are entitled to recover their costs and to receive a portion of any amounts recovered by the federal government in the lawsuit. These lawsuits can be prosecuted by a private plaintiff, even if the Department does not agree with plaintiff’s theory of liability. In 2009, we settled a qui tam lawsuit relating to alleged payment of incentive compensation to our enrollment counselors for a total payment of $80.5 million, and we currently are subject to a qui tam lawsuit alleging payment of improper incentive compensation in subsequent periods. For more information about the pending qui tam case, refer to Note 16, Commitments and Contingencies, in Part II, Item 8, Financial Statements and Supplementary Data.
In October 2011, the Office of the Inspector General of the U.S. Department of Education (“OIG”) notified us that it was conducting a nationwide audit of the Department’s program requirements, guidance, and monitoring of institutions of higher education offering distance education. In connection with the OIG’s audit of the Department, the OIG examined a sample of University of Phoenix students who enrolled during the period from July 1, 2010 to June 30, 2011. The OIG subsequently notified University of Phoenix that in the course of this review it identified certain conditions that the OIG believed were Title IV program compliance exceptions at University of Phoenix. Although University of Phoenix was not the direct subject of the OIG’s audit of the Department, the OIG asked University of Phoenix to respond so that it could consider University of Phoenix’s views in formulating its audit report of the Department. In September 2013, the OIG provided to University of Phoenix, among other institutions, a draft appendix to its audit report which again identified compliance exceptions at University of Phoenix. University of Phoenix responded to the appendix. In February 2014, the OIG released a final audit report on this subject entitled Title IV of Higher Education Act Programs: Additional Safeguards are Needed to Help Mitigate the Risks that Are Unique to the Distance Education Environment. This report included Appendix J related to University of Phoenix, which identified exceptions based on select student records related principally to the calculation of the amount of Title IV program funds returned after student withdrawals and the process for confirming student eligibility prior to disbursement of Title IV program funds. While the OIG recommended follow-up action with regard to some schools, University of Phoenix was not among them. The Department has indicated that OIG’s recommendations could form the basis for additional Department guidance or rulemaking.
Any of the penalties, funding delays, injunctions, restrictions, lawsuits or other forms of censure listed above could have a material adverse effect on our business and financial condition. If we lose our Title IV program eligibility, we would experience a dramatic decline in revenue and we would be unable to continue our business as it currently is conducted.
If we fail to maintain our institutional accreditation, we could lose our ability to participate in Title IV programs, which would materially and adversely affect our business.
In July 2013, the accreditation of University of Phoenix was reaffirmed by the HLC through the 2022-2023 academic year. At the same time, HLC placed the University on Notice status for a two-year period due to concerns regarding governance, student assessment and faculty scholarship/research for doctoral programs. Notice status is a sanction that means that HLC has determined that an institution is on a course of action that, if continued, could lead the institution to be out of compliance with one or more of the HLC Criteria for Accreditation or Core Components. The University was assigned by HLC to the Standard Pathway reaffirmation process, pursuant to which the University will host a comprehensive evaluation visit in 2016-2017 and will undergo its next reaffirmation visit and process in 2022-2023.
24
The University is required to submit a Notice Report to the HLC by the end of calendar year 2014 providing evidence that the University meets the Criteria for Accreditation, Core Components and Minimum Expectations (Assumed Practices after January 1, 2013) identified as the basis for the Notice sanction and that it has ameliorated the issues that led to the Notice sanction. In addition, in the Notice Report the University is also required to report on its progress in other areas of concern not included in the Notice sanction, including retention and graduation rates, three-year student loan cohort default rates, and credit hour policies and practices relating to learning teams. The University also will be required to host a focused visit by HLC in January 2015, to validate the contents of the Notice Report. The HLC Board of Trustees will review the University’s Notice Report, together with a report of the focused visit, at a meeting in 2015. During the Notice period, the University is required to disclose its Notice status in connection with any statements regarding its HLC accreditation.
We believe that the imposition of the sanction of notice has adversely impacted the reputation of University of Phoenix and may have contributed to the University’s continuing decline in enrollment. If, after the Notice period, HLC determines that University of Phoenix is not in compliance with one or more of HLC’s Criteria for Accreditation, HLC may elect to impose probation, which would have further, more significant consequences for the University and our business. In addition, the changes made by University of Phoenix to its corporate governance and administrative structure have increased our operating costs and could decrease our managerial flexibility to address the rapidly evolving and challenging postsecondary education market.
Continued institutional accreditation is critical to University of Phoenix’s business. If the University should lose its institutional accreditation, our business would be substantially impaired and we would not be able to continue our business as it is presently conducted.
The U.S. Department of Education gainful employment regulations may limit the programs we can offer students and increase our cost of operations.
Under the Higher Education Act, as reauthorized, proprietary schools are generally eligible to participate in Title IV programs only in respect of educational programs that lead to “gainful employment in a recognized occupation.”
In connection with this requirement, proprietary postsecondary institutions are required to disclose to prospective students each eligible program’s recognized occupations, cost, completion rate, job placement rate, and median loan debt of program completers. These reporting requirements increase our costs of operations and could adversely impact student enrollment, persistence and retention if our reported program information compares unfavorably with other reporting educational institutions.
A Notice of Proposed Rulemaking was issued by the U.S. Department of Education in March 2014 specifically on the topic of gainful employment. Under the proposed rule, if the students who complete a program have high debt-to-earnings ratios or students who complete or withdraw have high program-level cohort default rates, the program would lose its Title IV eligibility for three years. In general, the proposed debt-to-earnings metric requires that students who complete a program must not, on average, spend more than 8% of their annual income, or 20% of their discretionary income, on their student loan payments. The proposed program cohort default metric requires that the student loan default rate for students who completed or withdrew from a particular program during a given year may not exceed 30% measured during the three years after entering repayment. Under the proposed rule, programs would also be obligated to meet necessary programmatic accreditation requirements as well as applicable state licensure standards for any state in the institution’s regional area. Institutions would be required to attest that their programs meet these requirements as part of the program participation agreement with the Department.
The precise timing and substance of final regulations dealing with gainful employment cannot be predicted at this time. If final rules regarding gainful employment metrics are published by the Department by November 1, 2014, the regulations could be effective as soon as July 1, 2015.
Under the proposed gainful employment regulations, the continuing eligibility of our educational programs for Title IV program funding would be at risk due to factors beyond our control, such as changes in the actual or deemed income level of our graduates, changes in student borrowing levels, increases in interest rates, changes in the federal poverty income level relevant for calculating discretionary income, changes in the percentage of our former students who are current in repayment of their student loans, and other factors. The exposure to these external factors could reduce our ability to confidently offer or continue certain types of programs for which there is market demand, and therefore would impact our ability to maintain or grow our business.
University of Phoenix’s certification to participate in Title IV programs expired in December 2012 and continues on a month-to-month basis. If University of Phoenix is not recertified to participate in Title IV programs by the U.S. Department of Education, University of Phoenix would not be eligible to participate in Title IV programs and we could not conduct our business as it is currently conducted.
University of Phoenix and Western International University are certified by the U.S. Department of Education to participate in Title IV programs. University of Phoenix was recertified in November 2009 and its current certification expired in December
25
2012. University of Phoenix has submitted necessary documentation for re-certification and its eligibility continues on a month-to-month basis until the Department issues its decision on the application. We have no reason to believe that the University’s application will not be renewed in due course, and it is not unusual to be continued on a month-to-month basis until the Department completes its review. We cannot predict whether, or to what extent, the imposition of Notice status on University of Phoenix by The Higher Learning Commission might have on this process.
Western International University was recertified in May 2010 and its current certification expired on September 30, 2014. Western International University has submitted necessary documentation for re-certification and its eligibility continues on a month-to-month basis until the Department issues its decision on the application.
Generally, the recertification process includes a review by the Department of the institution’s educational programs and locations, administrative capability, financial responsibility, and other oversight categories. The Department could limit, suspend or terminate an institution’s participation in Title IV programs for violations of the Higher Education Act, as reauthorized, or Title IV program regulations.
Continued Title IV program eligibility is critical to the operation of our business. If University of Phoenix becomes ineligible to participate in Title IV programs, we could not conduct our business as it is currently conducted and it would have a material adverse effect on our business and financial condition.
Action by the U.S. Congress to revise the laws governing federal student financial aid programs or reduce funding for these programs, including changes applicable only to proprietary educational institutions, could reduce our enrollment and increase our costs of operation.
The U.S. Congress must periodically reauthorize the Higher Education Act and annually determine the funding level for each Title IV program. In 2008, the Higher Education Act was reauthorized through September 30, 2013 by the Higher Education Opportunity Act and an automatic one year extension continued the authorization through September 30, 2014. Congress continues to engage in Higher Education Act reauthorization hearings and although the one year automatic extension has expired, Title IV programs remain authorized and functioning. Changes to the Higher Education Act, including changes in eligibility and funding for Title IV programs, are likely to occur in connection with the next reauthorization, but we cannot predict the scope or substance of any such changes.
The Pell Grant program is one of the largest non-defense discretionary spending programs in the federal budget. Because of this, it is a target for reduction as Congress addresses the unprecedented U.S. budget deficits. A reduction in the maximum annual Pell Grant amount or changes in eligibility could result in increased student borrowing, which would make more difficult our ability to comply with other important regulatory requirements, such as the student loan cohort default rate regulations, which are discussed below, and could negatively impact enrollment.
In addition to Congress’s focus on the federal government’s funding challenges, in recent years, there has been increased focus by members of the U.S. Congress and federal agencies such as the Consumer Financial Protection Bureau and the Federal Trade Commission on the role that proprietary educational institutions play in higher education. We expect this focus to increase, particularly during the time leading up to the 2014 mid-term elections. Congressional hearings and roundtable discussions have been held regarding various aspects of the education industry, and reports have been issued that are highly critical of proprietary institutions and include a number of recommendations to be considered by Congress in connection with the upcoming reauthorization of the federal Higher Education Act as discussed above. In addition, Title IV program funding is a potential target for reduction as Congress seeks to reduce the U.S. budget deficit. Because a substantial portion of our revenue is derived from Title IV programs, any action by Congress that reduces Title IV program funding, whether through across-the-board funding reductions, sequestration or otherwise, or alters the eligibility of our institutions or students to participate in Title IV programs could have a material adverse effect on our enrollment and financial condition. Action by Congress or federal agencies could also require us to modify our practices in ways that increase our administrative costs and reduce our operating income.
In addition to possible reductions in Title IV program funding, certain military financial aid may be reduced as military branches address decreased funding. Reductions and/or changes in military financial aid could result in increased student borrowing, decreased enrollment and adverse impacts on our 90/10 Rule percentage, as discussed below.
If Congress reduced the eligibility or amount of available Title IV program funding, we would attempt to arrange for alternative sources of financial aid for our students, which may include lending funds directly to our students, but private sources would not be able to provide as much funding to our students or on terms comparable to Title IV programs. In addition, private funding sources could require us to guarantee all or part of this assistance and we might incur other additional costs. For these reasons, private, alternative sources of student financial aid would only partly offset, if at all, the impact on our business of reduced Title IV program eligibility or funding, and would not be a practical alternative in the case of a significant reduction in Title IV program eligibility or funding.
26
Our schools and programs would lose their eligibility to participate in federal student financial aid programs if the percentage of revenue derived from those programs is too high, in which event we could not conduct our business as it is currently conducted.
University of Phoenix and Western International University, and all other proprietary institutions of higher education, are subject to the so-called “90/10 Rule” under the Higher Education Act, as reauthorized. Under this rule, a proprietary institution will be ineligible to participate in Title IV programs for at least two fiscal years if for any two consecutive fiscal years it derives more than 90% of its cash basis revenue, as defined in the rule, from Title IV programs. If an institution is determined to be ineligible, any disbursements of Title IV program funds made after the end of the second fiscal year in the measuring period must be repaid to the U.S. Department of Education. An institution that derives more than 90% of its cash basis revenue from Title IV programs for any single fiscal year will be automatically placed on provisional certification for two fiscal years and will be subject to possible additional sanctions determined to be appropriate under the circumstances by the Department. While the Department has broad discretion to impose additional sanctions on such an institution, there is only limited precedent available to predict what those sanctions might be, particularly in the current regulatory environment. For example, the Department could impose conditions in the provisional certification such as:
• | Restrictions on the total amount of Title IV program funds that may be disbursed to students; |
• | Restrictions on programmatic and geographic expansion; |
• | Requirements to obtain and post letters of credit; |
• | Additional reporting requirements such as interim financial reporting; or |
• | Any other conditions deemed appropriate by the Department. |
The 90/10 Rule percentages for University of Phoenix and Western International University were as follows for the respective periods:
Year Ended August 31, | |||||
2014 | 2013 | 2012 | |||
University of Phoenix | 81% | 83% | 84% | ||
Western International University | 62% | 66% | 68% | ||
See the discussion of the 90/10 Rule in Item 1, Business, Regulatory Environment, above.
Any necessary further efforts to reduce the 90/10 Rule percentage for University of Phoenix, especially if the percentage exceeds 90% for a fiscal year, may involve taking measures which reduce our revenue, increase our operating expenses, or both, in each case perhaps significantly. In addition, we may be required to make structural changes to our business in the future in order to remain in compliance, which changes may materially alter the manner in which we conduct our business and materially and adversely impact our business and financial condition. Furthermore, these required changes could make it more difficult to comply with other important regulatory requirements, such as the student loan cohort default rate regulations, which are discussed below.
An increase in student loan default rates could result in the loss of eligibility to participate in Title IV programs, which would materially and adversely affect our business.
To remain eligible to participate in Title IV programs, an educational institution’s student loan cohort default rates must remain below certain specified levels. Each cohort is the group of students who first enter into student loan repayment during a federal fiscal year (ending September 30).
An educational institution loses eligibility to participate in Title IV programs if its three-year cohort default rate equals or exceeds 40% for any given year or 30% for three consecutive years. If an institution’s three-year cohort default rate equals or exceeds 30% for any given year, it must establish a default prevention task force and develop a default prevention plan with measurable objectives for improving the cohort default rate.
27
Based on information published by the U.S. Department of Education, the three-year cohort default rates for University of Phoenix, Western International University and for all proprietary postsecondary institutions for the applicable federal fiscal years were as follows:
Three-Year Cohort Default Rates for Cohort Years Ended September 30, | ||||||
2011 | 2010 | 2009 | ||||
University of Phoenix | 19.0% | 26.0% | 26.4% | |||
Western International University | 12.0% | 10.8% | 13.7% | |||
All proprietary postsecondary institutions | 19.1% | 21.8% | 22.7% | |||
See the discussion of cohort default rates in Item 1, Business, Regulatory Environment, above.
If our student loan default rates approach the applicable limits, we may be required to increase efforts and resources dedicated to improving these default rates. This is challenging because most borrowers who are in default or at risk of default are no longer students, and we may have only limited contact with them. Furthermore, recently there has been increased attention by members of Congress and others on default aversion activities of proprietary education institutions. If such attention leads to congressional or regulatory action restricting the types of default aversion assistance that educational institutions are permitted to provide, the default rates of our former students may be negatively impacted. Such attention could also lead to Congressional proposals to increase the measuring period, which could negatively impact our default rates. Accordingly, there is no assurance that we would be able to effectively improve our default rates or improve them in a timely manner to meet the requirements for continued participation in Title IV programs if we experience a substantial increase in our student loan default rates.
If we fail to maintain any of our state authorizations, we would lose our ability to operate in that state and to participate in Title IV programs there.
Institutions that participate in Title IV programs must be authorized to operate by the appropriate postsecondary regulatory authority in each state where the institution has a physical presence. Prior to July 1, 2011, such authorization was not specifically required for the institution’s students to become eligible for Title IV programs. Under the program integrity rules adopted by the Department effective July 1, 2011, institutions are required to obtain specific regulatory approval to operate in such states. University of Phoenix is specifically authorized to operate in all of the domestic jurisdictions in which it operates.
If our institutional accrediting body loses recognition by the U.S. Department of Education, we could lose our ability to participate in Title IV programs, which would materially and adversely affect our business.
University of Phoenix and Western International University are institutionally accredited by The Higher Learning Commission (“HLC”) of the North Central Association of Colleges and Schools, one of the six regional accrediting agencies recognized by the U.S. Department of Education. Refer above for discussion of Notice status. Accreditation by an accrediting agency recognized by the Department is required in order for an institution to become and remain eligible to participate in Title IV programs.
If the Department ceased to recognize HLC for any reason, University of Phoenix and Western International University would not be eligible to participate in Title IV programs beginning 18 months after the date such recognition ceased unless HLC was again recognized or our institutions were accredited by another accrediting body recognized by the Department. In June 2013, the National Advisory Committee on Institutional Quality and Integrity, a Committee that advises the Secretary of Education on matters related to postsecondary accreditation and eligibility, recommended to the Secretary that HLC have continuing recognition as an eligible accreditor with certain conditions and required reports.
In the event of a loss of recognition of HLC by the Department, it would, among other things, render our schools and programs ineligible to participate in Title IV programs, affect our authorization to operate and to grant degrees in certain states and decrease student demand. If University of Phoenix became ineligible to participate in Title IV programs, we could not conduct our business as it is currently conducted and it would have a material adverse effect on our business and financial condition.
28
A failure to demonstrate “administrative capability” or “financial responsibility” may result in the loss of eligibility to participate in Title IV programs and limit our access to liquidity, which would materially and adversely affect our business.
The U.S. Department of Education regulations specify extensive criteria an institution must satisfy to establish that it has the requisite administrative capability to participate in Title IV programs. The failure of an institution to satisfy any of the criteria used to assess administrative capability may cause the Department to determine that the institution lacks administrative capability and, therefore, subject the institution to additional scrutiny or deny eligibility for Title IV programs. These criteria require, among other things, that the institution:
• | Comply with all applicable Title IV program regulations; |
• | Have capable and sufficient personnel to administer the Title IV programs; |
• | Have acceptable methods of defining and measuring the satisfactory academic progress of its students; |
• | Not have student loan cohort default rates above specified levels; |
• | Have procedures in place for safeguarding federal funds; |
• | Not be, and not have any principal or affiliate who is, debarred or suspended from federal contracting or engaging in activity that is cause for debarment or suspension; |
• | Provide financial aid counseling to its students; |
• | Refer to the Office of Inspector General any credible information indicating that any applicant, student, employee or agent of the institution has been engaged in any fraud or other illegal conduct involving Title IV programs; |
• | Submit in a timely manner all reports and financial statements required by the regulations; and |
• | Not otherwise appear to lack administrative capability. |
Furthermore, to participate in Title IV programs, an eligible institution must satisfy specific measures of financial responsibility prescribed by the Department, or post a letter of credit in favor of the Department and possibly accept other conditions on its participation in Title IV programs. Pursuant to the Title IV program regulations, each eligible higher education institution must satisfy a measure of financial responsibility that is based on a weighted average of the following three annual ratios which assess the financial condition of the institution:
• | Primary Reserve Ratio - measure of an institution’s financial viability and liquidity; |
• | Equity Ratio - measure of an institution’s capital resources and its ability to borrow; and |
• | Net Income Ratio - measure of an institution’s profitability. |
These ratios provide three individual scores which are converted into a single composite score. The maximum composite score is 3.0. If the institution achieves a composite score of at least 1.5, it is considered financially responsible. A composite score from 1.0 to 1.4 is also considered financially responsible, and the institution may continue to participate as a financially responsible institution for up to three years, subject to additional monitoring and other consequences. If an institution does not achieve a composite score of at least 1.0, it can be transferred from the “advance” system of payment of Title IV program funds to cash monitoring status or to the “reimbursement” system of payment, under which the institution must disburse its own funds to students and document the students’ eligibility for Title IV program funds before receiving such funds from the U.S. Department of Education.
The fiscal year 2014 composite scores for Apollo Education Group, University of Phoenix and Western International University were as follows:
Fiscal Year 2014 Composite Score | |
Apollo Education Group | 2.5 |
University of Phoenix | 2.3 |
Western International University | 1.8 |
In addition, our principal revolving credit facility requires that we maintain a composite score of at least 1.5. If our composite score falls below 1.5, it would be an event of default under the facility and the outstanding balance could be declared immediately due and payable. If in connection with a composite score below 1.5 the Department of Education required that we post a letter of credit, our revolving credit facility would not be available for that purpose and there is no assurance that other sources would be available on terms acceptable to us or at all.
If our composite scores approach 1.5 in the future, which could result from acquisitions, declines in our institutions’ profitability or other factors, we may be limited in our ability to deploy capital to effect one or more desirable transactions or initiatives due to the impact on our composite scores, or we may be required to seek additional capital through the issuance of
29
equity or equity-linked securities, which would be dilutive to our existing shareholders. There is no assurance that such equity or equity-linked capital would be available on terms acceptable to us or at all.
If we, or our schools eligible to participate in Title IV programs fail to maintain administrative capability or financial responsibility, as defined by the Department, our schools could lose their eligibility to participate in Title IV programs or have that eligibility adversely conditioned, which would have a material adverse effect on our business. Limitations on, or termination of, participation in Title IV programs as a result of the failure to demonstrate administrative capability or financial responsibility would limit students’ access to Title IV program funds, which could significantly reduce the enrollments and revenues of our schools eligible to participate in Title IV programs and materially and adversely affect our business and financial condition.
If IPD’s client institutions are sanctioned due to non-compliance with Title IV program requirements, our business could be responsible for any resulting fines and penalties.
Our former subsidiary, Institute for Professional Development, Inc. (“IPD”) provided to its client institutions numerous consulting and administrative services, including services that involve the handling and receipt of Title IV program funds. As a result of this, IPD may be jointly and severally liable for any fines or penalties imposed by the U.S. Department of Education on the client institution for violation of applicable Title IV program regulations, regardless of the degree of fault, if any, on IPD’s part. Subject to various limitations, we agreed to indemnify the buyer of IPD for any such liability, which could have a material adverse impact on our financial condition.
Non-U.S. Operations
Our non-U.S. operations are subject to risks not inherent in our U.S. operations, which could adversely affect our business.
We operate physical and online educational institutions in the United Kingdom, Australia, Mexico, Chile, South Africa and elsewhere, and we are actively seeking further expansion in other countries, including India, where we offer educational programs through a joint venture. Our operations in each of the relevant foreign jurisdictions are subject to regulatory requirements relating to education providers, as well as foreign businesses. Many foreign countries have not fully embraced the proprietary education model, and in other countries, proprietary education remains controversial. As a result, our foreign operations are subject to the political risk that existing regulations will be interpreted unfavorably or new regulations will be adopted that render our business model impractical. In addition, our non-U.S. operations are subject to the U.S. Foreign Corrupt Practices Act and the U.K. Bribery Act which require extensive compliance vigilance on our part and, in some cases, puts our foreign operations at a competitive disadvantage with local companies. If one or more of our foreign operations ceases to be economically practical, we may be forced to discontinue such operations or seek a buyer, either of which might result in a substantial loss of value to Apollo Education Group.
Risks Related to Our Business
We face intense and increasing competition in the postsecondary education market from both public and private educational institutions, which could adversely affect our business.
Postsecondary education in our existing and new market areas is highly competitive and is becoming increasingly so as the industry is undergoing profound change at an unprecedented rate. We compete primarily with traditional public and private two-year and four-year degree-granting regionally accredited colleges and universities, other proprietary degree-granting regionally accredited schools and alternatives to higher education. In addition, we face increasing competition from various emerging non-traditional, credit-bearing and noncredit-bearing education programs, offered by both proprietary and not-for-profit providers. Some of our competitors have greater financial and nonfinancial resources than we have and are able to offer programs similar to ours at a lower tuition level for a variety of reasons, including the availability of direct and indirect government subsidies, government and foundation grants, large endowments, tax-deductible contributions and other financial resources not available to proprietary institutions, or by providing fewer student services or larger class sizes. For example, a typical community college is subsidized by local or state government and, as a result, tuition rates for associate’s degree programs are much lower at community colleges than at University of Phoenix. Also, like University of Phoenix, other proprietary educational institutions have begun to deploy pricing incentives to impact demand. We believe that price competition through targeted programs involving student scholarships and otherwise will increase throughout the industry in the future. We have implemented scholarships and discounts which reduce the amount of tuition we receive, and further downward pressure on our tuition rates may cause us to implement further pricing incentives, which will adversely affect our revenue.
In addition, an increasing number of traditional four-year and community colleges are offering distance learning and other online education programs, including programs that are geared towards the needs of working learners. This trend has been accelerated by private companies that provide and/or manage online learning platforms for traditional four-year colleges and community colleges. As the proportion of traditional colleges providing alternative learning modalities increases, we continue to face increasing competition from traditional colleges, including those with well-established reputations. Already, this type of
30
competition is significant. As the online and distance learning segment of the postsecondary education market matures, we believe that the intensity of the competition we face will continue to increase.
Furthermore, the total postsecondary student population has recently declined, with the proprietary share disproportionately affected. Enrollment in Title IV program eligible postsecondary degree-granting institutions in spring 2014 decreased 1%, compared to spring 2013, with the largest decrease of 5% taking place among four-year proprietary institutions. Although the U.S. Department of Education projects that enrollment in degree-granting, postsecondary institutions will grow 13% over the ten-year period ending in the fall of 2021 to approximately 23.8 million students, this projected growth compares with a 33.7% increase reported in the prior ten-year period ended in 2011, when enrollment increased from 15.9 million students in 2001 to approximately 21.3 million students in 2011.
The combination of flat or declining postsecondary student population and increased capacity in the postsecondary education sector will further intensify competition.
This intense competition makes it more challenging for us to enroll students who are likely to succeed in our educational programs, which has contributed to the decline in recent years in our enrollment levels and put further downward pressure on our tuition rates. If we are not successful in adapting our business to meet these competitive challenges, our enrollment may continue to decline, which could materially and adversely affect our business and financial condition.
Changes we are making to our business to improve the student experience and more cost-effectively deliver services to our students may adversely affect our enrollment and operating results.
We continue to evaluate and make changes across a broad spectrum of our business and systems to improve the student experience and more cost-effectively deliver services to our students. In furtherance of this, we are implementing several important initiatives, including the following:
• | Emphasizing the distinctiveness of University of Phoenix’s eight colleges to more effectively address the specific needs of the students and employers they serve; |
• | Rationalizing campus locations and streamlining, automating where appropriate, and enhancing our administrative and student facing services; |
• | Modifying course structure and sequencing; |
• | Leveraging research and technology provided by the acquisition of Carnegie Learning; |
• | Implementing a new online classroom designed to provide more personalized learning to students, improve the overall student experience, and lead to better educational outcomes; |
• | Implementing a new student relationship and communications management platform designed to streamline student support services and assist students who have limited or no higher education experience or otherwise may be unprepared to succeed in University of Phoenix’s academic programs; and |
• | Reengineering and simplifying processes to improve the student experience and efficiency of our employees. |
These initiatives require significant time, energy and resources, and involve many significant interrelated and simultaneous changes in our processes and programs. We may not succeed in achieving our objectives of improving our services to students and reducing the cost of delivering services, due to organizational, operational, regulatory or other constraints. If our efforts are not successful, we may experience reduced enrollment, increased expense or other impacts on our business that materially and adversely impact our financial condition.
Our financial performance depends on our ability to continue to develop awareness among, and enroll and retain students; adverse publicity may negatively impact demand for our programs.
Building awareness of our schools and the programs we offer is critical to our ability to attract prospective students. We expend significant resources on marketing. If our schools are unable to successfully market and advertise their educational programs, our schools’ ability to attract and enroll prospective students in such programs could be adversely affected. It is also critical to our success that we convert these prospective students to enrolled students in a cost-effective manner and that these enrolled students remain active in our programs.
The proprietary postsecondary education sector is under regulatory and other scrutiny which has led to media attention that has portrayed the sector in an unflattering light. This negative media attention may cause some prospective students to choose educational alternatives outside of the proprietary sector or may cause them to choose proprietary alternatives other than University of Phoenix, either of which could negatively impact our new enrollments.
31
Some of the additional factors that could prevent us from successfully enrolling and retaining students in our programs include:
• | Increased competition from schools offering distance learning and other online educational programs; |
• | A decrease in the perceived or actual economic benefits that students derive from our programs or education in general; |
• | A decrease in or perceived low student pass rates for professional licenses and other examinations necessary for students to work in their chosen field; |
• | Regulatory investigations that may damage our reputation; |
• | Increased regulation of online education, including in states in which we do not have a physical presence; |
• | Litigation that may damage our reputation; |
• | Inability to continue to recruit, train and retain quality faculty; |
• | Student or employer dissatisfaction with the quality of our services and programs; |
• | Student financial, personal or family constraints; |
• | Tuition rate reductions by competitors that we are unwilling or unable to match; |
• | A decline in the acceptance of online education; |
• | Unavailability of ground locations where students want to attend; and |
• | Disruptions to our information technology systems. |
If one or more of these factors reduces demand for our programs, our enrollment could be negatively affected or our costs associated with each new enrollment could increase, or both, either of which could have a material adverse impact on our business and financial condition.
Our financial performance depends, in part, on our ability to keep pace with changing education market needs and technology; if we fail to keep pace or fail in implementing or adapting to new educational offerings and technologies, our business may be adversely affected.
Increasingly, employers demand that their new employees possess appropriate technological skills and also appropriate “soft” skills, such as communication, critical thinking and teamwork. The nature of the skills required can evolve rapidly in today’s changing economic and technological environment. Accordingly, it is important for our schools’ educational programs to evolve in response to economic and technological changes. The expansion of existing programs and the development of new programs may not be accepted by current or prospective students or the employers of our graduates. Even if our schools are able to develop acceptable new programs, our schools may not be able to begin offering those new programs as quickly as required by prospective employers or as quickly as our competitors offer similar programs. In addition, we may be unable to obtain specialized accreditations or licensures that may make certain programs desirable to students. To offer a new academic program, we may be required to obtain federal, state and accrediting agency approvals, which may be conditioned or delayed in a manner that could significantly affect our growth plans. In addition, to be eligible for Title IV programs, a new academic program may need to be certified by the U.S. Department of Education. If we are unable to adequately respond to changes in market requirements due to regulatory or financial constraints, unusually rapid technological changes, or other factors, our ability to attract and retain students could be impaired, the rates at which our graduates obtain jobs involving their fields of study could suffer, and our business and financial condition could be adversely affected.
Establishing new academic programs or modifying existing programs requires us to make investments, incur marketing expenses and reallocate other resources. We may have limited experience with the courses in new areas and may need to modify our systems and strategy or enter into arrangements with other educational institutions to provide new programs effectively and profitably. If we are unable to increase the number of students or offer new programs in a cost-effective manner, or are otherwise unable to manage effectively the operations of newly established academic programs, our business, financial condition and results of operations could be adversely affected.
If we do not maintain existing, and develop additional, relationships with employers, our future growth may be impaired.
We currently have relationships with large employers to provide their employees with the opportunity to obtain degrees through us while continuing their employment. These relationships are an important part of our strategy as they provide us with potential working learners for particular programs and also serve to increase our reputation among high-profile employers. In addition, programs in which employers directly pay tuition have a beneficial impact on our 90/10 Rule percentage calculation by reducing the proportion of our cash basis revenues attributable to Title IV program funds. If we are unable to develop new relationships or further develop our existing relationships, if our existing relationships deteriorate or end, or if we are unable to offer programs that teach skills demanded by employers, our efforts to seek these sources of potential working learners may be impaired, and this could materially and adversely affect our business and financial condition and our compliance with applicable regulations.
32
Our acquisitions may not be successful and may result in additional debt or dilution to our shareholders, which could adversely affect our business.
As part of our growth strategy, we are actively considering acquisition opportunities worldwide. We have acquired and expect to acquire additional proprietary educational institutions that complement our strategic direction, some of which could be material. Any acquisition involves significant risks and uncertainties, including:
• | Inability to successfully integrate the acquired operations, including the information technology systems, into our institutions and maintain uniform standards, controls, policies and procedures; |
• | Inability to successfully operate and grow the acquired businesses; |
• | Distraction of management’s attention from normal business operations; |
• | Challenges retaining the key employees of the acquired operation; |
• | Operating, market or other challenges causing operating results to be less than projected; |
• | Expenses associated with the acquisition; |
• | Noncontrolling shareholder options that could require us to purchase shares in certain of our businesses that we do not wholly-own; |
• | Challenges relating to conforming non-compliant financial reporting procedures to those required of a subsidiary of a U.S. reporting company, including procedures required by the Sarbanes-Oxley Act; and |
• | Unidentified issues not discovered in our due diligence process, including commitments and/or contingencies. |
Acquisitions are inherently risky. We have experienced many challenges in connection with our previous acquisitions and cannot be certain that any future acquisitions will be successful and will not materially adversely affect our business and financial condition. We may not be able to identify suitable acquisition opportunities, acquire institutions on favorable terms, or successfully integrate or profitably operate acquired institutions. Future transactions may involve use of our cash resources, issuance of equity or debt securities, incurrence of other forms of debt or a significant increase in our financial leverage, which could adversely affect our business and financial condition, especially if the cash flows associated with any acquisition are not sufficient to cover the additional debt service and could negatively impact our compliance with the U.S. Department of Education composite score measure of financial responsibility. If we issue equity securities as consideration in an acquisition, current shareholders’ percentage ownership and earnings per share may be diluted. In addition, our acquisition of an educational institution could be considered a change in ownership and control of the acquired institution under applicable regulatory standards. For such an acquisition in the U.S., we may need approval from the U.S. Department of Education and applicable state agencies and accrediting agencies and possibly other regulatory bodies. Our inability to obtain such approvals with respect to a completed acquisition could have a material adverse effect on our business and financial condition.
33
Our expansion into new markets outside the U.S. subjects us to risks inherent in international operations.
As part of our growth strategy, we have acquired schools and universities outside the U.S. and we intend to actively pursue further acquisitions. To the extent that we make such acquisitions, we will face risks that are inherent in international operations, including:
• | Complexity of operations across borders; |
• | Compliance with foreign regulatory environments, including laws and regulations hindering proprietary education enterprises; |
• | Changes in existing laws to prohibit or restrict proprietary education, whether arising from public discontent or otherwise; |
• | Currency exchange rate fluctuations and/or price controls or restrictions on exchange of foreign currencies; |
• | Monetary policy risks, such as inflation, hyperinflation and deflation; |
• | Potential political and economic instability in the countries in which we operate; |
• | Expropriation of assets by local governments; |
• | Multiple and possibly overlapping and conflicting tax laws; |
• | Compliance with anti-corruption regulations such as the U.S. Foreign Corrupt Practices Act and the U.K. Bribery Act of 2010; |
• | Potential unionization of employees under local labor laws and local labor laws that make it more expensive and complex to negotiate with, retain or terminate employees; |
• | Greater difficulty in utilizing and enforcing any acquired intellectual property and contract rights; |
• | Investment and execution missteps due to a failure to understand the local culture and market; |
• | Limitations on the repatriation of funds; and |
• | Increased risk of acts of terrorism and war, epidemics and natural disasters. |
Any one or more of these risks could negatively impact our non-U.S. operations and materially and adversely impact our business and financial condition.
System disruptions to our computer networks or phone systems could have a material adverse effect on our business.
The performance and reliability of our computer network and phone systems infrastructure at our schools, including our online programs, is critical to our operations, reputation and ability to attract and retain students. From time to time we experience intermittent outages of the information technology systems used by our students and by our employees, including system-wide outages. Any computer system error or failure, regardless of cause, could result in a substantial outage that materially disrupts our online and ground operations. Not all of our critical systems are protected by a validated formal disaster recovery plan and redundant disaster recovery infrastructure at a geographically remote data center. We are continuing execution of our plan to implement disaster recovery infrastructure for our remaining critical systems to allow timely recovery from catastrophic failure. For those systems not yet protected, a catastrophic failure or unavailability for any reason of our principal data center may require us to replicate the function of this data center at our existing remote data facility or elsewhere, and could result in the loss of data. An event such as this may require service restoration activities that could take up to several weeks to complete.
We have upgraded or are in the process of upgrading a substantial portion of our key IT systems, including our online student classroom, student relationship and communications management platform, and corporate applications, and retiring the related legacy systems. Although these new systems are expected to improve the productivity, scalability, reliability and sustainability of our IT infrastructure, the transition from the legacy systems entails risk of unanticipated disruption or failure to fully replicate all necessary data processing and reporting functions, including in our core business functions.
Any disruption in our IT systems, including any disruptions and system malfunctions that may arise from our upgrade initiative, could significantly impact our operations, reduce student and prospective student confidence in our educational institutions, adversely affect our compliance with applicable regulations and accrediting body standards and have a material adverse effect on our business and financial condition. Although we maintain insurance in respect of some types of these disruptions, there is no assurance that available insurance proceeds would be adequate to compensate us for damages sustained due to these disruptions.
34
Security threats to our computer systems, including breach of the personal information that we collect, could have a material adverse effect on our business.
We face an ever increasing number of threats to our computer systems, including unauthorized activity and access, malicious penetration, system viruses, malicious code and organized cyber-attacks, which could breach our security and disrupt our systems. These risks increase when we are making changes to our IT systems, such as our substantial IT systems upgrade initiative currently underway and our frequent updates to enable instructional innovation and address new student populations. Our size makes us a prominent target for hacking and other cyber attacks within the education industry. From time to time we experience security events and incidents, and these reflect an increasing level of malicious sophistication, organization and innovation. We have devoted and will continue to devote significant resources to the security of our computer systems, but they may still be vulnerable to these threats. A user who circumvents security measures could misappropriate proprietary information or cause interruptions or malfunctions in operations, perhaps over an extended period of time prior to detection. As a result, we may be required to expend significant additional resources to protect against the threat of or alleviate problems caused by these system disruptions and security breaches. Any of these events could have a material adverse effect on our business and financial condition. Although we maintain insurance in respect of these types of events, there is no assurance that available insurance proceeds would be adequate to compensate us for damages sustained due to these events.
In addition, possession and use of personal information in our operations subjects us to risks and costs that could harm our business. Our educational institutions collect, use and retain large amounts of personal information regarding our students and their families, including social security numbers, tax return information, personal and family financial data and credit card numbers. We also collect and maintain personal information of our employees in the ordinary course of our business. Some of this personal information is held and managed by certain of our vendors. Although we use security and business controls to limit access and use of personal information, a third-party may be able to circumvent those security and business controls, which could result in a breach of student or employee privacy. In addition, errors in the storage, use or transmission of personal information could result in a breach of student or employee privacy, and the increased availability and use of mobile data devices by our employees and students increases the risk of unintentional disclosure of personal information. Possession and use of personal information in our operations also subjects us to legislative and regulatory burdens that could require notification of data breaches and restrict our use of personal information. We cannot ensure that a breach, loss or theft of personal information will not occur. A breach, theft or loss of personal information regarding our students and their families or our employees that is held by us or our vendors could have a material adverse effect on our reputation and results of operations and result in liability under state and federal privacy statutes and legal actions by state attorneys, general and private litigants, and any of which could have a material adverse effect on our business and financial condition.
If we cannot attract qualified new personnel or retain our existing senior management team, our business could be adversely affected.
Our future performance depends on the continued services and continuing contributions of our senior management to execute on our business plan and to identify and pursue new opportunities. Our future success also depends in large part on our continued ability to attract and retain qualified personnel. The loss of the services of our senior management for any reason could adversely affect our business and results of operations.
In June 2014, a new President of University of Phoenix began serving, and in December 2013, a new Chief Operating Officer of Apollo began serving. Since early in fiscal year 2013, the Provost of University of Phoenix has been filled in an acting capacity. University of Phoenix is in the process of searching to fill this position. Competition for such personnel can be intense, and our ability to attract, select and hire new candidates may prove difficult, take more time than anticipated, and be costly. A lack of management continuity could also result in operational and administrative inefficiencies, make achievement of our strategic and management objectives more challenging and may make recruiting for future management positions more difficult. If we are unable to effectively manage our business through these management transitions our business and results of operation could be adversely affected.
To effectively educate our students, we must continue to attract and retain qualified faculty members.
Our educational institutions employ approximately 26,000 faculty members, a substantial majority of whom are adjunct, part-time faculty. In order to effectively educate our students, we must recruit and train a large number of faculty on an ongoing basis and keep our faculty engaged and focused on the mission of delivering quality education. If we cannot attract and retain sufficient qualified faculty members, or we fail to adequately train new faculty members, or our relations with faculty members deteriorate and lead to work stoppages or other disruptions, our ability to serve our students would be impaired and we may be required to reduce the scope or number of the classes available to our students, any of which could have a material adverse impact our business.
35
If we are unable to successfully conclude pending litigation and governmental inquiries, our business and financial condition could be adversely affected.
We, certain of our subsidiaries, and certain of our current and former directors and executive officers have been named as defendants in various lawsuits. Refer to Note 16, Commitments and Contingencies, in Part II, Item 8, Financial Statements and Supplementary Data, which is incorporated herein by reference, for further discussion of pending litigation and other proceedings. In addition, changes in our business and pending actions by regulators and accreditors may increase the risk of claims by our shareholders.
We cannot predict the ultimate outcome of these matters and expect to incur significant defense costs and other expenses in connection with them. Such costs and expenses could have a material adverse effect on our financial conditions and the market price of our common stock. We may be required to pay substantial damages or settlement costs in excess of our insurance coverage related to these matters, or may be required to pay substantial fines or penalties, any of which could have a further material adverse effect on our financial condition. An adverse outcome in any of these matters could also materially and adversely affect our licenses, accreditations and eligibility to participate in Title IV programs.
We rely on proprietary rights and intellectual property that may not be adequately protected under current laws, and we encounter disputes from time to time relating to our use of intellectual property.
Our success depends in part on our ability to protect our proprietary rights and intellectual property. We rely on a combination of copyrights, trademarks, trade secrets, patents, domain names and contractual agreements to protect our proprietary rights. For example, we rely on trademark protection in the U.S. and various foreign jurisdictions to protect our rights to various marks as well as distinctive logos and other marks associated with our services. We also rely on agreements under which we obtain intellectual property to own or license rights to use intellectual property developed by faculty members, content experts and other third-parties. We cannot assure that these measures are adequate, that we have secured, or will be able to secure, appropriate permissions or protections for all of the intellectual property rights we use or claim rights to in the U.S. or various foreign jurisdictions, or that third parties will not terminate our license rights or infringe upon or otherwise violate our intellectual property rights or the intellectual property rights of others. Despite our efforts to protect these rights, unauthorized third parties may attempt to use, duplicate or copy the proprietary aspects of our student recruitment and educational delivery methods and systems, curricula, online resource material or other content. Our management’s attention may be diverted by these attempts and we may need to use funds in litigation to protect our proprietary rights against any infringement or violation, which could have a material adverse affect on our business and financial condition.
We may become party to disputes from time to time over rights and obligations concerning intellectual property, and we may not prevail in these disputes. For example, third parties may allege that we have infringed upon or not obtained sufficient rights in the technologies used in our educational delivery systems, the content of our courses or other training materials or in our ownership or uses of other intellectual property claimed by that third-party. Some third-party intellectual property rights may prove to be extremely broad, and it may not be possible for us to conduct our operations in such a way as to avoid violating those intellectual property rights. Any such intellectual property claim could subject us to costly litigation and impose a significant strain on our financial resources and management personnel regardless of whether such claim has merit. Our various liability insurance coverages, if any, may not cover potential claims of this type adequately or at all, and we may be required to alter the design and operation of our systems or the content of our courses or pay monetary damages or license fees to third parties, which could have a material adverse affect on our business and financial condition. Refer to Note 16, Commitments and Contingencies, in Part II, Item 8, Financial Statements and Supplementary Data, for a description of prior patent litigation.
We may incur liability for the unauthorized duplication, distribution or other use of materials posted online.
In some instances, our employees, including faculty members, or our students may post various articles or other third-party content online in class discussion boards or in other venues including Facebook, PhoenixConnect, University of Phoenix’s proprietary social media network, and other social networks. The laws governing the fair use of these third-party materials are imprecise and adjudicated on a case-by-case basis, which makes it challenging to adopt and implement appropriately balanced institutional policies governing these practices. As a result, we could incur liability to third parties for the unauthorized duplication, distribution or other use of this material. Any such claims could subject us to costly litigation and impose a significant strain on our financial resources and management personnel regardless of whether the claims have merit. Our various liability insurance coverages, if any, may not cover potential claims of this type adequately or at all, and we may be required to alter or cease our uses of such material, which may include changing or removing content from our courses, or pay monetary damages, which could have a material adverse affect on our business and financial condition.
36
We may have unanticipated tax liabilities that could adversely impact our results of operations and financial condition.
We are subject to multiple types of taxes in the U.S., United Kingdom and various other foreign jurisdictions. The determination of our worldwide provision for income taxes and other tax accruals involves various judgments, and therefore the ultimate tax determination is subject to uncertainty. In addition, changes in tax laws, regulations, or rules may adversely affect our future reported financial results, may impact the way in which we conduct our business, or may increase the risk of audit by the Internal Revenue Service (“IRS”) or other tax authorities.
Our U.S. federal income tax return for fiscal year 2013 is currently open for review by the IRS, and we are participating in the IRS’s Compliance Assurance Process for fiscal years 2014 and 2015, which is a voluntary program in which taxpayers seek to resolve all or most issues with the IRS prior to or soon after filing their U.S. federal income tax returns. In addition, our state and foreign jurisdictions have various tax years as early as 2007 that remain subject to examination. Although we believe our tax accruals are reasonable, the final determination of tax returns under review or returns that may be reviewed in the future and any related litigation could result in tax liabilities that materially differ from our historical income tax provisions and accruals.
In addition, an increasing number of states are adopting new laws or changing their interpretation of existing laws regarding the apportionment of service revenues for corporate income tax purposes in a manner that could result in a larger proportion of our income being taxed by the states into which we sell services. These legislative and administrative changes could have a material adverse effect on our business and financial condition.
Risks Related to the Control Over Our Voting Stock
Our Class A common stock has no voting rights. The Apollo Class B Voting Stock Trust No. 1 holds approximately 51% of our voting stock and controls substantially all actions requiring the vote or consent of our shareholders, which may discourage or make impractical a takeover and may have an adverse effect on the trading price of our Class A common stock.
Approximately 51% of our outstanding Class B voting shares, our only class of voting stock, is held by the Apollo Class B Voting Stock Trust No. 1 (the “Class B Trust”), an irrevocable trust of which the current trustees are Peter V. Sperling, Chairman of our Board of Directors, Ms. Terri Bishop, the Vice Chair of our Board of Directors, and Ms. Darby Shupp, a member of our Board of Directors. Mr. Peter Sperling owns the remaining 49% of our outstanding Class B voting stock through a revocable grantor trust. Accordingly, the Class B Trust and Mr. Peter Sperling together control the election of all members of our Board of Directors and substantially all other actions requiring a vote of our shareholders, except in certain limited circumstances. Holders of our outstanding Class A common stock do not have the right to vote for the election of directors or for substantially any other action requiring a vote of shareholders. The trustees of the Class B Trust have the sole power to appoint successor and additional trustees.
The control of a majority of our voting stock by the Class B Trust makes it impossible for a third-party to acquire voting control of us without the approval of a majority of the trustees of the Class B Trust. There is no assurance that the Apollo Education Group Class B shareholders, or the trustees of the Class B Trust, will exercise their control of Apollo Education Group in the same manner that a majority of the outstanding Class A shareholders would if they were entitled to vote on actions currently reserved exclusively for our Class B shareholders.
We are a “Controlled Company” under the NASDAQ Listing Rules and therefore are exempt from certain corporate governance requirements, which could reduce the influence of independent directors on our management and strategic direction.
We are a “Controlled Company” as defined in Rule 5615(c)(1) of the NASDAQ Listing Rules, because more than 50% of the voting power of our outstanding stock is controlled by the Class B Trust. As a consequence, we are exempt from certain requirements of NASDAQ Listing Rule 5605, including that:
• | Our Board be composed of a majority of Independent Directors (as defined in NASDAQ Listing Rule 5605(a)(2)); |
• | The compensation of our officers be determined by a majority of the independent directors or a compensation committee composed solely of independent directors; and |
• | Nominations to the Board of Directors be made by a majority of the independent directors or a nominations committee composed solely of independent directors. |
However, NASDAQ Listing Rule 5605(b)(2) does require that our independent directors have regularly scheduled meetings at which only independent directors are present (“executive sessions”). In addition, Internal Revenue Code Section 162(m) requires that a compensation committee of outside directors (within the meaning of Section 162(m)) approve stock option grants to executive officers in order for us to be able to claim deductions for the compensation expense attributable to such stock options. Notwithstanding the foregoing exemptions, we do have a majority of independent directors on our Board of
37
Directors and we do have an Audit Committee, a Compensation Committee and a Nominating and Governance Committee composed entirely of independent directors.
The charters for the Compensation Committee, Audit Committee and Nominating and Governance Committee have been adopted by the Board of Directors and are available on our website, www.apollo.edu. These charters provide, among other items, that each member must be independent as such term is defined by the rules of the NASDAQ Stock Market LLC and the Securities and Exchange Commission.
If in the future our Board of Directors elects to rely on the exemptions permitted by the NASDAQ Listing Rules and reduce the number or proportion of independent directors on our Board and its key committees, the influence of independent directors on our management and strategy would be reduced and the influence of the holders of our Class B voting common stock on our management and strategy would increase.
If regulators do not approve or delay their approval of transactions involving a change of control of our company, our eligibility to participate in Title IV programs, our accreditation and our state licenses may be impaired in a manner that materially and adversely affects our business.
A change of ownership or control of Apollo Education Group, depending on the type of change, may have significant regulatory consequences for University of Phoenix. Such a change of ownership or control could require recertification by the U.S. Department of Education, the reevaluation of accreditation by The Higher Learning Commission and/or reauthorization by state licensing agencies. If we experience a change of ownership or control, then University of Phoenix may cease to be eligible to participate in Title IV programs until recertified by the Department. There is no assurance that such recertification would be obtained on a timely basis. Under some circumstances, the Department may continue an institution’s participation in Title IV programs on a provisional basis pending completion of the change in ownership approval process. The continuing participation of University of Phoenix in Title IV programs is critical to its business. Any disruption in its eligibility to participate in Title IV programs would materially and adversely impact our business and financial condition.
In addition, University of Phoenix would be required to report any material change in stock ownership to its principal institutional accrediting body, The Higher Learning Commission, and would be required to obtain approval prior to undergoing any transaction that affects, or may affect, its corporate control or governance. In the event of any such change, The Higher Learning Commission may undertake an evaluation of the effect of the change on the continuing operations of University of Phoenix for purposes of determining if continued accreditation is appropriate, which evaluation may include a comprehensive review. If the Commission determines that the change is such that prior approval by the Commission was required, but was not obtained, the Commission’s policies require it to consider withdrawal of accreditation. If accreditation by The Higher Learning Commission is suspended or withdrawn, University of Phoenix would not be eligible to participate in Title IV programs until the accreditation is reinstated by the Commission or is obtained from another appropriate accrediting body. There is no assurance that reinstatement of accreditation could be obtained on a timely basis, if at all, and accreditation from a different qualified accrediting authority, if available, would require a significant amount of time. Any material disruption in accreditation would materially and adversely impact our business and financial condition.
In addition, some states in which University of Phoenix is licensed require approval (in some cases, advance approval) of changes in ownership or control in order to remain authorized to operate in those states, and participation in grant programs in some states may be interrupted or otherwise affected by a change in ownership or control.
As discussed above, approximately 51% of our outstanding Class B voting stock, our only class of voting stock, is held by the Class B Trust, and Mr. Peter Sperling beneficially owns the remaining 49% of such shares. A future change in trustees of the Class B Trust, whether resulting from resignation, death, disability or otherwise, may be considered to be a change of control by the Department of Education, the Higher Learning Commission or other regulatory authorities, depending on the circumstances.
We cannot prevent a change of ownership or control that would arise from a transfer of voting stock by the Class B Trust or Mr. Peter Sperling, including a transfer that may occur or be deemed to occur upon the resignation, death or incompetency of one or more of the trustees of the Class B Trust.
Item 1B - Unresolved Staff Comments
None.
38
Item 2 - Properties
Our corporate headquarters are principally located in Phoenix, Arizona. As of August 31, 2014, we used 265 facilities representing 7.7 million square feet as follows:
Leased(4) | Owned | |||||||||||
Square Feet | # of Properties | Square Feet | # of Properties | |||||||||
University of Phoenix(1) | 5,371,970 | 178 | — | — | ||||||||
Apollo Global(2) | 512,731 | 47 | 547,626 | 15 | ||||||||
Other(3) | 1,227,747 | 24 | 3,108 | 1 | ||||||||
7,112,448 | 249 | 550,734 | 16 | |||||||||
(1) University of Phoenix has campus locations and learning centers throughout the U.S. and Puerto Rico.
(2) Apollo Global’s properties are principally located in the United Kingdom, Mexico, Chile, South Africa and Australia.
(3) The substantial majority of Other properties is office space located in the U.S.
(4) We are rationalizing certain of our real estate facilities and ground locations in connection with our restructuring activities. The properties in the above table include 1.9 million of square feet we are exiting as part of our restructuring activities for which we still have a remaining lease obligation as of August 31, 2014.
Our properties consist of both office and dual purpose space, which includes classroom and office facilities. Leases generally range from five to ten years with one to two renewal options for extended terms. We also lease space from time to time on a short-term basis in order to provide specific courses or programs. We evaluate current utilization of our educational facilities and projected enrollment to determine facility needs.
Item 3 - Legal Proceedings
We are subject to various claims and contingencies which are in the scope of ordinary and routine litigation incidental to our business, including those related to regulation, business transactions, employee-related matters and taxes, among others. While the outcomes of these matters are uncertain, management does not expect that the ultimate costs to resolve these matters will have a material adverse effect on our consolidated financial position, results of operations or cash flows.
A description of pending litigation, settlements, and other proceedings that fall outside the scope of ordinary and routine litigation incidental to our business is provided under Note 16, Commitments and Contingencies, in Item 8, Financial Statements and Supplementary Data, which is incorporated herein by reference.
Item 4 - Mine Safety Disclosures
Not applicable.
39
PART II
Item 5 - Market for Registrant’s Common Equity, Related Stockholder Matters and Issuer Purchases of Equity Securities
Market Information
Our Class A common stock trades on the NASDAQ Global Select Market under the symbol “APOL.” The holders of our Class A common stock are not entitled to any voting rights.
There is no established public trading market for our Class B common stock and all shares of our Class B common stock are beneficially owned by affiliates.
The following sets forth the high and low bid share prices for our Class A common stock as reported by the NASDAQ Global Select Market:
2014 | 2013 | ||||||||||||||
High | Low | High | Low | ||||||||||||
First Quarter | $ | 29.07 | $ | 18.50 | $ | 30.41 | $ | 18.36 | |||||||
Second Quarter | 35.92 | 24.18 | 22.48 | 16.80 | |||||||||||
Third Quarter | 35.23 | 26.05 | 21.91 | 15.98 | |||||||||||
Fourth Quarter | 32.10 | 26.29 | 22.91 | 16.89 | |||||||||||
Holders
As of August 31, 2014, there were 219 registered holders of record of our Class A common stock and four registered holders of record of our Class B common stock. A substantially greater number of holders of our Class A common stock are “street name” or beneficial holders, whose shares are held of record by banks, brokers and other financial institutions.
Dividends
Although we are permitted to pay dividends on our Class A and Class B common stock, we have never paid cash dividends on our common stock. Dividends are payable at the discretion of the Board of Directors, and the Articles of Incorporation treat the declaration of dividends on the Class A and Class B common stock in an identical manner as follows: holders of our Class A and Class B common stock are entitled to receive cash dividends, if and to the extent declared by the Board of Directors, payable to the holders of either class or both classes of common stock in equal or unequal per share amounts, at the discretion of the Board of Directors. We have no current plan to pay dividends in the near-term. The decision of our Board of Directors to pay future dividends will depend on general business conditions, the effect of a dividend payment on our financial condition and other factors the Board of Directors may consider relevant.
Sales of Unregistered Securities
None.
Securities Authorized for Issuance under Equity Compensation Plans
The information required by Item 201(d) of Regulation S-K is provided under Item 12, Security Ownership of Certain Beneficial Owners and Management and Related Stockholder Matters, which is incorporated herein by reference.
Purchase of Equity Securities
Our Board of Directors has authorized us to repurchase outstanding shares of our Class A common stock, from time to time, depending on market conditions and other considerations. During fiscal year 2013, our Board of Directors authorized an increase in the amount available under our share repurchase program up to an aggregate amount of $250 million, of which $90.3 million remained available as of August 31, 2014. There is no expiration date on the repurchase authorizations and the amount and timing of future share repurchase authorizations and repurchases, if any, will be made as market and business conditions warrant. Repurchases occur at our discretion and may be made on the open market through various methods including but not limited to accelerated share repurchase programs, or in privately negotiated transactions, pursuant to the applicable Securities and Exchange Commission rules, and may include repurchases pursuant to Securities and Exchange Commission Rule 10b5-1 nondiscretionary trading programs.
40
The following details changes in our treasury stock during the three months ended August 31, 2014:
(In thousands, except per share data) | Total Number of Shares Repurchased | Average Price Paid per Share | Total Number of Shares Repurchased as Part of Publicly Announced Plans or Programs | Maximum Value of Shares Available for Repurchase Under the Plans or Programs | |||||||||
Treasury stock as of May 31, 2014 | 78,634 | $ | 49.88 | 78,634 | $ | 135,316 | |||||||
New authorizations | — | — | — | — | |||||||||
Share repurchases | 193 | 28.34 | 193 | (5,477 | ) | ||||||||
Share reissuances | (4 | ) | 49.83 | (4 | ) | — | |||||||
Treasury stock as of June 30, 2014 | 78,823 | $ | 49.83 | 78,823 | $ | 129,839 | |||||||
New authorizations | — | — | — | — | |||||||||
Share repurchases | 1,100 | 29.10 | 1,100 | (32,019 | ) | ||||||||
Share reissuances | (300 | ) | 49.54 | (300 | ) | — | |||||||
Treasury stock as of July 31, 2014 | 79,623 | $ | 49.54 | 79,623 | $ | 97,820 | |||||||
New authorizations | — | — | — | — | |||||||||
Share repurchases | 273 | 27.51 | 273 | (7,504 | ) | ||||||||
Share reissuances | (311 | ) | 49.46 | (311 | ) | — | |||||||
Treasury stock as of August 31, 2014 | 79,585 | $ | 49.46 | 79,585 | $ | 90,316 | |||||||
41
Company Stock Performance
The following graph compares the five-year cumulative total return attained by shareholders on our Class A common stock relative to the cumulative total returns of the S&P 500 index and our customized peer group, which we modified in fiscal year 2014 as discussed below.
An investment of $100 (with reinvestment of all dividends) is assumed to have been made in our common stock, in the S&P 500 Index, and in the peer groups on August 31, 2009, and its relative performance is tracked through August 31, 2014. The stock price performance included in this graph is not necessarily indicative of future stock price performance.
COMPARISON OF FIVE-YEAR CUMULATIVE TOTAL RETURN*
Among Apollo Education Group, Inc., the S&P 500 Index, and Peer Groups
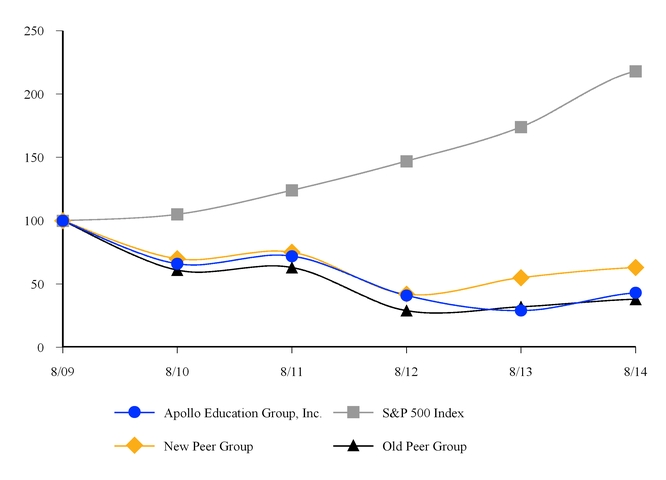
* $100 invested on August 31, 2009 in stock and index, including reinvestment of dividends.
Source: Standard & Poor’s.
Fiscal Year Ending August 31, | |||||||||||
2009 | 2010 | 2011 | 2012 | 2013 | 2014 | ||||||
Apollo Education Group, Inc. | 100 | 66 | 72 | 41 | 29 | 43 | |||||
S&P 500 Index | 100 | 105 | 124 | 147 | 174 | 218 | |||||
New Peer Group | 100 | 70 | 75 | 42 | 55 | 63 | |||||
Old Peer Group | 100 | 61 | 63 | 29 | 32 | 38 | |||||
42
We modified our peer group in fiscal year 2014 to better represent the companies included in our industry. We believe the New Peer Group provides a more meaningful comparison to our overall business and operations. Our Old Peer Group and New Peer Group consist of the following:
Old Peer Group | New Peer Group | ||
Career Education Corporation | Career Education Corporation | American Public Education, Inc. | |
DeVry Inc. | DeVry Education Group Inc. | Bridgepoint Education, Inc. | |
ITT Educational Services, Inc. | ITT Educational Services, Inc. | Capella Education Company | |
Strayer Education, Inc. | Strayer Education, Inc. | Grand Canyon Education, Inc. | |
Corinthian Colleges, Inc. | |||
The information contained in the performance graph shall not be deemed “soliciting material” or to be “filed” with the Securities and Exchange Commission nor shall such information be deemed incorporated by reference into any future filing under the Securities Act or the Exchange Act, except to the extent that we specifically incorporate it by reference into such filing.
43
Item 6 - Selected Financial Data
The following selected financial data is derived from our consolidated financial statements and is qualified by reference to and should be read in conjunction with Item 8, Financial Statements and Supplementary Data, and Item 7, Management’s Discussion and Analysis of Financial Condition and Results of Operations, to fully understand factors that may affect the comparability of the information. The historical results are not necessarily indicative of the results to be expected in any future period.
We have made certain reclassifications to the selected financial data associated with our presentation of Institute for Professional Development as discontinued operations. Refer to Note 3, Discontinued Operations, in Item 8, Financial Statements and Supplementary Data.
As of August 31, | |||||||||||||||||||
($ in thousands) | 2014 | 2013 | 2012 | 2011 | 2010 | ||||||||||||||
Cash and cash equivalents | $ | 1,228,813 | $ | 1,414,485 | $ | 1,276,375 | $ | 1,571,664 | $ | 1,284,769 | |||||||||
Restricted cash and cash equivalents | 224,135 | 259,174 | 318,334 | 379,407 | 444,132 | ||||||||||||||
Current marketable securities | 187,472 | 105,809 | — | — | — | ||||||||||||||
Long-term restricted cash and cash equivalents | — | — | — | — | 126,615 | ||||||||||||||
Total assets | 3,092,935 | 2,997,947 | 2,868,322 | 3,269,706 | 3,601,451 | ||||||||||||||
Current liabilities | 1,543,400 | 1,570,315 | 1,655,039 | 1,655,287 | 1,793,511 | ||||||||||||||
Long-term debt | 47,590 | 64,004 | 81,323 | 179,691 | 168,039 | ||||||||||||||
Long-term liabilities | 256,616 | 245,619 | 207,637 | 190,739 | 251,161 | ||||||||||||||
Redeemable noncontrolling interests | 64,527 | — | — | — | — | ||||||||||||||
Total equity | 1,180,802 | 1,118,009 | 924,323 | 1,243,989 | 1,388,740 | ||||||||||||||
Year Ended August 31, | |||||||||||||||||||
(In thousands, except per share data) | 2014 | 2013 | 2012 | 2011 | 2010 | ||||||||||||||
Net revenue | $ | 3,024,178 | $ | 3,635,924 | $ | 4,193,190 | $ | 4,635,031 | $ | 4,823,716 | |||||||||
Operating income(1) | 338,971 | 434,392 | 676,368 | 936,405 | 985,106 | ||||||||||||||
Income from continuing operations | 211,416 | 253,510 | 383,507 | 517,666 | 521,857 | ||||||||||||||
Net income | 204,798 | 248,965 | 417,006 | 535,796 | 521,581 | ||||||||||||||
Net income attributable to Apollo | 209,304 | 248,526 | 422,678 | 572,427 | 553,002 | ||||||||||||||
Earnings (loss) per share - Basic: | |||||||||||||||||||
Continuing operations attributable to Apollo | $ | 1.94 | $ | 2.25 | $ | 3.24 | $ | 3.93 | $ | 3.64 | |||||||||
Discontinued operations attributable to Apollo | (0.06 | ) | (0.05 | ) | 0.24 | 0.12 | — | ||||||||||||
Basic income per share attributable to Apollo | $ | 1.88 | $ | 2.20 | $ | 3.48 | $ | 4.05 | $ | 3.64 | |||||||||
Earnings (loss) per share - Diluted: | |||||||||||||||||||
Continuing operations attributable to Apollo | $ | 1.92 | $ | 2.23 | $ | 3.22 | $ | 3.91 | $ | 3.62 | |||||||||
Discontinued operations attributable to Apollo | (0.06 | ) | (0.04 | ) | 0.23 | 0.13 | — | ||||||||||||
Diluted income per share attributable to Apollo | $ | 1.86 | $ | 2.19 | $ | 3.45 | $ | 4.04 | $ | 3.62 | |||||||||
Basic weighted average shares outstanding | 111,354 | 112,712 | 121,607 | 141,269 | 151,955 | ||||||||||||||
Diluted weighted average shares outstanding | 112,610 | 113,285 | 122,357 | 141,750 | 152,906 | ||||||||||||||
(1) Operating income includes:
• | Restructuring and other charges of $85.3 million, $197.0 million, $38.7 million and $22.9 million in fiscal years 2014, 2013, 2012 and 2011, respectively; |
• | Contingent consideration charges and acquisition costs of $19.8 million in fiscal year 2014. |
• | Litigation charge (credit) of $13.9 million, $(24.6) million, $4.7 million, $(12.0) million, and $178.0 million in fiscal years 2014, 2013, 2012, 2011 and 2010, respectively; and |
• | Goodwill and other intangibles impairment of $16.8 million, $219.9 million and $184.6 million in fiscal years 2012, 2011 and 2010, respectively. |
44
Item 7 - Management’s Discussion and Analysis of Financial Condition and Results of Operations
This Management’s Discussion and Analysis of Financial Condition and Results of Operations (“MD&A”) is intended to help provide an understanding of our results of operations, financial condition and present business environment. The MD&A is provided as a supplement to, and should be read in conjunction with, our consolidated financial statements and related notes included in Item 8, Financial Statements and Supplementary Data.
Overview
Apollo Education Group, Inc. is one of the world’s largest private education services providers, serving students since 1973. We believe that our success depends on providing high quality education and career pathways, tools and services to students to maximize the benefits of their educational experience. Through our subsidiaries, we offer undergraduate, graduate, professional development and other non-degree educational programs and services, online and on-campus, principally to working learners in the U.S. and abroad.
Substantially all of our net revenue is composed of tuition and fees for educational services. In fiscal year 2014, University of Phoenix represented 87% of our total consolidated net revenue and generated more than 100% of our operating income. Further information regarding our education platforms is included in Note 18, Segment Reporting, in Item 8, Financial Statements and Supplementary Data.
Key Trends, Developments and Challenges
The following developments and trends present opportunities, challenges and risks as we work toward our goal of providing attractive returns for our stakeholders:
• | Rapidly Evolving and Highly Competitive Education Industry. The U.S. higher education industry is experiencing unprecedented, rapidly developing changes due to technological developments, evolving needs and objectives of students and employers, economic constraints affecting educational institutions and students, price competition, increased focus on affordability and other factors that challenge many of the core principles underlying the industry. In addition, the sector in which we operate has experienced significant and increasing competition from traditional public and private colleges and universities as these institutions are increasing their distance learning and other online education programs, including programs that are geared towards the needs of working learners. We believe these changes have contributed to the decline in University of Phoenix enrollment since 2010, and the 15.2% decline in Aggregate New Degreed Enrollment in fiscal year 2014 compared to the prior year. See further discussion of enrollment in Results of Operations below. |
We are adapting our business to meet these rapidly evolving developments and to stabilize University of Phoenix enrollment. In furtherance of this, we are implementing several initiatives including emphasizing the distinctiveness of University of Phoenix’s eight colleges to more effectively address the specific needs of the students and employers they serve. Additionally, we are working to accelerate the enhancement of our offerings to remain competitive and to more effectively deliver a quality student experience. This includes increased use of targeted scholarships and discounts that attract students and reward persistence. These initiatives, along with some of those described below, could adversely impact our operating results, especially in the short-term.
• | Education to Careers Value Proposition. We believe it is critical that we maximize the value our students garner from their education. Our goal is to continuously improve educational programs that retain students and provide skills in high-growth industries with the purpose of increasing employment opportunities within their field of study or advancement within their existing careers. This is our key value proposition to prospective students. We have launched career-oriented tools and continue to increase career connections and relationships to connect students to the careers they want and employers with the talent they need. We also intend to focus on areas of high demand for qualified employees and to tailor our programs to meet the needs of students and employers in these areas, including through the increased offering of professional development and other non-degree programs. |
45
• | Student Retention. We are focused on improving student retention. In furtherance of this, we are implementing several initiatives, including: |
• | Increasing use of full-time faculty in initial University of Phoenix courses; |
• | Modifying course structure and sequencing; |
• | Leveraging research and technology provided by the acquisition of Carnegie Learning; |
• | Targeted use of scholarships to reward persistence; |
• | Implementing a new online classroom designed to provide more personalized learning to students, improve the overall student experience, and lead to better educational outcomes; and |
• | Implementing a new student relationship and communications management platform designed to streamline student support services and assist students who have limited or no higher education experience or otherwise may be unprepared to succeed in University of Phoenix’s academic programs. |
• | Business Process Reengineering and Simplification. As discussed in Results of Operations below, we remain focused on reengineering and simplifying our business processes and refining our educational delivery systems to improve the effectiveness of our services to students, and on reducing the size of our services infrastructure and associated operating expenses to align with our reduced enrollment and revenue. These activities include rationalizing University of Phoenix campus locations and streamlining, automating where appropriate, and enhancing our administrative and student facing services. Because of the rapidly evolving and transformational changes in higher education, the University continues to evaluate the extent, functionality and location of its ground facilities. |
• | Expansion into New Markets. We believe that our significant experience pioneering and delivering effective, flexible education to working learners can be utilized to successfully offer education in significant and underserved international markets. We are working to expand our global operations so that they become an increasingly significant portion of our consolidated operating results, and are exploring new opportunities for growth in other areas of non-traditional higher education. To date, we have acquired educational institutions in the United Kingdom, Australia, Mexico, South Africa and Chile and we have a joint venture in India providing non-degree programs. Consistent with our experience to date, the integration and operation of acquired businesses in foreign jurisdictions entails substantial regulatory, market and execution risks and such acquisitions may not be accretive for an extended period of time. |
• | Information Technology. We have upgraded or are in the process of upgrading a substantial portion of our key IT systems, including our online student classroom, student relationship and communications management platform, and corporate applications, and retiring the related legacy systems. We believe that these new systems will improve the productivity, scalability, reliability and sustainability of our IT infrastructure and improve the student experience. However, the transition from the legacy systems entails risk of unanticipated disruption or failure to fully replicate all necessary data processing and reporting functions, including in our core business functions, that could adversely impact our business. Refer to Part I, Item 1A, Risk Factors - Risks Related to Our Business - System disruptions to our computer networks or phone systems could have a material adverse effect on our business and Security threats to our computer systems, including breach of the personal information that we collect, could have a material adverse effect on our business. |
• | Regulatory Environment. The following summarizes significant regulatory matters applicable to our business. For a more detailed discussion of the regulatory environment and related risks, refer to Part I, Item 1, Business, and Item 1A, Risk Factors. |
• | Financial Aid Funding. In recent years, there has been increased focus by members of the U.S. Congress and federal agencies such as the Consumer Financial Protection Bureau and the Federal Trade Commission on the role that proprietary educational institutions play in higher education. We expect this focus to increase, particularly during the time leading up to the 2014 mid-term elections. Congressional hearings and roundtable discussions have been held regarding various aspects of the education industry, and reports have been issued that are highly critical of proprietary institutions and include a number of recommendations to be considered by Congress in connection with the upcoming reauthorization of the federal Higher Education Act. The current reauthorization expired September 30, 2013 and an automatic one year extension continued the authorization through September 30, 2014. Congress continues to engage in Higher Education Act reauthorization hearings and although the one year automatic extension has expired, Title IV programs remain authorized and functioning. |
In addition, Title IV program funding is a potential target for reduction as Congress seeks to reduce the U.S. budget deficit. Because a substantial portion of our revenue is derived from Title IV programs, any action by Congress that reduces Title IV program funding, whether through across-the-board funding reductions, sequestration or otherwise, or alters the eligibility of our institutions or students to participate in Title IV
46
programs could have a material adverse effect on our enrollment and financial condition. Action by Congress or federal agencies could also require us to modify our practices in ways that increase our administrative costs and reduce our operating income.
In addition to possible reductions in Title IV program funding, certain military financial aid may be reduced as military branches address decreased funding. Reductions and/or changes in military financial aid could result in increased student borrowing, decreased enrollment and adverse impacts on our 90/10 Rule percentage, as discussed below.
• | Gainful Employment. Under the Higher Education Act, as reauthorized, proprietary schools are generally eligible to participate in Title IV programs only in respect of educational programs that lead to “gainful employment in a recognized occupation.” In connection with this requirement, proprietary postsecondary institutions are required to provide prospective students with each eligible program’s recognized occupations, cost, completion rate, job placement rate, and median loan debt of program completers. These reporting requirements could adversely impact student enrollment, persistence and retention if our reported program information compares unfavorably with other reporting educational institutions. A Notice of Proposed Rulemaking was issued by the U.S. Department of Education in March 2014 specifically on the topic of gainful employment. Refer to U.S. Department of Education Rulemaking Initiative below. |
• | Program Participation Agreement. University of Phoenix’s Title IV Program Participation Agreement expired December 31, 2012. The University has submitted necessary documentation for re-certification and its eligibility continues on a month-to-month basis until the Department issues its decision on the application. We have no reason to believe that the University’s application will not be renewed in due course, and it is not unusual to be continued on a month-to-month basis until the Department completes its review. We cannot predict whether, or to what extent, the imposition of the Notice sanction by The Higher Learning Commission, discussed below, might have on this process. |
• | U.S. Department of Education Rulemaking Initiative. In March 2014, the U.S. Department of Education issued a Notice of Proposed Rulemaking (“NPRM”) to establish measures for determining whether certain postsecondary educational programs prepare students for gainful employment in a recognized occupation, and the conditions under which these educational programs remain eligible to participate in Title IV programs. The public comment period on the NPRM ended in May 2014 and the Department has submitted its proposed final rule to the Office of Information and Regulatory Affairs for review and approval before the final regulations are published. The effective date of any such regulations cannot be determined until final regulations are published by the Department. If the Department publishes final regulations by November 1, 2014, such regulations could be effective as early as July 1, 2015. Additional details are available at |
http://www2.ed.gov/policy/highered/reg/hearulemaking/2012/gainfulemployment.html.
Additionally, the Department announced the creation of a rulemaking committee to focus on other topics, including cash management and state authorization. This committee has held negotiated rulemaking sessions, but the committee failed to reach consensus on all topics. These negotiated rulemaking initiatives are expected to produce new regulations in a variety of areas. In May 2014, prior to the final negotiated rulemaking session, the Department issued its proposal for certain new regulations, including those for state authorization. The proposed regulations, if promulgated as drafted, would impose significant new regulatory burdens on postsecondary institutions which provide distance education, regardless of educational sector, including University of Phoenix. The effective date of any such regulations cannot be determined at this time, but it is likely that the rules, if adopted, would be effective on or after July 1, 2015. While the Department is expected to issue final regulations in a number of these areas, the Department has indicated that it does not expect to promulgate additional regulations for state authorization for distance education programs without further study. Additional details are available at
http://www2.ed.gov/policy/highered/reg/hearulemaking/2012/programintegrity.html.
The Department has also conducted listening tours to solicit public feedback building on President Obama’s call for a national college rating system. The Secretary of the Department has publicly stated that a draft ratings system is expected to be issued by the end of calendar year 2014, and the Department has been charged with issuing the ratings for use by students and others for the 2015-2016 school year.
• | The Higher Learning Commission Accreditation Reaffirmation. In July 2013, the accreditation of University of Phoenix was reaffirmed by The Higher Learning Commission, its institutional accreditor (“HLC”), through the 2022-2023 academic year. At the same time, HLC placed the University on Notice status for a two-year period. Notice status is a sanction that means that HLC has determined that an institution is on a course of action that, if continued, could lead the institution to be out of compliance with one or more of the HLC |
47
Criteria for Accreditation or Core Components. We believe the imposition of the sanction of Notice has adversely impacted the reputation of University of Phoenix, may have contributed to the University’s continuing decline in enrollment and could adversely impact our business in the future. See discussion of these risks in Part I, Item 1A, Risk Factors - Risks Related to the Highly Regulated Industry in Which We Operate - If we fail to maintain our institutional accreditation, we could lose our ability to participate in Title IV programs, which would materially and adversely affect our business.
• | 90/10 Rule. To remain eligible to participate in Title IV programs, proprietary institutions of higher education must comply with the so-called “90/10 Rule” under the Higher Education Act, as reauthorized, and must derive 90% or less of their cash basis revenue, as defined in the rule, from Title IV programs. The 90/10 Rule percentages for University of Phoenix were as follows for the respective periods: |
Year Ended August 31, | |||||
2014 | 2013 | 2012 | |||
University of Phoenix | 81% | 83% | 84% | ||
Based on recent trends, we do not expect the 90/10 Rule percentage for University of Phoenix to exceed 90% for fiscal year 2015. However, the 90/10 Rule percentage for the University remains high and could exceed 90% in the future depending on the degree to which its various initiatives are effective, the impact of future changes in its enrollment mix, and regulatory and other factors outside our control, including any reduction in military benefit programs or changes in the treatment of such funding for purposes of the 90/10 Rule calculation. Various legislative proposals have been introduced in Congress that would heighten the requirements of the 90/10 rule, including proposals that would, if enacted, reduce the percentage to 85% and adversely change the manner in which military aid is treated for purposes of the rule calculation. Refer to Part I, Item 1A, Risk Factors - Risks Related to the Highly Regulated Industry in Which We Operate - Our schools and programs would lose their eligibility to participate in federal student financial aid programs if the percentage of revenue derived from those programs is too high, in which event we could not conduct our business as it is currently conducted.
• | Student Loan Cohort Default Rates. To remain eligible to participate in Title IV programs, an educational institution’s student loan cohort default rates must remain below certain specified levels. Educational institutions will lose eligibility to participate in Title IV programs if their three-year cohort default rate equals or exceeds 40% for any given year or 30% for three consecutive years. Based on information published by the U.S. Department of Education, the three-year cohort default rates for University of Phoenix for the applicable federal fiscal years were as follows: |
Three-Year Cohort Default Rates for Cohort Years Ended September 30, | |||||
2011 | 2010 | 2009 | |||
University of Phoenix | 19.0% | 26.0% | 26.4% | ||
Based on our most recent trends, we expect the 2012 three-year cohort default rate for University of Phoenix to be lower than the 2011 three-year cohort default rate. However, if our student loan default rates approach the applicable limits, we may be required to increase efforts and resources dedicated to improving these default rates. Refer to Part I, Item 1A, Risk Factors - Risks Related to the Highly Regulated Industry in Which We Operate - An increase in student loan default rates could result in the loss of eligibility to participate in Title IV programs, which would materially and adversely affect our business.
• | U.S. Department of Education Program Review. The U.S. Department of Education periodically reviews institutions participating in Title IV programs for compliance with applicable standards and regulations. In August 2014, the Department commenced an ordinary course program review of University of Phoenix’s administration of Title IV programs covering federal financial aid years 2012-2013 and 2013-2014, as well as compliance with the Jeanne Clery Disclosure of Campus Security Policy and Campus Crime Statistics Act, the Drug-Free Schools and Communities Act and related regulations. |
• | Office of the Inspector General of the U.S. Department of Education (“OIG”) Subpoena. On March 21, 2014, University of Phoenix received a subpoena from the Mid-Atlantic Region of the OIG. The subpoena seeks the production by the University of documents and detailed information regarding a broad spectrum of the activities conducted in the University’s Centralized Service Center for the Northeast Region located in Columbia, Maryland, for the time period of January 1, 2007 to the present, including information relating to marketing, recruitment, enrollment, financial aid processing, fraud prevention, student retention, personnel |
48
training, attendance, academic grading and other matters. We are cooperating with these requests but cannot at this time predict the eventual scope, duration or outcome of this matter.
For a more detailed discussion of our business, industry and risks, refer to Item 1, Business, and Item 1A, Risk Factors.
Fiscal Year 2014 Significant Events
In addition to the items mentioned above, we experienced the following significant events during fiscal year 2014 and to date:
1. | Passing of Dr. John Sperling. On August 24, 2014, Dr. John Sperling, the founder of Apollo Education Group and University of Phoenix, passed away. Dr. Sperling’s work ethic and passion for the higher education industry drove him to reshape the industry and transform students’ lives, principally through the pioneering of distance education online and electronic textbooks. |
2. | Corporate Name Change. During the first quarter of fiscal year 2014, we changed our corporate name from Apollo Group, Inc. to Apollo Education Group, Inc. to better and more clearly reflect our mission and our purpose. |
3. | Executive Management and Board of Directors Changes. We experienced the following executive management and Board of Directors changes: |
• | J. Mitchell Bowling was appointed as our Chief Operating Officer effective December 2, 2013. Curtis M. Uehlein, who served as our Acting Chief Operating Officer since April 2013, continues to serve in his role as President of Apollo Global; |
• | Dana H. Born, Ph.D. was appointed to our Board of Directors on March 20, 2014 and serves on the Audit and Compensation Committees of the Board of Directors; |
• | William J. Pepicello retired from his position as President of University of Phoenix, effective June 20, 2014; and |
• | Timothy P. Slottow was named as the new President of University of Phoenix, effective June 20, 2014. |
4. | Apollo Education Group Reports. We issued the following reports that can be found on our website: |
• | Empowering America: Reinventing Pathways to College and the Workforce, which focuses on the current college and career readiness challenges facing the U.S., innovative ways to address students and their needs, and the economic impact of increasing student preparedness. |
• | Creating the Future American Workforce: Investments and Innovation in Human Capital, which focuses on businesses and educational institutions working together to address today’s growing employment “skills gap” by investing in the future American workforce. |
5. | Apollo Global Acquisitions. Apollo Global has completed the following acquisitions: |
• | On December 20, 2013, Apollo Global acquired 70% of the outstanding shares of Open Colleges, which is a provider of education and training to adult learners in Australia. Refer to Note 4, Acquisitions, in Item 8, Financial Statements and Supplementary Data. |
• | On May 20, 2014, Apollo Global acquired an 81% consolidated interest in Milpark Education, which is a provider of education and training to adult learners in South Africa. Refer to Note 4, Acquisitions, in Item 8, Financial Statements and Supplementary Data. |
6. | Lightspeed Online Career Skills and Learning Marketplace. Apollo Lightspeed began operating SkilledUp, an online career skills and learning marketplace designed to connect individuals to online learning offerings where they can acquire skills valued by technology companies. |
7. | Sale of Institute for Professional Development (“IPD”). During the fourth quarter of fiscal year 2014, we sold the assets of IPD for $4 million, which resulted in an immaterial gain on disposition. IPD’s operating results are presented as discontinued operations for all periods presented. Refer to Note 3, Discontinued Operations, in Item 8, Financial Statements and Supplementary Data. |
49
8. | Accreditation and Registration Updates. |
• | College for Financial Planning - During fiscal year 2014, College for Financial Planning was informed in writing by HLC, its institutional accreditor, that College for Financial Planning had addressed HLC’s findings from its most recent accreditation reaffirmation review. The next comprehensive visit from HLC is scheduled during the 2017-2018 school year. |
• | ULA - During the first quarter of fiscal year 2014, ULA received the recognition of University of Excellence, which is the highest level of institutional accreditation from the Mexican Federation of Private Institutions of Higher Education. |
• | Open Colleges - Open Colleges’ operates three registered training organizations as approved by the Australian Skills Quality Authority. All three registrations were recently renewed for the maximum allowable period of five years with the first expiring and requiring renewal in our fiscal year 2018. |
Critical Accounting Policies and Estimates
Our consolidated financial statements are prepared in accordance with accounting principles generally accepted in the United States of America. The preparation of these consolidated financial statements requires management to make certain estimates, assumptions and judgments that affect the reported amount of assets and liabilities and the disclosure of contingent assets and liabilities at the date of the financial statements and the reported amount of revenues and expenses during the reporting period. Our critical accounting policies involve a higher degree of subjective or complex judgments and assumptions, often as a result of the need to make estimates about the effect of inherently uncertain matters. Although we believe our estimates, assumptions, and judgments are reasonable, actual results may differ materially from our estimates under different assumptions, judgments, or conditions.
Revenue Recognition
Substantially all of our net revenue is composed of tuition and fees from educational programs that range in length from one-day seminars to degree and non-degree programs lasting multiple years. University of Phoenix represents the substantial majority of our total consolidated net revenue and substantially all of the University’s net revenue is generated from degree programs. University of Phoenix students fund their education through loans and/or grants from U.S. federal financial aid programs established by Title IV of the Higher Education Act and regulations promulgated thereunder (“Title IV”), military benefit programs, tuition assistance from their employers, or personal funds.
Our net revenue generally varies from period to period based on several factors, including the aggregate number of students attending educational programs, the number of programs or classes held during the period, and the tuition price per program. The following summarizes our net revenue for the respective periods:
Year Ended August 31, | ||||||||||||||||||||
($ in thousands) | 2014 | 2013 | 2012 | |||||||||||||||||
Tuition and educational services | $ | 3,030,064 | 100 | % | $ | 3,622,767 | 100 | % | $ | 4,124,629 | 98 | % | ||||||||
Educational materials | 219,085 | 7 | % | 252,441 | 7 | % | 294,499 | 7 | % | |||||||||||
Other | 50,028 | 2 | % | 42,816 | 1 | % | 30,026 | 1 | % | |||||||||||
Gross revenue | 3,299,177 | 109 | % | 3,918,024 | 108 | % | 4,449,154 | 106 | % | |||||||||||
Discounts | (274,999 | ) | (9 | )% | (282,100 | ) | (8 | )% | (255,964 | ) | (6 | )% | ||||||||
Net revenue | $ | 3,024,178 | 100 | % | $ | 3,635,924 | 100 | % | $ | 4,193,190 | 100 | % | ||||||||
We recognize revenue when persuasive evidence of an arrangement exists, services have been rendered or delivery has occurred, our fee or price to the customer is fixed or determinable, and collectibility is reasonably assured.
• | Tuition and educational services encompasses all educational delivery modalities (i.e., online, on-campus, etc.), and we recognize revenue over the period of instruction as services are delivered to students, which may vary depending on the program structure. Tuition benefits for our employees and their eligible dependents are included in tuition and educational services revenue and instructional and student advisory expenses, and were $32.3 million, $53.4 million and $71.1 million during fiscal years 2014, 2013 and 2012, respectively. |
Under University of Phoenix’s non-term academic delivery model, students generally enroll in a program of study encompassing a series of five- to nine-week courses taken consecutively over the length of the program. Students are billed separately for each course when the student first attends a course, resulting in the recording of a receivable from the student and deferred revenue in the amount of the billing. The University generally recognizes revenue evenly over the period of instruction (e.g., five weeks for a five-week course) as services are delivered to the student. For students
50
that participate in the University’s risk-free, three-week program during their first credit-bearing course, the University does not recognize revenue for the risk-free period until students decide to continue beyond the risk-free period, which is when the fees become fixed and determinable. Additionally, the University reassesses collectibility throughout the period revenue is recognized when there are changes in facts or circumstances that indicate collectibility is no longer reasonably assured.
University of Phoenix’s refund policy permits students who attend 60% or less of a course to be eligible for a refund for the portion of the course they did not attend. Accordingly, the University ceases revenue recognition for the remainder of a course if a student withdraws prior to the tuition refund period elapsing, and refunds result in a reduction of deferred revenue in the period that a student withdraws. This refund policy applies to students in most, but not all states, as some states require different policies.
For our Apollo Global operations, tuition revenue is generally recognized over the length of the course and/or program. However, we recognize revenue associated with Open Colleges’ educational offerings over the contract period that students are provided access to complete their online, asynchronous program or the period of time it takes students to complete their program, as applicable. As a result, revenue recognition for Open Colleges’ educational offerings generally extends beyond one year.
• | Educational materials encompasses online course materials delivered to students over the period of instruction and the sale of various books, study texts, course notes, and CDs. We recognize revenue associated with online materials over the period of the related course to correspond with delivery of the materials to students. We recognize revenue for the sale of other educational materials when they have been delivered to and accepted by students or other customers. |
• | Other includes net revenue generated by Carnegie Learning, fees students pay when submitting an enrollment application and non-tuition generating revenues such as renting classroom space. |
• | Discounts reflect reductions in charges for tuition or other fees from our standard rates and include military, corporate, and other employer discounts, along with institutional scholarships, grants and promotions. Discounts are generally recognized over the period of instruction in the same manner as the related revenue to which the discount relates. |
During fiscal year 2014, we began presenting Institute of Professional Development’s (“IPD”) operating results as discontinued operations. Accordingly, IPD’s net revenue is included in discontinued operations on our Consolidated Statements of Income for all periods presented. IPD’s revenue was generated based on fixed fee contracts with IPD client institutions and was recognized in accordance with the terms of the respective agreements as services were provided.
Sales tax collected from students is excluded from net revenue. Collected but unremitted sales tax is included as a liability on our Consolidated Balance Sheets and is not material to our consolidated financial statements.
Allowance for Doubtful Accounts
We reduce our accounts receivable by an allowance for amounts that we expect to be uncollectible. We use estimates that are subjective and require judgment in determining the allowance for doubtful accounts, and estimates may vary depending on the institution or educational program that generated the accounts receivable. In general, our estimates are based on historical collection experience and write-offs, the aging of our receivables, and current trends. Our accounts receivable are written off once the account is deemed to be uncollectible, which typically occurs after outside collection agencies have pursued collection for approximately six months.
For our Title IV eligible institutions, program participation rules determine if we are required to return a portion of the funds to the U.S. Department of Education when a student with Title IV program loans withdraws. We are then entitled to collect these funds from the students, but collection rates for these types of receivables are significantly lower than our collection rates for receivables from students who remain in our educational programs.
We estimate our allowance for doubtful accounts for University of Phoenix’s receivables using a statistical model that considers a number of factors that we believe impact whether receivables will become uncollectible based on our collections experience. These factors include, but are not limited to, the student’s academic performance and previous college experience as well as other student characteristics such as credit hours earned and method of payment. We also monitor and consider external factors such as changes in the economic and regulatory environment.
We routinely evaluate our estimation methodologies for all our institutions and educational programs for adequacy and modify them as necessary. In doing so, we believe our allowance for doubtful accounts reflects the amount of receivables that will become uncollectible by considering our most recent collections experience, changes in trends and other relevant facts.
51
We recorded bad debt expense of $53.8 million, $83.8 million and $146.7 million during fiscal years 2014, 2013 and 2013, respectively. Our allowance for doubtful accounts was $50.1 million and $59.7 million as of August 31, 2014 and 2013, respectively, which approximated 20% and 25% of gross student receivables as of the respective dates. For the purpose of sensitivity:
• | a one percent change in our allowance for doubtful accounts as a percentage of gross student receivables as of August 31, 2014 would have resulted in a pre-tax change in income of $2.6 million; and |
• | if our bad debt expense were to change by one percent of net revenue for the fiscal year ended August 31, 2014, we would have recorded a pre-tax change in income of approximately $30.2 million. |
For a discussion of the decrease in bad debt expense in recent years, refer to Results of Operations below.
Goodwill and Intangibles
Goodwill represents the excess of the purchase price of an acquired business over the amount assigned to the assets acquired and liabilities assumed. We allocate assets acquired, including goodwill, and liabilities assumed in business combinations to our respective reporting units. We identify our reporting units by assessing whether the components of our operating segments constitute businesses for which discrete financial information is available and segment management regularly reviews the operating results of those components.
Our intangibles principally include trademarks, technology, regulatory accreditations and designations, course curriculum and customer relationships. We assign indefinite lives to intangibles that we believe have the continued ability to generate cash flows indefinitely; have no legal, regulatory, contractual, economic or other factors limiting the useful life of the respective intangible; and we intend to renew the respective intangible, if applicable, and renewal can be accomplished at little cost. Finite-lived intangibles are amortized on either a straight-line basis or using an accelerated method to reflect the pattern in which the economic benefits of the asset are consumed. The weighted average original useful life of our $74.7 million of finite-lived intangibles as of August 31, 2014 was 5.8 years.
We assess goodwill and indefinite-lived intangibles at least annually for impairment or more frequently if events occur or circumstances change between annual tests that would more likely than not reduce the fair value of the respective reporting unit or indefinite-lived intangible below its carrying amount. We perform our annual indefinite-lived intangibles impairment tests on the same dates that we perform our annual goodwill impairment tests for the respective reporting units. In performing our impairment tests, we first consider the option to assess qualitative factors to determine whether it is more likely than not that the fair value of a reporting unit or intangible, as applicable, is less than its carrying amount. If we conclude that it is more likely than not that the fair value is less than the carrying amount based on our qualitative assessment, or that a qualitative assessment should not be performed, we proceed with the following quantitative impairment tests:
• | Goodwill - We compare the estimated fair value of the reporting unit to the carrying value of its net assets. If the fair value of the reporting unit exceeds the carrying value of the net assets of the reporting unit, goodwill is not impaired. If the carrying value of the net assets of the reporting unit exceeds the fair value of the reporting unit, we perform a hypothetical purchase price allocation to determine the implied fair value of the goodwill and compare it to the carrying value of the goodwill. An impairment loss is recognized to the extent the implied fair value of the goodwill is less than the carrying amount of the goodwill. |
• | Indefinite-lived intangibles - We compare the estimated fair value of the intangible with its carrying value. If the carrying value of the intangible exceeds its fair value, an impairment loss is recognized in the amount of that excess. |
52
Our goodwill and indefinite-lived intangibles for our reporting units within our reportable segments are summarized below:
($ in thousands) | Annual Impairment Test Date | Goodwill as of August 31, | Indefinite-lived Intangibles as of August 31, | ||||||||||||||
2014 | 2013 | 2014 | 2013 | ||||||||||||||
University of Phoenix | May 31 | $ | 71,812 | $ | 71,812 | $ | — | $ | — | ||||||||
Apollo Global | |||||||||||||||||
Open Colleges | July 1 | 134,561 | — | — | — | ||||||||||||
BPP | July 1 | — | — | 90,461 | 84,739 | ||||||||||||
Milpark Education | July 1 | 21,828 | — | 6,930 | — | ||||||||||||
ULA | May 31 | 14,809 | 14,917 | 2,377 | 2,342 | ||||||||||||
UNIACC | May 31 | — | — | 808 | 951 | ||||||||||||
Other | |||||||||||||||||
College for Financial Planning | August 31 | 15,310 | 15,310 | — | — | ||||||||||||
Western International University | May 31 | 1,581 | 1,581 | — | — | ||||||||||||
Carnegie Learning | May 31 | — | — | 14,100 | 14,100 | ||||||||||||
Total | $ | 259,901 | $ | 103,620 | $ | 114,676 | $ | 102,132 | |||||||||
The process of evaluating goodwill and indefinite-lived intangibles for impairment is subjective and requires significant judgment at many points during the analysis. If we elect to perform an optional qualitative analysis, we consider many factors including, but not limited to, general economic conditions, industry and market conditions, our market capitalization, financial performance and key business drivers, long-term operating plans, and potential changes to significant assumptions used in the most recent fair value analysis for either the reporting unit or respective intangible.
When performing a quantitative goodwill or indefinite-lived intangibles impairment test, we determine fair value using an income-based approach, a market-based approach or a combination of both methods. The fair value determination consists primarily of using unobservable inputs under the fair value measurement standards. We believe the most critical assumptions and estimates in determining the estimated fair value of our reporting units or indefinite-lived intangibles include, but are not limited to, the amounts and timing of expected future cash flows, the discount rate applied to those cash flows, terminal growth rates, selection of comparable market multiples and applying weighting factors when multiple valuation methods are used. The assumptions used in determining our expected future cash flows consider various factors such as historical operating trends and long-term operating strategies and initiatives. The discount rate used by each reporting unit is based on our assumption of a prudent investor’s required rate of return of assuming the risk of investing in a particular company in a specific country. The terminal growth rate reflects the sustainable operating income a reporting unit could generate in a perpetual state as a function of revenue growth, inflation and future margin expectations.
Fiscal Year 2014 Impairment Testing
We completed our fiscal year 2014 annual goodwill and indefinite-lived intangibles impairment tests and determined there was no impairment. We elected to perform qualitative assessments for certain of our reporting units and indefinite-lived intangibles. For reporting units that we tested using a quantitative approach, the fair values exceeded the respective carrying values by significant margins representing at least 20% of their respective fair values.
If the critical assumptions used in our impairment testing deteriorate or are otherwise adversely impacted, a lower fair value estimate may result. In particular, the goodwill acquired in our recent acquisitions of Open Colleges and Milpark Education was principally attributable to future earnings potential associated with student growth. If these acquired entities do not achieve our forecasts, the goodwill could be impaired in the future.
Other Long-Lived Asset Impairments
We evaluate the carrying amount of our other long-lived assets, including property and equipment and finite-lived intangibles, whenever changes in circumstances or events indicate that the value of such assets may not be recoverable. During fiscal year 2013, we recorded $20.4 million of long-lived asset impairments, which includes $12.2 million resulting from our restructuring activities.
As of August 31, 2014, we believe the carrying amounts of our remaining other long-lived assets are recoverable and no impairment exists. However, we are continuing to adapt our business to the rapidly developing changes in our industry, and changes to our business or other circumstances could lead to potential impairments in the future.
53
Restructuring and Other Charges
Restructuring and other charges principally consist of non-cancelable lease obligations, severance and other employee separation costs, and other related costs. We recognize restructuring obligations and liabilities for other exit and disposal activities at fair value in the period the liability is incurred. The process of measuring fair value and recognizing the associated liabilities is subjective and requires significant judgment. For our non-cancelable lease obligations, we record the obligation when we terminate the contract in accordance with the contract terms or when we cease using the right conveyed by the contract. Our employee severance costs are expensed on the date we notify the employee, unless the employee must provide future service, in which case the benefits are expensed over the future service period.
We generally estimate the fair value of restructuring obligations using significant unobservable inputs (Level 3) based on the best available information. For non-cancelable lease obligations, the fair value estimate is based on the contractual lease costs over the remaining terms of the leases, partially offset by estimated future sublease rental income. Our estimate of the amount and timing of sublease rental income considers subleases we expect to execute, current commercial real estate market data and conditions, comparable transaction data and qualitative factors specific to the facilities. The estimates are subject to adjustment as market conditions change or as new information becomes available, including the execution of sublease agreements.
Changes to restructuring obligations in periods subsequent to the initial fair value measurement are not measured at fair value. We record a cumulative adjustment resulting from changes in the estimated timing or amount of cash flows associated with restructuring obligations in the period of change using the same discount rate that was initially used to measure the obligation’s fair value. Changes in restructuring obligations resulting from the passage of time are recorded as accretion expense. The adjustments to restructuring obligations, including accretion expense, are included in restructuring and other charges on our Consolidated Statements of Income.
The following details the changes in our restructuring obligations by type of cost during fiscal year 2014:
($ in thousands) | Lease and Related Costs, Net | Severance and Other Employee Separation Costs | Other Restructuring Related Costs | Total | |||||||||||
Balance at August 31, 2013 | $ | 104,048 | $ | 7,623 | $ | 8,130 | $ | 119,801 | |||||||
Expense incurred | 47,279 | 33,215 | 4,849 | 85,343 | |||||||||||
Other | (3,251 | ) | (4,281 | ) | — | (7,532 | ) | ||||||||
Payments | (51,872 | ) | (30,870 | ) | (11,787 | ) | (94,529 | ) | |||||||
Balance at August 31, 2014 | $ | 96,204 | $ | 5,687 | $ | 1,192 | $ | 103,083 | |||||||
Loss Contingencies
We are subject to various claims and contingencies including those related to regulation, litigation, business transactions, employee-related matters and taxes, among others. When we become aware of a claim or potential claim, the likelihood of any loss or exposure is assessed. If it is probable that a loss will result and the amount of the loss or range of loss can be reasonably estimated, we record a liability for the loss. The liability recorded includes probable and estimable legal costs incurred to date and future legal costs to the point in the legal matter where we believe a conclusion to the matter will be reached. The liability excludes any anticipated loss recoveries from third parties such as insurers, which we record as a receivable if we determine recovery is probable. If the loss is not probable or the amount of the loss or range of loss cannot be reasonably estimated, we disclose the claim if the likelihood of a potential loss is reasonably possible and the amount of the potential loss could be material. For matters where no loss contingency is recorded, we expense legal fees as incurred. The assessment of the likelihood of a potential loss and the estimation of the amount of a loss or range of loss are subjective and require judgment.
Income Taxes
We are subject to the income tax laws of the U.S. and the foreign jurisdictions in which we have significant business operations. These tax laws are complex and subject to different interpretations by the taxpayer and the relevant governmental taxing authorities. As a result, significant judgments and interpretations are required in determining our provision for income taxes and evaluating our uncertain tax positions.
The objectives of accounting for income taxes are to recognize the amount of taxes payable or refundable for the current year and deferred tax liabilities and assets for the future tax consequences of events that have been recognized in an entity’s financial statements or tax returns. Deferred tax assets and liabilities are measured using enacted tax rates in effect for the year in which those temporary differences are expected to be recovered or settled. The effect on deferred tax assets and liabilities of a change in tax rates is recognized in earnings in the period when the new rate is enacted. We record a valuation allowance to reduce deferred tax assets to the amount that we believe is more likely than not to be realized.
54
We have not provided deferred taxes on unremitted earnings attributable to international subsidiaries that have been considered permanently reinvested. As of August 31, 2014, the earnings from these operations are not significant, but they are expected to increase in the future due to our focus on international expansion, which includes two acquisitions by Apollo Global during fiscal year 2014.
We evaluate and account for uncertain tax positions using a two-step approach. Recognition (step one) occurs when we conclude that a tax position, based solely on its technical merits, is more likely than not to be sustained upon examination. Measurement (step two) determines the amount of benefit that is greater than 50% likely to be realized upon ultimate settlement with a taxing authority that has full knowledge of all relevant information. Derecognition of a tax position that was previously recognized would occur when we subsequently determine that a tax position no longer meets the more likely than not threshold of being sustained. We classify interest and penalties accrued in connection with unrecognized tax benefits as income tax expense on our Consolidated Statements of Income. Our total unrecognized tax benefits, excluding interest and penalties, were $18.4 million and $44.1 million as of August 31, 2014 and 2013, respectively.
Recent Accounting Pronouncements
For discussion of recent accounting pronouncements, refer to Note 1, Nature of Operations and Significant Accounting Policies, in Item 8, Financial Statements and Supplementary Data.
Results of Operations
We have included below a discussion of our operating results and significant items explaining the material changes in our operating results during fiscal years 2014, 2013 and 2012.
As discussed in the Overview of this MD&A, the U.S. higher education industry is experiencing unprecedented, rapidly developing changes. We believe University of Phoenix enrollment has been adversely impacted by these changes, and we are working to accelerate the enhancement of our offerings to remain competitive and to more effectively deliver a quality student experience. Certain of our initiatives under consideration could adversely impact our operating results, especially in the short-term.
Our operations are generally subject to seasonal trends, which vary depending on subsidiary. We have historically experienced, and expect to continue to experience, fluctuations in our results of operations as a result of seasonal variations in the level of our institutions’ enrollments.
• | University of Phoenix - Although University of Phoenix enrolls students throughout the year, its net revenue is generally lower in our second fiscal quarter (December through February) than the other quarters due to holiday breaks. |
• | Apollo Global - Our Apollo Global subsidiaries experience seasonality associated with the timing of when courses begin, exam dates, the timing of their respective holidays and other factors. These factors have historically resulted in lower net revenue in our second and fourth fiscal quarters, particularly for BPP, which also results in substantially lower operating results during these quarters due to BPP’s relatively fixed cost structure. |
We categorize our operating expenses principally as follows:
• | Instructional and student advisory - consist primarily of costs related to the delivery and administration of our educational programs and include costs related to faculty, student advisory and administrative compensation, classroom and administration lease expenses (including facilities that are shared and support both instructional and other functions), financial aid processing costs, costs related to the development and enhancement of our educational programs and other related costs. Tuition costs for all employees and their eligible family members are recorded as an expense within instructional and student advisory. |
• | Marketing - the substantial majority of costs consist of advertising expenses, compensation for marketing personnel, including personnel responsible for establishing relationships with selected employers, and production of marketing materials. The category also includes other costs directly related to marketing functions. |
• | Admissions advisory - the substantial majority of costs consist of compensation for admissions personnel. The category also includes other costs directly related to admissions advisory functions. |
• | General and administrative - consist primarily of corporate compensation, rent expense, legal and professional fees, information technology infrastructure costs and other related costs. |
• | Depreciation and amortization - consist of depreciation expense on our property and equipment and amortization of our finite-lived intangibles. |
• | Provision for uncollectible accounts receivable - consist of expense charged to reduce our accounts receivable to our estimate of the amount we expect to collect. |
55
Analysis of Consolidated Statements of Income
The following details our consolidated results of operations. For a more detailed discussion of our operating results by reportable segment, refer to Analysis of Operating Results by Reportable Segment below.
Year Ended August 31, | Percentage Change 2014 versus 2013 | Percentage Change 2013 versus 2012 | ||||||||||||||||||||||||
Percent of Net Revenue | ||||||||||||||||||||||||||
($ in thousands) | 2014 | 2013 | 2012 | 2014 | 2013 | 2012 | ||||||||||||||||||||
Net revenue | $ | 3,024,178 | $ | 3,635,924 | $ | 4,193,190 | 100.0 | % | 100.0 | % | 100.0 | % | (16.8 | )% | (13.3 | )% | ||||||||||
Costs and expenses: | ||||||||||||||||||||||||||
Instructional and student advisory | 1,301,004 | 1,561,568 | 1,776,596 | 43.0 | % | 43.0 | % | 42.4 | % | (16.7 | )% | (12.1 | )% | |||||||||||||
Marketing | 557,649 | 641,784 | 641,699 | 18.4 | % | 17.7 | % | 15.3 | % | (13.1 | )% | — | % | |||||||||||||
Admissions advisory | 215,196 | 253,319 | 371,901 | 7.1 | % | 7.0 | % | 8.9 | % | (15.0 | )% | (31.9 | )% | |||||||||||||
General and administrative | 287,884 | 326,908 | 341,872 | 9.5 | % | 9.0 | % | 8.2 | % | (11.9 | )% | (4.4 | )% | |||||||||||||
Depreciation and amortization | 150,575 | 161,733 | 177,804 | 5.0 | % | 4.4 | % | 4.2 | % | (6.9 | )% | (9.0 | )% | |||||||||||||
Provision for uncollectible accounts receivable | 53,819 | 83,798 | 146,742 | 1.8 | % | 2.3 | % | 3.5 | % | (35.8 | )% | (42.9 | )% | |||||||||||||
Restructuring and other charges | 85,343 | 197,022 | 38,695 | 2.8 | % | 5.4 | % | 0.9 | % | * | * | |||||||||||||||
Contingent consideration charges and acquisition costs | 19,837 | — | — | 0.7 | % | — | % | — | % | * | * | |||||||||||||||
Litigation charge (credit) | 13,900 | (24,600 | ) | 4,725 | 0.5 | % | (0.7 | )% | 0.1 | % | * | * | ||||||||||||||
Goodwill and other intangibles impairment | — | — | 16,788 | — | % | — | % | 0.4 | % | * | * | |||||||||||||||
Total costs and expenses | 2,685,207 | 3,201,532 | 3,516,822 | 88.8 | % | 88.1 | % | 83.9 | % | (16.1 | )% | (9.0 | )% | |||||||||||||
Operating income | 338,971 | 434,392 | 676,368 | 11.2 | % | 11.9 | % | 16.1 | % | (22.0 | )% | (35.8 | )% | |||||||||||||
Interest income | 2,230 | 1,913 | 1,187 | 0.1 | % | — | % | — | % | 16.6 | % | 61.2 | % | |||||||||||||
Interest expense | (7,914 | ) | (8,745 | ) | (11,745 | ) | (0.3 | )% | (0.2 | )% | (0.2 | )% | (9.5 | )% | (25.5 | )% | ||||||||||
Other (loss) income, net | (547 | ) | 2,407 | 476 | — | % | 0.1 | % | — | % | * | * | ||||||||||||||
Income from continuing operations before income taxes | 332,740 | 429,967 | 666,286 | 11.0 | % | 11.8 | % | 15.9 | % | (22.6 | )% | (35.5 | )% | |||||||||||||
Provision for income taxes | (121,324 | ) | (176,457 | ) | (282,779 | ) | (4.0 | )% | (4.8 | )% | (6.8 | )% | (31.2 | )% | (37.6 | )% | ||||||||||
Income from continuing operations | 211,416 | 253,510 | 383,507 | 7.0 | % | 7.0 | % | 9.1 | % | (16.6 | )% | (33.9 | )% | |||||||||||||
(Loss) income from discontinued operations, net of tax | (6,618 | ) | (4,545 | ) | 33,499 | (0.2 | )% | (0.2 | )% | 0.8 | % | * | * | |||||||||||||
Net income | 204,798 | 248,965 | 417,006 | 6.8 | % | 6.8 | % | 9.9 | % | (17.7 | )% | (40.3 | )% | |||||||||||||
Net loss (income) attributable to noncontrolling interests | 4,506 | (439 | ) | 5,672 | 0.1 | % | — | % | 0.2 | % | * | * | ||||||||||||||
Net income attributable to Apollo | $ | 209,304 | $ | 248,526 | $ | 422,678 | 6.9 | % | 6.8 | % | 10.1 | % | (15.8 | )% | (41.2 | )% | ||||||||||
*Not meaningful
Net Revenue
Our net revenue decreased $611.7 million and $557.3 million, or 16.8% and 13.3%, in fiscal years 2014 and 2013 compared to the respective prior years. The decreases were primarily attributable to net revenue declines at University of Phoenix of 20.3% and 14.7% during the respective periods principally due to lower enrollment. This was partially offset by increases in Apollo Global net revenue. Refer to further discussion of net revenue by reportable segment below at Analysis of Operating Results by Reportable Segment.
Instructional and Student Advisory
Instructional and student advisory decreased $260.6 million and $215.0 million, or 16.7% and 12.1%, in fiscal years 2014 and 2013 compared to the respective prior years. As a percentage of net revenue, instructional and student advisory was consistent in fiscal year 2014 compared to the prior year, and increased 60 basis points in fiscal year 2013 compared to the prior year. The decreases in expense were primarily due to lower costs including rent and compensation attributable to our restructuring activities (refer to Restructuring and Other Charges below) and lower costs from the enrollment decline at University of Phoenix. Fiscal years 2014 and 2013 were also impacted by approximately $11 million of foreign indirect taxes related to instructional materials that were originally assessed in fiscal year 2013, and were subsequently reversed in fiscal year 2014 following resolution with the taxing authority.
56
Marketing
Marketing decreased $84.1 million, or 13.1%, in fiscal year 2014 compared to the prior year, which represented a 70 basis point increase as a percentage of net revenue. The decrease in expense was principally attributable to lower advertising costs, and lower headcount due in part to our restructuring activities. This was partially offset by advertising costs attributable to Open Colleges, which was acquired in the second quarter of fiscal year 2014.
Marketing was essentially flat in fiscal year 2013 compared to the prior year, which represented a 240 basis point increase as a percentage of net revenue. Our marketing costs in fiscal year 2013 included lower advertising expense compared to fiscal year 2012 from the reduced use of third-party operated Internet sites, which was offset by increased costs in fiscal year 2013 associated with investments in non-Internet branding.
Admissions Advisory
Admissions advisory decreased $38.1 million and $118.6 million, or 15.0% and 31.9%, in fiscal years 2014 and 2013 compared to the respective prior years. This represented an increase as a percentage of net revenue of 10 basis points for fiscal year 2014 compared to the prior year, and a decrease of 190 basis points for fiscal year 2013 compared to the prior year. The decreases in expense were principally attributable to lower headcount due in part to our restructuring activities. During fiscal year 2014, the decrease in expense was partially offset by employee costs attributable to Open Colleges.
General and Administrative
General and administrative decreased $39.0 million, or 11.9%, in fiscal year 2014 compared to the prior year, which represented a 50 basis point increase as a percentage of net revenue. The decrease in expense was primarily attributable to lower costs including rent and compensation due in part to our restructuring activities.
General and administrative decreased $15.0 million, or 4.4%, in fiscal year 2013 compared to the prior year, which represented an 80 basis point increase as a percentage of net revenue. The decrease in expense was principally attributable to lower share-based compensation expense, and a decline in headcount due in part to our restructuring activities. This was partially offset by a $5.0 million retirement bonus in fiscal year 2013.
Depreciation and Amortization
Depreciation and amortization decreased $11.2 million and $16.1 million, or 6.9% and 9.0%, in fiscal years 2014 and 2013 compared to the respective prior years. This represented increases as a percent of net revenue of 60 and 20 basis points, respectively. The decreases in expense were principally attributable to lower depreciation due in part to the decline in depreciable assets resulting from our restructuring activities. During fiscal year 2014, the decrease in expense was partially offset by $10.6 million of intangibles amortization as a result of the Open Colleges and Milpark Education acquisitions.
Provision for Uncollectible Accounts Receivable
Provision for uncollectible accounts receivable decreased $30.0 million and $62.9 million, or 35.8% and 42.9%, in fiscal years 2014 and 2013 compared to the respective prior years. This represented decreases as a percentage of net revenue of 50 and 120 basis points, respectively. The decreases were primarily due to reductions in University of Phoenix gross student receivables from its revenue decline, and process improvements that significantly contributed to lowering the University’s gross student receivables associated with students no longer enrolled in its programs. Additionally, the University’s collection rates have increased due in part to changes in the relative composition of its student receivables including a higher proportion attributable to students in higher degree level programs.
57
Restructuring and Other Charges
The U.S. higher education industry is experiencing unprecedented, rapidly developing changes that challenge many of the core principles underlying the industry. We are reengineering and simplifying our business processes and refining our educational delivery systems to improve the effectiveness of our services to students, and reducing the size of our services infrastructure and associated operating expenses to align with our reduced enrollment and revenue. We have incurred restructuring and other charges associated with these activities beginning in fiscal year 2011 as summarized below:
Year Ended August 31, | Cumulative Costs as of August 31, 2014 | ||||||||||||||
($ in thousands) | 2014 | 2013 | 2012 | ||||||||||||
Lease and related costs, net | $ | 47,279 | $ | 137,263 | $ | 15,981 | $ | 219,590 | |||||||
Severance and other employee separation costs | 33,215 | 32,690 | 12,887 | 82,638 | |||||||||||
Other restructuring related costs | 4,849 | 27,069 | 9,827 | 41,745 | |||||||||||
Restructuring and other charges | $ | 85,343 | $ | 197,022 | $ | 38,695 | $ | 343,973 | |||||||
The following summarizes the restructuring and other charges in our segment reporting format:
Year Ended August 31, | Cumulative Costs as of August 31, 2014 | ||||||||||||||
($ in thousands) | 2014 | 2013 | 2012 | ||||||||||||
University of Phoenix | $ | 61,899 | $ | 158,757 | $ | 20,002 | $ | 263,571 | |||||||
Apollo Global | 6,091 | 6,053 | 5,712 | 17,856 | |||||||||||
Other | 17,353 | 32,212 | 12,981 | 62,546 | |||||||||||
Restructuring and other charges | $ | 85,343 | $ | 197,022 | $ | 38,695 | $ | 343,973 | |||||||
• | Lease and Related Costs, Net - Beginning in fiscal year 2011, University of Phoenix began rationalizing its administrative real estate facilities. In addition to continuing to rationalize its administrative facilities, University of Phoenix began closing 115 of its ground locations during fiscal year 2013. After these closures, the University operates 110 ground campus locations throughout the U.S. and Puerto Rico. However, the University continues to evaluate the extent, functionality and location of its ground facilities because of the rapidly evolving and transformational changes in higher education. |
As of August 31, 2014, University of Phoenix has closed the substantial majority of the total square feet included in the above plan and has recorded $158.3 million of initial aggregate charges representing the estimated fair value of future contractual operating lease obligations. These charges were recorded in the periods we ceased using the respective facilities. We measure lease obligations at fair value using a discounted cash flow approach encompassing significant unobservable inputs (Level 3). The significant unobservable inputs principally include estimated future cash flows and discount rates, which have ranged between 3%-6% for our lease obligations. The estimation of future cash flows includes non-cancelable contractual lease costs over the remaining terms of the leases, partially offset by estimated future sublease rental income, which involves significant judgment. Our estimate of the amount and timing of sublease rental income considers subleases that we have executed and subleases we expect to execute, current commercial real estate market data and conditions, comparable transaction data and qualitative factors specific to the facilities. The estimates will be subject to adjustment as market conditions change or as new information becomes available, including the execution of additional sublease agreements. As of August 31, 2014, we have recorded adjustments to our initial lease obligation liabilities for interest accretion and immaterial adjustments for changes in estimated sublease income.
Lease and related costs, net also includes $7.6 million and $50.1 million of accelerated depreciation during fiscal years 2014 and 2013, respectively, associated with revising the useful lives of the fixed assets at the facilities we are closing through their expected closure dates. Prior to revising the useful lives, we perform a recoverability analysis for the facilities’ fixed assets by comparing the estimated undiscounted cash flows of the locations through their expected closure dates to the carrying amount of the locations’ fixed assets. Based on such analyses, we recorded no impairment charges during fiscal year 2014 and immaterial impairment charges during fiscal year 2013.
• | Severance and Other Employee Separation Costs - Beginning in fiscal year 2011 and continuing through fiscal year 2014, we have implemented workforce reductions as we reengineer and simplify our business processes, refine our educational delivery systems and reduce our operating costs to align with our reduced enrollment and revenue. We incurred severance and other employee separation costs of $33.2 million, $32.7 million and $12.9 million in fiscal years 2014, 2013 and 2012, respectively. These costs are included in the reportable segments in which the respective personnel were employed. |
58
• | Other Restructuring Related Costs - We incurred other restructuring related costs that principally include services from a consulting firm associated with our restructuring activities and fixed asset impairment charges related to software and equipment we are no longer using. The majority of our other restructuring related costs are included in “Other” in our segment reporting because they pertain to all areas of our business. |
Because University of Phoenix has closed the substantial majority of the total square feet included in the above plan as of August 31, 2014, we do not expect to incur material charges related to the remaining square feet to be vacated under the above plan. However, we will incur interest accretion associated with the lease obligations in future periods, and we may incur material charges associated with future restructuring activities as we intend to continue our efforts to streamline operations and improve efficiency.
Due principally to our cost optimization and restructuring activities in recent years, our fiscal year 2014 operating costs decreased by approximately $900 million compared to fiscal year 2012. Approximately 80% of this decrease represents costs that were more fixed in nature, and the remaining decrease represents costs that are more variable in nature resulting from our net revenue decline.
Contingent Consideration Charges and Acquisition Costs
During fiscal year 2014, we recorded $19.8 million of charges associated with changes in the fair value of contingent consideration, and costs associated with our acquisitions. The majority of this expense is attributable to the increase in our estimated Open Colleges’ contingent consideration liability subsequent to the acquisition.
Litigation Charge (Credit)
During fiscal year 2014, we recorded $13.9 million of charges associated with our legal matters. Refer to Note 16, Commitments and Contingencies, in Item 8, Financial Statements and Supplementary Data.
During fiscal year 2013, we recorded a credit of $24.6 million principally resulting from resolution of certain of our legal matters.
During fiscal year 2012, we recorded a $4.7 million charge principally reflecting a rejected settlement offer we made in connection with one of our legal matters.
Goodwill and Other Intangibles Impairment
During fiscal year 2012, we recorded impairment charges of UNIACC’s goodwill and other intangibles of $11.9 million and $4.9 million, respectively.
Provision for Income Taxes
Our effective income tax rate for continuing operations was 36.5%, 41.0% and 42.4% for fiscal years 2014, 2013 and 2012, respectively. For a reconciliation of our effective income tax rate for continuing operations for each fiscal year to the statutory U.S. federal income tax rate, refer to Note 12, Income Taxes, in Item 8, Financial Statements and Supplementary Data.
The decrease in our fiscal year 2014 effective tax rate compared to the prior year was principally attributable to a $10.2 million benefit in fiscal year 2014 from resolution with the Internal Revenue Service related to the deductibility of certain costs for our foreign subsidiaries, and a $2.8 million tax benefit resulting from tax reform in Mexico.
The decrease in our fiscal year 2013 effective tax rate compared to the prior year was principally attributable to the nondeductible UNIACC goodwill and other intangibles impairment recorded in fiscal year 2012 and the recognition of $4.9 million of previously unrecognized tax benefits in fiscal year 2013. This was partially offset by an increase in the impact of foreign losses for which we cannot take a tax benefit on our effective tax rate.
(Loss) Income from Discontinued Operations, Net of Tax
Discontinued operations, net of tax for all fiscal years includes the operating results of IPD through the date we sold its assets in the fourth quarter of fiscal year 2014. In addition to IPD’s operating results, fiscal year 2012 includes a $26.7 million gain on sale of BPP’s subsidiary Mander Portman Woodward and its operating results through the date of sale in fiscal year 2012. Refer to Note 3, Discontinued Operations, in Item 8, Financial Statements and Supplementary Data.
Net Loss (Income) Attributable to Noncontrolling Interests
The change during fiscal year 2014 compared to the prior year was principally attributable to the noncontrolling interest in Open Colleges’ operating results. The change in fiscal year 2013 compared to the prior year was attributable to our purchase of the noncontrolling interest in Apollo Global during fiscal year 2013.
59
Analysis of Operating Results by Reportable Segment
The following details our operating results by reportable segment for the respective periods:
Year Ended August 31, | 2014 versus 2013 | 2013 versus 2012 | |||||||||||||||||||||||
($ in thousands) | 2014 | 2013 | 2012 | $ Change | % Change | $ Change | % Change | ||||||||||||||||||
Net revenue | |||||||||||||||||||||||||
University of Phoenix | $ | 2,632,949 | $ | 3,304,464 | $ | 3,873,098 | $ | (671,515 | ) | (20.3 | )% | $ | (568,634 | ) | (14.7 | )% | |||||||||
Apollo Global | 338,008 | 275,768 | 269,541 | 62,240 | 22.6 | % | 6,227 | 2.3 | % | ||||||||||||||||
Other | 53,221 | 55,692 | 50,551 | (2,471 | ) | (4.4 | )% | 5,141 | 10.2 | % | |||||||||||||||
Net revenue | $ | 3,024,178 | $ | 3,635,924 | $ | 4,193,190 | $ | (611,746 | ) | (16.8 | )% | $ | (557,266 | ) | (13.3 | )% | |||||||||
Operating income (loss) | |||||||||||||||||||||||||
University of Phoenix | $ | 488,217 | $ | 579,670 | $ | 846,840 | $ | (91,453 | ) | (15.8 | )% | $ | (267,170 | ) | (31.5 | )% | |||||||||
Apollo Global | (74,189 | ) | (59,936 | ) | (66,964 | ) | (14,253 | ) | (23.8 | )% | 7,028 | 10.5 | % | ||||||||||||
Other | (75,057 | ) | (85,342 | ) | (103,508 | ) | 10,285 | 12.1 | % | 18,166 | 17.6 | % | |||||||||||||
Operating income | $ | 338,971 | $ | 434,392 | $ | 676,368 | $ | (95,421 | ) | (22.0 | )% | $ | (241,976 | ) | (35.8 | )% | |||||||||
University of Phoenix
University of Phoenix’s net revenue decreased $671.5 million and $568.6 million, or 20.3% and 14.7%, in fiscal years 2014 and 2013 compared to the respective prior years. The decreases were principally attributable to lower enrollment. During fiscal years 2014 and 2013, we increased our use of discounts, grants and scholarships to attract students and reward persistence, which reduced net revenue compared to the respective prior years. The revenue decline in fiscal year 2013 compared to the prior year was partially offset by selective tuition price and other fee increases implemented in July 2012 that were generally in the range of 3-5%.
As discussed in the Overview of this MD&A, University of Phoenix began emphasizing the distinctiveness of its eight colleges to more effectively address the specific needs of the students and employers they serve. As one result of this transition, the University is evaluating pricing on a programmatic basis and determined changes were appropriate for a number of its programs. Accordingly, the University announced selective changes, including increasing and decreasing prices on a program by program basis, effective during the first quarter of fiscal year 2015. Future net revenue will be impacted by these and other pricing changes, enrollment and student mix within programs, and discounts, grants and scholarships.
The following details University of Phoenix student enrollment for the respective periods:
Average Degreed Enrollment(1), (2) | Aggregate New Degreed Enrollment(1), (3) | |||||||||||||||||||||||||||||
(Rounded to the nearest hundred) | Year Ended August 31, | % Change | Year Ended August 31, | % Change | ||||||||||||||||||||||||||
2014 | 2013 | 2012 | 2014-2013 | 2013-2012 | 2014 | 2013 | 2012 | 2014-2013 | 2013-2012 | |||||||||||||||||||||
Students | 251,500 | 301,100 | 356,900 | (16.5 | )% | (15.6 | )% | 146,700 | 172,900 | 216,700 | (15.2 | )% | (20.2 | )% | ||||||||||||||||
(1) Refer to Item 1, Business, for definitions of Degreed Enrollment and New Degreed Enrollment.
(2) Represents the average of quarterly Degreed Enrollment from the beginning to the end of the respective fiscal years.
(3) Represents the sum of the four quarters of New Degreed Enrollment in the respective fiscal years.
University of Phoenix Average Degreed Enrollment decreased 16.5% and 15.6%, in fiscal years 2014 and 2013 compared to the respective prior periods. We believe University of Phoenix enrollment has been adversely impacted by unprecedented, rapidly developing changes and increasing competition in the U.S. higher education industry as further discussed in the Overview of this MD&A. We are working to accelerate the enhancement of our offerings to remain competitive and to more effectively deliver a quality student experience at the right value. Certain of our initiatives under consideration could adversely impact our operating results, especially in the short-term.
60
University of Phoenix’s operating income decreased $91.5 million, or 15.8%, in fiscal year 2014 compared to the prior year, and decreased $267.2 million, or 31.5%, in fiscal year 2013 compared to the prior year. The University’s operating margin was 18.5%, 17.5% and 21.9% in the respective fiscal years, and its operating results were impacted by the following:
Year Ended August 31, | |||||||||||
($ in thousands) | 2014 | 2013 | 2012 | ||||||||
Restructuring and other charges | $ | 61,899 | $ | 158,757 | $ | 20,002 | |||||
Litigation (credit) charge | — | (2,751 | ) | 4,725 | |||||||
The decreased operating income in fiscal year 2014 compared to the prior year was principally attributable to lower net revenue. This was partially offset by lower costs including rent and compensation attributable to our restructuring activities, decreases in restructuring charges, lower advertising costs, decreases in faculty and curriculum costs associated with lower enrollment, and a decrease in bad debt expense.
The decreased operating income in fiscal year 2013 compared to the prior year was principally attributable to lower net revenue and increases in restructuring charges. This was partially offset by a decrease in faculty and curriculum costs associated with lower enrollment, a decrease in bad debt expense, and lower costs attributable to our restructuring activities.
Apollo Global
Apollo Global’s net revenue increased $62.2 million and $6.2 million, or 22.6% and 2.3%, in fiscal years 2014 and 2013 compared to the respective prior years. The increase in fiscal year 2014 compared to the prior year was primarily due to Open Colleges and Milpark Education revenue, an increase in enrollment at our other international institutions and the favorable impact of foreign exchange rates. The increase in fiscal year 2013 compared to the prior year was principally due to increased enrollment at ULA.
Apollo Global’s operating loss increased $14.3 million in fiscal year 2014 compared to the prior year, and decreased $7.0 million in fiscal year 2013 compared to the prior year. Apollo Global’s operating results include the following during the respective periods:
Year Ended August 31, | |||||||||||
($ in thousands) | 2014 | 2013 | 2012 | ||||||||
Depreciation and amortization | $ | 38,168 | $ | 25,982 | $ | 24,297 | |||||
Contingent consideration charges and acquisition costs | 18,990 | — | — | ||||||||
Restructuring and other charges | 6,091 | 6,053 | 5,712 | ||||||||
Foreign indirect tax assessment (reversal) charge(1) | (11,173 | ) | 10,683 | — | |||||||
Goodwill and other intangibles impairment | — | — | 16,788 | ||||||||
(1) This is included in instructional and student advisory on our Consolidated Statements of Income.
The increased operating loss in fiscal year 2014 compared to the prior year was principally due to costs associated with Apollo Global’s recent acquisitions and the negative near term impact of Open Colleges discussed below. The decreased operating loss in fiscal year 2013 compared to the prior year was primarily due to the goodwill and other intangibles impairment charge in fiscal year 2012, and reduced operating expenses resulting from our restructuring activities.
Open Colleges’ educational offerings generally extend beyond one year and the associated revenue is recognized over the contractual period that students are provided access to complete their program, or the time period it takes students to complete their program, as applicable. However, Open Colleges’ operating costs are period costs that are expensed as incurred and a substantial portion are incurred before, or soon after, the students begin their programs. Accordingly, as a result of Open Colleges’ rapid growth, service model, and cost structure, Apollo Global’s operating results are negatively impacted in the near term. However, these factors do not have the same adverse impact on cash flows generated from Open Colleges. Additionally, Apollo Global’s deferred revenue has increased substantially from approximately $50 million as of August 31, 2013 to $127 million as of August 31, 2014, and we expect this amount to continue to increase, perhaps rapidly, as Open Colleges continues to grow.
Other
Other net revenue decreased $2.5 million and increased $5.1 million in fiscal years 2014 and 2013 compared to the respective prior years. The decrease in fiscal year 2014 was due to lower enrollment at Western International University in part due to the launch of its new strategy at the end of fiscal year 2013. The new strategy has reduced Western International University’s revenue in fiscal year 2014 due to a revised pricing structure that allows prospective students to test the academic experience
61
for a significantly reduced price in their initial courses. The net revenue decrease was partially offset by an increase in Carnegie Learning revenue. The increase in fiscal year 2013 was primarily due to an increase in Carnegie Learning revenue.
Other operating losses decreased $10.3 million in fiscal year 2014 compared to the prior year. The decrease was primarily attributable to reduced operating costs resulting from our restructuring activities and a decrease in restructuring charges. This was partially offset by $23.2 million of litigation credits recorded during the prior year period, and the $13.9 million of litigation charges recorded in fiscal year 2014.
Other operating losses decreased $18.2 million in fiscal year 2013 compared to the prior year. The decrease was principally attributable to the litigation credits in fiscal year 2013 discussed above and reduced operating costs resulting from our restructuring activities. This was partially offset by higher restructuring charges in fiscal year 2013.
Liquidity, Capital Resources, and Financial Position
We believe that our cash and cash equivalents and available liquidity will be adequate to satisfy our working capital and other liquidity requirements associated with our existing operations through at least the next 12 months. We believe that the most strategic uses of our cash resources include investments in initiatives to achieve improvements in student outcomes through the delivery of education that meets employers’ needs, investments in opportunities for targeted growth through new education offerings or programs, expansion of our global operations through acquisitions or other initiatives, and share repurchases.
Although we currently have substantial available liquidity, our ability to access the credit markets and other sources of liquidity, including utilization of our Revolving Credit Facility described below, may be adversely affected if we experience regulatory compliance challenges, including, but not limited to, maintaining a U.S. Department of Education financial responsibility composite score of at least 1.5, reduced availability of Title IV program funding, or other adverse effects on our business from regulatory or legislative changes. Additionally, we believe that due to recent developments in the proprietary education industry, capital has become less accessible to, and more expensive for, proprietary education providers like us. Refer to Part I, Item 1A, Risk Factors - Risks Related to the Highly Regulated Industry in Which We Operate.
Cash and Cash Equivalents, Restricted Cash and Cash Equivalents and Marketable Securities
The substantial majority of our cash and cash equivalents, including restricted cash and cash equivalents, are held by our domestic operations and placed with high-credit-quality financial institutions. The following provides a summary of our cash and cash equivalents, restricted cash and cash equivalents and current marketable securities as of the respective periods:
% of Total Assets at August 31, | ||||||||||||||||
August 31, | % Change | |||||||||||||||
($ in thousands) | 2014 | 2013 | 2014 | 2013 | ||||||||||||
Cash and cash equivalents | $ | 1,228,813 | $ | 1,414,485 | (13.1 | )% | 39.7 | % | 47.2 | % | ||||||
Restricted cash and cash equivalents | 224,135 | 259,174 | (13.5 | )% | 7.2 | % | 8.7 | % | ||||||||
Marketable securities(1) | 187,472 | 105,809 | 77.2 | % | 6.1 | % | 3.5 | % | ||||||||
Total | $ | 1,640,420 | $ | 1,779,468 | (7.8 | )% | 53.0 | % | 59.4 | % | ||||||
(1) Represents current marketable securities. We also have $87.8 million and $43.9 million of long-term marketable securities as of August 31, 2014 and 2013, respectively, that principally includes securities maturing in less than three years.
Cash and cash equivalents (excluding restricted cash) decreased $185.7 million primarily due to $172.7 million of share repurchases, $130.8 million of marketable securities purchases (net of maturities), $119.5 million for acquisitions, $100.7 million of capital expenditures, and $36.7 million of payments on borrowings (net of proceeds from borrowings). These items were partially offset by $375.9 million of cash provided by operations.
We consider the unremitted earnings attributable to certain of our foreign subsidiaries to be permanently reinvested. As of August 31, 2014, the earnings from these operations were not significant.
As of August 31, 2014, we had $132.5 million of money market funds included in cash and restricted cash equivalents that we measure at fair value. Our remaining cash and cash equivalents included in the above table approximate fair value because of the short-term nature of the financial instruments.
Our current marketable securities, which principally include tax-exempt municipal bonds, corporate bonds, time deposits and commercial paper, have original maturities to us greater than three months, and contractual maturities that will occur within one year. During fiscal year 2014, we changed the designation of our marketable securities from held-to-maturity to available-for-sale primarily to provide liquidity flexibility, which represented a change in our intent to hold the securities until maturity. Accordingly, our current marketable securities are measured at fair value as of August 31, 2014, and we have recorded immaterial adjustments in other comprehensive income for the changes in fair value. We determine the fair value of our
62
investments using a market approach with Level 2 observable inputs including quoted prices for similar assets in active markets, or quoted prices for identical or similar assets in markets that are not active. Refer to Note 5, Financial Instruments, in Item 8, Financial Statements and Supplementary Data.
Debt
In fiscal year 2012, we entered into a syndicated $625 million unsecured revolving credit facility (the “Revolving Credit Facility”). The Revolving Credit Facility is used for general corporate purposes, which may include acquisitions and share repurchases. The term is five years and will expire in April 2017. The Revolving Credit Facility may be used for borrowings in certain foreign currencies and letters of credit, in each case up to specified sublimits.
We borrowed $585.0 million and $605.0 million under the Revolving Credit Facility as of August 31, 2014 and 2013, respectively. We also had approximately $24 million and $14 million of outstanding letters of credit under the Revolving Credit Facility as of the respective dates. We repaid the entire amount borrowed under the Revolving Credit Facility subsequent to the respective fiscal year ends. We have classified these borrowings as short-term borrowings and the current portion of long-term debt on our Consolidated Balance Sheets because they were repaid subsequent to the respective fiscal year-ends.
The Revolving Credit Facility fees are determined based on a pricing grid that varies according to our leverage ratio. The Revolving Credit Facility fee ranges from 25 to 40 basis points. Incremental fees for borrowings under the facility generally range from LIBOR + 125 to 185 basis points. The weighted average interest rate on outstanding short-term borrowings under the Revolving Credit Facility at both August 31, 2014 and 2013 was 3.5%.
The Revolving Credit Facility contains various customary representations, covenants and other provisions, including a material adverse event clause and the following financial covenants: maximum leverage ratio, minimum interest and rent expense coverage ratio, and U.S. Department of Education financial responsibility composite score requirements. We were in compliance with all applicable covenants related to the Revolving Credit Facility at August 31, 2014 and 2013.
Other debt principally includes debt at subsidiaries of Apollo Global and the present value of an obligation payable over a 10-year period associated with our purchase of technology in fiscal year 2012. The weighted average interest rate on our outstanding other debt at August 31, 2014 and 2013 was 5.8% and 5.3%, respectively.
The carrying value of our debt, excluding capital leases, approximates fair value based on the nature of our debt, which includes consideration of the portion that is variable-rate.
Cash Flows
Operating Activities
The following provides a summary of our operating cash flows during the respective fiscal years:
Year Ended August 31, | |||||||||||
($ in thousands) | 2014 | 2013 | 2012 | ||||||||
Net income | $ | 204,798 | $ | 248,965 | $ | 417,006 | |||||
Non-cash items | 241,109 | 336,136 | 413,994 | ||||||||
Changes in assets and liabilities, excluding the impact of acquisitions and business dispositions | (70,000 | ) | (107,053 | ) | (279,700 | ) | |||||
Net cash provided by operating activities | $ | 375,907 | $ | 478,048 | $ | 551,300 | |||||
Fiscal Year 2014 - Our non-cash items primarily consisted of $150.6 million of depreciation and amortization, a $53.8 million provision for uncollectible accounts receivable, and $42.8 million of share-based compensation. These items were partially offset by $13.9 million of deferred income taxes. The changes in assets and liabilities, excluding the impact of acquisitions and business dispositions, primarily consisted of a $61.4 million use of cash related to the change in accounts receivable, excluding the provision for uncollectible accounts receivable (see further discussion of accounts receivable below), and a $30.7 million decrease in student deposits principally due to the enrollment decline at University of Phoenix. This was partially offset by a $37.2 million decrease in restricted cash and cash equivalents primarily due to the enrollment decline at University of Phoenix.
We monitor our accounts receivable through a variety of metrics, including days sales outstanding. We calculate our days sales outstanding by determining average daily student revenue based on a rolling twelve month analysis and divide it into the gross student accounts receivable balance as of the end of the period. Excluding accounts receivable and the related net revenue for Apollo Global, our days sales outstanding was flat at 21 days as of August 31, 2014 and 2013, respectively.
63
Fiscal Year 2013 - Our non-cash items primarily consisted of $161.7 million of depreciation and amortization, an $83.8 million provision for uncollectible accounts receivable, $62.3 million of restructuring accelerated depreciation and impairments, and $49.5 million of share-based compensation. These items were partially offset by $29.5 million of deferred income taxes.
The changes in assets and liabilities primarily consisted of a $103.4 million use of cash related to the change in accounts receivable, excluding the provision for uncollectible accounts receivable, and decreases in student deposits and deferred revenue of $52.6 million and $39.1 million, respectively, principally attributable to the enrollment decline at University of Phoenix. This was partially offset by a $59.2 million decrease in restricted cash and cash equivalents primarily due to the enrollment decline at University of Phoenix, and a $54.1 million increase in accrued and other liabilities principally attributable to an increase in our restructuring liabilities.
Fiscal Year 2012 - Our non-cash items primarily consisted of $178.2 million of depreciation and amortization, a $146.7 million provision for uncollectible accounts receivable, $78.7 million of share-based compensation, $21.9 million of deferred income taxes and $16.8 million of goodwill and other intangibles impairments. These items were partially offset by a $26.7 million gain on the sale of BPP’s subsidiary Mander Portman Woodward. The changes in assets and liabilities primarily consisted of the following:
• | a $129.8 million use of cash related to the change in accounts receivable, excluding the provision for uncollectible accounts receivable; |
• | a $123.4 million decrease in accrued and other liabilities principally attributable to our $145.0 million payment to settle a legal matter, which was partially offset by an increase in our restructuring liabilities; and |
• | decreases in student deposits and deferred revenue of $58.7 million and $39.2 million, respectively, principally attributable to the enrollment decline at University of Phoenix. |
The above changes were partially offset by a $61.1 million decrease in restricted cash and cash equivalents principally attributable to the enrollment decline at University of Phoenix.
Investing Activities
The following provides a summary of our investing cash flows during the respective fiscal years:
Year Ended August 31, | |||||||||||
($ in thousands) | 2014 | 2013 | 2012 | ||||||||
Purchases of marketable securities, net | $ | (130,803 | ) | $ | (143,804 | ) | $ | — | |||
Acquisitions, net of cash acquired | (119,454 | ) | — | (73,736 | ) | ||||||
Capital expenditures | (100,666 | ) | (119,348 | ) | (115,187 | ) | |||||
Proceeds from dispositions, net | — | — | 76,434 | ||||||||
Other | 606 | (1,500 | ) | (1,694 | ) | ||||||
Net cash used in investing activities | $ | (350,317 | ) | $ | (264,652 | ) | $ | (114,183 | ) | ||
Fiscal Year 2014 - Cash used in investing activities primarily consisted of $130.8 million of marketable securities purchases (net of maturities), $119.5 million used to acquire Open Colleges and Milpark Education, and $100.7 million used for capital expenditures.
We expect our fiscal year 2015 capital expenditures to be materially consistent with fiscal year 2014.
Fiscal Year 2013 - Cash used in investing activities primarily consisted of $143.8 million used for marketable securities purchases (net of maturities) and $119.3 million used for capital expenditures.
Fiscal Year 2012 - Cash used in investing activities primarily consisted of $115.2 million used for capital expenditures and $73.7 million used to acquire Carnegie Learning. This was partially offset by $76.4 million of proceeds from dispositions, the substantial majority of which relates to our sale of MPW.
64
Financing Activities
The following provides a summary of our financing cash flows during the respective fiscal years:
Year Ended August 31, | |||||||||||
($ in thousands) | 2014 | 2013 | 2012 | ||||||||
Share repurchases | $ | (172,709 | ) | $ | (9,537 | ) | $ | (811,913 | ) | ||
(Payments) proceeds related to borrowings, net | (36,691 | ) | (26,151 | ) | 66,876 | ||||||
Purchase of noncontrolling interests | (893 | ) | (42,500 | ) | — | ||||||
Share reissuances | 1,793 | 3,867 | 11,949 | ||||||||
Other | (2,858 | ) | 17 | 1,150 | |||||||
Net cash used in financing activities | $ | (211,358 | ) | $ | (74,304 | ) | $ | (731,938 | ) | ||
Fiscal Year 2014 - Cash used in financing activities primarily consisted of $172.7 million used for share repurchases and $36.7 million used for payments on borrowings (net of proceeds from borrowings). Share repurchases consisted of $159.7 million used to repurchase 5.4 million shares at a weighted average purchase price of $29.78 per share, and additional repurchases related to tax withholding requirements on restricted stock units.
As of August 31, 2014, $90.3 million remained available under our share repurchase authorization. There is no expiration date on the repurchase authorization and the amount and timing of future share repurchase authorizations and repurchases, if any, will be made as market and business conditions warrant. Repurchases occur at our discretion and may be made on the open market through various methods including but not limited to accelerated share repurchase programs, or in privately negotiated transactions, pursuant to the applicable Securities and Exchange Commission rules, and may include repurchases pursuant to Securities and Exchange Commission Rule 10b5-1 nondiscretionary trading programs.
Fiscal Year 2013 - Cash used in financing activities primarily consisted of $42.5 million used for the purchase of the noncontrolling ownership interest in Apollo Global, $26.2 million used for payments on borrowings (net of proceeds from borrowings), and $9.5 million used for share repurchases related to tax withholding requirements on restricted stock units.
Fiscal Year 2012 - Cash used in financing activities primarily consisted of $811.9 million used for share repurchases. This was partially offset by $66.9 million of proceeds from borrowings (net of payments on borrowings) and $11.9 million of cash received from share reissuances.
Contractual Obligations and Other Commercial Commitments
The following summarizes our contractual obligations and other commercial commitments as of August 31, 2014:
Payments Due by Fiscal Year | |||||||||||||||||||
($ in thousands) | 2015 | 2016-2017 | 2018-2019 | Thereafter | Total | ||||||||||||||
Debt(1) | $ | 594,313 | $ | 23,193 | $ | 7,405 | $ | 5,781 | $ | 630,692 | |||||||||
Operating lease obligations | 171,875 | 273,191 | 178,005 | 296,334 | 919,405 | ||||||||||||||
Capital lease obligations | 17,963 | 15,050 | 1,277 | 611 | 34,901 | ||||||||||||||
Stadium naming rights(2) | 7,339 | 15,344 | 16,279 | 62,458 | 101,420 | ||||||||||||||
Uncertain tax positions(3) | 5,715 | — | — | 9,770 | 15,485 | ||||||||||||||
Other obligations(4) | 46,693 | 62,223 | 3,338 | 3,665 | 115,919 | ||||||||||||||
Total | $ | 843,898 | $ | 389,001 | $ | 206,304 | $ | 378,619 | $ | 1,817,822 | |||||||||
(1) Amounts include expected future interest payments.
(2) Represents an agreement for naming rights to the Glendale, Arizona Sports Complex until 2026.
(3) Represents our liability for unrecognized tax positions, including interest and penalties, with the fiscal year 2015 amount representing the portion we have classified as a current liability as of August 31, 2014. However, we are uncertain as to if or when such amounts may be settled. Refer to Note 12, Income Taxes, in Item 8, Financial Statements and Supplementary Data.
(4) Represents obligations to purchase goods and services that are enforceable and legally binding and principally includes amounts relating to information technology services, marketing and administration services.
In addition to the commitments included in the above table, we have contingent consideration and redeemable noncontrolling interests associated with our our acquisitions. Refer to Note 9, Fair Value Measurements, and Note 13, Shareholders’ Equity and Redeemable Noncontrolling Interests, in Item 8, Financial Statements and Supplementary Data.
We have no other material commercial commitments not described above.
65
Off-Balance Sheet Arrangements
As part of our normal operations, our insurers issue surety bonds for us that are required by various states where we operate. We are obligated to reimburse our insurers for any surety bonds that are paid. As of August 31, 2014, the total face amount of these surety bonds was approximately $36 million. We also had approximately $24 million of outstanding letters of credit as of August 31, 2014, which principally support certain guarantees provided by our subsidiaries as part of our normal operations for which the fair value is not material.
Certain other off-balance sheet obligations, such as operating leases, are included in the Contractual Obligations and Other Commercial Commitments table above.
Item 7A - Quantitative and Qualitative Disclosures about Market Risk
We are exposed to economic risk from inflation, foreign currency exchange rates, and interest rates.
Inflation
Inflation has not had a significant impact on our historical operations.
Foreign Currency Exchange Risk
The substantial majority of our revenue, expense and capital expenditure activities are transacted in U.S. dollars. However, because a portion of our operations consists of activities outside of the U.S., we have transactions in other currencies, primarily the British pound, Australian dollar, South African rand and Mexican peso.
We use the U.S. dollar as our reporting currency. The functional currencies of our foreign subsidiaries are generally the local currencies. Accordingly, our foreign currency exchange risk is related to the following exposure areas:
• | Adjustments resulting from the translation of assets and liabilities of the foreign subsidiaries into U.S. dollars using exchange rates in effect at the balance sheet dates. These translation adjustments are recorded in accumulated other comprehensive loss; |
• | Earnings volatility from the translation of income and expense items of the foreign subsidiaries using an average monthly exchange rate for the respective periods; and |
• | Gains and losses resulting from foreign currency exchange rate changes related to intercompany receivables and payables that are not of a long-term investment nature, as well as gains and losses from foreign currency transactions. These items are recorded in other (loss) income, net on our Consolidated Statements of Income. |
In fiscal year 2014, we recorded $11.7 million of net foreign currency translation gains, net of tax, that are included in other comprehensive income. These gains are primarily the result of the weakening of the U.S. dollar relative to the British pound and Australian dollar. The following outlines our net asset exposure by foreign currency (defined as foreign currency assets less foreign currency liabilities and excluding intercompany balances) denominated in U.S. dollars for foreign currencies in which we have significant assets and/or liabilities as of August 31:
($ in thousands) | 2014 | 2013 | |||||
Australian dollar | $ | 124,262 | $ | — | |||
British pound sterling | 102,909 | 87,784 | |||||
South African rand | 29,629 | — | |||||
Mexican peso | 23,172 | 22,034 | |||||
We generally have not used derivative contracts to hedge foreign currency exchange rate fluctuations.
Interest Rate Risk
Our interest income and interest expense is sensitive to fluctuations in interest rates in the U.S. and certain international countries. Changes in interest rates affect the interest earned on our cash and cash equivalents, restricted cash and cash equivalents, and marketable securities, and the cost associated with our debt.
Interest Income
As of August 31, 2014, we had $1.7 billion of cash and cash equivalents, restricted cash and cash equivalents, and current and noncurrent marketable securities. During fiscal year 2014, our interest rate yields were less than 1%, and we earned interest income of $2.2 million. A reduction in interest rates would not have a material impact on our interest income.
66
Interest Expense
We have exposure to changing interest rates primarily associated with our variable rate debt. As of August 31, 2014, we had $657.1 million of outstanding debt that matures as follows:
($ in thousands) | 2015 | 2016 | 2017 | 2018 | 2019 | Thereafter | Total | ||||||||||||||||||||
Fixed-rate debt(1) | $ | 20,613 | $ | 17,348 | $ | 6,430 | $ | 3,684 | $ | 3,551 | $ | 5,845 | $ | 57,471 | |||||||||||||
Variable-rate debt(1) | 588,893 | 10,732 | — | — | — | — | 599,625 | ||||||||||||||||||||
Total | $ | 609,506 | $ | 28,080 | $ | 6,430 | $ | 3,684 | $ | 3,551 | $ | 5,845 | $ | 657,096 | |||||||||||||
(1) The weighted-average interest rates on our fixed-rate debt and variable-rate debt at August 31, 2014 were 5.1% and 3.6%, respectively.
Subsequent to August 31, 2014, we repaid $585.0 million of our variable rate debt borrowed under the Revolving Credit Facility. Accordingly, we do not believe a change in interest rates would have a material impact on our interest expense.
67
Item 8 - Financial Statements and Supplementary Data
Page | |
68
REPORT OF INDEPENDENT REGISTERED PUBLIC ACCOUNTING FIRM
To the Board of Directors and Shareholders of
Apollo Education Group, Inc. and Subsidiaries
Phoenix, Arizona
We have audited the accompanying consolidated balance sheets of Apollo Education Group, Inc. and subsidiaries (the “Company”) as of August 31, 2014 and 2013, and the related consolidated statements of income, comprehensive income, shareholders’ equity and redeemable noncontrolling interests, and cash flows for each of the three years in the period ended August 31, 2014. These financial statements are the responsibility of the Company’s management. Our responsibility is to express an opinion on these financial statements based on our audits.
We conducted our audits in accordance with the standards of the Public Company Accounting Oversight Board (United States). Those standards require that we plan and perform the audit to obtain reasonable assurance about whether the financial statements are free of material misstatement. An audit includes examining, on a test basis, evidence supporting the amounts and disclosures in the financial statements. An audit also includes assessing the accounting principles used and significant estimates made by management, as well as evaluating the overall financial statement presentation. We believe that our audits provide a reasonable basis for our opinion.
In our opinion, such consolidated financial statements present fairly, in all material respects, the financial position of Apollo Education Group, Inc. and subsidiaries as of August 31, 2014 and 2013, and the results of their operations and their cash flows for each of the three years in the period ended August 31, 2014, in conformity with accounting principles generally accepted in the United States of America.
We have also audited, in accordance with the standards of the Public Company Accounting Oversight Board (United States), the Company’s internal control over financial reporting as of August 31, 2014, based on the criteria established in Internal Control - Integrated Framework (1992) issued by the Committee of Sponsoring Organizations of the Treadway Commission and our report dated October 21, 2014 expressed an unqualified opinion on the Company’s internal control over financial reporting.
/s/ DELOITTE & TOUCHE LLP
Phoenix, Arizona
October 21, 2014
69
APOLLO EDUCATION GROUP, INC. AND SUBSIDIARIES
CONSOLIDATED BALANCE SHEETS
As of August 31, | |||||||
(In thousands) | 2014 | 2013 | |||||
ASSETS | |||||||
Current assets: | |||||||
Cash and cash equivalents | $ | 1,228,813 | $ | 1,414,485 | |||
Restricted cash and cash equivalents | 224,135 | 259,174 | |||||
Marketable securities | 187,472 | 105,809 | |||||
Accounts receivable, net | 225,398 | 215,401 | |||||
Prepaid taxes | 34,006 | 30,359 | |||||
Deferred tax assets | 83,871 | 60,294 | |||||
Other current assets | 58,855 | 64,134 | |||||
Total current assets | 2,042,550 | 2,149,656 | |||||
Marketable securities | 87,811 | 43,941 | |||||
Property and equipment, net | 435,733 | 472,614 | |||||
Goodwill | 259,901 | 103,620 | |||||
Intangible assets, net | 189,365 | 132,192 | |||||
Deferred tax assets | 37,335 | 63,894 | |||||
Other assets | 40,240 | 32,030 | |||||
Total assets | $ | 3,092,935 | $ | 2,997,947 | |||
LIABILITIES, REDEEMABLE NONCONTROLLING INTERESTS AND SHAREHOLDERS’ EQUITY | |||||||
Current liabilities: | |||||||
Short-term borrowings and current portion of long-term debt | $ | 609,506 | $ | 628,050 | |||
Accounts payable | 63,907 | 73,123 | |||||
Student deposits | 280,562 | 309,176 | |||||
Deferred revenue | 225,818 | 213,260 | |||||
Accrued and other current liabilities | 363,607 | 346,706 | |||||
Total current liabilities | 1,543,400 | 1,570,315 | |||||
Long-term debt | 47,590 | 64,004 | |||||
Deferred tax liabilities | 22,674 | 12,177 | |||||
Other long-term liabilities | 233,942 | 233,442 | |||||
Total liabilities | 1,847,606 | 1,879,938 | |||||
Commitments and contingencies | |||||||
Redeemable noncontrolling interests | 64,527 | — | |||||
Shareholders’ equity: | |||||||
Preferred stock, no par value, 1,000 shares authorized; none issued | — | — | |||||
Apollo Class A nonvoting common stock, no par value, 400,000 shares authorized; 188,007 issued as of August 31, 2014 and 2013, and 108,422 and 112,825 outstanding as of August 31, 2014 and 2013, respectively | 103 | 103 | |||||
Apollo Class B voting common stock, no par value, 3,000 shares authorized; 475 issued and outstanding as of August 31, 2014 and 2013 | 1 | 1 | |||||
Additional paid-in capital | — | — | |||||
Apollo Class A treasury stock, at cost, 79,585 and 75,182 shares as of August 31, 2014 and 2013, respectively | (3,936,607 | ) | (3,824,758 | ) | |||
Retained earnings | 5,143,949 | 4,978,815 | |||||
Accumulated other comprehensive loss | (27,320 | ) | (36,563 | ) | |||
Total Apollo shareholders’ equity | 1,180,126 | 1,117,598 | |||||
Noncontrolling interests | 676 | 411 | |||||
Total equity | 1,180,802 | 1,118,009 | |||||
Total liabilities, redeemable noncontrolling interests and shareholders’ equity | $ | 3,092,935 | $ | 2,997,947 | |||
The accompanying notes are an integral part of these consolidated financial statements.
70
APOLLO EDUCATION GROUP, INC. AND SUBSIDIARIES
CONSOLIDATED STATEMENTS OF INCOME
Year Ended August 31, | |||||||||||
(In thousands, except per share data) | 2014 | 2013 | 2012 | ||||||||
Net revenue | $ | 3,024,178 | $ | 3,635,924 | $ | 4,193,190 | |||||
Costs and expenses: | |||||||||||
Instructional and student advisory | 1,301,004 | 1,561,568 | 1,776,596 | ||||||||
Marketing | 557,649 | 641,784 | 641,699 | ||||||||
Admissions advisory | 215,196 | 253,319 | 371,901 | ||||||||
General and administrative | 287,884 | 326,908 | 341,872 | ||||||||
Depreciation and amortization | 150,575 | 161,733 | 177,804 | ||||||||
Provision for uncollectible accounts receivable | 53,819 | 83,798 | 146,742 | ||||||||
Restructuring and other charges | 85,343 | 197,022 | 38,695 | ||||||||
Contingent consideration charges and acquisition costs | 19,837 | — | — | ||||||||
Litigation charge (credit) | 13,900 | (24,600 | ) | 4,725 | |||||||
Goodwill and other intangibles impairment | — | — | 16,788 | ||||||||
Total costs and expenses | 2,685,207 | 3,201,532 | 3,516,822 | ||||||||
Operating income | 338,971 | 434,392 | 676,368 | ||||||||
Interest income | 2,230 | 1,913 | 1,187 | ||||||||
Interest expense | (7,914 | ) | (8,745 | ) | (11,745 | ) | |||||
Other (loss) income, net | (547 | ) | 2,407 | 476 | |||||||
Income from continuing operations before income taxes | 332,740 | 429,967 | 666,286 | ||||||||
Provision for income taxes | (121,324 | ) | (176,457 | ) | (282,779 | ) | |||||
Income from continuing operations | 211,416 | 253,510 | 383,507 | ||||||||
(Loss) income from discontinued operations, net of tax | (6,618 | ) | (4,545 | ) | 33,499 | ||||||
Net income | 204,798 | 248,965 | 417,006 | ||||||||
Net loss (income) attributable to noncontrolling interests | 4,506 | (439 | ) | 5,672 | |||||||
Net income attributable to Apollo | $ | 209,304 | $ | 248,526 | $ | 422,678 | |||||
Earnings (loss) per share - Basic: | |||||||||||
Continuing operations attributable to Apollo | $ | 1.94 | $ | 2.25 | $ | 3.24 | |||||
Discontinued operations attributable to Apollo | (0.06 | ) | (0.05 | ) | 0.24 | ||||||
Basic income per share attributable to Apollo | $ | 1.88 | $ | 2.20 | $ | 3.48 | |||||
Earnings (loss) per share - Diluted: | |||||||||||
Continuing operations attributable to Apollo | $ | 1.92 | $ | 2.23 | $ | 3.22 | |||||
Discontinued operations attributable to Apollo | (0.06 | ) | (0.04 | ) | 0.23 | ||||||
Diluted income per share attributable to Apollo | $ | 1.86 | $ | 2.19 | $ | 3.45 | |||||
Basic weighted average shares outstanding | 111,354 | 112,712 | 121,607 | ||||||||
Diluted weighted average shares outstanding | 112,610 | 113,285 | 122,357 | ||||||||
The accompanying notes are an integral part of these consolidated financial statements.
71
APOLLO EDUCATION GROUP, INC. AND SUBSIDIARIES
CONSOLIDATED STATEMENTS OF COMPREHENSIVE INCOME
Year Ended August 31, | |||||||||||
($ in thousands) | 2014 | 2013 | 2012 | ||||||||
Net income | $ | 204,798 | $ | 248,965 | $ | 417,006 | |||||
Other comprehensive income (loss) (net of tax): | |||||||||||
Currency translation gain (loss)(1) | 11,652 | (2,545 | ) | (8,281 | ) | ||||||
Unrealized gain on available-for-sale securities(1) | 130 | — | — | ||||||||
Comprehensive income | 216,580 | 246,420 | 408,725 | ||||||||
Comprehensive loss attributable to noncontrolling interests | 1,967 | 463 | 7,680 | ||||||||
Comprehensive income attributable to Apollo | $ | 218,547 | $ | 246,883 | $ | 416,405 | |||||
(1) The tax effect on each component of other comprehensive income (loss) during fiscal years 2014, 2013 and 2012 is not significant.
The accompanying notes are an integral part of these consolidated financial statements.
72
APOLLO EDUCATION GROUP, INC. AND SUBSIDIARIES
CONSOLIDATED STATEMENTS OF SHAREHOLDERS’ EQUITY AND REDEEMABLE NONCONTROLLING INTERESTS
Common Stock | Additional Paid-in Capital | Apollo Class A Treasury Stock | Accumulated Other Comprehensive Loss | Total Apollo Shareholders’ Equity | Noncontrolling Interests (Deficit) | ||||||||||||||||||||||||||||||||||||||||||||
Class A Nonvoting | Class B Voting | Retained Earnings | Total Equity | Redeemable Noncontrolling Interests | |||||||||||||||||||||||||||||||||||||||||||||
(In thousands) | Shares | Stated Value | Shares | Stated Value | Shares | Cost | |||||||||||||||||||||||||||||||||||||||||||
Balance as of August 31, 2011 | 188,007 | $ | 103 | 475 | $ | 1 | $ | 68,724 | 58,003 | $ | (3,125,175 | ) | $ | 4,320,472 | $ | (23,761 | ) | $ | 1,240,364 | $ | 3,625 | $ | 1,243,989 | $ | — | ||||||||||||||||||||||||
Share repurchases | — | — | — | — | — | 19,420 | (811,913 | ) | — | — | (811,913 | ) | — | (811,913 | ) | — | |||||||||||||||||||||||||||||||||
Share reissuances | — | — | — | — | (46,527 | ) | (1,184 | ) | 58,476 | — | — | 11,949 | — | 11,949 | — | ||||||||||||||||||||||||||||||||||
Net tax effect for stock incentive plans | — | — | — | — | (7,132 | ) | — | — | — | — | (7,132 | ) | — | (7,132 | ) | — | |||||||||||||||||||||||||||||||||
Share-based compensation | — | — | — | — | 78,705 | — | — | — | — | 78,705 | — | 78,705 | — | ||||||||||||||||||||||||||||||||||||
Currency translation adjustment, net of tax | — | — | — | — | — | — | — | — | (6,273 | ) | (6,273 | ) | (2,008 | ) | (8,281 | ) | — | ||||||||||||||||||||||||||||||||
Net income (loss) | — | — | — | — | — | — | — | 422,678 | — | 422,678 | (5,672 | ) | 417,006 | — | |||||||||||||||||||||||||||||||||||
Balance as of August 31, 2012 | 188,007 | $ | 103 | 475 | $ | 1 | $ | 93,770 | 76,239 | $ | (3,878,612 | ) | $ | 4,743,150 | $ | (30,034 | ) | $ | 928,378 | $ | (4,055 | ) | $ | 924,323 | $ | — | |||||||||||||||||||||||
Share repurchases | — | — | — | — | — | 475 | (9,537 | ) | — | — | (9,537 | ) | — | (9,537 | ) | — | |||||||||||||||||||||||||||||||||
Share reissuances | — | — | — | — | (46,663 | ) | (1,532 | ) | 63,391 | (12,861 | ) | — | 3,867 | — | 3,867 | — | |||||||||||||||||||||||||||||||||
Net tax effect for stock incentive plans | — | — | — | — | (48,026 | ) | — | — | — | — | (48,026 | ) | — | (48,026 | ) | — | |||||||||||||||||||||||||||||||||
Share-based compensation | — | — | — | — | 49,462 | — | — | — | — | 49,462 | — | 49,462 | — | ||||||||||||||||||||||||||||||||||||
Currency translation adjustment, net of tax | — | — | — | — | — | — | — | — | (1,643 | ) | (1,643 | ) | (902 | ) | (2,545 | ) | — | ||||||||||||||||||||||||||||||||
Purchase of noncontrolling interests | — | — | — | — | (48,543 | ) | — | — | — | (4,886 | ) | (53,429 | ) | 4,929 | (48,500 | ) | — | ||||||||||||||||||||||||||||||||
Net income | — | — | — | — | — | — | — | 248,526 | — | 248,526 | 439 | 248,965 | — | ||||||||||||||||||||||||||||||||||||
Balance as of August 31, 2013 | 188,007 | $ | 103 | 475 | $ | 1 | $ | — | 75,182 | $ | (3,824,758 | ) | $ | 4,978,815 | $ | (36,563 | ) | $ | 1,117,598 | $ | 411 | $ | 1,118,009 | $ | — | ||||||||||||||||||||||||
Share repurchases | — | — | — | — | — | 5,834 | (172,709 | ) | — | — | (172,709 | ) | — | (172,709 | ) | — | |||||||||||||||||||||||||||||||||
Share reissuances | — | — | — | — | (28,683 | ) | (1,431 | ) | 60,860 | (30,384 | ) | — | 1,793 | — | 1,793 | — | |||||||||||||||||||||||||||||||||
Net tax effect for stock incentive plans | — | — | — | — | (14,136 | ) | — | — | — | — | (14,136 | ) | — | (14,136 | ) | — | |||||||||||||||||||||||||||||||||
Share-based compensation | — | — | — | — | 42,819 | — | — | — | — | 42,819 | — | 42,819 | — | ||||||||||||||||||||||||||||||||||||
Acquisitions | — | — | — | — | — | — | — | — | — | — | — | — | 53,866 | ||||||||||||||||||||||||||||||||||||
Currency translation adjustment, net of tax | — | — | — | — | — | — | — | — | 9,113 | 9,113 | 106 | 9,219 | 2,433 | ||||||||||||||||||||||||||||||||||||
Unrealized gain on available-for-sale securities | — | — | — | — | — | — | — | — | 130 | 130 | — | 130 | — | ||||||||||||||||||||||||||||||||||||
Redemption value adjustments | — | — | — | — | — | — | — | (13,786 | ) | — | (13,786 | ) | — | (13,786 | ) | 13,786 | |||||||||||||||||||||||||||||||||
Purchase of noncontrolling interests | — | — | — | — | — | — | — | — | — | — | (893 | ) | (893 | ) | — | ||||||||||||||||||||||||||||||||||
Net income (loss) | — | — | — | — | — | — | — | 209,304 | — | 209,304 | 1,052 | 210,356 | (5,558 | ) | |||||||||||||||||||||||||||||||||||
Balance as of August 31, 2014 | 188,007 | $ | 103 | 475 | $ | 1 | $ | — | 79,585 | $ | (3,936,607 | ) | $ | 5,143,949 | $ | (27,320 | ) | $ | 1,180,126 | $ | 676 | $ | 1,180,802 | $ | 64,527 | ||||||||||||||||||||||||
The accompanying notes are an integral part of these consolidated financial statements.
73
APOLLO EDUCATION GROUP, INC. AND SUBSIDIARIES
CONSOLIDATED STATEMENTS OF CASH FLOWS
Year Ended August 31, | |||||||||||
($ in thousands) | 2014 | 2013 | 2012 | ||||||||
Operating activities: | |||||||||||
Net income | $ | 204,798 | $ | 248,965 | $ | 417,006 | |||||
Adjustments to reconcile net income to net cash provided by operating activities: | |||||||||||
Share-based compensation | 42,819 | 49,462 | 78,705 | ||||||||
Excess tax benefits from share-based compensation | (1,285 | ) | (17 | ) | (1,150 | ) | |||||
Depreciation and amortization | 150,575 | 161,733 | 178,234 | ||||||||
Accelerated depreciation and impairments included in restructuring | 7,580 | 62,267 | — | ||||||||
Loss (gain) on asset dispositions and write-offs, net | 556 | 8,190 | (26,678 | ) | |||||||
Goodwill and other intangibles impairment | — | — | 16,788 | ||||||||
Non-cash foreign currency loss (gain), net | 957 | 220 | (497 | ) | |||||||
Provision for uncollectible accounts receivable | 53,819 | 83,798 | 146,742 | ||||||||
Deferred income taxes | (13,912 | ) | (29,517 | ) | 21,850 | ||||||
Changes in assets and liabilities, excluding the impact of acquisitions and business dispositions: | |||||||||||
Restricted cash and cash equivalents | 37,233 | 59,160 | 61,073 | ||||||||
Accounts receivable | (61,435 | ) | (103,369 | ) | (129,773 | ) | |||||
Prepaid taxes | (2,890 | ) | (3,985 | ) | 9,303 | ||||||
Other assets | 6,072 | (19,514 | ) | (11,568 | ) | ||||||
Accounts payable | (11,950 | ) | (1,775 | ) | 12,525 | ||||||
Student deposits | (30,738 | ) | (52,587 | ) | (58,740 | ) | |||||
Deferred revenue | 657 | (39,091 | ) | (39,154 | ) | ||||||
Accrued and other liabilities | (6,949 | ) | 54,108 | (123,366 | ) | ||||||
Net cash provided by operating activities | 375,907 | 478,048 | 551,300 | ||||||||
Investing activities: | |||||||||||
Purchases of property and equipment | (100,666 | ) | (119,348 | ) | (115,187 | ) | |||||
Purchases of marketable securities | (319,079 | ) | (208,878 | ) | — | ||||||
Maturities of marketable securities | 188,276 | 65,074 | — | ||||||||
Acquisitions, net of cash acquired | (119,454 | ) | — | (73,736 | ) | ||||||
Proceeds from dispositions, net | — | — | 76,434 | ||||||||
Other investing activities | 606 | (1,500 | ) | (1,694 | ) | ||||||
Net cash used in investing activities | (350,317 | ) | (264,652 | ) | (114,183 | ) | |||||
Financing activities: | |||||||||||
Payments on borrowings | (627,822 | ) | (636,387 | ) | (562,269 | ) | |||||
Proceeds from borrowings | 591,131 | 610,236 | 629,145 | ||||||||
Share repurchases | (172,709 | ) | (9,537 | ) | (811,913 | ) | |||||
Share reissuances | 1,793 | 3,867 | 11,949 | ||||||||
Purchase of noncontrolling interests | (893 | ) | (42,500 | ) | — | ||||||
Excess tax benefits from share-based compensation | 1,285 | 17 | 1,150 | ||||||||
Other financing activities | (4,143 | ) | — | — | |||||||
Net cash used in financing activities | (211,358 | ) | (74,304 | ) | (731,938 | ) | |||||
Exchange rate effect on cash and cash equivalents | 96 | (982 | ) | (468 | ) | ||||||
Net (decrease) increase in cash and cash equivalents | (185,672 | ) | 138,110 | (295,289 | ) | ||||||
Cash and cash equivalents, beginning of year | 1,414,485 | 1,276,375 | 1,571,664 | ||||||||
Cash and cash equivalents, end of year | $ | 1,228,813 | $ | 1,414,485 | $ | 1,276,375 | |||||
Supplemental disclosure of cash flow and non-cash information: | |||||||||||
Cash paid for income taxes, net of refunds | $ | 161,163 | $ | 201,055 | $ | 246,824 | |||||
Cash paid for interest | 7,657 | 7,869 | 9,794 | ||||||||
Restricted stock units vested and released | 37,430 | 27,054 | 36,182 | ||||||||
Credits received for tenant improvements | 1,131 | 6,049 | 27,009 | ||||||||
Capital lease additions | — | 3,500 | 44,145 | ||||||||
Debt incurred for acquired technology | — | — | 14,389 | ||||||||
The accompanying notes are an integral part of these consolidated financial statements.
74
APOLLO EDUCATION GROUP, INC. AND SUBSIDIARIES
NOTES TO CONSOLIDATED FINANCIAL STATEMENTS
Note 1. Nature of Operations and Significant Accounting Policies
Apollo Education Group, Inc. is one of the world’s largest private education services providers, serving students since 1973. Through our subsidiaries, we offer undergraduate, graduate, professional development and other non-degree educational programs and services, online and on-campus, principally to working learners in the U.S. and abroad. Refer to Note 18, Segment Reporting, for further information regarding our education platforms.
During fiscal year 2014, Apollo changed its name from Apollo Group, Inc. to Apollo Education Group, Inc.
Our fiscal year is from September 1 to August 31. Unless otherwise stated, references to particular years or quarters refer to our fiscal years and the associated quarters of those fiscal years.
Basis of Presentation
These consolidated financial statements have been prepared in accordance with accounting principles generally accepted in the United States of America (“GAAP”).
Use of Estimates
The preparation of financial statements in accordance with GAAP requires management to make certain estimates and assumptions that affect the reported amount of assets and liabilities and the disclosure of contingent assets and liabilities at the date of the financial statements and the reported amount of revenues and expenses during the reporting period. Actual results may differ from these estimates.
Principles of Consolidation
The consolidated financial statements include the assets, liabilities, revenues and expenses of Apollo Education Group, Inc., our wholly-owned subsidiaries, and other subsidiaries that we control. We eliminate intercompany transactions and balances in consolidation.
We record noncontrolling interests in our consolidated financial statements to recognize the noncontrolling ownership interest in our consolidated subsidiaries. A portion of the net income (loss) of such subsidiaries is allocated to our noncontrolling interests generally based on the respective noncontrolling shareholder’s ownership interest in the consolidated subsidiary. Depending on the nature of the noncontrolling interest and the associated rights of the noncontrolling shareholders, we present noncontrolling interests either as a component of equity or separately as redeemable noncontrolling interests on our Consolidated Balance Sheets.
For redeemable noncontrolling interests that are either redeemable or probable of becoming redeemable, we record the noncontrolling interests at the greater of the carrying value or the redemption value at the end of each reporting period. We determine the redemption value by assuming the end of each reporting period is the redemption date. Redemption value adjustments are recorded through retained earnings. Refer to Note 13, Shareholders’ Equity and Redeemable Noncontrolling Interests.
Revenue Recognition
Substantially all of our net revenue is composed of tuition and fees from educational programs that range in length from one-day seminars to degree and non-degree programs lasting multiple years. University of Phoenix represents the substantial majority of our total consolidated net revenue and substantially all of the University’s net revenue is generated from degree programs. University of Phoenix students fund their education through loans and/or grants from U.S. federal financial aid programs established by Title IV of the Higher Education Act and regulations promulgated thereunder (“Title IV”), military benefit programs, tuition assistance from their employers, or personal funds.
Our net revenue generally varies from period to period based on several factors, including the aggregate number of students attending educational programs, the number of programs or classes held during the period, and the tuition price per program. We recognize revenue when persuasive evidence of an arrangement exists, services have been rendered or delivery has occurred, our fee or price to the customer is fixed or determinable, and collectibility is reasonably assured. The following summarizes the components of our net revenue, which are generally consistent on a percentage basis for all periods presented:
• | Tuition and educational services represents approximately 92% of our gross consolidated revenue, and encompasses all educational delivery modalities (i.e., online, on-campus, etc.). We recognize tuition and educational services revenue over the period of instruction as services are delivered to students, which may vary depending on the program structure. Tuition benefits for our employees and their eligible dependents are included in tuition and educational |
75
APOLLO EDUCATION GROUP, INC. AND SUBSIDIARIES
NOTES TO CONSOLIDATED FINANCIAL STATEMENTS
services revenue and instructional and student advisory expenses, and were $32.3 million, $53.4 million and $71.1 million during fiscal years 2014, 2013 and 2012, respectively.
Under University of Phoenix’s non-term academic delivery model, students generally enroll in a program of study encompassing a series of five- to nine-week courses taken consecutively over the length of the program. Students are billed separately for each course when the student first attends a course, resulting in the recording of a receivable from the student and deferred revenue in the amount of the billing. The University generally recognizes revenue evenly over the period of instruction (e.g., five weeks for a five-week course) as services are delivered to the student. For students that participate in the University’s risk-free, three-week program during their first credit-bearing course, the University does not recognize revenue for the risk-free period until students decide to continue beyond the risk-free period, which is when the fees become fixed and determinable. Additionally, the University reassesses collectibility throughout the period revenue is recognized when there are changes in facts or circumstances that indicate collectibility is no longer reasonably assured.
University of Phoenix’s refund policy permits students who attend 60% or less of a course to be eligible for a refund for the portion of the course they did not attend. Accordingly, the University ceases revenue recognition for the remainder of a course if a student withdraws prior to the tuition refund period elapsing, and refunds result in a reduction of deferred revenue in the period that a student withdraws. This refund policy applies to students in most, but not all states, as some states require different policies.
For our Apollo Global operations, tuition revenue is generally recognized over the length of the course and/or program. However, we recognize revenue associated with Open Colleges’ educational offerings over the contract period that students are provided access to complete their online, asynchronous program or the period of time it takes students to complete their program, as applicable. As a result, revenue recognition for Open Colleges’ educational offerings generally extends beyond one year.
• | Educational materials represents approximately 7% of our gross consolidated revenue, and encompasses online course materials delivered to students over the period of instruction and the sale of various books, study texts, course notes, and CDs. We recognize revenue associated with online materials over the period of the related course to correspond with delivery of the materials to students. We recognize revenue for the sale of other educational materials when they have been delivered to and accepted by students or other customers. |
• | Other represents approximately 1% of our gross consolidated revenue, and includes net revenue generated by Carnegie Learning, fees students pay when submitting an enrollment application and non-tuition generating revenues such as renting classroom space. |
• | Discounts reflect reductions in charges for tuition or other fees from our standard rates and include military, corporate, and other employer discounts, along with institutional scholarships, grants and promotions. Discounts are generally recognized over the period of instruction in the same manner as the related revenue to which the discount relates. |
During fiscal year 2014, we began presenting Institute of Professional Development’s (“IPD”) operating results as discontinued operations. Accordingly, IPD’s net revenue is included in discontinued operations on our Consolidated Statements of Income for all periods presented. IPD’s revenue was generated based on fixed fee contracts with IPD client institutions and was recognized in accordance with the terms of the respective agreements as services were provided.
Sales tax collected from students is excluded from net revenue. Collected but unremitted sales tax is included as a liability on our Consolidated Balance Sheets and is not material to our consolidated financial statements.
Allowance for Doubtful Accounts
We reduce our accounts receivable by an allowance for amounts that we expect to be uncollectible. We use estimates that are subjective and require judgment in determining the allowance for doubtful accounts, and estimates may vary depending on the institution or educational program that generated the accounts receivable. In general, our estimates are based on historical collection experience and write-offs, the aging of our receivables, and current trends. Our accounts receivable are written off once the account is deemed to be uncollectible, which typically occurs after outside collection agencies have pursued collection for approximately six months.
For our Title IV eligible institutions, program participation rules determine if we are required to return a portion of the funds to the U.S. Department of Education when a student with Title IV program loans withdraws. We are then entitled to collect these funds from the students, but collection rates for these types of receivables are significantly lower than our collection rates for receivables from students who remain in our educational programs.
76
APOLLO EDUCATION GROUP, INC. AND SUBSIDIARIES
NOTES TO CONSOLIDATED FINANCIAL STATEMENTS
We estimate our allowance for doubtful accounts for University of Phoenix’s receivables using a statistical model that considers a number of factors that we believe impact whether receivables will become uncollectible based on our collections experience. These factors include, but are not limited to, the student’s academic performance and previous college experience as well as other student characteristics such as credit hours earned and method of payment. We also monitor and consider external factors such as changes in the economic and regulatory environment.
We routinely evaluate our estimation methodologies for all our institutions and educational programs for adequacy and modify them as necessary. In doing so, we believe our allowance for doubtful accounts reflects the amount of receivables that will become uncollectible by considering our most recent collections experience, changes in trends and other relevant facts. Refer to Note 6, Accounts Receivable, Net.
Cash and Cash Equivalents
We consider all highly liquid investments with stated maturities of three months or less from the date we purchase the investment to be cash equivalents. Cash and cash equivalents generally include money market funds, bank overnight deposits and time deposits, which are all placed with high-credit-quality financial institutions in the U.S. and internationally. Only a negligible portion of these deposits are insured by the Federal Deposit Insurance Corporation. We have not experienced any losses on our cash and cash equivalents.
Restricted Cash and Cash Equivalents
Restricted cash and cash equivalents primarily represents funds held for students for unbilled educational services that were received from Title IV program funds. As a trustee of these Title IV program funds, we are required to maintain and restrict these funds pursuant to the terms of our program participation agreement with the U.S. Department of Education. Restricted cash and cash equivalents are excluded from cash and cash equivalents on our Consolidated Balance Sheets and Consolidated Statements of Cash Flows. Changes in restricted cash and cash equivalents that represent funds held for students as described above are included in cash flows from operating activities on our Consolidated Statements of Cash Flows because these restricted funds are a core activity of our operations. Our restricted cash and cash equivalents are primarily held in money market funds.
Marketable Securities
We invest our excess cash in instruments that may include tax-exempt municipal bonds, corporate bonds, time deposits, commercial paper, agency bonds and other marketable securities. We present such instruments with original maturities to us greater than three months as marketable securities on our Consolidated Balance Sheets, and we classify our marketable securities as either current or noncurrent based on each instrument’s contractual maturity. Securities with maturities of twelve months or less are classified as current, and securities with maturities greater than twelve months are classified as noncurrent.
We determine the designation of our marketable securities as held-to-maturity or available-for-sale at the time of purchase and reevaluate such designation at the end of each period. Securities are designated as held-to-maturity if we have intent and ability to hold them until maturity, and such securities are reported at amortized cost. If we do not have the intent or ability to hold securities until maturity, they are designated as available-for-sale. Available-for-sale securities are reported at fair value with changes in fair value reflected in shareholders’ equity as a component of accumulated other comprehensive loss. We determine any realized gains or losses on the sale of marketable securities using the specific identification method, and they are included in other (loss) income, net on our Consolidated Statements of Income. Refer to Note 5, Financial Instruments.
Property and Equipment, Net
Property and equipment is recorded at cost less accumulated depreciation. Property and equipment under capital leases, and the related obligation, is recorded at an amount equal to the present value of future minimum lease payments. Buildings, furniture, equipment, and software, including internally developed software, are depreciated using the straight-line method over the estimated useful lives of the related assets, which range from 3 to 40 years. Capital leases, leasehold improvements and tenant improvement allowances are amortized using the straight-line method over the shorter of the lease term or the estimated useful lives of the related assets. Construction in progress, excluding software, is recorded at cost until the corresponding asset is placed into service and depreciation begins. Software is recorded at cost and is amortized once the related asset is ready for its intended use. Maintenance and repairs are expensed as incurred.
We capitalize certain internal software development costs consisting primarily of the direct labor associated with creating the internally developed software. Capitalized costs are amortized using the straight-line method over the estimated lives of the software. Software development projects generally include three stages: the preliminary project stage (all costs expensed as incurred), the application development stage (certain costs capitalized, certain costs expensed as incurred), and the post-implementation/operation stage (all costs expensed as incurred). The costs we capitalize in the application development stage
77
APOLLO EDUCATION GROUP, INC. AND SUBSIDIARIES
NOTES TO CONSOLIDATED FINANCIAL STATEMENTS
primarily include the costs of designing the application, coding, installation of hardware, and testing. Refer to Note 7, Property and Equipment, Net.
Business Combinations
We include the results of operations of businesses we acquire from the date of the respective acquisition. We allocate the purchase price of acquisitions to the assets acquired and liabilities assumed at fair value. The excess of the purchase price of an acquired business over the amount assigned to the assets acquired and liabilities assumed is recorded as goodwill. Transaction costs incurred in connection with business combinations are expensed as incurred.
Goodwill and Intangibles
Goodwill represents the excess of the purchase price of an acquired business over the amount assigned to the assets acquired and liabilities assumed. We allocate assets acquired, including goodwill, and liabilities assumed in business combinations to our respective reporting units. We identify our reporting units by assessing whether the components of our operating segments constitute businesses for which discrete financial information is available and segment management regularly reviews the operating results of those components.
Our intangibles principally include trademarks, technology, regulatory accreditations and designations, course curriculum and customer relationships. We assign indefinite lives to intangibles that we believe have the continued ability to generate cash flows indefinitely; have no legal, regulatory, contractual, economic or other factors limiting the useful life of the respective intangible; and we intend to renew the respective intangible, if applicable, and renewal can be accomplished at little cost. Finite-lived intangibles are amortized on either a straight-line basis or using an accelerated method to reflect the pattern in which the economic benefits of the asset are consumed. The weighted average original useful life of our $74.7 million of finite-lived intangibles as of August 31, 2014 was 5.8 years.
We assess goodwill and indefinite-lived intangibles at least annually for impairment or more frequently if events occur or circumstances change between annual tests that would more likely than not reduce the fair value of the respective reporting unit or indefinite-lived intangible below its carrying amount. We perform our annual indefinite-lived intangibles impairment tests on the same dates that we perform our annual goodwill impairment tests for the respective reporting units. In performing our impairment tests, we first consider the option to assess qualitative factors to determine whether it is more likely than not that the fair value of a reporting unit or intangible, as applicable, is less than its carrying amount. If we conclude that it is more likely than not that the fair value is less than the carrying amount based on our qualitative assessment, or that a qualitative assessment should not be performed, we proceed with the following quantitative impairment tests:
• | Goodwill - We compare the estimated fair value of the reporting unit to the carrying value of its net assets. If the fair value of the reporting unit exceeds the carrying value of the net assets of the reporting unit, goodwill is not impaired. If the carrying value of the net assets of the reporting unit exceeds the fair value of the reporting unit, we perform a hypothetical purchase price allocation to determine the implied fair value of the goodwill and compare it to the carrying value of the goodwill. An impairment loss is recognized to the extent the implied fair value of the goodwill is less than the carrying amount of the goodwill. |
• | Indefinite-lived intangibles - We compare the estimated fair value of the intangible with its carrying value. If the carrying value of the intangible exceeds its fair value, an impairment loss is recognized in the amount of that excess. |
The process of evaluating goodwill and indefinite-lived intangibles for impairment is subjective and requires significant judgment at many points during the analysis. If we elect to perform an optional qualitative analysis, we consider many factors including, but not limited to, general economic conditions, industry and market conditions, our market capitalization, financial performance and key business drivers, long-term operating plans, and potential changes to significant assumptions used in the most recent fair value analysis for either the reporting unit or respective intangible.
When performing a quantitative goodwill or indefinite-lived intangibles impairment test, we determine fair value using an income-based approach, a market-based approach or a combination of both methods. The fair value determination consists primarily of using unobservable inputs under the fair value measurement standards.
If the critical assumptions used in our impairment testing deteriorate or are otherwise adversely impacted, a lower fair value estimate may result. In particular, the goodwill acquired in our recent acquisitions of Open Colleges and Milpark Education was principally attributable to future earnings potential associated with student growth. If these acquired entities do not achieve our forecasts, the goodwill could be impaired in the future.
Refer to Note 8, Goodwill and Intangibles.
78
APOLLO EDUCATION GROUP, INC. AND SUBSIDIARIES
NOTES TO CONSOLIDATED FINANCIAL STATEMENTS
Other Long-Lived Asset Impairments
We evaluate the carrying amount of our other long-lived assets, including property and equipment and finite-lived intangibles, whenever changes in circumstances or events indicate that the value of such assets may not be recoverable. During fiscal year 2013, we recorded $20.4 million of long-lived asset impairments, which includes $12.2 million resulting from our restructuring activities. Refer to Note 2, Restructuring and Other Charges, and Note 7, Property and Equipment, Net.
As of August 31, 2014, we believe the carrying amounts of our remaining other long-lived assets are recoverable and no impairment exists. However, we are continuing to adapt our business to the rapidly developing changes in our industry, and changes to our business or other circumstances could lead to potential impairments in the future.
Leases
We enter into various lease agreements in conducting our business. We evaluate the lease agreement at the inception of the lease to determine whether the lease is an operating or capital lease. Additionally, our lease agreements may contain renewal options, tenant improvement allowances, rent holidays, and/or rent escalation clauses. When such items are included in a lease agreement, we record a deferred rent asset or liability on our Consolidated Balance Sheets and record the rent expense evenly over the term of the lease. Leasehold improvements are reflected under investing activities as purchases of property and equipment on our Consolidated Statements of Cash Flows. Credits received against rent for tenant improvement allowances are reflected as a component of non-cash investing activities on our Consolidated Statements of Cash Flows. For leases with renewal options, we generally record rent expense on a straight-line basis over the initial non-cancelable lease term (in instances where renewal is not reasonably assured). Refer to Note 16, Commitments and Contingencies.
We are also required to make additional payments under lease terms for taxes, insurance, and other operating expenses incurred during the lease period, which are expensed as incurred. Rental deposits are provided for lease agreements that specify payments in advance or deposits held in security that are refundable, less any damages at lease end.
Restructuring and Other Charges
Restructuring and other charges principally consist of non-cancelable lease obligations, severance and other employee separation costs, and other related costs. We recognize restructuring obligations and liabilities for other exit and disposal activities at fair value in the period the liability is incurred. The process of measuring fair value and recognizing the associated liabilities is subjective and requires significant judgment. For our non-cancelable lease obligations, we record the obligation when we terminate the contract in accordance with the contract terms or when we cease using the right conveyed by the contract. Our employee severance costs are expensed on the date we notify the employee, unless the employee must provide future service, in which case the benefits are expensed over the future service period.
We generally estimate the fair value of restructuring obligations using significant unobservable inputs (Level 3) based on the best available information. For non-cancelable lease obligations, the fair value estimate is based on the contractual lease costs over the remaining terms of the leases, partially offset by estimated future sublease rental income. Our estimate of the amount and timing of sublease rental income considers subleases we expect to execute, current commercial real estate market data and conditions, comparable transaction data and qualitative factors specific to the facilities. The estimates are subject to adjustment as market conditions change or as new information becomes available, including the execution of sublease agreements.
Changes to restructuring obligations in periods subsequent to the initial fair value measurement are not measured at fair value. We record a cumulative adjustment resulting from changes in the estimated timing or amount of cash flows associated with restructuring obligations in the period of change using the same discount rate that was initially used to measure the obligation’s fair value. Changes in restructuring obligations resulting from the passage of time are recorded as accretion expense. The adjustments to restructuring obligations, including accretion expense, are included in restructuring and other charges on our Consolidated Statements of Income. Refer to Note 2, Restructuring and Other Charges.
79
APOLLO EDUCATION GROUP, INC. AND SUBSIDIARIES
NOTES TO CONSOLIDATED FINANCIAL STATEMENTS
Loss Contingencies
We are subject to various claims and contingencies including those related to regulation, litigation, business transactions, employee-related matters and taxes, among others. When we become aware of a claim or potential claim, the likelihood of any loss or exposure is assessed. If it is probable that a loss will result and the amount of the loss or range of loss can be reasonably estimated, we record a liability for the loss. The liability recorded includes probable and estimable legal costs incurred to date and future legal costs to the point in the legal matter where we believe a conclusion to the matter will be reached. The liability excludes any anticipated loss recoveries from third parties such as insurers, which we record as a receivable if we determine recovery is probable. If the loss is not probable or the amount of the loss or range of loss cannot be reasonably estimated, we disclose the claim if the likelihood of a potential loss is reasonably possible and the amount of the potential loss could be material. For matters where no loss contingency is recorded, we expense legal fees as incurred. The assessment of the likelihood of a potential loss and the estimation of the amount of a loss or range of loss are subjective and require judgment. Refer to Note 16, Commitments and Contingencies.
Share-Based Compensation
Our outstanding share-based awards principally consist of restricted stock units, performance share awards and stock options, and restricted stock units represent the majority of our share-based compensation expense in recent years. We measure and recognize compensation expense for all share-based awards based on their estimated fair values on the grant date. We record compensation expense, net of forfeitures, for all share-based awards over the requisite service period using the straight-line method for awards with only a service condition, and the graded vesting attribution method for awards with service and performance conditions.
For share-based awards with performance conditions, we measure the fair value of such awards as of the grant date and record expense for our estimate of the number of shares expected to vest. Our estimate of the number of shares that will vest is based on our determination of the probable outcome of the performance condition, which may require considerable judgment. We record a cumulative adjustment to share-based compensation expense in periods that we change our estimate of the number of shares expected to vest. Additionally, we ultimately adjust the expense recognized to reflect the actual vested shares following the resolution of the performance conditions.
We estimate expected forfeitures of share-based awards at the grant date and recognize expense only for those awards expected to vest. We estimate our forfeiture rate based on several factors including historical forfeiture activity, expected future employee turnover, and other qualitative factors. We ultimately adjust this forfeiture assumption to actual forfeitures. Therefore, changes in the forfeiture assumptions do not impact the total amount of expense ultimately recognized over the requisite service period. Rather, different forfeiture assumptions only impact the timing of expense recognition over the requisite service period.
We typically use the Black-Scholes-Merton option pricing model to estimate the fair value of stock options. The Black-Scholes-Merton option pricing model requires us to estimate key assumptions based on both historical information and management judgment regarding market factors and trends. The following represents our key weighted average assumptions for stock options granted in the respective fiscal years:
Year Ended August 31, | |||||||||||
2014 | 2013 | 2012 | |||||||||
Weighted average fair value | $ | 10.24 | $ | 5.84 | $ | 14.10 | |||||
Expected volatility | 44.3 | % | 44.4 | % | 46.6 | % | |||||
Expected term | 4.5 | 3.4 | 4.3 | ||||||||
Risk-free interest rate | 1.4 | % | 0.7 | % | 0.6 | % | |||||
Dividend yield | 0.0 | % | 0.0 | % | 0.0 | % | |||||
We estimate expected volatility based on a weighted average of our historical volatility and the implied volatility of long-lived call options. We estimate the expected term of our stock options based primarily on the vesting period of the awards and historical exercise behavior. For the risk-free interest rate, we use the U.S. constant maturity treasury rates interpolated between the years commensurate with the expected life assumptions. Our dividend yield assumption considers that we have not historically paid dividends and we have no current plan to pay dividends in the near-term.
80
APOLLO EDUCATION GROUP, INC. AND SUBSIDIARIES
NOTES TO CONSOLIDATED FINANCIAL STATEMENTS
Income Taxes
We are subject to the income tax laws of the U.S. and the foreign jurisdictions in which we have significant business operations. These tax laws are complex and subject to different interpretations by the taxpayer and the relevant governmental taxing authorities. As a result, significant judgments and interpretations are required in determining our provision for income taxes and evaluating our uncertain tax positions.
The objectives of accounting for income taxes are to recognize the amount of taxes payable or refundable for the current year and deferred tax liabilities and assets for the future tax consequences of events that have been recognized in an entity’s financial statements or tax returns. Deferred tax assets and liabilities are measured using enacted tax rates in effect for the year in which those temporary differences are expected to be recovered or settled. The effect on deferred tax assets and liabilities of a change in tax rates is recognized in earnings in the period when the new rate is enacted. We record a valuation allowance to reduce deferred tax assets to the amount that we believe is more likely than not to be realized.
We have not provided deferred taxes on unremitted earnings attributable to international subsidiaries that have been considered permanently reinvested. As of August 31, 2014, the earnings from these operations are not significant, but they are expected to increase in the future due to our focus on international expansion, which includes two acquisitions by Apollo Global during fiscal year 2014.
We evaluate and account for uncertain tax positions using a two-step approach. Recognition (step one) occurs when we conclude that a tax position, based solely on its technical merits, is more likely than not to be sustained upon examination. Measurement (step two) determines the amount of benefit that is greater than 50% likely to be realized upon ultimate settlement with a taxing authority that has full knowledge of all relevant information. Derecognition of a tax position that was previously recognized would occur when we subsequently determine that a tax position no longer meets the more likely than not threshold of being sustained. We classify interest and penalties accrued in connection with unrecognized tax benefits as income tax expense on our Consolidated Statements of Income. Our total unrecognized tax benefits, excluding interest and penalties, were $18.4 million and $44.1 million as of August 31, 2014 and 2013, respectively. Refer to Note 12, Income Taxes.
Marketing Costs
We expense marketing costs, the substantial majority of which represents advertising, as incurred.
Earnings per Share
Our outstanding shares consist of Apollo Class A and Class B common stock issued, net of shares held in treasury. Our Articles of Incorporation treat the declaration of dividends on the Class A and Class B common stock in an identical manner. As such, both the Class A and Class B common stock are included in the calculation of our earnings per share. Basic income per share is calculated using the weighted average number of Class A and Class B common shares outstanding during the period.
Diluted income per share is calculated similarly except that it includes the dilutive effect of share-based awards under our stock compensation plans by applying the treasury stock method. Our share-based awards with performance conditions are contingently issuable and are included in the calculation of diluted income per share based on our evaluation of the performance criteria as of the end of the respective period. The amount of any tax benefit to be credited to additional paid-in capital related to our share-based awards, and unrecognized share-based compensation expense is included when applying the treasury stock method in the computation of diluted income per share. Refer to Note 14, Earnings Per Share.
Foreign Currency Translation
We use the U.S. dollar as our reporting currency. The functional currency of our entities operating outside the U.S. is the currency of the primary economic environment in which the entity primarily generates and expends cash, which is generally the local currency. The assets and liabilities of these operations are translated to U.S. dollars using exchange rates in effect at the balance sheet dates. Income and expense items are translated monthly at the average exchange rate for that period. The resulting translation adjustments and the effect of exchange rate changes on intercompany transactions of a long-term investment nature are included in shareholders’ equity as a component of accumulated other comprehensive loss, noncontrolling interests or redeemable noncontrolling interests, as applicable. We report gains and losses from foreign exchange rate changes related to intercompany receivables and payables that are not of a long-term investment nature, as well as gains and losses from foreign currency transactions in other (loss) income, net on our Consolidated Statements of Income. These items represented a net $1.0 million loss, net $0.2 million loss and net $0.5 million gain in fiscal years 2014, 2013 and 2012, respectively.
81
APOLLO EDUCATION GROUP, INC. AND SUBSIDIARIES
NOTES TO CONSOLIDATED FINANCIAL STATEMENTS
Fair Value
The carrying amount of financial assets and liabilities reported on our Consolidated Balance Sheets, including accounts receivable and accounts payable, approximate fair value because of the short-term nature of these financial instruments.
For fair value measurements of assets and liabilities that are recognized or disclosed at fair value, we consider fair value to be an exit price, which represents the amount that would be received to sell an asset or paid to transfer a liability in an orderly transaction between market participants at the measurement date. As such, fair value is a market-based measurement that is determined based on assumptions that market participants would use in pricing an asset or liability. We use valuation techniques to determine fair value consistent with either the market approach, income approach and/or cost approach, and we prioritize the inputs used in our valuation techniques using the following three-tier fair value hierarchy:
• | Level 1 - Observable inputs that reflect quoted prices (unadjusted) in active markets for identical assets and liabilities; |
• | Level 2 - Observable inputs other than quoted prices in active markets for identical assets or liabilities, quoted prices for identical or similar assets or liabilities in markets that are not active, or other inputs that are observable or can be corroborated by observable market data for substantially the full term of the assets or liabilities; and |
• | Level 3 - Unobservable inputs that are supported by little or no market activity. |
We categorize each of our fair value measurements for disclosure purposes in one of the above three levels based on the lowest level input that is significant to the fair value measurement in its entirety. In measuring fair value, our valuation techniques maximize the use of observable inputs and minimize the use of unobservable inputs. We use prices and inputs that are current as of the measurement date, including during periods of market volatility. Therefore, classification of inputs within the hierarchy may change from period to period depending upon the observability of those prices and inputs. Our assessment of the significance of a particular input to the fair value measurement requires judgment, and may affect the fair value of certain assets and liabilities and their placement within the fair value hierarchy. Refer to Note 9, Fair Value Measurements.
Discontinued Operations
If we determine we will not have significant continuing involvement with components that are classified as held for sale or otherwise sold or disposed, the results of operations of these components are presented separately on our Consolidated Statements of Income as (loss) income from discontinued operations, net of tax, in the current and prior periods. The operating results of our discontinued operations only include revenues and costs directly attributable to discontinued operations. Refer to Note 3, Discontinued Operations.
Reclassifications
We reclassified the following during fiscal year 2014 for prior periods to conform to our current presentation:
• | We began presenting share reissuances in the aggregate on our Consolidated Statements of Shareholders’ Equity and Redeemable Noncontrolling Interests, which consists of reissuances attributable to our employee stock purchase plan and our equity compensation plans that were previously reported separately; |
• | We began presenting litigation charge (credit) as a component of the change in accrued and other liabilities on our Consolidated Statements of Cash Flows, which did not impact total cash provided by operating activities; and |
• | As discussed in Note 3, Discontinued Operations, we began presenting Institute for Professional Development’s operating results as discontinued operations on our Consolidated Statements of Income. |
Recent Accounting Pronouncements
In August 2014, the Financial Accounting Standards Board (“FASB”) issued Accounting Standards Update (“ASU”) 2014-15, “Presentation of Financial Statements - Going Concern (Subtopic 205-40): Disclosure of Uncertainties about an Entity’s Ability to Continue as a Going Concern” (“ASU 2014-15”). The standard requires management to evaluate, at each interim and annual reporting period, whether there are conditions or events that raise substantial doubt about the entity’s ability to continue as a going concern within one year after the date the financial statements are issued, and provide related disclosures. ASU 2014-15 is effective for annual periods ending after December 15, 2016, and for annual and interim periods thereafter, and early adoption is permitted. We do not expect to early adopt ASU 2014-15, which will be effective for us for our fiscal year ending August 31, 2017, and we do not believe the standard will have a material impact on our financial statements.
In May 2014, the FASB issued ASU No. 2014-09, “Revenue from Contracts with Customers (Topic 606)” (“ASU 2014-09”). The standard is a comprehensive new revenue recognition model that requires revenue to be recognized in a manner to depict the transfer of goods or services to a customer at an amount that reflects the consideration expected to be received in exchange for those goods or services. ASU 2014-09 is effective for fiscal years, and interim periods within those years, beginning after December 15, 2016, and early adoption is not permitted. Accordingly, the standard is effective for us on September 1, 2017
82
APOLLO EDUCATION GROUP, INC. AND SUBSIDIARIES
NOTES TO CONSOLIDATED FINANCIAL STATEMENTS
using either a full retrospective or a modified retrospective approach. We are currently evaluating which transition approach to use and the impact that the standard will have on our financial statements.
In April 2014, the FASB issued ASU No. 2014-08, “Presentation of Financial Statements (Topic 205) and Property, Plant, and Equipment (Topic 360): Reporting Discontinued Operations and Disclosures of Disposals of Components of an Entity” (“ASU 2014-08”). The standard raises the threshold for a disposal to qualify as a discontinued operation and requires new disclosures of both discontinued operations and certain other disposals that do not meet the definition of a discontinued operation. ASU 2014-08 is effective for fiscal years, and interim periods within those years, beginning on or after December 15, 2014, and early adoption is permitted. We do not expect to early adopt ASU 2014-08, which will be effective for us on September 1, 2015 and will apply to disposals that have not yet been reported in our financial statements as of the adoption date. Accordingly, the standard will not impact our previously reported disposals, and we will evaluate the impact of the standard on any disposals that occur after adoption.
Note 2. Restructuring and Other Charges
The U.S. higher education industry is experiencing unprecedented, rapidly developing changes that challenge many of the core principles underlying the industry. We are reengineering and simplifying our business processes and refining our educational delivery systems to improve the effectiveness of our services to students, and reducing the size of our services infrastructure and associated operating expenses to align with our reduced enrollment and revenue. We have incurred restructuring and other charges associated with these activities beginning in fiscal year 2011 as summarized below:
Year Ended August 31, | Cumulative Costs as of August 31, 2014 | ||||||||||||||
($ in thousands) | 2014 | 2013 | 2012 | ||||||||||||
Lease and related costs, net | $ | 47,279 | $ | 137,263 | $ | 15,981 | $ | 219,590 | |||||||
Severance and other employee separation costs | 33,215 | 32,690 | 12,887 | 82,638 | |||||||||||
Other restructuring related costs | 4,849 | 27,069 | 9,827 | 41,745 | |||||||||||
Restructuring and other charges | $ | 85,343 | $ | 197,022 | $ | 38,695 | $ | 343,973 | |||||||
The following summarizes the restructuring and other charges in our segment reporting format:
Year Ended August 31, | Cumulative Costs as of August 31, 2014 | ||||||||||||||
($ in thousands) | 2014 | 2013 | 2012 | ||||||||||||
University of Phoenix | $ | 61,899 | $ | 158,757 | $ | 20,002 | $ | 263,571 | |||||||
Apollo Global | 6,091 | 6,053 | 5,712 | 17,856 | |||||||||||
Other | 17,353 | 32,212 | 12,981 | 62,546 | |||||||||||
Restructuring and other charges | $ | 85,343 | $ | 197,022 | $ | 38,695 | $ | 343,973 | |||||||
The following details the changes in our restructuring liabilities by type of cost during fiscal years 2014 and 2013:
($ in thousands) | Lease and Related Costs, Net | Severance and Other Employee Separation Costs | Other Restructuring Related Costs | Total | |||||||||||
Balance at August 31, 2012 | $ | 26,024 | $ | 2,998 | $ | 1,411 | $ | 30,433 | |||||||
Restructuring and other charges | 137,263 | 32,690 | 27,069 | 197,022 | |||||||||||
Other(1) | (31,114 | ) | (405 | ) | (12,221 | ) | (43,740 | ) | |||||||
Payments | (28,125 | ) | (27,660 | ) | (8,129 | ) | (63,914 | ) | |||||||
Balance at August 31, 2013(2) | 104,048 | 7,623 | 8,130 | 119,801 | |||||||||||
Restructuring and other charges | 47,279 | 33,215 | 4,849 | 85,343 | |||||||||||
Other(1) | (3,251 | ) | (4,281 | ) | — | (7,532 | ) | ||||||||
Payments | (51,872 | ) | (30,870 | ) | (11,787 | ) | (94,529 | ) | |||||||
Balance at August 31, 2014(2) | $ | 96,204 | $ | 5,687 | $ | 1,192 | $ | 103,083 | |||||||
(1) Other for lease and related costs, net represents $7.6 million and $50.1 million of accelerated depreciation in fiscal years 2014 and 2013, respectively, partially offset by the release of certain associated liabilities such as deferred rent. Other for severance and other employee separation costs primarily represents share-based compensation.
(2) The current portion of our restructuring liabilities was $43.3 million and $55.2 million as of August 31, 2014 and 2013, respectively. These balances are included in accrued and other current liabilities on our Consolidated Balance Sheets and the long-term portion is included in other long-term liabilities. The gross, undiscounted obligation associated with our restructuring liabilities as of August 31, 2014 was approximately $170 million, which principally represents non-cancelable leases that will be paid over the respective lease terms through fiscal year 2023.
• | Lease and Related Costs, Net - Beginning in fiscal year 2011, University of Phoenix began rationalizing its administrative real estate facilities. In addition to continuing to rationalize its administrative facilities, University of Phoenix began closing 115 of its ground locations during fiscal year 2013. After these closures, the University operates 110 ground campus locations throughout the U.S. and Puerto Rico. However, the University continues to evaluate the extent, functionality and location of its ground facilities because of the rapidly evolving and transformational changes in higher education. |
As of August 31, 2014, University of Phoenix has closed the substantial majority of the total square feet included in the above plan and has recorded $158.3 million of initial aggregate charges representing the estimated fair value of future contractual operating lease obligations. These charges were recorded in the periods we ceased using the respective facilities. We measure lease obligations at fair value using a discounted cash flow approach encompassing significant unobservable inputs (Level 3). The significant unobservable inputs principally include estimated future cash flows and discount rates, which have ranged between 3%-6% for our lease obligations. The estimation of future cash flows includes non-cancelable contractual lease costs over the remaining terms of the leases, partially offset by estimated future sublease rental income, which involves significant judgment. Our estimate of the amount and timing of sublease rental income considers subleases that we have executed and subleases we expect to execute, current commercial real estate market data and conditions, comparable transaction data and qualitative factors specific to the facilities. The estimates are subject to adjustment as market conditions change or as new information becomes available, including the execution of additional sublease agreements. As of August 31, 2014, we have recorded adjustments to our initial lease obligation liabilities for interest accretion and immaterial adjustments for changes in estimated sublease income.
Lease and related costs, net also includes $7.6 million and $50.1 million of accelerated depreciation during fiscal years 2014 and 2013, respectively, associated with revising the useful lives of the fixed assets at the facilities we are closing through their expected closure dates. Prior to revising the useful lives, we perform a recoverability analysis for the facilities’ fixed assets by comparing the estimated undiscounted cash flows of the locations through their expected closure dates to the carrying amount of the locations’ fixed assets. Based on such analyses, we recorded no impairment charges during fiscal year 2014 and immaterial impairment charges during fiscal year 2013.
• | Severance and Other Employee Separation Costs - Beginning in fiscal year 2011 and continuing through fiscal year 2014, we have implemented workforce reductions as we reengineer and simplify our business processes, refine our educational delivery systems and reduce our operating costs to align with our reduced enrollment and revenue. We incurred severance and other employee separation costs of $33.2 million, $32.7 million and $12.9 million in fiscal years 2014, 2013 and 2012, respectively. These costs are included in the reportable segments in which the respective personnel were employed. |
83
APOLLO EDUCATION GROUP, INC. AND SUBSIDIARIES
NOTES TO CONSOLIDATED FINANCIAL STATEMENTS
• | Other Restructuring Related Costs - We incurred other restructuring related costs that principally include services from a consulting firm associated with our restructuring activities and fixed asset impairment charges related to software and equipment we are no longer using. The majority of our other restructuring related costs are included in “Other” in our segment reporting because they pertain to all areas of our business. |
Because University of Phoenix has closed the substantial majority of the total square feet included in the above plan as of August 31, 2014, we do not expect to incur material charges related to the remaining square feet to be vacated under the above plan. However, we will incur interest accretion associated with the lease obligations in future periods, and we may incur material charges associated with future restructuring activities as we intend to continue our efforts to streamline operations and improve efficiency.
Note 3. Discontinued Operations
During the fourth quarter of fiscal year 2014, we sold the assets of our subsidiary Institute for Professional Development (“IPD”) for $4 million. IPD had insignificant assets and liabilities as of the date of sale and as a result, we realized an immaterial gain on sale during the fourth quarter of fiscal year 2014. We sold IPD because its business was no longer consistent with our long-term strategic objectives due to recent operating losses and limitations on our ability to further develop and expand the domestic business.
During fiscal year 2012, BPP completed the sale of its subsidiary Mander Portman Woodward (“MPW”), a U.K.-based secondary education institution for £54.8 million (equivalent to $85.3 million as of the date of sale). We realized a $26.7 million gain on the sale, net of transaction costs, in fiscal year 2012, with no tax expense associated with the gain because it was not taxable under U.K. tax law. The sale of MPW reflects our strategy to focus on the postsecondary education market.
We do not have significant continuing involvement with IPD or MPW after the respective sales. The operating results of the sold businesses and associated gains on sale are presented as discontinued operations on our Consolidated Statements of Income. We determined cash flows from our discontinued operations individually and in the aggregate are not material and are included with cash flows from continuing operations on our Consolidated Statements of Cash Flows. IPD was included in Other in our segment reporting and MPW was included in our Apollo Global reportable segment.
The following summarizes the operating results for our discontinued operations for the respective periods, which are presented in (loss) income from discontinued operations, net of tax on our Consolidated Statements of Income:
Year Ended August 31, | |||||||||||
($ in thousands) | 2014 | 2013 | 2012 | ||||||||
Net revenue | $ | 22,901 | $ | 45,386 | $ | 84,356 | |||||
Gain on sale | 809 | — | 26,678 | ||||||||
Costs and other | (35,163 | ) | (52,364 | ) | (74,772 | ) | |||||
(Loss) income from discontinued operations before income taxes | (11,453 | ) | (6,978 | ) | 36,262 | ||||||
Benefit from (provision for) income taxes(1) | 4,835 | 2,433 | (2,763 | ) | |||||||
(Loss) income from discontinued operations, net of tax | (6,618 | ) | (4,545 | ) | 33,499 | ||||||
Income from discontinued operations, net of tax, attributable to noncontrolling interests(2) | — | — | (4,871 | ) | |||||||
(Loss) income from discontinued operations, net of tax, attributable to Apollo | $ | (6,618 | ) | $ | (4,545 | ) | $ | 28,628 | |||
(1) There was no tax expense associated with the gain on sale of MPW as discussed above.
(2) The noncontrolling interest represents the portion of MPW’s operating results attributable to Apollo Global’s former noncontrolling shareholder.
The operating results of our discontinued operations only include revenues and costs directly attributable to the discontinued operations. Accordingly, no interest expense or general corporate overhead have been allocated to our discontinued operations. IPD and MPW did not meet the held for sale criteria until the respective periods they were sold.
84
APOLLO EDUCATION GROUP, INC. AND SUBSIDIARIES
NOTES TO CONSOLIDATED FINANCIAL STATEMENTS
Note 4. Acquisitions
Fiscal Year 2014 Acquisitions
On May 20, 2014, Apollo Global acquired an 81% consolidated interest in Milpark Education, a provider of education and training to adult learners in South Africa, for approximately ZAR 265 million (approximated $26 million on the transaction date). This acquisition, along with the Open Colleges acquisition described below, provides access to new markets and supports our strategy to diversify and expand our global operations.
On December 20, 2013, Apollo Global acquired 70% of the outstanding shares of Open Colleges, a provider of education and training to adult learners in Australia. We paid A$110.3 million (equivalent to $98.1 million on the transaction date), plus contingent consideration of up to A$52.5 million (equivalent to $49.0 million as of August 31, 2014) that was principally based on Open Colleges’ operating results for its fiscal year ended June 30, 2014 as defined in the acquisition agreement. On the acquisition date, we estimated the fair value of the contingent consideration to be $21.4 million using a discounted cash flow valuation method encompassing significant unobservable inputs. The inputs included estimated operating results for the performance period, probability weightings assigned to the operating results scenarios and the discount rate applied. Based on Open Colleges’ operating results for the performance period, we paid A$37.8 million (equivalent to $35.2 million as of August 31, 2014) in the first quarter of fiscal year 2015 to settle the contingent consideration. For further discussion of the contingent consideration, refer to Note 9, Fair Value Measurements.
We also have the option to buy the remaining noncontrolling interests associated with the above acquisitions, and the noncontrolling shareholders have the option to sell their shares to us. The options are exercisable in the third quarter of our fiscal year 2016 for Milpark Education and in early calendar 2017 for Open Colleges, or earlier in limited circumstances for both acquisitions. The price for the options is based on a formula specified at the respective acquisition dates and is principally based on a multiple of the respective acquired entity’s operating results as defined in the acquisition agreements. There is no minimum or maximum price for these options. Since the options are embedded in the shares owned by the respective noncontrolling shareholders and the shareholders have the option to redeem their shares, we have classified both of the noncontrolling interests as redeemable equity on our Consolidated Balance Sheets. Refer to Note 13, Shareholders’ Equity and Redeemable Noncontrolling Interests.
We incurred transaction costs of $0.7 million and $3.6 million for the Milpark Education and Open Colleges acquisitions, respectively, and these costs are included in contingent consideration charges and acquisition costs on our Consolidated Statements of Income. We accounted for the acquisitions as business combinations and allocated the purchase price to the assets acquired and liabilities assumed at fair value as summarized below:
Milpark Education | Open Colleges | ||||||||||
Purchase Price Allocation ($ in thousands) | Weighted Average Useful Life (Years) | Purchase Price Allocation ($ in thousands) | Weighted Average Useful Life (Years) | ||||||||
Net working capital deficit(1) | $ | (307 | ) | $ | (10,979 | ) | |||||
Property and equipment | 518 | 2,684 | |||||||||
Intangibles: | |||||||||||
Course designations | — | 20,652 | 5.0 | ||||||||
Trademarks | 5,778 | Indefinite | 17,919 | 10.0 | |||||||
Course curriculum | 1,203 | 2.0 | 15,790 | 4.0 | |||||||
Customer relationships | 2,149 | 2.5 | 5,238 | 1.0 | |||||||
Accreditation | 1,270 | Indefinite | 976 | 4.0 | |||||||
Goodwill | 22,227 | 127,656 | |||||||||
Deferred taxes, net(1) | (2,818 | ) | (9,279 | ) | |||||||
Total assets acquired and liabilities assumed | 30,020 | 170,657 | |||||||||
Less: Fair value of redeemable noncontrolling interests | (2,669 | ) | (51,197 | ) | |||||||
Total fair value of consideration transferred | 27,351 | 119,460 | |||||||||
Less: Fair value of contingent consideration | — | (21,371 | ) | ||||||||
Less: Cash acquired | (2,834 | ) | (3,152 | ) | |||||||
Cash paid for acquisition, net of cash acquired | $ | 24,517 | $ | 94,937 | |||||||
(1) Net working capital deficit and deferred taxes, net include approximately $6 million and $33 million of assumed liabilities related to the Milpark Education and Open Colleges acquisitions, respectively.
85
APOLLO EDUCATION GROUP, INC. AND SUBSIDIARIES
NOTES TO CONSOLIDATED FINANCIAL STATEMENTS
We determined the fair value of assets acquired, liabilities assumed and the redeemable noncontrolling interests based on assumptions that reasonable market participants would use while employing the concept of highest and best use of the respective items. We used the following assumptions, the majority of which include significant unobservable inputs, and valuation methodologies to determine fair value:
• | Intangibles - We used income approaches to value the substantial majority of the acquired intangibles. The course designations and trademarks for both acquisitions and the course curriculum for Open Colleges were valued using the relief-from-royalty method, which represents the benefit of owning these intangible assets rather than paying royalties for their use. The remaining intangibles were valued using the excess earnings method, cost savings method, or replacement cost approach. |
• | Deferred revenue - Deferred revenue is included in net working capital deficit in the above table. We estimated the fair value of deferred revenue using the cost build-up method, which represents the cost to deliver the services, plus a normal profit margin. |
• | Other assets and liabilities - The carrying value of all other assets and liabilities approximated fair value at the time of acquisition. |
• | Redeemable noncontrolling interests - We estimated the fair value of the redeemable noncontrolling interests principally as the noncontrolling ownership percentage of the implied fair value of each acquired entity as a whole. We reduced the fair value of the Milpark Education noncontrolling interest for certain discounts including lack of control. Based on the terms of the Open Colleges acquisition, including the structure of the redemption options held by the noncontrolling shareholders and our future operating plans for the entity, we did not apply a discount to the fair value of the noncontrolling interest. |
We recorded $22.2 million and $127.7 million of goodwill as a result of the Milpark Education and Open Colleges acquisitions, respectively, both of which are not expected to be deductible for tax purposes. The goodwill for both acquisitions is principally attributable to the future earnings potential associated with student growth and other intangibles that do not qualify for separate recognition such as the assembled workforce. The goodwill is included in our Apollo Global reportable segment and we have selected a July 1 annual goodwill impairment test date for both reporting units.
We assigned an indefinite useful life to the acquired Milpark Education trademark and accreditation intangibles as we believe they have the ability to generate cash flows indefinitely. In addition, there are no legal, regulatory, contractual, economic or other factors to limit the intangibles’ useful life and, as applicable, we intend to renew the intangible and renewal can be accomplished at little cost. We determined all of the other acquired intangibles are finite-lived and we are amortizing them on either a straight-line or an accelerated basis that reflects the pattern in which we expect the economic benefits of the assets to be consumed. The weighted average original useful life of the acquired finite-lived intangibles was 2.3 years and 5.9 years for Milpark Education and Open Colleges, respectively. Refer to Note 8, Goodwill and Intangibles, for the estimated future amortization of our finite-lived intangibles.
The operating results of Milpark Education and Open Colleges are included in our consolidated financial statements from the date of each respective acquisition. We have not provided pro forma information or the revenue and operating results of the acquired entities because their results of operations are not material, both individually and in the aggregate, to our consolidated results of operations.
86
APOLLO EDUCATION GROUP, INC. AND SUBSIDIARIES
NOTES TO CONSOLIDATED FINANCIAL STATEMENTS
Fiscal Year 2012 Acquisition
On September 12, 2011, we acquired all of the outstanding stock of Carnegie Learning, a publisher of research-based math curricula and adaptive learning software for a cash purchase price of $75.0 million. We accounted for the Carnegie Learning acquisition as a business combination and Carnegie Learning’s operating results are included in our consolidated financial statements from the date of acquisition. We have not provided pro forma information or the revenue and operating results of Carnegie Learning because its results of operations are not significant to our consolidated results of operations.
The acquisition purchase price allocation is summarized below:
($ in thousands) | |||
Tangible assets (net of acquired liabilities) | $ | (10,894 | ) |
Finite-lived intangibles | 37,000 | ||
Indefinite-lived intangibles | 14,100 | ||
Goodwill | 34,794 | ||
Allocated purchase price | 75,000 | ||
Less: Cash acquired | (1,264 | ) | |
Acquisition, net of cash acquired | $ | 73,736 | |
In a separate transaction completed on the same date, we acquired related technology from Carnegie Mellon University for $21.5 million payable over a 10-year period. We accounted for the technology acquired as an asset purchase. Accordingly, we recorded a $14.4 million asset and corresponding liability representing the present value of the future cash payments on the acquisition date using our incremental borrowing rate. The asset is included in intangible assets, net on our Consolidated Balance Sheets and is being amortized on a straight-line basis over a five-year useful life. The liability is included in debt on our Consolidated Balance Sheets and is being accreted over the 10-year period, with the accretion recorded in interest expense on our Consolidated Statements of Income.
87
APOLLO EDUCATION GROUP, INC. AND SUBSIDIARIES
NOTES TO CONSOLIDATED FINANCIAL STATEMENTS
Note 5. Financial Instruments
We invest our excess cash in a variety of marketable securities. During fiscal year 2014, we changed the designation of our marketable securities from held-to-maturity to available-for-sale primarily to provide liquidity flexibility, which represented a change in our intent to hold the securities until maturity. Accordingly, we recorded a $0.2 million gain through other comprehensive income to adjust the securities from amortized cost to fair value. Unrealized gains and losses have been insignificant for all periods presented principally because of the short term nature of our debt securities.
The following summarizes our cash and cash equivalents, restricted cash and cash equivalents and marketable securities by significant financial instrument category as of the respective periods:
August 31, 2014 | |||||||||||||||||||||||||||
($ in thousands) | Amortized Cost | Unrealized Gains | Unrealized Losses | Fair Value | Cash and Cash Equivalents(1) | Current Marketable Securities(2) | Noncurrent Marketable Securities(2) | ||||||||||||||||||||
Cash | $ | 1,295,395 | $ | — | $ | — | $ | 1,295,395 | $ | 1,295,395 | $ | — | $ | — | |||||||||||||
Level 1: | |||||||||||||||||||||||||||
Money market funds | 132,508 | — | — | 132,508 | 132,508 | — | — | ||||||||||||||||||||
Level 2: | |||||||||||||||||||||||||||
Tax-exempt municipal bonds | 106,543 | 155 | (11 | ) | 106,687 | — | 78,443 | 28,244 | |||||||||||||||||||
Corporate bonds | 106,575 | 123 | (52 | ) | 106,646 | — | 56,837 | 49,809 | |||||||||||||||||||
Time deposits | 50,100 | — | — | 50,100 | 25,041 | 25,059 | — | ||||||||||||||||||||
Commercial paper | 11,793 | 1 | — | 11,794 | — | 11,794 | — | ||||||||||||||||||||
Other | 19,155 | 1 | (1 | ) | 19,155 | 4 | 15,339 | 3,812 | |||||||||||||||||||
Level 3: | |||||||||||||||||||||||||||
Auction-rate securities | 5,946 | — | — | 5,946 | — | — | 5,946 | ||||||||||||||||||||
Total | $ | 1,728,015 | $ | 280 | $ | (64 | ) | $ | 1,728,231 | $ | 1,452,948 | $ | 187,472 | $ | 87,811 | ||||||||||||
August 31, 2013 | |||||||||||||||||||||||||||
($ in thousands) | Cash and Cash Equivalents(1) | Current Marketable Securities(2) | Noncurrent Marketable Securities(2) | Total Carrying Value | Unrealized Gains | Unrealized Losses | Fair Value | ||||||||||||||||||||
Cash | $ | 874,074 | $ | — | $ | — | $ | 874,074 | $ | — | $ | — | $ | 874,074 | |||||||||||||
Level 1: | |||||||||||||||||||||||||||
Money market funds | 732,530 | — | — | 732,530 | — | — | 732,530 | ||||||||||||||||||||
Level 2: | |||||||||||||||||||||||||||
Tax-exempt municipal bonds | 2,055 | 69,621 | 24,070 | 95,746 | 19 | (54 | ) | 95,711 | |||||||||||||||||||
Certificates of deposit | 65,000 | 1,200 | — | 66,200 | — | — | 66,200 | ||||||||||||||||||||
Corporate bonds | — | 24,503 | 13,925 | 38,428 | 6 | (40 | ) | 38,394 | |||||||||||||||||||
Commercial paper | — | 9,828 | — | 9,828 | — | — | 9,828 | ||||||||||||||||||||
Other | — | 657 | — | 657 | — | — | 657 | ||||||||||||||||||||
Level 3: | |||||||||||||||||||||||||||
Auction-rate securities | — | — | 5,946 | 5,946 | |||||||||||||||||||||||
Total | $ | 1,673,659 | $ | 105,809 | $ | 43,941 | $ | 1,823,409 | |||||||||||||||||||
(1) Cash and cash equivalents includes restricted cash and cash equivalents.
(2) As described above, we changed the designation of our marketable securities to available-for-sale as of August 31, 2014 and they are reported at fair value. Our held-to-maturity securities at August 31, 2013 are recorded at amortized cost.
88
APOLLO EDUCATION GROUP, INC. AND SUBSIDIARIES
NOTES TO CONSOLIDATED FINANCIAL STATEMENTS
We measure our marketable securities at fair value on a recurring basis as follows:
• | Money market funds - We use Level 1 inputs that primarily consist of real-time quotes for transactions in active exchange markets involving identical assets. |
• | Auction-rate securities - We use a discounted cash flow model encompassing Level 3 significant unobservable inputs such as estimated interest rates, credit spreads, timing and amount of cash flows, credit quality of the underlying securities and illiquidity considerations. There were no changes in the assets measured at fair value on a recurring basis using significant unobservable inputs (Level 3) during fiscal year 2014. |
• | All other securities - We use a market approach with Level 2 observable inputs including quoted prices for similar assets in active markets, or quoted prices for identical or similar assets in markets that are not active. |
Substantially all of our marketable securities have maturities that occur within three years. We may sell certain of our available-for-sale securities prior to their stated maturities for strategic reasons including, but not limited to, investment yield and credit risk management. We have not recognized significant gains or losses related to such sales.
Note 6. Accounts Receivable, Net
Accounts receivable, net consist of the following as of August 31:
($ in thousands) | 2014 | 2013 | |||||
Student accounts receivable | $ | 255,134 | $ | 243,660 | |||
Less allowance for doubtful accounts | (50,145 | ) | (59,744 | ) | |||
Net student accounts receivable | 204,989 | 183,916 | |||||
Other receivables | 20,409 | 31,485 | |||||
Total accounts receivable, net | $ | 225,398 | $ | 215,401 | |||
Student accounts receivable is composed primarily of amounts due related to tuition and educational services. Our student receivables are not collateralized; however, credit risk is reduced as the amount owed by any individual student is small relative to the total student receivables and the customer base is geographically diverse.
The following summarizes the activity in allowance for doubtful accounts for the respective periods:
Year Ended August 31, | |||||||||||
($ in thousands) | 2014 | 2013 | 2012 | ||||||||
Beginning allowance for doubtful accounts | $ | 59,744 | $ | 107,230 | $ | 128,897 | |||||
Provision for uncollectible accounts receivable | 53,819 | 83,798 | 146,742 | ||||||||
Write-offs, net of recoveries | (63,418 | ) | (131,284 | ) | (168,409 | ) | |||||
Ending allowance for doubtful accounts | $ | 50,145 | $ | 59,744 | $ | 107,230 | |||||
Note 7. Property and Equipment, Net
Property and equipment, net consist of the following as of August 31:
($ in thousands) | 2014 | 2013 | |||||
Land | $ | 30,540 | $ | 30,562 | |||
Buildings | 62,970 | 62,852 | |||||
Furniture and equipment | 388,397 | 428,441 | |||||
Leasehold improvements (includes tenant improvement allowances) | 357,645 | 353,548 | |||||
Software | 139,376 | 128,746 | |||||
Internally developed software | 139,325 | 121,137 | |||||
Construction in progress | 40,502 | 52,097 | |||||
Gross property and equipment | 1,158,755 | 1,177,383 | |||||
Accumulated depreciation and amortization | (723,022 | ) | (704,769 | ) | |||
Property and equipment, net | $ | 435,733 | $ | 472,614 | |||
89
APOLLO EDUCATION GROUP, INC. AND SUBSIDIARIES
NOTES TO CONSOLIDATED FINANCIAL STATEMENTS
The following amounts, which are included in the above table, represent capital leases as of August 31:
($ in thousands) | 2014 | 2013 | |||||
Buildings and land | $ | 4,510 | $ | 5,307 | |||
Furniture and equipment | 48,024 | 53,826 | |||||
Software | 14,264 | 14,264 | |||||
Accumulated depreciation and amortization | (42,401 | ) | (33,301 | ) | |||
Capital lease assets, net | $ | 24,397 | $ | 40,096 | |||
Depreciation expense was $135.8 million, $196.7 million and $158.0 million for fiscal years 2014, 2013 and 2012, respectively. For fiscal years 2014 and 2013, depreciation expense includes $7.6 million and $50.1 million, respectively, of accelerated depreciation associated with our restructuring activities that is included in restructuring and other charges on our Consolidated Statements of Income. The remaining depreciation expense in fiscal year 2014 and 2013 and all of the depreciation expense in fiscal year 2012 is included in depreciation and amortization on our Consolidated Statements of Income. Depreciation expense also includes internally developed software depreciation of $20.1 million, $12.1 million and $10.1 million for fiscal years 2014, 2013 and 2012, respectively.
During fiscal year 2013, we recorded $20.4 million of fixed asset impairment charges, which includes $12.2 million resulting from our restructuring activities. Refer to Note 2, Restructuring and Other Charges.
Note 8. Goodwill and Intangibles
The following details changes in the carrying amount of our goodwill by reportable segment during fiscal years 2014 and 2013:
University of Phoenix | Apollo Global | Other | Total | ||||||||||||
($ in thousands) | |||||||||||||||
Goodwill as of August 31, 2012 | $ | 71,812 | $ | 14,642 | $ | 16,891 | $ | 103,345 | |||||||
Currency translation adjustment | — | 275 | — | 275 | |||||||||||
Goodwill as of August 31, 2013 | 71,812 | 14,917 | 16,891 | 103,620 | |||||||||||
Acquisitions(1) | — | 149,883 | — | 149,883 | |||||||||||
Currency translation adjustment | — | 6,398 | — | 6,398 | |||||||||||
Goodwill as of August 31, 2014 | $ | 71,812 | $ | 171,198 | $ | 16,891 | $ | 259,901 | |||||||
(1) Represents goodwill acquired in the Milpark Education and Open Colleges acquisitions. Refer to Note 4, Acquisitions.
The following presents the components of the net carrying amount of our goodwill by reportable segment as of August 31, 2014 and 2013:
University of Phoenix | Apollo Global(1) | Other | Total | ||||||||||||
($ in thousands) | |||||||||||||||
Gross carrying amount(1) | $ | 71,812 | $ | 177,068 | $ | 37,096 | $ | 285,976 | |||||||
Accumulated impairments(1) | — | (8,712 | ) | (20,205 | ) | (28,917 | ) | ||||||||
Foreign currency translation | — | 2,842 | — | 2,842 | |||||||||||
Net carrying amount at August 31, 2014 | $ | 71,812 | $ | 171,198 | $ | 16,891 | $ | 259,901 | |||||||
University of Phoenix | Apollo Global(1) | Other | Total | ||||||||||||
($ in thousands) | |||||||||||||||
Gross carrying amount(1) | $ | 71,812 | $ | 27,185 | $ | 37,096 | $ | 136,093 | |||||||
Accumulated impairments(1) | — | (8,712 | ) | (20,205 | ) | (28,917 | ) | ||||||||
Foreign currency translation | — | (3,556 | ) | — | (3,556 | ) | |||||||||
Net carrying amount at August 31, 2013 | $ | 71,812 | $ | 14,917 | $ | 16,891 | $ | 103,620 | |||||||
(1) We have also recorded $366 million of accumulated impairments associated with our BPP and UNIACC reporting units, both of which did not have any goodwill as of August 31, 2014 and 2013.
90
APOLLO EDUCATION GROUP, INC. AND SUBSIDIARIES
NOTES TO CONSOLIDATED FINANCIAL STATEMENTS
Intangible assets consist of the following as of August 31:
2014 | 2013 | ||||||||||||||||||||||||||||||
($ in thousands) | Gross Carrying Amount | Accumulated Amortization | Effect of Foreign Currency Translation | Net Carrying Amount | Gross Carrying Amount | Accumulated Amortization | Effect of Foreign Currency Translation | Net Carrying Amount | |||||||||||||||||||||||
Software and technology | $ | 42,389 | $ | (25,151 | ) | $ | — | $ | 17,238 | $ | 42,389 | $ | (16,673 | ) | $ | — | $ | 25,716 | |||||||||||||
Accreditations and designations(1) | 21,628 | (3,015 | ) | 1,000 | 19,613 | — | — | — | — | ||||||||||||||||||||||
Trademarks(1) | 17,919 | (1,238 | ) | 907 | 17,588 | — | — | — | — | ||||||||||||||||||||||
Curriculum(1) | 16,993 | (2,933 | ) | 826 | 14,886 | — | — | — | — | ||||||||||||||||||||||
Student and customer relationships(1) | 15,934 | (9,780 | ) | (1,161 | ) | 4,993 | 12,026 | (7,727 | ) | (1,363 | ) | 2,936 | |||||||||||||||||||
Other(1) | 20,891 | (19,909 | ) | (611 | ) | 371 | 20,891 | (18,706 | ) | (777 | ) | 1,408 | |||||||||||||||||||
Total finite-lived intangibles | 135,754 | (62,026 | ) | 961 | 74,689 | 75,306 | (43,106 | ) | (2,140 | ) | 30,060 | ||||||||||||||||||||
Trademarks(1) | 106,514 | — | (68 | ) | 106,446 | 100,736 | — | (5,347 | ) | 95,389 | |||||||||||||||||||||
Accreditations and designations(1) | 8,530 | — | (300 | ) | 8,230 | 7,260 | — | (517 | ) | 6,743 | |||||||||||||||||||||
Total indefinite-lived intangibles | 115,044 | — | (368 | ) | 114,676 | 107,996 | — | (5,864 | ) | 102,132 | |||||||||||||||||||||
Total intangible assets, net | $ | 250,798 | $ | (62,026 | ) | $ | 593 | $ | 189,365 | $ | 183,302 | $ | (43,106 | ) | $ | (8,004 | ) | $ | 132,192 | ||||||||||||
(1) We acquired certain intangibles during fiscal year 2014 as a result of our acquisitions. Refer to Note 4, Acquisitions.
Finite-lived intangibles are amortized on either a straight-line basis or using an accelerated method to reflect the pattern in which the benefits of the asset are consumed. Amortization expense for intangibles for fiscal years 2014, 2013 and 2012 was $22.4 million, $15.1 million and $20.2 million, respectively. The weighted average original useful life of our finite-lived intangibles as of August 31, 2014 was 5.8 years and the estimated future amortization expense of our finite-lived intangibles is as follows:
($ in thousands) | 2015 | 2016 | 2017 | 2018 | 2019 | Thereafter | Total | ||||||||||||||||||||
University of Phoenix | $ | 8,478 | $ | 8,478 | $ | 282 | $ | — | $ | — | $ | — | $ | 17,238 | |||||||||||||
Apollo Global | 14,765 | 11,923 | 10,793 | 7,689 | 3,327 | 8,166 | 56,663 | ||||||||||||||||||||
Other | 764 | 24 | — | — | — | — | 788 | ||||||||||||||||||||
Total estimated future amortization expense(1) | $ | 24,007 | $ | 20,425 | $ | 11,075 | $ | 7,689 | $ | 3,327 | $ | 8,166 | $ | 74,689 | |||||||||||||
(1) The estimated future amortization expense may vary as acquisitions and dispositions occur in the future and as a result of foreign currency translation adjustments.
We completed our fiscal year 2014 annual goodwill and indefinite-lived intangibles impairment tests, as applicable, for our reporting units on the following annual test dates and determined there was no impairment:
• | May 31: University of Phoenix, ULA, UNIACC, Carnegie Learning and Western International University; |
• | July 1: Open Colleges, BPP and Milpark Education; and |
• | August 31: College for Financial Planning. |
During fiscal year 2012, UNIACC was advised by the National Accreditation Commission of Chile that its institutional accreditation would not be renewed and therefore had lapsed. The loss of accreditation reduced new enrollment in UNIACC’s degree programs. Accordingly, we revised our cash flow estimates and UNIACC’s $11.9 million of goodwill and $4.9 million of its intangibles were impaired. We did not record an income tax benefit associated with these charges as UNIACC’s goodwill and other intangibles are not deductible for tax purposes.
91
APOLLO EDUCATION GROUP, INC. AND SUBSIDIARIES
NOTES TO CONSOLIDATED FINANCIAL STATEMENTS
Note 9. Fair Value Measurements
We measure and disclose certain financial instruments at fair value as described in Note 5, Financial Instruments. Liabilities measured at fair value on a recurring basis, all of which are included in other liabilities on our Consolidated Balance Sheets, consist of the following as of August 31, 2014 and 2013:
Fair Value Measurements at Reporting Dates Using | |||||||||||||||
Fair Value as of Respective Reporting Dates | Quoted Prices in Active Markets for Identical Liabilities (Level 1) | Significant Other Observable Inputs (Level 2) | Significant Unobservable Inputs (Level 3) | ||||||||||||
($ in thousands) | |||||||||||||||
Contingent consideration as of August 31, 2014 | $ | 41,893 | $ | — | $ | — | $ | 41,893 | |||||||
Contingent consideration as of August 31, 2013 | $ | 5,277 | $ | — | $ | — | $ | 5,277 | |||||||
Our contingent consideration liabilities are classified within Level 3 and valued using discounted cash flow valuation methods encompassing significant unobservable inputs. The inputs include estimated operating results scenarios for the applicable performance periods, probability weightings assigned to operating results scenarios and the discount rates applied. Our contingent consideration liabilities relate to the following:
• | Open Colleges - As a result of our acquisition of Open Colleges during the second quarter of fiscal year 2014, we had contingent consideration that was principally based on Open Colleges’ operating results for its fiscal year ended June 30, 2014 as defined in the acquisition agreement. Based on information available as of the acquisition date, we initially estimated the fair value of the contingent consideration to be $21.4 million using a discounted cash flow valuation method encompassing significant unobservable inputs. The inputs included estimated operating results for the performance period, probability weightings assigned to the operating results scenarios and the discount rate applied. Based on Open Colleges’ operating results for the performance period, we paid A$37.8 million (equivalent to $35.2 million as of August 31, 2014) in the first quarter of fiscal year 2015 to settle the contingent consideration, which also represents the fair value of the liability as of August 31, 2014. The increase in fair value of the contingent consideration was included in Contingent consideration charges and acquisition costs on our Consolidated Statements of Income during fiscal year 2014. |
• | Apollo Global - As a result of our purchase of the noncontrolling interest in Apollo Global during fiscal year 2013, we have contingent consideration that is based on a portion of Apollo Global’s operating results through the fiscal years ending August 31, 2017. As of August 31, 2014, the estimated fair value for this contingent consideration was $6.7 million. |
We did not change our valuation techniques associated with recurring fair value measurements from prior periods. The following summarizes the changes in liabilities measured at fair value on a recurring basis using significant unobservable inputs (Level 3) for the respective periods:
Year Ended August 31, | |||||||
($ in thousands) | 2014 | 2013 | |||||
Beginning balance | $ | 5,277 | $ | — | |||
Initial contingent consideration at fair value | 21,371 | 6,000 | |||||
Change in fair value included in net income | 13,907 | (723 | ) | ||||
Currency translation adjustment | 1,338 | — | |||||
Ending balance | $ | 41,893 | $ | 5,277 | |||
Liabilities measured at fair value on a nonrecurring basis during fiscal years 2014 and 2013, all of which are included in other liabilities on our Consolidated Balance Sheets, consist of the following:
Fair Value Measurements at Measurement Dates Using | |||||||||||||||||||
($ in thousands) | Fair Value at Measurement Dates | Quoted Prices in Active Markets for Identical Liabilities (Level 1) | Significant Other Observable Inputs (Level 2) | Significant Unobservable Inputs (Level 3) | Losses for Respective Fiscal Years | ||||||||||||||
Fiscal year 2014 restructuring obligations | $ | 34,701 | $ | — | $ | — | $ | 34,701 | $ | 34,701 | |||||||||
Fiscal year 2013 restructuring obligations | $ | 92,151 | $ | — | $ | — | $ | 92,151 | $ | 92,151 | |||||||||
92
APOLLO EDUCATION GROUP, INC. AND SUBSIDIARIES
NOTES TO CONSOLIDATED FINANCIAL STATEMENTS
During fiscal years 2014 and 2013, we recorded $34.7 million and $92.2 million, respectively, of aggregate initial lease and other contract obligations at fair value associated with our restructuring activities. We recorded obligation liabilities on the dates we ceased using the right conveyed by the respective contracts, and we measured the liabilities at fair value using Level 3 inputs included in the valuation method. Refer to Note 2, Restructuring and Other Charges.
Note 10. Accrued and Other Liabilities
Accrued and other current liabilities consist of the following as of August 31:
($ in thousands) | 2014 | 2013 | |||||
Salaries, wages and benefits | $ | 125,165 | $ | 135,553 | |||
Restructuring obligations | 43,339 | 55,191 | |||||
Contingent consideration | 35,239 | — | |||||
Accrued advertising | 33,853 | 45,850 | |||||
Accrued legal and other professional obligations | 33,651 | 31,310 | |||||
Student refunds, grants and scholarships | 20,072 | 7,180 | |||||
Deferred rent and other lease liabilities | 12,384 | 14,001 | |||||
Curriculum materials | 12,069 | 10,764 | |||||
Other | 47,835 | 46,857 | |||||
Total accrued and other current liabilities | $ | 363,607 | $ | 346,706 | |||
Other long-term liabilities consist of the following as of August 31:
($ in thousands) | 2014 | 2013 | |||||
Restructuring obligations | $ | 59,744 | $ | 64,610 | |||
Deferred rent and other lease liabilities | 57,788 | 67,641 | |||||
Deferred revenue | 51,831 | 21,080 | |||||
Deferred gains on sale-leasebacks | 21,641 | 22,894 | |||||
Uncertain tax positions | 9,770 | 33,637 | |||||
Other | 33,168 | 23,580 | |||||
Total other long-term liabilities | $ | 233,942 | $ | 233,442 | |||
Note 11. Debt
Debt and short-term borrowings consist of the following as of August 31:
($ in thousands) | 2014 | 2013 | |||||
Revolving Credit Facility, see terms below | $ | 585,000 | $ | 605,000 | |||
Capital lease obligations | 32,806 | 49,628 | |||||
Other, see terms below | 39,290 | 37,426 | |||||
Total debt | 657,096 | 692,054 | |||||
Less short-term borrowings and current portion of long-term debt | (609,506 | ) | (628,050 | ) | |||
Long-term debt | $ | 47,590 | $ | 64,004 | |||
Aggregate debt maturities for each of the years ended August 31 are as follows:
($ in thousands) | 2015 | 2016 | 2017 | 2018 | 2019 | Thereafter | Total | ||||||||||||||||||||
Debt maturities | $ | 609,506 | $ | 28,080 | $ | 6,430 | $ | 3,684 | $ | 3,551 | $ | 5,845 | $ | 657,096 | |||||||||||||
93
APOLLO EDUCATION GROUP, INC. AND SUBSIDIARIES
NOTES TO CONSOLIDATED FINANCIAL STATEMENTS
In fiscal year 2012, we entered into a syndicated $625 million unsecured revolving credit facility (the “Revolving Credit Facility”). The Revolving Credit Facility is used for general corporate purposes, which may include acquisitions and share repurchases. The term is five years and will expire in April 2017. The Revolving Credit Facility may be used for borrowings in certain foreign currencies and letters of credit, in each case up to specified sublimits.
We borrowed $585.0 million and $605.0 million under the Revolving Credit Facility as of August 31, 2014 and 2013, respectively. We also had approximately $24 million and $14 million of outstanding letters of credit under the Revolving Credit Facility as of the respective dates. We repaid the entire amount borrowed under the Revolving Credit Facility subsequent to the respective fiscal year ends. We have classified these borrowings as short-term borrowings and the current portion of long-term debt on our Consolidated Balance Sheets because they were repaid subsequent to the respective fiscal year-ends.
The Revolving Credit Facility fees are determined based on a pricing grid that varies according to our leverage ratio. The Revolving Credit Facility fee ranges from 25 to 40 basis points. Incremental fees for borrowings under the facility generally range from LIBOR + 125 to 185 basis points. The weighted average interest rate on outstanding short-term borrowings under the Revolving Credit Facility at both August 31, 2014 and 2013 was 3.5%.
The Revolving Credit Facility contains various customary representations, covenants and other provisions, including a material adverse event clause and the following financial covenants: maximum leverage ratio, minimum interest and rent expense coverage ratio, and U.S. Department of Education financial responsibility composite score requirements. We were in compliance with all applicable covenants related to the Revolving Credit Facility at August 31, 2014 and 2013.
Other debt principally includes debt at subsidiaries of Apollo Global and the present value of an obligation payable over a 10-year period associated with our purchase of technology in fiscal year 2012. The weighted average interest rate on our outstanding other debt at August 31, 2014 and 2013 was 5.8% and 5.3%, respectively.
The carrying value of our debt, excluding capital leases, approximates fair value based on the nature of our debt, which includes consideration of the portion that is variable-rate.
Note 12. Income Taxes
Geographic sources of income (loss) from continuing operations before income taxes are as follows for the respective periods:
Year Ended August 31, | |||||||||||
($ in thousands) | 2014 | 2013 | 2012 | ||||||||
United States | $ | 384,146 | $ | 468,738 | $ | 727,965 | |||||
Foreign | (51,406 | ) | (38,771 | ) | (61,679 | ) | |||||
Income from continuing operations before income taxes | $ | 332,740 | $ | 429,967 | $ | 666,286 | |||||
Income tax (expense) benefit consists of the following for the respective periods:
Year Ended August 31, | |||||||||||
($ in thousands) | 2014 | 2013 | 2012 | ||||||||
Current: | |||||||||||
U.S. Federal | $ | (114,997 | ) | $ | (174,020 | ) | $ | (212,113 | ) | ||
State and local | (17,664 | ) | (30,250 | ) | (46,676 | ) | |||||
Foreign | (2,575 | ) | (1,704 | ) | (2,140 | ) | |||||
Total current | (135,236 | ) | (205,974 | ) | (260,929 | ) | |||||
Deferred: | |||||||||||
U.S. Federal | (3,154 | ) | 20,420 | (28,999 | ) | ||||||
State and local | 240 | 3,132 | (1,039 | ) | |||||||
Foreign | 16,826 | 5,965 | 8,188 | ||||||||
Total deferred | 13,912 | 29,517 | (21,850 | ) | |||||||
Provision for income taxes | $ | (121,324 | ) | $ | (176,457 | ) | $ | (282,779 | ) | ||
94
APOLLO EDUCATION GROUP, INC. AND SUBSIDIARIES
NOTES TO CONSOLIDATED FINANCIAL STATEMENTS
The provision for income taxes differs from the tax computed using the statutory U.S. federal income tax rate as a result of the following items for the respective periods:
Year Ended August 31, | ||||||||
2014 | 2013 | 2012 | ||||||
Statutory U.S. federal income tax rate | 35.0 | % | 35.0 | % | 35.0 | % | ||
State income taxes, net of federal benefit | 4.8 | % | 4.3 | % | 4.2 | % | ||
Foreign taxes | 0.9 | % | 2.2 | % | 1.4 | % | ||
Goodwill impairments | — | % | — | % | 0.9 | % | ||
Internal Revenue Service settlement | (3.1 | )% | — | % | — | % | ||
Mexico tax reform | (0.8 | )% | — | % | — | % | ||
Contingent consideration | 1.0 | % | — | % | — | % | ||
Other, net | (1.3 | )% | (0.5 | )% | 0.9 | % | ||
Effective income tax rate | 36.5 | % | 41.0 | % | 42.4 | % | ||
Deferred tax assets and liabilities consist of the following as of August 31:
($ in thousands) | 2014 | 2013 | |||||
Deferred tax assets: | |||||||
Allowance for doubtful accounts | $ | 13,100 | $ | 16,479 | |||
Leasing transactions | 74,528 | 86,946 | |||||
Net operating loss carry-forward | 16,938 | 25,055 | |||||
Share-based compensation | 23,796 | 35,123 | |||||
Deferred revenue | 18,539 | 4,698 | |||||
Other | 62,436 | 47,231 | |||||
Gross deferred tax assets | 209,337 | 215,532 | |||||
Valuation allowance | (21,048 | ) | (17,998 | ) | |||
Deferred tax assets, net of valuation allowance | 188,289 | 197,534 | |||||
Deferred tax liabilities: | |||||||
Fixed assets | 36,149 | 42,485 | |||||
Intangibles | 47,344 | 35,109 | |||||
Other | 6,264 | 7,929 | |||||
Gross deferred tax liabilities | 89,757 | 85,523 | |||||
Net deferred income taxes | $ | 98,532 | $ | 112,011 | |||
The net operating loss carry-forward in the above table represents $23.2 million of U.S. net operating losses that will begin to expire August 31, 2028. We also have $59.6 million of net operating losses in various foreign jurisdictions that do not expire.
As of August 31, 2014 and 2013, we have recorded a valuation allowance related to a portion of our net operating losses and other deferred tax assets of certain of our foreign subsidiaries because it is more likely than not that these deferred tax assets will not be utilized. We have concluded that it is more likely than not that we will ultimately realize the full benefit of our other deferred tax assets principally based on our history of profitable operations.
We have not provided deferred taxes on unremitted earnings attributable to international subsidiaries that have been considered permanently reinvested. As of August 31, 2014, the earnings from these operations are not significant.
95
APOLLO EDUCATION GROUP, INC. AND SUBSIDIARIES
NOTES TO CONSOLIDATED FINANCIAL STATEMENTS
Uncertain Tax Positions
The following summarizes the activity in our unrecognized tax benefits, excluding interest and penalties, for the respective periods:
Year Ended August 31, | |||||||||||
($ in thousands) | 2014 | 2013 | 2012 | ||||||||
Beginning unrecognized tax benefits | $ | 44,057 | $ | 32,207 | $ | 25,811 | |||||
Increases for tax positions taken in the current year | — | 13,095 | 7,708 | ||||||||
Increases for tax positions taken in prior years | 2,214 | 5,953 | 813 | ||||||||
Decreases for settlements with tax authorities | (7,184 | ) | (197 | ) | (733 | ) | |||||
Decreases for tax positions of prior years(1) | (10,541 | ) | (2,635 | ) | — | ||||||
Decreases due to lapse of applicable statutes of limitations | (10,148 | ) | (4,366 | ) | (1,392 | ) | |||||
Ending unrecognized tax benefits | $ | 18,398 | $ | 44,057 | $ | 32,207 | |||||
(1) Fiscal year 2014 includes the $10.2 million tax benefit discussed in Income Tax Audits below.
Our liabilities for unrecognized tax benefits are primarily included in accrued and other current liabilities and other long-term liabilities on our Consolidated Balance Sheets, which also includes $2.2 million and $4.2 million of interest and penalties associated with our unrecognized tax benefits as of August 31, 2014 and 2013, respectively.
We classify interest and penalties related to uncertain tax positions as a component of provision for income taxes on our Consolidated Statements of Income. We recognized a $1.9 million benefit in fiscal year 2014, and expense of $0.1 million and $0.4 million in fiscal years 2013 and 2012, respectively, related to interest and penalties.
Although we cannot predict the timing of resolution with taxing authorities, if any, we believe it is reasonably possible that $13.8 million of our unrecognized tax benefits will be reduced in the next twelve months due to settlement with tax authorities or expiration of the applicable statute of limitations. These unrecognized tax benefits primarily relate to apportionment of service revenues for corporate income tax purposes and deductibility of certain costs of our foreign subsidiaries.
As of August 31, 2014, $10.0 million of our total unrecognized tax benefits would favorably affect our effective tax rate if recognized. If amounts accrued are less than amounts ultimately assessed by the taxing authorities, we would record additional income tax expense.
Income Tax Audits
Our U.S. federal income tax return for fiscal year 2013 is currently open for review by the Internal Revenue Service (“IRS”). During fiscal year 2014, the IRS completed its review of our federal income tax return for fiscal year 2012. In addition, we are participating in the IRS’s Compliance Assurance Process for fiscal years 2014 and 2015, which is a voluntary program in which taxpayers seek to resolve all or most issues with the IRS prior to or soon after filing their U.S. federal income tax returns.
In fiscal year 2014, we settled a matter with the IRS related to the deductibility of certain costs for our foreign subsidiaries in fiscal years 2011 through 2013, which resulted in a $10.2 million tax benefit during fiscal year 2014. In addition, our fiscal year 2011 federal income tax return was closed in connection with this settlement.
In addition to the IRS audits discussed above, we are subject to numerous ongoing audits by state, local and foreign tax authorities with various tax years as early as 2007 that remain subject to examination. Although we believe our tax accruals are reasonable, the final determination of tax returns under review or returns that may be reviewed in the future and any related litigation could result in tax liabilities that materially differ from our historical income tax provisions and accruals.
Note 13. Shareholders’ Equity and Redeemable Noncontrolling Interests
Share Repurchases
Our Board of Directors has authorized us to repurchase outstanding shares of our Class A common stock from time to time depending on market conditions and other considerations. During fiscal year 2013, our Board of Directors authorized an increase in the amount available under our share repurchase program up to an aggregate amount of $250 million, of which $90.3 million remained available as of August 31, 2014. There is no expiration date on the repurchase authorizations and the amount and timing of future share repurchase authorizations and repurchases, if any, will be made as market and business conditions warrant. Repurchases occur at our discretion and may be made on the open market through various methods including but not limited to accelerated share repurchase programs, or in privately negotiated transactions, pursuant to the applicable Securities and Exchange Commission rules, and may include repurchases pursuant to Securities and Exchange Commission Rule 10b5-1 nondiscretionary trading programs.
96
APOLLO EDUCATION GROUP, INC. AND SUBSIDIARIES
NOTES TO CONSOLIDATED FINANCIAL STATEMENTS
We also repurchase shares in connection with tax withholding requirements associated with the release of vested shares of restricted stock units, which do not fall under the repurchase program described above.
The following summarizes our share repurchase activity for the respective periods:
Year Ended August 31, | |||||||||||
(In thousands, except per share data) | 2014 | 2013 | 2012 | ||||||||
Share repurchases under share repurchase program: | |||||||||||
Number of shares repurchased | 5,363 | — | 19,117 | ||||||||
Weighted average purchase price per share | $ | 29.78 | $ | — | $ | 41.82 | |||||
Cost of share repurchases | $ | 159,684 | $ | — | $ | 799,506 | |||||
Share repurchases related to vesting of restricted stock units: | |||||||||||
Number of shares repurchased | 471 | 475 | 303 | ||||||||
Cost of share repurchases | $ | 13,025 | $ | 9,537 | $ | 12,407 | |||||
Share Reissuances
We reissue our Class A common stock from our treasury stock as a result of the release of shares covered by vested restricted stock units, stock option exercises and purchases under our employee stock purchase plan. Share reissuances were as follows for the respective periods:
Year Ended August 31, | ||||||||
(In thousands) | 2014 | 2013 | 2012 | |||||
Number of shares reissued | 1,431 | 1,532 | 1,184 | |||||
Purchase of Noncontrolling Interest in Apollo Global
During fiscal year 2013, we purchased the 14.4% noncontrolling ownership interest in Apollo Global. We paid $42.5 million cash, plus a contingent payment based on a portion of Apollo Global’s operating results through the fiscal years ending August 31, 2017. On the purchase date, we estimated the fair value of the contingent payment to be $6.0 million. Refer to Note 9, Fair Value Measurements, for further discussion of the valuation and subsequent changes in the estimated fair value. We accounted for the purchase as an equity transaction and the following details net income attributable to Apollo and transfers to noncontrolling interest during the respective periods:
Year Ended August 31, | |||||||||||
($ in thousands) | 2014 | 2013 | 2012 | ||||||||
Net income attributable to Apollo | $ | 209,304 | $ | 248,526 | $ | 422,678 | |||||
Transfer to noncontrolling interest: | |||||||||||
Decrease in equity for purchase of noncontrolling interest in Apollo Global(1) | — | (48,543 | ) | — | |||||||
Change from net income attributable to Apollo and transfer to noncontrolling interest | $ | 209,304 | $ | 199,983 | $ | 422,678 | |||||
(1) Represents the difference between the fair value of the consideration paid to purchase the noncontrolling ownership interest in Apollo Global and the carrying amount of the noncontrolling interest acquired, and an adjustment to accumulated other comprehensive loss to reflect the change in Apollo’s proportionate interest.
Redeemable Noncontrolling Interests
During fiscal year 2014, Apollo Global acquired an 81% consolidated interest in Milpark Education and 70% of the outstanding shares of Open Colleges. We also have the option to buy the remaining noncontrolling interests associated with these acquisitions, and the noncontrolling shareholders have the option to sell their shares to us. The options are exercisable in the third quarter of our fiscal year 2016 for Milpark Education and in early calendar year 2017 for Open Colleges, or earlier in limited circumstances for both acquisitions. The price for the options is based on a formula specified at the respective acquisition dates and is principally based on a multiple of the respective acquired entity’s operating results as defined in the acquisition agreements. There is no minimum or maximum price for these options. Since the options are embedded in the shares owned by the respective noncontrolling shareholders and the shareholders have the option to redeem their shares, we have classified both of the noncontrolling interests as redeemable equity on our Consolidated Balance Sheets.
Both of the redeemable noncontrolling interests are probable of becoming redeemable. Accordingly, we record both redeemable noncontrolling interests at the greater of the carrying value or the redemption value at the end of each reporting period. We
97
APOLLO EDUCATION GROUP, INC. AND SUBSIDIARIES
NOTES TO CONSOLIDATED FINANCIAL STATEMENTS
determine the redemption value using the formula specified at each respective acquisition date, and by assuming the end of each reporting period is the redemption date. We record redemption value adjustments through retained earnings.
Accumulated Other Comprehensive Loss
The following summarizes the components of accumulated other comprehensive loss at August 31:
($ in thousands) | 2014 | 2013 | |||||
Foreign currency translation losses | $ | (26,919 | ) | $ | (36,032 | ) | |
Unrealized loss on available-for-sale securities | (401 | ) | (531 | ) | |||
Accumulated other comprehensive loss(1) | $ | (27,320 | ) | $ | (36,563 | ) | |
(1) Accumulated other comprehensive loss is net of insignificant taxes as of August 31, 2014 and 2013.
Note 14. Earnings Per Share
The components of basic and diluted earnings per share are as follows for the respective periods:
Year Ended August 31, | |||||||||||
(In thousands, except per share data) | 2014 | 2013 | 2012 | ||||||||
Numerator: | |||||||||||
Net income attributable to Apollo (basic and diluted) | $ | 209,304 | $ | 248,526 | $ | 422,678 | |||||
Denominator: | |||||||||||
Basic weighted average shares outstanding | 111,354 | 112,712 | 121,607 | ||||||||
Dilutive effect of restricted stock units and performance share awards | 1,116 | 573 | 746 | ||||||||
Dilutive effect of stock options | 140 | — | 4 | ||||||||
Diluted weighted average shares outstanding | 112,610 | 113,285 | 122,357 | ||||||||
Basic income per share attributable to Apollo | $ | 1.88 | $ | 2.20 | $ | 3.48 | |||||
Diluted income per share attributable to Apollo | $ | 1.86 | $ | 2.19 | $ | 3.45 | |||||
Anti-dilutive securities excluded from diluted earnings per share calculation: | |||||||||||
Anti-dilutive restricted stock units and performance share awards outstanding | 39 | 1,449 | 15 | ||||||||
Anti-dilutive stock options outstanding | 2,532 | 7,040 | 8,785 | ||||||||
Note 15. Stock and Savings Plans
401(k) Plan
We sponsor a 401(k) plan for eligible employees which provides them the opportunity to make pre-tax contributions subject to certain restrictions as set forth in the Internal Revenue Code. Upon a participating employee’s completion of one year of service and 1,000 hours worked, we will match, at our discretion, 30% of such employee’s contributions up to the lesser of 15% of their gross compensation or the maximum participant contribution permitted under the Internal Revenue Code. We are also permitted to make additional discretionary contributions for certain eligible employees. Our contributions were $22.9 million, $20.0 million and $13.6 million for fiscal years 2014, 2013 and 2012, respectively.
Employee Stock Purchase Plan
At our discretion, our Third Amended and Restated 1994 Employee Stock Purchase Plan allows eligible employees to purchase shares of our Class A common stock at quarterly intervals through periodic payroll deductions at a price per share equal to 95% of the fair market value on the purchase date. This plan is deemed to be non-compensatory, and accordingly, we do not recognize any share-based compensation expense for shares purchased under the plan.
Share-Based Awards
We currently have outstanding awards under our Amended and Restated 2000 Stock Incentive Plan (“Plan”). Under this Plan, we may grant non-qualified stock options, incentive stock options, stock appreciation rights, restricted stock units, performance share awards (“PSAs”), and other share-based awards covering shares of our Class A common stock to officers, certain employees, and the non-employee members of our Board of Directors. In general, the awards granted under the Plan vest over periods ranging from one to four years and stock options have contractual terms of 10 years or less. Restricted stock units issued under the Plan
98
APOLLO EDUCATION GROUP, INC. AND SUBSIDIARIES
NOTES TO CONSOLIDATED FINANCIAL STATEMENTS
may have both performance-vesting and service-vesting components or service-vesting only. PSAs have both performance-vesting and service-vesting components tied to a defined performance period. The majority of our restricted stock units and PSAs contain rights to receive dividends or dividend equivalents, but these rights are forfeitable and Apollo has not historically issued dividends.
Approximately 28.6 million shares of our Class A common stock have been reserved for issuance over the term of the Plan. The shares may be issued from treasury shares or from authorized but unissued shares of our Class A common stock. As of August 31, 2014, approximately 14.1 million authorized and unissued shares of our Class A common stock were available for issuance under the Plan, including the shares subject to outstanding equity awards.
Under the Plan, the exercise price for stock options may not be less than 100% of the fair market value of our Class A common stock on the date of the grant. The requisite service period for all awards is generally equal to the vesting period.
Restricted Stock Units and PSAs
We granted restricted stock units during fiscal years 2014, 2013 and 2012 with both service-vesting and performance-vesting conditions, and with only service vesting. The vesting period of the restricted stock units granted generally ranges from one to four years. We also granted PSAs during fiscal years 2014, 2013 and 2012 that vest based on performance and service vesting conditions. The level at which the performance condition is attained will determine the actual number of shares of our Class A common stock into which the PSAs will be converted. The conversion percentage generally ranges from 0% up to 300% of the target level based on the performance condition attainment. The award holder will vest in one-third of the shares of our Class A common stock into which their PSAs are so converted for each fiscal year the award holder remains employed during the three year performance period. However, the PSAs will immediately convert into fully-vested shares of our Class A common stock at target level or above upon certain changes in control or ownership. The shares of our Class A common stock into which the PSAs are converted will be issued upon the completion of the applicable performance period.
The following provides a summary of activity for our restricted stock units and PSAs (granted PSAs are assumed to convert into shares of our Class A common stock at the target level):
Restricted Stock Units | Performance Share Awards(1) | ||||||||||||
Number of Shares (in thousands) | Weighted Average Grant Date Fair Value | Number of Shares (in thousands) | Weighted Average Grant Date Fair Value | ||||||||||
Nonvested at August 31, 2011 | 2,932 | $ | 45.78 | 260 | $ | 45.74 | |||||||
Granted | 1,692 | 36.81 | 145 | 37.50 | |||||||||
Vested and released | (905 | ) | 46.97 | — | — | ||||||||
Forfeited | (193 | ) | 47.12 | (6 | ) | 44.89 | |||||||
Nonvested at August 31, 2012 | 3,526 | $ | 41.10 | 399 | $ | 42.76 | |||||||
Granted | 2,301 | 20.10 | 47 | 19.80 | |||||||||
Vested and released | (1,334 | ) | 42.25 | — | — | ||||||||
Forfeited | (527 | ) | 39.99 | (81 | ) | 37.45 | |||||||
Nonvested at August 31, 2013 | 3,966 | $ | 28.68 | 365 | $ | 40.97 | |||||||
Granted | 2,022 | 26.71 | 41 | 26.63 | |||||||||
Vested and released | (1,353 | ) | 33.38 | — | — | ||||||||
Forfeited | (592 | ) | 26.15 | (93 | ) | 38.35 | |||||||
Nonvested at August 31, 2014 | 4,043 | $ | 26.49 | 313 | $ | 39.88 | |||||||
(1) The vesting of PSAs is subject to the achievement of the specified performance goals and the number of common shares that will ultimately be issued is calculated by multiplying the number of performance shares by a payout percentage that generally ranges from 0% up to 300%.
As of August 31, 2014, we have $79.4 million and $1.7 million of total unrecognized share-based compensation cost, net of forfeitures, related to unvested restricted stock units and PSAs, respectively. These costs are expected to be recognized over a weighted average period of 2.9 years. The fair value of restricted stock units that vested during fiscal years 2014, 2013 and 2012 was $45.2 million, $56.4 million and $42.5 million, respectively.
99
APOLLO EDUCATION GROUP, INC. AND SUBSIDIARIES
NOTES TO CONSOLIDATED FINANCIAL STATEMENTS
Stock Options
We have granted stock options during fiscal years 2014, 2013 and 2012 with a service vesting condition that generally ranges from one to four years. The following provides a summary of our stock option activity:
Options Outstanding | ||||||||||||
Number of Shares (in thousands) | Weighted Average Exercise Price per Share | Weighted Average Remaining Contractual Term (Years) | Aggregate Intrinsic Value ($)(1) (in thousands) | |||||||||
Balance at August 31, 2011 | 9,276 | $ | 57.18 | |||||||||
Granted | 176 | 36.89 | ||||||||||
Exercised | (157 | ) | 43.57 | |||||||||
Forfeited, canceled or expired | (736 | ) | 58.53 | |||||||||
Balance at August 31, 2012 | 8,559 | $ | 56.90 | |||||||||
Granted | 945 | 17.95 | ||||||||||
Exercised | — | — | ||||||||||
Forfeited, canceled or expired | (5,381 | ) | 57.69 | |||||||||
Balance at August 31, 2013 | 4,123 | $ | 46.94 | |||||||||
Granted | 713 | 26.70 | ||||||||||
Exercised | (5 | ) | 19.62 | |||||||||
Forfeited, canceled or expired | (1,327 | ) | 60.07 | |||||||||
Balance at August 31, 2014 | 3,504 | $ | 37.89 | 3.06 | $ | 9,926 | ||||||
Vested and expected to vest as of August 31, 2014 | 3,398 | $ | 38.29 | 2.99 | $ | 9,581 | ||||||
Exercisable as of August 31, 2014 | 2,186 | $ | 45.74 | 1.98 | $ | 4,585 | ||||||
Available for future grant as of August 31, 2014 | 5,361 | |||||||||||
(1) Aggregate intrinsic value represents the sum of the differences between our closing stock price of $27.77 on August 31, 2014 and the exercise prices of all of our options with an exercise price less than $27.77.
As of August 31, 2014, we have $10.1 million of total unrecognized share-based compensation cost, net of forfeitures, related to unvested stock options. These costs are expected to be recognized over a weighted average period of 2.6 years. The fair value of stock options that vested during fiscal years 2014, 2013 and 2012 was $7.3 million, $10.6 million, and $22.8 million, respectively.
The following summarizes information related to outstanding and exercisable options at August 31, 2014:
Outstanding | Exercisable | |||||||||||||||
Range of Exercise Prices | Number of Shares (in thousands) | Weighted Average Contractual Life Remaining (Years) | Weighted Average Exercise Price per Share | Number of Shares (in thousands) | Weighted Average Exercise Price per Share | |||||||||||
$16.75 | 600 | 2.53 | $ | 16.75 | 360 | $ | 16.75 | |||||||||
$19.62 to $25.79 | 361 | 4.91 | $ | 20.54 | 81 | $ | 20.11 | |||||||||
$26.74 | 682 | 5.95 | $ | 26.74 | — | $ | — | |||||||||
$33.12 to $42.27 | 778 | 2.27 | $ | 40.29 | 699 | $ | 40.57 | |||||||||
$42.41 to $63.79 | 613 | 1.87 | $ | 53.10 | 576 | $ | 53.46 | |||||||||
$65.26 to $91.20 | 468 | 1.01 | $ | 70.08 | 468 | $ | 70.08 | |||||||||
$169.47 | 2 | 0.66 | $ | 169.47 | 2 | $ | 169.47 | |||||||||
3,504 | 2,186 | |||||||||||||||
100
APOLLO EDUCATION GROUP, INC. AND SUBSIDIARIES
NOTES TO CONSOLIDATED FINANCIAL STATEMENTS
The following summarizes information related to stock options exercised during the respective periods:
Year Ended August 31, | |||||||||||
($ in thousands) | 2014 | 2013 | 2012 | ||||||||
Intrinsic value realized | $ | 79 | $ | — | $ | 1,498 | |||||
Actual tax benefit realized by Apollo for tax deductions | $ | 30 | $ | — | $ | 573 | |||||
Cash received by Apollo | $ | 101 | $ | — | $ | 6,754 | |||||
Refer to Note 1, Nature of Operations and Significant Accounting Policies, for discussion of stock option valuation and related assumptions.
Share-based Compensation Expense
The following details share-based compensation expense for the respective periods:
Year Ended August 31, | |||||||||||
($ in thousands) | 2014 | 2013 | 2012 | ||||||||
Instructional and student advisory | $ | 10,727 | $ | 20,060 | $ | 27,731 | |||||
Marketing | 3,702 | 5,182 | 6,807 | ||||||||
Admissions advisory | 813 | 849 | 1,691 | ||||||||
General and administrative | 23,296 | 21,363 | 41,153 | ||||||||
Restructuring and other charges | 4,281 | 2,008 | 1,323 | ||||||||
Share-based compensation expense | 42,819 | 49,462 | 78,705 | ||||||||
Tax effect of share-based compensation | (16,754 | ) | (18,986 | ) | (29,874 | ) | |||||
Share-based compensation expense, net of tax | $ | 26,065 | $ | 30,476 | $ | 48,831 | |||||
Note 16. Commitments and Contingencies
Guarantees
We have agreed to indemnify our officers and directors for certain events or occurrences. The maximum potential amount of future payments we could be required to make under these indemnification agreements is unlimited; however, we have director and officer liability insurance policies that mitigate our exposure and enable us to recover a portion of any future amounts paid. Based on the significant uncertainty associated with our pending as well as possible future litigation, settlements and other proceedings relative to our insurance policy coverage, the fair value of these indemnification agreements, if any, cannot be estimated.
101
APOLLO EDUCATION GROUP, INC. AND SUBSIDIARIES
NOTES TO CONSOLIDATED FINANCIAL STATEMENTS
Lease Commitments
The following details our future minimum commitments for operating and capital leases as of August 31, 2014:
($ in thousands) | Capital Leases | Operating Leases(1) | |||||
2015 | $ | 17,963 | $ | 171,875 | |||
2016 | 10,957 | 149,902 | |||||
2017 | 4,093 | 123,289 | |||||
2018 | 947 | 103,134 | |||||
2019 | 330 | 74,871 | |||||
Thereafter | 611 | 296,334 | |||||
Total future minimum lease obligation(1), (2) | $ | 34,901 | $ | 919,405 | |||
Less: imputed interest on capital leases | (2,095 | ) | |||||
Net present value of capital lease obligations | $ | 32,806 | |||||
(1) The total future minimum lease obligation excludes non-cancelable sublease rental income of $25.7 million.
(2) We have initiated restructuring activities that include ceasing use of a significant number of our operating leases. Refer to Note 2, Restructuring and Other Charges. The total future minimum operating lease obligation includes approximately $163 million of future contractual lease payments associated with locations for which we no longer expect to receive an economic benefit. The total future minimum operating lease obligation also includes approximately $6 million of future contractual lease payments associated with locations that we expect to close as University of Phoenix obtains the necessary regulatory approvals and completes its teach-out obligations.
Rent expense was $144.9 million, $184.6 million and $207.5 million for fiscal years 2014, 2013 and 2012, respectively.
We have entered into sale-leaseback agreements in prior fiscal years for properties that we currently use to support our operations. As of August 31, 2014 and 2013, our total deferred gains included on our Consolidated Balance Sheets was $23.1 million and $25.7 million, respectively. We recognized gain amortization associated with these sale-leasebacks of $2.0 million, $2.8 million and $2.8 million in fiscal years 2014, 2013 and 2012, respectively.
Naming Rights to Glendale, Arizona Sports Complex
In September 2006, we entered into an agreement for naming and sponsorship rights on a stadium in Glendale, Arizona, which is home to the Arizona Cardinals team in the National Football League. The agreement includes naming, sponsorship, signage, advertising and other promotional rights and benefits. The initial agreement term is in effect until 2026 with options to extend. Pursuant to the agreement, we were required to pay a total of $5.8 million for the 2006 contract year, which increases 3% per year until 2026. As of August 31, 2014, our remaining contractual obligation pursuant to this agreement is $101.4 million. Other payments apply if certain events occur, such as if the Cardinals play in the Super Bowl or if all of the Cardinals’ regular season home games are sold-out.
Surety Bonds
As part of our normal operations, our insurers issue surety bonds for us that are required by various states where we operate. We are obligated to reimburse our insurers for any surety bonds that are paid. As of August 31, 2014, the face amount of these surety bonds was approximately $36 million.
Letters of Credit
As of August 31, 2014, we had approximately $24 million of outstanding letters of credit, which principally support certain guarantees provided by our subsidiaries as part of our normal operations for which the fair value is not material.
Litigation and Other Matters
We are subject to various claims and contingencies that arise from time to time in the ordinary course of business, including those related to regulation, litigation, business transactions, employee-related matters and taxes, among others. We do not believe any of these are material for separate disclosure.
The following is a description of pending litigation, settlements, and other proceedings that fall outside the scope of ordinary and routine litigation incidental to our business.
102
APOLLO EDUCATION GROUP, INC. AND SUBSIDIARIES
NOTES TO CONSOLIDATED FINANCIAL STATEMENTS
Securities Class Action (Apollo Institutional Investors Group)
On August 13, 2010, a securities class action complaint was filed in the U.S. District Court for the District of Arizona by Douglas N. Gaer naming us, John G. Sperling, Gregory W. Cappelli, Charles B. Edelstein, Joseph L. D’Amico, Brian L. Swartz and Gregory J. Iverson as defendants for allegedly making false and misleading statements regarding our business practices and prospects for growth. That complaint asserted a putative class period stemming from December 7, 2009 to August 3, 2010. A substantially similar complaint was also filed in the same Court by John T. Fitch on September 23, 2010 making similar allegations against the same defendants for the same purported class period. Finally, on October 4, 2010, another purported securities class action complaint was filed in the same Court by Robert Roth against the same defendants as well as Brian Mueller, Terri C. Bishop and Peter V. Sperling based upon the same general set of allegations, but with a defined class period of February 12, 2007 to August 3, 2010. The complaints allege violations of Sections 10(b) and 20(a) of the Securities Exchange Act of 1934 and Rule 10b-5 promulgated thereunder. On October 15, 2010, three additional parties filed motions to consolidate the related actions and be appointed the lead plaintiff.
On November 23, 2010, the Fitch and Roth actions were consolidated with Gaer and the Court appointed the “Apollo Institutional Investors Group” consisting of the Oregon Public Employees Retirement Fund, the Mineworkers’ Pension Scheme, and Amalgamated Bank as lead plaintiffs. The case is now entitled, In re Apollo Group, Inc. Securities Litigation, Lead Case Number CV-10-1735-PHX-JAT. On February 18, 2011, the lead plaintiffs filed a consolidated complaint naming Apollo, John G. Sperling, Peter V. Sperling, Joseph L. D’Amico, Gregory W. Cappelli, Charles B. Edelstein, Brian L. Swartz, Brian E. Mueller, Gregory J. Iverson, and William J. Pepicello as defendants. The consolidated complaint asserts a putative class period of May 21, 2007 to October 13, 2010. On April 19, 2011, we filed a motion to dismiss and oral argument on the motion was held before the Court on October 17, 2011. On October 27, 2011, the Court granted our motion to dismiss and granted plaintiffs leave to amend. On December 6, 2011, the lead plaintiffs filed an Amended Consolidated Class Action Complaint, which alleges similar claims against the same defendants. On January 9, 2012, we filed a motion to dismiss the Amended Consolidated Class Action Complaint. On June 22, 2012, the Court granted our motion to dismiss and entered a judgment in our favor. On July 20, 2012, the plaintiffs filed a Notice of Appeal with the U.S. Court of Appeals for the Ninth Circuit, and their appeal remains pending before that Court. If the plaintiffs are successful in their appeal, we anticipate they will seek substantial damages.
Because of the many questions of fact and law that may arise, the outcome of this legal proceeding is uncertain at this point. Based on the information available to us at present, we cannot reasonably estimate a range of loss for this action and, accordingly, we have not accrued any liability associated with this action.
Securities Class Action (Teamsters Local 617 Pensions and Welfare Funds)
On November 2, 2006, the Teamsters Local 617 Pension and Welfare Funds filed a class action complaint purporting to represent a class of shareholders who purchased our stock between November 28, 2001 and October 18, 2006. The complaint, filed in the U.S. District Court for the District of Arizona, is entitled Teamsters Local 617 Pension & Welfare Funds v. Apollo Group, Inc. et al., Case Number 06-cv-02674-RCB, and alleges that we and certain of our current and former directors and officers violated Sections 10(b) and 20(a) of the Securities Exchange Act of 1934 and Rule 10b-5 promulgated thereunder by purportedly making misrepresentations concerning our stock option granting policies and practices and related accounting. The defendants are Apollo, J. Jorge Klor de Alva, Daniel E. Bachus, John M. Blair, Dino J. DeConcini, Kenda B. Gonzales, Hedy F. Govenar, Brian E. Mueller, Todd S. Nelson, Laura Palmer Noone, John R. Norton III, John G. Sperling and Peter V. Sperling. On September 11, 2007, the Court appointed The Pension Trust Fund for Operating Engineers as lead plaintiff. Lead plaintiff filed an amended complaint on November 23, 2007, asserting the same legal claims as the original complaint and adding claims for violations of Section 20A of the Securities Exchange Act of 1934 and allegations of breach of fiduciary duties and civil conspiracy. On April 30, 2009, plaintiffs filed their Second Amended Complaint, which alleges similar claims for alleged securities fraud against the same defendants.
On March 31, 2011, the U.S. District Court for the District of Arizona dismissed the case with prejudice and entered judgment in our favor. Plaintiffs filed a motion for reconsideration of this ruling, and the Court denied this motion on April 2, 2012. On April 27, 2012, the plaintiffs filed a Notice of Appeal with the U.S. Court of Appeals for the Ninth Circuit. During the pendency of this appeal, the parties reached an agreement in principle to settle this matter and, at the request of the parties, the Ninth Circuit issued an order staying the appeal on April 30, 2014. The parties plan to present a stipulation of settlement to the district court for approval in the near term.
As of August 31, 2014, we have accrued an immaterial amount reflecting the agreed-upon settlement. We intend to pursue reimbursement of the settlement amount from our insurance carriers, although the outcome of any such recovery efforts is uncertain at this point.
103
APOLLO EDUCATION GROUP, INC. AND SUBSIDIARIES
NOTES TO CONSOLIDATED FINANCIAL STATEMENTS
Securities Class Action (Nader Saleh)
On April 24, 2014, a securities class action complaint was filed in the U.S. District Court for the District of Arizona by Nader Saleh naming Apollo Education Group, Inc., Gregory W. Cappelli, and Brian L. Swartz as defendants and asserting a putative class period stemming from October 19, 2011 to April 1, 2014. The complaint alleges violations of Sections 10(b) and 20(a) of the Securities Exchange Act of 1934 and Rule 10b-5 promulgated thereunder and contends that defendants made false and/or misleading statements by misrepresenting and failing to disclose that: (i) defendants manipulated federal student loan and grant programs to appear to be in compliance with federal regulations; (ii) defendants’ predatory and deceptive recruiting and enrollment practices violated federal regulations; and (iii) Apollo engaged in a number of practices, including loan forbearance programs, to create the appearance that it was in compliance with federal regulations. The complaint further contends that the truth emerged regarding these statements when Apollo announced on April 1, 2014 it had received a subpoena from the U.S. Department of Education. The matter is entitled Saleh v. Apollo Education Group, Inc., 2:14-cv-00877-SRB. Per the scheduling order entered by the district court, defendants shall have 60 days to respond to plaintiff’s amended complaint, which is due to be filed on or before November 12, 2014.
Because of the many questions of fact and law that may arise, the outcome of this legal proceeding is uncertain at this point. Based on the information available to us at present, we cannot reasonably estimate a range of loss for this action and, accordingly, we have not accrued any liability associated with this action.
Class Action under the Telephone Consumer Protection Act
On September 25, 2014, Mundy Gonzalez filed a class action complaint against University of Phoenix alleging violations of the Telephone Consumer Protection Act (“TCPA”). The complaint, which is captioned Gonzalez v. The University of Phoenix, 3:14-cv-02279 and which was filed in U.S. District Court for the Southern District of California, alleges that University of Phoenix violated the TCPA by using automatic dialing systems to place unsolicited telephone calls to the cellular telephones of plaintiff and other individuals. The complaint seeks to recover damages on behalf of plaintiff and other similarly situated individuals.
Because of the many questions of fact and law that may arise, the outcome of this legal proceeding is uncertain at this point. Based on information available to us at present, we cannot reasonably estimate a range of loss for this action and, accordingly, we have not accrued any liability associated with this action.
Incentive Compensation False Claims Act Lawsuit
On May 25, 2011, we were notified that a qui tam complaint had been filed against us in the U.S. District Court, Eastern District of California, by private relators under the Federal False Claims Act and California False Claims Act, entitled USA and State of California ex rel. Hoggett and Good v. University of Phoenix, et al, Case Number 2:10-CV-02478-MCE-KJN. When the federal government declines to intervene in a qui tam action, as it has done in this case, the relators may elect to pursue the litigation on behalf of the federal government and, if successful, they are entitled to receive a portion of the federal government’s recovery.
The complaint alleges, among other things, that University of Phoenix has violated the Federal False Claims Act since December 12, 2009 and the California False Claims Act for the preceding ten years by falsely certifying to the U.S. Department of Education and the State of California that University of Phoenix was in compliance with various regulations that require compliance with federal rules regarding the payment of incentive compensation to admissions personnel, in connection with University of Phoenix’s participation in student financial aid programs. In addition to injunctive relief and fines, the relators seek significant damages on behalf of the Department of Education and the State of California, including all student financial aid disbursed by the Department to our students since December 2009 and by the State of California to our students during the preceding ten years. On July 24, 2014, the Court granted our motion to dismiss for lack of jurisdiction and dismissed relators’ complaint with prejudice. On August 21, 2014, relators filed a motion to stay the dismissal order and final judgment pending the appeal of another False Claims Act case not involving Apollo or University of Phoenix, and that motion remains pending before the district court.
Because of the many questions of fact and law that may arise, the outcome of this legal proceeding is uncertain at this point. Based on the information available to us at present, we cannot reasonably estimate a range of loss for this action and, accordingly, we have not accrued any liability associated with this action.
104
APOLLO EDUCATION GROUP, INC. AND SUBSIDIARIES
NOTES TO CONSOLIDATED FINANCIAL STATEMENTS
Himmel Derivative Action
On November 12, 2010, we received a shareholder demand to investigate, address and commence proceedings against each of our directors and certain of our officers for violation of any applicable laws, including in connection with the subject matter of the report of the Government Accountability Office prepared for the U.S. Senate in August 2010, our withdrawal of the outlook we previously provided for our fiscal year 2011, the investigation into possible unfair and deceptive trade practices associated with certain alleged practices of University of Phoenix by the State of Florida Office of the Attorney General in Fort Lauderdale, Florida, the participation by the State of Oregon Office of the Attorney General in the Securities Class Action (Apollo Institutional Investors Group), and the informal inquiry by the Enforcement Division of the Securities and Exchange Commission that commenced in October 2009.
On March 24, 2011, a shareholder derivative complaint was filed in the Superior Court for the State of Arizona, Maricopa County by Daniel Himmel, the foregoing shareholder who previously made a demand for investigation. In the complaint, the plaintiff asserts a derivative claim on our behalf against certain of our current and former officers and directors for breach of fiduciary duty, waste of corporate assets, and unjust enrichment. The complaint alleges that the individual defendants made improper statements and engaged in improper business practices that caused our stock price to drop, led to securities class actions against us, and enhanced regulation and scrutiny by various government entities and regulators. The case is entitled, Himmel v. Bishop, et al, Case Number CV2011-005604. Pursuant to a stipulation between all parties, on August 31, 2011, the Court ordered this action stayed during the pendency of the underlying Securities Class Action (Apollo Institutional Investors Group) matter.
Because of the many questions of fact and law that may arise, the outcome of this legal proceeding is uncertain at this point. Based on the information available to us at present, we cannot reasonably estimate a range of loss for this action and, accordingly, we have not accrued any liability associated with this action.
K.K. Modi Investment and Financial Services Pvt. Ltd.
On November 8, 2010, a suit was filed by K.K. Modi Investment and Financial Services Pvt. Ltd. (“Modi”) in the High Court of Delhi at New Delhi against defendants Apollo, Western International University, Inc., University of Phoenix, Inc., Apollo Global, Inc., Modi Apollo International Group Pvt. Ltd., Apollo International, Inc., John G. Sperling, Peter V. Sperling and Jorge Klor De Alva, seeking to permanently enjoin the defendants from making investments in the education industry in the Indian market in breach of an exclusivity and noncompete provision which plaintiff alleges is applicable to Apollo and its subsidiaries. The case is entitled, K.K. Modi Investment and Financial Services Pvt. Ltd. v. Apollo International, et. al. We believe that the relevant exclusivity and noncompete provision is inapplicable to us and our affiliates, we have sought to dismiss this action on those grounds, and our application for such relief remains pending before the Court. If plaintiff ultimately obtains the requested injunctive relief, our ability to conduct business in India, including through our joint venture with HT Media Limited, may be adversely affected. It is also possible that in the future K.K. Modi may seek to expand existing litigation in India or commence litigation in the U.S. in which it may assert a significant damage claim against us.
Because of the many questions of fact and law that may arise, the outcome of this legal proceeding is uncertain at this point. Based on the information available to us at present, we cannot reasonably estimate a range of loss for this action and, accordingly, we have not accrued any liability associated with this action.
Attorney General Investigations
On October 22, 2010, University of Phoenix received notice that the State of Florida Office of the Attorney General in Fort Lauderdale, Florida had commenced an investigation into possible unfair and deceptive trade practices associated with certain alleged practices of the University. The notice included a subpoena to produce documents and detailed information for the time period of January 1, 2006 to the present about a broad spectrum of the University’s business. We are cooperating with the investigation, but also filed a suit to quash or limit the subpoena and to protect information sought that constitutes proprietary or trade secret information. We cannot predict the eventual scope, duration or outcome of the investigation at this time.
In May 2011 and January 2013, University of Phoenix received Civil Investigative Demands from the State of Massachusetts Office of the Attorney General. The Demands relate to an investigation of possible unfair or deceptive methods, acts, or practices by proprietary educational institutions in connection with the recruitment of students and the financing of education. The Demands seek documents, information and testimony regarding a broad spectrum of the University’s business for the time period of January 1, 2002 to the present. We are cooperating with the investigation. We cannot predict the eventual scope, duration or outcome of the investigation at this time.
Because of the many questions of fact and law that may arise, the outcome of these investigative proceedings is uncertain at this point. Based on the information available to us at present, we cannot reasonably estimate a range of loss for these matters and, accordingly, we have not accrued any liability associated with these matters.
105
APOLLO EDUCATION GROUP, INC. AND SUBSIDIARIES
NOTES TO CONSOLIDATED FINANCIAL STATEMENTS
In addition, from time to time, we receive informal requests from state Attorneys General and other government agencies relating to specific complaints they have received from students or former students and seeking information about the student, our programs, and other matters relating to our activities in the relevant state. These requests can be broad and time consuming to respond to, and there is a risk that they could expand and/or lead to a formal inquiry or investigation into our practices in a particular state.
UNIACC Investigations
UNIACC was advised by the National Accreditation Commission of Chile in November 2011 that its institutional accreditation would not be renewed and therefore had lapsed. Subsequently, in June 2012, a prosecutor’s office in Santiago, Chile requested that UNIACC provide documents relating to UNIACC’s relationship with a former employee and consultant who served as a member of the National Accreditation Commission until March 2012, and we have since received requests for additional information in connection with this investigation. Furthermore, in August 2012, the prosecutor’s office began requesting that UNIACC provide information about UNIACC’s business structure and operations and its relationship with other Apollo entities, in connection with an additional investigation regarding UNIACC’s compliance with applicable laws concerning the generation of profit by universities such as UNIACC. The prosecutor’s office is also requesting additional information from UNIACC regarding certain government funding received by the institution. UNIACC is cooperating with these investigations. At this time, we cannot predict the eventual scope, duration or outcome of these investigations.
In November 2012, UNIACC learned that the Ministry of Education was commencing a formal investigation into profit related issues and concerning the official recognition of UNIACC as a university under Chilean law. On November 18, 2013, we were notified by the Ministry of Education that it declined to pursue any charges against UNIACC and closed its investigation without imposing any sanction on UNIACC. In closing its investigation, the Ministry forwarded certain of its files for review by the Chilean tax authorities and the criminal prosecutor conducting the profit investigation referenced above.
Because of the many questions of fact and law that may arise, the outcome of these investigative proceedings is uncertain at this point. Based on the information available to us at present, we cannot reasonably estimate a range of loss for these matters and, accordingly, we have not accrued any liability associated with these matters.
Office of the Inspector General of the U.S. Department of Education (“OIG”) Subpoena
On March 21, 2014, University of Phoenix received a subpoena from the Mid-Atlantic Region of the OIG. The subpoena seeks the production by the University of documents and detailed information regarding a broad spectrum of the activities conducted in the University’s Centralized Service Center for the Northeast Region located in Columbia, Maryland, for the time period of January 1, 2007 to the present, including information relating to marketing, recruitment, enrollment, financial aid processing, fraud prevention, student retention, personnel training, attendance, academic grading and other matters. We are cooperating with these requests but cannot at this time predict the eventual scope, duration or outcome of this matter.
Because of the many questions of fact and law that may arise, the outcome of this matter is uncertain at this point. Based on the information available to us at present, we cannot reasonably estimate a range of loss and, accordingly, we have not accrued any liability associated with this matter.
Patent Infringement Litigation
On March 3, 2008, Digital-Vending Services International Inc. filed a complaint against University of Phoenix and Apollo, as well as Capella Education Company, Laureate Education Inc., and Walden University Inc. in the U.S. District Court for the Eastern District of Texas, since transferred on plaintiff’s motion to the Eastern District of Virginia. The case is entitled, Digital Vending Services International, LLC vs. The University of Phoenix, et al, Case Number 2:09cv555 (JBF-TEM). The complaint alleges that we and the other defendants have infringed and are infringing various patents relating to managing courseware in a shared use operating environment and seeks injunctive relief and substantial damages, including royalties as a percentage of our net revenue over a multi-year period. We filed an answer to the complaint on May 27, 2008, in which we denied that Digital-Vending Services International’s patents were duly and lawfully issued, and asserted defenses of non-infringement and patent invalidity, among others. We also asserted a counterclaim seeking a declaratory judgment that the patents are invalid, unenforceable, and not infringed by us.
On January 7, 2011, the Court granted our motion for summary judgment and dismissed the case with prejudice, citing plaintiff’s failure to point to admissible evidence that could support a finding of infringement. Plaintiff appealed the order granting summary judgment to the United States Court of Appeals for the Federal Circuit, which held oral argument on December 5, 2011. On March 7, 2012, a divided three-judge panel of the Federal Circuit issued an opinion affirming in part and reversing in part the order granting summary judgment, and it remanded a portion of the plaintiff’s claims to the district court for further proceedings. We filed a Petition for Rehearing with the Federal Circuit regarding the portion of the decision reversing the grant of summary judgment, which the Federal Circuit denied on May 25, 2012. Accordingly, the case was
106
APOLLO EDUCATION GROUP, INC. AND SUBSIDIARIES
NOTES TO CONSOLIDATED FINANCIAL STATEMENTS
remanded to the U.S. District Court for the Eastern District of Virginia for further proceedings. In July 2013, we filed another motion for summary judgment based on non-infringement, and on October 4, 2013, the Court granted our motion and dismissed each of plaintiff’s remaining claims with prejudice. On November 1, 2013, plaintiff filed a Notice of Appeal of the District Court’s order. The parties subsequently entered into a settlement agreement for an immaterial amount pursuant to which plaintiff agreed to dismiss its appeal. Plaintiff’s appeal was dismissed on November 21, 2013, which resolved the litigation.
Note 17. Regulatory Matters
All U.S. federal financial aid programs are established by Title IV of the Higher Education Act and regulations promulgated thereunder. The U.S. Congress must periodically reauthorize the Higher Education Act and annually determine the funding level for each Title IV program. In 2008, the Higher Education Act was reauthorized through September 30, 2013 by the Higher Education Opportunity Act and an automatic one year extension continued the authorization through September 30, 2014. Congress continues to engage in Higher Education Act reauthorization hearings and although the one year automatic extension has expired, Title IV programs remain authorized and functioning. Changes to the Higher Education Act, including changes in eligibility and funding for Title IV programs, are likely to occur in connection with the next reauthorization, but we cannot predict the scope or substance of any such changes.
The Higher Education Act, as reauthorized, specifies the manner in which the U.S. Department of Education reviews institutions for eligibility and certification to participate in Title IV programs. Every educational institution involved in Title IV programs must be certified to participate and is required to periodically renew this certification.
University of Phoenix was recertified in November 2009 and entered into a new Title IV Program Participation Agreement which expired on December 31, 2012. University of Phoenix has submitted necessary documentation for re-certification and its eligibility continues on a month-to-month basis until the Department issues its decision on the application. We have no reason to believe that the University’s application will not be renewed in due course, and it is not unusual to be continued on a month-to-month basis until the Department completes its review. We cannot predict whether, or to what extent, the imposition of the Notice sanction by The Higher Learning Commission might have on this process.
Western International University was recertified in May 2010 and its current certification expired on September 30, 2014. Western International University has submitted necessary documentation for re-certification and its eligibility continues on a month-to-month basis until the Department issues its decision on the application.
Higher Learning Commission Accreditation
University of Phoenix and Western International University are accredited by The Higher Learning Commission (“HLC”) of the North Central Association of Colleges and Schools. This accreditation provides the following:
• | Recognition and acceptance by employers, other higher education institutions and governmental entities of the degrees and credits earned by students; |
• | Qualification to participate in Title IV programs (in combination with state higher education operating and degree granting authority); and |
• | Qualification for authority to operate in certain states. |
In July 2013, the accreditations of University of Phoenix and Western International University were reaffirmed by HLC through the 2022-2023 academic year. At the same time, HLC placed both universities on Notice status for a two-year period. Notice status is a sanction that means that HLC has determined that an institution is on a course of action that, if continued, could lead the institution to be out of compliance with one or more of the HLC Criteria for Accreditation or Core Components. The University was assigned by HLC to the Standard Pathway reaffirmation process, pursuant to which the University will host a comprehensive evaluation visit in 2016-2017 and will undergo its next reaffirmation visit and process in 2022-2023.
The University is required to submit a Notice Report to the HLC by the end of calendar year 2014 providing evidence that the University meets the Criteria for Accreditation, Core Components and Minimum Expectations (Assumed Practices after January 1, 2013) identified as the basis for the Notice sanction and that it has ameliorated the issues that led to the Notice sanction. In addition, in the Notice Report the University is also required to report on its progress in other areas of concern not included in the Notice sanction, including retention and graduation rates, three-year student loan cohort default rates, and credit hour policies and practices relating to learning teams. The University also will be required to host a focused visit by the HLC in January 2015, to validate the contents of the Notice Report. The HLC Board of Trustees will review the University’s Notice Report, together with a report of the focused visit, at a meeting in 2015. During the Notice period, the University is required to disclose its Notice status in connection with any statements regarding its HLC accreditation. If, after the Notice period, HLC determines that University of Phoenix is not in compliance with one or more of HLC’s Criteria for Accreditation, HLC may elect to impose probation, which would have further, more significant consequences for the University and our business.
107
APOLLO EDUCATION GROUP, INC. AND SUBSIDIARIES
NOTES TO CONSOLIDATED FINANCIAL STATEMENTS
90/10 Rule
To remain eligible to participate in Title IV programs, proprietary institutions of higher education must comply with the so-called “90/10 Rule” under the Higher Education Act, as reauthorized, and must derive 90% or less of their cash basis revenue, as defined in the rule, from Title IV programs. The 90/10 Rule percentage for University of Phoenix was 81% for fiscal year 2014. Based on recent trends, we do not expect the 90/10 Rule percentage for University of Phoenix to exceed 90% for fiscal year 2015. The 90/10 Rule percentage for the University remains high and could exceed 90% in the future depending on the degree to which its various initiatives are effective, the impact of future changes in its enrollment mix, and regulatory and other factors outside our control, including any reduction in military benefit programs or changes in the treatment of such funding for purposes of the 90/10 Rule calculation.
Student Loan Cohort Default Rates
To remain eligible to participate in Title IV programs, an educational institution’s student loan cohort default rates must remain below certain specified levels. Educational institutions will lose eligibility to participate in Title IV programs if their three-year cohort default rate equals or exceeds 40% for any given year or 30% for three consecutive years. The University of Phoenix three-year cohort default rates for the 2011 and 2010 federal fiscal years were 19.0% and 26.0%, respectively. If our student loan default rates approach the applicable limits, we may be required to increase efforts and resources dedicated to improving these default rates.
OIG Audit of the U.S. Department of Education
In October 2011, the Office of the Inspector General of the U.S. Department of Education (“OIG”) notified us that it was conducting a nationwide audit of the Department’s program requirements, guidance, and monitoring of institutions of higher education offering distance education. In connection with the OIG’s audit of the Department, the OIG examined a sample of University of Phoenix students who enrolled during the period from July 1, 2010 to June 30, 2011. The OIG subsequently notified University of Phoenix that in the course of this review it identified certain conditions that the OIG believed were Title IV program compliance exceptions at University of Phoenix. In February 2014, the OIG released a final audit report on this subject, which identified exceptions based on select student records related principally to the calculation of the amount of Title IV program funds returned after student withdrawals and the process for confirming student eligibility prior to disbursement of Title IV program funds. While the OIG recommended follow-up action with regard to some schools, University of Phoenix was not among them. We were not the direct subject of the OIG’s audit of the Department, and we have not accrued any liability associated with this matter.
U.S. Department of Education Program Reviews
The U.S. Department of Education periodically reviews institutions participating in Title IV programs for compliance with applicable standards and regulations. In August 2014, the Department commenced an ordinary course program review of University of Phoenix’s administration of Title IV programs covering federal financial aid years 2012-2013 and 2013-2014, as well as compliance with the Jeanne Clery Disclosure of Campus Security Policy and Campus Crime Statistics Act, the Drug-Free Schools and Communities Act and related regulations.
Note 18. Segment Reporting
We operate in the education industry and our reportable segments have been determined based on the method by which our chief operating decision maker evaluates performance and allocates resources. Our operating segments are presented in the following reportable segments:
• | University of Phoenix; |
• | Apollo Global; and |
• | Other. |
University of Phoenix is composed of eight colleges and offers undergraduate and graduate degrees in a wide range of program areas including business, education and nursing. The University’s students attend classes online and at 110 ground campus locations throughout the U.S. and Puerto Rico. The majority of students attend classes exclusively online. In addition, the University offers a range of non-degree education programs for lifelong learners and students interested in developing skills and knowledge to improve their prospects of employment in their field of choice or advancement within their existing careers.
108
APOLLO EDUCATION GROUP, INC. AND SUBSIDIARIES
NOTES TO CONSOLIDATED FINANCIAL STATEMENTS
Apollo Global includes:
• | BPP Holdings Limited (“BPP”), which is headquartered in London, England and offers professional training and exam preparation programs in a variety of areas and qualification training, undergraduate and graduate degrees through BPP University, which principally includes BPP Law School and BPP Business School; |
• | Open Colleges Australia Pty Ltd (“Open Colleges”), which is headquartered in Sydney, Australia and offers nationally recognized and government approved certificates, diplomas and other qualifications in a diverse range of disciplines and industries, including health and wellness, business management and services, and community services; |
• | Universidad Latinoamericana (“ULA”), which is headquartered in Mexico City, Mexico and offers graduate and undergraduate degrees, high school and executive education in a variety of program areas and disciplines; |
• | Milpark Education (Pty) Ltd. (“Milpark Education”), which is headquartered in Cape Town, South Africa and offers postsecondary education, including undergraduate and graduate degrees primarily in business, and non-degree programs; |
• | Apollo Global Chile S.A. (“Apollo Global Chile”), which includes Universidad de Artes, Ciencias y Comunicación (“UNIACC”) and Instituto Superior de las Artes y Comunicaciones (“IACC”). UNIACC offers undergraduate and graduate degree programs in a variety of program areas principally at its campus in Santiago, Chile. IACC primarily offers degree and non-degree programs that are delivered online; |
• | India Education Services Private Ltd (“India Education Services”), which is a joint venture that offers non-degree management and business programs delivered in a mix of online and on-ground teaching; and |
• | Apollo Global corporate operations. |
Apollo Global acquired Open Colleges and Milpark Education during the second and third quarters of fiscal year 2014, respectively. The operating results of Open Colleges and Milpark Education are included in our Apollo Global operating segment from the date of each respective acquisition. Refer to Note 4, Acquisitions.
Other includes:
• | Western International University, Inc., which offers undergraduate and graduate degrees in a variety of program areas, including business, information technology and behavioral science; |
• | The College for Financial Planning Institutes Corporation (“College for Financial Planning”), which provides online financial services education programs, including graduate degrees in three majors, certificate programs, Financial Industry Regulatory Authority securities license training, and continuing education courses. |
• | Carnegie Learning, Inc. publishes innovative, research-based math curricula and adaptive learning software for middle school and high school students; |
• | Apollo Lightspeed, which is focused on developing innovative educational offerings and services that enable motivated learners to acquire in-demand job skills via non-degree learning solutions; and |
• | Apollo Corporate activities. |
During the fourth quarter of fiscal year 2014, we sold the assets of IPD and began presenting it as discontinued operations. IPD was previously included in Other in our segment reporting. As IPD’s operating results are presented as discontinued operations on our Consolidated Statements of Income for all periods presented, we have revised our financial information by segment to exclude IPD’s operating results.
Management evaluates performance based on reportable segment profit. This measure of profit includes allocating corporate support costs to each segment as part of transfer pricing arrangements and/or a general allocation, but excludes taxes, interest income and expense, and certain revenue and unallocated corporate charges. At the discretion of management, certain corporate costs are not allocated to the subsidiaries due to their designation as special charges because of their infrequency of occurrence, the non-cash nature of the expense and/or the determination that the allocation of these costs to the subsidiaries will not result in an appropriate measure of the subsidiaries’ results.
No individual customer accounted for more than 10% of our consolidated net revenue in fiscal years 2014, 2013 and 2012.
109
APOLLO EDUCATION GROUP, INC. AND SUBSIDIARIES
NOTES TO CONSOLIDATED FINANCIAL STATEMENTS
A summary of financial information by reportable segment is as follows:
Year Ended August 31, | |||||||||||
($ in thousands) | 2014 | 2013 | 2012 | ||||||||
Net revenue: | |||||||||||
University of Phoenix | $ | 2,632,949 | $ | 3,304,464 | $ | 3,873,098 | |||||
Apollo Global | 338,008 | 275,768 | 269,541 | ||||||||
Other | 53,221 | 55,692 | 50,551 | ||||||||
Net revenue | $ | 3,024,178 | $ | 3,635,924 | $ | 4,193,190 | |||||
Operating income (loss)(1): | |||||||||||
University of Phoenix | $ | 488,217 | $ | 579,670 | $ | 846,840 | |||||
Apollo Global(2) | (74,189 | ) | (59,936 | ) | (66,964 | ) | |||||
Other(3) | (75,057 | ) | (85,342 | ) | (103,508 | ) | |||||
Operating income | 338,971 | 434,392 | 676,368 | ||||||||
Reconciling items: | |||||||||||
Interest income | 2,230 | 1,913 | 1,187 | ||||||||
Interest expense | (7,914 | ) | (8,745 | ) | (11,745 | ) | |||||
Other (loss) income, net | (547 | ) | 2,407 | 476 | |||||||
Income from continuing operations before income taxes | $ | 332,740 | $ | 429,967 | $ | 666,286 | |||||
Depreciation and amortization(4): | |||||||||||
University of Phoenix(4) | $ | 35,261 | $ | 53,562 | $ | 64,643 | |||||
Apollo Global | 38,168 | 25,982 | 24,297 | ||||||||
Other | 77,146 | 82,189 | 89,294 | ||||||||
Depreciation and amortization(4) | $ | 150,575 | $ | 161,733 | $ | 178,234 | |||||
Capital expenditures: | |||||||||||
University of Phoenix | $ | 8,280 | $ | 6,992 | $ | 20,133 | |||||
Apollo Global | 22,231 | 33,627 | 36,523 | ||||||||
Other | 70,155 | 78,729 | 58,531 | ||||||||
Capital expenditures | $ | 100,666 | $ | 119,348 | $ | 115,187 | |||||
(1) University of Phoenix, Apollo Global and Other include charges associated with our restructuring activities. Refer to Note 2, Restructuring and Other Charges.
(2) The operating loss for Apollo Global in fiscal year 2014 includes contingent consideration charges and acquisition costs. Refer to Note 4, Acquisitions, and Note 9, Fair Value Measurements. The operating loss also includes the reversal of approximately $11 million of foreign indirect taxes following resolution with the taxing authority. These taxes were originally assessed in fiscal year 2013. The operating loss in fiscal year 2012 includes goodwill and other intangibles impairment charges of $16.8 million. Refer to Note 8, Goodwill and Intangibles.
(3) The operating loss for Other in fiscal year 2014 includes $13.9 million of charges associated with our legal matters. The operating loss in fiscal year 2013 includes credits of $23.2 million associated with our legal matters.
(4) Depreciation and amortization in fiscal years 2014 and 2013 excludes $7.6 million and $50.1 million, respectively, of accelerated depreciation associated with our restructuring activities. Refer to Note 2, Restructuring and Other Charges.
A summary of our consolidated assets by reportable segment is as follows:
As of August 31, | |||||||||||
($ in thousands) | 2014 | 2013 | 2012 | ||||||||
University of Phoenix | $ | 824,895 | $ | 790,537 | $ | 901,180 | |||||
Apollo Global | 680,363 | 359,903 | 376,071 | ||||||||
Other(1) | 1,587,677 | 1,847,507 | 1,591,071 | ||||||||
Total assets | $ | 3,092,935 | $ | 2,997,947 | $ | 2,868,322 | |||||
(1) The majority of assets included in Other consists of corporate cash and cash equivalents and marketable securities.
110
APOLLO EDUCATION GROUP, INC. AND SUBSIDIARIES
NOTES TO CONSOLIDATED FINANCIAL STATEMENTS
A summary of financial information by geographical area based on country of domicile for our respective operating locations is as follows:
Year Ended August 31, | |||||||||||
($ in thousands) | 2014 | 2013 | 2012 | ||||||||
Net revenue: | |||||||||||
United States | $ | 2,686,571 | $ | 3,360,316 | $ | 3,923,649 | |||||
United Kingdom | 229,508 | 205,662 | 198,408 | ||||||||
Other | 108,099 | 69,946 | 71,133 | ||||||||
Net revenue | $ | 3,024,178 | $ | 3,635,924 | $ | 4,193,190 | |||||
As of August 31, | |||||||||||
($ in thousands) | 2014 | 2013 | 2012 | ||||||||
Long-lived assets(1): | |||||||||||
United States | $ | 430,641 | $ | 472,811 | $ | 580,457 | |||||
United Kingdom | 172,485 | 169,371 | 174,229 | ||||||||
Australia | 191,393 | — | — | ||||||||
Other | 90,480 | 66,244 | 69,322 | ||||||||
Long-lived assets | $ | 884,999 | $ | 708,426 | $ | 824,008 | |||||
(1) Long-lived assets include property and equipment, net, goodwill, and intangible assets, net.
111
APOLLO EDUCATION GROUP, INC. AND SUBSIDIARIES
NOTES TO CONSOLIDATED FINANCIAL STATEMENTS
Note 19. Quarterly Results of Operations (Unaudited)
Our operations are generally subject to seasonal trends, which vary depending on subsidiary. We have historically experienced, and expect to continue to experience, fluctuations in our results of operations as a result of seasonal variations in the level of our institutions’ enrollments.
• | University of Phoenix - Although University of Phoenix enrolls students throughout the year, its net revenue is generally lower in our second fiscal quarter (December through February) than the other quarters due to holiday breaks. |
• | Apollo Global - Our Apollo Global subsidiaries experience seasonality associated with the timing of when courses begin, exam dates, the timing of their respective holidays and other factors. These factors have historically resulted in lower net revenue in our second and fourth fiscal quarters, particularly for BPP, which also results in substantially lower operating results during these quarters due to BPP’s relatively fixed cost structure. |
The following unaudited consolidated quarterly financial information should be read in conjunction with other information included in our consolidated financial statements, and reflects all adjustments, consisting of normal, recurring adjustments, necessary for the fair presentation of the results of interim periods. We have made certain reclassifications to the unaudited consolidated quarterly financial information associated with our presentation of IPD as discontinued operations. Refer to Note 3, Discontinued Operations.
(Unaudited) | |||||||||||||||||||||||||||||||
2014 | 2013 | ||||||||||||||||||||||||||||||
Q1 Nov. 30 | Q2 Feb. 28 | Q3 May 31 | Q4 Aug. 31 | Q1 Nov. 30 | Q2 Feb. 28 | Q3 May 31 | Q4 Aug. 31 | ||||||||||||||||||||||||
(In thousands, except per share data) | |||||||||||||||||||||||||||||||
Net revenue | $ | 848,148 | $ | 672,754 | $ | 793,610 | $ | 709,666 | $ | 1,040,534 | $ | 821,861 | $ | 937,171 | $ | 836,358 | |||||||||||||||
Operating income(1), (2) | 170,361 | 10,296 | 116,324 | 41,990 | 230,927 | 30,118 | 134,797 | 38,550 | |||||||||||||||||||||||
Income from continuing operations | 99,432 | 14,149 | 67,039 | 30,796 | 133,823 | 13,932 | 82,029 | 23,726 | |||||||||||||||||||||||
Net income | 99,041 | 12,177 | 65,010 | 28,570 | 133,740 | 13,659 | 80,170 | 21,396 | |||||||||||||||||||||||
Net income attributable to Apollo | 98,891 | 14,605 | 66,025 | 29,783 | 133,495 | 13,527 | 79,953 | 21,551 | |||||||||||||||||||||||
Earnings (loss) per share - Basic:(3) | |||||||||||||||||||||||||||||||
Continuing operations attributable to Apollo | $ | 0.88 | $ | 0.15 | $ | 0.62 | $ | 0.29 | $ | 1.19 | $ | 0.12 | $ | 0.73 | $ | 0.21 | |||||||||||||||
Discontinued operations attributable to Apollo | (0.01 | ) | (0.02 | ) | (0.02 | ) | (0.02 | ) | — | — | (0.02 | ) | (0.02 | ) | |||||||||||||||||
Basic income per share attributable to Apollo | $ | 0.87 | $ | 0.13 | $ | 0.60 | $ | 0.27 | $ | 1.19 | $ | 0.12 | $ | 0.71 | $ | 0.19 | |||||||||||||||
Earnings (loss) per share - Diluted:(3) | |||||||||||||||||||||||||||||||
Continuing operations attributable to Apollo | $ | 0.87 | $ | 0.15 | $ | 0.61 | $ | 0.29 | $ | 1.18 | $ | 0.12 | $ | 0.72 | $ | 0.21 | |||||||||||||||
Discontinued operations attributable to Apollo | — | (0.02 | ) | (0.02 | ) | (0.02 | ) | — | — | (0.01 | ) | (0.02 | ) | ||||||||||||||||||
Diluted income per share attributable to Apollo | $ | 0.87 | $ | 0.13 | $ | 0.59 | $ | 0.27 | $ | 1.18 | $ | 0.12 | $ | 0.71 | $ | 0.19 | |||||||||||||||
Basic weighted average shares outstanding | 113,326 | 112,151 | 110,613 | 109,364 | 112,420 | 112,573 | 112,742 | 113,105 | |||||||||||||||||||||||
Diluted weighted average shares outstanding | 113,960 | 113,380 | 112,082 | 110,839 | 112,849 | 113,068 | 113,372 | 113,740 | |||||||||||||||||||||||
(1) Operating income includes the following for fiscal year 2014:
• | Restructuring and other charges of $32.0 million, $15.2 million, $14.9 million and $23.2 million in the first, second, third and fourth quarters, respectively; |
• | Contingent consideration charges and acquisition costs of $13.0 million and $16.1 million in the second and third quarters, respectively, and a $9.3 million credit in the fourth quarter principally due to a decrease in estimated contingent consideration; and |
• | Litigation charges of $9.0 million, $4.1 million and $0.8 million in the second, third and fourth quarters, respectively. |
(2) Operating income includes the following for fiscal year 2013:
• | Restructuring and other charges of $24.1 million, $44.1 million, $61.5 million and $67.3 million in the first, second, third and fourth quarters, respectively; and |
• | Litigation net credits of $16.9 million, $6.3 million, and $1.4 million in the first, second and fourth quarters, respectively. |
(3) Basic and diluted earnings per share are computed independently for each of the quarters presented. Therefore, the sum of quarterly basic and diluted income per share may not equal annual basic and diluted income per share.
112
Item 9 - Changes in and Disagreements With Accountants on Accounting and Financial Disclosure
None.
Item 9A - Controls and Procedures
Disclosure Controls and Procedures
We intend to maintain disclosure controls and procedures designed to provide reasonable assurance that information required to be disclosed in reports filed under the Securities Exchange Act of 1934, as amended, is recorded, processed, summarized and reported within the specified time periods and accumulated and communicated to our management, including our Chief Executive Officer (“Principal Executive Officer”) and our Senior Vice President and Chief Financial Officer (“Principal Financial Officer”), as appropriate, to allow timely decisions regarding required disclosure. We have established a Disclosure Committee, consisting of certain members of management, to assist in this evaluation. Our Disclosure Committee meets on a quarterly basis and more often if necessary.
Our management, under the supervision and with the participation of our Principal Executive Officer and Principal Financial Officer, evaluated the effectiveness of our disclosure controls and procedures (as defined in Rules 13a-15(e) or 15d-15(e) promulgated under the Securities Exchange Act), as of the end of the period covered by this report. Based on that evaluation, management concluded that, as of that date, our disclosure controls and procedures were effective at the reasonable assurance level.
Attached as exhibits to this Annual Report on Form 10-K are certifications of our Principal Executive Officer and Principal Financial Officer, which are required in accordance with Rule 13a-14 of the Securities Exchange Act. This Disclosure Controls and Procedures section includes information concerning management’s evaluation of disclosure controls and procedures referred to in those certifications and, as such, should be read in conjunction with the certifications of our Principal Executive Officer and Principal Financial Officer.
Management’s Report on Internal Control Over Financial Reporting
Management is responsible for establishing and maintaining effective internal control over financial reporting. Management’s intent is to design a process to provide reasonable assurance regarding the reliability of financial reporting and the preparation of financial statements for external purposes in accordance with GAAP in the United States of America.
Our internal control over financial reporting includes those policies and procedures that:
(i) pertain to the maintenance of records that, in reasonable detail, accurately and fairly reflect the transactions and dispositions of our assets;
(ii) provide reasonable assurance that transactions are recorded as necessary to permit preparation of financial statements in accordance with GAAP, and that receipts and expenditures are being made only in accordance with authorizations of our management and directors; and
(iii) provide reasonable assurance regarding prevention or timely detection of unauthorized acquisition, use, or disposition of our assets that could have a material effect on the financial statements.
Management performed an assessment of the effectiveness of our internal control over financial reporting as of August 31, 2014, utilizing the criteria described in the “Internal Control - Integrated Framework (1992)” issued by the Committee of Sponsoring Organizations of the Treadway Commission. The objective of this assessment was to determine whether our internal control over financial reporting was effective as of August 31, 2014. Based on our assessment, management believes that, as of August 31, 2014, the Company’s internal control over financial reporting is effective.
Our independent registered public accounting firm, Deloitte & Touche LLP, independently assessed the effectiveness of the Company’s internal control over financial reporting. Deloitte & Touche LLP has issued a report, which is included at the end of Part II, Item 9A of this Annual Report on Form 10-K.
Changes in Internal Control Over Financial Reporting
There have not been any changes in our internal control over financial reporting during the quarter ended August 31, 2014, that have materially affected, or are reasonably likely to materially affect, our internal control over financial reporting.
113
REPORT OF INDEPENDENT REGISTERED PUBLIC ACCOUNTING FIRM
To the Board of Directors and Shareholders of
Apollo Education Group, Inc. and Subsidiaries
Phoenix, Arizona
We have audited the internal control over financial reporting of Apollo Education Group, Inc. and subsidiaries (the “Company”) as of August 31, 2014, based on criteria established in Internal Control - Integrated Framework (1992) issued by the Committee of Sponsoring Organizations of the Treadway Commission. The Company’s management is responsible for maintaining effective internal control over financial reporting and for its assessment of the effectiveness of internal control over financial reporting, included in the accompanying Management’s Report on Internal Control Over Financial Reporting. Our responsibility is to express an opinion on the Company’s internal control over financial reporting based on our audit.
We conducted our audit in accordance with the standards of the Public Company Accounting Oversight Board (United States). Those standards require that we plan and perform the audit to obtain reasonable assurance about whether effective internal control over financial reporting was maintained in all material respects. Our audit included obtaining an understanding of internal control over financial reporting, assessing the risk that a material weakness exists, testing and evaluating the design and operating effectiveness of internal control based on the assessed risk, and performing such other procedures as we considered necessary in the circumstances. We believe that our audit provides a reasonable basis for our opinion.
A company’s internal control over financial reporting is a process designed by, or under the supervision of, the company’s principal executive and principal financial officers, or persons performing similar functions, and effected by the company’s board of directors, management, and other personnel to provide reasonable assurance regarding the reliability of financial reporting and the preparation of financial statements for external purposes in accordance with generally accepted accounting principles. A company’s internal control over financial reporting includes those policies and procedures that (1) pertain to the maintenance of records that, in reasonable detail, accurately and fairly reflect the transactions and dispositions of the assets of the company; (2) provide reasonable assurance that transactions are recorded as necessary to permit preparation of financial statements in accordance with generally accepted accounting principles, and that receipts and expenditures of the company are being made only in accordance with authorizations of management and directors of the company; and (3) provide reasonable assurance regarding prevention or timely detection of unauthorized acquisition, use, or disposition of the company’s assets that could have a material effect on the financial statements.
Because of the inherent limitations of internal control over financial reporting, including the possibility of collusion or improper management override of controls, material misstatements due to error or fraud may not be prevented or detected on a timely basis. Also, projections of any evaluation of the effectiveness of the internal control over financial reporting to future periods are subject to the risk that the controls may become inadequate because of changes in conditions, or that the degree of compliance with the policies or procedures may deteriorate.
In our opinion, the Company maintained, in all material respects, effective internal control over financial reporting as of August 31, 2014, based on the criteria established in Internal Control - Integrated Framework (1992) issued by the Committee of Sponsoring Organizations of the Treadway Commission.
We have also audited, in accordance with the standards of the Public Company Accounting Oversight Board (United States), the consolidated financial statements as of and for the year ended August 31, 2014 of the Company, and our report dated October 21, 2014 expressed an unqualified opinion on those financial statements.
/s/ DELOITTE & TOUCHE LLP
Phoenix, Arizona
October 21, 2014
114
Item 9B - Other Information
None.
115
PART III
Item 10 - Directors, Executive Officers and Corporate Governance
Information relating to our Board of Directors, Executive Officers, and Corporate Governance required by this item appears in the Information Statement for Apollo Education Group, Inc., to be filed within 120 days of our fiscal year end (August 31, 2014) and such information is incorporated herein by reference.
Our employees must act ethically at all times and in accordance with the policies in our Code of Business Ethics. We require full compliance with this policy from all designated employees including our Chief Executive Officer, Chief Financial Officer, and Chief Accounting Officer. We publish the policy, and any amendments or waivers to the policy, on our website located at www.apollo.edu.
Item 11 - Executive Compensation
Information relating to this item appears in the Information Statement for Apollo Education Group, Inc., to be filed within 120 days of our fiscal year end (August 31, 2014) and such information is incorporated herein by reference.
Item 12 - Security Ownership of Certain Beneficial Owners and Management and Related Stockholder Matters
Information relating to this item appears in the Information Statement for Apollo Education Group, Inc., to be filed within 120 days of our fiscal year end (August 31, 2014) and such information is incorporated herein by reference.
Item 13 - Certain Relationships and Related Transactions, and Director Independence
Information relating to this item appears in the Information Statement for Apollo Education Group, Inc., to be filed within 120 days of our fiscal year end (August 31, 2014) and such information is incorporated herein by reference.
Item 14 - Principal Accounting Fees and Services
Information relating to this item appears in the Information Statement for Apollo Education Group, Inc., to be filed within 120 days of our fiscal year end (August 31, 2014) and such information is incorporated herein by reference.
116
PART IV
Item 15 - Exhibits, Financial Statement Schedules
(a) The following documents are filed as part of this Annual Report on Form 10-K:
1. Financial Statements filed as part of this report
Index to Consolidated Financial Statements | Page |
2. Financial Statement Schedules
All financial statement schedules have been omitted since the required information is not applicable or is not present in amounts sufficient to require submission of the schedule, or because the information required is included on the Consolidated Financial Statements and Notes thereto.
117
3. Exhibits
Index to Exhibits
Incorporated by Reference | |||||||
Exhibit Number | Exhibit Description | Form | File No. | Exhibit Number | Filing Date | Filed Herewith | |
2.1 | Agreement and Plan of Merger by and among Carnegie Learning, Inc., Apollo Group, Inc.,† BHCL Acquisition Co. and CLI Shareholder Representative, LLC, dated August 2, 2011 | X | |||||
2.2 | First Amendment to Agreement and Plan of Merger by and among Carnegie Learning, Inc., Apollo Group, Inc., BHCL Acquisition Co. and CLI Shareholder Representative, LLC, dated August 31, 2011 | 10-K | No. 000-25232 | 2.2 | October 20, 2011 | ||
2.3 | Technology Assignment and License Agreement by and between Apollo Group, Inc., Carnegie Mellon University and Carnegie Learning, Inc., dated August 2, 2011 | X | |||||
2.4 | Stock Purchase Agreement by and among Apollo Group, Inc., an Arizona corporation, Apollo Global, Inc., a Delaware corporation, Carlyle U.S. Growth Fund III, L.P. /f/k/a Carlyle Venture Partners III, L.P., a Delaware limited partnership and CVP III Coinvestments, L.P., dated October 12, 2012 | 10-Q | No. 000-25232 | 2.1 | January 8, 2013 | ||
2.5 | Share Sale Agreement by and among the Sellers and Restrained Persons party thereto, ACN 149 902 330 Pty Limited, Apollo Global Asia-Pacific Pty Ltd and Apollo Education Group, Inc., dated December 16, 2013(1) | 10-Q | No. 000-25232 | 2.1 | April 1, 2014 | ||
3.1 | Amended and Restated Articles of Incorporation of Apollo Education Group, Inc., as amended effective November 15, 2013 | 10-Q | No. 000-25232 | 3.1 | January 7, 2014 | ||
3.2 | Amended and Restated Bylaws of Apollo Education Group, Inc. | 10-Q | No. 000-25232 | 3.2 | January 7, 2014 | ||
10.1 | Apollo Group, Inc. Long-Term Incentive Plan* | S-1 | No. 33-83804 | 10.3 | September 9, 1994 | ||
10.2 | Apollo Group, Inc. Plan Amendment to Long-Term Incentive Plan* | 10-Q | No. 000-25232 | 10.5 | June 28, 2007 | ||
10.3 | Apollo Group, Inc. Plan Amendment to Long-Term Incentive Plan* | 10-K | No. 000-25232 | 10.3 | October 27, 2009 | ||
10.4 | Apollo Group, Inc. Amended and Restated Savings and Investment Plan* | 10-Q | No. 000-25232 | 10.4 | January 14, 2002 | ||
10.5 | Apollo Group, Inc. Third Amended and Restated 1994 Employee Stock Purchase Plan* | 10-K | No. 000-25232 | 10.5 | November 14, 2005 | ||
10.6 | Apollo Group, Inc. 2000 Stock Incentive Plan (as amended and restated June 25, 2009)* | 10-Q | No. 000-25232 | 10.3 | June 29, 2009 | ||
10.7 | Apollo Group, Inc. 2000 Stock Incentive Plan Amendment (effective June 24, 2010)* | 8-K | No. 000-25232 | 10.3 | June 30, 2010 | ||
10.8 | Apollo Group, Inc. Amended and Restated 2000 Stock Incentive Plan Amendment (effective October 6, 2011)* | 10-K | No. 000-25232 | 10.8 | October 20, 2011 | ||
10.9 | Apollo Group, Inc. Amended and Restated 2000 Stock Incentive Plan Amendment (effective December 8, 2011)* | 10-Q | No. 000-25232 | 10.2 | March 26, 2012 | ||
10.10 | Apollo Group, Inc. Amended and Restated 2000 Stock Incentive Plan Amendment (effective December 13, 2012)* | 10-K | No. 000-25232 | 10.10 | October 22, 2013 | ||
118
Incorporated by Reference | |||||||
Exhibit Number | Exhibit Description | Form | File No. | Exhibit Number | Filing Date | Filed Herewith | |
10.11 | Form of Performance Share Award Agreement (Apollo Global Metrics)* (used for awards from 2011-2012) | 10-K | No. 000-25232 | 10.21 | October 20, 2011 | ||
10.12 | Form of Performance Share Award Agreement (Apollo Global Metrics) (revised June 25, 2013)* (used for awards in and after August 2013) | 10-Q | No. 000-25232 | 10.4 | June 25, 2013 | ||
10.13 | Form of Performance Share Award Agreement (Apollo Group Metrics)* (used for awards from 2011-2012) | 10-K | No. 000-25232 | 10.22 | October 20, 2011 | ||
10.14 | Form of Performance Share Award Agreement (Apollo Group Metrics) (revised June 25, 2013)* (used for awards in and after August 2013) | 10-Q | No. 000-25232 | 10.5 | June 25, 2013 | ||
10.15 | Form of Cash Retention Award Agreement* | 10-Q | No. 000-25232 | 10.1 | January 8, 2013 | ||
10.16 | Form of Special Cash Retention Award Agreement* | 10-Q | No. 000-25232 | 10.6 | June 25, 2013 | ||
10.17 | Form of Apollo Group, Inc. Non-Employee Director Stock Option Agreement* (used for awards prior to July 2011) | 10-Q | No. 000-25232 | 10.6 | June 28, 2007 | ||
10.18 | Form of Apollo Group, Inc. Non-Employee Director Stock Option Agreement With Limited Transferability* (used for awards in and after July 2011) | 10-K | No. 000-25232 | 10.10 | October 20, 2011 | ||
10.19 | Form of Apollo Group, Inc. Non-Employee Director Restricted Stock Unit Award Agreement* | 10-Q | No. 000-25232 | 10.7 | June 28, 2007 | ||
10.20 | Form of Apollo Group, Inc. Stock Option Agreement (for officers with an employment agreement)* (used for awards prior to July 2011 and for July 2012 award) | 10-Q | No. 000-25232 | 10.3 | January 8, 2009 | ||
10.21 | Form of Apollo Group, Inc. Stock Option Agreement With Limited Transferability (for officers with an employment agreement)* (used for July 2011 and March 2013 awards) | 10-K | No. 000-25232 | 10.15 | October 20, 2011 | ||
10.22 | Form of Apollo Group, Inc. Stock Option Agreement With Limited Transferability (for officers with an employment agreement) (revised June 25, 2013)* (used for awards from August 2013 to July 2014) | 10-Q | No. 000-25232 | 10.2 | June 25, 2013 | ||
10.23 | Form of Apollo Education Group, Inc. Stock Option Agreement With Limited Transferability* (used for awards to Gregory W. Cappelli in and after August 2014) | X | |||||
10.24 | Form of Non-Statutory Stock Option Agreement (for officers without an employment agreement)* (used for awards prior to July 2011) | 10-Q | No. 000-25232 | 10.4 | January 8, 2009 | ||
10.25 | Form of Non-Statutory Stock Option Agreement With Limited Transferability (for officers without an employment agreement)* (used for awards from July 2011 to July 2013) | 10-K | No. 000-25232 | 10.14 | October 20, 2011 | ||
10.26 | Form of Apollo Group, Inc. Stock Option Agreement With Limited Transferability (for officers without an employment agreement) (revised June 25, 2013)* (used for awards from August 2013 to July 2014) | 10-Q | No. 000-25232 | 10.1 | June 25, 2013 | ||
119
Incorporated by Reference | |||||||
Exhibit Number | Exhibit Description | Form | File No. | Exhibit Number | Filing Date | Filed Herewith | |
10.27 | Form of Apollo Education Group, Inc. Stock Option Agreement with Limited Transferability* (used for awards to officers other than Gregory W. Cappelli in and after August 2014) | X | |||||
10.28 | Form of Apollo Group, Inc. Restricted Stock Unit Award Agreement (for officers with an employment agreement)* (used for awards in July 2009) | 10-Q | No. 000-25232 | 10.1 | January 8, 2009 | ||
10.29 | Form of Apollo Group, Inc. Restricted Stock Unit Award Agreement (for officers without an employment agreement)* (used for awards in July 2009) | 10-Q | No. 000-25232 | 10.2 | January 8, 2009 | ||
10.30 | Form of Restricted Stock Unit Award Agreement (Special Retention Award - Form A)* | 10-Q | No. 000-25232 | 10.1 | March 29, 2011 | ||
10.31 | Form of Restricted Stock Unit Award Agreement (Special Retention Award - Form B)* | 10-Q | No. 000-25232 | 10.2 | March 29, 2011 | ||
10.32 | Form of Restricted Stock Unit Award Agreement With Performance Condition and Partial Service Vesting Acceleration* (used for awards from 2010 to July 2013) | 10-K | No. 000-25232 | 10.20 | October 20, 2011 | ||
10.33 | Form of Restricted Stock Unit Award Agreement With Performance Condition and Partial Service Vesting Acceleration (revised June 25, 2013)* (used for awards from August 2013 to July 2014) | 10-Q | No. 000-25232 | 10.3 | June 25, 2013 | ||
10.34 | Form of Restricted Stock Unit Award Agreement With Performance Condition and Partial Service Vesting Acceleration* (used for awards to officers other than Gregory W. Cappelli in and after August 2014) | X | |||||
10.35 | Form of Restricted Stock Unit Award Agreement With Performance Condition and Partial Service Vesting Acceleration* (used for awards to Gregory W. Cappelli in and after August 2014) | X | |||||
10.36 | Aptimus, Inc. 2001 Stock Plan* | S-8 | No. 333-147151 | 99.1 | November 5, 2007 | ||
10.37 | Apollo Group, Inc. Stock Option Assumption Agreement Aptimus, Inc. 2001 Stock Plan* | S-8 | No. 333-147151 | 99.2 | November 5, 2007 | ||
10.38 | Apollo Group, Inc. Stock Appreciation Right Assumption Agreement Aptimus, Inc. 2001 Stock Plan* | S-8 | No. 333-147151 | 99.3 | November 5, 2007 | ||
10.39 | Aptimus, Inc. 1997 Stock Option Plan, as amended* | S-8 | No. 333-147151 | 99.4 | November 5, 2007 | ||
10.40 | Apollo Group, Inc. Stock Option Assumption Agreement Aptimus, Inc. 1997 Stock Option Plan, as amended* | S-8 | No. 333-147151 | 99.5 | November 5, 2007 | ||
10.41 | Apollo Group, Inc. Executive Officer Performance Incentive Plan (as amended and restated effective as of October 6, 2011)* | 10-K | No. 000-25232 | 10.28 | October 20, 2011 | ||
10.42 | Amendment to Apollo Group, Inc. Executive Officer Performance Incentive Plan (as amended and restated effective as of October 6, 2011) (effective December 8, 2011)* | 10-Q | No. 000-25232 | 10.2 | January 5, 2012 | ||
10.43 | Amendment to Apollo Group, Inc. Executive Officer Performance Incentive Plan (as amended and restated effective as of October 6, 2011) (effective December 13, 2012)* | 10-K | No. 000-25232 | 10.40 | October 22, 2013 | ||
120
Incorporated by Reference | |||||||
Exhibit Number | Exhibit Description | Form | File No. | Exhibit Number | Filing Date | Filed Herewith | |
10.44 | Apollo Group, Inc. Deferral Election Program for Non-Employee Board Members* | 10-K | No. 000-25232 | 10.20 | October 27, 2009 | ||
10.45 | Apollo Group, Inc. Deferred Compensation Plan (effective February 1, 2012) (as amended and restated November 15, 2013)* | 10-Q | No. 000-25232 | 10.1 | January 7, 2014 | ||
10.46 | Apollo Group, Inc. Senior Executive Severance Pay Plan (as amended and restated effective as of September 1, 2013)* | 10-K | No. 000-25232 | 10.43 | October 22, 2013 | ||
10.47 | Form of Indemnification Agreement - Employee Director* | 10-K | No. 000-25232 | 10.23 | October 21, 2010 | ||
10.48 | Form of Indemnification Agreement - Outside Director* | 10-K | No. 000-25232 | 10.24 | October 21, 2010 | ||
10.49 | Shareholder Agreement among Apollo Group, Inc. and holders of Apollo Group Class B common stock, dated September 7, 1994 | S-1 | No. 33-83804 | 10.1 | September 9, 1994 | ||
10.50 | Amendment to Shareholder Agreement among Apollo Group, Inc. and holders of Apollo Group Class B common stock, dated May 25, 2001 | 10-K | No. 000-25232 | 10.10b | November 28, 2001 | ||
10.51 | Amendment to Shareholder Agreement among Apollo Group, Inc. and holders of Apollo Group Class B common stock, dated June 23, 2006 | 10-K | No. 000-25232 | 10.23c | October 27, 2009 | ||
10.52 | Amendment to Shareholder Agreement among Apollo Group, Inc. and holders of Apollo Group Class B common stock, dated May 19, 2009 | 10-K | No. 000-25232 | 10.23d | October 27, 2009 | ||
10.53 | Amended and Restated Employment Agreement between Apollo Group, Inc. and Gregory W. Cappelli, dated June 5, 2014* | X | |||||
10.57 | Offer letter between Apollo Group, Inc. and Sean Martin, dated August 23, 2010* | 10-Q | No. 000-25232 | 10.1 | January 10, 2011 | ||
10.58 | Clarification letter between Apollo Group, Inc. and Sean Martin, dated September 20, 2010* | 10-Q | No. 000-25232 | 10.2 | January 10, 2011 | ||
10.59 | Credit Agreement among Apollo Group, Inc., the Lenders from time to time party thereto, JPMorgan Chase Bank, N.A., as Administrative Agent, Bank of America, N.A. and Wells Fargo Bank, National Association, as Syndication Agents and U.S. Bank National Association, National Bank of Arizona, Morgan Stanley Bank, N.A. and Barclays Bank PLC, as Documentation Agents, dated as of April 18, 2012 | 10-Q | No. 000-25232 | 10.1 | June 25, 2012 | ||
10.60 | Commercial Lease between Cole of Phoenix AZ, LLC and Apollo Group, Inc., dated March 24, 2011 | 8-K | No. 000-25232 | 10.2 | March 24, 2011 | ||
10.61 | Offer Letter dated October 18, 2013 from Apollo Group, Inc. to J. Mitchell Bowling* | 8-K | No. 000-25232 | 10.1 | October 30, 2013 | ||
10.62 | Offer letter between University of Phoenix and Timothy Slottow dated March 18, 2014* | 10-Q | No. 000-25232 | 10.1 | June 25, 2014 | ||
21 | List of Subsidiaries | X | |||||
23.1 | Consent of Independent Registered Public Accounting Firm | X | |||||
31.1 | Certification of Principal Executive Officer Pursuant to Section 302 of the Sarbanes-Oxley Act of 2002 | X | |||||
121
Incorporated by Reference | |||||||
Exhibit Number | Exhibit Description | Form | File No. | Exhibit Number | Filing Date | Filed Herewith | |
31.2 | Certification of Principal Financial Officer Pursuant to Section 302 of the Sarbanes-Oxley Act of 2002 | X | |||||
32.1 | Certification of Chief Executive Officer Pursuant to 18 U.S.C. Section 1350, as adopted pursuant to Section 906 of the Sarbanes-Oxley Act of 2002 | X | |||||
32.2 | Certification of Chief Financial Officer Pursuant to 18 U.S.C. Section 1350, as adopted pursuant to Section 906 of the Sarbanes-Oxley Act of 2002 | X | |||||
101.INS | XBRL Instance Document | X | |||||
101.SCH | XBRL Taxonomy Extension Schema Document | X | |||||
101.CAL | XBRL Taxonomy Extension Calculation Linkbase Document | X | |||||
101.DEF | XBRL Taxonomy Extension Definition Linkbase Document | X | |||||
101.LAB | XBRL Taxonomy Extension Label Linkbase Document | X | |||||
101.PRE | XBRL Taxonomy Extension Presentation Linkbase Document | X | |||||
† References in this exhibit index to Apollo Group, Inc. shall be deemed to refer to Apollo Education Group, Inc., formerly known as Apollo Group, Inc.
* Indicates a management contract or compensation plan.
(1) Portions of this exhibit have been omitted pursuant to a request for confidential treatment from the Securities and Exchange Commission.
122
SIGNATURES
Pursuant to the requirements of Section 13 or 15(d) of the Securities Exchange Act of 1934, the registrant has duly caused this report to be signed on its behalf by the undersigned, thereunto duly authorized.
APOLLO EDUCATION GROUP, INC. An Arizona Corporation | ||
By: | /s/ Brian L. Swartz | |
Brian L. Swartz Senior Vice President and Chief Financial Officer (Principal Financial Officer) | ||
By: | /s/ Gregory J. Iverson | |
Gregory J. Iverson Vice President, Chief Accounting Officer and Controller (Principal Accounting Officer) | ||
Date: October 21, 2014
123
Pursuant to the requirements of the Securities Exchange Act of 1934, this report has been signed below by the following persons on behalf of the registrant and in the capacities and on the dates indicated.
Signature | Title | Date |
/s/ Peter V. Sperling | Chairman and Director | October 21, 2014 |
Peter V. Sperling | ||
/s/ Terri C. Bishop | Vice Chairman and Director | October 21, 2014 |
Terri C. Bishop | ||
/s/ Gregory W. Cappelli | Chief Executive Officer and Director (Principal Executive Officer) | October 21, 2014 |
Gregory W. Cappelli | ||
/s/ Brian L. Swartz | Senior Vice President and Chief Financial Officer (Principal Financial Officer) | October 21, 2014 |
Brian L. Swartz | ||
/s/ Gregory J. Iverson | Vice President, Chief Accounting Officer and Controller (Principal Accounting Officer) | October 21, 2014 |
Gregory J. Iverson | ||
/s/ Dana H. Born | Director | October 21, 2014 |
Dana H. Born | ||
/s/ Matthew Carter, Jr. | Director | October 21, 2014 |
Matthew Carter, Jr. | ||
/s/ Richard H. Dozer | Director | October 21, 2014 |
Richard H. Dozer | ||
/s/ Roy A. Herberger, Jr. | Director | October 21, 2014 |
Roy A. Herberger, Jr. | ||
/s/ Ann Kirschner | Director | October 21, 2014 |
Ann Kirschner | ||
/s/ Robert S. Murley | Director | October 21, 2014 |
Robert S. Murley | ||
/s/ Manuel F. Rivelo | Director | October 21, 2014 |
Manuel F. Rivelo | ||
/s/ Darby E. Shupp | Director | October 21, 2014 |
Darby E. Shupp | ||
/s/ Allen R. Weiss | Director | October 21, 2014 |
Allen R. Weiss | ||
124