Attached files
| file | filename |
|---|---|
| 8-K - AMERICAN CAMPUS COMMUNITIES, INC. 8-K - AMERICAN CAMPUS COMMUNITIES INC | a6375176.htm |
| EX-99.1 - EXHIBIT 99.1 - AMERICAN CAMPUS COMMUNITIES INC | a6375176ex99_1.htm |
Exhibit 99.2
Supplemental Analyst Package Second Quarter 2010 Earnings Call July 28, 2010
Table of Contents Consolidated Statements of Funds from Operations 4 Wholly-owned Property Results of Operations 5 Seasonality of Operations 6 Capital Structure 7 Portfolio Overview 8 2010/2011 Leasing Status - Summary 9 2010/2011 Leasing Status - By Property 10 Owned Development Update 14 Third-party Development Update 15 Management Services Update 16 Investor Information 17
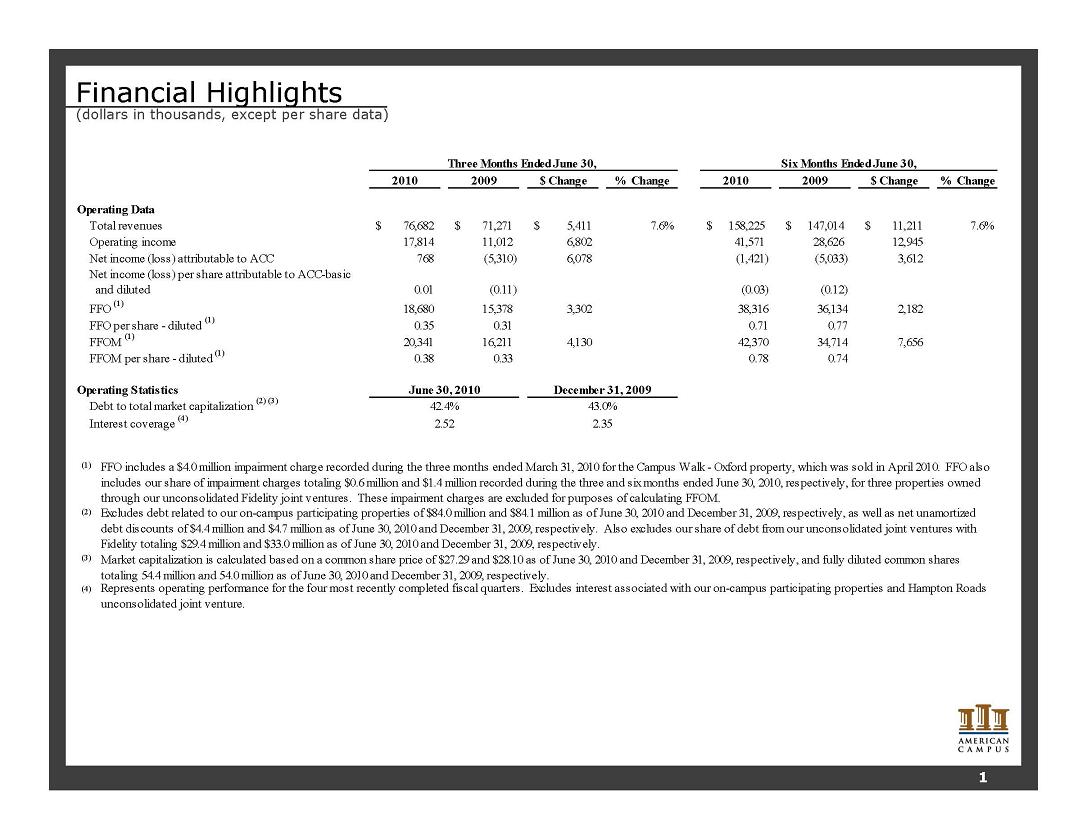
Financial Highlights (dollars in thousands, except per share data) 2010 2009 $ Change % Change 2010 2009 $ Change % Change 76,682 $ 71,271 $ 5,411 $ 7.6% 158,225 $ 147,014 $ 11,211 $ 7.6% 17,814 11,012 6,802 41,571 28,626 12,945 768 (5 310) 6 078 (1 421) (5 033) 3 612 Six Months Ended June 30, Three Months Ended June 30, Total revenues Net attributable to ACC Operating Data Operating income 5,310) 6,078 1,421) 5,033) 3,612 0.01 (0.11) (0.03) (0.12) 18,680 15,378 3,302 38,316 36,134 2,182 FFO per share - diluted (1) 0.35 0.31 0.71 0.77 20,341 16,211 4,130 42,370 34,714 7,656 FFOM per share - diluted (1) 0.38 0.33 0.78 0.74 Net income (loss) per share attributable to ACC-basic and diluted FFO (1) income (loss) FFOM (1) Debt to total market capitalization (2) (3) 42.4% 2.52 (1) June 30, 2010 December 31, 2009 Operating Statistics 2.35 43.0% Interest coverage (4) (1) FFO includes a $4.0 million impairment charge recorded during the three months ended March 31, 2010 for the Campus Walk - Oxford property, which was sold in April 2010. FFO also includes our share of impairment charges totaling $0.6 million and $1.4 million recorded during the three and six months ended June 30, 2010, respectively, for three properties owned through our unconsolidated Fidelity joint ventures. These impairment charges are excluded for purposes of calculating FFOM. (2) Excludes debt related to our on-campus participating properties of $84.0 million and $84.1 million as of June 30, 2010 and December 31, 2009, respectively, as well as net unamortized debt discounts of $4.4 million and $4.7 million as of June 30, 2010 and December 31, 2009, respectively. Also excludes our share of debt from our unconsolidated joint ventures with Fidelity totaling $29.4 million and $33.0 million as of June 30, 2010 and December 31, 2009, respectively. (3) Market capitalization is calculated based on a common share price of $27.29 and $28.10 as of June 30, 2010 and December 31, 2009, respectively, and fully diluted common shares totaling 54.4 million and 54.0 million as of June 30, 2010 and December 31, 2009, respectively. (4) Represents operating performance for the four most recently completed fiscal quarters. Excludes interest associated with our on-campus participating properties and Hampton Roads unconsolidated joint venture. 1
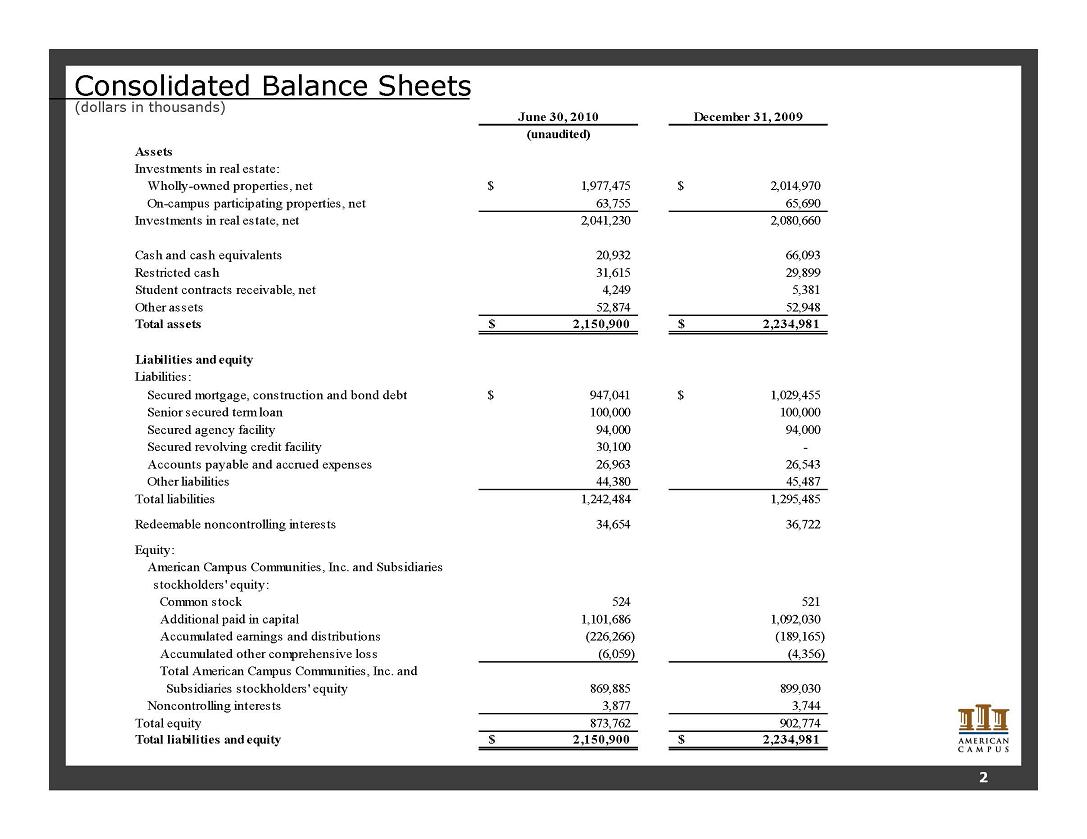
Consolidated Balance Sheets (dollars in thousands) June 30, 2010 December 31, 2009 (unaudited) Assets Investments in real estate: Wholly-owned properties, net 1,977,475 $ 2,014,970 $ On-campus participating properties, net 63,755 65,690 Investments in real estate, net 2,041,230 2,080,660 Cash and cash equivalents 20,932 66,093 Restricted cash 31,615 29,899 Student contracts receivable, net 4,249 5,381 Other assets 52,874 52,948 Total assets 2,150,900 $ 2,234,981 $ Liabilities and equity Liabilities: Secured mortgage, construction and bond debt 947,041 $ 1,029,455 $ Senior secured term loan 100,000 100,000 Secured agency facility 94,000 94,000 Secured revolving credit facility 30,100 - Accounts payable and accrued expenses 26,963 26,543 Other liabilities 44,380 45,487 Total liabilities 1,242,484 1,295,485 Redeemable noncontrolling interests 34,654 36,722 Equity: American Campus Communities, Inc. and Subsidiaries stockholders' equity: Common stock 524 521 Additional paid in capital 1,101,686 1,092,030 Accumulated earnings and distributions (226,266) (189,165) Accumulated other comprehensive loss (6,059) (4,356) 869 885 899 030 Total American Campus Communities, Inc. and Subsidiaries stockholders' equity 869,885 899,030 Noncontrolling interests 3,877 3,744 Total equity 873,762 902,774 Total liabilities and equity 2,150,900 $ 2,234,981 $ 2
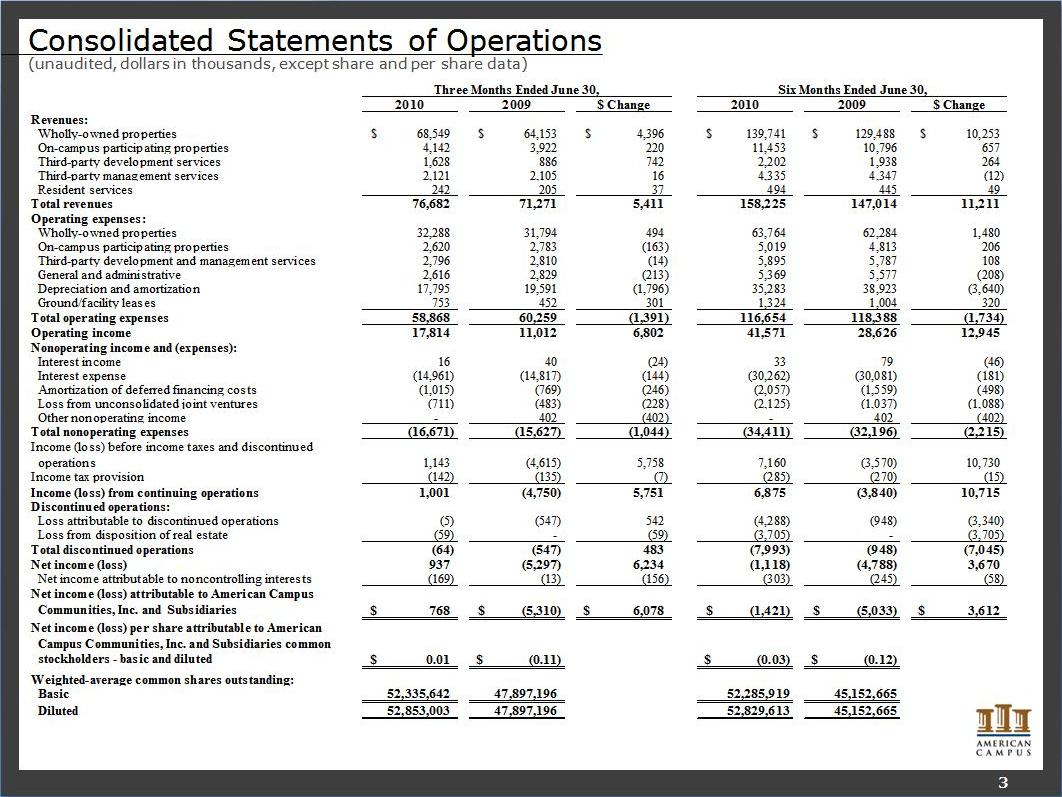
Consolidated Statements of Operations (unaudited, dollars in thousands, except share and per share data) Resident services 242 205 37 494 445 49 Total revenues 76,682 71,271 5,411 158,225 147,014 11,211 Operating expenses: Wholly-owned properties 32,288 31,794 494 63,764 62,284 1,480 On-campus participating properties 2,620 2,783 (163) 5,019 4,813 206 Third-party development and management services 2,796 2,810 (14) 5,895 5,787 108 General and administrative 2,616 2,829 (213) 5,369 5,577 (208) Depreciation and amortization 17,795 19,591 (1,796) 35,283 38,923 (3,640) Ground/facility leases 753 452 301 1,324 1,004 320 operating expenses 58 868 60 259 (1 391) 116 654 118 388 (1 734) Total 58,868 60,259 1,391) 116,654 118,388 1,734) Operating income 17,814 11,012 6,802 41,571 28,626 12,945 Nonoperating income and (expenses): Interest income 16 40 (24) 33 79 (46) Interest expense (14,961) (14,817) (144) (30,262) (30,081) (181) Amortization of deferred financing costs (1,015) (769) (246) (2,057) (1,559) (498) Loss from unconsolidated joint ventures (711) (483) (228) (2,125) (1,037) (1,088) Other nonoperating income - 402 (402) - 402 (402) Total nonoperating expenses (16,671) (15,627) (1,044) (34,411) (32,196) (2,215) Income (loss) before income taxes and discontinued operations 1,143 (4,615) 5,758 7,160 (3,570) 10,730 Income tax provision (142) (135) (7) (285) (270) (15) Income (loss) from continuing operations 1,001 (4,750) 5,751 6,875 (3,840) 10,715 Discontinued operations: Loss attributable to discontinued (5) (547) 542 (4,288) (948) (3,340) operations Loss from disposition of real estate (59) - (59) (3,705) - (3,705) Total discontinued operations (64) (547) 483 (7,993) (948) (7,045) Net income (loss) 937 (5,297) 6,234 (1,118) (4,788) 3,670 Net income attributable to noncontrolling interests (169) (13) (156) (303) (245) (58) Net income (loss) attributable to American Campus Communities, Inc. and Subsidiaries 768 $ (5,310) $ 6,078 $ (1,421) $ (5,033) $ 3,612 $ Net (loss) per share attributable to American income Campus Communities, Inc. and Subsidiaries common stockholders - basic and diluted 0.01 $ (0.11) $ (0.03) $ (0.12) $ Weighted-average common shares outstanding: Basic 52,335,642 47,897,196 52,285,919 45,152,665 Diluted 52,853,003 47,897,196 52,829,613 45,152,665 3
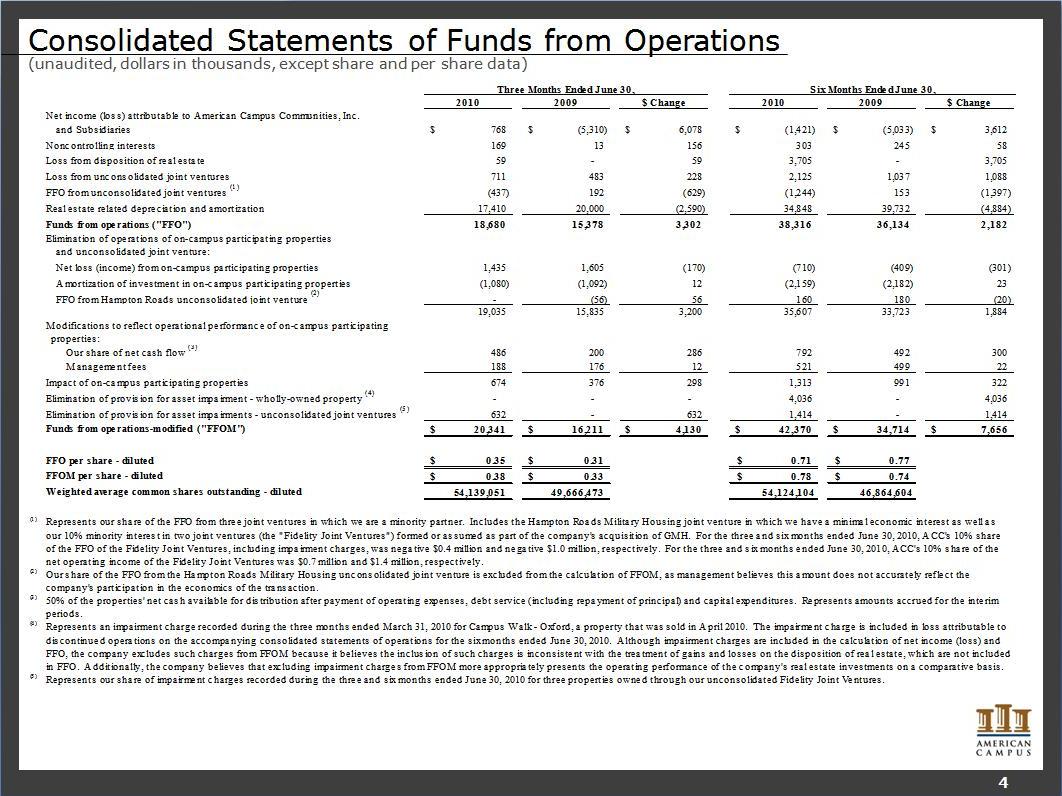
Consolidated Statements of Funds from Operations (unaudited, dollars in thousands, except share and per share data) Noncontrolling interests 169 13 156 303 245 58 Loss from disposition of real estate 59 - 59 3,705 - 3,705 Loss from unconsolidated joint ventures 711 483 228 2,125 1,037 1,088 FFO from unconsolidated joint ventures (1) (437) 192 (629) (1,244) 153 (1,397) Real estate related depreciation and amortization 17,410 20,000 (2,590) 34,848 39,732 (4,884) Funds from operations ("FFO") 18,680 15,378 3,302 38,316 36,134 2,182 Elimination of operations of on-campus participating properties and unconsolidated joint venture: Net loss (income) from on-campus participating properties 1,435 1,605 (170) (710) (409) (301) Amortization of investment in on-campus participating properties (1,080) (1,092) 12 (2,159) (2,182) 23 FFO from Hampton Roads unconsolidated joint venture (2) - (56) 56 160 180 (20) 19,035 15,835 3,200 35,607 33,723 1,884 Modifications to reflect operational performance of on-campus participating properties: Our share of net cash flow (3) 486 200 286 792 492 300 Management fees 188 176 12 521 499 22 991 322 Impact of on-campus participating properties 674 376 1,313 Elimination of provision for asset impairment - wholly-owned property (4) - - - 4,036 - 4,036 Elimination of provision for asset impairments - unconsolidated joint ventures (5) 632 - 632 1,414 - 1,414 Funds from operations-modified ("FFOM") 20,341 $ 16,211 $ 4,130 $ 42,370 $ 34,714 $ 7,656 $ FFO per share - diluted 0.35 $ 0.31 $ 0.71 $ 0.77 $ FFOM per share - diluted 0.38 $ 0.33 $ 0.78 $ 0.74 $ Weighted average common shares outstanding - diluted 54,139,051 49,666,473 54,124,104 46,864,604 (1) Represents our share of the FFO from three joint ventures in which we are a minority partner. Includes the Hampton Roads Military Housing joint venture in which we have a minimal economic interest as well as our 10% minority interest in two joint ventures (the "Fidelity Joint Ventures") formed or assumed as part of the company's acquisition of GMH. For the three and six months ended June 30, 2010, ACC's 10% share of the FFO of the Fidelity Joint Ventures, including impairment charges, was negative $0.4 million and negative $1.0 million, respectively. For the three and six months ended June 30, 2010, ACC's 10% share of the net operating income of the Fidelity Joint Ventures was $0.7 million and $1.4 million, respectively. (2) Our share of the FFO from the Hampton Roads Military Housing unconsolidated joint venture is excluded from the calculation of FFOM, as management believes this amount does not accurately reflect the company's participation in the economics of the transaction. (3) 50% of the properties' net cash available for distribution after payment of operating expenses, debt service (including repayment of principal) and capital expenditures. Represents amounts accrued for the interim periods. (4) Represents an impairment charge recorded during the three months ended March 31, 2010 for Campus Walk - Oxford, a property that was sold in April 2010. The impairment charge is included in loss attributable to discontinued operations on the accompanying consolidated statements of operations for the six months ended June 30, 2010. Although impairment charges are included in the calculation of net income (loss) and FFO, the company excludes such charges from FFOM because it believes the inclusion of such charges is inconsistent with the treatment of gains and losses on the disposition of real estate, which are not included in FFO. Additionally, the company believes that excluding impairment charges from FFOM more appropriately presents the operating performance of the company's real estate investments on a comparative basis. (5) Represents our share of impairment charges recorded during the three and six months ended June 30, 2010 for three properties owned through our unconsolidated Fidelity Joint Ventures. 4
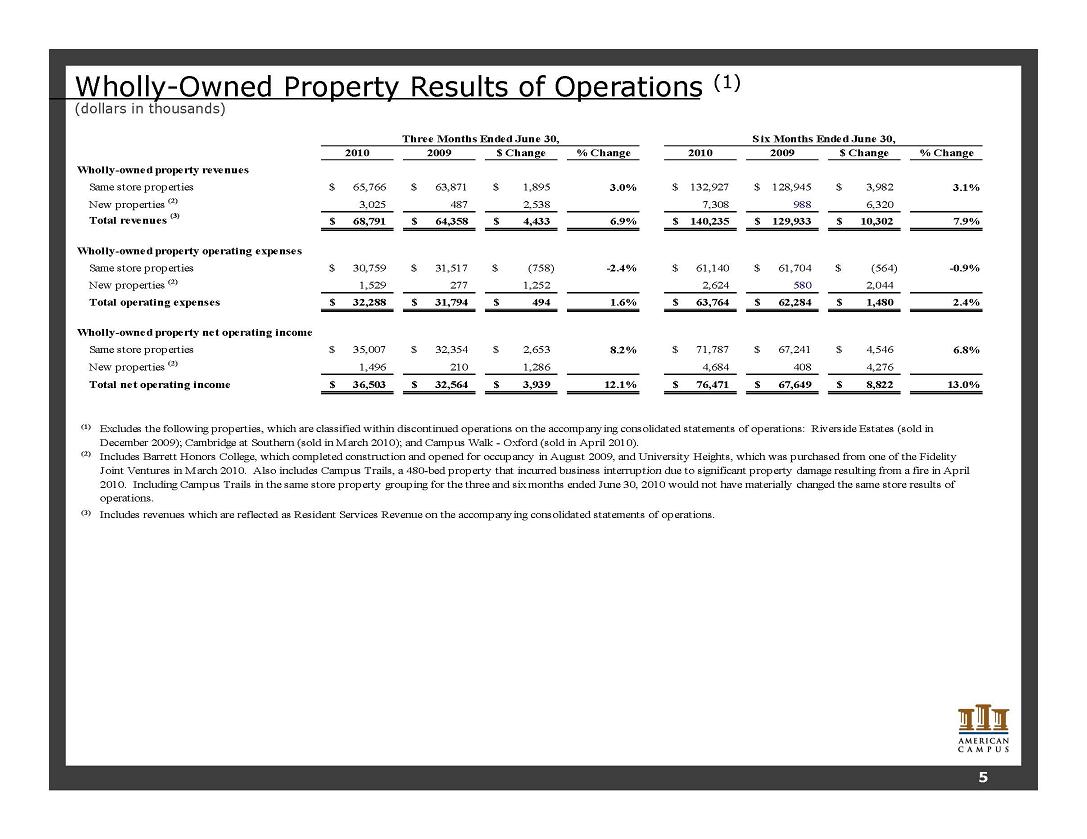
Wholly-Owned Property Results of Operations (1) (dollars in thousands) 2010 2009 $ % 2010 2009 $ Change % Three Months Ended June 30, Six Months Ended June 30, Change Change Change Wholly-owned property revenues Same store properties 65,766 $ 63,871 $ 1,895 $ 3.0% 132,927 $ 128,945 $ 3,982 $ 3.1% New properties (2) 3,025 487 2,538 7,308 988 6,320 Total revenues (3) 68,791 $ 64,358 $ 4,433 $ 6.9% 140,235 $ 129,933 $ 10,302 $ 7.9% Wholly-owned property operating expenses Same store properties 30,759 $ 31,517 $ (758) $ -2.4% 61,140 $ 61,704 $ (564) $ -0.9% New properties (2) 1,529 277 1,252 2,624 580 2,044 Total operating expenses 32,288 $ 31,794 $ 494 $ 1.6% 63,764 $ 62,284 $ 1,480 $ 2.4% Wholly-owned property net operating income Same store properties 35,007 $ 32,354 $ 2,653 $ 8.2% 71,787 $ 67,241 $ 4,546 $ 6.8% New properties (2) 1 496 210 1 286 4 684 408 4 276 ) 1,496 1,286 4,684 4,276 Total net operating income 36,503 $ 32,564 $ 3,939 $ 12.1% 76,471 $ 67,649 $ 8,822 $ 13.0% (1) Excludes the following properties, which are classified within discontinued operations on the accompanying consolidated statements of operations: Riverside Estates (sold in December 2009); Cambridge at Southern (sold in March 2010); and Campus Walk - Oxford (sold in April 2010). (2) Includes Barrett Honors College, which completed construction and opened for occupancy in August 2009, and University Heights, which was purchased from one of the Fidelity Joint Ventures in March 2010. Also includes Campus Trails a 480-bed property that incurred business interruption due to significant property damage resulting from a fire in April 2010. Including Campus Trails in the same store property grouping for the three and six months ended June 30, 2010 would not have materially changed the same store results of operations. (3) Includes revenues which are reflected as Resident Services Revenue on the accompanying consolidated statements of operations. 5
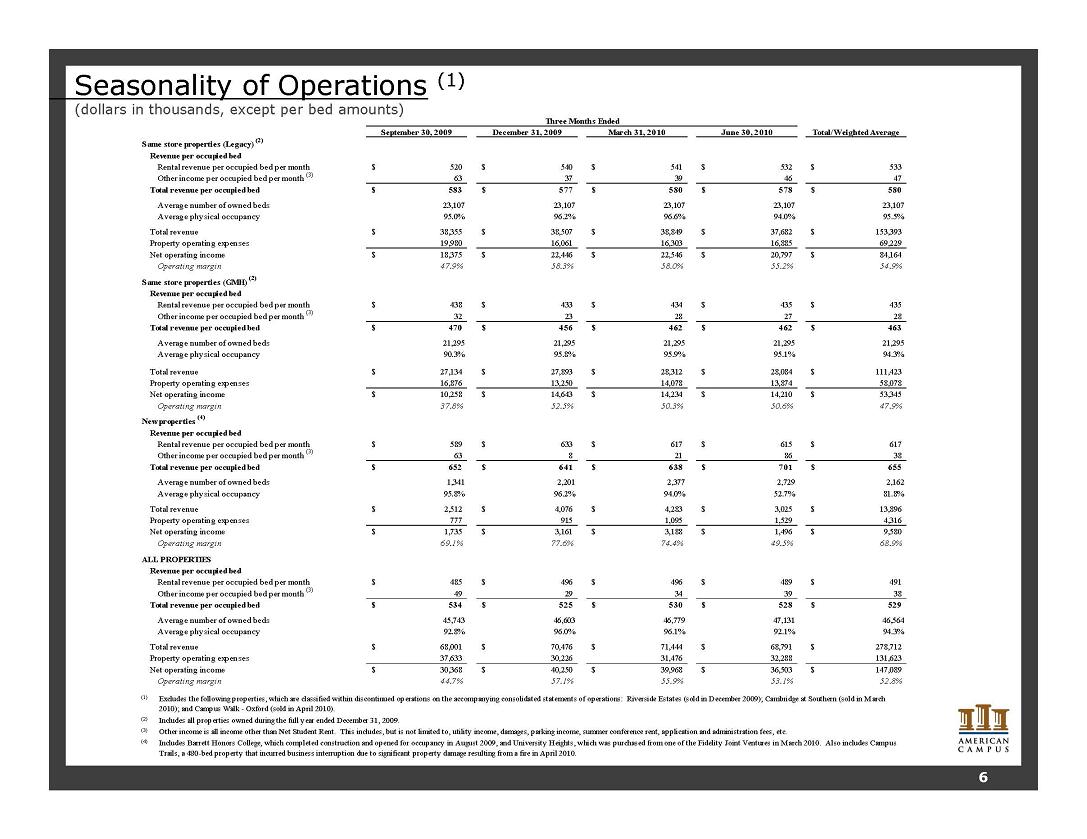
Seasonality of Operations (1) (dollars in thousands, except per bed amounts) September 30, 2009 December 31, 2009 March 31, 2010 June 30, 2010 Total/Weighted Average Same store properties (Legacy) (2) Revenue occupied bed Three Months Ended per occupied bed Rental revenue per occupied bed per month 520 $ 540 $ 541 $ 532 $ 533 $ Other income per occupied bed per month (3) 63 37 39 46 47 Total revenue per occupied bed 583 $ 577 $ 580 $ 578 $ 580 $ Average number of owned beds 23,107 23,107 23,107 23,107 23,107 Average physical occupancy 95.0% 96.2% 96.6% 94.0% 95.5% Total revenue 38,355 $ 38,507 $ 38,849 $ 37,682 $ 153,393 $ Property operating expenses 19,980 16,061 16,303 16,885 69,229 Net operating income 18,375 $ 22,446 $ 22,546 $ 20,797 $ 84,164 $ Operating margin 47.9% 58.3% 58.0% 55.2% 54.9% Same store properties (GMH) (2) Revenue per occupied bed Rental revenue per occupied bed per month 438 $ 433 $ 434 $ 435 $ 435 $ Other income per occupied bed per month (3) 32 23 28 27 28 Total revenue per occupied bed 470 $ 456 $ 462 $ 462 $ 463 $ Average number of owned beds 21,295 21,295 21,295 21,295 21,295 Average physical occupancy 90.3% 95.8% 95.9% 95.1% 94.3% Total revenue 27,134 $ 27,893 $ 28,312 $ 28,084 $ 111,423 $ Property operating expenses 16,876 13,250 14,078 13,874 58,078 Net operating income 10,258 $ 14,643 $ 14,234 $ 14,210 $ 53,345 $ Operating margin 37.8% 52.5% 50.3% 50.6% 47.9% New properties (4) Revenue per occupied bed Rental revenue per occupied bed per month 589 $ 633 $ 617 $ 615 $ 617 $ Other income per occupied bed per month (3) 63 8 21 86 38 Total revenue per occupied bed 652 $ 641 $ 638 $ 701 $ 655 $ Average number of owned beds 1,341 2,201 2,377 2,729 2,162 Average physical occupancy 95.8% 96.2% 94.0% 52.7% 81.8% Total revenue 2,512 $ 4,076 $ 4,283 $ 3,025 $ 13,896 $ Property operating expenses 777 915 1,095 1,529 4,316 Net operating income 1,735 $ 3,161 $ 3,188 $ 1,496 $ 9,580 $ Operating margin 69.1% 77.6% 74.4% 49.5% 68.9% ALL PROPERTIES Revenue per occupied bed Rental revenue per occupied bed per month 485 $ 496 $ 496 $ 489 $ 491 $ Other income per occupied bed per month (3) 49 29 34 39 38 Total revenue per occupied bed 534 $ 525 $ 530 $ 528 $ 529 $ Average number of owned beds 45,743 46,603 46,779 47,131 46,564 Average physical occupancy 92.8% 96.0% 96.1% 92.1% 94.3% Total revenue 68,001 $ 70,476 $ 71,444 $ 68,791 $ 278,712 $ Property operating expenses 37,633 30,226 31,476 32,288 131,623 Net operating income 30,368 $ 40,250 $ 39,968 $ 36,503 $ 147,089 $ Operating margin 44.7% 57.1% 55.9% 53.1% 52.8% (1) Excludes the following properties, which are classified within discontinued operations on the accompanying consolidated statements of operations: Riverside Estates (sold in December 2009); Cambridge at Southern (sold in March 2010); and Campus Walk - Oxford (sold in April 2010). (2) Includes all properties owned during the full year ended December 31, 2009. (3) Other income is all income other than Net Student Rent. This includes, but is not limited to, utility income, damages, parking income, summer conference rent, application and administration fees, etc. (4) Includes Barrett Honors College, which completed construction and opened for occupancy in August 2009, and University Heights, which was purchased from one of the Fidelity Joint Ventures in March 2010. Also includes Campus Trails, a 480-bed property that incurred business interruption due to significant property damage resulting from a fire in April 2010. 6
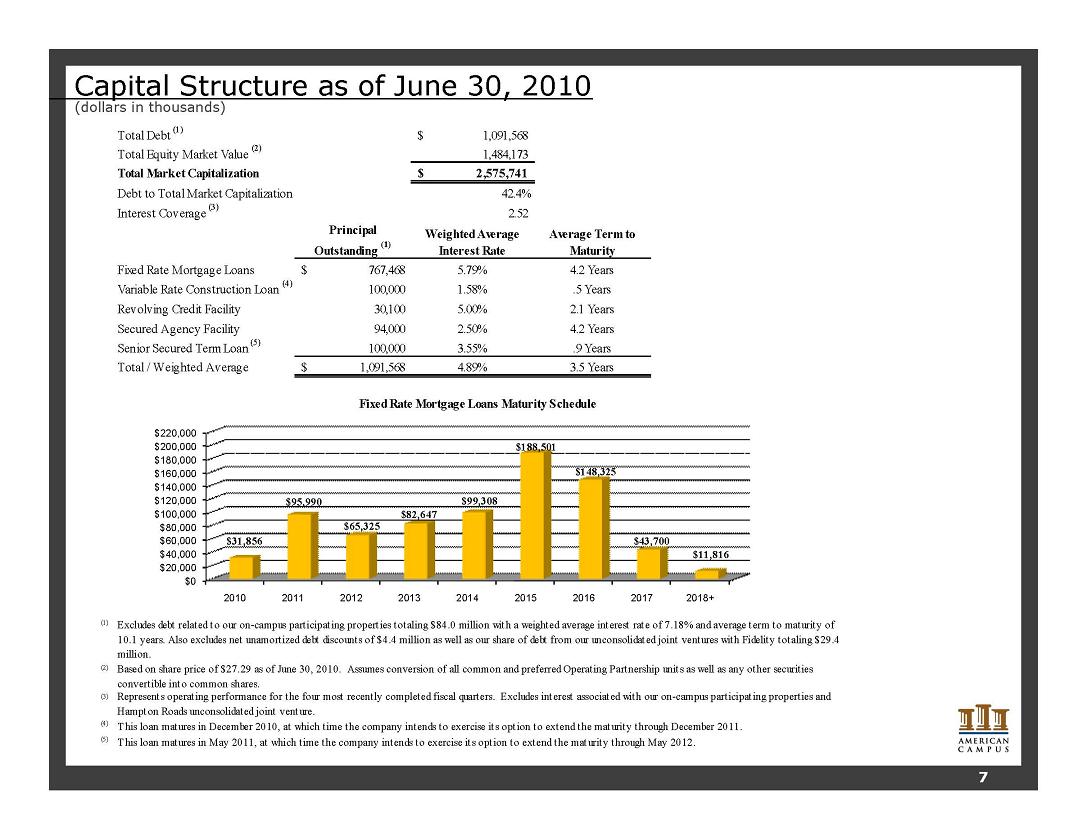
Capital Structure as of June 30, 2010 (dollars in thousands) Total Debt (1) 1,091,568 $ Total Equity Market Value (2) 1 484 173 1,484,173 Total Market Capitalization 2,575,741 $ Debt to Total Market Capitalization 42.4% Interest Coverage (3) 2.52 Principal Outstanding (1) Weighted Average Interest Rate Average Term to Maturity Fixed Rate Mortgage Loans 767,468 $ 5.79% 4.2 Years Variable Rate Construction Loan (4) 100,000 1.58% .5 Years Revolving Credit Facility 30,100 5.00% 2.1 Years Secured Agency Facility 94,000 2.50% 4.2 Years Senior Secured Term Loan (5) 100,000 3.55% .9 Years Total / Weighted Average 1 091 568 $ 4 89% 3 5Years 1,091,568 4.89% 3.5 Years Fixed Rate Mortgage Loans Maturity Schedule $31,856 $95,990 $65,325 $82,647 $99,308 $188,501 $148 325 $43,700 $11,816 $0 $20,000 $40,000 $60,000 $80,000 $100,000 $120,000 $140,000 $160 000 $180,000 $200,000 $220,000 2010 2011 2012 2013 2014 2015 2016 2017 2018+ (1) Excludes debt related to our on-campus participating properties totaling $84.0 million with a weighted average interest rate of 7.18% and average term to maturity of 10.1 years. Also excludes net unamortized debt discounts of $4.4 million as well as our share of debt from our unconsolidated joint ventures with Fidelity totaling $29.4 million. (2) Based on share price of $27.29 as of June 30, 2010. Assumes conversion of all common and preferred Operating Partnership units as well as any other securities convertible into common shares (3) Represents operating performance for the four most recently completed fiscal quarters. Excludes interest associated with our on-campus participating properties and Hampton Roads unconsolidated joint venture. (4) This loan matures in December 2010, at which time the company intends to exercise its option to extend the maturity through December 2011. (5) This loan matures in May 2011, at which time the company intends to exercise its option to extend the maturity through May 2012. 7
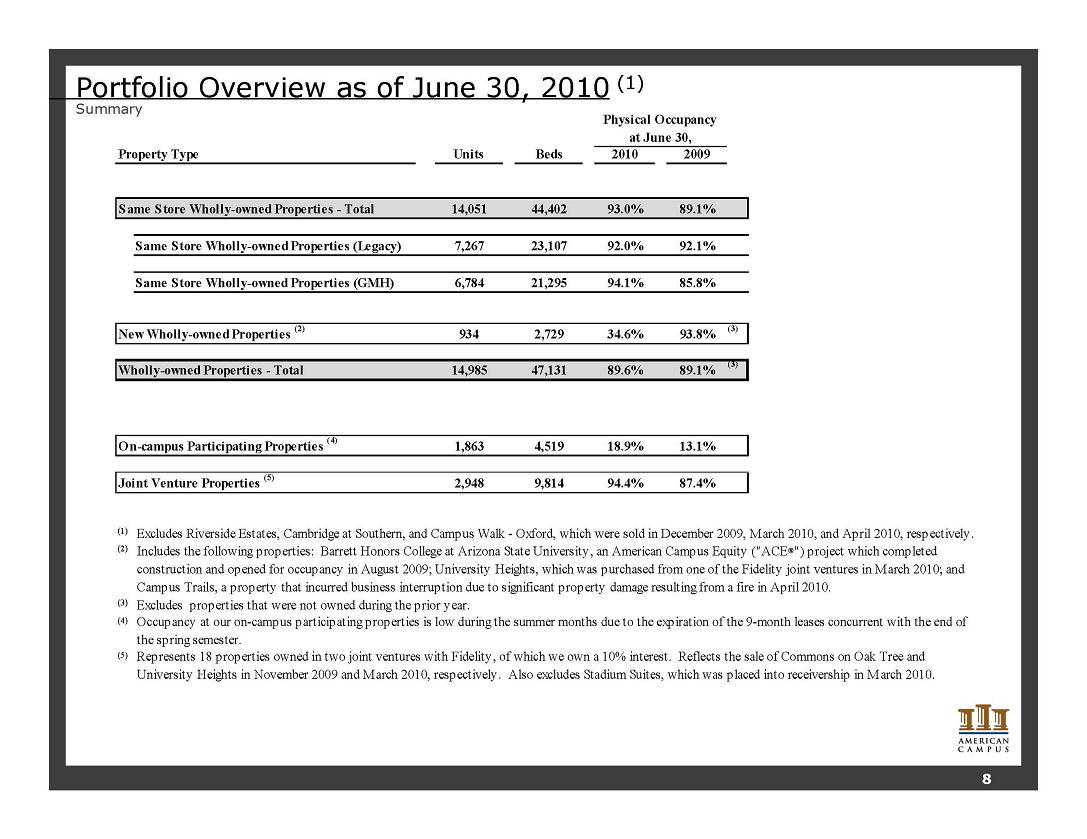
Portfolio Overview as of June 30, 2010 (1) Summary Units Beds 2010 2009 Physical Occupancy at June 30, Property Type Same Store Wholly-owned Properties - Total 14,051 44,402 93.0% 89.1% Same Store Wholly-owned Properties (Legacy) 7,267 23,107 92.0% 92.1% Same Store Wholly-owned Properties (GMH) 6,784 21,295 94.1% 85.8% New Wholly-owned Properties (2) 934 2,729 34.6% 93.8% (3) Wh ll d P ti T t l 14 985 47 131 89 6% 89 1% (3) Wholly-owned Properties - Total 14,985 47,131 89.6% 89.1% On-campus Participating Properties (4) 1,863 4,519 18.9% 13.1% Joint Venture Properties (5) 2,948 9,814 94.4% 87.4% (1) Excludes Riverside Estates, Cambridge at Southern, and Campus Walk - Oxford, which were sold in December 2009, March 2010, and April 2010, respectively. (2) Includes the following properties: Barrett Honors College at Arizona State University, an American Campus Equity ("ACE®") project which completed construction and opened for occupancy in August 2009; University Heights, which was purchased from one of the Fidelity joint ventures in March 2010; and Campus Trails, a property that incurred business interruption due to significant property damage resulting from a fire in April 2010. (3) Excludes properties that were not owned during the prior year. (4) Occupancy at our on-campus participating properties is low during the summer months due to the expiration of the 9-month leases concurrent with the end of the spring semester. (5) Represents 18 properties owned in two joint ventures with Fidelity, of which we own a 10% interest. Reflects the sale of Commons on Oak Tree and University Heights in November 2009 and March 2010, respectively. Also excludes Stadium Suites, which was placed into receivership in March 2010. 8
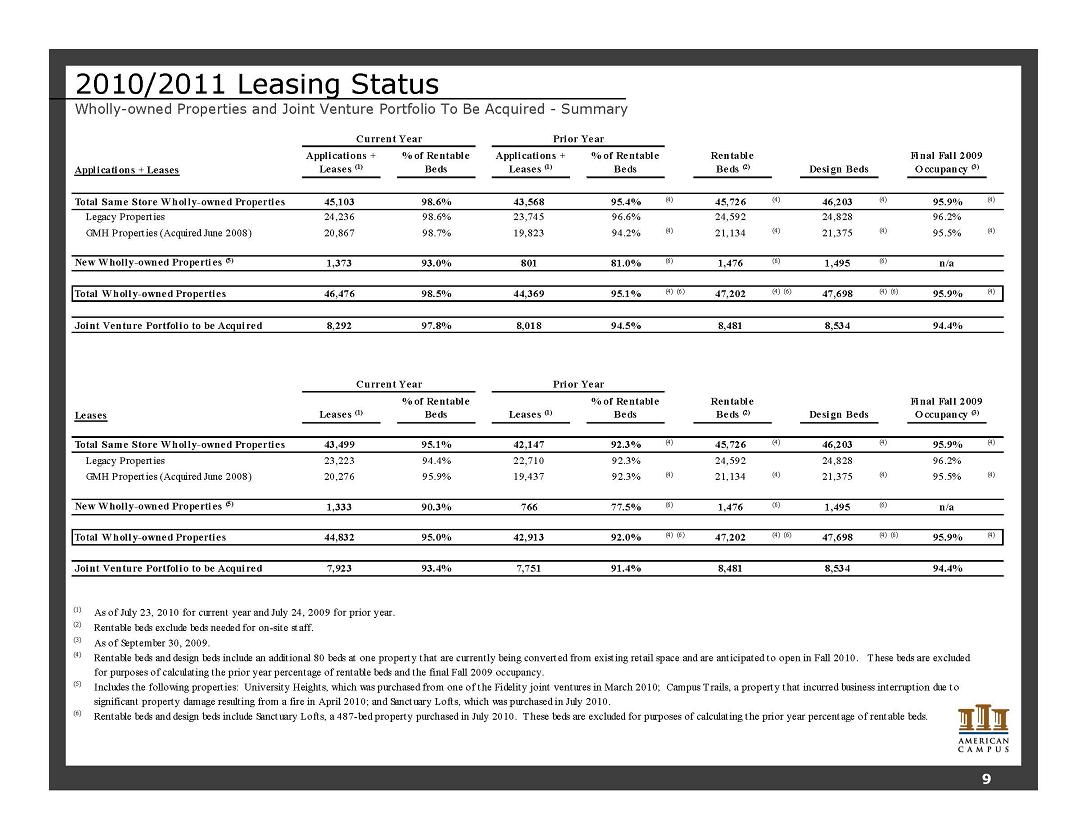
2010/2011 Leasing Status Wholly-owned Properties and Joint Venture Portfolio To Be Acquired - Summary Applications % of Rentable Applications % of Rentable Rentable Final Fall 2009 Current Year Prior Year Applications + Leases + Leases (1) Beds + Leases (1) Beds Beds (2) Design Beds Occupancy (3) Total Same Store Wholly-owned Properties 45,103 98.6% 43,568 95.4% (4) 45,726 (4) 46,203 (4) 95.9% (4) Legacy Properties 24,236 98.6% 23,745 96.6% 24,592 24,828 96.2% GMH Properties (Acquired June 2008) 20,867 98.7% 19,823 94.2% (4) 21,134 (4) 21,375 (4) 95.5% (4) New Wholly-owned Properties 1,373 93.0% 81.0% (6) 1,476 (6) 1,495 (6) n/a Total Wholly-owned Properties 46,476 98.5% 44,369 95.1% (4) (6) 47,202 (4) (6) 47,698 (4) (6) 95.9% (4) Joint Venture Portfolio to be Acquired 8,292 97.8% 8,018 94.5% 8,481 8,534 94.4% Leases Leases (1) % of Rentable Beds Leases (1) % of Rentable Beds Rentable Beds (2) Design Beds Final Fall 2009 Occupancy (3) Total Same Store Wholly-owned Properties 43,499 95.1% 42,147 92.3% (4) 45,726 (4) 46,203 (4) 95.9% (4) Legacy Properties 23,223 94.4% 22,710 92.3% 24,592 24,828 96.2% Current Year Prior Year GMH Properties (Acquired June 2008) 20,276 95.9% 19,437 92.3% 21,134 21,375 95.5% New Wholly-owned Properties (5) 1,333 90.3% 766 77.5% (6) 1,476 (6) 1,495 (6) n/a Total Wholly-owned Properties 44,832 95.0% 42,913 92.0% (4) (6) 47,202 (4) (6) 47,698 (4) (6) 95.9% (4) Joint Venture Portfolio to be Acquired 7,923 93.4% 7,751 91.4% 8,481 8,534 94.4% (1) As of July 23, 2010 for current year and July 24, 2009 for prior year. (2) Rentable beds exclude beds needed for on-site staff. (3) As of September 30, 2009. (4) Rentable beds and design beds include an additional 80 beds at one property that are currently being converted from existing retail space and are anticipated to open in Fall 2010. These beds are excluded for purposes of calculating the prior year percentage of rentable beds and the final Fall 2009 occupancy. (5) Includes the following properties: University Heights, which was purchased from one of the Fidelity joint ventures in March 2010; Campus Trails, a property that incurred business interruption due to significant property damage resulting from a fire in April 2010; and Sanctuary Lofts, which was purchased in July 2010. (6) Rentable beds and design beds include Sanctuary Lofts, a 487-bed property purchased in July 2010. T hese beds are excluded for purposes of calculating the prior year percentage of rentable beds. 9
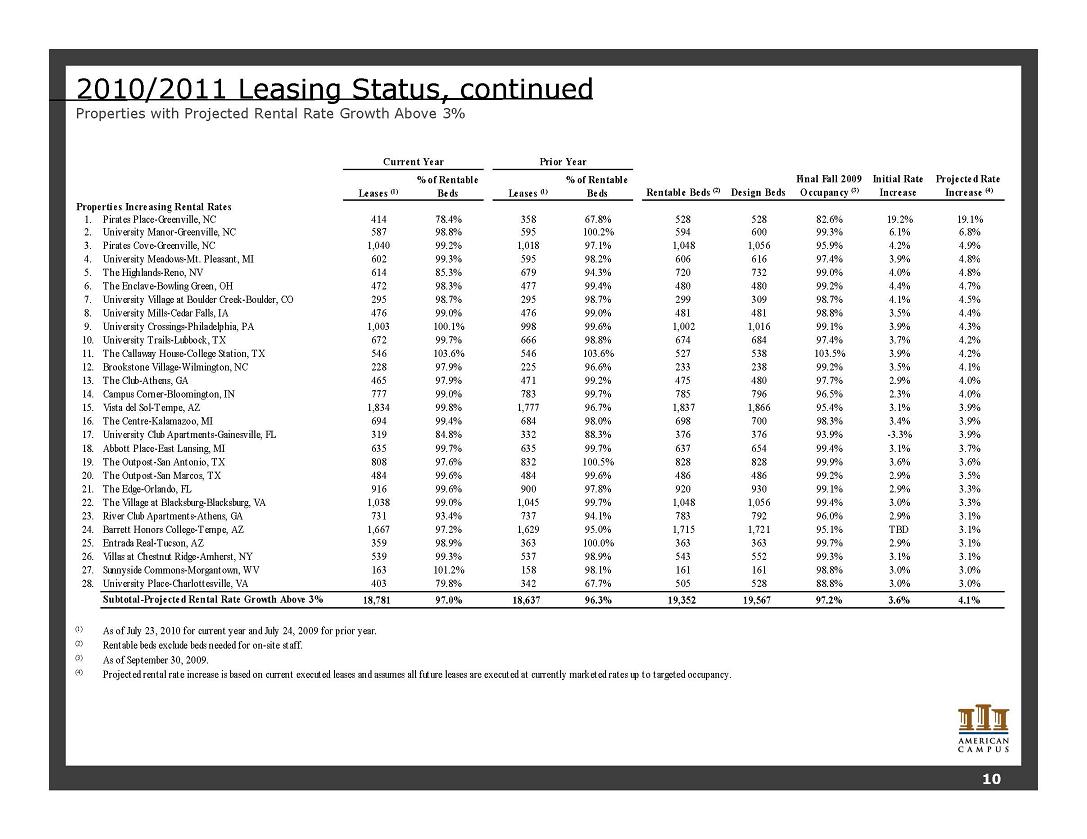
2010/2011 Leasing Status, continued Properties with Projected Rental Rate Growth Above 3% Leases (1) % of Rentable Beds Leases (1) % of Rentable Beds Properties Increasing Rental Rates 1. Pirates Place-Greenville, NC 414 78.4% 358 67.8% 528 528 82.6% 19.2% 19.1% 2. University Manor-Greenville, NC 587 98.8% 595 100.2% 594 600 99.3% 6.1% 6.8% 3. Pirates Cove-Greenville, NC 1,040 99.2% 1,018 97.1% 1,048 1,056 95.9% 4.2% 4.9% Initial Rate Increase Projected Rate Increase (4) Current Year Design Beds Final Fall 2009 Occupancy (3) Rentable Beds (2) Prior Year 4. University Meadows Mt. Pleasant, 99.3% 98.2% 97.4% 3.9% 4.8% 5. The Highlands-Reno, NV 614 85.3% 679 94.3% 720 732 99.0% 4.0% 4.8% 6. The Enclave-Bowling Green, OH 472 98.3% 477 99.4% 480 480 99.2% 4.4% 4.7% 7. University Village at Boulder Creek-Boulder, CO 295 98.7% 295 98.7% 299 309 98.7% 4.1% 4.5% 8. University Mills-Cedar Falls, IA 476 99.0% 476 99.0% 481 481 98.8% 3.5% 4.4% 9. University Crossings-Philadelphia, PA 1,003 100.1% 998 99.6% 1,002 1,016 99.1% 3.9% 4.3% 10. University Trails-Lubbock, TX 672 99.7% 666 98.8% 674 684 97.4% 3.7% 4.2% 11. The Callaway House-College Station, TX 546 103.6% 546 103.6% 527 538 103.5% 3.9% 4.2% 12 Brookstone Village Wilmington NC 228 97 9% 225 96 6% 233 99 2% 3 5% 4 1% 12. Village-Wilmington, 97.9% 96.6% 238 99.2% 3.5% 4.1% 13. The Club-Athens, GA 465 97.9% 471 99.2% 475 480 97.7% 2.9% 4.0% 14. Campus Corner-Bloomington, IN 777 99.0% 783 99.7% 785 796 96.5% 2.3% 4.0% 15. Vista del Sol-Tempe, AZ 1,834 99.8% 1,777 96.7% 1,837 1,866 95.4% 3.1% 3.9% 16. The Centre-Kalamazoo, MI 694 99.4% 684 98.0% 698 700 98.3% 3.4% 3.9% 17. University Club Apartments-Gainesville, FL 319 84.8% 332 88.3% 376 376 93.9% -3.3% 3.9% 18. Abbott Place-East Lansing, MI 635 99.7% 635 99.7% 637 654 99.4% 3.1% 3.7% 19. The Outpost-San Antonio, TX 808 97.6% 832 100.5% 828 828 99.9% 3.6% 3.6% 20. The Outpost-San Marcos, TX 99.6% 99.6% 486 99.2% 2.9% 3.5% 21. The Edge-Orlando, FL 916 99.6% 900 97.8% 920 930 99.1% 2.9% 3.3% 22. The Village at Blacksburg-Blacksburg, VA 1,038 99.0% 1,045 99.7% 1,048 1,056 99.4% 3.0% 3.3% 23. River Club Apartments-Athens, GA 731 93.4% 737 94.1% 783 792 96.0% 2.9% 3.1% 24. Barrett Honors College-Tempe, AZ 1,667 97.2% 1,629 95.0% 1,715 1,721 95.1% TBD 3.1% 25. Entrada Real-Tucson, AZ 359 98.9% 363 100.0% 363 363 99.7% 2.9% 3.1% 26. Villas at Chestnut Ridge-Amherst, NY 539 99.3% 537 98.9% 543 552 99.3% 3.1% 3.1% 27. Sunnyside Commons-Morgantown, WV 163 101.2% 158 98.1% 161 161 98.8% 3.0% 3.0% 28. University Place-Charlottesville, VA 403 79.8% 342 67.7% 505 528 88.8% 3.0% 3.0% Subtotal-Projected Rental Rate Growth Above 3% 18,781 97.0% 18,637 96.3% 19,352 19,567 97.2% 3.6% 4.1% (1) As of July 23, 2010 for current year and July 24, 2009 for prior year. (2) Rentable beds exclude beds needed for on-site staff. (3) As of September 30, 2009. (4) Projected rental rate increase is based on current executed leases and assumes all future leases are executed at currently marketed rates up to targeted occupancy. 10
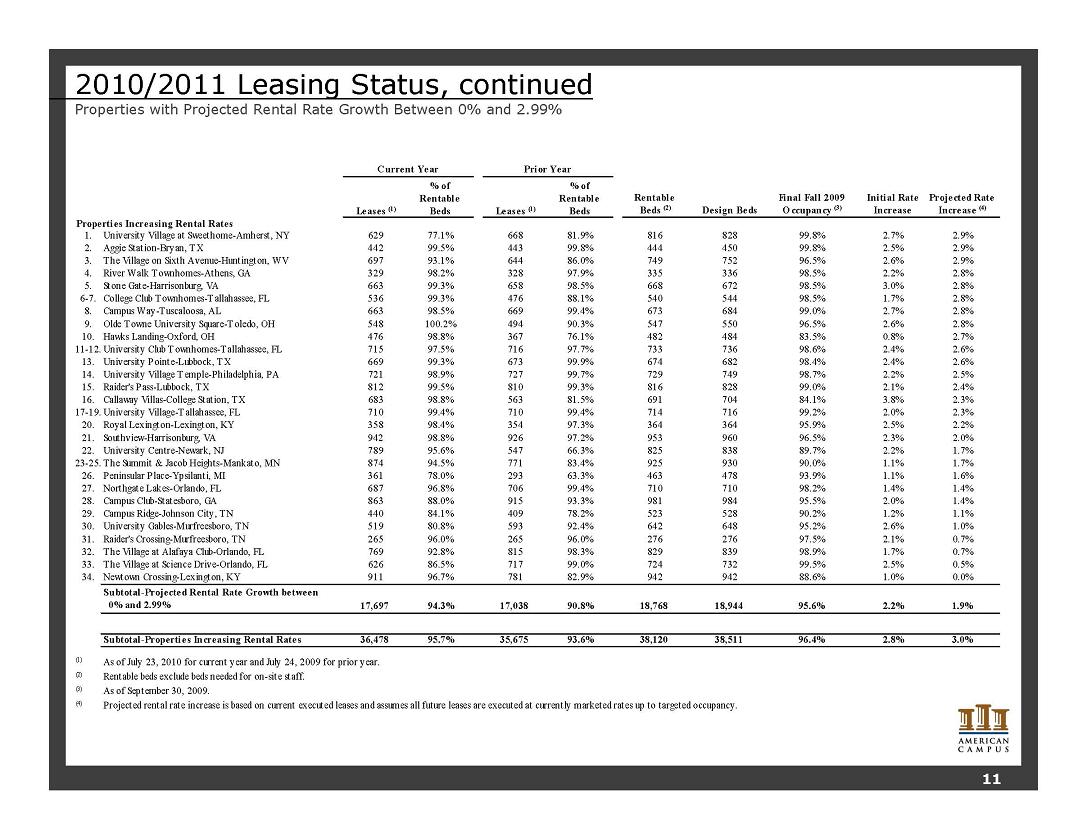
2010/2011 Leasing Status, continued Properties with Projected Rental Rate Growth Between 0% and 2.99% Leases (1) % of Rentable Beds Leases (1) % of Rentable Beds Properties Increasing Rental Rates 1. University Village at Sweethome-Amherst, NY 629 77.1% 668 81.9% 816 828 99.8% 2.7% 2.9% 2. Aggie Station-Bryan, TX 442 99.5% 443 99.8% 444 450 99.8% 2.5% 2.9% 3. The Village on Sixth Avenue Huntington WV 697 93 1% 644 86 0% 749 752 96 5% 2 6% 2 9% Initial Rate Increase Projected Rate Increase (4) Current Year Design Beds Final Fall 2009 Occupancy (3) Rentable Beds (2) Prior Year 4. River Walk Townhomes-Athens, GA 329 98.2% 328 97.9% 335 336 98.5% 2.2% 2.8% 5. Stone Gate-Harrisonburg, VA 663 99.3% 658 98.5% 668 672 98.5% 3.0% 2.8% 6-7. College Club Townhomes-Tallahassee, FL 536 99.3% 476 88.1% 540 544 98.5% 1.7% 2.8% 8. Campus Way-Tuscaloosa, AL 663 98.5% 669 99.4% 673 684 99.0% 2.7% 2.8% 9. Olde Towne University Square-Toledo, OH 548 100.2% 494 90.3% 547 550 96.5% 2.6% 2.8% 10. Hawks Landing-Oxford, OH 476 98.8% 367 76.1% 482 484 83.5% 0.8% 2.7% 11-12. University Club Townhomes-Tallahassee, FL 715 97.5% 716 97.7% 733 736 98.6% 2.4% 2.6% 13. University Pointe-Lubbock, TX 669 99.3% 673 99.9% 674 682 98.4% 2.4% 2.6% y , 14. University Village Temple-Philadelphia, PA 721 98.9% 727 99.7% 729 749 98.7% 2.2% 2.5% 15. Raider's Pass-Lubbock, TX 812 99.5% 810 99.3% 816 828 99.0% 2.1% 2.4% 16. Callaway Villas-College Station, TX 683 98.8% 563 81.5% 691 704 84.1% 3.8% 2.3% 17-19. University Village-Tallahassee, FL 710 99.4% 710 99.4% 714 716 99.2% 2.0% 2.3% 20. Royal Lexington-Lexington, KY 358 98.4% 354 97.3% 364 364 95.9% 2.5% 2.2% 21. Southview-Harrisonburg, VA 942 98.8% 926 97.2% 953 960 96.5% 2.3% 2.0% 22. University Centre-Newark, NJ 789 95.6% 547 66.3% 825 838 89.7% 2.2% 1.7% 23-25. The Summit & Jacob Heights-Mankato, MN 874 94.5% 771 83.4% 925 930 90.0% 1.1% 1.7% 26. Peninsular Place-Ypsilanti, 78.0% 63.3% 93.9% 1.1% 1.6% 27. Northgate Lakes-Orlando, FL 687 96.8% 706 99.4% 710 710 98.2% 1.4% 1.4% 28. Campus Club-Statesboro, GA 863 88.0% 915 93.3% 981 984 95.5% 2.0% 1.4% 29. Campus Ridge-Johnson City, TN 440 84.1% 409 78.2% 523 528 90.2% 1.2% 1.1% 30. University Gables-Murfreesboro, TN 519 80.8% 593 92.4% 642 648 95.2% 2.6% 1.0% 31. Raider's Crossing-Murfreesboro, TN 265 96.0% 265 96.0% 276 276 97.5% 2.1% 0.7% 32. The Village at Alafaya Club-Orlando, FL 769 92.8% 815 98.3% 829 839 98.9% 1.7% 0.7% 33. The Village at Science Drive-Orlando, FL 626 86.5% 717 99.0% 724 732 99.5% 2.5% 0.5% 34. Newtown Crossing-Lexington, 96.7% 82.9% 88.6% 1.0% 0.0% Subtotal-Projected Rental Rate Growth between 0% and 2.99% 17,697 94.3% 17,038 90.8% 18,768 18,944 95.6% 2.2% 1.9% Subtotal-Properties Increasing Rental Rates 36,478 95.7% 35,675 93.6% 38,120 38,511 96.4% 2.8% 3.0% (1) As of July 23, 2010 for current year and July 24, 2009 for prior year. (2) Rentable beds exclude beds needed for on-site staff. (3) As of September 30, 2009. (4) Projected rental rate increase is based on current executed leases and assumes all future leases are executed at currently marketed rates up to targeted occupancy. 11
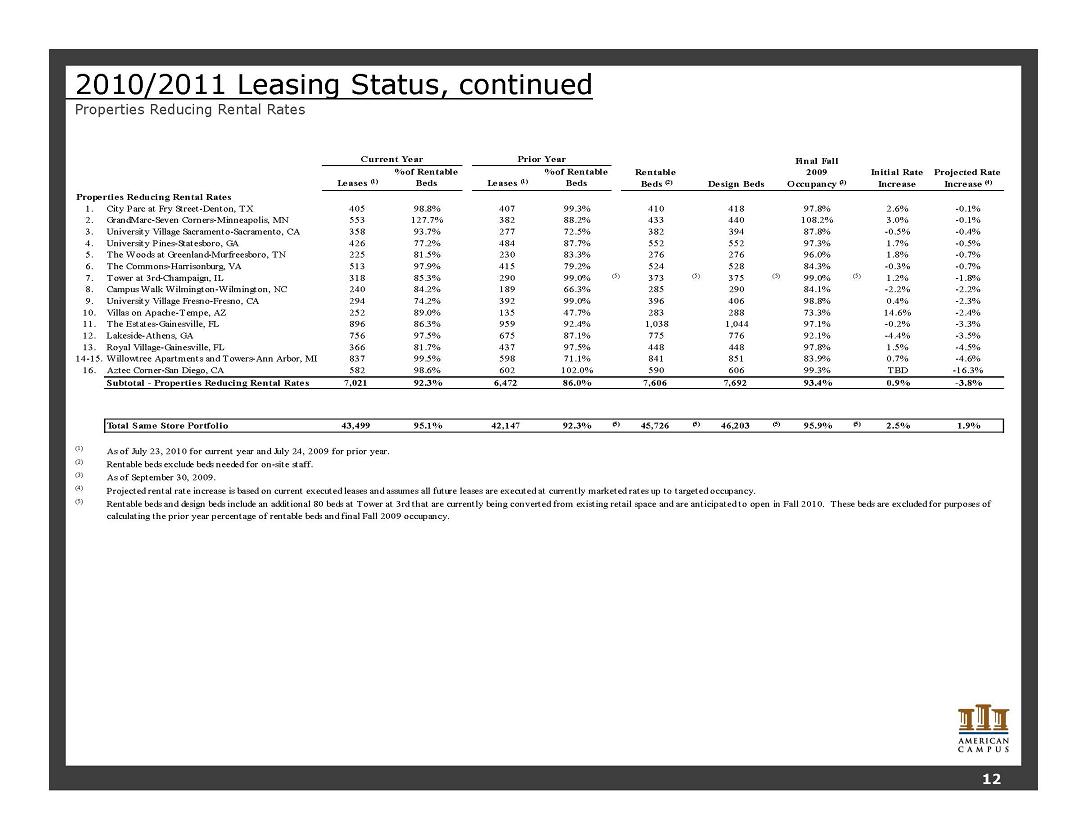
2010/2011 Leasing Status, continued Properties Reducing Rental Rates Leases (1) % of Rentable Beds Leases (1) % of Rentable Beds Properties Reducing Rental Rates 1. City Parc at Fry Street-Denton, TX 405 98.8% 407 99.3% 410 418 97.8% 2.6% -0.1% 2. GrandMarc-Seven Corners-Minneapolis, MN 553 127.7% 382 88.2% 433 440 108.2% 3.0% -0.1% 3. University Village Sacramento-Sacramento, CA 358 93.7% 277 72.5% 382 394 87.8% -0.5% -0.4% 4. University Pines-Statesboro, GA 426 77.2% 484 87.7% 552 552 97.3% 1.7% -0.5% 5. The Woods at Greenland-Murfreesboro, TN 225 81.5% 230 83.3% 276 276 96.0% 1.8% -0.7% Current Year Prior Year Initial Rate Increase Projected Rate Increase (4) Final Fall 2009 Occupancy (3) Rentable Beds (2) Design Beds 6. The Commons-Harrisonburg, VA 513 97.9% 415 79.2% 524 528 84.3% -0.3% -0.7% 7. Tower at 3rd-Champaign, IL 318 85.3% 290 99.0% (5) 373 (5) 375 (5) 99.0% (5) 1.2% -1.8% 8. Campus Walk Wilmington-Wilmington, NC 240 84.2% 189 66.3% 285 290 84.1% -2.2% -2.2% 9. University Village Fresno-Fresno, CA 294 74.2% 392 99.0% 396 406 98.8% 0.4% -2.3% 10. Villas on Apache-Tempe, AZ 252 89.0% 135 47.7% 283 288 73.3% 14.6% -2.4% 11. The Estates-Gainesville, FL 896 86.3% 959 92.4% 1,038 1,044 97.1% -0.2% -3.3% 12. Lakeside-Athens, GA 756 97.5% 675 87.1% 775 776 92.1% -4.4% -3.5% 13. Royal Village-Gainesville, FL 366 81.7% 437 97.5% 448 448 97.8% 1.5% -4.5% 14-15. Willowtree Apartments and Towers-Ann Arbor, MI 837 99.5% 598 71.1% 841 851 83.9% 0.7% -4.6% 16. Aztec Corner-San Diego, CA 582 98.6% 602 102.0% 590 606 99.3% TBD -16.3% Subtotal - Properties Reducing Rental Rates 7,021 92.3% 6,472 86.0% 7,606 7,692 93.4% 0.9% -3.8% Total Same Store Portfolio 43,499 95.1% 42,147 92.3% (5) 45,726 (5) 46,203 (5) 95.9% (5) 2.5% 1.9% (1) As of July 23, 2010 for current year and July 24, 2009 for prior year. (2) Rentable beds exclude beds needed for on-site staff. (3) As of September 30, 2009. (4) Projected rental rate increase is based on current executed leases and assumes all future leases are executed at currently marketed rates up to targeted occupancy. (5) Rentable beds and design beds include an additional 80 beds at Tower at 3rd that are currently being converted from existing retail space and are anticipated to open in Fall 2010. These beds are excluded for purposes of calculating the prior year percentage of rentable beds and final Fall 2009 occupancy. 12
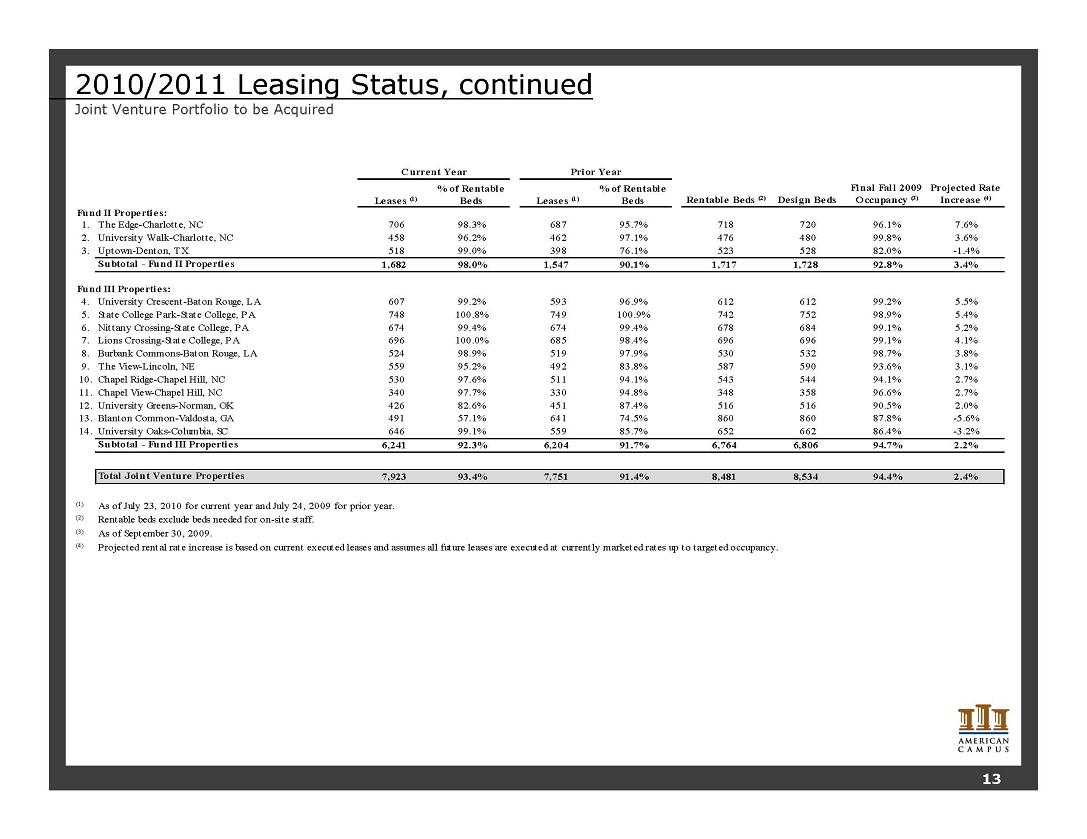
2010/2011 Leasing Status, continued Joint Venture Portfolio to be Acquired Lease s (1) % of Rentable Beds Leases (1) % of Rentable Beds Fund II Prope rties: 1. The Edge-Charlotte, NC 706 98.3% 687 95.7% 718 720 96.1% 7.6% 2. University Walk-Charlotte, NC 458 96.2% 462 97.1% 476 480 99.8% 3.6% 3. Uptown-Denton, TX 518 99.0% 398 76.1% 523 528 82.0% -1.4% Projected Rate Increase (4) Current Year Prior Year Rentable Beds (2) Design Beds Final Fall 2009 Occupancy (3) Subtotal - Fund II Properties 1,682 98.0% 1,547 90.1% 1,717 1,728 92.8% 3.4% Fund III Prope rtie s: 4. University Crescent-Baton Rouge, LA 607 99.2% 593 96.9% 612 612 99.2% 5.5% 5. State College Park-State College, PA 748 100.8% 749 100.9% 742 752 98.9% 5.4% 6. Nittany Crossing-State College, PA 674 99.4% 674 99.4% 678 684 99.1% 5.2% 7. Lions Crossing-State College, PA 696 100.0% 685 98.4% 696 696 99.1% 4.1% 8. Burbank Commons-Baton Rouge, LA 524 98.9% 519 97.9% 530 532 98.7% 3.8% 9. View-Lincoln, 95.2% 83.8% 93.6% 3.1% 10. Chapel Ridge-Chapel Hill, NC 530 97.6% 511 94.1% 543 544 94.1% 2.7% 11. Chapel View-Chapel Hill, NC 340 97.7% 330 94.8% 348 358 96.6% 2.7% 12. University Greens-Norman, OK 426 82.6% 451 87.4% 516 516 90.5% 2.0% 13. Blanton Common-Valdosta, GA 491 57.1% 641 74.5% 860 860 87.8% -5.6% 14. University Oaks-Columbia, SC 646 99.1% 559 85.7% 652 662 86.4% -3.2% Subtotal - Fund III Properties 6,241 92.3% 6,204 91.7% 6,764 6,806 94.7% 2.2% Total Joint Venture Properties 7,923 93.4% 7,751 91.4% 8,481 8,534 94.4% 2.4% (1) As of July 23, 2010 for current year and July 24, 2009 for prior year. (2) Rentable beds exclude beds needed for on-site staff. (3) As of September 30, 2009. (4) Projected rental rate increase is based on current executed leases and assumes all future leases are executed at currently marketed rates up to targeted occupancy. 13
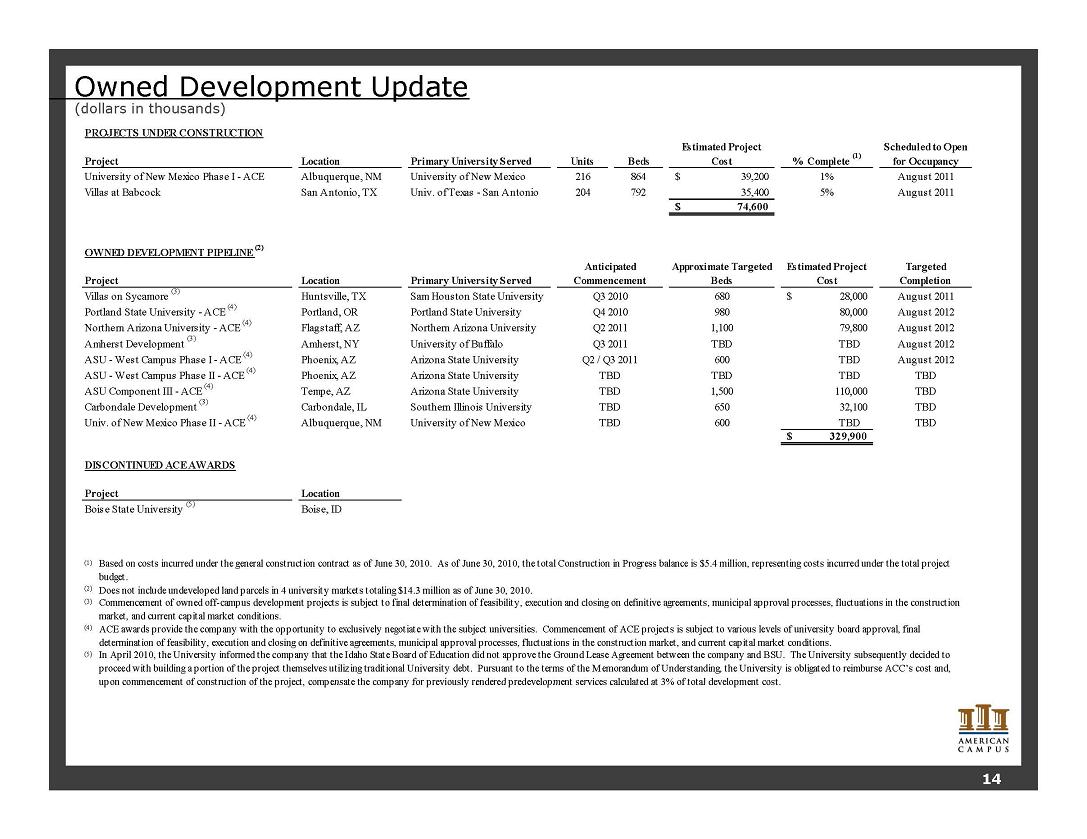
Owned Development Update (dollars in thousands) PROJECTS UNDER CONSTRUCTION Estimated Project (1) Scheduled to Open Location Primary University Served Units Beds Cost % Complete for Occupancy University of New Mexico Phase I - ACE Albuquerque, NM University of New Mexico 216 864 39,200 $ 1% August 2011 Villas at Babcock San Antonio, TX Univ. of Texas - San Antonio 204 792 35,400 5% August 2011 74,600 $ OWNED DEVELOPMENT PIPELINE (2) Project Location Primary University Served Approximate Targeted Beds Estimated Project Cost Targeted Completion Villas on Sycamore (3) Huntsville, TX Sam Houston State University 680 28,000 $ August 2011 Portland State University - ACE (4) Portland, OR Portland State University 980 80,000 August 2012 Northern Arizona University - ACE (4) Flagstaff, AZ Northern Arizona University 1,100 79,800 August 2012 Amherst Development (3) Amherst, NY University of Buffalo TBD TBD August 2012 ASU - West Campus Phase I - ACE (4) Phoenix, AZ Arizona State University 600 TBD August 2012 Q3 2011 Q2 2011 Anticipated Commencement Project Q4 2010 Q2 / Q3 2011 Q3 2010 ASU - West Campus Phase II - ACE (4) Phoenix, AZ Arizona State University TBD TBD TBD ASU Component III - ACE (4) Tempe, AZ Arizona State University 1,500 110,000 TBD Carbondale Development (3) Carbondale, IL Southern Illinois University 650 32,100 TBD Univ. of New Mexico Phase II - ACE (4) Albuquerque, NM University of New Mexico 600 TBD TBD 329,900 $ DISCONTINUED ACE AWARDS TBD TBD TBD TBD Location Boise State University (5) Boise, ID Project (1) Based on costs incurred under the general construction contract as of June 30, 2010. As of June 30, 2010, the total Construction in Progress balance is $5.4 million, representing costs incurred under the total project budget. (2) Does not include undeveloped land parcels in 4 university markets totaling $14.3 million as of June 30, 2010. (3) Commencement of owned off-campus development projects is subject to final determination of feasibility, execution and closing on definitive agreements, municipal approval processes, fluctuations in the construction market, and current capital market conditions. (4) ACE awards provide the company with the opportunity to exclusively negotiate with the subject universities. Commencement of ACE projects is subject to various levels of university board approval, final determination of feasibility, execution and closing on definitive agreements, municipal approval processes, fluctuations in the construction market, and current capital market conditions. (5) In April 2010, the University informed the company that the Idaho State Board of Education did not approve the Ground Lease Agreement between the company and BSU. The University subsequently decided to proceed with building a portion of the project themselves utilizing traditional University debt. Pursuant to the terms of the Memorandum of Understanding, the University is obligated to reimburse ACC’s cost and, upon commencement of construction of the project compensate the company for previously rendered predevelopment services calculated at 3% of total development cost. 14
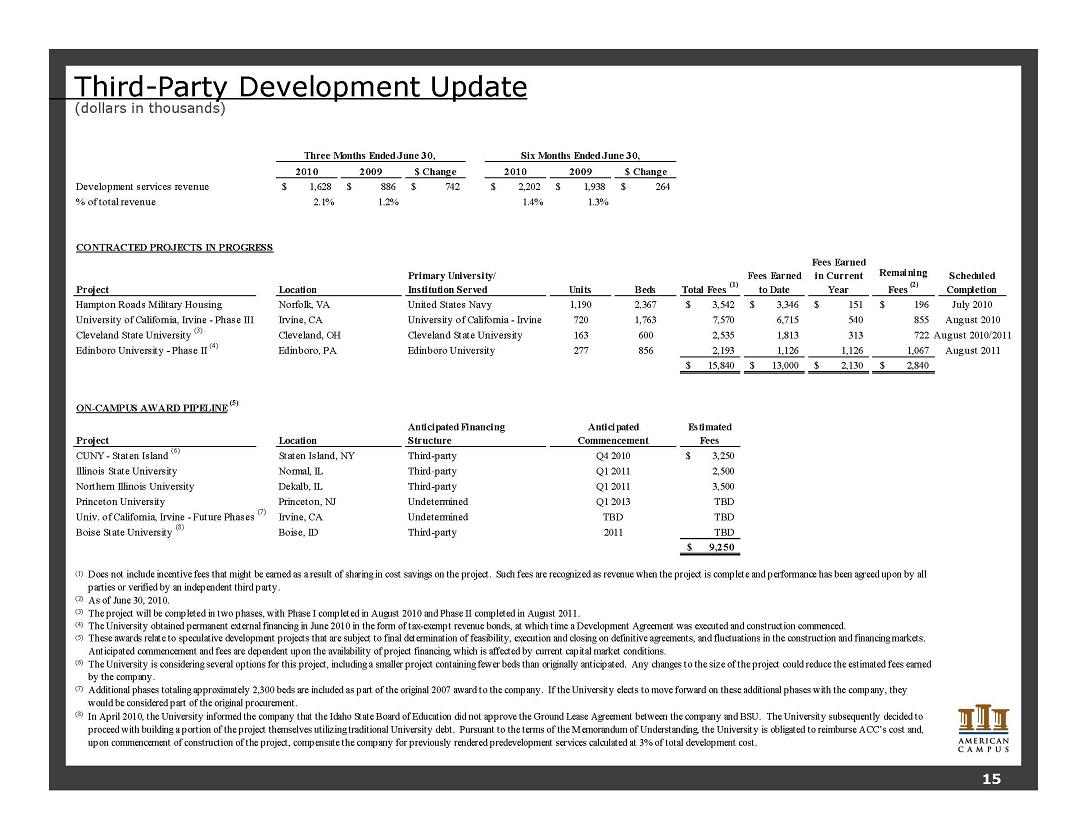
Third-Party Development Update (dollars in thousands) SixMonths Ended June 30 Months Ended June 30 2010 2009 $ Change 2010 2009 $ Change Development services revenue 1,628 $ 886 $ 742 $ 2,202 $ 1,938 $ 264 $ % of total revenue 2.1% 1.2% 1.4% 1.3% CONTRACTED PROJECTS IN PROGRESS Fees Earned Six Months 30, Three 30, Project Units Beds Total Fees (1) Fees Earned to Date in Current Year Remaining Fees (2) Scheduled Completion Hampton Roads Military Housing 1,190 2,367 3,542 $ 3,346 $ 151 $ 196 $ July 2010 University of California, Irvine - Phase III Irvine, CA University of California - Irvine 720 1,763 7,570 6,715 540 855 August 2010 Cleveland State University (3) Cleveland, OH Cleveland State University 163 600 2,535 1,813 313 722 August 2010/2011 Edinboro University - Phase II (4) Edinboro, PA Edinboro University 277 856 2,193 1,126 1,126 1,067 August 2011 15 840 $ 13 000 $ 2 130 $ 2 840 $ Location Primary University/ Institution Served Norfolk, VA United States Navy 15,840 13,000 2,130 2,840 ON-CAMPUS AWARD PIPELINE (5) Project Estimated Fees CUNY - Staten Island (6) Staten Island, NY 3,250 $ Illinois State University Normal IL 2 500 Anticipated Financing Structure Location Third-party Q4 2010 Anticipated Commencement Third-Q1 Normal, 2,500 Northern Illinois University Dekalb, IL 3,500 Princeton University Princeton, NJ Undetermined TBD Univ. of California, Irvine - Future Phases (7) Irvine, CA TBD Boise State University (8) Boise, ID TBD 9,250 $ Undetermined Third-party Q1 2013 TBD Third party Third-party 2011 2011 Q1 2011 (1) Does not include incentive fees that might be earned as a result of sharing in cost savings on the project. Such fees are recognized as revenue when the project is complete and performance has been agreed upon by all parties or verified by an independent third party. (2) As of June 30, 2010. (3) The project will be completed in two phases, with Phase I completed in August 2010 and Phase II completed in August 2011. (4) The University obtained permanent external financing in June 2010 in the form of tax-exempt revenue bonds, at which time a Development Agreement was executed and construction commenced. (5) These awards relate to speculative development projects that are subject to final determination of feasibility, execution and closing on definitive agreements, and fluctuations in the construction and financing markets. Anticipated commencement and fees are dependent upon the availability of project financing, which is affected by current capital market conditions. (6) The University is considering several options for this project, including a smaller project containing fewer beds than originally anticipated. Any changes to the size of the project could reduce the estimated fees earned by the company. (7) Additional phases totaling approximately 2,300 beds are included as part of the original 2007 award to the company. If the University elects to move forward on these additional phases with the company, they would be considered part of the original procurement. (8) In April 2010, the University informed the company that the Idaho State Board of Education did not approve the Ground Lease Agreement between the company and BSU. The University subsequently decided to proceed with building a portion of the project themselves utilizing traditional University debt. Pursuant to the terms of the Memorandum of Understanding, the University is obligated to reimburse ACC’s cost and, upon commencement of construction of the project, compensate the company for previously rendered predevelopment services calculated at 3% of total development cost. 15
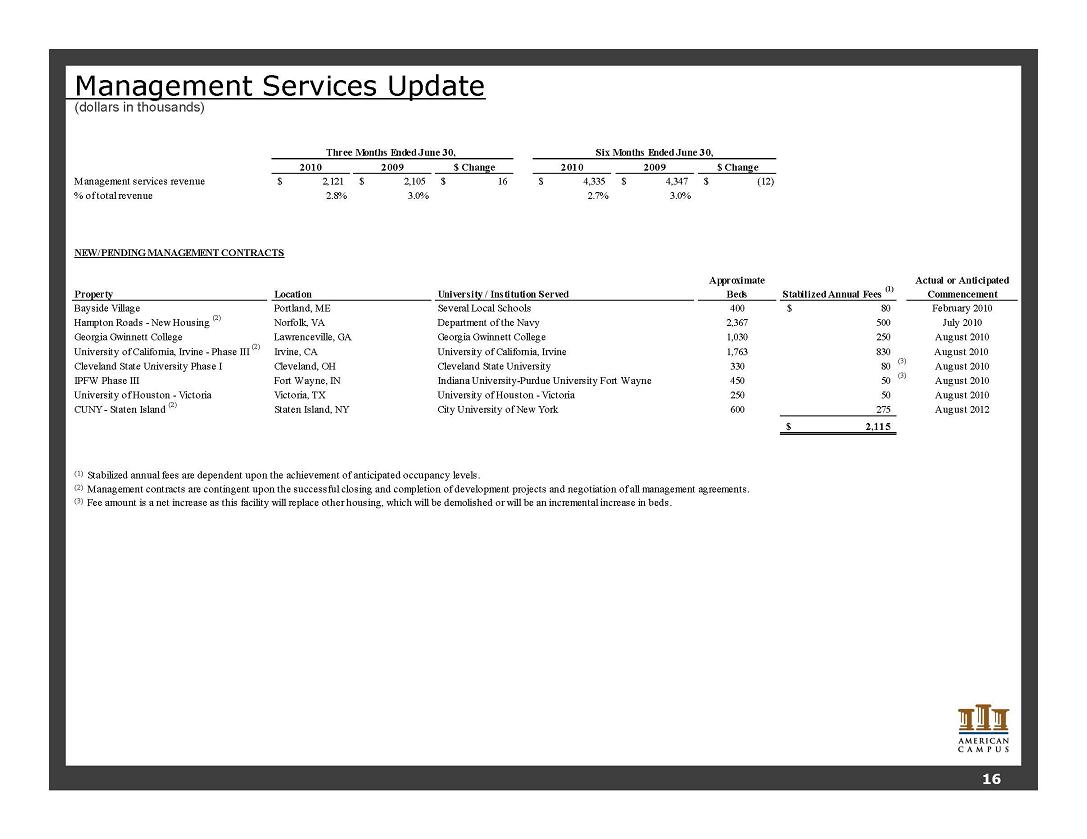
Management Services Update (dollars in thousands) Months Ended June Six Months Ended June 2010 2009 $ Change 2010 2009 $ Change Management services revenue 2,121 $ 2,105 $ 16 $ 4,335 $ 4,347 $ (12) $ % of total revenue 2.8% 3.0% 2.7% 3.0% NEW/PENDING MANAGEMENT CONTRACTS Three Ended June 30, Six Months Ended June 30, Property Approximate Beds Stabilized Annual Fees (1) Actual or Anticipated Commencement Bayside Village Portland, ME Several Local Schools 400 80 $ February 2010 Hampton Roads - New Housing (2) Norfolk, VA Department of the Navy 2,367 500 July 2010 Georgia Gwinnett College Lawrenceville, GA Georgia Gwinnett College 1,030 250 August 2010 University of California, Irvine - Phase III (2) Irvine, CA University of California, Irvine 1,763 830 August 2010 Cleveland State University Phase I Cleveland OH State University 330 80 (3) August Location University / Institution Served Cleveland, Cleveland 2010 IPFW Phase III Fort Wayne, IN Indiana University-Purdue University Fort Wayne 450 50 (3) August 2010 University of Houston - Victoria Victoria, TX University of Houston - Victoria 250 50 August 2010 CUNY - Staten Island (2) Staten Island, NY City University of New York 600 275 August 2012 2,115 $ (1) Stabilized annual fees are dependent upon the achievement of anticipated occupancy levels. (2) Management contracts are contingent upon the successful closing and completion of development projects and negotiation of all management agreements. (3) Fee amount is a net increase as this facility will replace other housing, which will be demolished or will be an incremental increase in beds. 16
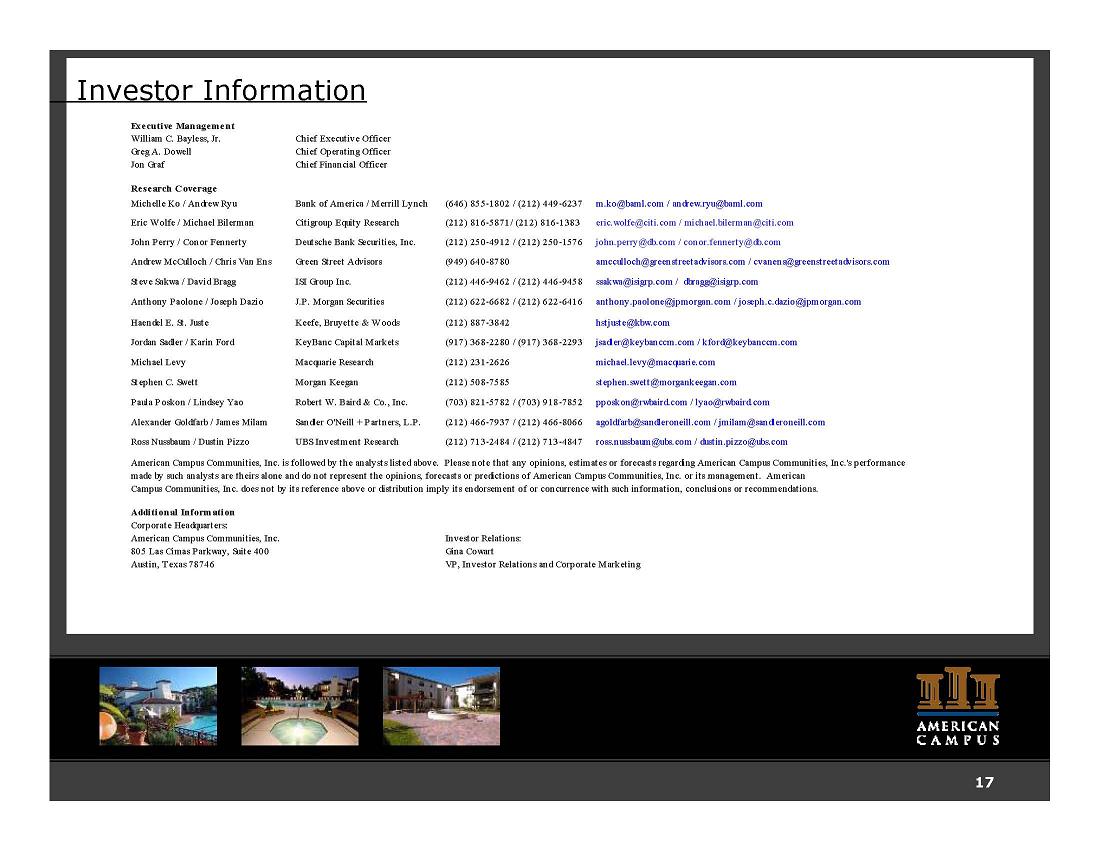
Investor Information Executive Management William C. Bayless, Jr. Chief Executive Officer Greg A. Dowell Chief Operating Officer Jon Graf Chief Financial Officer Research Coverage Michelle Ko / Andrew Ryu Bank of America / Merrill Lynch (646) 855-1802 / (212) 449-6237 m.ko@baml.com / andrew.ryu@baml.com Eric Wolfe / Michael Bilerman Citigroup Equity Research (212) 816-5871/ (212) 816-1383 eric.wolfe@citi.com / michael.bilerman@citi.com John Perry / Conor Fennerty Deutsche Bank Securities, Inc. (212) 250-4912 / (212) 250-1576 john.perry@db.com / conor.fennerty@db.com AndrewMcCulloch / Chris Van Ens Green Street Advisors (949) 640-8780 amcculloch@greenstreetadvisors.com / cvanens@greenstreetadvisors.com Andrew McCulloch 640 Steve Sakwa / David Bragg ISI Group Inc. (212) 446-9462 / (212) 446-9458 ssakwa@isigrp.com / dbragg@isigrp.com Anthony Paolone / Joseph Dazio J.P. Morgan Securities (212) 622-6682 / (212) 622-6416 anthony.paolone@jpmorgan.com / joseph.c.dazio@jpmorgan.com Haendel E. St. Juste Keefe, Bruyette & Woods (212) 887-3842 hstjuste@kbw.com Jordan Sadler / Karin Ford KeyBanc Capital Markets (917) 368-2280 / (917) 368-2293 jsadler@keybanccm.com / kford@keybanccm.com Michael Levy Macquarie Research (212) 231-2626 michael.levy@macquarie.com Stephen C. Swett Morgan Keegan (212) 508-7585 stephen.swett@morgankeegan.com Paula Poskon / Lindsey Yao Robert W. Baird & Co., Inc. (703) 821-5782 / (703) 918-7852 pposkon@rwbaird.com / lyao@rwbaird.com Alexander Goldfarb / James Milam Sandler O'Neill + Partners, L.P. (212) 466-7937 / (212) 466-8066 agoldfarb@sandleroneill.com / jmilam@sandleroneill.com Ross Nussbaum / Dustin Pizzo UBS Investment Research (212) 713-2484 / (212) 713-4847 ross.nussbaum@ubs.com / dustin.pizzo@ubs.com American Campus Communities, Inc. is followed by the analysts listed above. Please note that any opinions, estimates or forecasts regarding American Campus Communities, Inc.'s performance made by such analysts are theirs alone and do not represent the opinions, forecasts or predictions of American Campus Communities, Inc. or its American Campus Communities, Inc. does not by its reference above or distribution imply its endorsement of or concurrence with such information, conclusions or recommendations. Investor Relations: Gina Cowart VP, Investor Relations and Corporate Marketing Additional Information Corporate Headquarters: American Campus Communities, Inc. 805 Las Cimas Parkway, Suite 400 Austin, Texas 78746 management. 17
Forward Looking Statements In addition to historical information, this supplemental package contains forward-looking statements under the federal securities law. These statements are based on current expectations, estimates and projections about the industry and markets in which American Campus operates, management's beliefs, and assumptions made by management. Forward-looking statements are not guarantees of future performance and involve certain risks and uncertainties, which are difficult to predict.