Attached files
| file | filename |
|---|---|
| 8-K - 8-K - VIVUS INC | a10-12241_18k.htm |
Exhibit 99.1
|
|
W. Timothy Garvey, MD Chair, Department of Nutrition Sciences Professor of Nutrition Sciences University of Alabama at Birmingham Staff Physician and GRECC Investigator Birmingham Veterans Affairs Medical Center Birmingham, Alabama Charles H. Bowden, MD Barbara Troupin, MD Wesley W. Day, PhD Vivus, Inc. Once-Daily, Low-Dose, Controlled-Release Phentermine/Topiramate Demonstrates Significant Improvement in Weight, Related Risk in Overweight/Obese Patients With Comorbidities |
|
|
Disclosures Dr. Garvey has the following financial relationships to disclose: Research support – Merck & Co., Inc.; Isis/Genzyme; Amylin Pharmaceuticals Speakers Bureau – Merck & Co., Inc; Abbott Nutrition Advisor/consultant – Daiichi-Sankyo; Tethys; Vivus, Inc. Board member – Daiichi-Sankyo, Tethys Stockholder – Merck & Co., Inc.; Isis/Genzyme; Pfizer, Inc.; Eli Lilly and Company; Schering Plough; Novartis Pharmaceuticals Corp.; Vivus, Inc.; Bristol Myers Squibb Drs. Bowden, Troupin, and Day are employed by Vivus, Inc., the manufacturer of the study drug |
|
|
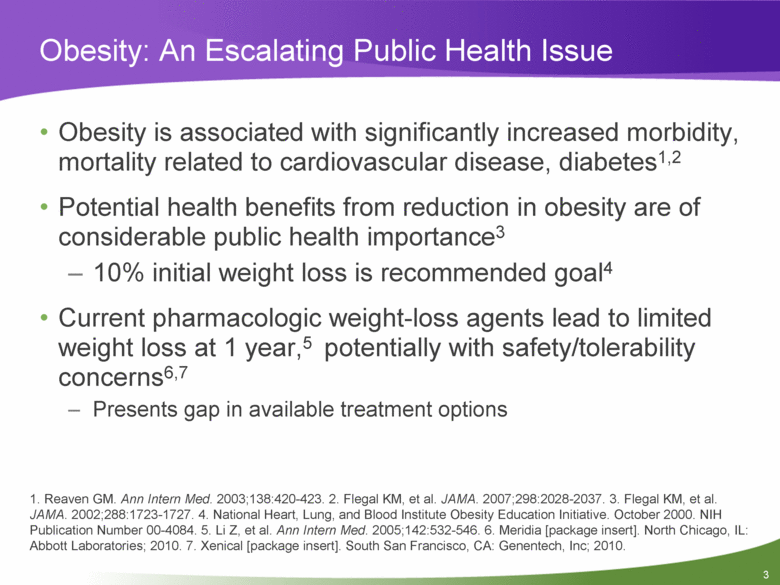
Obesity: An Escalating Public Health Issue Obesity is associated with significantly increased morbidity, mortality related to cardiovascular disease, diabetes1,2 Potential health benefits from reduction in obesity are of considerable public health importance3 10% initial weight loss is recommended goal4 Current pharmacologic weight-loss agents lead to limited weight loss at 1 year,5 potentially with safety/tolerability concerns6,7 Presents gap in available treatment options 1. Reaven GM. Ann Intern Med. 2003;138:420-423. 2. Flegal KM, et al. JAMA. 2007;298:2028-2037. 3. Flegal KM, et al. JAMA. 2002;288:1723-1727. 4. National Heart, Lung, and Blood Institute Obesity Education Initiative. October 2000. NIH Publication Number 00-4084. 5. Li Z, et al. Ann Intern Med. 2005;142:532-546. 6. Meridia [package insert]. North Chicago, IL: Abbott Laboratories; 2010. 7. Xenical [package insert]. South San Francisco, CA: Genentech, Inc; 2010. |
|
|
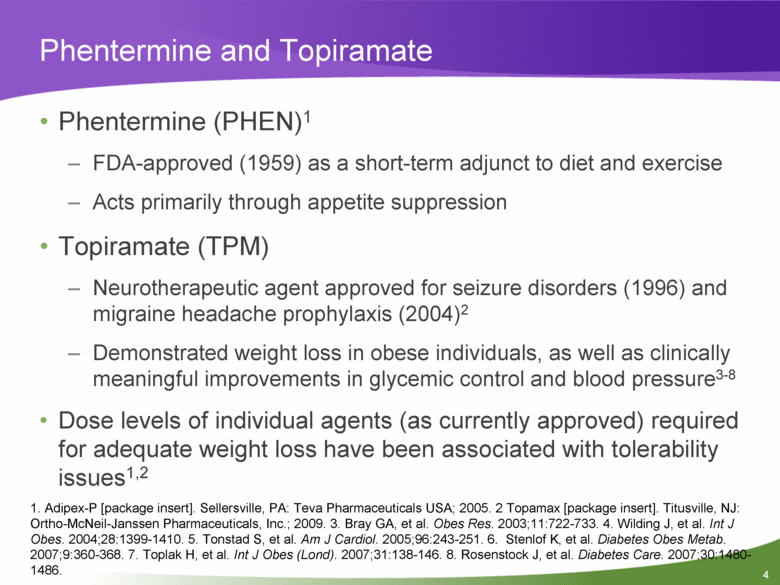
Phentermine and Topiramate Phentermine (PHEN)1 FDA-approved (1959) as a short-term adjunct to diet and exercise Acts primarily through appetite suppression Topiramate (TPM) Neurotherapeutic agent approved for seizure disorders (1996) and migraine headache prophylaxis (2004)2 Demonstrated weight loss in obese individuals, as well as clinically meaningful improvements in glycemic control and blood pressure3-8 Dose levels of individual agents (as currently approved) required for adequate weight loss have been associated with tolerability issues1,2 1. Adipex-P [package insert]. Sellersville, PA: Teva Pharmaceuticals USA; 2005. 2 Topamax [package insert]. Titusville, NJ: Ortho-McNeil-Janssen Pharmaceuticals, Inc.; 2009. 3. Bray GA, et al. Obes Res. 2003;11:722-733. 4. Wilding J, et al. Int J Obes. 2004;28:1399-1410. 5. Tonstad S, et al. Am J Cardiol. 2005;96:243-251. 6. Stenlof K, et al. Diabetes Obes Metab. 2007;9:360-368. 7. Toplak H, et al. Int J Obes (Lond). 2007;31:138-146. 8. Rosenstock J, et al. Diabetes Care. 2007;30:1480-1486. |
|
|
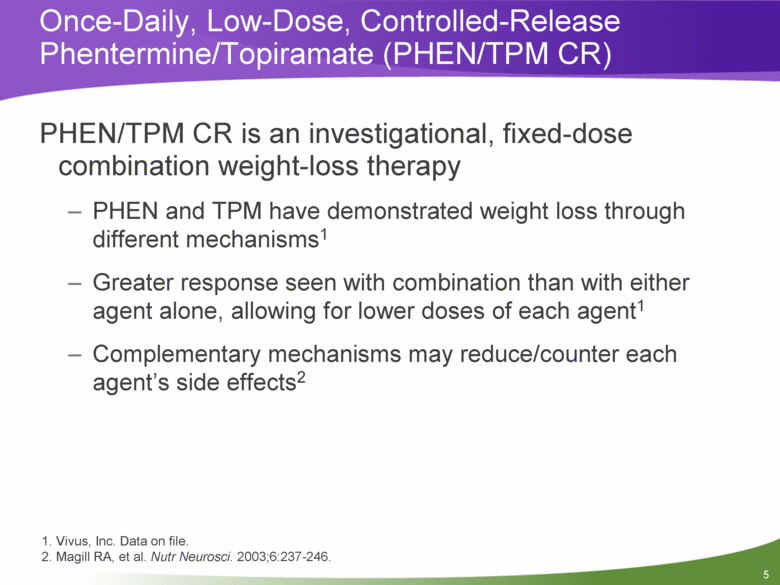
PHEN/TPM CR is an investigational, fixed-dose combination weight-loss therapy PHEN and TPM have demonstrated weight loss through different mechanisms1 Greater response seen with combination than with either agent alone, allowing for lower doses of each agent1 Complementary mechanisms may reduce/counter each agent’s side effects2 Once-Daily, Low-Dose, Controlled-Release Phentermine/Topiramate (PHEN/TPM CR) 1. Vivus, Inc. Data on file. 2. Magill RA, et al. Nutr Neurosci. 2003;6:237-246. |
|
|
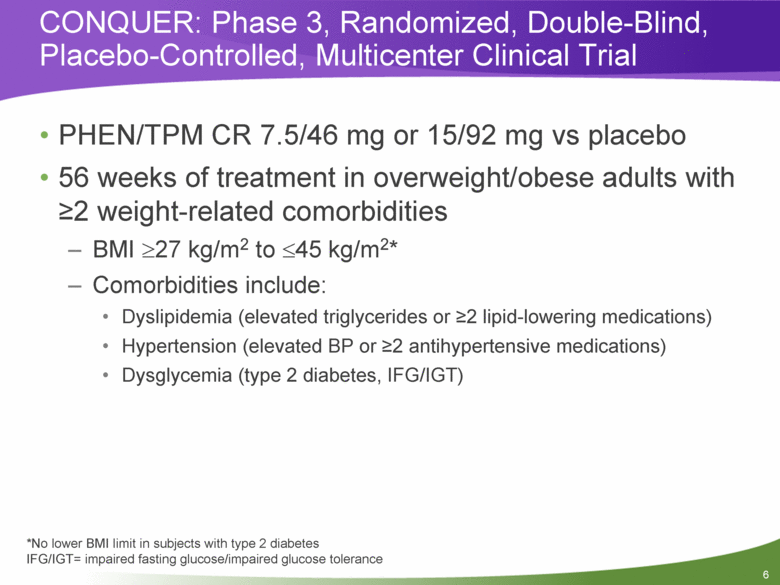
CONQUER: Phase 3, Randomized, Double-Blind, Placebo-Controlled, Multicenter Clinical Trial PHEN/TPM CR 7.5/46 mg or 15/92 mg vs placebo 56 weeks of treatment in overweight/obese adults with >2 weight-related comorbidities BMI >27 kg/m2 to <45 kg/m2* Comorbidities include: Dyslipidemia (elevated triglycerides or >2 lipid-lowering medications) Hypertension (elevated BP or >2 antihypertensive medications) Dysglycemia (type 2 diabetes, IFG/IGT) *No lower BMI limit in subjects with type 2 diabetes IFG/IGT= impaired fasting glucose/impaired glucose tolerance |
|
|
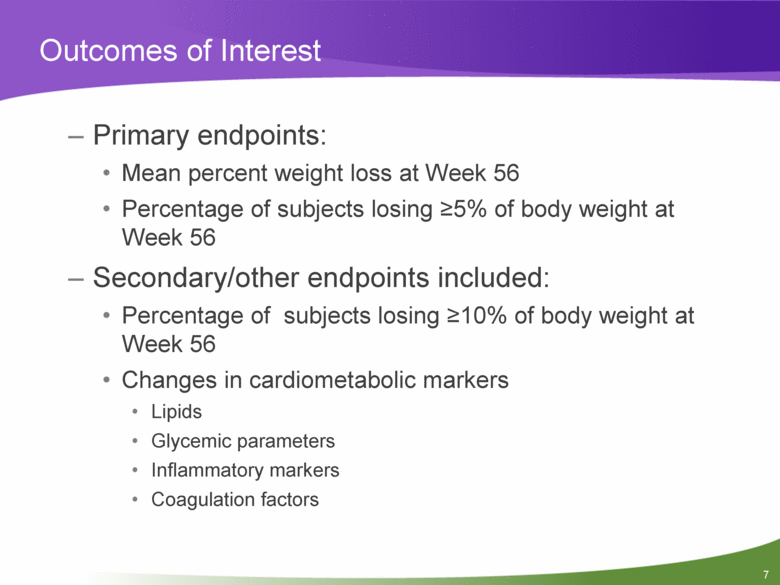
Outcomes of Interest Primary endpoints: Mean percent weight loss at Week 56 Percentage of subjects losing >5% of body weight at Week 56 Secondary/other endpoints included: Percentage of subjects losing >10% of body weight at Week 56 Changes in cardiometabolic markers Lipids Glycemic parameters Inflammatory markers Coagulation factors |
|
|
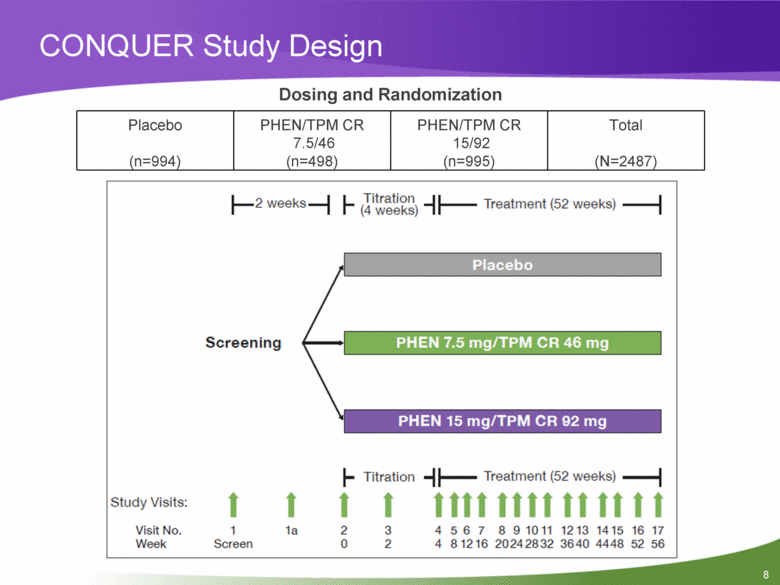
CONQUER Study Design Dosing and Randomization Placebo (n=994) PHEN/TPM CR 7.5/46 (n=498) PHEN/TPM CR 15/92 (n=995) Total (N=2487) |
|
|
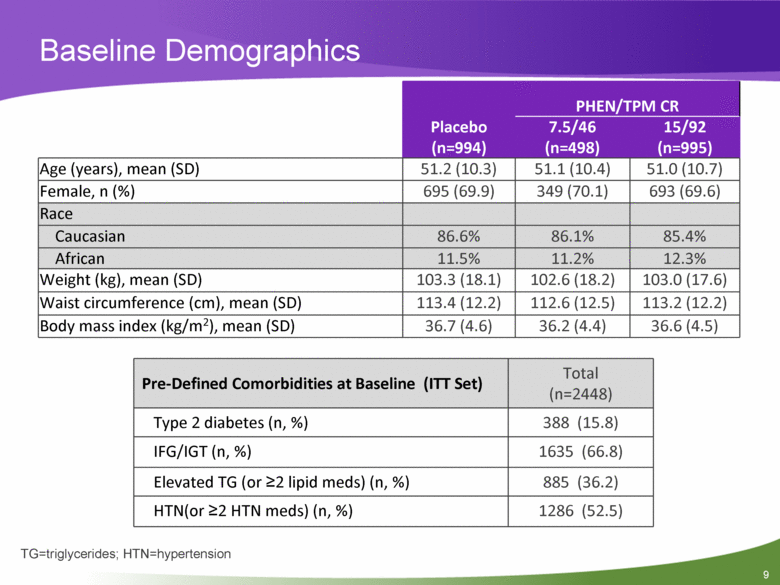
Baseline Demographics Placebo (n=994) PHEN/TPM CR 7.5/46 (n=498) 15/92 (n=995) Age (years), mean (SD) 51.2 (10.3) 51.1 (10.4) 51.0 (10.7) Female, n (%) 695 (69.9) 349 (70.1) 693 (69.6) Race Caucasian 86.6% 86.1% 85.4% African 11.5% 11.2% 12.3% Weight (kg), mean (SD) 103.3 (18.1) 102.6 (18.2) 103.0 (17.6) Waist circumference (cm), mean (SD) 113.4 (12.2) 112.6 (12.5) 113.2 (12.2) Body mass index (kg/m2), mean (SD) 36.7 (4.6) 36.2 (4.4) 36.6 (4.5) TG=triglycerides; HTN=hypertension Pre-Defined Comorbidities at Baseline (ITT Set) Total (n=2448) Type 2 diabetes (n, %) 388 (15.8) IFG/IGT (n, %) 1635 (66.8) Elevated TG (or >2 lipid meds) (n, %) 885 (36.2) HTN(or >2 HTN meds) (n, %) 1286 (52.5) |
|
|
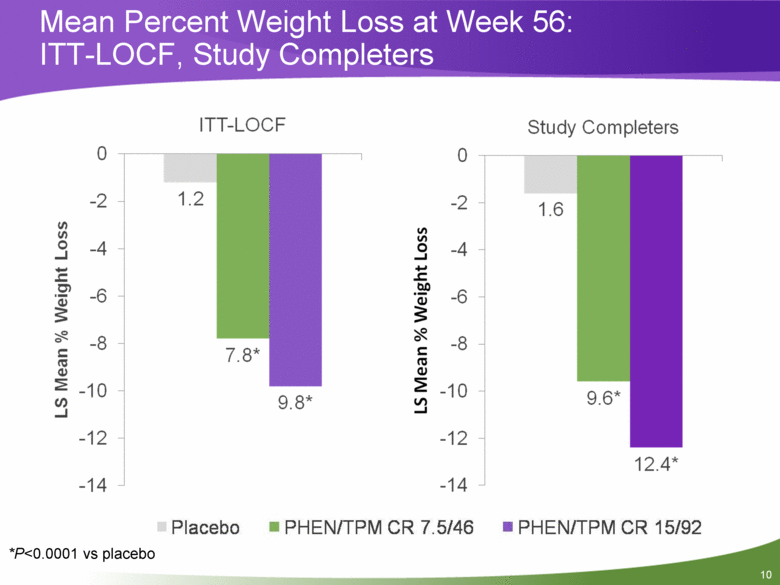
Mean Percent Weight Loss at Week 56: ITT-LOCF, Study Completers *P<0.0001 vs placebo |
|
|
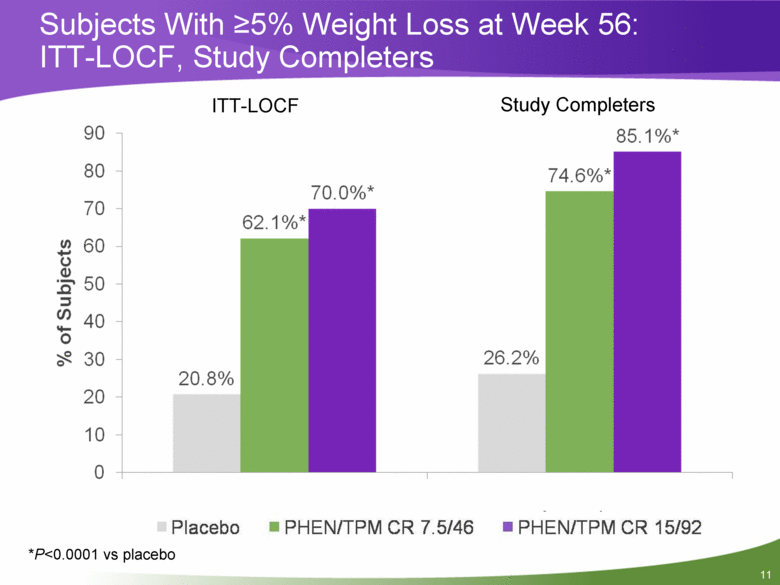
Subjects With >5% Weight Loss at Week 56: ITT-LOCF, Study Completers *P<0.0001 vs placebo ITT-LOCF Study Completers 20.8% 26.2% 62.1%* 74.6%* 70.0%* 85.1%* 0 10 20 30 40 50 60 70 80 90 ITT-LOCF Study Completers % of Subjects |
|
|
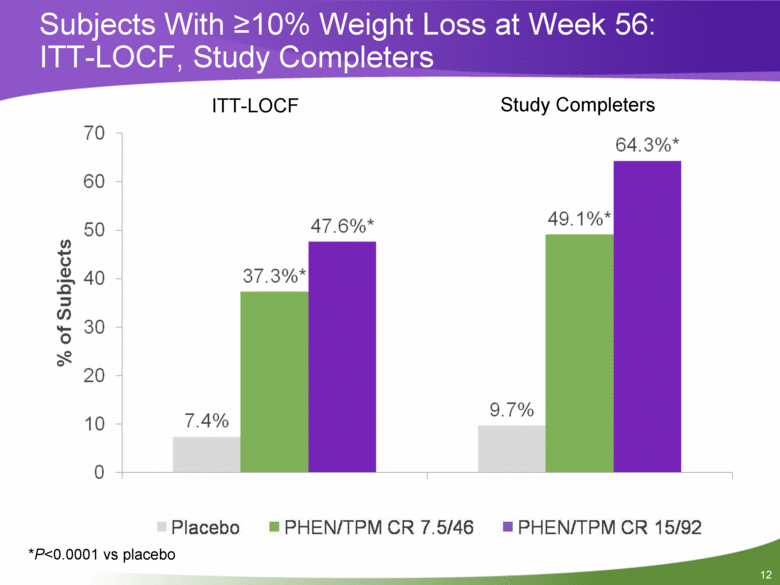
Subjects With >10% Weight Loss at Week 56: ITT-LOCF, Study Completers *P<0.0001 vs placebo ITT-LOCF Study Completers |
|
|
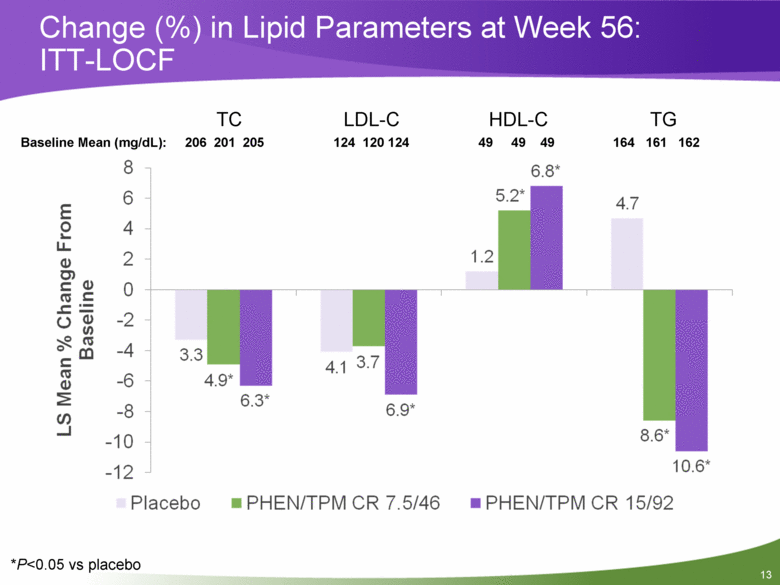
Change (%) in Lipid Parameters at Week 56: ITT-LOCF *P<0.05 vs placebo TC LDL-C HDL-C TG Baseline Mean (mg/dL): 206 201 205 124 120 124 49 49 49 164 161 162 |
|
|
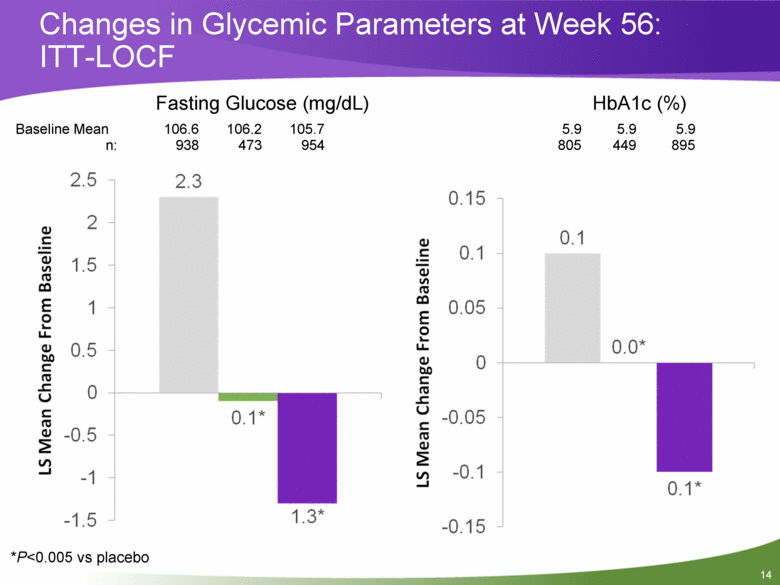
Changes in Glycemic Parameters at Week 56: ITT-LOCF Baseline Mean 106.6 106.2 105.7 5.9 5.9 5.9 n: 938 473 954 805 449 895 Fasting Glucose (mg/dL) HbA1c (%) *P<0.005 vs placebo |
|
|
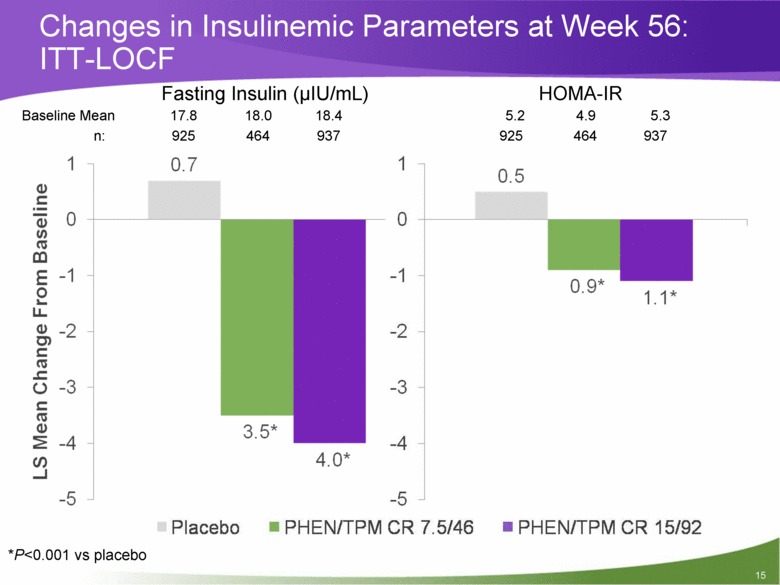
Changes in Insulinemic Parameters at Week 56: ITT-LOCF Fasting Insulin (uIU/mL) HOMA-IR *P<0.001 vs placebo 15 Baseline Mean 17.8 18.0 18.4 5.2 4.9 5.3 n: 925 464 937 925 464 937 |
|
|
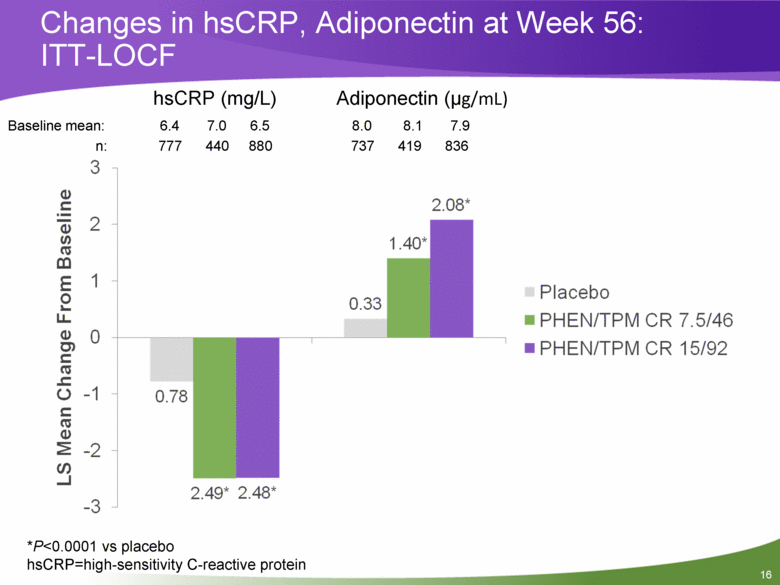
Changes in hsCRP, Adiponectin at Week 56: ITT-LOCF Baseline mean: 6.4 7.0 6.5 8.0 8.1 7.9 n: 777 440 880 737 419 836 *P<0.0001 vs placebo hsCRP=high-sensitivity C-reactive protein hsCRP (mg/L) Adiponectin (ug/mL) |
|
|
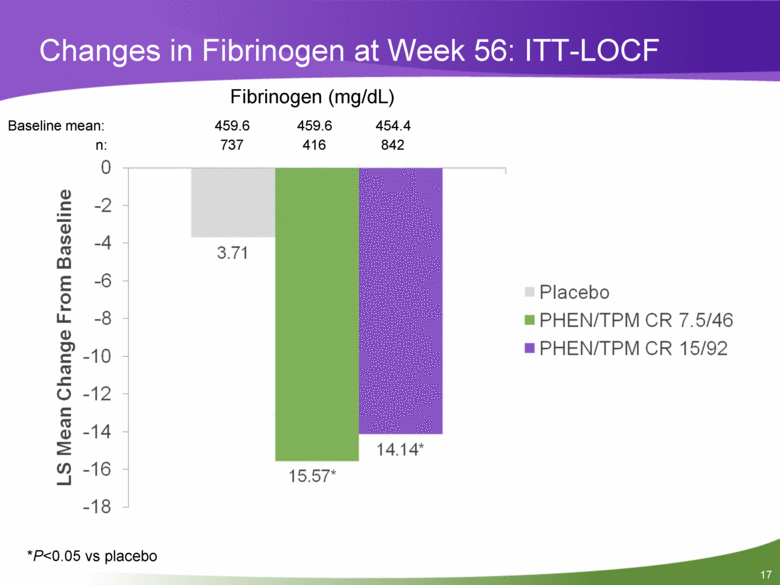
Changes in Fibrinogen at Week 56: ITT-LOCF Baseline mean: 459.6 459.6 454.4 n: 737 416 842 *P<0.05 vs placebo Fibrinogen (mg/dL) |
|
|
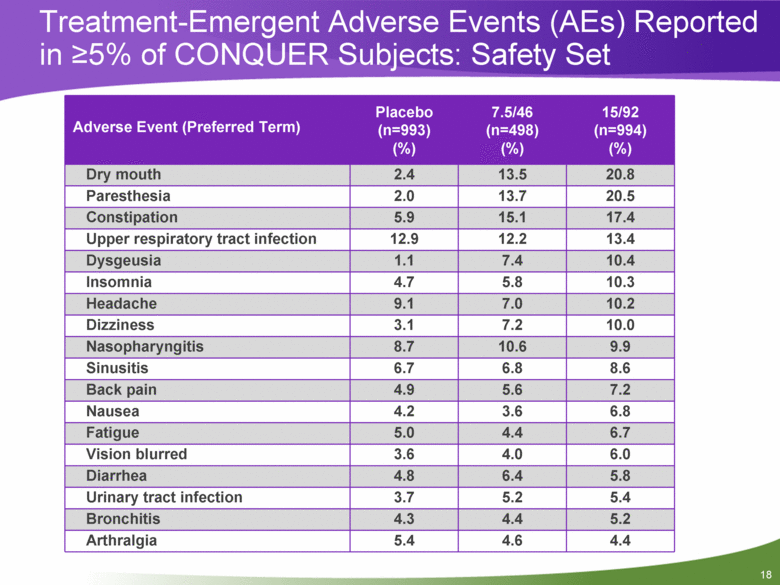
Treatment-Emergent Adverse Events (AEs) Reported in >5% of CONQUER Subjects: Safety Set Adverse Event (Preferred Term) Placebo (n=993) (%) 7.5/46 (n=498) (%) 15/92 (n=994) (%) Dry mouth 2.4 13.5 20.8 Paresthesia 2.0 13.7 20.5 Constipation 5.9 15.1 17.4 Upper respiratory tract infection 12.9 12.2 13.4 Dysgeusia 1.1 7.4 10.4 Insomnia 4.7 5.8 10.3 Headache 9.1 7.0 10.2 Dizziness 3.1 7.2 10.0 Nasopharyngitis 8.7 10.6 9.9 Sinusitis 6.7 6.8 8.6 Back pain 4.9 5.6 7.2 Nausea 4.2 3.6 6.8 Fatigue 5.0 4.4 6.7 Vision blurred 3.6 4.0 6.0 Diarrhea 4.8 6.4 5.8 Urinary tract infection 3.7 5.2 5.4 Bronchitis 4.3 4.4 5.2 Arthralgia 5.4 4.6 4.4 |
|
|
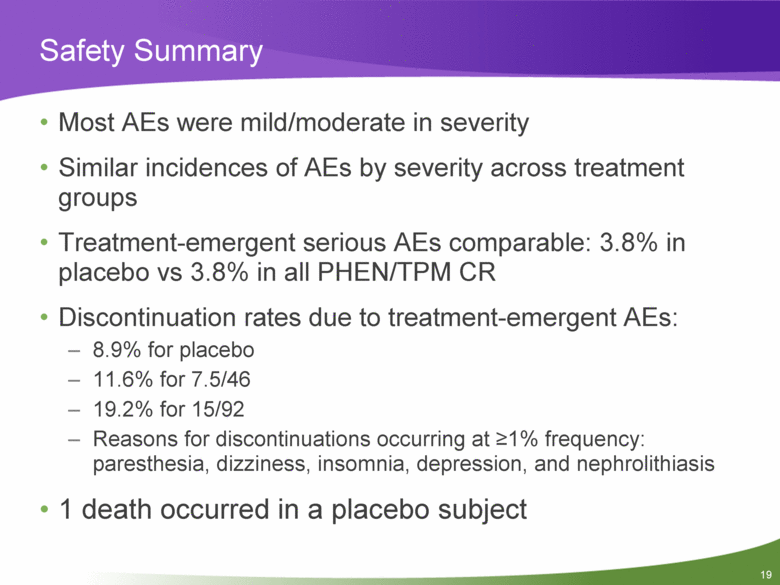
Safety Summary Most AEs were mild/moderate in severity Similar incidences of AEs by severity across treatment groups Treatment-emergent serious AEs comparable: 3.8% in placebo vs 3.8% in all PHEN/TPM CR Discontinuation rates due to treatment-emergent AEs: 8.9% for placebo 11.6% for 7.5/46 19.2% for 15/92 Reasons for discontinuations occurring at >1% frequency: paresthesia, dizziness, insomnia, depression, and nephrolithiasis 1 death occurred in a placebo subject |
|
|
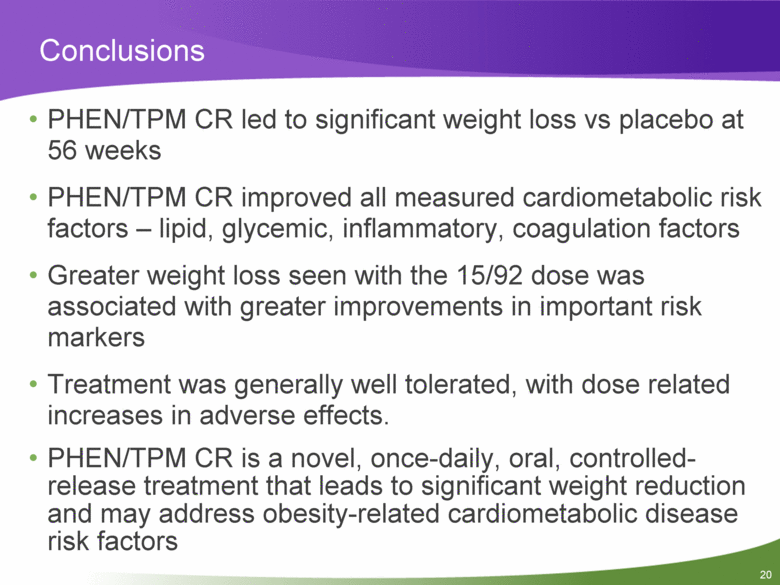
Conclusions PHEN/TPM CR led to significant weight loss vs placebo at 56 weeks PHEN/TPM CR improved all measured cardiometabolic risk factors – lipid, glycemic, inflammatory, coagulation factors Greater weight loss seen with the 15/92 dose was associated with greater improvements in important risk markers Treatment was generally well tolerated, with dose related increases in adverse effects. PHEN/TPM CR is a novel, once-daily, oral, controlled-release treatment that leads to significant weight reduction and may address obesity-related cardiometabolic disease risk factors |

