Attached files
| file | filename |
|---|---|
| 8-K - OSG FORM 8-K - OVERSEAS SHIPHOLDING GROUP INC | earn8k1q.htm |
| EX-99 - OSG FORM 8-K - EXHIBIT 99.1 - OVERSEAS SHIPHOLDING GROUP INC | earn8k991.htm |

EXHIBIT 99.2
First Quarter Fiscal 2010 Earnings Conference Call
May 4, 2010

Page 2
This presentation contains forward-looking statements regarding the Company's prospects, including the outlook
for tanker and articulated tug barge markets, changing oil trading patterns, anticipated levels of newbuilding and
scrapping, prospects for certain strategic alliances and investments, estimated fixed revenue for 2010,
forecasted newbuilding delivery schedule for 2010 and 2011, projected scheduled drydock and off hire days for
the second, third and fourth quarters of 2010, projected locked-in charter revenue and locked-in time charter
days, forecasted 2010 vessel expenses, charter hire expenses, depreciation and amortization, general and
administrative expenses, interest expense, and levels of equity income, other income, taxes and capital
expenditures, timely delivery of newbuildings in accordance with contractual terms, the outcome of OSG
negotiations with Maersk Oil Qatar, the sustainability of OSG’s annual dividend, prospects of OSG’s strategy of
being a market leader in the segments in which it competes and the forecast of world economic activity and oil
demand. These statements are based on certain assumptions made by OSG management based on its
experience and perception of historical trends, current conditions, expected future developments and other
factors it believes are appropriate in the circumstances. Forward-looking statements are subject to a number of
risks, uncertainties and assumptions, many of which are beyond the control of OSG, which may cause actual
results to differ materially from those implied or expressed by the forward-looking statements. Factors, risks and
uncertainties that could cause actual results to differ from the expectations reflected in these forward-looking
statements are described in the Company’s Annual Report for 2009 on Form 10-K and those risks discussed in
the other reports OSG files with the Securities and Exchange Commission.
Forward-Looking Statements

Page 3
< A mixed rate environment leads to disappointing first quarter 2010 results
• TCE revenues of $230M down 21% from $293M
• EBITDA totaled $44M
• Net loss of $9M and $0.34 per diluted share
• Special charges totaled ~$7M
– Adjusted net loss $3M
– Adjusted diluted loss per share $0.09
< Solid VLCC rates, but most segments declined quarter-over-quarter
< 2Q 2010 bookings-to-date are as expected
• $44.5K/day VLCC
• $29.5K/day Suezmax
• $16.5K/day Aframax
< Financial condition of OSG is strong
• $1.9B in liquidity
• Manageable debt and refinancing obligations over next three years
• $413M of future construction commitments fully funded
• Annual dividend of $1.75 is sustainable
• $19.5K/day Panamax
• $12.5K/day MR
OSG’s balanced growth strategy enables us to remain strong in any rate environment
Financial Highlights

Page 4
Focused on improving and strengthening the Company
Shuttle Tanker Overseas Cascade
FSO Africa Leaving the Shipyard
Quarter/Current Highlights
< Executed two capital market transactions that diversified funding
sources, lengthened our debt maturity profile and increased flexibility
for investment and expansion
sources, lengthened our debt maturity profile and increased flexibility
for investment and expansion
• ~$290M in net proceeds from 8.125% 8-year note issue
• ~$160M in net proceeds from 3.5 million equity share issue
< Technically challenging newbuild/conversion projects completed
• Overseas Cascade
– 5-year charter to Petrobras America commenced April 1st
– Vessel currently supporting recovery efforts for U.S. Gulf of Mexico oil spill
• OSG 350
– Long-term contract of affreightment with Sunoco commenced with delivery
– Delaware Bay lightering operations currently service Sunoco, Valero and
ConocoPhillips
ConocoPhillips
< FSO update
• FSO Asia on site and operating at full capacity
• Additional performance bonus received for superior environmental
performance
performance
• FSO Africa conversion completed
• Discussions with various parties concerning employment of the FSO Africa
are ongoing
are ongoing

Page 5
Commitments / Construction in Progress
Vessel Delivery Schedule
§ $3B of vessel assets as of March 31, 2010
- $625M construction in progress; capital
paid but not generating revenue
paid but not generating revenue
- During Q1 2010, four vessels delivered
mid-to-very late in the quarter
mid-to-very late in the quarter
§ $413M shipyard contract commitments
Chartered-in
Owned
Built-in Fleet Growth Over Next Two Years
Built-in Growth

Page 6
§ Active S&P activity, effective management of long-standing yard relationships
and OSG’s financial strength enabled us to make significant modifications to
our orderbook in 2009 and 2010.
and OSG’s financial strength enabled us to make significant modifications to
our orderbook in 2009 and 2010.
§ Modifications have reduced contract costs of specific orders and enabled us
to replace our MR fleet faster.
to replace our MR fleet faster.
|
OSG Orderbook Actions
|
|
Financing Activities
|
|
2 LR1s cancelled
|
|
<$124M>
|
|
Price reductions on 2 LR1s
|
|
<$12M>
|
|
3 new MRs
|
|
+$117M
|
|
1 new MR bareboat
|
|
+$17M addition to charter-in obligations
|
|
2 MR bareboat swaps
|
|
$6M savings in charter-in obligations
|
|
Other price reductions achieved in lieu of prepayments
|
|
<$13M>
|
Active asset management continues to support our growth strategy
Orderbook Modifications
Page 7
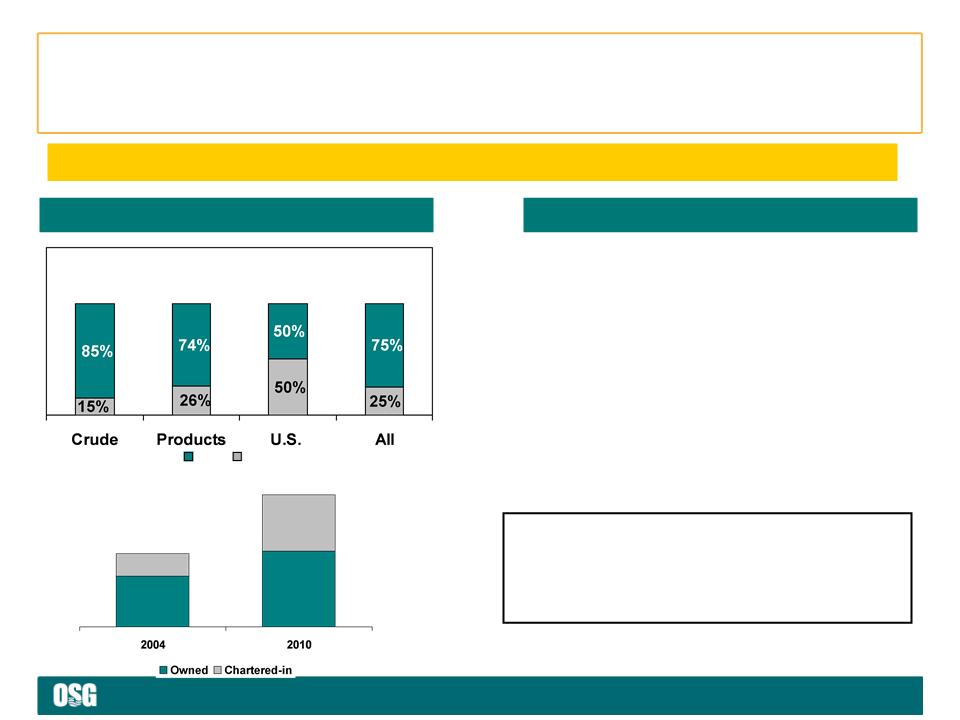
Portfolio Mix*
Chartered Portfolio
• Average duration of chartered-in portfolio: 4.4 years
- Crude 2.5 years
- Products 7.5 years
- U.S. Flag 5.1 years
• Average duration of chartered-out portfolio: 1.7 years
- Crude 0.8 years
- Products 0.7 years
- U.S. Flag 2.7 years
69% of Fleet
57% of Fleet
110 Vessels
61 Vessels
Two newbuild MRs, time chartered-in for 7 years and
delivering in 2011 swapped for two 2009-built 8-year
time charters delivering Q110 and Q210.
delivering in 2011 swapped for two 2009-built 8-year
time charters delivering Q110 and Q210.
Charter-in commitment savings = $6M
MR Swap Transaction
Portfolio of owned and chartered-in tonnage is managed based on market cycle
Spot
Fixed
*Based on 2010 projected revenue days
Time charters-out will generate ~$260M TCE revenues in 2010
Owned and Chartered-in Portfolio

Page 8
OSG
Market / Competitive Outlook
Our U.S. Flag strategy is to become the leading operator of modern double hull
tankers/ATBs in the Jones Act market with the majority of the fleet committed to
servicing long-term COAs and time charters
tankers/ATBs in the Jones Act market with the majority of the fleet committed to
servicing long-term COAs and time charters
§ 2010 expected to be as tough as 2009
§ Refinery utilization expected to remain in the
mid-80% range
mid-80% range
§ U.S. demand levels are expected to remain
relatively constant
relatively constant
§ 8 ships in the Jones Act fleet currently in layup
§ The competitive market of owners with high
quality, new ships is shrinking
quality, new ships is shrinking
§ OPA-90 retirements has market turning
favorable in 2012; we expect timing could be
accelerated by bankruptcies and earlier
retirement of marginal tonnage
favorable in 2012; we expect timing could be
accelerated by bankruptcies and earlier
retirement of marginal tonnage
U.S. Flag
< 2010 OSG Deliveries
• Overseas Cascade (complete)
• OSG 350 (complete)
• Overseas Martinez
• Overseas Anacortes
• OSG 351
< 2011 OSG Deliveries
• Overseas Chinook
• Overseas Tampa
< 65% of fleet is chartered-out through 12/31/10
< 56% of fleet is chartered-out through 12/31/11
< 2 owned shuttle tankers chartered at premium
rates
rates

Page 9
Products: Refinery Expansions Will Benefit Ton-mile Demand
Brazil
Petrobras 380K bpd 2013
India
850K bpd 2010-2014
Essar Oil, BROL, Indian Oil
Company, Hindustan
Petroleum, Nagarjuna
Company, Hindustan
Petroleum, Nagarjuna
China
Qingdao, Tianjin, Quizhou 700K bpd 2010
Jilin, Yueyan 300K bpd 2011
PetroChina, Sinopec 400K bpd 2012
Jilin, Yueyan 300K bpd 2011
PetroChina, Sinopec 400K bpd 2012
In Planning
760K bpd 2013-2014
760K bpd 2013-2014
Middle East
Saudi Arabia JV 800K bpd
- Yanbu 2014/2015
- Jubail 2013/2014
UAE 400K bpd 2014
- Yanbu 2014/2015
- Jubail 2013/2014
UAE 400K bpd 2014
Our products strategy is to be the ship operator of choice by offering high quality ships and
technical management and fostering strong relationships with customers and partners
technical management and fostering strong relationships with customers and partners

Page 10
Our crude strategy is to maintain our market leadership positions through commercial
pool participation and build cargo portfolios with key partners and customers
pool participation and build cargo portfolios with key partners and customers
Source of China oil imports: ESAI
Chinese auto sales in March 2010 hit a
new record of 1.75 million vehicles, up
56% year-over-year
new record of 1.75 million vehicles, up
56% year-over-year
Crude oil imports into China have increased
from 2.9 mbpd in 2006 to 4.0 mbpd in 2009 and
are forecast to increase to 5.6 mbpd in 2014
from 2.9 mbpd in 2006 to 4.0 mbpd in 2009 and
are forecast to increase to 5.6 mbpd in 2014
Crude: China Isn’t Slowing Down

Page 11
Key Takeaways / Differentiators
< Focused on running our business for the long-term
• Consistent strategy throughout the 2008-2009 financial/credit crisis
• Board holds us accountable for both short-term performance and long-term value creation
< Confident about our relative competitive position
• Market leader in crude, products and U.S. Flag segments
• Strong balance sheet and financial position
– Predominantly unsecured borrower
– Liquidity position is strong
– Conservative, consistent financial management
– Annual dividend is sustainable
– Well within all covenant limitations
• Built-in growth with 17-ship newbuild program over next two years
• Commercial pools and cargo systems uniquely enable OSG to outperform the market
• Active asset management generates cash, creates optionality and results in competitive
vessel ownership costs
vessel ownership costs
• Leveraged to rebound with OPEC production increases, spot rate improvement and start-
up of export refineries in Asia
up of export refineries in Asia

Page *
Financial Review
Myles Itkin, CFO

Page 13
Spot rates down across all fleets, except VLCCs.
Q110 Q109
VLCC $49.9K/day $47.2K/day
Suezmax $28.3K/day $40.1K/day
Aframax $17.5K/day $28.4K/day
Panamax $20.3K/day $27.3K/day
MR $15.2K/day $22.4K/day
VLCC $49.9K/day $47.2K/day
Suezmax $28.3K/day $40.1K/day
Aframax $17.5K/day $28.4K/day
Panamax $20.3K/day $27.3K/day
MR $15.2K/day $22.4K/day
Redelivery of 11 older MR vessels and layup of 6
U.S. Flag vessels
U.S. Flag vessels
$6.5M reduction in profit share and redelivery of 11
older MR product carriers.
older MR product carriers.
FSO Africa not yet employed; $4.5M charge on
hedge dedesignation of FSO Africa interest rate
swap.
hedge dedesignation of FSO Africa interest rate
swap.
Increase in average amount of debt outstanding of
$411M; partially offset by lower rates on floating rate
debt
$411M; partially offset by lower rates on floating rate
debt
Financial Review - Income Statement

Page 14
Raised net $450M in capital market transactions; offset
by $400M repayment of credit facility; $112M on vessel
expenditures and $92M advanced to FSO joint venture
by $400M repayment of credit facility; $112M on vessel
expenditures and $92M advanced to FSO joint venture
Increase in VLCC rates drove up balances due from TI
Pool (Q110 spot rate of $50K/day v. Q409 spot rate of
$24K/day) and increase in lightering activities and rates
in U.S. Gulf
Pool (Q110 spot rate of $50K/day v. Q409 spot rate of
$24K/day) and increase in lightering activities and rates
in U.S. Gulf
Reflects $112M costs for construction in progress.
Includes CIP of $625M
Includes CIP of $625M
Funding conversion on FSO Africa $20M; cash collateral
required by FSO JV banks $72M; offset by net operating
losses and ATC incentive hire distribution
required by FSO JV banks $72M; offset by net operating
losses and ATC incentive hire distribution
Financial Review - Balance Sheet

Page 15
Sources & Uses of Cash During the Period

Page 16
2010 Guidance
< Estimated vessel expenses
• $280M to $300M
< Time and bareboat charter hire expenses
• $345M to $370M
< Depreciation and Amortization
• $170M to $190M
< G&A
• $100M to $115M
< Equity income of affiliated companies (updated from $15M to $20M due to change in assumptions on FSO Africa)
• $10M to $15M
< Interest expense (updated from $50M to $60M to reflect $300M 8.125% bond issue)
• Interest expense approx. $65M to $75M
< Capital expenditures for the balance of the year
• $20M in drydock costs (Q2 $10M; Q3 $3M and Q4 $7M) on 20 vessels
• $254M newbuild progress payments, vessel improvements and capitalized interest (Q2 $64M; Q3
$20M and Q4 $170M)
$20M and Q4 $170M)

Page *
Appendix

Page 18
Set forth below are significant items of income and expense that affected the Company’s results for the three months ended March 31, 2010 and
2009, all of which are typically excluded by securities analysts in their published estimates of the Company’s financial results
2009, all of which are typically excluded by securities analysts in their published estimates of the Company’s financial results
Special Items Affecting Net Income/(Loss)
Reconciling Items and Other Information

Page 19
EBITDA represents operating earnings excluding net income attributable to the noncontrolling interest, which is before interest expense and
income taxes, plus other income and depreciation and amortization expense. EBITDA is presented to provide investors with meaningful additional
information that management uses to monitor ongoing operating results and evaluate trends over comparative periods. EBITDA should not be
considered a substitute for net income / (loss) attributable to the Company or cash flow from operating activities prepared in accordance with
accounting principles generally accepted in the United States or as a measure of profitability or liquidity. While EBITDA is frequently used as a
measure of operating results and performance, it is not necessarily comparable to other similarly titled captions of other companies due to
differences in methods of calculation.
EBITDA
Consistent with general practice in the shipping industry, the Company uses time charter equivalent revenues, which represents shipping revenues
less voyage expenses, as a measure to compare revenue generated from a voyage charter to revenue generated from a time charter. Time charter
equivalent revenues, a non-GAAP measure, provides additional meaningful information in conjunction with shipping revenues, the most directly
comparable GAAP measure, because it assists Company management in making decisions regarding the deployment and use of its vessels and in
evaluating their financial performance.
TCE Revenues
Reconciling Items and Other Information (continued)

Page 20
|
|
Owned
|
Chartered-in
|
Total
|
Newbuild
|
Total
|
|
VLCC
|
9
|
7
|
16
|
2
|
18
|
|
FSO
|
2
|
-
|
2
|
-
|
2
|
|
Suezmax
|
-
|
2
|
2
|
-
|
2
|
|
Aframax
|
6
|
7
|
13
|
-
|
13
|
|
Panamax
|
9
|
-
|
9
|
-
|
9
|
|
Lightering
|
2
|
5
|
7
|
-
|
7
|
|
Total Crude
|
28
|
21
|
49
|
2
|
51
|
|
LR2
|
-
|
1
|
1
|
-
|
1
|
|
LR1
|
2
|
2
|
4
|
4
|
8
|
|
MR*
|
13
|
16
|
29
|
6
|
35
|
|
Total Products
|
15
|
19
|
34
|
10
|
44
|
|
Handysize
|
5
|
7
|
12
|
4
|
16
|
|
ATB
|
7
|
-
|
7
|
-
|
7
|
|
Lightering
|
4
|
-
|
4
|
1
|
5
|
|
Total U.S. Flag
|
16
|
7
|
23
|
5
|
28
|
|
Total Gas
|
4
|
-
|
4
|
-
|
4
|
|
TOTAL
|
63
|
47
|
110
|
17
|
127
|
*Operating fleet Includes 2 owned U.S. Flag product carriers that trade internationally and a car carrier; newbuild fleet includes chemical tanker
Fleet Composition - As of 4/30/10

Page 21
Off Hire and Scheduled Drydock
In addition to regular inspections by OSG personnel, all vessels are subject to periodic drydock,
special survey and other scheduled maintenance. The table below sets forth actual days off hire for
the first quarter of 2010 and anticipated days off hire for the above-mentioned events by class for the
second, third and fourth quarters of 2010.
special survey and other scheduled maintenance. The table below sets forth actual days off hire for
the first quarter of 2010 and anticipated days off hire for the above-mentioned events by class for the
second, third and fourth quarters of 2010.
Off Hire Schedule

Page 22
For the Quarter Ended March 31, 2010
Charter Hire Expense by Segment
Page 23
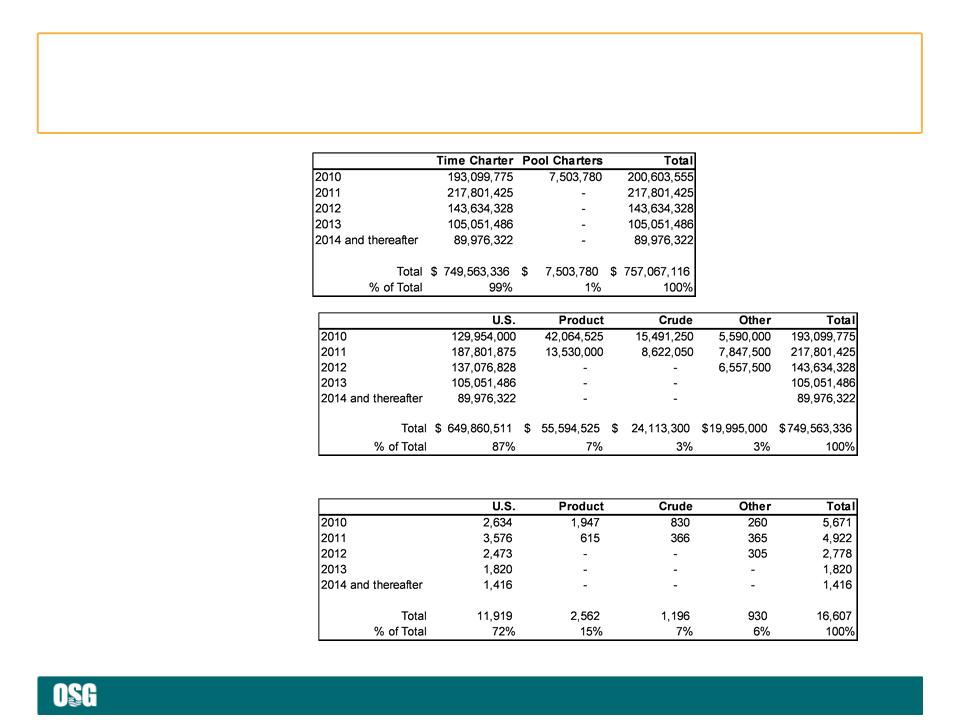
Locked-in Time Charter
Days by Segment
Days by Segment
Locked-in Time Charter
Revenue by Segment
Revenue by Segment
Locked-in
Charter Revenue
Charter Revenue
Note: Locked in time charter days above for 2010 are as of 3/31/10 and will differ from a more current date
used in Appendices 3 and 4 in the quarterly earnings press release
used in Appendices 3 and 4 in the quarterly earnings press release
Future Revenue $/Days by Segment - As of 3/31/10

Page *
www.osg.com