Attached files
| file | filename |
|---|---|
| 8-K - 8-K - VIVUS INC | a10-9128_28k.htm |
Exhibit 99.1
|
|
Suzanne Oparil, MD Professor of Medicine, Physiology and Biophysics Director, Vascular Biology and Hypertension Program Division of Cardiovascular Disease Department of Medicine University of Alabama at Birmingham Birmingham, Alabama Once-Daily, Low-Dose, Controlled-Release Phentermine/Topiramate (PHEN/TPM CR) Improves Blood Pressure and Results in Weight Loss in Overweight/Obese Patients Through 28 Weeks |
|
|
American Society of Hypertension, Inc. (ASH) Disclosure of Relationships Over the past 12 months Grant/Research Support: Daiichi Sankyo Inc., Gilead, and Takeda Consultant: Boehringer Ingelheim, Daiichi Sankyo Inc., Eli Lilly, Forest Laboratories, NicOx, Novartis, Schering-Plough, The Salt Institute, and Vivus Honoraria: Daiichi Sankyo Inc., Merck and Co., and Novartis |
|
|
American Society of Hypertension, Inc. (ASH) Learning Objectives Upon completion of this activity, participants should be better able to Explain the current unmet need for safe and effective weight loss and its implications for obesity-related comorbidities Describe the unique formulation of PHEN/TPM CR and its potential use for the management of overweight and obese patients with hypertension Discuss data from the integrated analyses of safety and efficacy of 3 pooled Phase 3 trials evaluating PHEN/TPM CR |
|
|
Overview The prevalence of overweight and obese adults (BMI >25 kg/m2) is 68% (NHANES 2007-2008) and is on the rise1 Obesity is associated with excess mortality due to comorbidities (eg, cardiovascular disease, diabetes, hypertension)2,3 Standard treatments for obesity (diet and exercise) often achieve only marginal weight loss Currently approved weight-loss agents often fail to achieve long-term efficacy due to safety or tolerability concerns A well-tolerated, safe, and effective weight loss therapy that can improve obesity-associated comorbidity is needed to impede this growing epidemic 1. Flegal M, et al. JAMA. 2010;303:235-241. 2. Poirier P, et al. Arterioscler Thromb Vasc Biol. 2006;26:968-976. 3. Must A, et al. JAMA. 1999;282:1523-1529. |
|
|
Phentermine and Topiramate Phentermine (PHEN)1-3 FDA approved (1959) as a short-term adjunct to diet and exercise Stimulates neurons to release or maintain high levels of catecholamines that may cause Appetite suppression by increasing blood leptin levels A decrease in neuropeptide Y production, which may result in increased satiety and decreased appetite Adverse effects at recommended dose of 37.5 mg/day Topiramate (TPM)4-7 Neurotherapeutic agent approved for seizure disorders (1996) and migraine headache prophylaxis Produced weight loss in obese individuals and clinically meaningful improvements in glycemic control and blood pressure Associated with dose-limiting adverse effects, which prevent use as a single agent at the doses necessary to produce significant weight loss 1. Adipex-P® [package insert]. Sellersville, PA: Teva Pharmaceuticals USA; 2005. 2. Montague CT, et al. Nature. 1997;387:903-908. 3. Heymsfield SB, et al. JAMA. 1999;282:1568-1575. 4. Topamax® [package insert]. Titusville, NJ: Ortho-McNeil-Janssen Pharmaceuticals, Inc.; 2008. 5. Ben-Menachem E, et al. Obes Res .2003;11:556-562. 6. Wilding J, et al. Int J Obes Relat Metab Disord. 2004;28:1399-1410. 7. Bray GA, et al. Obes Res. 2003;11:722-733. |
|
|
PHEN/TPM CR or Qnexa® is an investigational weight loss therapy that is a combination of PHEN and TPM The 2 agents produce weight loss through different complementary mechanisms specific to each component Response with the combination is greater than the maximal response that could be obtained with either agent alone, allowing for lower doses of each agent Once-Daily, Low-Dose, Controlled Release Phentermine/Topiramate (PHEN/TPM CR) |
|
|
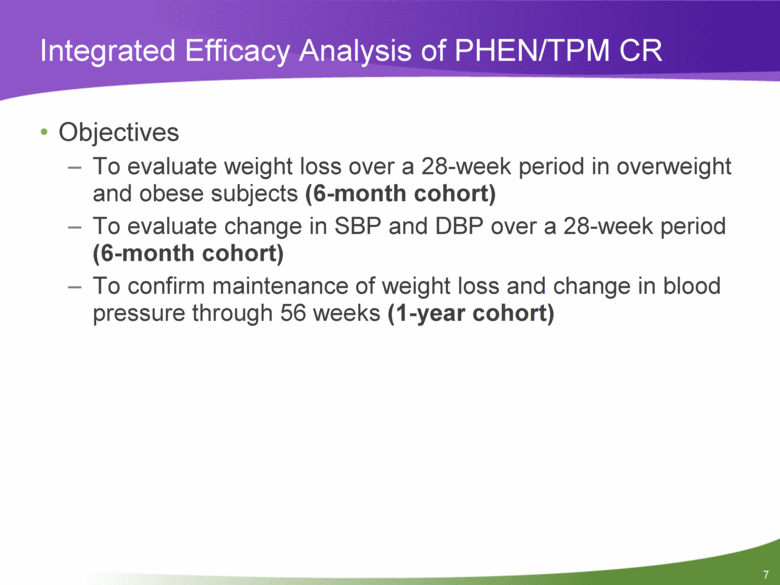
Integrated Efficacy Analysis of PHEN/TPM CR Objectives To evaluate weight loss over a 28-week period in overweight and obese subjects (6-month cohort) To evaluate change in SBP and DBP over a 28-week period (6-month cohort) To confirm maintenance of weight loss and change in blood pressure through 56 weeks (1-year cohort) |
|
|
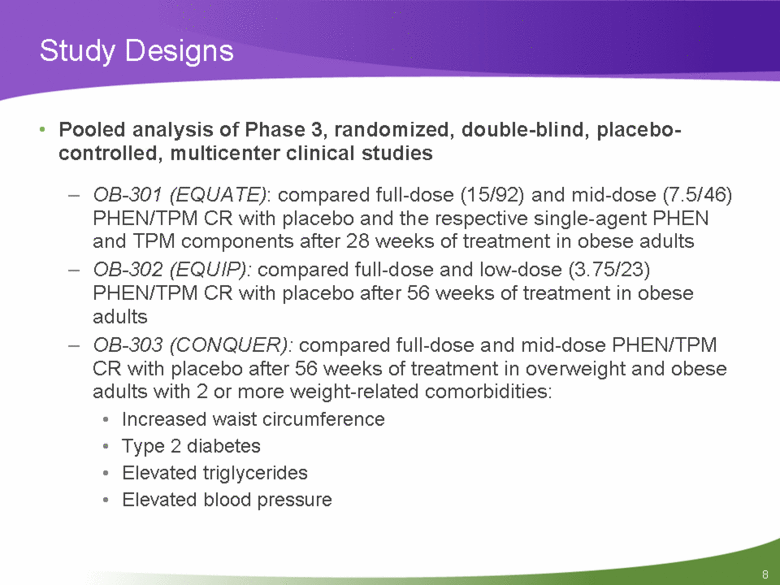
Study Designs Pooled analysis of Phase 3, randomized, double-blind, placebo-controlled, multicenter clinical studies OB-301 (EQUATE): compared full-dose (15/92) and mid-dose (7.5/46) PHEN/TPM CR with placebo and the respective single-agent PHEN and TPM components after 28 weeks of treatment in obese adults OB-302 (EQUIP): compared full-dose and low-dose (3.75/23) PHEN/TPM CR with placebo after 56 weeks of treatment in obese adults OB-303 (CONQUER): compared full-dose and mid-dose PHEN/TPM CR with placebo after 56 weeks of treatment in overweight and obese adults with 2 or more weight-related comorbidities: Increased waist circumference Type 2 diabetes Elevated triglycerides Elevated blood pressure |
|
|
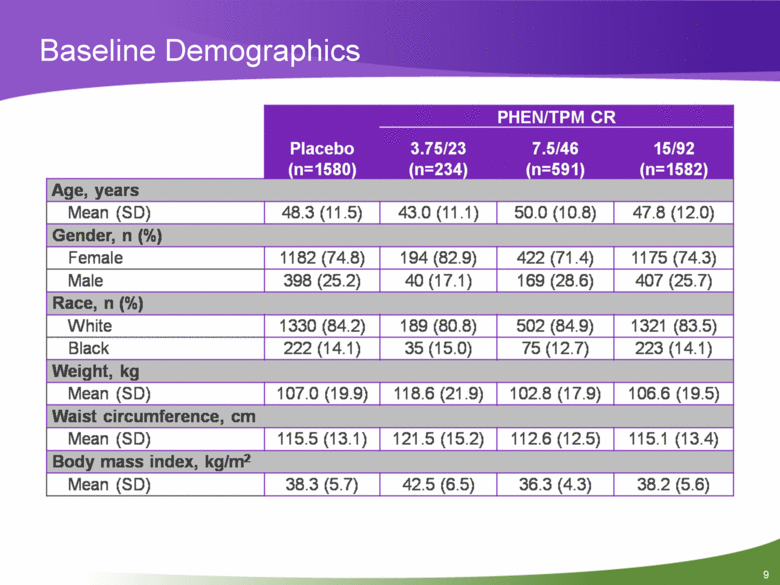
Baseline Demographics Placebo (n=1580) PHEN/TPM CRL 3.75/23 (n=234) 7.5/46 (n=591) 15/92 (n=1582) Age, years Mean (SD) 48.3(11.5) 43.0(11.1) 50.0(10.8) 47.8(12.0) Gender, n (%) Female 1182 (74.8) 194 (82.9) 422 (71.4) 1175 (74.3) Male 398 (25.2) 40(17.1) 169 (28.6) 407 (25.7) Race, n (%) White 1330 (84.2) 189 (80.8) 502 (84.9) 1321 (83.5) Black 222(14.1) 35(15.0) 75(12.7) 223(14.1) Weight, kg Mean (SD) 107.0(19.9) 118.6(21.9) 102.8(17.9) 106.6(19.5) Waist circumference, cm Mean (SD) 115.5(13.1) 121.5(15.2) 112.6(12.5) 115.1 (13.4) Body mass index, kg/m2 Mean (SD) 38.3 (5.7) 42.5 (6.5) 36.3 (4.3) 38.2 (5.6) |
|
|
|
|
|
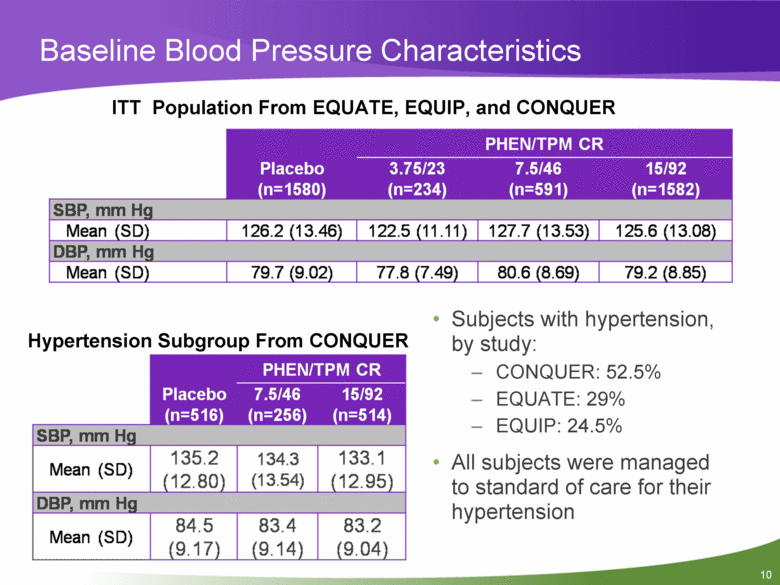
Baseline Blood Pressure Characteristics ITT Population From EQUATE, EQUIP, and CONQUER Placebo (n=1580) PHEN/TPM CR 3.75/23 (n=234) 7.5/46 (n=591) 15/92 (n=1582) SBP, mm Hg Mean (SD) 126.2(13.46) 122.5(11.11) 127.7(13.53) 125.6(13.08) DBP, mm Hg Mean (SD) 79.7 (9.02) 77.8 (7.49) 80.6 (8.69) 79.2 (8.85) Hypertension Subgroup From CONQUER PHEN/TPM CR Placebo (n=516) 7.5/46 15/92 (n=256) (n=514) SBP, mm Hg Mean (SD) 135.2 (12.80) 134.3 (13.54) 133.1 (12.95) DBP, mm Hg Mean (SD) 84.5 (9.17) 83.4 (9.14) 83.2 (9.04) • Subjects with hypertension, by study: - CONQUER: 52.5% - EQUATE: 29% - EQUIP: 24.5% • All subjects were managed to standard of care for their hypertension |
|
|
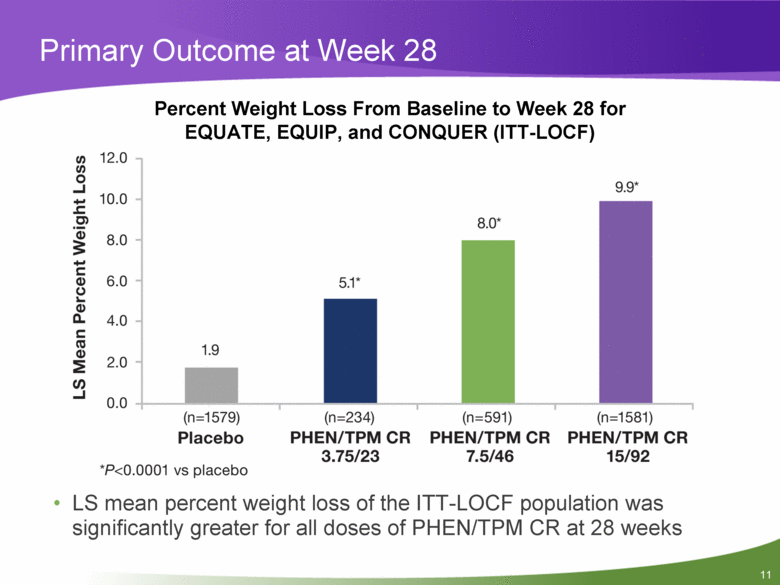
Primary Outcome at Week 28 LS mean percent weight loss of the ITT-LOCF population was significantly greater for all doses of PHEN/TPM CR at 28 weeks Percent Weight Loss From Baseline to Week 28 for EQUATE, EQUIP, and CONQUER (ITT-LOCF) |
|
|
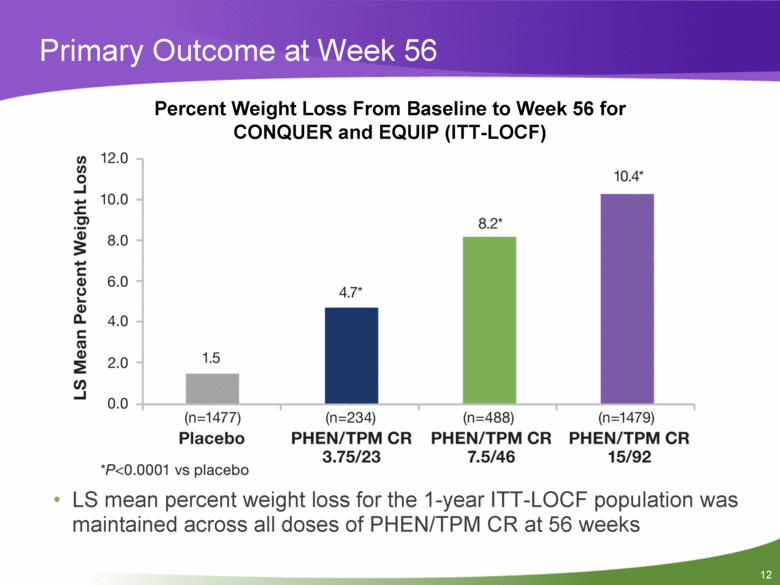
Primary Outcome at Week 56 Percent Weight Loss From Baseline to Week 56 for CONQUER and EQUIP (ITT-LOCF) LS mean percent weight loss for the 1-year ITT-LOCF population was maintained across all doses of PHEN/TPM CR at 56 weeks |
|
|
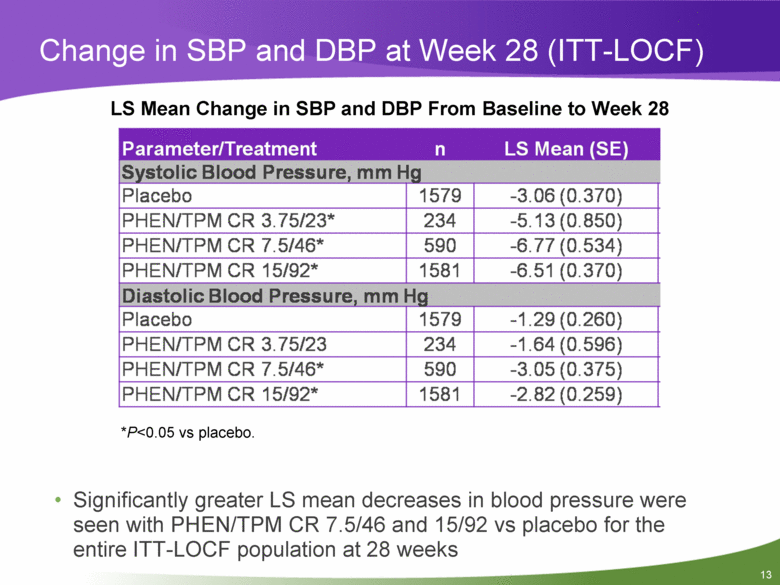
Change in SBP and DBP at Week 28 (ITT-LOCF) LS Mean Change in SBP and DBP From Baseline to Week 28 Parameter/Treatment n LS Mean (SE) Systolic Blood Pressure, mm Hg Placebo 1579 -3.06(0.370) PHEN/TPM CR 3.75/23* 234 -5.13(0.850) PHEN/TPM CR 7.5/46* 590 -6.77(0.534) PHEN/TPM CR 15/92* 1581 -6.51 (0.370) Diastolic Blood Pressure, mm Hg Placebo 1579 -1.29(0.260) PHEN/TPM CR 3.75/23 234 -1.64(0.596) PHEN/TPM CR 7.5/46* 590 -3.05(0.375) PHEN/TPM CR 15/92* 1581 -2.82(0.259) *P<0.05 vs placebo. • Significantly greater LS mean decreases in blood pressure were seen with PHEN/TPM CR 7.5/46 and 15/92 vs placebo for the entire ITT-LOCF population at 28 weeks |
|
|
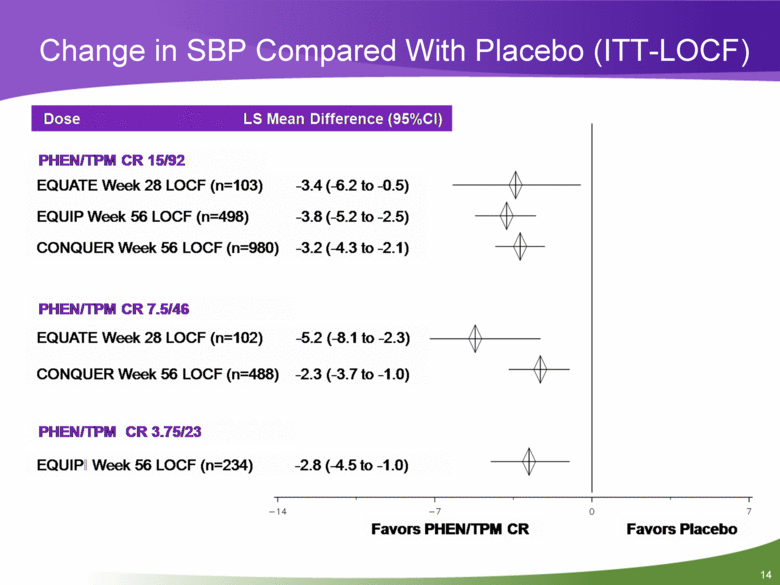
Change in SBP Compared With Placebo (ITT-LOCF) Dose LS Mean Difference (95%CI) PHEN/TPM CR 15/92 EQUATE Week 28 LOCF (n=103) EQUIP Week 56 LOCF (n=498) CONQUER Week 56 LOCF (n=980) -3.4 (-6.2 to -0.5) -3.8 (-5.2 to -2.5) -3.2 (-4.3 to-2.1) PHEN/TPM CR 7.5/46 EQUATE Week 28 LOCF (n=102) -5.2 (-8.1 to -2.3) CONQUER Week 56 LOCF (n=488) -2.3 (-3.7 to -1.0) PHEN/TPM CR 3.75/23 EQUIP Week 56 LOCF (n=234) -2.8 (-4.5 to-1.0) Favors PHEN/TPM CR 0 7 Favors Placebo -14 -7 |
|
|
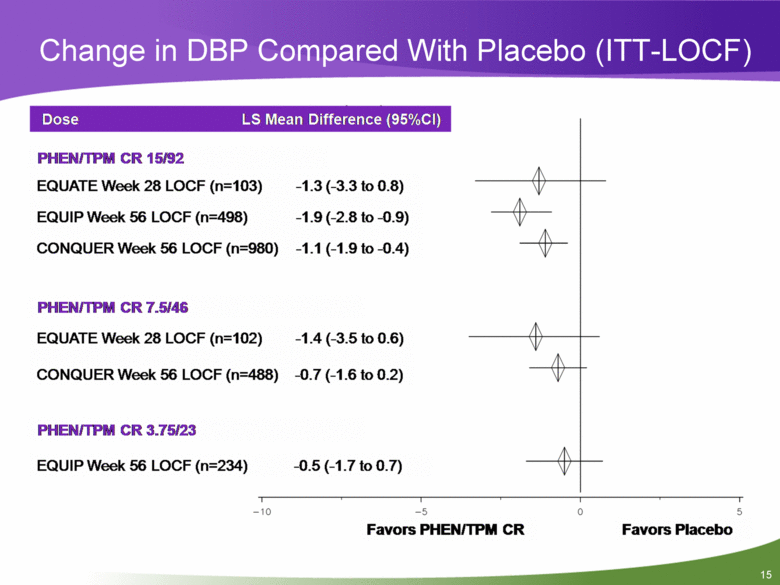
Change in DBP Compared With Placebo (ITT-LOCF) Dose LS Mean Difference (95%CI) -1.3 (-3.3 to 0.8) -1.9 (-2.8 to-0.9) -1.1 (-1.9 to-0.4) PHEN/TPM CR 15/92 EQUATE Week 28 LOCF (n=103) EQUIP Week 56 LOCF (n=498) CONQUER Week 56 LOCF (n=980) PHEN/TPM CR 7.5/46 EQUATE Week 28 LOCF (n=102) -1.4 (-3.5 to 0.6) CONQUER Week 56 LOCF (n=488) -0.7 (-1.6 to 0.2) PHEN/TPM CR 3.75/23 EQUIP Week 56 LOCF (n=234) -0.5 (-1.7 to 0.7) -10 -5 Favors PHEN/TPM CR Favors Placebo 0 5 |
|
|
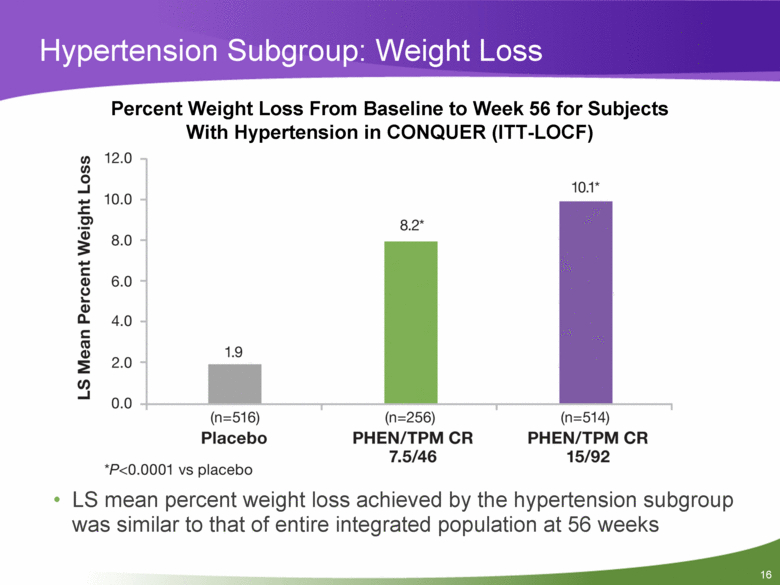
Hypertension Subgroup: Weight Loss Percent Weight Loss From Baseline to Week 56 for Subjects With Hypertension in CONQUER (ITT-LOCF) LS mean percent weight loss achieved by the hypertension subgroup was similar to that of entire integrated population at 56 weeks |
|
|
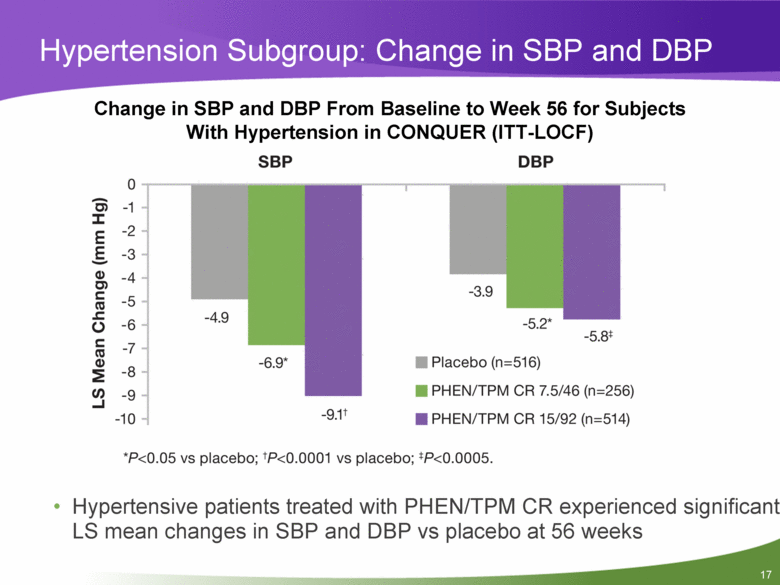
Hypertension Subgroup: Change in SBP and DBP Change in SBP and DBP From Baseline to Week 56 for Subjects With Hypertension in CONQUER (ITT-LOCF) Hypertensive patients treated with PHEN/TPM CR experienced significant LS mean changes in SBP and DBP vs placebo at 56 weeks |
|
|
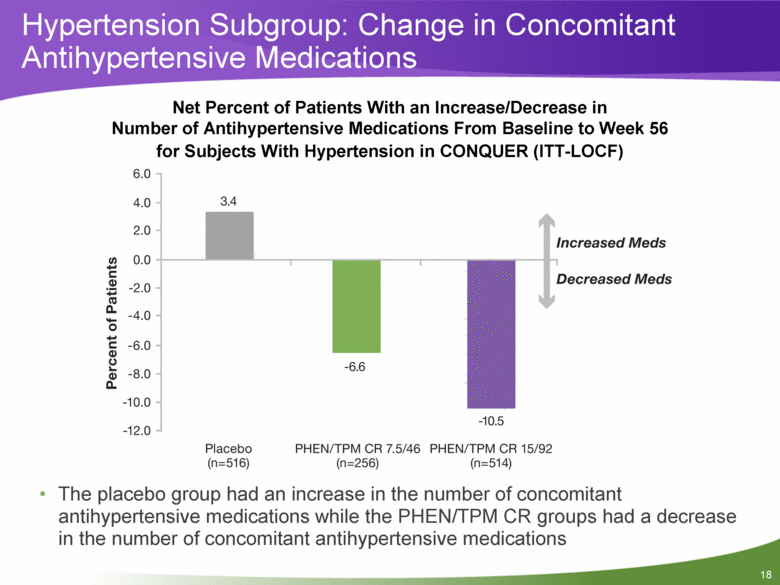
Net Percent of Patients With an Increase/Decrease in Number of Antihypertensive Medications From Baseline to Week 56 for Subjects With Hypertension in CONQUER (ITT-LOCF) The placebo group had an increase in the number of concomitant antihypertensive medications while the PHEN/TPM CR groups had a decrease in the number of concomitant antihypertensive medications Hypertension Subgroup: Change in Concomitant Antihypertensive Medications |
|
|
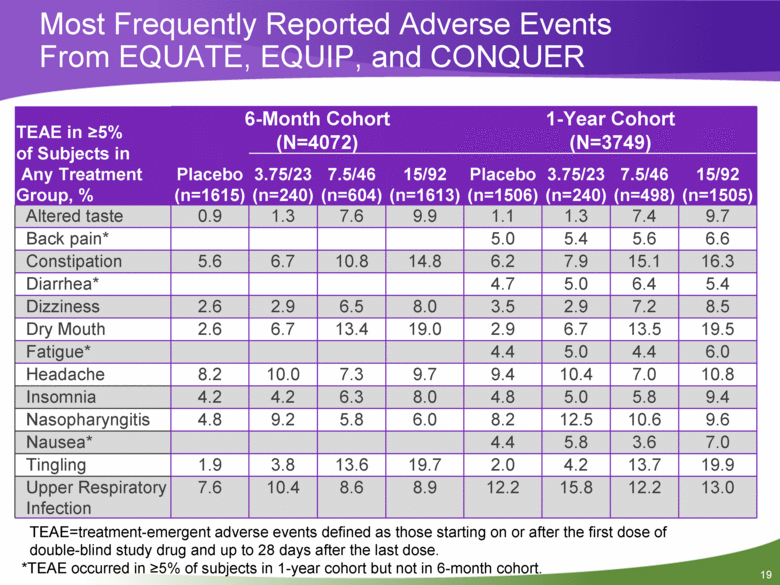
Most Frequently Reported Adverse Events From EQUATE, EQUIP, and CONQUER TEAE in >5% of Subjects in Any Treatment Group, % 6-Month Cohort (N=4072) 1-Year Cohort (N=3749) Placebo (n=1615) 3.75/23 (n=240) 7.5/46 (n=604) 15/92 (n=1613) Placebo (n=1506) 3.75/23 (n=240) 7.5/46 (n=498) 15/92 (n=1505) Altered taste 0.9 1.3 7.6 9.9 1.1 1.3 7.4 9.7 Back pain* 5.0 5.4 5.6 6.6 Constipation 5.6 6.7 10.8 14.8 6.2 7.9 15.1 16.3 Diarrhea* 4.7 5.0 6.4 5.4 Dizziness 2.6 2.9 6.5 8.0 3.5 2.9 7.2 8.5 Dry Mouth 2.6 6.7 13.4 19.0 2.9 6.7 13.5 19.5 Fatigue* 4.4 5.0 4.4 6.0 Headache 8.2 10.0 7.3 9.7 9.4 10.4 7.0 10.8 Insomnia 4.2 4.2 6.3 8.0 4.8 5.0 5.8 9.4 Nasopharyngitis 4.8 9.2 5.8 6.0 8.2 12.5 10.6 9.6 Nausea* 4.4 5.8 3.6 7.0 Tingling 1.9 3.8 13.6 19.7 2.0 4.2 13.7 19.9 Upper Respiratory Infection 7.6 10.4 8.6 8.9 12.2 15.8 12.2 13.0 TEAE=treatment-emergent adverse events defined as those starting on or after the first dose of double-blind study drug and up to 28 days after the last dose. *TEAE occurred in >5% of subjects in 1-year cohort but not in 6-month cohort. |
|
|
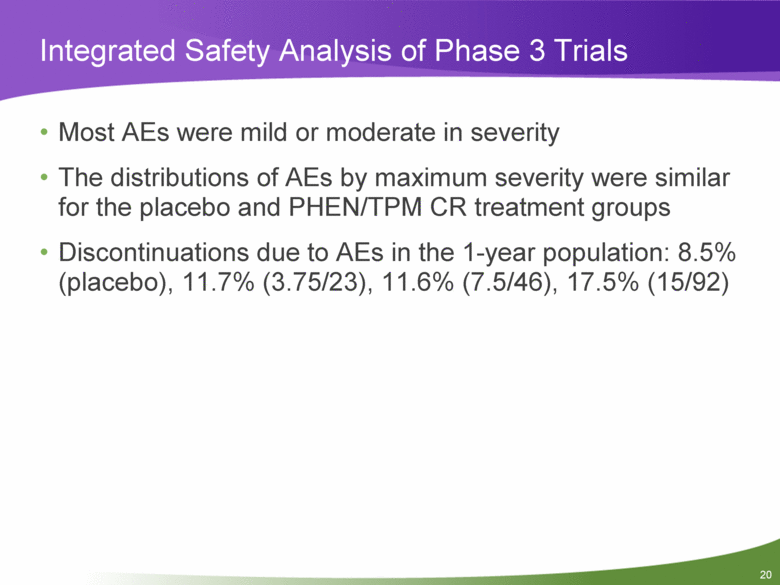
Integrated Safety Analysis of Phase 3 Trials Most AEs were mild or moderate in severity The distributions of AEs by maximum severity were similar for the placebo and PHEN/TPM CR treatment groups Discontinuations due to AEs in the 1-year population: 8.5% (placebo), 11.7% (3.75/23), 11.6% (7.5/46), 17.5% (15/92) |
|
|
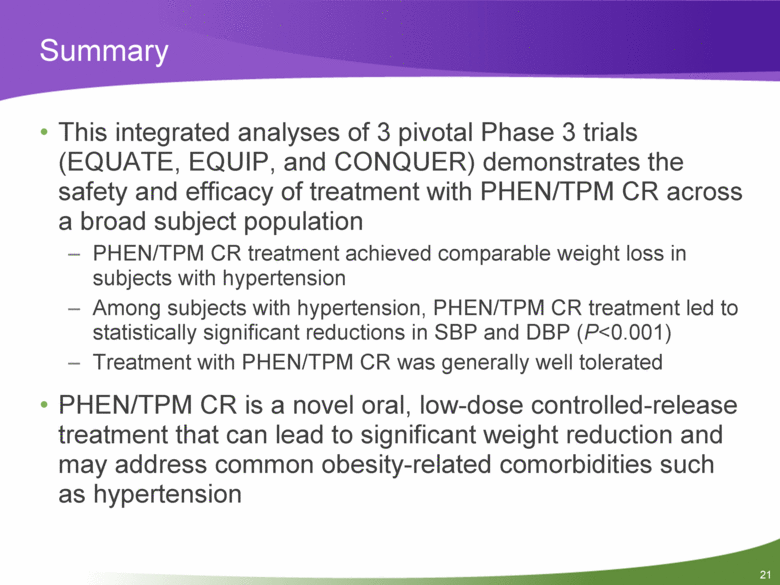
Summary This integrated analyses of 3 pivotal Phase 3 trials (EQUATE, EQUIP, and CONQUER) demonstrates the safety and efficacy of treatment with PHEN/TPM CR across a broad subject population PHEN/TPM CR treatment achieved comparable weight loss in subjects with hypertension Among subjects with hypertension, PHEN/TPM CR treatment led to statistically significant reductions in SBP and DBP (P<0.001) Treatment with PHEN/TPM CR was generally well tolerated PHEN/TPM CR is a novel oral, low-dose controlled-release treatment that can lead to significant weight reduction and may address common obesity-related comorbidities such as hypertension |
|
|
Acknowledgments |
|
|
American Society of Hypertension, Inc. (ASH) Disclosure of Relationships Over the past 12 months Grant/Research Support: Daiichi Sankyo Inc., Gilead, and Takeda Consultant: Boehringer Ingelheim, Daiichi Sankyo Inc., Eli Lilly, Forest Laboratories, NicOx, Novartis, Schering-Plough, The Salt Institute, and Vivus Honoraria: Daiichi Sankyo Inc., Merck and Co., and Novartis |

