Attached files
Table of Contents
UNITED STATES
SECURITIES AND EXCHANGE COMMISSION
Washington, D.C. 20549
Form 10-K
(Mark One)
| x | ANNUAL REPORT PURSUANT TO SECTION 13 OR 15(d) OF THE SECURITIES EXCHANGE ACT OF 1934 |
| For the fiscal year ended December 31, 2009 |
OR
| ¨ | TRANSITION REPORT PURSUANT TO SECTION 13 OR 15(d) OF THE SECURITIES EXCHANGE ACT OF 1934 |
| For the transition period from to |
Commission File Number: 000-50327
iPass Inc.
(Exact name of Registrant as specified in its charter)
| Delaware | 93-1214598 | |
| (State or Other Jurisdiction of Incorporation or Organization) |
(I.R.S. Employer Identification No.) |
3800 Bridge Parkway
Redwood Shores, California 94065
(Address of principal executive offices) (Zip Code)
Registrant’s telephone number, including area code: (650) 232-4100
Securities registered pursuant to Section 12(b) of the Act:
| Title of Each Class |
Name of Each Exchange on Which Registered | |
| Common Stock, $0.001 Per Share Par Value |
NASDAQ Global Market |
Securities registered pursuant to Section 12(g) of the Act:
Common Stock, $0.001 Per Share Par Value
Indicate by check mark if the registrant is a well-known seasoned issuer, as defined in Rule 405 of the Securities Act. Yes ¨ No x
Indicate by check mark if the registrant is not required to file reports pursuant to Section 13 or Section 15(d) of the Act. Yes ¨ No x
Indicate by check mark whether the registrant (1) has filed all reports required to be filed by Section 13 or 15(d) of the Securities Exchange Act of 1934 during the preceding 12 months (or for such shorter period that the registrant was required to file such reports), and (2) has been subject to such filing requirements for the past 90 days. Yes x No ¨
Indicate by check mark whether the registrant has submitted electronically and posted on its corporate Web site, if any, every Interactive Data File required to be submitted and posted pursuant to Rule 405 of Regulation S-T during the preceding 12 months (or for such shorter period that the registrant was required to submit and post such files). Yes ¨ No ¨
Indicate by check mark if disclosure of delinquent filers pursuant to Item 405 of Regulation S-K is not contained herein, and will not be contained, to the best of the registrant’s knowledge, in definitive proxy or information statements incorporated by reference in Part III of this form 10-K or any amendment to this Form 10-K. x
Indicate by check mark whether the registrant is a large accelerated filer, an accelerated filer, a non-accelerated filer or a smaller reporting company. See the definitions of large “accelerated filer”, large accelerated filer” and “smaller reporting company” in Rule 12b-2 of the Exchange Act. (Check one):
| Large accelerated filer | ¨ | Accelerated filer | x | |||
| Non-accelerated filer | ¨ (Do not check if a smaller reporting company) | Smaller reporting company | ¨ | |||
Indicate by check mark whether the registrant is a shell company (as defined in Rule 12b-2 of the Act). Yes ¨ No x
Aggregate market value of the registrant’s common stock held by non-affiliates of the registrant, based upon the closing price of a share of the registrant’s common stock on June 30, 2009 as reported by the Nasdaq Global Market on that date: $64,674,771. The determination of affiliate status for the purposes of this calculation is not necessarily a conclusive determination for other purposes. The calculation excludes approximately 21,783,037 shares held by directors, officers and stockholders whose ownership exceeded five percent of the registrant’s outstanding Common Stock as of June 30, 2009. Exclusion of these shares should not be construed to indicate that such person controls, is controlled by or is under common control with the registrant.
The number of shares outstanding of the Registrant’s Common Stock, $0.001 par value, as of February 26, 2010 was 60,590,642.
DOCUMENTS INCORPORATED BY REFERENCE
Portions of the registrant’s definitive proxy statement in connection with our 2010 Annual Meeting of Stockholders to be filed with the Securities and Exchange Commission not later than April 30, 2010, are incorporated by reference in Part III, Items 10, 11, 12, 13 and 14 of this report on Form 10-K.
Table of Contents
FORM 10-K
FOR THE YEAR ENDED DECEMBER 31, 2009
TABLE OF CONTENTS
2
Table of Contents
Disclosure Regarding Forward-Looking Statements
This annual report on Form 10-K contains forward-looking statements regarding future events and our future results that are based on current expectations, estimates, forecasts, and projections about the industries in which we operate and the beliefs and assumptions of our management. Words such as “expects,” “will,” “anticipates,” “targets,” “goals,” “projects,” “intends,” “plans,” “believes,” “seeks,” “estimates,” variations of such words, and similar expressions are intended to identify such forward-looking statements. In addition, any statements which refer to projections of our future financial performance, our anticipated growth and trends in our business, and other characterizations of future events or circumstances, are forward-looking statements. Readers are cautioned that these forward-looking statements are only predictions and are subject to risks, uncertainties, and assumptions that are difficult to predict. Therefore, actual results may differ materially and adversely from those expressed in any forward-looking statements. Readers are directed to risks and uncertainties identified below, under “Item 1A. Risk Factors” and elsewhere herein, for factors that may cause actual results to be different from those expressed in these forward-looking statements. Any forward-looking statement speaks only as of the date on which it is made, and except as required by law, we undertake no obligation to revise or update publicly any forward-looking statements for any reason.
3
Table of Contents
| Item 1. | Business |
Overview
We offer enterprise mobility services on a global basis that simply, smartly and openly facilitate network access from mobile devices while providing the enterprise with visibility and control over their mobile ecosystem. We also offer managed network services for enterprise remote and branch office connectivity in North America. We were incorporated in California in July 1996 and reincorporated in Delaware in June 2000. Our principal executive offices are located in Redwood Shores, California.
Our Strategy
Our strategy is to provide our enterprise customers with market leading enterprise mobility services that allow them to effectively manage their mobile workforces by controlling costs, enforcing compliance and ensuring security when workers connect their mobile devices to a wide range of networks.
Our strategy consists of the following key elements and initiatives:
Deliver a new cloud-based platform.
In early 2009, we began work on a new service delivery platform to meet the evolving needs of our customers and channel partners, and to enable us to deliver new enterprise mobility services. We delivered the first version of this cloud-based platform in January 2010. We believe that our new cloud-based iPass Open Mobile Platform positions us to deliver a compelling and integrated portfolio of services that help enterprises address their increasingly complex mobility needs. We also believe that our Open Mobile Platform will allow our customers to keep pace with mobility innovation while minimizing capital investment in infrastructure and technology, and eliminating carrier and device lock-in. We have designed our new Open Mobile Platform to support the following key characteristics and functionality:
| • | An always-on, lightweight software client that runs on the mobile device; |
| • | A cloud-based platform that allows the enterprise to configure and manage its mobility offering by providing in-depth reporting and analytics on mobile usage across the networks and devices used by an enterprise; and |
| • | Policy enforcement services that enable the enterprise IT organization to have their cost, compliance and security measures enforced across their mobile workforce. |
Our new Open Mobile Platform can provide our enterprise and carrier customers control over the services they choose to deliver to their employees and users. The Open Mobile Platform also can provide our enterprise customers with the ability to enforce cost control and security policies directly on their employees’ mobile devices. The Open Mobile Platform is designed to help enterprise customers manage their mobile connectivity, network providers and devices whether provided through our platform or by another carrier or provider. We believe that our new platform and services are transforming our company from a business focused on selling network access to a company that sells a comprehensive set of enterprise mobility services.
Migrate existing customers and add new customers to our new Open Mobile Platform.
To grow our business we intend to migrate our existing customer base to our new Open Mobile Platform. We believe that the broader functionality and value proposition of our Open Mobile Platform services that are designed to address enterprise customer’s mobility needs will increase the number of active users of our services by our existing customers and attract new enterprise customers. We believe that our new platform will also
4
Table of Contents
increase end-user awareness of our brand and thus may drive more iPass network usage. We intend to drive the migration of existing and prospective customers to our new Open Mobile Platform by:
| • | Offering a new and integrated portfolio of mobility management services to our enterprise customers; |
| • | Continuing to enhance the value of our existing mobile network offering; |
| • | Providing a comprehensive set of services that enable our customers and partners to launch their own enterprise mobility services; and |
| • | Actively selling the value proposition of our Open Mobile Platform. |
Increase the use of our services.
Another element of our strategy, and what we believe is key to increasing stockholder value, is to drive increased usage of our services by our enterprise customers. We expect to achieve this by promoting our Open Mobile Platform and its benefits to drive an increase in the number of enterprise employees using our services and their frequency of use of our services. We believe that the visibility and control functionality of our new Open Mobile Platform will provide an improved value proposition to the enterprise IT departments of our customers and thereby support our customers making our platform a standard connectivity medium across their enterprise. Further, we believe that our new mobile device client offers significantly improved ease-of-use and better user experience that will support the enterprise’s users and will drive greater usage of our services. We intend to drive increased usage by:
| • | Making the end-user connection experience easy and seamless; |
| • | Providing tools to the IT administrator to more effectively manage their mobility service; |
| • | Continuing to develop the functionality and features of our platform; |
| • | Continually expanding our network footprint, including free Wi-Fi, in-flight and new geographies; and |
| • | Executing on our commitment to customer success and account management activities. |
Our Services
We offer Enterprise Mobility Services, consisting primarily of iPass Mobile Office services and our Network Services. We also offer Managed Network Services and other services. In January 2010, we launched our Open Mobile Platform, which is our new enterprise mobility management platform.
Enterprise Mobility Services
iPass Mobile Office
The iPass Mobile Office service has been the foundation of our enterprise mobility offering. iPass Mobile Office offers our customers the ability to reduce their costs of delivering mobility by providing unified global connectivity, connectivity management and device management. It delivers 3G mobile data, Wi-Fi hotspot, wired broadband and dial-up access through the iPassConnect mobility manager. It unifies management and billing for the IT department of our enterprise customers. We generally bill customers based on usage or charge a flat fee for the iPass Mobile Office services, as well as for additional monthly fees. We market and sell our Mobile Office services directly, as well as indirectly through channel partners, including network service providers, Internet service providers, systems integrators and value-added resellers.
5
Table of Contents
iPass Mobile Office includes the following features:
| • | iOQ Advanced Reporting. iOQ allows our customers’ in-house or outsourced help desk personnel to quickly identify issues and troubleshoot connection problems. With this feature enterprises can generate records and reports regarding access locations, client configuration, error codes, connection speeds, time to authenticate and other critical information. We generally charge a monthly fee for our iOQ service. |
| • | Hosted Authentication. We offer a hosted authentication option for iPass Mobile Office to enable enterprises to realize the benefits of our enterprise connectivity services while avoiding the cost of installing and managing additional authentication infrastructure. We manage an enterprise’s authentication server in one of our secure data centers, but the enterprise’s information technology manager retains full control. |
| • | On-Campus Roaming. This capability allows enterprise IT departments to offer a single user experience for all remote and local wireless connections, while extending centralized management of security policies to these potentially vulnerable corporate wireless networks. |
Network Services
In addition to our portfolio of services that our Enterprise Mobility Services provide, we can provide our enterprise customers with access to our network of hotel Ethernet, Wi-Fi hotspots and mobile broadband services such as 3G, as well as narrowband access technologies, such as modem dial-up. Our network is composed of contractual relationships and technical integrations with over 300 fixed and mobile telecommunications carriers, Internet service providers and other network service providers around the globe. This architecture has redundancy built in through fault-tolerance mechanisms at key points in the platform. This allows us to deliver extremely high service availability to our customers. Our network services provide customers with a dial-up network coverage in over 160 countries and broadband coverage including 3G, in more than 90 countries including what we believe is the world’s largest Wi-Fi network of over 140,000 hotspot access points. We charge our enterprise customers for accessing our network either using usage-based or fixed-fee arrangements, such as our enterprise flat rate price plan.
New Open Mobile Platform and Enterprise Mobility Services
In January 2010, we introduced our new cloud-based Open Mobile Platform which was designed to deliver enhanced enterprise mobility services. These services are designed to allow our enterprise customers to more effectively manage their mobile workforces by controlling costs, enforcing compliance and ensuring security when workers connect their mobile devices to the Internet and wireless networks. In addition, our software-enabled enterprise mobility services provide a connection management service that runs independent of carriers. We are architecting our Open Mobile Platform so that it can transparently facilitate every connection initiated by a user, regardless of the underlying network or device that they use to connect; as a result, the Open Mobile Platform can provide our enterprise customers with carrier independence, reduced lock-in costs and provide the enterprise a new level of choice and control. We believe that our new platform and services are transforming our company from a business focused on selling network access to a company that sells a comprehensive set of enterprise mobility services.
The iPass Open Mobile Platform will provide the foundation for an expanded portfolio of enterprise mobility services designed to enable enterprise users to connect from mobile devices over a wide range of networks simply, smartly and openly. The new portfolio of services for an enterprise customer includes:
iPass Mobile Connect. A service that orchestrates policy-based Internet and corporate network access for the iPass Open Mobile Client, an always-on, lightweight software client that runs on the mobile device. The service collects and transmits usage data and statistics from the mobile device via the iPass Open Mobile Portal and interfaces with the enterprise’s other client software and internal IT systems as needed.
6
Table of Contents
iPass Mobile Insight. A service that offers companies in-depth reporting and analysis on mobile usage across all their networks, connections and devices. Using the iPass Open Mobile Portal, IT administrators can design sophisticated reports that are driven by the iPass patented SQM data collection system that monitor mobile usage, cost and compliance by division, department or user group.
iPass Mobile Control. A powerful policy enforcement service that enables IT staff to apply and enforce cost, security and policy compliance measures across their mobile workforce by deploying a wide variety of connectivity—and device-oriented policies in real-time. Combined with iPass Mobile Insight companies can use real-world usage behavior to create comprehensive policies.
iPass Mobile Network. Our virtual network through which we provide our enterprise customers unmatched broadband access in over 90 countries across the world’s largest multi-technology mobile access footprint, unifying 3G mobile broadband, 140,000 Wi-Fi hotspots, hotel Ethernet and dial-up connections across more than 160 countries.
Managed Network Services
We also offer site-to-site managed network services (“MNS”) to enterprise customers through our iPass Branch Office and iPass Retail Office services that combine service functions that include end-to-end managed IP VPN, Visa accredited PCI security solutions for retail, and home gateway management for teleworkers. Complete with a tailored design and end-to-end software license agreements to meet enterprise performance requirements, our MNS services are used by leaders in a range of industries including retail, pharmaceutical, financial services and health care. We charge our customers a monthly fee for each end point and fees for installations and services. An end point is a logical network “end point.” In all situations, this means a separate physical location—it could be a home (as for teleworkers) or a branch office (for branch and/or retail).
Branch Office. This service provides an organization with a managed wide-area network to connect hundreds of small offices back to a corporate data center. It leverages iPass’ relationships with over 170 cable, DSL and wireless providers to provide coverage throughout the United States and Canada. The connections are secured using VPN platforms from Cisco, Juniper Networks and SonicWALL. As part of the managed service, we provide end-to-end proactive monitoring, reporting and troubleshooting of the health of the network, including availability, latency and packet loss. All of this information is available on a real-time basis on the Universal Remote Control section of the iPass portal.
Retail Office. Retail Office provides wide-area networking for distributed retail locations to connect to a corporate data center. It is identical to the Branch Office service, except that the offering includes Payment Card Industry (PCI) Compliance as part of the solution. PCI Compliance is required for any network which transmits credit card data. Retail Office solutions include VPN platforms from Cisco and Juniper Networks and include all of the proactive management and reporting associated with Branch Office as well as specific reporting for PCI Compliance. Secure Franchise is an additional add-on offering to Retail Office, which enables franchise owners to access their Retail Office locations remotely.
Virtual Office. iPass Virtual Office adds managed fixed broadband for teleworkers to Mobile Office, providing enterprise customers a method of outsourcing the broadband network design, implementation and on-going support for their entire population of home workers. This service provides customers a managed service with a single point of contact and single consolidated bill while supporting broadband connections on different technologies and carriers. iPass maintains relationships with over 170 cable and DSL providers to provide coverage in the United States and Canada. The Virtual Office service comes with a secured, managed Wi-Fi enabled router to allow a user the freedom to work anywhere within the home.
Other Services
We provide other services, including professional services and other fees.
For a breakdown of our revenue by service type, see “Management’s Discussion and Analysis of Financial Condition and Results of Operations” in Item 7.
7
Table of Contents
Our Platform Architecture and Services
iPass Enterprise Mobility Services are delivered to customers through a cloud-based platform comprising software elements on the mobile device and available over the Internet. Our platform gives the enterprise control over the definition and management of mobility services configured to their specific needs. This architecture gives customers choice in access, devices and services and serves as a bridge to future functionality through use of extensible web services standards, while keeping the operational and financial burden on companies low by not requiring them to purchase, deploy and manage on-premises infrastructure.
Our platform is designed to:
| • | Integrate with existing enterprise security, directory, and business systems; |
| • | Integrate with any network, whether the iPass Network, customer-owned networks or third-party provider networks; |
| • | Embrace new access methods, devices, and applications; and |
| • | Spawn innovation through applications that extend the platform, written by customers, partners or third-party software developers. |
The technology incorporated into our platform and services is designed to provide our customers with reliability, flexibility, network security, policy enforcement, consolidated billing and scalability. Our technology consists of the following principal components:
Foundation Services. Provide the basic capabilities needed for a cloud-based platform, including the ability to manage users (add, remove, or change rights), authenticate users to access the platform, authorize access to particular functions, or track and audit use of the platform.
Operational Services. Are built on top of the iPass Foundation Services platform, enabling customers to operate the various iPass market-facing offers, including user profile/configuration management, network directory management, account management, order management, usage management, support, billing and training.
Presentation Services. Impact how information is presented to users of the platform, usually through a web based portal. Services include web presentation, data validation, access control (controlling who can see and enter what), and web analytics.
Client Services. Provide the core update functionality within the platform, with the ability to update the client software, configuration files, and network registries associated with it, and to receive the data that the client collects.
High-Availability and Scalable Authentication Architecture. Our relationships with over 300 network service providers enable us to provide connectivity through multiple networks in over 160 countries on our cloud-based platform. As a result, our cloud-based platform reduces the risk of service interruptions associated with depending on only one service provider. Furthermore, our geographically distributed transaction centers act as a unified and fault-tolerant system that provides scalable and highly-available user authentication and quality management information collection. Each point in the authentication process is designed with built-in redundancy and fail-over capabilities. There has been no service-wide system down-time that impacted the platform and the services that it provides since 2000. This architecture also makes our cloud-based platform scalable, allowing us to handle more connections and users with a less than proportional increase in capital expenditures.
8
Table of Contents
Customers
We sell our service offerings directly to enterprise customers and indirectly though channel partners. As of December 31, 2009, 2008 and 2007 our customers included 391, 371 and 345, respectively, of the Forbes 2000 companies.
Revenues generated in the United States accounted for approximately 61%, 61% and 62% of total revenues for the years ended December 31, 2009, 2008 and 2007, respectively. International revenues accounted for approximately 39%, 39% and 38% of total revenues for the years ended December 31, 2009, 2008 and 2007, respectively. Revenues in the United Kingdom accounted for 10%, 9% and 11% of total revenues in 2009, 2008 and 2007, respectively. International revenues are determined by the location of the customer’s headquarters. We do experience some seasonality in our business due to decreased business travel during the summer, particularly in Europe, which results in decreased demand for our network services.
For information regarding our revenues, net loss and total assets, see “Selected Financial Data” in Item 6. Substantially all of our long-lived assets are located in the United States.
Agreements with Network Service Providers
Our relationships with multiple global network service providers form the basis of our Network Services offerings. These offerings span a breadth of access technologies including dial-up, Wi-Fi, Ethernet, 3G (both GSM and CDMA versions) and geographies. We typically contract with network service providers, integrate their networks into our global infrastructure, and monitor their performance to ensure that our customers have a consistent end user experience.
We have commercial relationships with over 300 telecommunications carriers, Internet service providers and other network service providers that enable us to offer our network services in over 160 countries around the world. We pay network service providers for access to their network on a usage, session or subscription basis. Most of these contracts have a one or two year term, after which either party can terminate the contract with notice. The contracts we have entered into with providers are non-exclusive and may contain minimum commitments for the purchase of network access.
Sales and Marketing
We sell our services directly through our global sales force and indirectly through our channel and service provider partners. Our sales organization is organized into regional account teams, which include sales management, territory managers, sales engineers and customer success teams. We maintain sales offices or personnel in a number of cities in the United States as well as Australia, India, the United Kingdom, Hong Kong, Japan, Germany, France, Singapore, Sweden and The Netherlands. As of December 31, 2009, our sales organization was comprised of 32 individuals in North America, 8 individuals in Asia Pacific and 24 individuals in Europe.
Our channel partners include network service providers, telecommunications carriers, systems integrators and value added resellers. A channel partner typically signs a one to two-year agreement with us through which we appoint the partner as a nonexclusive reseller of our services. Channel partner responsibilities vary and may include actively marketing and selling iPass services, deploying and supporting customer accounts, and implementing and managing billing for their customers. Selling through channel partners allows us to offer our services without incurring the full cost of customer acquisition (sales and marketing) or customer post-sales support. Our channel partners typically sell complementary hardware, software, and services, and bundle our services with their core offerings. They may also have a base of existing customers to whom they can efficiently sell our portfolio of services. In many cases our salespeople do support the partner with closing new business, and once an enterprise has signed a contract for our services through a channel partner, our post-sales team may work with the channel partner to ensure successful implementation of our services. However, the enterprise remains the customer of the channel partner and has no direct financial relationship with us.
9
Table of Contents
We focus our marketing efforts on establishing a strong corporate reputation in the market, creating awareness and preference for our services and their benefits, educating potential customers, generating new sales opportunities, generating end-user awareness and demand within existing customer accounts and enabling our sales force and channel partners to effectively sell and provide our service offerings. We conduct a variety of marketing programs that may include advertising, promotions, public relations, analyst relations, telemarketing, direct marketing, web and e-mail marketing, collateral and sales tools creation, seminars, events and trade shows, training, co-operative channel marketing, internet marketing and promotions.
Competition
Our approach to addressing the mobility challenges and needs of the enterprise is to provide an integrated platform and suite of value added services that offer connectivity, reporting and analytics, policy management, and network services. While there are numerous point solution providers that offer varying individual or in some cases combinations of the various mobility services similar to the services we offer, we are not aware of any competitor that provides a platform or range of services in an integrated offering as we do. Further, we believe that the self-service nature of our platform that allows an enterprise to configure and manage their own custom mobility service is a unique and differentiating factor for us.
The enterprise mobility market is very fragmented with a variety of competitors, including; facilities-based carriers, cloud-based platform operators and mobility management solution providers. We compete based on a number of factors including; geographic network coverage, pricing, multiple network technology support, network reliability, quality of service, platform functionality and features, ease of implementation, ease of use and ease of management.
As we have expanded our mobility offerings beyond network services to include an integrated platform of enterprise mobility services delivered through our cloud-based platform, we may also encounter additional competitors in the marketplace, including mobility management solution providers which offer mobile device management, mobile security, and telecommunication expense management software and services, among other mobility offerings.
Insofar as network connectivity and core telecommunications services, we compete with the national telecommunications carriers who provide a suite of services to enterprise customers. To a lesser extent we compete with cloud-based platform operators who may also provide managed services such as VPNs and firewalls, and additional telecommunications services such as local exchange and long distance services, voicemail and DSL services. We do have channel partners that offer these types of services in conjunction with our service, but we do not offer these additional services directly.
Insofar as our managed network services, we compete with a variety of providers, including large connectivity providers who own their own networks and have a broad range of network solutions and smaller regional providers.
Research and Development
As we continue to enhance our underlying technology, we are continuing to innovate and incorporate new technologies and features into our services and network architecture. Our research and development efforts are focused on improving and enhancing our new platform and service offerings as well as developing new services. As of December 31, 2009, our research and development organization consisted of 166 employees. Our research and development expenses were $14.4 million, $16.4 million and $21.1 million in 2009, 2008 and 2007, respectively.
10
Table of Contents
Intellectual Property
We believe our technology and platform contains valuable intellectual property and we rely on a combination of trademark, copyright, trade secret laws, patents and disclosure restrictions to protect these intellectual property rights. We license third-party technologies that are incorporated into our services. We also enter into confidentiality and proprietary rights agreements with our employees, consultants and other third parties and control access to software, documentation and other proprietary information. We have a patent portfolio of twelve US patents, two Australian patents, one Israeli patent and three European patents (UK, Germany and France). Our patents expire between 2016 and 2025. In 2009 we were granted two new US patents. We currently have fourteen US patent applications pending, and seventeen international patent applications pending (in the same subject areas as the US patent applications). iPass and the iPass logo are registered trademarks. We have also applied for or registered company trademarks in the U.S. and numerous other countries.
Employees
As of December 31, 2009, we had 389 employees of which 243 were located in the North America, 41 in Europe and 105 in Asia Pacific. Our success is highly dependent on our ability to attract and retain qualified employees.
Available Information
Our Internet address is www.ipass.com. We make available free of charge through our Internet website our annual report on Form 10-K, quarterly reports on Form 10-Q, current reports on Form 8-K, and amendments to those reports filed or furnished pursuant to Section 13(a) or 15(d) of the Securities and Exchange Act, as amended, as soon as reasonably practicable after we electronically file such material with, or furnish it to, the SEC.
Further, a copy of this annual report is located at the SEC’s Public Reference Room at 450 Fifth Street, NW, Washington, D.C. 20549. Information on the operation of the Public Reference Room can be obtained by calling the SEC at 1-800-SEC-0330. The SEC maintains an Internet site that contains reports, proxy and information statements, and other information regarding our filings at www.sec.gov.
11
Table of Contents
| Item 1A. | Risk Factors |
Our business is subject to a number of risks, many of which are described below. If any of the events described in these risks factors actually occur, our business, financial condition or results of operations could be materially and adversely affected, which would likely have a corresponding impact on the value of our common stock. Further, the risk factors described below could cause actual results to differ materially from the results contemplated by the forward-looking statements contained in this report. These risk factors should be reviewed carefully.
Global economic conditions may adversely affect our customers which directly impacts our business and results of operations.
Our operations and performance depend on our customers having adequate resources to purchase our services. Poor global economic conditions continue to adversely impact our customers and potential customers. These economic conditions may remain volatile and uncertain for the foreseeable future. Customers have altered and may continue to alter their purchasing and payment activities in response to deterioration in their businesses, lack of credit, economic uncertainty and concern about the stability of markets in general, and these customers may reduce, delay or terminate purchases of, and payment for, our services. Certain of our current and prospective customers may merge with others, or may be forced to cut expenditures, which may result in less demand for our services. In addition, poor economic conditions result in decreased business travel by our customers which results in decreased demand for our services. If we are unable to protect against these events or adequately respond to changes in demand resulting from deteriorating market and economic conditions, our financial condition and operating results may be materially and adversely affected.
We have recently released a new cloud-based platform for the delivery of our enterprise mobility services and if this new platform does not achieve market acceptance our ability to grow our business could be harmed.
We have recently released a new cloud-based platform for the delivery of our enterprise mobility services. The future success of our business will depend in large part on our current and prospective customers’ acceptance of our new cloud-based platform and enterprise mobility services. Key risks associated with our new platform and services are as follows:
Our new platform may not have all functionality desired by our customers. Early versions of the platform will not have all the functionality contained in our old platform. This may cause customers to delay their decision to purchase and/or adopt the new platform. There is risk that we may not timely release versions of the new platform that contain features that our customers desire. Further, the new platform may contain bugs or errors that would cause our customers to not adopt or delay the adoption of the new platform. If some or all of these risks associated with our new platform were to occur, market acceptance of the platform may not occur and our business could be harmed.
Customer deployment of our new platform may not result in increased use of our services. We believe it is important to the future success of our business that our customers’ employees increase their usage of our services. We believe that the deployment by our customers of our new platform will lead to increased usage of our services and an increase in our revenue. However, even if a significant portion of our customers deploy our new platform, we will need to provide our customers with stable, easy to use, feature-rich and valuable enterprise mobility services related to security, policy control and reporting. If we do not provide these valuable enterprise mobility services to our customers, use of our services may not increase.
Customers must be willing to pay for our new platform in order for us to generate meaningful revenues and growth. We believe that it is important that the value proposition of our new Open Mobile Platform is accepted by enterprise customers such that they are willing to pay for their employees to use our enterprise mobility services. If enterprises are willing to adopt our Open Mobile Platform but are not willing to pay for incremental users and/or additional usage in their organizations, this could adversely impact our ability to grow revenues and profitability.
12
Table of Contents
Events or conditions that result in a decrease in business travel could adversely affect our business.
If events or conditions occur that cause users of our services to decrease the amount that they travel, this could result in a substantial decrease in the demand for our services. Certain global or regional events such as poor economic conditions, outbreaks or fear of pandemics or terrorist events could severely restrict business-related travel and the use of our services. If such conditions were to worsen, business travel could further decline. In addition, if conditions improve, business travel may not return to previous levels.
Our revenue and profitability may be adversely impacted by our customers and partners willingness to agree to minimum purchase and resale commitments, or by any material reductions in their existing minimum commitments.
Our customers and partners that are billed on a usage basis have traditionally entered into contractual provisions that require them to pay the greater of the fees generated from the use of our services or a minimum committed amount over a pre-determined time period. Poor global economic conditions have in certain cases caused our customers and partners to generate fees from the use of our services that are significantly less than their minimum committed amounts. Consequently this shortfall has caused some partners and customers upon renewal of their contracts with us, to renew with a lower minimum commitment and in some cases with no minimum commitment. Additionally, in some cases partners and customers are requesting a re-evaluation of their minimum commitments on a prospective basis during the term of their existing contract; in order to maintain these commercial relationships, we have addressed these requests on a contract by contract basis. The reduction or elimination of minimum commitments means that a larger percentage of future revenue will be based on the actual usage of our services, making our ability to forecast revenue in a given period more difficult to predict and may decrease our revenues. Further, if usage levels in the future are lower for these customers that obtain lower commitments, we would experience lower minimum commitment revenue.
If we do not deliver valuable services for smart-phones and other mobile handheld devices our ability to profitably grow our business may be impaired.
A variety of smart-phone devices are available in the marketplace enabling individuals to, among other things, check email, access business applications and access the Internet. These devices are becoming more relied upon by our customers’ employees. If the capabilities of smart-phones or other mobile handheld devices cause our users to stop using laptops while traveling, or to use them less often, then our operating results may be harmed. Further, if we do not develop valuable services for smart-phones and handheld devices in a timely fashion, these devices may access the Internet and/or be managed without our services, impairing our ability to grow our business.
If demand for enterprise mobility services does not grow or grows in ways that do not require use of our services, we may experience a shortfall in revenues or earnings.
The growth of our business is dependent, in part, upon the increased use of enterprise mobility services and our ability to capture a higher proportion of this market. If the demand for enterprise mobility services does not continue to grow, or grows in ways that do not require use of our services, then we may not be able to grow our business, or achieve or maintain profitability. Increased usage of our enterprise mobility services depends on numerous factors, including:
| • | Willingness of enterprises to make additional information technology expenditures; |
| • | Availability of security services necessary to ensure data privacy over a variety of networks; |
| • | Quality, cost and functionality of our services and competing services; |
| • | Increased adoption of wireless broadband access methods and our ability to support these new methods; |
13
Table of Contents
| • | Proliferation of mobile handheld devices and smart-phones and related applications; and |
| • | Our ability to provide valuable services and support for those devices. |
We face strong competition in the market for enterprise mobility services, which could make it difficult for us to succeed.
While we do not believe there are service providers in the enterprise mobility services market that offer a platform or range of services in an integrated offering as we do, we compete with a variety of service providers, including facilities-based carriers, cloud-based platform operators and mobility management solution providers. Some of these providers have substantially greater resources, larger customer bases, longer operating histories and/or greater name recognition than we have. In addition, we face the following challenges:
Many of our competitors can compete on price. Because many of our facilities-based competitors own and operate physical networks they may be able to provide additional hotspot access or telephone connections at little incremental cost to them. As a result, they may offer network access services at a lower cost, and may be willing to discount or subsidize network access services to capture other sources of revenue. In contrast, we have traditionally purchased network access from facilities-based network service providers to enable our network access service and in these cases, may not be able to compete aggressively on price. In addition, new cloud-based platform operators may enter enterprise mobility services market and compete on price. In either case, we may lose business or be forced to lower our prices to compete, which could reduce our revenues.
Many of our competitors offer additional services that we do not, which enables them to bundle these services and compete favorably against us. Some of our competitors provide services that we do not, such as: local exchange and long distance services, voicemail and digital subscriber line, or DSL, services. Potential customers that desire these services on a bundled basis may choose to subscribe to network access from a competitor that provides these additional services.
Our potential customers may have unrelated business relationships with our competitors and consider those relationships when deciding between our services and those of our competitors. Many of our competitors are large facilities-based carriers that purchase substantial amounts of services or provide other services or goods unrelated to network access services. As a result, if a potential customer is also a supplier to one of our large competitors, or purchases unrelated services or goods from our competitor, the potential customer may be motivated to purchase its network access services from our competitor in order to maintain or enhance its business relationship with that competitor. In addition, our current or potential carrier customers may already have or may consider buying services from mobility management solution providers which may impact our ability to sell our services to those customers as well as drive market prices down for the services that we offer.
Users may take advantage of free Wi-Fi networks for Internet and corporate access. Some venues such as cafes and hotels offer free Wi-Fi internet access as an incentive or value added benefit to their customers. Use at these venues may replace our “for charge” sessions and put downward pressure on prices we charge their enterprises for Wi-Fi Internet access services. In addition, telecommunications providers may also offer free Wi-Fi as part of a home broadband or other service contract, which also may force down the prices which the market will bear for our services.
We face strong competition in the market for managed network services, which could make it difficult for us to grow.
In the market for managed network services, we compete with a variety of large connectivity service providers, many of whom own their own networks. We see the competition from these larger service providers, which own their own networks, in two primary ways: first in that they can provide a broader range of network options (MPLS, Frame Relay, Wire line and Wireless Voice, etc.) and, second, they can integrate their separate products providing cross-product subsidization. There are also small regional players with a similar model to ours who compete with us. If we are not able to offer competitively priced offerings that are profitable for us, we may have difficulty growing our MNS business.
14
Table of Contents
If we are unable to meet the challenges posed by broadband access, our ability to profitably grow our business may be impaired.
A substantial portion of the growth of our business has depended, and will continue to depend, in part upon our ability to expand the broadband elements of our cloud-based platform to address broadband access technologies, such as cable modem, DSL, Wi-Fi, 3G data, Wi-Max and other wireless technologies. Such an expansion may not result in additional revenues to us. Key challenges in expanding the broadband elements of our cloud-based platform include:
The broadband access market continues to develop at a rapid pace. We derive revenues from wireless broadband “hotspots,” such as certain airports, hotels and convention centers. The broadband access market, particularly for wireless access, continues to develop rapidly, in particular: the market for enterprise connectivity services through broadband is characterized by evolving industry standards and specifications and there is currently no uniform standard for wireless access. Furthermore, although the use of wireless frequencies generally does not require a license in the United States and abroad, if Wi-Fi frequencies become subject to licensing requirements, or are otherwise restricted, this would substantially impair the growth of wireless access. Some large telecommunications providers and other stakeholders that pay large sums of money to license other portions of the wireless spectrum may seek to have the Wi-Fi spectrum become subject to licensing restrictions. If the broadband wireless access market develops in ways that limit access growth, our ability to generate substantial revenues from broadband wireless access could be harmed.
The broadband service provider market is highly fragmented. There are currently many wired and wireless broadband service providers that provide coverage in only one or a small number of hotspots. We have entered into contractual relationships with numerous broadband service providers. These contracts generally have an initial term of two years or less. We must continue to develop relationships with many providers on terms commercially acceptable to us in order to provide adequate coverage for our customers’ mobile workers and to expand our broadband coverage. We may also be required to develop additional technologies in order to integrate new broadband services into our service offering. If we are unable to develop these relationships or technologies, our ability to grow our business could be impaired. In addition, if broadband service providers consolidate, our negotiating leverage with providers may decrease, resulting in increased rates for access, which could harm our operating results.
Broadband service provider actions may restrict our ability to sell our services. Some network providers restrict our ability to sell access to their networks to our resellers whom they consider competitive with them. This can reduce our revenue by limiting the footprint our partners can make available to their customers. In addition, in some geographies the conventional practice is for a mobile data (3G) carrier to provide a device on a subsidized basis. This device cannot easily be used with any network besides that of the carrier who provides it, which makes it difficult for us to replace that carrier in the account and thus may negatively impact our ability to sign new enterprise customers to our 3G service which could harm our ability to grow our business.
Consolidation in the telecommunications industry may impair our ability to provide reliable, redundant and expanded service coverage and negotiate favorable network access terms.
The telecommunications industry is rapidly evolving and highly competitive. These factors combined with recent poor economic conditions, resulted in certain network service providers having poor operating results. As a result, some of these service providers have consolidated and are working to consolidate or otherwise cease operations, which would reduce the number of network service providers from which we are able to obtain network access. If consolidation continues to occur, we will have a smaller number of network service providers to acquire network access from and we may not be able to provide additional or sufficient redundant access points in some geographic areas, which could diminish our ability to provide broad, reliable, redundant coverage. Further, our ability to negotiate favorable access rates from network service providers could be impaired, which could increase our network access expenses and harm our operating results.
15
Table of Contents
If we fail to address market requirements, evolving standards and technological changes in the enterprise mobility services industry, our business could be harmed.
The market for enterprise mobility services and mobile devices (laptops, handhelds devices, and smart-phones) is characterized by evolving industry standards and specifications and rapid technological change; including; new access methods, devices, applications and operating systems. In developing and introducing our services, we have made, and will continue to make, assumptions with respect to which features, security standards, performance criteria, access methods, devices, applications and operating systems will be required or desired by enterprises and their mobile workers. If we implement technological changes or specifications that are different from those required or desired, or if we are unable to successfully integrate required or desired technological changes or specifications into our services, market acceptance of our services may be significantly reduced or delayed and our business could be harmed.
If our channel partners do not successfully market our services to their customers, then our revenues and business may be adversely affected.
We sell our services directly through our sales force and indirectly through our channel partners, which include network service providers, systems integrators and value-added resellers. A large percentage of our sales outside the United States are made through our channel partners. Our business depends on the efforts and the success of these channel partners in marketing our services to their customers. Our own ability to promote our services directly to their customers is often limited. Many of our channel partners may offer services to their customers that may be similar to, or competitive with, our services. Therefore, these channel partners may not actively promote our services. If our channel partners fail to market our services effectively, our ability to grow our revenue could be reduced and our business may be impaired.
Because a meaningful portion of our business is international, we encounter additional risks, which may impact our revenues and profitability.
We generate a substantial portion of our revenues from international customers. Revenues from customers domiciled outside of the United States were approximately 39% of our revenues in 2009, of which approximately 30% and 6% were generated in our EMEA (Europe, Middle East and Africa) and Asia Pacific regions, respectively. We currently bill the majority of our services in U.S. dollars and pay expenses in local currencies. Our international operations subject our business to specific risks, including:
| • | Longer payment cycles for foreign customers; |
| • | The impact of changes in foreign currency exchange rates on the attractiveness of our pricing and our operating results; |
| • | High taxes in some foreign jurisdictions; |
| • | Difficulty in complying with Internet-related regulations in foreign jurisdictions; and |
| • | Difficulty enforcing intellectual property rights and weaker laws protecting these rights. |
Any of these factors could negatively impact our business.
Changes in foreign currency exchange rates could negatively affect our operating results.
The functional currency of our foreign subsidiaries is the U.S. dollar. Fluctuations in foreign currency exchange rates impact the re-measurement of assets, liabilities, revenues and expenses and generate exchange gains and losses. In addition, certain of our network access costs are invoiced in currencies other than U.S. dollars. The transactional settlement of these outstanding liabilities generates exchange gains and losses depending on the fluctuation of exchange rates between the U.S. dollar and the various foreign currencies in which we do business between the date of invoicing and the date of payment. Accordingly, changes in
16
Table of Contents
foreign currency exchange rates relative to the U.S. Dollar could negatively affect our operating results. Prior to 2009, we periodically entered into forward contracts to partially manage foreign currency exposure. During 2009, we did not enter into any forward contracts to manage foreign currency exposure.
If we do not accurately predict usage for our Enterprise Flat Rate price plan, our costs could increase without a corresponding increase in revenue.
A number of our customers have transitioned to our Enterprise Flat Rate price plan, and we are signing new customers to this plan. In this plan, our customers pay a flat rate price to access our network services. However, in the majority of situations we continue to pay our providers based on usage. The rate we charge in our Enterprise Flat Rate price plan is based on statistical predictions of usage across a pool of users within an enterprise. If actual usage is higher than expected our profitability could be negatively impacted.
Our software is complex and may contain errors that could damage our reputation and decrease usage of our services.
Our software may contain errors that interrupt network access or have other unintended consequences. If network access is disrupted due to a software error, or if any other unintended negative results occur, such as the loss of billing information, a security breach, unauthorized access to our cloud-based platform or the introduction of a virus by our software onto our customers’ computers or networks, our reputation could be harmed and our business may suffer. Our contracts generally limit our exposure to incidental and consequential damages and to the extent possible; we further limit our exposure by entering into insurance policies that are designed to protect our customers and us from these and other types of losses. If these contract provisions are not enforced or enforceable, or if liabilities arise that are not, effectively, limited, our operating results and financial condition could be harmed.
Our sales cycles are lengthy and could require us to incur substantial costs that may not result in related revenues.
Our business is characterized by a lengthy sales cycle. In addition, once a contract with a customer is signed there is typically an extended period before the customer’s end users actually begin to use our services, which is when we begin to realize revenues. Furthermore, the release of our new platform and services may further extend the sales cycle. As a result, we may invest a significant amount of time and effort in attempting to secure a customer which may not result in any revenues. Even if we enter into a contract, we may have incurred substantial sales-related expenses well before we recognize any related revenues. If the expenses associated with sales efforts increase and, we are not successful in our sales efforts, or we are unable to generate associated offsetting revenues in a timely manner; our operating results could be harmed.
Significant dependency with a single network provider could negatively affect our revenues.
There are certain venues (hotels, airports, cafes, etc.) globally where we depend on a single provider for network access in those venues. If such a provider were to go out of business or terminate their agreement with iPass, it could have a negative impact on our revenues and profitability if we cannot find an alternative provider to provide network access in those venues.
Security concerns related to Internet-based services could reduce demand for our services.
The secure transmission of confidential information when using Internet-based services is extremely important to our customers. Security and authentication concerns with respect to the transmission over the Internet of confidential information, such as corporate access passwords and the ability of hackers to penetrate online security systems may reduce the demand for our services. Further, new access methods, devices, applications and operating systems have also introduced additional vulnerabilities which have been actively
17
Table of Contents
exploited by hackers. Internet-based worms and viruses, computer programs that are created to slow Internet traffic or disrupt computer networks or files by replicating through software or operating systems, are examples of events or computer programs that can disrupt users from using our services and reduce demand for our services, potentially affecting our business and financial performance. Furthermore, any well-publicized compromises of confidential information may reduce demand for Internet-based services, including our services.
If our security measures are breached and unauthorized access is obtained to a customer’s internal network, our cloud-based platform may be perceived as not being secure and enterprises may curtail or stop using our services.
It is imperative for our customers that access to their mission critical data is secure. A key component of our ability to attract and retain customers is the security measures that we have engineered into our network for the authentication of the end user’s credentials. These measures are designed to protect against unauthorized access to our customers’ networks. Because techniques used to obtain unauthorized access or to sabotage networks change frequently and generally are not recognized until launched against a target, we may be unable to anticipate these techniques or to implement adequate preventative measures against unauthorized access or sabotage. If an actual or perceived breach of network security occurs, regardless of whether the breach is attributable to our services, the market perception of the effectiveness of our security measures could be harmed.
If licenses to third party technologies do not continue to be available to us at a reasonable cost, or at all, our business and operations may be adversely affected.
We license technologies from several software providers that are incorporated into our services. We anticipate that we will continue to license technology from third parties in the future. Licenses to third party technologies may not continue to be available to us at a reasonable cost, or at all. The loss of the right to use these technologies or other technologies that we license could have an adverse effect on our services and increase our costs or cause interruptions or delays in our services until substitute technologies, if available, are developed or identified, licensed and successfully integrated into our services.
Litigation arising out of intellectual property infringement could be expensive and disrupt our business.
We cannot be certain that our services do not, or will not, infringe upon patents, trademarks, copyrights or other intellectual property rights held by third parties, or that other parties will not assert infringement claims against us. From time to time we have been, and we may continue to be, involved in disputes with these third parties. Any claim of infringement of proprietary rights of others, even if ultimately decided in our favor, could result in substantial costs and diversion of our resources. Successful claims against us may result in an injunction or substantial monetary liability, which in either case could significantly impact our results of operations or materially disrupt the conduct of our business. If we are enjoined from using a technology, we will need to obtain a license to use the technology, but licenses to third-party technology may not be available to us at a reasonable cost, or at all.
We may be exposed to credit risk, collection risk and payment delinquencies on our accounts receivable.
A substantial majority of our outstanding accounts receivables are not secured. Our standard terms and conditions permit payment within a specified number of days following the receipt of our services. While we have procedures to monitor and limit exposure to credit risk on our receivables, there can be no assurance such procedures will effectively limit our collection risk and avoid losses. In addition, under poor economic conditions, certain of our customers have faced and may face liquidity concerns and have delayed and may delay or may be unable to satisfy their payment obligations, which may have a material adverse effect on our financial condition and operating results.
18
Table of Contents
Government regulation of, and legal uncertainties regarding, the Internet could harm our business.
Internet-based communication services generally are not subject to federal fees or taxes imposed to support programs such as universal telephone service. Changes in the rules or regulations of the U.S. Federal Communications Commission or in applicable federal communications laws relating to the imposition of these fees or taxes could result in significant new operating expenses for us, and could negatively impact our business. Any new law or regulation, U.S. or foreign, pertaining to Internet-based communications services, such as the recently enacted European Union legislation requiring network operators to notify customers of roaming rates prior to incurring roaming charges, or changes to the application or interpretation of existing laws, could decrease the demand for our services, increase our cost of doing business or otherwise harm our business. There are an increasing number of laws and regulations pertaining to the Internet. These laws or regulations may relate to taxation and the quality of services. Furthermore, the applicability to the Internet of existing laws governing intellectual property ownership and infringement, taxation, encryption, obscenity, libel, employment, personal privacy, export or import matters and other issues is uncertain and developing and we are not certain how the possible application of these laws may affect us. Some of these laws may not contemplate or address the unique issues of the Internet and related technologies. Changes in laws intended to address these issues could create uncertainty in the Internet market, which could reduce demand for our services, increase our operating expenses or increase our litigation costs.
Our reduced cash balances may impede our ability to make acquisitions or aggressively fund growth initiatives.
In 2009, we paid approximately $30.0 million in extraordinary cash dividends to our stockholders. We intend to return an additional $10.0 million in capital to our stockholders through a stock repurchase program that began in the fourth quarter of 2009 and extends through March 2011, of which approximately $0.8 million has been purchased through December 31, 2009. In the event that the full $10.0 million stock repurchase program is not used to repurchase the Company’s stock by March 31, 2011, we are obligated to dividend to stockholders the remaining balance by April 15, 2011. At December 31, 2009, we had $41.8 million of cash and cash equivalents and short term investments. Although we believe that we have sufficient cash to operate our business, we have significantly less cash with which to acquire additional technologies or other businesses if the opportunities arise. Further, if our cash flows were to decrease significantly, we will have less cash to support operations through any period of significant negative cash flow, which could cause us to have to decrease our expenditures on research and development and in other areas, which could negatively affect our business.
Due to uncertainty in the application and interpretation of applicable state sales tax laws, we may be exposed to additional sales tax liability.
During 2009, we recorded a liability of approximately $5.0 million reflecting our best estimate of our potential sales tax liability and associated interest and penalties thereon. The application and interpretation of various state sales tax laws to certain of our services is uncertain. Accordingly, we may be exposed to additional sales tax liability to the extent various state jurisdictions determine that certain of our services are subject to their state’s sales tax. While we believe all of our estimates and assumptions are reasonable and will be sustained upon audit, the actual liabilities may be more than such estimates, and if so, such liability may negatively impact our financial condition.
| Item 1B. | Unresolved Staff Comments |
Not applicable
| Item 2. | Properties |
We lease approximately 48,000 square feet of space in our headquarters in Redwood Shores, California under a lease that expires in 2015. We also lease sales and support offices in other parts of the Unites States and
19
Table of Contents
abroad. We believe that our principal facility in Redwood Shores, and sales and support offices in other parts of the Unites States and abroad will be adequate for our needs for at least the next several years, and we expect that additional facilities will be available in other jurisdictions to the extent we need to add new offices.
| Item 3. | Legal Proceedings |
Not applicable.
| Item 4. | (Removed and Reserved) |
Not applicable.
20
Table of Contents
| Item 5. | Market For Registrant’s Common Equity, Related Stockholder Matters and Issuer Purchases of Equity Securities |
Price Range of Common Stock
Our common stock is traded on the NASDAQ Global Select Market under the symbol “IPAS”. The following table sets forth the intra-day high and low sale price of our common stock, in each quarterly period presented within the two most recent years, as reported on the NASDAQ Global Select Market:
| Price range | ||||||
| High | Low | |||||
| Year ended December 31, 2009: |
||||||
| First Quarter |
$ | 1.39 | $ | 0.89 | ||
| Second Quarter |
1.87 | 0.95 | ||||
| Third Quarter |
2.35 | 1.26 | ||||
| Fourth Quarter |
1.42 | 0.92 | ||||
| Year ended December 31, 2008: |
||||||
| First Quarter |
$ | 4.10 | $ | 2.43 | ||
| Second Quarter |
3.14 | 1.95 | ||||
| Third Quarter |
2.50 | 1.57 | ||||
| Fourth Quarter |
2.19 | 1.01 | ||||
We had 60,590,642 shares of our common stock outstanding held as of February 26, 2010, held by 185 holders of record of our common stock. We believe there are approximately 3,500 beneficial owners of our common stock.
21
Table of Contents
Performance Measurement Comparison(1)
The performance graph below shows the five-year cumulative total stockholder return on the iPass common stock during the period from December 31, 2004 through December 31, 2009. This is compared with the cumulative total return of the NASDAQ Market Index and the Russell 2000 Index over the same period. The comparison assumes $100 was invested on December 31, 2004 in the Company’s common stock and in each of the foregoing indices and assumes reinvestment of the full amount of all dividends; dollar amounts in the graph are rounded to the nearest whole dollar. The performance shown in the graph represents past performance and should not be considered an indication of future performance.
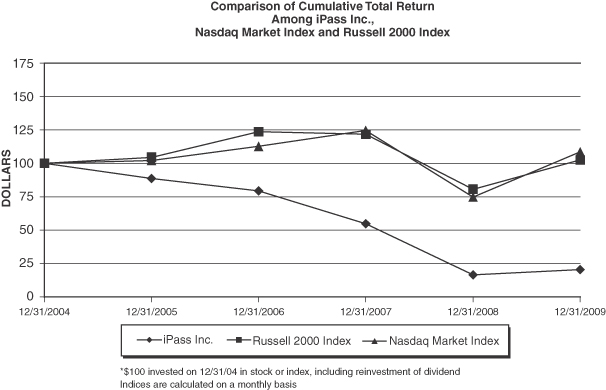
| 12/31/04 | 12/31/05 | 12/31/06 | 12/31/07 | 12/31/08 | 12/31/09 | |||||||
| iPass Inc. |
100.00 | 88.65 | 79.46 | 54.86 | 16.49 | 20.54 | ||||||
| Russell 2000 Index |
100.00 | 104.55 | 123.76 | 121.82 | 80.66 | 102.58 | ||||||
| Nasdaq Market Index |
100.00 | 102.20 | 112.68 | 124.57 | 74.71 | 108.56 |
We do not believe that there is any published industry or line of business indices that are directly relevant to our line of business. In addition, we do not believe that we can construct a peer group index as many of the services similar to ours comprise a small portion of the business of the companies providing the services. Consequently, in addition to the NASDAQ Market Index, we are comparing our stock price performance to the Russell 2000 Index as it is an index of businesses with an average market capitalization similar to ours, and we are included in this index.
(1) This Section is not “soliciting material,” is not deemed “filed” with the SEC and is not to be incorporated by reference in any filing of iPass under the 1933 Act or the 1934 Act whether made before or after the date hereof and irrespective of any general incorporation language in any such filing.
22
Table of Contents
Stock Repurchases
The following table presents the stock repurchase activity during the three months ended December 31, 2009 (in thousands except for shares and price per share):
| Total Number of Shares Purchased |
Average Price Paid per Share |
Total Number of Shares Purchased as Part of Publicly Announced Program |
Approximate Dollar Value of Shares that May Be Purchased under the Program (in thousands) | |||||||
| October 1, 2009 to October 31, 2009 |
0 | $ | 0 | 0 | $ | 0 | ||||
| November 1, 2009 to November 30, 2009 |
191,439 | 1.21 | 191,439 | 9,768 | ||||||
| December 1, 2009 to December 31, 2009 |
558,561 | $ | 1.06 | 558,561 | $ | 9,179 | ||||
| Total |
750,000 | 750,000 | ||||||||
On November 3, 2009, our Board of Directors approved a stock repurchase program (the “2009 Repurchase Program”) which authorizes us to repurchase up to $10.0 million of outstanding common stock from time to time on the open market or through negotiated transactions. Through December 31, 2009, we repurchased a total of 750,000 shares of iPass common stock at an average price of $1.09 per share for an aggregate purchase price of approximately $0.8 million. In the event that this $10.0 million stock repurchase program is not completed by March 31, 2011, we are obligated to dividend to stockholders any remaining balance by April 15, 2011.
Return of Capital and Dividend Policy
In 2009 the Company returned approximately $30.0 million to stockholders in the form of two extraordinary cash dividends. The first dividend of approximately $20.0 million or $0.32 per share was paid on September 17, 2009 to stockholders of record as of August 31, 2009. The second dividend of approximately $10.0 million or $0.16 per share was paid on December 18, 2009 to stockholders of record as of December 4, 2009. Prior to 2009, the Company did not pay any cash dividends on its common stock.
We currently do not anticipate that we will pay cash dividends in the future, although the declaration of any future cash dividend is at the discretion of the Board of Directors and will depend on our financial condition, results of operations, capital requirements, business conditions and other factors, as well as a determination that cash dividends are in the best interest of our stockholders; provided however, that in the event that $10.0 million of our common stock is not repurchased under the 2009 Repurchase Program by March 31, 2011, we are obligated to dividend to stockholders any remaining balance by April 15, 2011.
23
Table of Contents
| Item 6. | Selected Financial Data |
The following selected financial information has been derived from our historical audited consolidated financial statements and should be read in conjunction with the consolidated financial statements and the accompanying notes for the corresponding years. The historical results are not necessarily indicative of results expected in any future period.
| Year Ended December 31, | |||||||||||||||||||
| 2009 | 2008 | 2007 | 2006 | 2005 | |||||||||||||||
| (In thousands, except per share data) | |||||||||||||||||||
| Statement of Operations Data |
|||||||||||||||||||
| Revenues |
$ | 171,377 | $ | 191,368 | $ | 191,732 | $ | 182,711 | $ | 169,373 | |||||||||
| Total operating expenses |
185,575 | 284,767 | 206,077 | 202,001 | 151,474 | ||||||||||||||
| Operating income (loss) |
(14,198 | ) | (93,399 | ) | (14,345 | ) | (19,290 | ) | 17,899 | ||||||||||
| Net income (loss) |
(13,492 | ) | (91,968 | ) | (34,214 | ) | (8,089 | ) | 12,895 | ||||||||||
| Net income (loss) per share: |
|||||||||||||||||||
| Basic |
(0.22 | ) | (1.50 | ) | (0.54 | ) | (0.13 | ) | 0.20 | ||||||||||
| Diluted |
(0.22 | ) | (1.50 | ) | (0.54 | ) | (0.13 | ) | 0.19 | ||||||||||
| Cash dividends declared per common share |
0.48 | — | — | — | — | ||||||||||||||
| Total assets |
$ | 89,563 | $ | 125,328 | $ | 221,989 | $ | 263,602 | $ | 254,474 | |||||||||
| Total stockholders’ equity |
47,986 | 89,797 | 181,108 | 221,389 | 226,251 | ||||||||||||||
See “Restructuring the Business”, “Restructuring and Other Charges” and “Impairment of Goodwill and Long-Lived Assets” in “Management’s Discussion and Analysis of Financial Condition and Results of Operations” Item 7.
| Item 7. | Management’s Discussion and Analysis of Financial Condition and Results of Operations |
Company Overview
We offer a portfolio of enterprise mobility services that help enterprises manage the networks, connections and devices used by their mobile workforce. Our services are designed to help customers manage their mobility costs and provide improved visibility and control while making it easy for their end-users to connect to networks. Historically our enterprise mobility services have been driven by network access services, which have been the primary source of revenue for the Company to-date.
During 2009, we focused on re-engineering our business as we built our new Open Mobile Platform to better address the opportunity in the mobility market, namely our customer’s desire to reduce complexity in managing their mobile workforces, manage mobility costs, ensure security and control over their mobile connections, support a wide range of mobile networks and devices, and meet their workers’ increasing demand for global Wi-Fi.
In January 2010, we launched a new portfolio of services based on our Open Mobile Platform that we believe will add substantial value and capabilities to our existing offerings. This new platform is designed to deliver simple and smart mobility solutions and transparently facilitate every connection, regardless of the underlying network or device. Our services provide the enterprise with carrier independence and reduced lock-in costs, and give the enterprise a new level of insight and policy management and control to drive down costs and maintain security.
We also offer managed network services for enterprise remote and branch office connectivity in North America. In this area, our site-to-site managed network services combine service functions that include end-to-end Managed IP VPN, Visa-accredited PCI security solutions for retail, and home gateway management for teleworkers. Complete with a tailored design and end-to-end agreements to meet enterprise performance requirements, iPass services are used by leaders in a range of industries including retail, pharmaceutical, financial services and health care.
24
Table of Contents
We sell our services directly, as well as indirectly through our channel partners, to enterprises located throughout the world; including 391 of the Forbes 2000 companies as of December 31, 2009.
Key Corporate Objectives
Our corporate objectives include developing the Open Mobile Platform, migrating existing customers and enrolling new customers on our new platform, increasing the number of users of our services, driving returns to scale and running our business efficiently. For a detailed discussion regarding certain of our corporate objectives, see section entitled “Our Strategy” under “Item 1A. Business”.
Significant Trends and Events
The following describes significant trends and events that impacted our financial condition, results of operations, and the direction of our business in 2009.
Poor Economic Conditions
2009 was a challenging year from a global economic perspective. Poor economic conditions negatively impacted our business in the following ways:
| • | Impacted the dollar value of new business transactions as well as renewal transactions with existing customers, resulting in monthly order values being lower than anticipated; |
| • | Reduced the usage of our services as a result of reductions in personnel at our customers; |
| • | Reduced business travel which resulted in lower usage of our services; and |
Development of a New Cloud-based Platform
In 2009, the bulk of our development efforts were centered on the development of our new cloud-based platform known as our Open Mobile Platform. We believe this new platform will allow us to provide a compelling and value-focused set of integrated mobility offerings. We believe that this new platform and functionality is central to evolving our business model from a network access centric model to a business that sells enterprise mobility services via a cloud-based platform. We released the first version of the Open Mobile Platform in January 2010.
Restructuring the Business
During 2009, we implemented two restructuring plans to improve operational efficiencies and align our cost and operating structure to support the evolution of our business. As a result of the restructuring plans, we reduced our personnel by 146 employees worldwide and we recorded, in the aggregate, approximately $7.9 million in restructuring charges.
Continued Decline in Dial-up Revenue
As anticipated, we saw a significant decline of nearly $20.0 million in our dial-up revenue in 2009. This trend was primarily due to our customer’s continued migration from dial-up connections to faster broadband connections. We expect the trend of declining dial-up revenue to continue during 2010.
Return of Capital to Stockholders
In 2009, we returned approximately $30.0 million in capital to our stockholders in the form of two extraordinary cash dividends. We intend to return an additional $10.0 million in capital to our stockholders
25
Table of Contents
through a stock repurchase program that began in the fourth quarter of 2009 and extends through March 2011, of which approximately 750,000 shares of our common stock for $0.8 million has been purchased through December 31, 2009. In the event that the full amount is not used to repurchase our common stock by March 31, 2011, we are obligated to dividend to stockholders the remaining balance by April 15, 2011.
Decline in Minimum Commitment Revenue
Some of our enterprise customers have signed contracts with us that commit them to minimum revenue commitments. Some of these contracts may be several years old and some customers may be paying iPass shortfall payments as a result of these minimum commitment terms. Because economic conditions and employment levels have changed in the interim this is not an economically sustainable situation for our customers and we have begun to experience the impact of a number of customers negotiating decreases in minimum commitments. While we do not know the full extent of any future potential declines in minimum commitment shortfall revenue, we anticipate that these reductions will continue for the foreseeable future.
Key Operating Metrics
Described below are key metrics that we use to evaluate our operating performance as well as our success in transforming our business and driving future growth.
Number of Monetized Users
Number of Monetized Users means the number of monthly users for which a fee was billed by iPass to a customer for such users. We have begun to use this metric as an indicator of the adoption and use of our services and our ability to convert customers into revenue opportunities. We intend to begin reporting the results of this metric with the release of our financial results in 2010.
Adjusted Earnings Before Interest, Taxes, Depreciation and Amortization (“Adjusted EBITDA”)
We defined Adjusted EBITDA as net loss plus interest expense net of interest income, income taxes, depreciation and amortization, stock-based compensation, impairment of goodwill on long-lived assets, certain revenue adjustments related to the correction of historical billing errors (discussed below in “Revenue” within our “Results of Operations”), certain sales tax items, and other one-time and/or non-cash items. The following table reconciles Adjusted EBITDA to the accompanying financial statements.
| Year Ended December 31, | ||||||||||||
| 2009 | 2008 | 2007 | ||||||||||
| Adjusted EBITDA |
$ | 7,406 | $ | 4,035 | $ | 3,034 | ||||||
| Less: |
||||||||||||
| Interest income |
(613 | ) | (2,003 | ) | (3,395 | ) | ||||||
| Provision for (benefit from) income taxes |
(674 | ) | (581 | ) | 23,151 | |||||||
| Depreciation of property and equipment |
4,425 | 5,540 | 5,206 | |||||||||
| Amortization of intangible assets |
1,380 | 3,901 | 4,201 | |||||||||
| Impairment of goodwill and long-lived assets |
— | 84,494 | — | |||||||||
| Stock-based compensation |
2,316 | 3,794 | 4,918 | |||||||||
| Restructuring charges |
8,147 | 858 | 3,167 | |||||||||
| Sales tax liability |
5,030 | — | — | |||||||||
| Revenue adjustments related to the correction of historical billing errors |
887 | — | — | |||||||||
| Net loss |
$ | (13,492 | ) | $ | (91,968 | ) | $ | (34,214 | ) | |||
26
Table of Contents
Adjusted EBITDA for the year ended December 31, 2009 was positively impacted by a smaller net loss position despite the restructuring charges, sales tax liability accrual, and billing error adjustments to revenue. Adjusted EBITDA for the year ended December 31, 2008 was impacted by a significant net loss offset by a large impairment of goodwill and long-lived assets charge and restructuring charge. In 2007 Adjusted EBITDA was benefited by a large provision for (benefit from) income taxes and restructuring charge.
We believe that Adjusted EBITDA is useful as a supplemental measure of the performance of the company’s operations because it helps investors evaluate and compare the results of operations from period to period by removing the accounting impact of the company’s financing strategies, tax provisions, and depreciation and amortization, restructuring charges, material non-recurring sales tax and related charges, stock based compensation expense and other infrequent operating items. We adjust for these excluded items because we believe that, in general, these items possess one or more of the following characteristics: their magnitude and timing is largely outside of the company’s control; they are unrelated to the ongoing operation of the business in the ordinary course; they are unusual or infrequent and the company does not expect them to occur in the ordinary course of business; or they are non-operational, or non-cash expenses involving stock option grants.
Adjusted EBITDA is not a measure determined in accordance with accounting principles generally accepted in the United States, or GAAP, and should not be considered a substitute for operating income, net income or any other measure determined in accordance with GAAP. Adjusted EBITDA should not be considered in isolation or as a substitute for measures of performance prepared in accordance with GAAP. Adjusted EBITDA is used by our management as a measure of operating efficiency and overall financial performance for benchmarking against our peers and competitors and in 2010 will be used as a metric to determine management bonuses. Management believes Adjusted EBITDA provides meaningful supplemental information regarding the underlying operating performance of our business. Management also believes that Adjusted EBITDA is useful to investors because it is frequently used by securities analysts, investors and other interested parties to evaluate the company.
Monthly Order Value (“MOV”)
MOV is the amount of new contractually committed monthly usage fees. We believe that MOV is a helpful metric in providing insight into how much incremental dollar value we contracted with customers in a period. Management uses MOV as an indicator of our success in signing new customers to contractual commitments and signing existing customers to higher contractual commitments. During the year ended December 31, 2009, the total MOV was $1.5 million compared to $2.5 million for 2008 and $3.0 million for 2007. The decrease from 2008 to 2009 and from 2007 to 2008 was primarily due to the global economic downturn.
Other User Metrics
We use additional metrics including the number of 3G subscriptions, broadband users (excluding 3G users) and dial-up users, in order to provide visibility into the types of users that are using our services. In addition, these operating metrics can be used to help assess how successful we are in driving increased penetration into our customer base and leading both the enterprise market and our customers to 3G technology.
During the year ended December 31, 2009, the total number of 3G subscription users was approximately 36,000 compared to approximately 27,000 in 2008; the number of Broadband users (excluding 3G users) in 2009 was approximately 286,000 compared to approximately 312,000 in 2008; and the number of dial-up users in 2009 was approximately 69,000 compared to approximately 156,000 in 2008. The increase in 3G subscription users and the decrease in dial-up users from 2008 to 2009 is the result of our customer’s continued migration away from dial-up to 3G. Broadband users (excluding 3G users) declined due to the global economic downturn which impacted our customers’ business in terms of corporate layoffs and reduced business travel resulting in decreased demand for our Wi-Fi services.
27
Table of Contents
Gross Margin
| Year Ended December 31, | |||||||||
| 2009 | 2008 | 2007 | |||||||
| Gross Margin (%) |
56.9 | % | 57.2 | % | 63.9 | % | |||
We use gross margin as a metric to assist us in assessing the profitability of our network services. Gross margin percentage is defined as total revenue less networks access costs divided by total revenue. Factors impacting gross margin in 2009 compared to 2008, and 2008 compared to 2007 are discussed in the sections entitled “Revenue” and “Network Access” below under “Results of Operations.”
Sources of Revenues
During 2009, we derived our revenues from broadband and dial-up enterprise mobility services, managed network services and other services and fees. We sell these services directly, as well as indirectly through our channel partners. We bill approximately half of our customers (determined using a percentage of revenue) based on a fixed charge per user per month and we bill the remaining customers primarily based on actual network usage. Many of our customers that are billed based on actual usage agree to a Minimum Monthly Commitment (“MMC”). Substantially all of our enterprise customers commit to a one to three-year contract term.
Critical Accounting Policies and Estimates
Our discussion and analysis of our financial condition and results of operations is based upon our consolidated financial statements which have been prepared in accordance with accounting principles generally accepted in the United States. The preparation of these consolidated financial statements requires us to make estimates and judgments that affect the reported amounts of assets, liabilities, revenues and expenses, and related disclosure of contingent assets and liabilities. We base our estimates and judgments on our historical experience, knowledge of current conditions and our belief of what could occur in the future considering available information, including assumptions that are believed to be reasonable under the circumstances. By their nature, these estimates and judgments are subject to an inherent degree of uncertainty and actual results could differ materially from the amounts reported based on these policies. On an ongoing basis, we evaluate our estimates, including those related to revenue recognition, income taxes, and allowance for doubtful accounts.
We believe our most significant estimates, judgments and assumptions used in the preparation of our consolidated financial statements are used in the following critical accounting policies.
Revenue Recognition
Our revenue recognition policy requires us to make certain estimates and judgments in the treatment of MMC fees and managed network services (“MNS”) contracts.
For customers that have agreed to a MMC fee in connection with either broadband or dial-up usage, such customer’s monthly invoice reflects the greater of the customer’s actual usage during the month or the customer’s MMC for that month. If the MMC exceeds actual usage (“Shortfall”), we determine whether the Shortfall is fixed or determinable in accordance with the revenue recognition criteria. If we conclude that the Shortfall is fixed or determinable, based upon customer specific collection history, and all other revenue recognition criteria have been met, we recognize as revenue the amount of the Shortfall which is invoiced. If the customer is in a Shortfall situation and it is determined that the Shortfall is not fixed or determinable, we recognize revenue only when the shortfall is collected.
Managed network services contracts are monthly flat fee contracts bundled with certain other upfront fees such as, one-time non-recurring fees, which include equipment fees, installation, management set up, and
28
Table of Contents
shipping fees. The monthly flat usage fee is recognized on a monthly basis, while other fees are recognized ratably over the estimated life of the end point. An end point represents a separate physical location, such as a branch office, retail office or virtual office. End point lives are estimated based on historical average end point life by product group. The Company periodically performs an analysis of estimated lives of the end points and revises the remaining term over which revenue will be recognized, if needed.
Allowance for Doubtful Accounts
We maintain an allowance for doubtful accounts for estimated losses resulting from the inability of our customers to make required payments. This allowance is based on historical experience, credit evaluations, specific customer collection history and any customer-specific issues that we have identified, current economic trends and contractual terms and conditions. Changes in circumstances, such as an unexpected material adverse change in a customer’s ability to meet its financial obligation, may require us to further adjust our estimates of the recoverability of amounts due to us.
Stock-Based Compensation
Our stock-based compensation expense is estimated at the grant date based on the award’s fair value and is recognized as expense over the award’s requisite service period on a straight-line basis. Fair value for restricted stock awards is determined by the stock’s closing price on the grant date. The fair value of stock options and employee purchase rights granted in connection with the Employee Stock Purchase Plan is determined using the Black-Scholes option-pricing model. We estimate expected volatility of our stock price based on historical volatility as an input into the option-pricing model. To the extent volatility of our stock price increases in the future, our estimates of the fair value of options granted in the future could increase, thereby increasing stock-based compensation expense in future periods. We estimate the expected term based on the historical average term as an input into the option-pricing model. We apply an expected forfeiture rate to our stock options and restricted stock awards and only recognize expense for those shares expected to vest. Our estimate of the forfeiture rate is based upon historical experience of employee turnover and other factors. To the extent the actual forfeiture rate is different from our expected rate, stock-based compensation expense is adjusted accordingly. To the extent we revise this estimate in the future, our stock-based compensation expense could be materially impacted in the quarter of revision, as well as in following quarters.
Sales tax
Our sales and use tax filings are subject to customary audits by authorities in the jurisdictions where we conduct business, which may result in assessments of additional taxes. As a result of addressing a sales and use tax audit which was initiated in 2009, we determined that additional sales taxes were probable of being assessed for multiple states. Given the nature of our business model, the state conducting the sales tax audit agreed to work with us in developing the methodology that was used to estimate the incremental sales tax obligation. We have applied this same model to other states where this type of sales tax may also be applicable. We estimated an incremental sales tax liability including interest and penalties of approximately $5.0 million. Significant subjectivity exists as to both whether sales tax can be assessed on the activity for which the incremental sales tax amount is derived, and given the nature of our business model, how the sales tax will ultimately be measured by the relevant jurisdiction. Based on the developments associated with the ongoing sales and use tax audit, we make a determination each reporting period whether the estimates for sales tax in certain states should be revised, and accordingly recognize additional sales tax obligations, including interest and penalties, which are recorded in general and administrative expenses.
While we have the ability and right to bill and collect the incremental sales tax, excluding interest and penalties, from our customers, several factors create significant uncertainty in determining whether recognition of an asset as a sales tax receivable is appropriate. The primary uncertainties include the following: (1) As disclosed above, significant judgment exists both as to the activity that gives rise to the incremental sales tax assessment and how the sales tax amount has been measured; (2) Although the Company has identified the
29
Table of Contents
process to invoice incremental sales tax to our customers, we do not have a history of collecting on these types of sales taxes and therefore are unable to determine the amount recoverable and; (3) The estimated incremental sales tax relates to multiple periods which would make it more difficult to successfully collect the incremental sales tax from our customers. Accordingly, we have determined that we will not recognize an asset relating to this matter as we currently do not have the ability to estimate the amount, if any, that we will be able to collect from our customers. Collections received from customers, if any, in connection with the additional sales tax assessment will be recognized upon receipt. No collections from customers had been received as of December 31, 2009.
Accounting for Income Taxes
In preparing our consolidated financial statements, we assess the likelihood that our deferred tax assets will be realized from future taxable income. We establish a valuation allowance if we determine that it is more likely than not that some portion of the net deferred tax assets will not be realized. We include changes in the valuation allowance in our consolidated statements of income as a provision for (benefit from) income taxes. We exercise significant judgment in determining our provisions for income taxes, our deferred tax assets and liabilities and our future taxable income for purposes of assessing our ability to utilize any future tax benefit from our deferred tax assets.
When we assess the likelihood that we will be able to recover our deferred tax assets, we consider all available evidence, both positive and negative, including historical levels of income, expectations and risks associated with estimates of future taxable income and ongoing prudent and feasible tax planning strategies in assessing the need for a valuation allowance. If recovery is not likely, we would increase our provision for taxes by recording a valuation allowance against the deferred tax assets that we estimate will not ultimately be recoverable.
We account for the recognition of deferred tax assets if realization of such assets is more likely than not. Based upon the weight of available evidence, which includes our historical operating performance and the reported cumulative net losses to date, we have provided a full valuation allowance of $59.2 million against the majority of our deferred tax assets at December 31, 2009, compared to $59.7 million at December 31, 2008. At each period end, we reassess our ability to realize our deferred tax assets. The factors we considered include, but are not limited to: (i) our historical cumulative net losses, after adjustment for permanent tax differences, over the previous three years through 2009; (ii) the dependence on continued high growth rates in achieving forecasted profitability; (iii) operation in an industry subject to rapid technological changes; (iv) the unknown impact of current negative macroeconomic factors on forecasted results of operations; and (v) consideration of tax strategies.
RESULTS OF OPERATIONS
Revenue
| Year ended December 31, | ||||||||||||||||||||||||
| 2009 | Change $ | Change % | 2008 | Change $ | Change % | 2007 | ||||||||||||||||||
| (In thousands, except percentages) | ||||||||||||||||||||||||
| Broadband |
||||||||||||||||||||||||
| Wi-Fi and Hotel Ethernet |
$ | 61,626 | $ | (2,273) | (3.6) | % | $ | 63,899 | $ | 22,501 | 54.4 | % | 41,398 | |||||||||||
| Managed Network Services |
28,322 | 686 | 2.5 | % | 27,636 | 1,352 | 5.1 | % | 26,284 | |||||||||||||||
| 3G Mobile Broadband |
18,126 | 5,949 | 48.9 | % | 12,177 | 4,786 | 64.8 | % | 7,391 | |||||||||||||||
| Total Broadband |
$ | 108,074 | $ | 4,362 | 4.2 | % | $ | 103,712 | $ | 28,639 | 38.1 | % | $ | 75,073 | ||||||||||
| As a percent of revenue |
63.1 | % | — | 8.9 | % | 54.2 | % | — | 15.1 | % | 39.1 | % | ||||||||||||
| Dial-up |
$ | 17,231 | $ | (19,884) | (53.6) | % | $ | 37,115 | $ | (30,711) | (45.3) | % | $ | 67,826 | ||||||||||
| As a percent of revenue |
10.0 | % | — | (9.4) | % | 19.4 | % | — | (16.0) | % | 35.4 | % | ||||||||||||
| Services and other fees |
$ | 46,072 | $ | (4,469) | (8.8) | % | $ | 50,541 | $ | 1,708 | 3.5 | % | $ | 48,833 | ||||||||||
| As a percent of revenue |
26.9 | % | — | 0.5 | % | 26.4 | % | — | 0.9 | % | 25.5 | % | ||||||||||||
| Total Revenue |
$ | 171,377 | $ | (19,991) | (10.4) | % | $ | 191,368 | $ | (364) | (0.2) | % | $ | 191,732 | ||||||||||
30
Table of Contents
The decrease in total revenue in 2009, as compared to 2008 was primarily due to the continued and anticipated erosion of dial-up revenue as users moved to faster connection technologies and reduced service and other fees resulting from lower service charges and MMC fees, partially offset by the growth in 3G and MNS broadband revenues. The overall decrease in revenues was also due to the continued global economic downturn resulting in corporate layoffs and restricted business travel in our enterprise customer base which caused a decrease in demand for our services.
Total revenue was relatively flat from 2007 to 2008. While the net change was relatively small we experienced a decline in Dial-up revenues that were offset by an increase in broadband revenues. Service and other fees were also up slightly as compared to 2007, primarily due to a client adoption of certain services.
International revenues, which are revenues generated from customers domiciled outside the United States, accounted for approximately 39%, 38% and 38% of total revenues in 2009, 2008 and 2007, respectively. Substantially all of our international revenues are generated in the EMEA (Europe, Middle East and Africa) and Asia Pacific regions. Revenues in the EMEA region represented 30%, 28% and 27% of total revenues in 2009, 2008 and 2007, respectively. Revenues in the Asia Pacific region represented 6%, 8% and 7% of total revenues in 2009, 2008 and 2007, respectively. Revenues in the United Kingdom accounted for 10%, 9% and 11% of total revenues in 2009, 2008 and 2007, respectively. To date, all of our revenues have been denominated in U.S. dollars. In the future some portion of revenues may be denominated in foreign currencies. No individual customer accounted for 10% or more of total revenues for the years ended December 31, 2009, 2008 or 2007.
Broadband Revenue
The increase in broadband revenue to 2009 compared to 2008 was primarily due to growth in our 3G revenues as well as a marginal increase in MNS revenues. The increase was due to the adoption of this 3G technology by our customers. MNS revenue increased from 2008 to 2009, primarily due to an increase in end points in our core branch and retail office business.
These increases were partially offset by a decline in Wi-Fi revenues as a result of the effects of corporate layoffs and restricted business travel implemented by many of our enterprise customers due to the global economic downturn. The increase was also partially offset by a one-time reduction of $0.9 million related to the correction of historical billing errors.
The increase in broadband revenue 2008 compared to 2007 was the result of the migration of dial-up customers to broadband as well as the increased number of broadband access points giving our customers increased remote access to their corporate networks from more locations at higher rates of speed.
We anticipate total broadband revenues will experience continued modest growth in the first quarter of 2010 despite the continued pressures from the current global economic downturn and associated corporate layoffs and restrictions on business travel in our enterprise customer base.
Dial-Up Revenue
The year over year decrease in dial-up revenue was due to a continuation of customer migration from dial-up to broadband as a preferred method of connectivity.
We expect dial-up revenue will continue to decrease in the first quarter of 2010 as the use of dial-up as a means of enterprise connectivity continues to decline.
Services and Other Fees
The decrease in services and other fees in 2009 compared to 2008 is primarily the result of a sharp decline in service fees as a result of MMC fees that declined due to customers renewing their agreements at lower minimum commit levels, as well as converting customers to our enterprise flat rate pricing structure and decrease in professional fees.
31
Table of Contents
The increase in 2008 compared to 2007 was primarily due to increased iPassConnect revenues resulting from the adoption of enterprise flat rate pricing that includes charges on a per user per month basis for using our client software. This increase was partially offset by a decline in software, MMC and service fees.
Operating Expenses
Network Access
Network access costs (“NAC”) consist of charges for access, principally by the minute, which we pay to our network service providers.
| Year Ended December 31, | ||||||||||||||||||||||||
| 2009 | Change $ | Change % | 2008 | Change $ | Change % | 2007 | ||||||||||||||||||
| (In thousands, except percentages) | ||||||||||||||||||||||||
| Network access expenses |
$ | 73,937 | $ | (8,024) | (9.8) | % | $ | 81,961 | $ | 12,818 | 18.5 | % | $ | 69,143 | ||||||||||
| As a percent of revenue |
43.1 | % | — | 0.3 | % | 42.8 | % | — | 6.7 | % | 36.1 | % | ||||||||||||
The decrease in network access costs for 2009 as compared to 2008 was primarily due to the decline in our revenues. The increase in NAC as a percentage of revenue was due to an increase in the minimum commitment made by us to certain key suppliers during 2009 as compared to 2008 as well as the costs for mobile data services being more expensive than dial-up.
The increase in network access costs from 2007 to 2008 was due primarily to increased usage of our broadband network services which are more expensive than dial-up.
We expect network access costs to decrease in the first quarter of 2010 from the fourth quarter of 2009 due to the anticipated more favorable foreign currency rates and some non-recurring expenses recorded in the fourth quarter of 2009.
Network Operations
Network operations expenses consist of compensation and benefits for our network engineering, customer support, network access quality, outside consultants, transaction center fees; depreciation of our network equipment; costs of mobile data cards and allocated overhead costs.
| Year Ended December 31, | ||||||||||||||||||||||||
| 2009 | Change $ | Change % | 2008 | Change $ | Change % | 2007 | ||||||||||||||||||
| (In thousands, except percentages) | ||||||||||||||||||||||||
| Network operations expense |
$ | 29,444 | $ | (2,969) | (9.2) | % | $ | 32,413 | $ | 451 | 1.4 | % | $ | 31,962 | ||||||||||
| As a percent of revenue |
17.2 | % | — | 0.3 | % | 16.9 | % | — | 0.2 | % | 16.7 | % | ||||||||||||
The decrease in network operations expenses in 2009 as compared to 2008 was primarily due to a reduction of $1.5 million in compensation, benefits and travel related expenses resulting from headcount reductions associated with restructuring activity and lower stock compensation expense of $0.1 million, primarily driven by lower share prices of our common stock and credits for the true-up of the actual forfeiture rate to the number of shares that were forfeited prior to contractual vest date. Additionally, a reduction in co-location network expense and licensing fees due to the implementation of certain cost saving measures further reduced network operations expense by $1.0 million. The remaining portion of the decrease is related to individually insignificant amounts.
Network operations expenses increased slightly from 2007 to 2008. There were no significant fluctuations, offsetting or otherwise.
We expect that our network operations expenses will increase in absolute dollars in the first quarter of 2010 from the fourth quarter of 2009 primarily due to the increase in consulting fees and mobile data card expenses.
32
Table of Contents
Research and Development
Research and development expenses consist of compensation and benefits for our research and development personnel, consulting, and allocated overhead costs.
| Year Ended December 31, | ||||||||||||||||||||||||
| 2009 | Change $ | Change % | 2008 | Change $ | Change % | 2007 | ||||||||||||||||||
| (In thousands, except percentages) | ||||||||||||||||||||||||
| Research and development expenses |
$ | 14,362 | $ | (2,019) | (12.3) | % | $ | 16,381 | $ | (4,760) | (22.5) | % | $ | 21,141 | ||||||||||
| As a percent of revenue |
8.4 | % | — | (0.2) | % | 8.6 | % | — | (2.4) | % | 11.0 | % | ||||||||||||
The decrease in research and development expenses for the year ended December 31, 2009 as compared to 2008 resulted from a $0.7 million decrease in compensation, benefits and travel expenses due to headcount reductions, a $0.4 million decrease in rent expense due to the consolidation of our facilities in India, lower licenses and fees of $0.4 million and lower depreciation expense of $0.2 million. The remaining portion of the decrease is related to individually insignificant items.
The decrease in research and development expenses, in both absolute dollars and percent of revenue from 2007 to 2008 resulted primarily from $4.2 million in lower compensation, benefits and outside contractor expenses resulting from restructuring activity. The remaining portion of the decrease is related to individually insignificant items.
We expect that our research and development expenses will decrease in absolute dollars in the first quarter of 2010 from the fourth quarter of 2009 as a result of the restructuring initiatives in the fourth quarter of 2009.
Sales and Marketing
Sales and marketing expenses consist of compensation, benefits, advertising, promotion expenses, and allocated overhead costs.
| Year Ended December 31, | ||||||||||||||||||||||||
| 2009 | Change $ | Change % | 2008 | Change $ | Change % | 2007 | ||||||||||||||||||
| (In thousands, except percentages) | ||||||||||||||||||||||||
| Sales and marketing expenses |
$ | 29,968 | $ | (11,172) | (27.2) | % | $ | 41,140 | $ | (11,669) | (22.1) | % | $ | 52,809 | ||||||||||
| As a percent of revenue |
17.5 | % | — | (4.0) | % | 21.5 | % | — | (6.0) | % | 27.5 | % | ||||||||||||
The decrease in sales and marketing expenses for 2009 as compared to 2008 was due primarily to a decrease of approximately $5.8 million in compensation, travel and benefits expenses due to decreased sales personnel resulting from restructuring activities that occurred during 2009, lower stock compensation expense of approximately $0.4 million, primarily driven by lower share prices of our common stock and credits for the true-up of the actual forfeiture rate to the number of shares that were forfeited prior to contractual vest date, and lower commission of approximately $2.9 million due to lower revenues. Targeted reductions in specific marketing programs further reduced sales and marketing expenses by approximately $1.5 million. The remaining portion of the decrease is related to individually insignificant items.
The decrease in sales and marketing expenses in absolute dollars and percent of revenue from 2007 to 2008 was due primarily to approximately $9.3 million in decreased compensation, commission, benefits related and outside contractor expenses resulting from decreased sales personnel as part of our restructuring activities in 2007. The decreased sales personnel resulted in an additional $0.9 million reduction in travel costs and $0.8 million in stock-based compensation expense. Targeted reductions in specific marketing programs further reduced sales and marketing expenses by $0.4 million. The remaining portion of the decrease is related to individually insignificant items.
We expect that sales and marketing expenses will decrease in absolute dollars in the first quarter of 2010 from the fourth quarter of 2009 as a result of the restructuring initiatives in the fourth quarter of 2009.
33
Table of Contents
General and Administrative
General and administrative expenses consist of compensation and benefits for general and administrative personnel, legal and accounting expenses, bad debt expense, and allocated overhead costs.
| Year Ended December 31, | ||||||||||||||||||||||||
| 2009 | Change $ | Change % | 2008 | Change $ | Change % | 2007 | ||||||||||||||||||
| (In thousands, except percentages) | ||||||||||||||||||||||||
| General and administrative expenses |
$ | 28,337 | $ | 4,718 | 20.0 | % | $ | 23,619 | $ | (35) | (0.1) | % | $ | 23,654 | ||||||||||
| As a percent of revenue |
16.5 | % | — | 4.2 | % | 12.3 | % | — | (0.0) | % | 12.3 | % | ||||||||||||
The increase in general and administrative expenses in 2009 as compared to 2008 was driven primarily by a charge of $5.0 million related to certain sales tax obligations and related interest and penalties and an increase in bad debt expense of $1.0 million. The remaining $0.2 million increase is due to individually insignificant items. These increases were offset in part by a reduction of $0.6 million in compensation expense resulting from restructuring activities that occurred in 2009, and lower stock compensation expense of approximately $0.9 million primarily driven by lower share prices of our common stock and credits for the true-up of the actual forfeiture rate to the number of shares that were forfeited prior to contractual vest date.
There were no significant fluctuations, offsetting or otherwise, for general and administrative expenses from 2007 to 2008.
We expect that our general and administrative expenses will increase in absolute dollars in the first quarter of 2010 from the fourth quarter of 2009 primarily due to the higher consulting fees for accounting and tax related projects.
Restructuring and Other Charges
In the fourth quarter of 2009, we announced a restructuring plan (the “Q4 2009 Plan”) designed to align our cost and operating structure, improve operating efficiencies and focus on our Open Mobile Platform. The Q4 2009 Plan resulted in a reduction of our workforce by 78 positions, abandonment of certain additional facilities and termination of a large contract obligation. During the year ended December 31, 2009, we recorded restructuring charges of $3.6 million related to the Q4 2009 Plan. We completed the work force reductions by the end of the first quarter of 2010. The lease terms for the abandoned facilities expire in February 2012. The obligation for the terminated contract was paid in January 2010.
In the first quarter of 2009, we announced a restructuring plan (the “Q1 2009 Plan”) to reduce our workforce by 68 positions across all functional areas and abandon certain facilities, for which the lease terms extend through April 30, 2015. We completed all terminations during the year ended December 31, 2009 and recorded restructuring charges of $4.3 million related to the Q1 2009 Plan.
In the fourth quarter of 2007, we announced a restructuring plan (the “Q4 2007 Plan”) to reduce our workforce by 72 positions and abandon certain facilities and capitalized assets. During 2007, we recorded a total restructuring charge of approximately $3.2 million related to the Q4 2007 Plan. As of December 31, 2008, we finalized all of the employment terminations.
The liability for net excess facilities costs is recorded at fair value. Any difference between the fair value of the liability at the measurement date and the total cash liability is accreted ratably over the remaining lease term. This accretion cost is included as a restructuring charge in the Consolidated Statements of Operations. Total accretion related to the Q1 2009 Plan that will be recognized through April 2015 is $0.3 million with a remaining balance of $0.3 million as of December 31, 2009. In addition, total accretion related to facilities abandoned in the 2006 restructuring plan (the “Q4 2006 Plan”) that will be recognized through April 2010 is $0.5 million with a remaining balance of $0.1 million as of December 31, 2009.
34
Table of Contents
The following is a summary of restructuring activity of the Q1 2009 and Q4 2009 Plans by plan (in thousands):
Q4 2009 Plan
| Excess Facility Costs |
Severance Costs |
Contract Termination Costs |
Total Restructuring Accrual |
|||||||||
| Balance as of December 31, 2008 |
$ | — | — | — | — | |||||||
| Restructuring charges |
1,121 | 1,778 | 744 | 3,643 | ||||||||
| Payments |
(190 | ) | (662 | ) | — | (852 | ) | |||||
| Balance as of December 31, 2009 |
$ | 931 | 1,116 | 744 | 2,791 | |||||||
Q1 2009 Plan
| Excess Facility Costs |
Severance Costs |
Contract Termination Costs |
Total Restructuring Accrual |
|||||||||
| Balance as of December 31, 2008 |
$ | — | — | — | — | |||||||
| Restructuring charges |
2,988 | 1,258 | — | 4,246 | ||||||||
| Net present value accretion |
11 | — | — | 11 | ||||||||
| Payments |
(1,484 | ) | (1,242 | ) | — | (2,726 | ) | |||||
| Balance as of December 31, 2009 |
$ | 1,515 | 16 | — | 1,531 | |||||||
Amortization of Intangible Assets
Amortization of intangible assets was $1.4 million, $3.9 million and $4.2 million for the years ended December 31, 2009, 2008 and 2007, respectively. Some of our intangible assets have reached the end of their estimated useful lives starting in the fourth quarter of 2008, resulting in the reductions. We recorded an intangible impairment charge of $3.4 million during the fourth quarter of 2008.
Impairment of Goodwill and Long-lived Asset
We evaluate goodwill for impairment on an annual basis or more frequently if changes in facts and circumstances indicate that impairment in the value of goodwill recorded on our balance sheet may exist. Our stock price has been negatively impacted by the recent economic environment, resulting in an 83% decline over the twelve months ended December 31, 2008. This decline was considered a triggering event which led management to perform a valuation analysis to determine whether and to what extent goodwill may have been impaired as of December 31, 2008. As a result of this analysis, in the fourth quarter of fiscal 2008, we recorded a charge of $79.8 million related to goodwill impairment which represented the full carrying value of goodwill on the consolidated balance sheet.
As part of the goodwill impairment analysis, we are required to assess our long-lived assets for impairment. During the fourth quarter of fiscal 2008, we recorded a charge of $1.3 million related to the impairment of certain long-lived assets.
Non-Operating Income and Expenses
Interest Income
Interest income includes primarily interest income on cash, cash equivalents, and short-term investment balances. Interest income was $0.6 million, $2.0 million and $3.4 million for the years ended December 31, 2009, 2008 and 2007, respectively. Interest income declined from 2007 to 2008 and further to 2009 primarily due to decreased cash and investment balances.
35
Table of Contents
Foreign Exchange Gains (Losses) and Other Income (Expense)
Foreign exchange gains (losses) and other income (expense) include primarily losses on foreign currency transactions. Fluctuations in foreign currency exchange rates impact the re-measurement of assets, liabilities, revenues and expenses and generate exchange gains or losses. In addition, certain of our network access costs are invoiced in currencies other than U.S. dollars. The transactional settlement of these outstanding liabilities generates exchange gains or losses depending on the fluctuation of exchange rates between the date of invoicing and the date of payment. Prior to 2009, we periodically entered into forward contracts to partially manage foreign currency exposure. During 2009, we did not enter into any forward contracts. For the years ended December 31, 2009, 2008, and 2007, respectively, foreign exchange losses were $0.6 million, $1.1 million, and $0.2 million.
Provision for Income Taxes
The benefit for income taxes was $0.7 million and $0.6 million in 2009 and 2008 respectively, compared to a provision of $23.2 million in 2007. The change from provision to benefit for income taxes in 2008 was mainly related to the fact that in 2007 a full valuation allowance was established against the majority of our net deferred tax assets as a result of continued losses. The tax benefit realized in 2009 primarily related to a federal alternative minimum tax refund filed under the Unemployment Insurance Extension Legislation H.R. 3548, partially offset by foreign income taxes. The tax benefit realized in 2008 primarily related to settlements of the California income tax audit of $0.7 million and receipt of income tax refunds of $0.2 million, partially offset by foreign income taxes.
Liquidity and Capital Resources
| December 31, 2009 |
December 31, 2008 |
Increase/ (Decrease) |
||||||||||
| (in thousands) | (in thousands) | (in thousands) | ||||||||||
| Cash and cash equivalents |
37,973 | 33,077 | 4,896 | |||||||||
| Short-term investments |
3,799 | 35,309 | (31,510 | ) | ||||||||
| Total |
$ | 41,772 | $ | 68,386 | $ | (26,614 | ) | |||||
| Percentage of total assets |
47 | % | 55 | % | ||||||||
Sources of Cash
We have historically relied on existing cash and cash flow from operations for our liquidity needs. Key sources of cash are provided by operations, existing cash, cash equivalents and short-term investments. As of December 31, 2009, we had cash and cash equivalents of $38.0 million and short-term investments of $3.8 million. We use a professional investment management firm to manage a large portion of our invested cash. The portfolio is invested primarily in money market accounts generally due within one year.
While our existing cash, cash equivalents and investment balances may decline during 2010 as a result of a further weakening of the economy or changes in our planned cash outlay including the stock repurchase program, we believe that based on our current business plan and revenue prospects, our existing cash balances and our anticipated cash flows from operations will be sufficient to meet our working capital and operating resource expenditure requirements for the next twelve months.
Uses of Cash
Our principal use of cash in 2009 was for stock repurchases, return of capital, restructuring, payroll related expenses, general operating expenses including marketing, travel and office rent, and network access costs.
Stock Repurchases. In November 2009, we announced a stock repurchase program which authorizes the repurchase up to $10.0 million of outstanding common stock on the open market or through negotiated
36
Table of Contents
transactions. In the event that this $10.0 million stock repurchase program is not completed by March 31, 2011, we are obligated to dividend to stockholders any remaining balance by April 15, 2011. Through December 31, 2009, we repurchased a total of 750,000 shares of common stock for an aggregate purchase price of approximately $0.8 million. During 2008, we repurchased approximately 1.3 million shares of common stock for an aggregate purchase price of $3.7 million.
Return of Capital. In 2009 we returned approximately $30.0 million in capital to our stockholders in the form of two extraordinary cash dividends.
Restructuring. In the first quarter of 2009, we announced a restructuring plan in order to reduce our operating costs and focus our resources on key strategic priorities. In the fourth quarter of 2009 we announced a restructuring plan to align our cost structure and improve operating efficiencies. Cash used for restructuring activities was $4.6 million, $2.0 million, and $3.0 million in 2009, 2008, and 2007, respectively.
Cash Flows
Operating Activities. Net cash provided by operating activities in 2009 was $6.3 million compared to net cash provided by operating activities in 2008 of $1.0 million and compared to net cash used in operating activities of $7.3 million on 2007. The trend in our cash flows from operations is generally reflective of our reduction of operating expenses by means of reductions in our workforce, tighter control over discretionary spending during 2009, improvements in efficiency and the continued success of our collection efforts which together have more than offset the effect of declining revenues.
Investing Activities. Net cash provided by investing activities in 2009 was $29.0 million compared to net cash used in investing activities in 2008 of $35.8 million and net cash provided by investing activities in 2007 of $73.8 million. Cash provided by and used in investing activities primarily relates to maturities and purchases of short-term investments.
Financing Activities. Net cash used in financing activities in 2009 was $30.4 million, primarily due to the payment of cash dividends of approximately $30.0 million and the repurchases of common stock of $0.8 million. Net cash used in financing activities in 2008 was $3.0 million primarily due to $3.7 million used for the repurchases of common stock offset by $0.6 million of cash received for stock option exercises and stock purchases through our employee stock purchase plan (“ESPP”). Net cash used in financing activities in 2007 was $11.1 million which was comprised of $13.8 million of cash used for repurchases of common stock offset by $2.7 million of cash received for stock option exercises and stock purchases through our ESPP.
Off-Balance Sheet Arrangements
At December 31, 2009 and 2008, we did not have any off-balance sheet arrangements or relationships with unconsolidated entities or financial partnerships, such as entities often referred to as structured finance or special purpose entities.
Commitments
At December 31, 2009, we had no material commitments for capital expenditures.
37
Table of Contents
Contractual Obligations
| Payments Due by Period | |||||||||||||||
| Total | Less Than 1 Yr |
1-3 Years | 3-5 Years | More Than 5 Yrs | |||||||||||
| Operating Lease Obligations |
$ | 16,926 | $ | 4,617 | $ | 6,048 | $ | 4,794 | $ | 1,467 | |||||
| Network Service Commitments(1) |
9,448 | 4,273 | 5,175 | — | — | ||||||||||
| Return of Capital Obligations |
9,179 | — | 9,179 | — | — | ||||||||||
| Total Contractual Obligations |
$ | 35,553 | $ | 8,890 | $ | 20,402 | $ | 4,794 | $ | 1,467 | |||||
| (1) | In the normal course of our business, we have signed contracts with certain network service and mobile data providers under which we have minimum purchase commitments that expire on various dates through June 2011. We have contracted with multiple network service providers to provide alternative access points in given geographic areas. In those geographic areas where we provide access through multiple providers, we are able to direct users to the network of particular service providers. Our ability to fulfill our purchase minimum commitment is subject to current economic environment among other factors. |
On August 18, 2009, we declared an extraordinary cash dividend of $20.0 million to stockholders of record as of August 31, 2009. The cash dividend was paid September 17, 2009. On November 3, 2009, the Company’s Board of Directors declared a $10.0 million extraordinary cash dividend to stockholders of record as of December 4, 2009. The cash dividend was paid on December 18, 2009. In addition, pursuant to the Agreement the Board approved a $10.0 million stock repurchase program that extends through March 31, 2011. In the event that any of the $10.0 million is not used to repurchase our stock, we have agreed to dividend to stockholders the remaining portion by April 15, 2011. (See Note 11. Return of Capital and Repricing of Stock Options).
In addition to the contractual obligations disclosed above, we have unrecognized tax benefits including estimated gross interest and penalties of $3.9 million and $2.5 million as of December 31, 2009 and 2008, respectively.
In the ordinary course of business, we may provide indemnifications of varying scope and terms to customers, business partners, and other parties with respect to certain matters, including, but not limited to, losses arising out of our breach of such agreements, services to be provided by us, or from intellectual property infringement claims made by third-parties. In addition, we have entered into indemnification agreements with our directors and certain of our officers and employees that will require us, among other things, to indemnify them against certain liabilities that may arise by reason of their status or service as directors, officers or employees. We maintain director and officer insurance, which may cover certain liabilities arising from our obligation to indemnify our directors and certain of our officers and employees, in certain circumstances. iPass’ product agreements typically include a limited indemnification provision for claims from third parties relating to breach of agreements, and iPass’ intellectual property. Certain indemnification agreements may not be subject to maximum loss clauses. If the potential loss from any indemnification claim is considered probable and the amount or the range of the loss can be estimated, iPass accrues a liability for the estimated loss. To date, claims under such indemnification provisions have not been significant.
38
Table of Contents
| Item 7A. | Quantitative and Qualitative Disclosures About Market Risk |
Foreign Currency
Certain costs of the Company, primarily overseas network access costs, are denominated in foreign currencies such as the Euro, British Pound and Indian Rupee. Although we currently bill substantially all of our revenue in U.S. Dollars, our financial results could be affected by factors such as changes in foreign currency rates and/or weak economic conditions in foreign markets. Further, a strengthening of the U.S. Dollar could make the pricing of our services less competitive in foreign markets and therefore, could reduce our revenues. The impact of foreign currency fluctuations is also discussed in “Foreign exchange gains (losses) and other income (expense)” under Item 7, “Management’s Discussion and Analysis of Financial Condition and Results of Operations.”
Interest Rate Sensitivity
As of December 31, 2009, we had cash and cash equivalents, short-term investments, and restricted cash totaling $43.7 million. Our investments of $3.8 million, consisted of commercial paper and government securities, all due within one year. The majority of these funds are held in the form of money market accounts.
| Item 8. | Financial Statements and Supplementary Data |
Financial Statements
Our financial statements required by this item are set forth in Item 15 of this report and incorporated by reference here. See Item 15(a)(1) for a listing of financial statements provided in the section titled “Financial Statements.”
Supplementary Data
The following tables present the Company’s operating results for each of the eight quarters during 2008 and 2009. This data has been derived from unaudited consolidated financial statements that, in the opinion of the Company’s management, include all adjustments, consisting only of normal recurring adjustments, necessary for a fair presentation of such information when read in conjunction with the Company’s annual audited consolidated financial statements and notes thereto appearing elsewhere in this report. These operating results are not necessarily indicative of results for any future period (in thousands, except per share amounts):
| Quarter Ended | |||||||||||||||
| March 31 | June 30 | September 30 | December 31(1) | ||||||||||||
| Year Ended December 31, 2009 |
|||||||||||||||
| Revenues |
$ | 44,642 | $ | 43,704 | $ | 42,555 | $ | 40,476 | |||||||
| Operating income (loss) |
(2,991 | ) | 881 | (5,821 | ) | (6,267 | ) | ||||||||
| Net income (loss) |
(3,013 | ) | 975 | (6,122 | ) | (5,332 | ) | ||||||||
| Basic net income (loss) per share |
$ | (0.05 | ) | $ | 0.02 | $ | (0.10 | ) | $ | (0.09 | ) | ||||
| Diluted net income (loss) per share |
$ | (0.05 | ) | $ | 0.02 | $ | (0.10 | ) | $ | (0.09 | ) | ||||
| Quarter Ended | ||||||||||||||||
| March 31 | June 30 | September 30 | December 31(2) | |||||||||||||
| Year Ended December 31, 2008 |
||||||||||||||||
| Revenues |
$ | 48,112 | $ | 48,616 | $ | 48,371 | $ | 46,269 | ||||||||
| Operating loss |
(2,200 | ) | (2,290 | ) | (1,743 | ) | (87,166 | ) | ||||||||
| Net loss |
(1,373 | ) | (1,445 | ) | (2,098 | ) | (87,052 | ) | ||||||||
| Basic net loss per share |
$ | (0.02 | ) | $ | (0.02 | ) | $ | (0.03 | ) | $ | (1.41 | ) | ||||
| Diluted net loss per share |
$ | (0.02 | ) | $ | (0.02 | ) | $ | (0.03 | ) | $ | (1.41 | ) | ||||
| (1) | Revenues include a one-time reduction of revenue of approximately $0.9 million related to the correction of historical billing errors. |
| (2) | Operating loss includes a one-time impairment of goodwill and long-lived assets amounting to $84.5 million. |
39
Table of Contents
| Item 9. | Changes in and Disagreements with Accountants on Accounting and Financial Disclosure |
None.
| Item 9A. | Controls and Procedures |
Disclosure Controls and Procedures
As of the end of the period covered by this report, management of the Company conducted an evaluation, under the supervision and with the participation of our Chief Executive Officer and Chief Financial Officer, of the effectiveness of the design and operation of our disclosure controls and procedures, as such term is defined in Securities Exchange Act Rules 13a-15(e) and 15d-15(e) of the Securities Exchange Act of 1934 (the Exchange Act), as of the end of the period covered by this report. Our disclosure controls and procedures are designed to provide reasonable assurance of achieving their objectives. Based upon that evaluation, our Chief Executive Officer and Chief Financial Officer concluded that our disclosure controls and procedures are effective at the reasonable assurance level, as of the end of the period covered by this report, to ensure that information required to be disclosed was recorded, processed, summarized and reported within the time periods specified in the SEC’s rules and forms, and to provide reasonable assurance that information required to be disclosed by us in such reports is accumulated and communicated to the company’s management, including its Chief Executive Officer and Chief Financial Officer, as appropriate to allow timely decisions regarding required disclosure.
Management’s Report on Internal Control Over Financial Reporting
Our management is responsible for establishing and maintaining adequate internal control over financial reporting, as such terms is defined in Rule 13a-15(f) under the Exchange Act. Under the supervision and with the participation of our Chief Executive Officer and Chief Financial Officer, management of the Company conducted an evaluation of the effectiveness of our internal control over financial reporting based upon the framework in “Internal Control—Integrated Framework” issued by the Committee of Sponsoring Organizations of the Treadway Commission (“COSO”) in Internal Control-Integrated Framework. Based on that evaluation, our management concluded that, as of December 31, 2009, our internal control over financial reporting was effective based on these criteria. KPMG LLP, an independent registered public accounting firm, has audited the consolidated financial statements included in this Form 10-K and, as part of the audit, has issued a report, included herein on the effectiveness of iPass’ internal control over financial reporting as of December 31, 2009.
Changes in Internal Control Over Financial Reporting
During the quarter ended December 31, 2009 there have been no changes in our internal controls over financial reporting that materially affected, or are reasonably likely to materially affect, our internal controls over financial reporting.
Inherent Limitations of Disclosure Controls and Procedures and Internal Control over Financial Reporting
Our management, including our Chief Executive Officer and Chief Financial Officer, does not expect that our disclosure controls and procedures or our internal controls will prevent all error and all fraud. A control system, no matter how well designed and operated, can provide only reasonable, not absolute, assurance that the objectives of the control system are met. Further, the design of a control system must reflect the fact that there are resource constraints, and the benefits of controls must be considered relative to their costs. Because of the inherent limitations in all control systems, no evaluation of controls can provide absolute assurance that all control issues and instances of fraud, if any, within iPass have been detected.
| Item 9B. | Other Information |
None.
40
Table of Contents
| Item 10. | Directors, Executive Officers and Corporate Governance |
Information relating to our executive officers and directors will be presented under the captions “Executive Officers” and “Proposal—Election of Directors” in our definitive proxy statement in connection with our 2009 Annual Meeting of stockholders to be filed with the Securities and Exchange Commission not later than April 30, 2010 (the “Proxy Statement”). That information is incorporated here by reference.
Information concerning compliance with Section 16(a) of the Securities Exchange Act of 1934 will be presented under the caption “Section 16(a) Beneficial Ownership Reporting Compliance” in the Proxy Statement. That information is incorporated into this report by reference.
Information concerning our Code of Ethics will be presented under the caption “Code of Conduct and Ethics” in “Proposal—Election of Directors” in the Proxy Statement. That information is incorporated here by reference.
Information concerning procedures for recommending nominees for director will be presented under the caption “Corporate Governance and Nominating Committee” in “Proposal—Election of Directors” in the Proxy Statement. That information is incorporated here by reference.
Information relating to our audit committee and the audit committee financial experts will be presented under the captions “Information Regarding the Board of Directors and its Committees” and “Audit Committee” in the “Proposal—Election of Directors” in the Proxy Statement. That information is incorporated here by reference.
| Item 11. | Executive Compensation |
Information relating to director and executive compensation and other matters required by this Item 11 will be presented under the caption “Executive Compensation and Related Information,” “Compensation Committee Interlocks and Insider Participation” and “Report of the Compensation Committee Report” in the Proxy Statement. That information is incorporated here by reference.
| Item 12. | Security Ownership of Certain Beneficial Owners and Management and Related Stockholder Matters |
Information relating to the security ownership of our common stock by our management and other beneficial owners will be presented under the caption “Security Ownership of Certain Beneficial Owners and Management” in the Proxy Statement. That information is incorporated here by reference.
Information relating to securities authorized for issuance under equity compensation plans will be presented under the caption “Securities Authorized for Issuance Under Equity Compensation Plans” in the Proxy Statement. That information is incorporated here by reference.
| Item 13. | Certain Relationships and Related Transactions, and Director Independence |
Information relating to certain relationships of our directors and executive officers and related transactions and the independence of our directors will be presented under the captions “Independence of the Board of Directors” in the “Proposal Election of Directors” and “Certain Relationships and Related Transactions” in the Proxy Statement. That information is incorporated here by reference.
| Item 14. | Principal Accounting Fees and Services |
The information required by this item will be included under the caption “Principal Accountant Fees and Services” in the “Proposal—Ratification of Independent Auditors” in the Proxy Statement. That information is incorporated here by reference.
41
Table of Contents
| Item 15. | Exhibits and Financial Statement Schedules |
| (a) | The following financial statements are filed as part of this report: |
1. Financial Statements
| Page | ||
| 43 | ||
| Consolidated Financial Statements: |
||
| 45 | ||
| Statements of Operations for the years ended December 31, 2009, 2008 and 2007 |
46 | |
| 47 | ||
| Statements of Cash Flows for the years ended December 31, 2009, 2008 and 2007 |
48 | |
| 49 |
2. Financial Statement Schedules
| 73 |
All other schedules are omitted because they are not required or the required information is shown in the financial statements or notes thereto.
3. Exhibits
See the Exhibit Index which follows the signature page of this Annual Report on Form 10-K, which is incorporated here by reference.
42
Table of Contents
REPORT OF INDEPENDENT REGISTERED PUBLIC ACCOUNTING FIRM
The Board of Directors and Stockholders
iPass Inc.:
We have audited the accompanying consolidated balance sheets of iPass Inc., and subsidiaries (the Company) as of December 31, 2009 and December 31, 2008, and the related consolidated statements of operations, stockholders’ equity and comprehensive loss, and cash flows for each of the years in the three-year period ended December 31, 2009. In connection with our audits of the consolidated financial statements, we also have audited financial statement schedule II as set forth under Item 15. We also have audited the Company’s internal control over financial reporting as of December 31, 2009, based on criteria established in Internal Control—Integrated Framework issued by the Committee of Sponsoring Organizations of the Treadway Commission (COSO). The Company’s management is responsible for these consolidated financial statements and financial statement schedule, for maintaining effective internal control over financial reporting, and for its assessment of the effectiveness of internal control over financial reporting, included in the accompanying Management’s Report on Internal Control over Financial Reporting appearing under Item 9A. Our responsibility is to express an opinion on these consolidated financial statements and financial statement schedule and an opinion on the Company’s internal control over financial reporting based on our audits.
We conducted our audits in accordance with the standards of the Public Company Accounting Oversight Board (United States). Those standards require that we plan and perform the audits to obtain reasonable assurance about whether the financial statements are free of material misstatement and whether effective internal control over financial reporting was maintained in all material respects. Our audits of the consolidated financial statements included examining, on a test basis, evidence supporting the amounts and disclosures in the financial statements, assessing the accounting principles used and significant estimates made by management, and evaluating the overall financial statement presentation. Our audit of internal control over financial reporting included obtaining an understanding of internal control over financial reporting, assessing the risk that a material weakness exists, and testing and evaluating the design and operating effectiveness of internal control based on the assessed risk. Our audits also included performing such other procedures as we considered necessary in the circumstances. We believe that our audits provide a reasonable basis for our opinions.
A company’s internal control over financial reporting is a process designed to provide reasonable assurance regarding the reliability of financial reporting and the preparation of financial statements for external purposes in accordance with generally accepted accounting principles. A company’s internal control over financial reporting includes those policies and procedures that (1) pertain to the maintenance of records that, in reasonable detail, accurately and fairly reflect the transactions and dispositions of the assets of the company; (2) provide reasonable assurance that transactions are recorded as necessary to permit preparation of financial statements in accordance with generally accepted accounting principles, and that receipts and expenditures of the company are being made only in accordance with authorizations of management and directors of the company; and (3) provide reasonable assurance regarding prevention or timely detection of unauthorized acquisition, use, or disposition of the company’s assets that could have a material effect on the financial statements.
Because of its inherent limitations, internal control over financial reporting may not prevent or detect misstatements. Also, projections of any evaluation of effectiveness to future periods are subject to the risk that controls may become inadequate because of changes in conditions, or that the degree of compliance with the policies or procedures may deteriorate.
In our opinion, the consolidated financial statements referred to above present fairly, in all material respects, the financial position of iPass Inc., and subsidiaries as of December 31, 2009 and December 31, 2008, and the results of their operations and their cash flows for each of the years in the three-year period ended December 31, 2009, in conformity with U.S. generally accepted accounting principles. Also in our opinion, the related financial statement schedule, when considered in relation to the basic consolidated financial statements taken as a whole,
43
Table of Contents
presents fairly, in all material respects, the information set forth therein. Also in our opinion, the Company maintained, in all material respects, effective internal control over financial reporting as of December 31, 2009, based on criteria established in Internal Control—Integrated Framework issued by the Committee of Sponsoring Organizations of the Treadway Commission.
As discussed in note 2 to the consolidated financial statements, the Company changed its method of accounting for uncertainty in income taxes in 2007 resulting from the adoption of a new accounting pronouncement.
/s/ KPMG LLP
Mountain View, California
March 15, 2010
44
Table of Contents
CONSOLIDATED BALANCE SHEETS
(In thousands, except share and per share amounts)
| As of December 31, | ||||||||
| 2009 | 2008 | |||||||
| ASSETS |
||||||||
| Current assets: |
||||||||
| Cash and cash equivalents |
$ | 37,973 | $ | 33,077 | ||||
| Short-term investments |
3,799 | 35,309 | ||||||
| Accounts receivable, net of allowance for doubtful accounts of $1,140 and $927 in 2009 and 2008, respectively |
27,023 | 33,756 | ||||||
| Prepaid expenses and other current assets |
7,726 | 7,326 | ||||||
| Total current assets |
76,521 | 109,468 | ||||||
| Property and equipment, net |
5,044 | 7,201 | ||||||
| Intangible assets, net |
836 | 2,216 | ||||||
| Other assets |
7,162 | 6,443 | ||||||
| Total assets |
$ | 89,563 | $ | 125,328 | ||||
| LIABILITIES AND STOCKHOLDERS’ EQUITY |
||||||||
| Current liabilities: |
||||||||
| Accounts payable |
$ | 15,179 | $ | 15,406 | ||||
| Accrued liabilities |
18,491 | 12,176 | ||||||
| Deferred revenue, short-term |
5,181 | 5,736 | ||||||
| Total current liabilities |
38,851 | 33,318 | ||||||
| Deferred revenue, long-term |
1,764 | 1,958 | ||||||
| Other long-term liabilities |
962 | 255 | ||||||
| Total liabilities |
41,577 | 35,531 | ||||||
| Commitments and contingencies (Note 13) |
||||||||
| Stockholders’ equity: |
||||||||
| Common stock, $0.001 par value (250,000,000 shares authorized; 61,538,187 and 61,251,523 shares issued and outstanding as of December 31, 2009 and 2008, respectively) |
62 | 61 | ||||||
| Additional paid-in capital |
214,056 | 242,160 | ||||||
| Accumulated other comprehensive income |
— | 216 | ||||||
| Accumulated deficit |
(166,132 | ) | (152,640 | ) | ||||
| Total stockholders’ equity |
47,986 | 89,797 | ||||||
| Total liabilities and stockholders’ equity |
$ | 89,563 | $ | 125,328 | ||||
The accompanying notes are an integral part of these consolidated financial statements.
45
Table of Contents
CONSOLIDATED STATEMENTS OF OPERATIONS
(In thousands, except share and per share amounts)
| For the Year Ended December 31, | ||||||||||||
| 2009 | 2008 | 2007 | ||||||||||
| Revenues |
$ | 171,377 | $ | 191,368 | $ | 191,732 | ||||||
| Cost of revenues and operating expenses: |
||||||||||||
| Network access |
73,937 | 81,961 | 69,143 | |||||||||
| Network operations |
29,444 | 32,413 | 31,962 | |||||||||
| Research and development |
14,362 | 16,381 | 21,141 | |||||||||
| Sales and marketing |
29,968 | 41,140 | 52,809 | |||||||||
| General and administrative |
28,337 | 23,619 | 23,654 | |||||||||
| Restructuring and other charges |
8,147 | 858 | 3,167 | |||||||||
| Amortization of intangible assets |
1,380 | 3,901 | 4,201 | |||||||||
| Impairment of goodwill and long-lived assets |
— | 84,494 | — | |||||||||
| Total operating expenses |
185,575 | 284,767 | 206,077 | |||||||||
| Operating loss |
(14,198 | ) | (93,399 | ) | (14,345 | ) | ||||||
| Interest income |
613 | 2,003 | 3,395 | |||||||||
| Foreign exchange gains (losses) and other income (expenses), net |
(581 | ) | (1,153 | ) | (113 | ) | ||||||
| Loss before income taxes |
(14,166 | ) | (92,549 | ) | (11,063 | ) | ||||||
| Provision for (benefit from) income taxes |
(674 | ) | (581 | ) | 23,151 | |||||||
| Net loss |
$ | (13,492 | ) | $ | (91,968 | ) | $ | (34,214 | ) | |||
| Basic and diluted net loss per share |
$ | (0.22 | ) | $ | (1.50 | ) | $ | (0.54 | ) | |||
| Number of shares used in per share calculations |
62,032,897 | 61,179,969 | 62,828,202 | |||||||||
The accompanying notes are an integral part of these consolidated financial statements.
46
Table of Contents
CONSOLIDATED STATEMENTS OF STOCKHOLDERS’ EQUITY AND COMPREHENSIVE LOSS
(In thousands)
| Common Stock | Additional Paid-In Capital |
Accumulated Comprehensive Income (Loss) |
Accumulated Deficit |
Total Stockholders’ Equity |
Comprehensive Income (Loss) |
||||||||||||||||||||||
| Shares | Amount | ||||||||||||||||||||||||||
| Balances, December 31, 2006 |
63,468 | $ | 63 | $ | 247,882 | $ | (98 | ) | $ | (26,458 | ) | $ | 221,389 | $ | (7,880 | ) | |||||||||||
| Exercise of stock options—common stock issued |
473 | 1 | 879 | — | — | 880 | — | ||||||||||||||||||||
| Restricted stock vested |
42 | — | — | — | — | — | — | ||||||||||||||||||||
| Employee stock purchase plan—common stock issued |
425 | 1 | 1,822 | — | — | 1,823 | — | ||||||||||||||||||||
| Outstanding common stock repurchased |
(2,595 | ) | (3 | ) | (13,798 | ) | — | — | (13,801 | ) | — | ||||||||||||||||
| Stock-based compensation |
— | — | 4,918 | — | — | 4,918 | — | ||||||||||||||||||||
| Change in net unrealized gain on available-for-sale investments |
— | — | — | 113 | — | 113 | 113 | ||||||||||||||||||||
| Net loss |
— | — | — | — | (34,214 | ) | (34,214 | ) | (34,214 | ) | |||||||||||||||||
| Balances, December 31, 2007 |
61,813 | $ | 62 | $ | 241,703 | $ | 15 | $ | (60,672 | ) | $ | 181,108 | $ | (34,101 | ) | ||||||||||||
| Exercise of stock options—common stock issued |
123 | — | 90 | — | — | 90 | — | ||||||||||||||||||||
| Restricted stock vested |
375 | — | — | — | — | — | — | ||||||||||||||||||||
| Employee stock purchase plan—common stock issued |
254 | — | 541 | — | — | 541 | — | ||||||||||||||||||||
| Outstanding common stock repurchased |
(1,313 | ) | (1 | ) | (3,672 | ) | — | — | (3,673 | ) | — | ||||||||||||||||
| Stock-based compensation |
— | — | 3,794 | — | — | 3,794 | — | ||||||||||||||||||||
| Acceleration of stock-based compensation included in restructuring and other expense |
— | — | 243 | — | — | 243 | — | ||||||||||||||||||||
| APIC pool adjustment |
— | — | (539 | ) | — | — | (539 | ) | — | ||||||||||||||||||
| Change in net unrealized gain on available-for-sale investments |
— | — | — | 201 | — | 201 | 201 | ||||||||||||||||||||
| Net loss |
— | — | — | — | (91,968 | ) | (91,968 | ) | (91,968 | ) | |||||||||||||||||
| Balances, December 31, 2008 |
61,252 | $ | 61 | $ | 242,160 | $ | 216 | $ | (152,640 | ) | $ | 89,797 | $ | (91,767 | ) | ||||||||||||
| Exercise of stock options—common stock issued |
62 | 1 | 36 | — | — | 37 | — | ||||||||||||||||||||
| Restricted stock granted (1) |
975 | — | — | — | — | — | — | ||||||||||||||||||||
| Restricted stock cancelled |
(157 | ) | — | — | — | — | — | — | |||||||||||||||||||
| Employee stock purchase plan—common stock issued |
156 | 1 | 160 | — | — | 161 | — | ||||||||||||||||||||
| Outstanding common stock repurchased |
(750 | ) | (1 | ) | (820 | ) | — | — | (821 | ) | — | ||||||||||||||||
| Stock-based compensation |
— | — | 2,316 | — | — | 2,316 | — | ||||||||||||||||||||
| Return of capital |
— | — | (29,796 | ) | — | — | (29,796 | ) | — | ||||||||||||||||||
| Change in net unrealized gain on available-for-sale investments |
— | — | — | (216 | ) | — | (216 | ) | (216 | ) | |||||||||||||||||
| Net loss |
— | — | — | — | (13, 492 | ) | (13,492 | ) | (13,492 | ) | |||||||||||||||||
| Balances, December 31, 2009 |
61,538 | 62 | $ | 214,056 | — | $ | (166,132 | ) | $ | 47,986 | $ | (13,708 | ) | ||||||||||||||
| (1) | Restricted stock awards granted includes 905,000 unvested restricted stock awards that were granted and considered outstanding in prior years, but were not included in shares outstanding in the prior years. |
The accompanying notes are an integral part of these consolidated financial statements.
47
Table of Contents
CONSOLIDATED STATEMENTS OF CASH FLOWS
(In thousands)
| For the Year Ended December 31, | ||||||||||||
| 2009 | 2008 | 2007 | ||||||||||
| Cash flows from operating activities: |
||||||||||||
| Net loss |
$ | (13,492 | ) | $ | (91,968 | ) | $ | (34,214 | ) | |||
| Adjustments to reconcile net loss to net cash provided by (used in) operating activities: |
||||||||||||
| Stock compensation |
2,316 | 3,794 | 4,918 | |||||||||
| Acceleration of stock compensation included in restructuring and other expense |
— | 243 | — | |||||||||
| Amortization of intangible assets |
1,380 | 3,901 | 4,201 | |||||||||
| Depreciation, amortization and accretion |
4,562 | 5,533 | 4,414 | |||||||||
| Loss on disposal of property and equipment |
56 | 25 | 1,149 | |||||||||
| Impairment of goodwill and long-lived assets |
— | 84,494 | — | |||||||||
| Non-cash restructuring charges |
296 | — | — | |||||||||
| Deferred income taxes |
(83 | ) | (180 | ) | 22,310 | |||||||
| Provision for doubtful accounts |
1,687 | 717 | 29 | |||||||||
| Realized (gain) loss on investments, net |
— | (29 | ) | 52 | ||||||||
| Changes in operating assets and liabilities: |
||||||||||||
| Accounts receivable |
5,046 | 1,465 | (7,388 | ) | ||||||||
| Prepaid expenses and other current assets |
(454 | ) | (109 | ) | (775 | ) | ||||||
| Other assets |
(729 | ) | (1,066 | ) | (62 | ) | ||||||
| Accounts payable |
(587 | ) | (781 | ) | 1,093 | |||||||
| Accrued liabilities |
6,315 | (4,394 | ) | (2,747 | ) | |||||||
| Deferred revenue |
(749 | ) | 139 | 676 | ||||||||
| Other liabilities |
707 | (785 | ) | (929 | ) | |||||||
| Net cash provided by (used in) operating activities |
6,271 | 999 | (7,273 | ) | ||||||||
| Cash flows from investing activities: |
||||||||||||
| Purchases of short-term investments |
(42,981 | ) | (230,192 | ) | (440,294 | ) | ||||||
| Maturities of short-term investments |
74,135 | 199,378 | 520,658 | |||||||||
| Purchases of property and equipment |
(2,110 | ) | (4,551 | ) | (5,108 | ) | ||||||
| Restricted cash pledged for letter of credit |
— | (422 | ) | (1,470 | ) | |||||||
| Net cash provided by (used in) investing activities |
29,044 | (35,787 | ) | 73,786 | ||||||||
| Cash flows from financing activities: |
||||||||||||
| Proceeds from issuance of common stock |
198 | 631 | 2,703 | |||||||||
| Return of capital |
(29,796 | ) | — | — | ||||||||
| Cash used in repurchase of common stock |
(821 | ) | (3,673 | ) | (13,801 | ) | ||||||
| Net cash used in financing activities |
(30,419 | ) | (3,042 | ) | (11,098 | ) | ||||||
| Net increase (decrease) in cash and cash equivalents |
4,896 | (37,830 | ) | 55,415 | ||||||||
| Cash and cash equivalents at beginning of year |
33,077 | 70,907 | 15,492 | |||||||||
| Cash and cash equivalents at end of year |
$ | 37,973 | $ | 33,077 | $ | 70,907 | ||||||
| Supplemental disclosures of cash flow information: |
||||||||||||
| Cash paid for taxes |
$ | 453 | $ | 727 | $ | 929 | ||||||
| Non-cash investing and financing activities: |
||||||||||||
| Stock-based payment APIC pool adjustment |
— | 539 | — | |||||||||
| Accrued amounts for acquisition of property and equipment |
624 | 264 | — | |||||||||
The accompanying notes are an integral part of these consolidated financial statements.
48
Table of Contents
NOTES TO CONSOLIDATED FINANCIAL STATEMENTS
Note 1. Description of Business
iPass Inc. (“the Company” or “iPass”) offers enterprise mobility services on a global basis by providing services that simply, smartly and openly facilitate network access from mobile devices while providing the enterprise with visibility and control over their mobile ecosystem. The Company also offers managed network services for enterprise remote and branch office connectivity in North America. The Company was incorporated in California in July 1996 and reincorporated in Delaware in June 2000. Our principal executive offices are located in Redwood Shores, California.
Note 2. Summary of Significant Accounting Policies
Principles of Consolidation and Basis of Presentation
The consolidated financial statements include the accounts of iPass Inc. and its wholly-owned subsidiaries. Intercompany transactions and balances have been eliminated.
Certain prior period amounts have been reclassified from network operations to general and administrative expense for 2008 and 2007 to conform to the 2009 presentation in the Consolidated Statements of Operations. Specifically, the Company determined that certain internal IT costs were more appropriately classified as general and administrative costs rather than network operations cost. These internal IT costs totaled $2.6 million during 2009 and the Company reclassified $2.4 million and $2.3 million from network operations to General and Administrative in 2008 and 2007, respectively.
Use of Estimates
The preparation of consolidated financial statements in conformity with accounting principles generally accepted in the United States of America (“GAAP”) requires management to make estimates and assumptions about future events. These estimates and the underlying assumptions affect the amounts of assets and liabilities reported, disclosure about contingent assets and liabilities, and reported amounts of revenues and expenses. Such estimates include valuation of accounts receivables, inventories, intangible assets, other long-lived assets, legal contingencies, and assumptions used in the calculation of income taxes, sales tax liabilities, and restructuring costs, among others. These estimates and assumptions are based on management’s best estimates and judgment. Management evaluates its estimates and assumptions on an ongoing basis using historical experience and other factors, including the current economic environment, which management believes to be reasonable under the circumstances. Management adjusts such estimates and assumptions when facts and circumstances dictate. As future events and their effects cannot be determined with precision, actual results could differ significantly from these estimates. Changes in those estimates resulting from, for example, changes in the economic environment will be reflected in the financial statements in future periods.
Foreign Currency
The U.S. dollar is the functional currency for all of the Company’s foreign subsidiaries. Monetary assets and liabilities are re-measured to U.S. dollars using current exchange rates in effect at the balance sheet date; non-monetary assets and liabilities are re-measured at historical exchange rates and revenues and expenses are re-measured using average exchange rates during the period. Resulting foreign exchange gains and losses and transactional foreign exchange gains and losses are included in other income and expense on the Consolidated Statements of Operations. For the years ended December 31, 2009, 2008, and 2007, respectively, foreign exchange losses were $0.6 million, $1.1 million, and $0.2 million.
49
Table of Contents
iPASS INC.
NOTES TO CONSOLIDATED FINANCIAL STATEMENTS—(Continued)
Comprehensive Loss
Comprehensive loss is a measure of all changes in equity of an enterprise that result from transactions and other economic events of the period other than transactions with stockholders. Comprehensive loss is the total of net loss and all other non-owner changes in equity. Comprehensive loss includes any net gain or (loss) and unrealized gains (losses) on available-for-sale securities.
Comprehensive loss is comprised of the following (in thousands):
| Year Ended December 31, | ||||||||||||
| 2009 | 2008 | 2007 | ||||||||||
| Net loss |
$ | (13,492 | ) | $ | (91,968 | ) | $ | (34,214 | ) | |||
| Changes in unrealized gains (losses) on available-for- sale securities, net of related tax effects |
(216 | ) | 201 | 113 | ||||||||
| Total comprehensive loss |
$ | (13,708 | ) | $ | (91,767 | ) | $ | (34,101 | ) | |||
Cash Equivalents
All highly-liquid investments with a remaining maturity of three months or less at the time of purchase are considered to be cash equivalents. Cash equivalents consist primarily of investments in institutional money market funds.
Short-term Investments
Short-term investments are comprised of fixed income securities with maturities of 12 months or less and are classified as available-for-sale at the respective balance sheet dates. Investments classified as available-for-sale are recorded at fair value based upon quoted market prices, and any temporary difference between the cost and fair value of an investment is presented as a separate component of accumulated other comprehensive income (loss). The specific identification method is used to determine the gains and losses on investments.
Restricted Cash
The Company’s restricted cash consists of cash deposited with Silicon Valley Bank in connection with an irrevocable letter of credit issued to a network service provider. The total amount of restricted cash was $1.9 million at December 31, 2009 and 2008 and is classified within other assets on the Consolidated Balance Sheets at December 31, 2009 and 2008.
Concentrations of Risk
Financial instruments that potentially subject the Company to significant concentrations of credit risk consist principally of cash, cash equivalents, investments and accounts receivable. Substantially all of the Company’s cash, cash equivalents and short-term investments are held by two financial institutions. The Company is exposed to risk in the event of default by these financial institutions or the issuers of these securities to the extent the balances are in excess of amounts that are insured by the FDIC.
The Company’s receivables are derived from revenue earned from customers located primarily in the United States and Europe. The Company provides credit to its customers in the normal course of business and requires
50
Table of Contents
iPASS INC.
NOTES TO CONSOLIDATED FINANCIAL STATEMENTS—(Continued)
no collateral to secure accounts receivable. The Company maintains an allowance for potentially uncollectible accounts receivable based on its assessment of the collectability of accounts receivable. The allowance for doubtful accounts is based on customer-specific identification, which encompasses various factors, including; the Company’s review of credit profiles of its customers, age of the accounts receivable balances, contractual terms and conditions, current economic conditions that may affect a customer’s ability to pay and historical payment experience.
As of December 31, 2009 and 2008, no individual customer represented 10% or more of accounts receivable. For the years ended December 31, 2009, 2008 and 2007, no individual customer represented more than 10% of total revenues.
For the years ended December 31, 2009, 2008 and 2007, no individual supplier represented 10% or more of total network access expenses.
Property and Equipment
Property and equipment are recorded at cost. Depreciation of property and equipment and amortization of leasehold improvements is calculated over the estimated useful lives of the related assets using the straight-line method. Estimated useful lives for financial reporting purposes are as follows:
| • | Equipment: 3 years. |
| • | Furniture and fixtures: 5 years. |
| • | Computer software: 3 years. |
| • | Leasehold improvements: the shorter of the useful life of the leasehold improvements or the term of the underlying lease (leases expire at various dates extending through October 2016). |
The Company reviews long-lived assets for impairment whenever events or changes in circumstances indicate that the carrying amount of an asset or asset group may not be recoverable. An asset is considered impaired if its carrying amount exceeds the undiscounted future net cash flows the asset is expected to generate. If an asset or asset group is considered to be impaired, the impairment to be recognized is measured by the amount by which the carrying amount of the asset exceeds its fair value.
Goodwill and Other Intangibles
The Company amortizes intangible assets with finite lives over their estimated useful life. The Company periodically evaluates the carrying amount of its intangible assets when events or changes in business circumstances have occurred which indicate the carrying amount of such assets may not be fully realizable. Determination of impairment is based on an estimate of undiscounted future cash flows resulting from the use of the assets and their eventual disposition. If the Company determines these assets have been impaired, an impairment charge is recorded based on the amount that the net book value exceeds the fair value.
Goodwill is not amortized, but rather is tested for impairment annually in the Company’s fourth quarter, or more frequently if there are changes in facts and circumstances indicating that the fair value may be less than its carrying amount. In performing its annual impairment analysis of goodwill during the fourth quarter of 2008, the Company determined that the full carrying value of goodwill was impaired and recorded an impairment charge of $79.8 million. In conjunction with the goodwill impairment testing, the Company also analyzed the fair values of its intangible assets and concluded that certain of those assets were also impaired resulting in an additional $3.4 million impairment charge. Both impairment charges were recognized during the year ended December 31, 2008.
51
Table of Contents
iPASS INC.
NOTES TO CONSOLIDATED FINANCIAL STATEMENTS—(Continued)
Income Taxes
Income taxes are accounted for under the asset and liability method. Deferred tax assets and liabilities are recognized for the future tax consequences attributable to differences between the financial statement carrying amounts of existing assets and liabilities and their respective tax bases and operating loss and tax credit carryforwards. Deferred tax assets and liabilities are measured using enacted tax rates expected to apply to taxable income in the years in which those temporary differences are expected to be recovered or settled. The effect on deferred tax assets and liabilities of a change in tax rates is recognized as income in the period that includes the enactment date.
The Company’s policy with respect to its undistributed foreign subsidiaries’ earnings is to consider those earnings to be indefinitely reinvested and, accordingly, no related provision for U.S. federal and state income taxes has been provided. The major foreign jurisdictions where the Company has operations includes India and the U.K. Upon distribution of those earnings in the form of dividends or otherwise, the Company may be subject to both U.S. income taxes (subject to an adjustment for foreign tax credits) and withholding taxes in the various foreign countries. At December 31, 2009, the cumulative undistributed earnings approximated $8.1 million.
The Company records net deferred tax assets to the extent management believed these assets would more likely than not be realized. In making such determination, management considers all available positive and negative evidence, including scheduled reversals of deferred tax liabilities, projected future taxable income, tax planning strategies and recent financial operations. In the event management was to determine that the Company would be able to realize the deferred income tax assets in the future in excess of their net recorded amount, the Company would make an adjustment to the valuation allowance which would reduce the provision for income taxes.
The Company recognizes interest and penalties relating to income taxes as a component of the provision for income taxes.
Stock-Based Compensation
Stock-based compensation expense is estimated at the grant date based on the award’s fair value and is recognized as expense over the award’s requisite service period on a straight-line basis. Fair value for restricted stock awards is determined by the stock’s closing price on the grant date. The fair value of stock options and employee purchase rights granted in connection with the Employee Stock Purchase Plan is determined using the Black-Scholes option-pricing model. The expected volatility of stock price is based on historical volatility and is an input into the option-pricing model. The expected term is based on the historical average term and is an input into the option-pricing model. An expected forfeiture rate is applied to stock options and restricted stock awards and expense is recognized for those shares expected to vest. The expected forfeiture rate is based upon historical experience of employee turnover and other factors. To the extent the actual forfeiture rate is different from the expected rate, stock-based compensation expense is adjusted accordingly.
Revenue Recognition
The Company derives its revenues from broadband and dial-up network access services, managed network services and other services and fees. The Company sells these services directly, as well as indirectly through its channel partners. Approximately 50% of network access service is billed based on a fixed charge per user per month and remaining service is billed based on actual network usage. Substantially all enterprise customers commit to a one to three-year contract term.
52
Table of Contents
iPASS INC.
NOTES TO CONSOLIDATED FINANCIAL STATEMENTS—(Continued)
Usage Fees
The Company derives the majority of its revenues from broadband usage fees, which includes fees for mobility and managed network services, and also from dial-up usage fees. The Company recognizes revenues when persuasive evidence of an arrangement exists, service has been provided to the customer, the price to the customer is fixed or determinable, and collection is reasonably assured.
The Company recognizes revenues for usage fees during the period the services are rendered to end users based on usage or a flat fee. The Company typically requires customers to commit to minimum usage levels if fees are based on usage.
Managed network services (“MNS”) contracts are monthly flat fee contracts bundled with certain other upfront fees such as, one-time non-recurring fees, which include equipment fees, installation, management set up, and shipping fees. The monthly flat usage fee is recognized on a monthly basis, while other fees are recognized ratably over the estimated life of the end point. An end point represents a separate physical location, such as a branch office, a retail office or a virtual office. End point lives are estimated based on historical average end point life by product group. The Company periodically performs an analysis of estimated lives of the end points and revises the remaining term over which revenue will be recognized, if needed.
Services and Other Fees
The Company’s service and other fees consist primarily of minimum monthly commitment (“MMC”) fees, iPassConnect (“IPC”) service fees, annual business fees, end of life fees and professional services fees.
For customers that have agreed to a minimum monthly commitment in connection with either broadband or dial-up usage, such customer’s monthly invoice reflects the greater of the customer’s actual usage during the month or the customer’s MMC for that month. If the MMC exceeds actual usage (a “Shortfall”), the Company determines whether the Shortfall is fixed or determinable in accordance with the revenue recognition criteria. If the Company concludes that the Shortfall is fixed or determinable, based upon customer specific billing history, and other recognition criteria have been met, the Company recognizes as revenue the amount of Shortfall which is invoiced. If the customer is in a Shortfall situation and it is determined that the Shortfall is not fixed or determinable, the Company recognizes revenue only when the shortfall is collected.
IPC services are any services that allow a user to connect to a network using the Company’s software. Fees for this service are typically based upon a monthly rate, and revenue is recognized during the month the services are provided.
Annual business fees represent subscription fees which are charged to customers on an annual basis. These fees are recognized ratably over the contract term.
Deferred revenue
The Company defers revenue for services that are billed in advance or prepaid as required per customer agreements. Revenue is recognized as the services are being performed, or ratably over the contract term, depending on the nature of the service, such as maintenance, annual business fees and certain professional services. Amounts expected to be recognized as revenue within one year are classified as short-term.
53
Table of Contents
iPASS INC.
NOTES TO CONSOLIDATED FINANCIAL STATEMENTS—(Continued)
Network Access Costs
Network access costs represent the amounts paid to network access providers for the usage of their networks. The Company has minimum purchase commitments with some network service providers for access that it expects to utilize during the term of the contracts. Costs of minimum purchase contracts are recognized as network access costs at the greater of the minimum commitment or actual usage.
Advertising Expenses
Advertising and promotional costs are expensed as incurred. For the years ended December 31, 2009, 2008 and 2007 these costs totaled approximately $0.1 million, $45,000 and $0.3 million, respectively.
Software Development Costs
Software development costs are capitalized beginning when a product’s technological feasibility has been established by completion of a working model of the product and amortization begins when a product is available for general release to customers. The period between the achievement of technological feasibility and the general release of products has typically been of short duration and costs incurred during this period have not been material. Accordingly, the Company had no software development costs capitalized on its Consolidated Balance Sheet as of December 31, 2009.
Recent Accounting Pronouncements
Effective January 1, 2009, the Company adopted the guidance for determining whether instruments granted in share-based payment transactions are participating securities and, therefore, should be included in computing earnings per share pursuant to the two-class method. The two-class method determines earnings per share for each class of common stock and participating securities according to dividends or dividend equivalents and their respective participating rights in undistributed earnings. Restricted stock awards granted to employees are considered participating securities as they receive rights to non-forfeitable dividends or dividend equivalents at the same rate as common stockholders. However, given the Company’s net loss for the period, the Company’s losses were not allocated to the participating securities as the participating securities do not have a contractual obligation to share in the Company’s losses. The participating securities have been excluded in determining basic and diluted EPS because the effect is anti-dilutive.
In October 2009, the Financial Accounting Standards Board (“FASB”) issued new revenue recognition standards for arrangements with multiple deliverables. The new standards permit entities to initially use management’s best estimate of selling price to value individual deliverables when those deliverables do not have VSOE of fair value or when third-party evidence is not available. Additionally, these new standards modify the manner in which the transaction consideration is allocated across the separately identified deliverables by no longer permitting the residual method of allocating arrangement consideration. These new standards are effective for annual periods ending after June 15, 2010 and are effective for the Company beginning in the first quarter of fiscal 2011, however early adoption is permitted. We are currently evaluating the impact of adopting these new standards on our consolidated financial position, results of operations and cash flows, including possible early adoption.
Note 3. Financial Instruments and Fair Value
On January 1, 2008, the Company adopted authoritative guidance for fair value measurements and the fair value option for financial assets and liabilities. This authoritative guidance defines fair value, establishes a framework for measuring fair value and enhances disclosure requirements for fair value measurements. Fair
54
Table of Contents
iPASS INC.
NOTES TO CONSOLIDATED FINANCIAL STATEMENTS—(Continued)
value is defined under this authoritative guidance as the exchange price that would be received for an asset, or paid to transfer a liability (an exit price), in the principal or most advantageous market for the asset or liability in an orderly transaction between market participants on the measurement date. Valuation techniques used to measure fair value under this guidance must maximize the use of observable inputs and minimize the use of unobservable inputs. This authoritative guidance describes a fair value hierarchy based on three levels of inputs, of which the first two are considered observable and the last is considered unobservable, which may be used to measure fair value:
| • | Level 1—Quoted prices in active markets for identical assets or liabilities; |
| • | Level 2—Observable inputs other than Level 1 either directly or indirectly, such as quoted prices for similar assets or liabilities; quoted prices in markets that are not active; or other inputs that are observable or can be corroborated by observable market data for substantially the full term of the assets or liabilities; and |
| • | Level 3—Represents financial assets whose fair value is determined based upon inputs that are unobservable, including the Company’s own determinations of the assumptions that a market participant would use in pricing the asset or liability. The Company currently does not own any assets measured as Level 3 assets. |
The Company’s investments are comprised primarily of fixed income securities that are classified as available-for-sale and recorded at their fair value. In general, investments with remaining effective maturities of 12 months or less from the balance sheet date are classified as short-term investments. Investments with remaining effective maturities of more than 12 months from the balance sheet date are classified as long-term investments. The Company generally obtains all pricing information from its investment manager and financial institutions.
Unrealized gains and temporary losses on investments classified as available-for-sale are included within accumulated other comprehensive income (loss), net of any related tax effect. Upon realization, those amounts are reclassified from accumulated other comprehensive income (loss) to the Consolidated Statement of Operations.
The fair value of these financial assets (excluding cash) and nonfinancial liabilities were determined using the following inputs at December 31, 2009 (in thousands):
| Fair Value Measurements at Reporting Date Using | ||||||||||||
| Total | Quoted Prices in Active Markets for Identical Assets (Level 1) |
Significant Other Observable Inputs (Level 2) |
Significant Unobservable Inputs (Level 3) | |||||||||
| Financial assets: |
||||||||||||
| Money market funds(1) |
$ | 24,932 | $ | 24,932 | $ | — | $ | — | ||||
| Fixed income available-for-sale securities(2) |
$ | 3,799 | $ | — | $ | 3,799 | $ | — | ||||
| Total financial assets |
$ | 28,731 | $ | 24,932 | $ | 3,799 | $ | — | ||||
| Nonfinancial liabilities: |
||||||||||||
| Lease liabilities incurred in connection with the restructuring plan(3) |
$ | 2,091 | $ | — | $ | — | $ | 2,091 | ||||
| Total nonfinancial liabilities |
$ | 2,091 | $ | — | $ | — | $ | 2,091 | ||||
| (1) | Included in cash and cash equivalents on the Company’s consolidated balance sheet. |
| (2) | Fixed income available-for-sale securities include government agency discount notes (71% of total) and corporate fixed income securities (29% of total). |
55
Table of Contents
iPASS INC.
NOTES TO CONSOLIDATED FINANCIAL STATEMENTS—(Continued)
| (3) | Lease liabilities were recorded at fair value and are included in other liabilities in the Company’s consolidated balance sheet. The lease liability was recorded in connection with the lease abandonment plans implemented in the first quarter and fourth quarter of 2009 (see Note 8 for further discussion of the restructuring plan). Management made assumptions in determining the fair value of the lease liability. Inputs to the present value technique to determine fair value included observable inputs, such as the future rent payment schedule, the discount rate and sublease income through the end of the lease term. However, the assumption about when the Company will be able to sublease its facility is considered to be a significant unobservable input. Management considered 12 months to be a reasonable period of time to sublease its facilities based on current market trends. |
The carrying amount of accounts receivable, prepaids and other assets, accounts payable and accrued liabilities, closely approximates fair value as of December 31, 2009 and 2008.
Note 4. Short-Term Investments
The following tables summarize the Company’s short-term investments by security type as of December 31, 2009 and 2008 (in thousands):
| As of December 31, 2009 |
Cost | Gross Unrealized Gains |
Gross Unrealized Losses |
Estimated Fair Value | |||||||||
| Commercial paper |
$ | 1,100 | $ | — | $ | (1 | ) | $ | 1,099 | ||||
| Federal agency discount notes |
2,699 | 1 | — | 2,700 | |||||||||
| Total short-term investments |
$ | 3,799 | $ | 1 | $ | (1 | ) | $ | 3,799 | ||||
As of December 31, 2009, the Company has no short-term investments with maturity dates beyond December 31, 2010.
| As of December 31, 2008 |
Cost | Gross Unrealized Gains |
Gross Unrealized Losses |
Estimated Fair Value | |||||||||
| Commercial paper |
$ | 7,726 | $ | 17 | $ | — | $ | 7,743 | |||||
| Commercial paper guaranteed by government program |
1,638 | 5 | (1 | ) | 1,642 | ||||||||
| Federal agency discount notes |
21,258 | 159 | — | 21,417 | |||||||||
| U.S. Government securities |
4,479 | 28 | — | 4,507 | |||||||||
| Total short-term investments |
$ | 35,101 | $ | 209 | $ | (1 | ) | $ | 35,309 | ||||
Note 5. Property and Equipment
Property and equipment consisted of (in thousands):
| December 31, | ||||||||
| 2009 | 2008 | |||||||
| Equipment |
$ | 16,525 | $ | 15,240 | ||||
| Furniture and fixtures |
3,441 | 3,542 | ||||||
| Computer software |
8,065 | 7,425 | ||||||
| Leasehold improvements |
2,719 | 2,764 | ||||||
| 30,750 | 28,971 | |||||||
| Less: Accumulated depreciation and amortization |
(25,706 | ) | (21,770 | ) | ||||
| Property and equipment, net |
$ | 5,044 | $ | 7,201 | ||||
56
Table of Contents
iPASS INC.
NOTES TO CONSOLIDATED FINANCIAL STATEMENTS—(Continued)
Depreciation expense was approximately $4.4 million, $5.5 million and $5.2 million for the years ended December 31, 2009, 2008 and 2007, respectively.
In the fourth quarter of 2008, as part of the goodwill and long-lived assets impairment, the Company recorded a charge of approximately $1.3 million related to the impairment of certain long-lived assets.
Note 6. Intangible Assets
The following tables set forth the carrying amount of intangible assets that will continue to be amortized (in thousands):
| Year Ended December 31, 2009 | ||||||||||||
| Amortization Life | Gross Carrying Amount |
Accumulated Amortization |
Net Carrying Amount | |||||||||
| Existing technology |
4-8 yrs | $ | 5,375 | $ | (5,101 | ) | $ | 274 | ||||
| Patent and core technology |
4-8 yrs | 2,800 | (2,428 | ) | 372 | |||||||
| Maintenance agreements and certain relationships |
5 yrs | 400 | (344 | ) | 56 | |||||||
| Customer relationships |
4-7 yrs | 4,800 | (4,666 | ) | 134 | |||||||
| $ | 13,375 | $ | (12,539 | ) | $ | 836 | ||||||
| Year Ended December 31, 2008 | ||||||||||||
| Amortization Life | Gross Carrying Amount |
Accumulated Amortization |
Net Carrying Amount | |||||||||
| Existing technology |
4-8 yrs | $ | 5,375 | $ | (5,000 | ) | $ | 375 | ||||
| Patent and core technology |
4-8 yrs | 2,800 | (2,290 | ) | 510 | |||||||
| Maintenance agreements and certain relationships |
5 yrs | 400 | (278 | ) | 122 | |||||||
| Customer relationships |
4-7 yrs | 4,800 | (3,591 | ) | 1,209 | |||||||
| $ | 13,375 | $ | (11,159 | ) | $ | 2,216 | ||||||
Aggregate amortization expense was approximately $1.4 million, $3.9 million, and $4.2 million for 2009, 2008, and 2007, respectively.
The following table presents the estimated future amortization of intangible assets (in thousands):
| Year |
|||
| 2010 |
$ | 428 | |
| 2011 |
239 | ||
| 2012 |
169 | ||
| $ | 836 | ||
57
Table of Contents
iPASS INC.
NOTES TO CONSOLIDATED FINANCIAL STATEMENTS—(Continued)
Note 7. Accrued Liabilities
Accrued liabilities consisted of (in thousands):
| Year Ended December 31, | ||||||
| 2009 | 2008 | |||||
| Accrued sales tax liabilities(1) |
$ | 4,987 | $ | — | ||
| Accrued restructuring liabilities—current(2) |
3,619 | 800 | ||||
| Accrued expenses |
2,868 | 3,464 | ||||
| Accrued commissions payable |
1,963 | 2,700 | ||||
| Customer overpayment |
1,739 | 959 | ||||
| Accrued paid time off and other employee benefits |
1,448 | 1,870 | ||||
| Other accrued liabilities |
1,867 | 2,383 | ||||
| $ | 18,491 | $ | 12,176 | |||
| (1) | See Note 13. Commitments and Contingencies |
| (2) | See Note 8. Restructuring and Other |
Note 8. Restructuring and Other
In the fourth quarter of 2007, the Company announced a restructuring plan (the “Q4 2007 Plan”) to reduce its workforce by 72 positions and abandon certain facilities and capitalized assets. During the year ended December 31, 2007, the Company recorded total restructuring charges of approximately $3.2 million related to the Q4 2007 Plan. As of December 31, 2008, the Company finalized all of the employment terminations.
In the first quarter of 2009, the Company announced a restructuring plan (the “Q1 2009 Plan”) to reduce its workforce by 68 positions across all functional areas and abandon certain facilities, for which the lease terms extend through April 30, 2015. The Company has completed all terminations and during the year ended December 31, 2009, the Company recorded a total restructuring charge of approximately $4.3 million related to the Q1 2009 Plan.
In the fourth quarter of 2009, the Company announced a restructuring plan (the “Q4 2009 Plan”) to reduce its workforce by 78 positions, abandon certain additional facilities and terminate a contract obligation. During the year ended December 31, 2009, the Company recorded a restructuring charge of approximately $3.6 million related to Q4 2009 Plan. The Company expects to complete the workforce reductions by the end of the first quarter of 2010. The lease terms for the abandoned facilities expire in February 2012. The obligation for the terminated contract was paid during January 2010.
The liability for net excess facilities costs is recorded at fair value. Any difference between the fair value of the liability at the measurement date and the total cash liability is accreted ratably over the remaining lease term. This accretion cost is included as a restructuring charge in the Consolidated Statements of Operations. Total accretion related to the Q1 2009 Plan that will be recognized through April 2015 is $0.3 million with a remaining balance of $0.3 million as of December 31, 2009. In addition, total accretion related to facilities abandoned in the 2006 restructuring plan (the “Q4 2006 Plan”) that will be recognized through April 2010 is $0.5 million with a remaining balance of $0.1 million as of December 31, 2009.
58
Table of Contents
iPASS INC.
NOTES TO CONSOLIDATED FINANCIAL STATEMENTS—(Continued)
The following is a summary of restructuring activity of the Q1 2009 and Q4 2009 Plans by plan (in thousands):
Q1 2009 Plan
| Excess Facility Costs |
Severance Costs |
Contract Termination Costs |
Total Restructuring Accrual | ||||||
| Balance as of December 31, 2008 |
$ | — | — | — | — | ||||
| Restructuring charges |
2,988 | 1,258 | — | 4,246 | |||||
| Net present value accretion |
11 | — | — | 11 | |||||
| Payments |
(1,484) | (1,242) | — | (2,726) | |||||
| Balance as of December 31, 2009 |
$ | 1,515 | 16 | — | 1,531 | ||||
Q4 2009 Plan
| Excess Facility Costs |
Severance Costs |
Contract Termination Costs |
Total Restructuring Accrual | ||||||
| Balance as of December 31, 2008 |
$ | — | — | — | — | ||||
| Restructuring charges |
1,121 | 1,778 | 744 | 3,643 | |||||
| Payments |
(190) | (662) | — | (852) | |||||
| Balance as of December 31, 2009 |
$ | 931 | 1,116 | 744 | 2,791 | ||||
As of December 31, 2009 and 2008, the Company has classified approximately $3.6 million and $0.8 million, respectively, of the restructuring liability in accrued liabilities and the remaining restructuring liability of approximately $1.0 million and $0.3 million, respectively, in long-term liabilities based on the Company’s expectation that the remaining lease payments will be paid over the remaining term of the related leases (net of expected sublease income).
Restructuring charges during 2009 for restructuring plans prior to the Q1 2009 Plan was approximately $0.2 million, and the remaining restructuring liability relating to such plans was approximately $0.3 million as of December 31, 2009.
In addition, the Company recorded a charge of $0.6 million for severance costs related to the departure of its former Chief Executive Officer in the fourth quarter of 2008 which is also included in restructuring and other. These costs are comprised of $0.3 million for lump-sum cash payment, $0.2 million for the acceleration of stock options and stock awards and $27,000 for continuation of health insurance benefits. All cash severance was fully paid by December 31, 2008.
Note 9. Income Taxes
Loss before income taxes includes income from foreign operations of approximately $1.5 million, $1.9 million and $2.0 million for the years ended December 31, 2009, 2008 and 2007, respectively.
59
Table of Contents
iPASS INC.
NOTES TO CONSOLIDATED FINANCIAL STATEMENTS—(Continued)
The provision for (benefit from) income taxes consisted of the following (in thousands):
| Year Ended December 31, | |||||||||||
| 2009 | 2008 | 2007 | |||||||||
| Current: |
|||||||||||
| U.S. federal |
$ | (1,213 | ) | $ | (141 | ) | $ | 0 | |||
| State |
126 | (775 | ) | 130 | |||||||
| Foreign |
496 | 471 | 629 | ||||||||
| $ | (591 | ) | $ | (445 | ) | $ | 759 | ||||
| Deferred: |
|||||||||||
| U.S. federal |
— | — | 19,640 | ||||||||
| State |
— | — | 2,716 | ||||||||
| Foreign |
(83 | ) | (180 | ) | — | ||||||
| Other |
— | 44 | 36 | ||||||||
| (83 | ) | (136 | ) | 22,392 | |||||||
| Total provision for (benefit from) income taxes |
$ | (674 | ) | $ | (581 | ) | $ | 23,151 | |||
Deferred income taxes reflect the net tax effects of temporary differences between carrying amounts of assets and liabilities for financial reporting purposes and the amounts used for income tax purposes and net loss carryforwards. As of December 31, 2009 and December 31, 2008, the Company assessed a full valuation allowance on its net deferred tax assets from the United States and Israel. The components of deferred tax assets (liabilities) consisted of the following (in thousands):
| Year Ended December 31, | ||||||||
| 2009 | 2008 | |||||||
| Deferred tax assets: |
||||||||
| Net operating loss carryforwards |
$ | 45,650 | $ | 45,713 | ||||
| Reserves and accruals |
8,133 | 6,717 | ||||||
| Research and other tax credits |
4,131 | 6,084 | ||||||
| Property and equipment |
1,842 | 2,208 | ||||||
| Total deferred tax assets |
59,756 | 60,722 | ||||||
| Valuation allowance |
(59,164 | ) | (59,672 | ) | ||||
| Net deferred tax assets |
$ | 592 | $ | 1,050 | ||||
| Deferred tax liabilities: |
||||||||
| Intangible assets |
$ | (329 | ) | $ | (870 | ) | ||
| Total net deferred tax assets |
$ | 263 | $ | 180 | ||||
As of December 31, 2009, approximately $24.7 million of the total valuation allowance for deferred tax assets relates to net operating loss and credit carryforwards attributable to acquired entities. These net operating loss and credit carryforwards are subject to an annual limitation under Internal Revenue Code Section 382. Also included in the valuation allowance as of December 31, 2009 is approximately $2.1 million related to Israel.
60
Table of Contents
iPASS INC.
NOTES TO CONSOLIDATED FINANCIAL STATEMENTS—(Continued)
The provision for (benefit from) income taxes differed from the amounts computed by applying the U.S. federal income tax rate to pretax income (loss) before income taxes as a result of the following:
| Year Ended December 31, | |||||||||
| 2009 | 2008 | 2007 | |||||||
| Federal statutory rate |
(35 | )% | (35 | )% | (35 | )% | |||
| State taxes, net of federal benefit |
(3 | ) | (5 | ) | (5 | ) | |||
| Foreign taxes |
(1 | ) | — | (5 | ) | ||||
| Amortization of stock-based compensation |
1 | — | 3 | ||||||
| Research and development benefit |
(4 | ) | (1 | ) | (5 | ) | |||
| Tax exempt interest |
— | — | (4 | ) | |||||
| Impairment of Intangible Assets |
— | 34 | — | ||||||
| Federal alternative minimum tax refund |
(8 | ) | — | — | |||||
| Other |
3 | 1 | 4 | ||||||
| Valuation Allowance |
42 | 5 | 256 | ||||||
| Provision for (benefit from) income taxes |
(5 | )% | (1 | )% | 209 | % | |||
As of December 31, 2009, the Company had gross cumulative net operating loss carryforwards for federal and state tax reporting purposes of approximately $117.0 million and $87.0 million, respectively, which expire in various periods between 2010 and 2029. Under current tax law, net operating loss carryforwards available in any given year may be limited upon the occurrence of certain events, including significant changes in ownership interest. In addition, the Company has federal net operating losses of $5.9 million and state net operating losses of $6.1 million related to stock options which vested prior to the adoption of new accounting guidance for Share-Based Payments in January 2006.
The Company also has research and development tax credit carryforwards of approximately $2.7 million and $4.2 million for federal and state income tax purposes, respectively. If not utilized, the federal carryforwards will expire in various amounts through 2029. The state tax credits can be carried forward indefinitely.
The following table presents a reconciliation of the beginning and ending amounts of unrecognized tax benefits (in thousands):
| Balance at January 1, 2009 |
$ | 2,471 | ||
| Increases for positions taken in prior years |
1,260 | |||
| Increases for positions related to the current year |
761 | |||
| Settlements with taxing authorities |
(629 | ) | ||
| Balance at December 31, 2009 |
$ | 3,863 | ||
The increase in unrecognized tax benefits primarily relates to the establishment of federal and state net operating loss reserves related to the timing of deducting transfer pricing payments made to controlled foreign corporations, less the settlement of an IRS audit pertaining to the carryforward of research and development credit reserves.
If any of these tax benefits that are unrecognized should become recognizable at a future time, $3.1 million would be recognized as deferred tax assets, and the remaining balance of $0.7 million would be released into income.
61
Table of Contents
iPASS INC.
NOTES TO CONSOLIDATED FINANCIAL STATEMENTS—(Continued)
It is reasonably possible that the total amount of unrecognized tax benefits will change in 2010. Decreases in the unrecognized tax benefits will result from the lapsing of statutes of limitations and the possible completion of tax audits in various jurisdictions. Increases will primarily result from tax positions expected to be taken on tax returns for 2010.
The continuing practice of the Company is to recognize interest and penalties related to income tax matters in the provision for income taxes which were not considered material during 2009, 2008, and 2007.
The Company’s major taxing jurisdictions are U.S. Federal, California and India. In the normal course of our business, we are subject to income tax audits in various jurisdictions. Years 2005 to 2009 remain open to examination by certain of these major taxing jurisdictions. The Company currently has income tax audits in progress in India and has accrued approximately $0.5 million is connection with these audits.
Note 10. Stockholders’ Equity
Stock Option and Restricted Stock Awards Plans
The Company has two stock plans that permit it to grant stock options and restricted stock awards—one for both employees and consultants (“Employee and Consultant Plan”) and one for directors (“Director Plan”). Stock options generally vest 25% on the first anniversary of the grant date with the remainder vesting ratably over the following 36 months; stock options generally expire 10 years after the date of grant. Restricted stock awards give the recipient the right to receive shares upon the lapse of the instruments’ time and/or performance based restrictions. The restricted stock awards with time-based restrictions are considered outstanding at the time of grant, as the holders are entitled to dividends and voting rights. Employees may surrender a portion of their award shares to pay for related employee payroll taxes. The restricted stock awards with performance-based restrictions are not considered outstanding until the performance criteria have been met and therefore are not entitled to dividends or voting rights at the time of grant. The performance-based restricted stock awards vest upon the achievement of pre-defined earnings before interest, taxes and amortization (“EBITA”) performance metrics. As of December 31, 2009, the Company had granted a total of 711,596 shares of performance-based restricted stock, none of which had vested as the performance goals had not been met. No compensation expense was recognized for these performance-based restricted awards.
The number of shares authorized for issuance under the Employee and Consultant Plan is automatically increased 5% annually; however, in 2006 the Board of Directors suspended the automatic increase for the years ending December 31, 2007 and 2008, but was reinstated during 2009. The number of shares authorized for issuance under the Director Plan is automatically increased by 250,000 shares annually. As of December 31, 2009, 21,759,678 shares were authorized for grant under all plans.
62
Table of Contents
iPASS INC.
NOTES TO CONSOLIDATED FINANCIAL STATEMENTS—(Continued)
The following table summarizes the stock option and restricted stock award activity under the Plans for the indicated periods:
| Shares Available for Future Grant |
Number of Options Outstanding |
Weighted Average Exercise per Share |
Weighted Average Grant Date Fair Value per Share |
Number of Restricted Stock Awards Outstanding |
Weighted Average Grant Date Fair Value per Share | |||||||||||||
| Beginning at December 31, 2006 |
13,370,006 | 9,400,425 | $ | 7.96 | 412,353 | $ | 6.34 | |||||||||||
| Granted |
(2,005,619 | ) | 1,445,525 | $ | 5.10 | $ | 2.69 | 560,094 | $ | 5.09 | ||||||||
| Options Exercised |
(473,280 | ) | $ | 1.86 | ||||||||||||||
| Restricted Stock Award Vested |
(41,667 | ) | $ | 6.01 | ||||||||||||||
| Terminated/cancelled/forfeited |
1,324,876 | (2,164,711 | ) | $ | 15.14 | (131,535 | ) | $ | 5.65 | |||||||||
| Balance at December 31, 2007 |
12,689,263 | 8,207,959 | $ | 5.92 | 799,245 | $ | 5.60 | |||||||||||
| Granted |
(2,401,520 | ) | 856,650 | $ | 1.83 | $ | 0.82 | 1,544,870 | $ | 2.42 | ||||||||
| Options Exercised |
(122,914 | ) | $ | 0.73 | ||||||||||||||
| Restricted Stock Award Vested |
(376,568 | ) | $ | 5.67 | ||||||||||||||
| Terminated/cancelled/forfeited |
1,687,950 | (1,820,294 | ) | $ | 6.34 | (576,393 | ) | $ | 4.07 | |||||||||
| Balance at December 31, 2008 |
11,975,693 | 7,121,401 | $ | 5.39 | 1,391,154 | $ | 2.68 | |||||||||||
| Authorized |
3,312,576 | |||||||||||||||||
| Granted(1) |
(21,461,494 | ) | 21,179,898 | $ | 2.50 | $ | 0.52 | 281,596 | $ | 1.28 | ||||||||
| Options Exercised |
(61,939 | ) | $ | 0.60 | ||||||||||||||
| Restricted Stock Award Vested |
(521,842 | ) | $ | 3.28 | ||||||||||||||
| Terminated/cancelled/forfeited(1) |
19,318,628 | (19,625,085 | ) | $ | 3.55 | (156,866 | ) | $ | 3.08 | |||||||||
| Balance at December 31, 2009 |
13,145,403 | 8,614,275 | $ | 2.50 | 994,042 | $ | 1.87 | |||||||||||
| (1) | Includes 16,863,274 stock options cancelled and re-granted as a result of the stock option repricing events which are described at Note 11. |
Restricted stock awards granted during 2009 included 70,000 shares of restricted stock with time based vesting criteria, which have been included as shares outstanding on the consolidated statement of stockholders’ equity and comprehensive loss. The aggregate intrinsic value of options exercised was $0.1 million, $0.3 million, and $1.5 million for the years ended December 31, 2009, 2008 and 2007, respectively. The following table summarizes the stock options outstanding and exercisable by range of exercise prices as of December 31, 2009:
| Options Outstanding | Options Exercisable | |||||||||||
| Range of Exercise Prices |
Number Outstanding |
Weighted- Average Remaining Contractual Life (in Years) |
Weighted- Average Exercise Price per Share |
Number Exercisable |
Weighted-Average Exercise Price per Share | |||||||
| $0.08—0.72 |
418,337 | 5.6 | $ | 0.65 | 218,337 | $ | 0.59 | |||||
| 0.74—0.75 |
1,761,450 | 8.0 | 0.75 | 9,450 | 0.74 | |||||||
| 0.78—1.24 |
1,236,082 | 8.7 | 1.17 | 77,081 | 1.15 | |||||||
| 1.33—1.64 |
1,983,021 | 7.6 | 1.40 | 679,659 | 1.52 | |||||||
| 1.73—3.97 |
863,318 | 4.3 | 3.49 | 842,564 | 3.48 | |||||||
| 4.00—4.24 |
912,426 | 4.1 | 4.17 | 862,491 | 4.17 | |||||||
| 4.26—5.76 |
934,875 | 4.7 | 4.91 | 928,619 | 4.90 | |||||||
| 5.78—37.29 |
502,516 | 3.3 | 8.43 | 501,377 | 8.43 | |||||||
| 56.16—56.16 |
2,250 | 0.3 | 56.16 | 2,250 | 56.16 | |||||||
| Total |
8,614,275 | 6.5 | 2.50 | 4,121,828 | 4.05 | |||||||
63
Table of Contents
iPASS INC.
NOTES TO CONSOLIDATED FINANCIAL STATEMENTS—(Continued)
| Shares | Weighted Average Exercise Price per Share |
Weighted Average Remaining Contractual Term (Years) |
Aggregate Intrinsic Value | |||||||
| (In thousands, except share and per share amounts) | ||||||||||
| Options outstanding at December 31, 2009 |
8,614,275 | $ | 2.50 | 6.5 | $ | 676 | ||||
| Options vested and expected to vest at December 31, 2009 |
7,346,033 | $ | 2.74 | 6.1 | $ | 521 | ||||
| Options exercisable at December 31, 2009 |
4,121,828 | $ | 4.05 | 4.1 | $ | 101 | ||||
Stock-Based Compensation
The following table sets forth the total stock-based compensation expense included in the Company’s Consolidated Statements of Operations:
| Years Ended December 31, | |||||||||
| 2009 | 2008 | 2007 | |||||||
| (In thousands) | |||||||||
| Network Operations |
$ | 702 | $ | 812 | $ | 735 | |||
| Research and development |
412 | 498 | 959 | ||||||
| Sales and marketing |
79 | 487 | 1,246 | ||||||
| General and administrative |
1,123 | 1,997 | 1,978 | ||||||
| Total |
$ | 2,316 | $ | 3,794 | $ | 4,918 | |||
As of December 31, 2009, there was $3.9 million of total unrecognized stock-based compensation expense related to stock options, net of expected forfeitures that will be recognized over the weighted average period of 3.17 years. As of December 31, 2009, there was $0.3 million of total unrecognized compensation cost related to the unvested restricted stock awards granted, which is expected to be recognized over the remaining weighted average vesting period of 2.99 years.
Valuation Assumptions
The weighted average estimated fair value of stock options granted during the years ended December 31, 2009, 2008, and 2007 were calculated under the Black-Scholes option-pricing model, using the following weighted-average assumptions (excluding repriced stock options, which are described at Note 11):
| Year Ended December 31, | |||||||||
| 2009 | 2008 | 2007 | |||||||
| Risk-free rate |
2.00 | % | 2.30 | % | 4.73 | % | |||
| Expected dividend yield |
0 | % | 0 | % | 0 | % | |||
| Expected volatility |
51 | % | 52 | % | 49 | % | |||
| Expected term |
4.3 years | 5.0 years | 6.1 years | ||||||
Expected volatilities are based on the historical volatility of the Company’s common stock. The expected term of stock options granted is based on the historical average expected term. The risk-free rate for periods within the expected term of the stock option is based on the U.S. Treasury yield curve in effect at the time of grant.
The total grant date fair value of the restricted awards granted during the years ended December 31, 2009, 2008 and 2007 was approximately $0.4 million, $3.7 million and $2.9 million, respectively, which will be recognized over the requisite service periods.
64
Table of Contents
iPASS INC.
NOTES TO CONSOLIDATED FINANCIAL STATEMENTS—(Continued)
Employee Stock Purchase Plan
The Company has an Employee Stock Purchase Plan (“ESPP”) which permits employees to purchase common stock through payroll deductions of up to 15% on an employee’s compensation, including commissions, overtime, bonuses and other incentive compensation. The purchase price per share is equal to the lower of 85% of the fair market value per share at the beginning of the offering period, or 85% of the fair market value per share on the semi-annual purchase date. The number of shares reserved under the ESPP increases annually by 1% of the total number of shares outstanding at the end of the prior year. As of December 31, 2009, the ESPP plan had 2.4 million shares reserved for future issuance.
Compensation cost related to the Company’s employee stock purchase plan is calculated using the fair value of the employees’ purchase rights granted. The estimated fair value of employee purchase rights granted during the years ended December 31, 2009, 2008, and 2007 was calculated using the Black-Scholes option-pricing model with the following weighted-average assumptions:
| Year Ended December 31, | |||||||||
| 2009 | 2008 | 2007 | |||||||
| Risk-free rate |
0.16 | % | 0.74 | % | 3.89 | % | |||
| Expected dividend yield |
0 | % | 0 | % | 0 | % | |||
| Expected volatility |
60 | % | 67 | % | 46 | % | |||
| Expected life |
0.5 to 1 year | 0.5 to 1 year | 0.5 to 1 year | ||||||
Note 11. Return of Capital and Repricing of Stock Options
In 2009 the Company returned approximately $30.0 million to stockholders in the form of two extraordinary cash dividends. The first dividend of approximately $20.0 million or $0.32 per share was paid on September 17, 2009 to stockholders of record as of August 31, 2009. In accordance with an amendment approved by the Company’s stockholders on August 18, 2009, the Company’s Board of Directors subsequently adjusted the exercise price of 8,434,529 outstanding stock options from an original weighted average exercise price of $3.62 to $3.13. The incremental fair value of the repriced options was determined using the Black-Scholes option-pricing model using the following assumptions: Expected term of 4.25 years; Expected volatility of 51.7%; Risk free interest rate of 1.96%; and Expected Dividend Yield of 0%. Also in accordance with this plan, the Board of Directors granted 368,624 new stock options and 114,285 new performance stock awards. The performance stock awards had a fair market value on the date of grant of $1.37 per share (collectively the “September Repricing”). The repricing and issuance of new stock options and performance stock awards that was approved by the Company’s stockholders was intended to address the diminution in value to the option from the extraordinary cash dividend and to attempt to preserve the option’s intrinsic value (amount of value the option holder would receive upon immediate exercise and sale of the underlying stock) that existed prior to the extraordinary cash dividend.
The second dividend of approximately $10.0 million or $0.16 per share was paid on December 18, 2009 to stockholders of record as of December 4, 2009. Again, in accordance with an amendment approved by stockholders on August 18, 2009, the Company’s Board of Directors subsequently further adjusted the exercise price of 8,428,745 outstanding stock options from an original weighted average exercise price of $2.82 to $2.50. The incremental fair value of the repriced options was determined using the Black-Scholes option-pricing model using the following assumptions: Expected term of 3.8 years; Expected volatility of 54.3%; Risk free rate of 1.69%; and Expected Dividend Yield of 0%. The Board of Directors also granted 208,000 new stock option grants and 97,311 new performance stock awards. The performance stock awards had a fair market value on the date of grant of $0.95 per share (collectively the “December Repricing”). The repricing and issuance of new stock options and performance stock awards was intended to address the diminution in value to the option from
65
Table of Contents
iPASS INC.
NOTES TO CONSOLIDATED FINANCIAL STATEMENTS—(Continued)
the Extraordinary Dividend and to attempt to preserve the option’s intrinsic value (amount of value the option holder would receive upon immediate exercise and sale of the underlying stock) that existed prior to the extraordinary cash dividend.
In connection with the repriced options and issuance of new options and performance stock awards, the Company recognized stock compensation expense of approximately $0.2 million for the September Repricing and approximately $0.1 million for the December Repricing, which is included in the total stock based compensation expense of approximately $2.3 million recognized during the year ended December 31, 2009. The remaining unamortized fair value of the repriced options and new options and performance stock awards of approximately $0.8 million as of December 31, 2009 will be recognized ratably over the remaining requisite service period of the underlying awards or as performance criteria are met.
Note 12. Stock Repurchase Program
On November 3, 2009, the Company’s Board of Directors approved a $10.0 million stock repurchase program (the “2009 Repurchase Program”) that extends through March 31, 2011. Under this program the Company may repurchase up to $10.0 million of outstanding common stock from time to time on the open market or through negotiated transactions. Through December 31, 2009, the Company repurchased a total of 750,000 shares of common stock at an average price of $1.09 per share for a total cash outlay of approximately $0.8 million. In the event that this $10.0 million repurchase program is not completed by March 31, 2011, the Company is required to distribute the remaining balance to stockholders in the form of a cash dividend by April 15, 2011.
In February 2008, the Company’s Board of Directors approved a stock repurchase program which authorized the Company to repurchase up to $30.0 million of outstanding common stock from time to time on the open market or through negotiated transactions. Through December 31, 2008, the Company repurchased a total of approximately 1.3 million shares of common stock for an aggregate purchase price of $3.7 million. On November 3, 2009 the Company’s Board of Directors terminated this stock repurchase program. There was no stock repurchase activity in 2009 relating to the 2008 stock repurchase program.
Note 13. Commitments and Contingencies
Leases and Purchase Commitments
The Company leases facilities under operating leases that expire at various dates through October 2016. Certain leases are cancellable prior to lease expiration dates. Future minimum lease payments under these operating leases, including payments on leases accounted for under the Company’s restructuring plan, as of December 31, 2009 are as follows (in thousands):
| Operating Leases |
Sublease Income |
Net Operating Leases | ||||||||
| Year ending December 31: |
||||||||||
| 2010 |
$ | 4,617 | $ | (186 | ) | $ | 4,431 | |||
| 2011 |
3,436 | — | 3,436 | |||||||
| 2012 |
2,612 | — | 2,612 | |||||||
| 2013 |
2,366 | — | 2,366 | |||||||
| 2014 |
2,428 | — | 2,428 | |||||||
| 2015 and thereafter |
1,467 | — | 1,467 | |||||||
| $ | 16,926 | $ | (186 | ) | $ | 16,740 | ||||
66
Table of Contents
iPASS INC.
NOTES TO CONSOLIDATED FINANCIAL STATEMENTS—(Continued)
Included in the table above, the Company has approximately $2.1 million in facility lease obligations, net of estimated sublease income and other costs, which are included in accrued restructuring liabilities. Rent expense for operating leases, excluding leases accounted for under the Company’s restructuring plan for the years ended December 31, 2009, 2008 and 2007 was $3.9 million, $5.0 million and $5.7 million, respectively.
The Company has contracts with certain network service and mobile data providers which have minimum purchase commitments that expire on various dates through June 2011. Future minimum purchase commitments under all agreements are as follows (in thousands):
| Year ending December 31: |
|||
| 2010 |
$ | 4,273 | |
| 2011 |
5,175 | ||
| $ | 9,448 | ||
Sales Tax Liabilities
The Company’s sales and use tax filings are subject to customary audits by authorities in the jurisdictions where it conducts business in the United States, which may result in assessments of additional taxes. As a result of addressing a sales and use tax audit which was initiated in 2009, the Company determined that additional sales taxes were probable of being assessed for multiple states. Given the nature of the Company’s business model, the state conducting the sales tax audit agreed to work with the Company in developing the methodology that was used to estimate the incremental sales tax. Once resolution of the methodology had been reached, the Company applied this same model to other states where this type of sales tax may also be applicable. As a result of completing this analysis, the Company estimated an incremental sales tax liability of approximately $5.0 million, including interest and penalties, where applicable, of approximately $1.5 million. Significant subjectivity exists as to both whether sales tax can even be assessed on the activity for which the incremental sales tax amount is derived, and given the nature of the Company’s business model, how the sales tax amount would be measured. However, based on the developments associated with the ongoing sales and use tax audit, the Company determined that its estimates for sales tax in certain states should be revised, and accordingly recognized additional sales tax obligations, including interest and penalties of approximately $5.0 million which was recorded in general and administrative expenses.
During the fourth quarter of 2009, the Company developed a sales tax automation tool and began invoicing the incremental sales tax for a portion of its business.
The Company has the ability and right to bill and collect the incremental sales tax, excluding interest and penalties, from its customers; however, several factors create significant uncertainty in determining whether recognition of an asset is appropriate. The primary uncertainties include the following: (1) As disclosed above, significant judgment exists both as to the activity that gives rise to the incremental sales tax assessment and how the sales tax amount has been measured (2) Although the Company has identified the process to invoice incremental sales tax to its customers, the Company does not have any collection history and; (3) The estimated incremental sales tax relates to multiple periods which would make it more difficult to successfully collect the incremental sales tax from its customers. Accordingly, the Company has determined that it will not recognize an asset relating to the incremental sales tax that the Company will invoice its customers as the Company currently does not have the ability to estimate the amount, if any, that it will be able to collect. Proceeds received from customers, if any, in connection with the additional sales tax assessment will be recognized upon receipt. Through the year-ended December 31, 2009, no proceeds from customers have been received.
67
Table of Contents
iPASS INC.
NOTES TO CONSOLIDATED FINANCIAL STATEMENTS—(Continued)
Return of Capital
On August 18, 2009, we declared an extraordinary cash dividend of $20.0 million to stockholders of record as of August 31, 2009. The cash dividend was paid September 17, 2009. On November 3, 2009, the Company’s Board of Directors declared a $10.0 million extraordinary cash dividend to stockholders of record as of December 4, 2009. The cash dividend was paid on December 18, 2009. In addition, the Company’s Board of Directors approved a $10.0 million stock repurchase program that extends through March 31, 2011. In the event that any of the $10.0 million is not used to repurchase our stock, we have agreed to dividend to stockholders the remaining portion by April 15, 2011. (See Note 11. Return of Capital and Repricing of Stock Options).
Legal Proceedings
The Company is involved in legal proceedings and claims arising in the ordinary course of business. While there can be no assurances as to the ultimate outcome of any litigation involving the Company, management does not believe any such pending legal proceeding or claim will result in a judgment or settlement that would have a material adverse effect on the Company’s financial position, results of operations or cash flows.
In the ordinary course of business, the Company may provide indemnifications of varying scope and terms to customers, business partners, and other parties with respect to certain matters, including, but not limited to, losses arising out of our breach of such agreements, services to be provided by the Company, or from intellectual property infringement claims made by third-parties. Certain indemnification agreements may not be subject to maximum loss clauses. If the potential loss from any indemnification claim is considered probable and the amount or the range of the loss can be estimated, the Company accrues a liability for the estimated loss. To date, claims under such indemnification provisions have not been significant.
Note 14. Employee 401(k) Plan
Substantially all of the Company’s employees are eligible to participate in the Company’s 401(k) plan, which provides for discretionary Company matching contributions. Beginning January 1, 2006, the Company provided a 50% match to employee contributions up to 6% of an employee’s total compensation. The Company has contributed no match for 2009. The Company’s matching contributions to the plan totaled $0.6 million and $0.7 million for the years ended December 31, 2008 and 2007, respectively.
Note 15. Net Loss Per Common Share
Basic net loss per share is computed by dividing net loss by the weighted daily average number of shares of common stock outstanding during the period, excluding participating securities. Diluted net loss per share is based upon the weighted daily average number of shares of common stock outstanding for the period plus dilutive potential common shares from the issuance of stock options and awards using the treasury-stock method. As the Company was in a net loss position for all periods presented, basic and diluted net loss per share are equal to each other as the weighted average number of shares used to compute diluted net loss per share excludes anti-dilutive securities, including participating securities.
68
Table of Contents
iPASS INC.
NOTES TO CONSOLIDATED FINANCIAL STATEMENTS—(Continued)
The following table sets forth the computation of basic and diluted net loss per share (in thousands, except per share amounts):
| Year Ended December 31, | ||||||||||||
| 2009 | 2008 | 2007 | ||||||||||
| Numerator: |
||||||||||||
| Net loss |
$ | (13,492 | ) | $ | (91,968 | ) | $ | (34,214 | ) | |||
| Denominator: |
||||||||||||
| Denominator for basic and diluted net loss per common share |
||||||||||||
| Weighted average shares outstanding |
62,032,897 | 61,179,969 | 62,828,202 | |||||||||
| Basic and diluted net loss per common share |
$ | (0.22 | ) | $ | (1.50 | ) | $ | (0.54 | ) | |||
The following potential shares of common stock have been excluded from the computation of diluted net loss per share because the effect of including these shares would have been anti-dilutive:
| Year Ended December 31, | ||||||
| 2009 | 2008 | 2007 | ||||
| Options to purchase common stock |
8,614,275 | 7,121,401 | 8,207,959 | |||
| Unvested restricted stock awards, considered participating securities |
994,042 | 1,391,154 | 799,245 | |||
The weighted-average exercise price of options to purchase common stock excluded from the computation was $2.50, $5.39 and $5.92 for the years ended December 31, 2009, 2008 and 2007, respectively.
Note 16. Segment and Geographical Information
The Company has determined that it operates in a single reportable operating segment. The Company’s chief operating decision maker is considered to be the Company’s chief executive officer (“CEO”). The CEO reviews financial information presented on a consolidated basis for purposes of making operating decisions and assessing financial performance. The consolidated financial information reviewed by the CEO is similar to the information presented in the accompanying consolidated financial statements.
Revenues generated in the United States accounted for approximately 61%, 61% and 62% of total revenues for the years ended December 31, 2009, 2008 and 2007, respectively. International revenue is determined by the location of the customer’s headquarters. International revenue accounted for approximately 39%, 39% and 38% of total revenues for the years ended December 31, 2009, 2008 and 2007, respectively. Substantially all of our international revenues are generated in the EMEA (Europe, Middle East and Africa) and Asia Pacific regions. Revenues in the EMEA region represented 30%, 28% and 27% of total revenues in 2009, 2008 and 2007, respectively. Revenues in the United Kingdom accounted for 10%, 9% and 11% of total revenues for the years ended December 31, 2009, 2008 and 2007, respectively. Revenues in the Asia Pacific region represented 6%, 8% and 7% of total revenues in 2009, 2008 and 2007, respectively.
69
Table of Contents
iPASS INC.
NOTES TO CONSOLIDATED FINANCIAL STATEMENTS—(Continued)
The following table sets forth disaggregated revenue by type (in thousands):
| For the Year Ended December 31, | |||||||||
| 2009 | 2008 | 2007 | |||||||
| Enterprise Mobility and Related Services |
$ | 143,055 | $ | 163,732 | $ | 165,448 | |||
| Managed Networks Services |
28,322 | 27,636 | 26,284 | ||||||
| $ | 171,377 | $ | 191,368 | $ | 191,732 | ||||
Substantially all of the Company’s long-lived assets are located in the United States.
70
Table of Contents
Pursuant to the requirements of Section 13 or 15(d) the Securities Exchange Act of 1934, the registrant has duly caused this report to be signed on its behalf by the undersigned, thereunto duly authorized.
| iPass Inc. | ||||||||
| By: | /S/ EVAN L. KAPLAN | By: | /S/ STEVEN H. GATOFF | |||||
| Evan L. Kaplan, President and Chief Executive Officer (Principal Executive Officer) |
Steven H. Gatoff, Senior Vice President and (Principal Financial and Accounting Officer) | |||||||
Date: March 15, 2010
71
Table of Contents
POWER OF ATTORNEY
KNOW ALL PERSONS BY THESE PRESENT, that each person whose signature appears below constitutes and appoints Steven H. Gatoff and Evan L. Kaplan, and each or any one of them, his true and lawful attorney-in-fact and agent, with full power of substitution and resubstitution, for him and in his name, place and stead, in any and all capacities, to sign any and all amendments (including post-effective amendments) to this Report, and to file the same, with all exhibits thereto, and other documents in connection therewith, with the Securities and Exchange Commission, granting unto said attorneys-in-fact and agents, and each of them, full power and authority to do and perform each and every act and thing requisite and necessary to be done in connection therewith, as fully to all intents and purposes as he might or could do in person, hereby ratifying and confirming all that said attorneys-in-fact and agents, or any of them, or their or his substitutes or substitute, may lawfully do or cause to be done by virtue hereof.
Pursuant to the requirements of the Securities Exchange Act of 1934, this Report has been signed below by the following persons on behalf of the registrant and in the capacities and on the dates indicated.
| Signature |
Title |
Date | ||
| /S/ EVAN L. KAPLAN Evan L. Kaplan |
President, Chief Executive Officer and Director (Principal Executive Officer) |
March 15, 2010 | ||
| /S/ STEVEN H. GATOFF Steven H. Gatoff |
Senior Vice President and Chief Financial Officer (Principal Financial and Accounting Officer) |
March 15, 2010 | ||
| /S/ A. GARY AMES A. Gary Ames |
Director |
March 15, 2010 | ||
| /S/ JOHN D. BELETIC John D. Beletic |
Chairman and Director |
March 15, 2010 | ||
| /S/ PETER G. BODINE Peter G. Bodine |
Director |
March 13, 2010 | ||
| /S/ PETER C. CLAPMAN Peter C. Clapman |
Director |
March 6, 2010 | ||
| /S/ GARY GRIFFITHS Gary Griffiths |
Director |
March 15, 2010 | ||
| /S/ ROBERT J. MAJTELES Robert J. Majteles |
Director |
March 15, 2010 | ||
| /S/ KENNETH H. TRAUB Kenneth H. Traub |
Director |
March 15, 2010 | ||
| /S/ SAMUEL L. SCHWERIN Samuel L. Schwerin |
Director |
March 5, 2010 | ||
| /S/ ALLAN R. SPIES Allan R. Spies |
Director |
March 6, 2010 | ||
72
Table of Contents
SCHEDULE II—VALUATION AND QUALIFYING ACCOUNTS RECEIVABLE
| Classification |
Balance at Beginning of Year |
Additions: Charged to Costs and Expenses |
Deductions: | Balance at End of Year | ||||||||
| (in thousands) | ||||||||||||
| Allowance for doubtful accounts: |
||||||||||||
| Year ended December 31 |
||||||||||||
| 2009 |
$ | 927 | $ | 1,687 | $ | 1,474 | $ | 1,140 | ||||
| 2008 |
2,792 | 717 | 2,582 | 927 | ||||||||
| 2007 |
3,089 | 29 | 326 | 2,792 | ||||||||
73
Table of Contents
| Exhibit |
Description of Document | |
| 3.1 | Amended and Restated Certificate of Incorporation.(1) | |
| 3.2 | Certificate of Amendment to Amended and Restated Certificate of Incorporation.(7) | |
| 3.3 | Certificate of Change to Amended and Restated Certificate of Incorporation.(15) | |
| 3.4 | Amended and Restated By-Laws.(2) | |
| 4.1 | Reference is made to Exhibits 3.1, 3.2, 3.3 and 3.4. | |
| 4.2 | Specimen stock certificate.(1) | |
| 10.1* | iPass Inc. 2003 Equity Incentive Plan.(12) | |
| 10.2* | Form of Stock Option Grant Notice under the 2003 Equity Incentive Plan.(3) | |
| 10.3* | Form of Restricted Stock Grant Notice and Agreement for Vice Presidents and above, under the Company’s 2003 Equity Incentive Plan.(6) | |
| 10.4* | Form of Restricted Stock Grant Notice and Agreement for below Vice Presidents, under the Company’s 2003 Equity Incentive Plan.(6) | |
| 10.5* | Form of Performance Shares Grant Notice and Agreement, under the Company’s 2003 Equity Incentive Plan.(6) | |
| 10.6* | iPass Inc. 2003 Non-Employee Directors Plan.(12) | |
| 10.7* | Forms of Restricted Stock Award Grant Notice and Restricted Stock Award Agreement under the 2003 Non-Employee Directors Plan.(4) | |
| 10.8* | Forms of Stock Option Grant Notice and Stock Option Agreement under the 2003 Non-Employee Directors Plan.(4) | |
| 10.9* | iPass Inc. 1999 Stock Option Plan.(12) | |
| 10.10* | GRIC Communications, Inc. (formerly Aimquest Corporation) 1997 Stock Option Plan.(12) | |
| 10.11* | GRIC Communications, Inc. 1999 Equity Incentive Plan.(12) | |
| 10.12* | iPass Inc. 2003 Employee Stock Purchase Plan and form of related agreements, as amended.(1) | |
| 10.13* | Outside Director Compensation Arrangement.(5) | |
| 10.14* | 2009 Annual Executive Management Bonus Plan.(8) | |
| 10.15* | 2010 Annual Executive Management Bonus Plan (Q1 and Q2).(15) | |
| 10.16* | iPass Inc. Executive Corporate Transaction and Severance Benefit Plan, as amended(13) | |
| 10.17* | iPass Inc. Key Employee Corporate Transaction and Severance Benefit Plan.(13) | |
| 10.18 | iPass Inc. Severance Benefit Plan.(13) | |
| 10.19* | Employment Agreement, dated November 1, 2008, between Registrant and Evan L. Kaplan.(13) | |
| 10.20* | Amendment to the Employment Agreement, dated May 28, 2009, between Registrant and Evan L. Kaplan(16) | |
| 10.21* | Offer Letter with Jayendra Patel dated March 16, 2009.(9) | |
| 10.22* | Offer Letter with William Garvey dated May 5, 2009.(11) | |
74
Table of Contents
| Exhibit |
Description of Document | |
| 10.23* | Offer Letter with Steven Wastie dated May 12, 2009.(11) | |
| 10.24* | Offer Letter with Steven Gatoff dated May 20, 2009.(11) | |
| 10.25* | Offer Letter with Nicholas Hulse dated July 13, 2009.(11) | |
| 10.26* | Separation Agreement with Frank Verdecanna dated May 28, 2009.(11) | |
| 10.27* | Form of Indemnity Agreement.(1) | |
| 10.28* | Lease Agreement, dated October 26, 1999, between iPass Inc. and Westport Joint Venture (as amended).(1) | |
| 10.29* | OEM Service Provider License Agreement, dated February 29, 2000, between RSA Security, Inc. and iPass Inc., and amendments thereto.(3) | |
| 10.30 | Support Agreement, dated February 29, 2000, between RSA Security, Inc. and iPass Inc.(3) | |
| 10.31 | Settlement Agreement, dated June 3, 2009, between iPass Inc. and Foxhill Opportunity Master Fund.(10) | |
| 10.32 | Amendment No.1 to Letter Agreement, dated November 3, 2009, between iPass Inc. and Foxhill Opportunity Master Fund.(14) | |
| 21.1 | Subsidiaries of the Registrant. | |
| 23.1 | Consent of Independent Registered Public Accounting Firm. | |
| 24.1 | Power of Attorney (reference is made to the signature page of this Form 10-K). | |
| 31.1 | Certification of the Chief Executive Officer pursuant to Section 302 of the Sarbanes-Oxley Act of 2002. | |
| 31.2 | Certification of the Chief Financial Officer pursuant to Section 302 of the Sarbanes-Oxley Act of 2002. | |
| 32.1 | Certification of the Chief Executive Officer pursuant to 18 U.S.C Section 1350, as adopted pursuant to Section 906 of the Sarbanes-Oxley Act of 2002 | |
| 32.2 | Certification of the Chief Financial Officer pursuant to 18 U.S.C Section 1350, as adopted pursuant to Section 906 of the Sarbanes-Oxley Act of 2002 | |
| * | Indicates management contract or compensatory plan. |
| (1) | Previously filed as an exhibit to our Registration Statement Form S-1 as amended, filed on January 24, 2003 and incorporated by reference herein. |
| (2) | Previously filed as an exhibit to our Form 10-Q, filed on August 11, 2008, and incorporated by reference herein. |
| (3) | Previously filed as exhibit to our Form 10-K, filed on March 16, 2006, and incorporated by reference herein. |
| (4) | Previously filed as an exhibit to our Form 10-K, filed on March 29, 2007, and incorporated by reference herein. |
| (5) | Previously disclosed under the caption “Compensation of Directors” in our Definitive Proxy Statement on Schedule 14A, filed on April 28, 2008, and incorporated by reference herein. |
| (6) | Previously filed as exhibit to our Form 10-Q, filed on May 10, 2007, and incorporated by reference herein. |
| (7) | Previously filed as exhibit to our Form 10-Q, filed on August 7, 2009, and incorporated by reference herein. |
| (8) | Previously described in Item 5.02 to our Form 8-K/A, filed on April 8, 2009, and incorporated by reference herein. |
| (9) | Previously filed as exhibit to our Form 10-Q, filed on May 8, 2009 and incorporated by reference herein. |
| (10) | Previously filed as an exhibit to our Form 8-K, filed on June 3, 2009, and incorporated herein by reference. |
75
Table of Contents
| (11) | Previously filed as an exhibit to our Form 10-Q, filed on August 7, 2009, and incorporated herein by reference. |
| (12) | Previously filed as an appendix to our Proxy Statement, filed on July 14, 2009, and incorporated herein by reference herein. |
| (13) | Previously filed as exhibit to our Form 10-K, filed on March 16, 2009, and incorporated by reference herein. |
| (14) | Previously filed as an exhibit to our Form 8-K, filed on November 5, 2009, and incorporated herein by reference. |
| (15) | Previously filed as an exhibit to our Form 8-K, filed on February 3, 2010, and incorporated herein by reference. |
| (16) | Previously described in our Form 8-K, filed on June 1, 2009, and incorporated herein by reference. |
76