Attached files
| file | filename |
|---|---|
| 8-K - FORM 8-K - CENTERSPACE | iretform8k-03122010.htm |
| EX-99.1 - EARNINGS RELEASE - CENTERSPACE | iretexhibit991-03122010.htm |
Exhibit 99.2

Third Quarter Fiscal 2010
Supplemental Operating and Financial Data
for the Quarter Ended January 31, 2010
|
CONTACT:
Lindsey Knoop Anderson
Director of Investor Relations
Direct Dial: 701-837-4738
E-Mail: landerson@iret.com
|
3015 16th Street SW, Suite 100
Minot, ND 58701
Tel: 701.837.4738
Fax: 701.838.7785
www.iret.com
|
Supplemental Financial and Operating Data
January 31, 2010
|
Page
|
|
|
Company Background and Highlights
|
2
|
|
Investment Cost by Segment
|
5
|
|
Key Financial Data
|
|
|
Condensed Consolidated Balance Sheets
|
6
|
|
Condensed Consolidated Statements of Operations
|
7
|
|
Funds From Operations
|
8
|
|
Earnings Before Interest, Taxes, Depreciation and Amortization (EBITDA)
|
9
|
|
Capital Analysis
|
|
|
Long-Term Mortgage Debt Analysis
|
10
|
|
Long-Term Mortgage Debt Detail
|
11-12
|
|
Capital Analysis
|
13
|
|
Portfolio Analysis
|
|
|
Stabilized Properties Net Operating Income Summary
|
14
|
|
Net Operating Income Detail
|
15-18
|
|
Stabilized Properties and Overall Economic Occupancy Levels by Segment
|
19
|
|
Tenant Analysis
|
|
|
Commercial Leasing Summary
|
20-21
|
|
Multi-Family Residential Summary
|
22
|
|
10 Largest Commercial Tenants - Based on Annualized Base Rent
|
23
|
|
Lease Expirations as of January 31, 2010
|
24
|
|
Growth and Strategy
|
|
|
Fiscal 2010 Acquisition Summary
|
25
|
|
Definitions
|
26
|
Company Background and Highlights
Third Quarter Fiscal 2010
Investors Real Estate Trust is a self-administered, equity real estate investment trust (REIT) investing in a portfolio of income-producing properties located primarily in the upper Midwest. IRET’s portfolio is diversified among multi-family residential, commercial office, medical (including senior housing), industrial and retail segments.
During the third quarter of fiscal year 2010, IRET acquired two limited liability companies that own and operate a portfolio of five assisted living facilities in three communities in Wyoming. The five facilities, located in Casper (two facilities), Cheyenne (two facilities) and Laramie (one facility), Wyoming, have a total of approximately 320 units or approximately 370-380 beds. IRET acquired 100% of the member interests in the owner and operator of these five facilities for a total purchase price of approximately $45 million. The Wyoming assisted living portfolio consists of the Meadow Wind and Park Place assisted living facilities in Casper, Wyoming; the Aspen Wind and Sierra Hills assisted living facilities in Cheyenne, Wyoming; and the Spring Wind assisted living facility in Laramie, Wyoming. The acquisition price for the portfolio was funded with cash in the amount of approximately $8.87 million, and with the proceeds of a $36.5 million loan from First International Bank and Trust, Watford City, North Dakota. During the third quarter of fiscal year 2010, the Company also acquired an approximately 6.8 acre parcel of vacant land located in Fargo, North Dakota for a purchase price of approximately $395,000. The Company has agreed to construct a new facility on this property to be leased to a single tenant, with a target lease commencement date in July 2010. The Company estimates that its cost to construct the facility will be approximately $4.2 million, including the cost of the land, plus imputed construction interest. The Company had no development projects placed in service or material dispositions during the third quarter of fiscal year 2010. IRET had no development projects placed in service or material dispositions during the third quarter of fiscal year 2010.
IRET continues to pursue its announced goal of transferring the management of the majority of its commercial and multi-family residential properties from third-party property management companies to its own employees. As of January 31, 2010, the Company has under internal management a total of 119 properties in its commercial industrial, medical, office and retail segments, totaling approximately 7.4 million square feet. Approximately 55.6% of the properties in the Company’s commercial industrial segment, 77.9% of the properties in its medical segment, 47.2% of the properties in its office segment, and 92.3% of the properties in its retail segment, were internally managed by Company employees as of January 31, 2010. IRET continues to evaluate its portfolio of commercial properties to determine additional suitable candidates for internal management, and to establish appropriate timelines to accomplish the transfers.
The transition to internal management in the Company’s multi-family residential segment is still in the early stages. As of January 31, 2010, approximately 4.2% of the properties in the Company’s multi-family residential segment were internally managed by Company employees, or approximately 367 units in six buildings. During the third quarter of fiscal year 2010, the Company added 21 new employees (19 full-time and 2 part-time), 15 of which, including a Vice President of Residential Property Management, were hired to work in multi-family residential property management. Subsequent to the end of the third quarter, in February 2010, the Company opened two regional property management offices in Rochester, Minnesota and St. Cloud, Minnesota, to manage its multi-family residential properties in those communities. These additions to staff, and associated investments in equipment, accounting and other support systems, represent a significant expense to the Company, which is reflected in an increase in property management expense of approximately $568,000 for the nine months ended January 31, 2010, primarily in the multi-family residential segment.
On April 7, 2009, IRET and IRET Properties entered into a continuous equity offering program sales agreement with Robert W. Baird & Co. Incorporated (Baird). Pursuant to the Sales Agreement, IRET may offer and sell its common shares of beneficial interest having an aggregate gross sales price of up to $50 million, from time to time through Baird as IRET's sales agent. Sales of common shares, if any, under the program will depend upon market conditions and other factors to be determined by IRET. IRET has no obligation to sell any common shares in the program, and may at any time suspend solicitation and offers under the program or terminate the program. IRET sold no common shares under this program during the second and third quarters of fiscal year 2010. During the first quarter of fiscal year 2010, IRET sold 116,869 common shares under this program for total proceeds (before offering expenses but after underwriting discounts and commissions) of $1.1 million.
IRET's third quarter fiscal year 2010 results reflect the continuing challenges the real estate industry faced during the three months ended January 31, 2010, and worsening conditions in IRET's multi-family residential segment in particular. During this quarter, factors adversely affecting demand for IRET’s commercial and multi-family properties continued to be pervasive across the United States and in IRET’s markets, with commercial tenants continuing to focus on reducing costs through space reductions and lower rents. Additionally, continued job losses pressured occupancy and revenue in the Company’s multi-family residential segment. We expect current credit market conditions and the continued high level of unemployment to maintain or increase credit stresses on Company tenants, and continue to expect this tenant stress to lead to increases in past due accounts and vacancies.
In the third quarter of fiscal year 2010, IRET paid its 155th consecutive quarterly distribution per common share/unit at equal or increasing rates. The $0.1715 per share/unit distribution was paid January 15, 2010.
As of January 31, 2010, IRET owns a diversified portfolio of 250 properties consisting of 77 multi-family residential properties, 67 office properties, 54 medical properties (including senior housing), 19 industrial properties and 33 retail properties. IRET’s distributions have increased every year for 39 consecutive years. IRET’s shares are publicly traded on the NASDAQ Global Select Market (NASDAQ: IRET).
Company Snapshot
(as of January 31, 2010)
|
Company Headquarters
|
Minot, North Dakota
|
|||
|
Fiscal Year-End
|
April 30
|
|||
|
Reportable Segments
|
Multi-Family Residential; Commercial Office, Medical, Industrial, Retail
|
|||
|
Total Properties
|
250 | |||
|
Total Square Feet
|
||||
|
(commercial properties)
|
12.0 million
|
|||
|
Total Units
|
||||
|
(multi-family residential properties)
|
9,669 | |||
|
Common Shares Outstanding (thousands)
|
73,966 | |||
|
Limited Partnership Units Outstanding (thousands)
|
20,853 | |||
|
Common Share Distribution - Quarter/Annualized
|
$ | 0.1715/$0.686 | ||
|
Dividend Yield
|
7.9% | |||
|
Total Capitalization (see p. 13 for detail)
|
$ |
1.9 billion
|
||
Investor Information
Board of Trustees
|
Jeffrey L. Miller
|
Trustee and Chairman
|
|
Stephen L. Stenehjem
|
Trustee and Vice Chairman, Chair of Compensation Committee
|
|
John D. Stewart
|
Trustee, Chair of Audit Committee
|
|
Patrick G. Jones
|
Trustee
|
|
C.W. “Chip” Morgan
|
Trustee
|
|
John T. Reed
|
Trustee, Chair of Nominating and Governance Committee
|
|
Edward T. Schafer
|
Trustee
|
|
W. David Scott
|
Trustee
|
|
Thomas A. Wentz, Jr.
|
Trustee, Senior Vice President and Chief Operating Officer
|
|
Timothy P. Mihalick
|
Trustee, President and Chief Executive Officer
|
Management
|
Timothy P. Mihalick
|
President and Chief Executive Officer; Trustee
|
|
Thomas A. Wentz, Jr
|
Senior Vice President and Chief Operating Officer; Trustee
|
|
Diane K. Bryantt
|
Senior Vice President and Chief Financial Officer
|
|
Thomas A. Wentz, Sr.
|
Senior Vice President and Chief Investment Officer
|
|
Charles A. Greenberg
|
Senior Vice President, Commercial Asset Management
|
|
Michael A. Bosh
|
Senior Vice President, General Counsel and Assistant Secretary
|
|
Karin M. Wentz
|
Senior Vice President, Chief Compliance Officer, Associate General Counsel & Secretary
|
Corporate Headquarters:
3015 16th Street SW, Suite 100
Minot, North Dakota 58701
Trading Symbol: IRET
Stock Exchange Listing: NASDAQ
Investor Relations:
Lindsey Knoop Anderson
landerson@iret.com
Common Share Data (NASDAQ: IRET)
|
3rd Quarter
Fiscal Year 2010
|
2nd Quarter
Fiscal Year 2010
|
1st Quarter
Fiscal Year 2010
|
4th Quarter
Fiscal Year 2009
|
3rd Quarter
Fiscal Year 2009
|
||||||||||||||||
|
High Closing Price
|
$ | 9.40 | $ | 9.75 | $ | 9.47 | $ | 10.43 | $ | 10.71 | ||||||||||
|
Low Closing Price
|
$ | 8.25 | $ | 8.19 | $ | 8.30 | $ | 8.60 | $ | 7.43 | ||||||||||
|
Average Closing Price
|
$ | 8.82 | $ | 9.06 | $ | 8.73 | $ | 9.58 | $ | 9.71 | ||||||||||
|
Closing Price at end of quarter
|
$ | 8.73 | $ | 8.37 | $ | 9.31 | $ | 9.25 | $ | 9.95 | ||||||||||
|
Common Share Distributions—annualized
|
$ | 0.686 | $ | 0.684 | $ | 0.682 | $ | 0.680 | $ | 0.678 | ||||||||||
|
Closing Dividend Yield - annualized
|
7.9 | % | 8.2 | % | 7.3 | % | 7.4 | % | 6.8 | % | ||||||||||
|
Closing common shares outstanding (thousands)
|
73,966 | 73,502 | 63,788 | 60,304 | 59,127 | |||||||||||||||
|
Closing limited partnership units outstanding (thousands)
|
20,853 | 20,962 | 20,837 | 20,838 | 21,184 | |||||||||||||||
|
Closing market value of outstanding common shares, plus imputed closing market value of outstanding limited partnership units (thousands)
|
$ | 827,770 | $ | 790,664 | $ | 787,859 | $ | 750,564 | $ | 799,094 | ||||||||||
Certain statements in these supplemental disclosures are “forward-looking statements” within the meaning of the Private Securities Litigation Reform Act of 1995. Such statements involve known and unknown risks, uncertainties and other factors that may cause actual results to differ materially from projected results. Such risks, uncertainties and other factors include, but are not limited to: fluctuations in interest rates, the effect of government regulation, the availability of capital, changes in general and local economic and real estate market conditions, competition, our ability to attract and retain skilled personnel, and those risks and uncertainties detailed from time to time in our filings with the Securities and Exchange Commission, including our 2009 Form 10-K. We assume no obligation to update or supplement forward-looking statements that become untrue because of subsequent events.
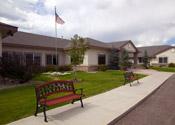
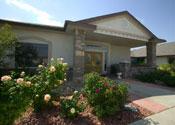
Third Quarter Fiscal 2010 Acquisitions
|
Casper 1930 E. 12th St. (Park Place), Casper, WY
|
Laramie 1072 N. 22nd St. (Spring Wind), Laramie, WY
|
 |
 |
|
Casper 3955 E. 12th St. (Meadow Wind), Casper, WY
|
Cheyenne 4010 N. College Dr. (Aspen Wind), Cheyenne, WY
|
 |
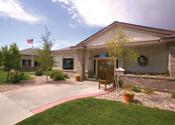 |
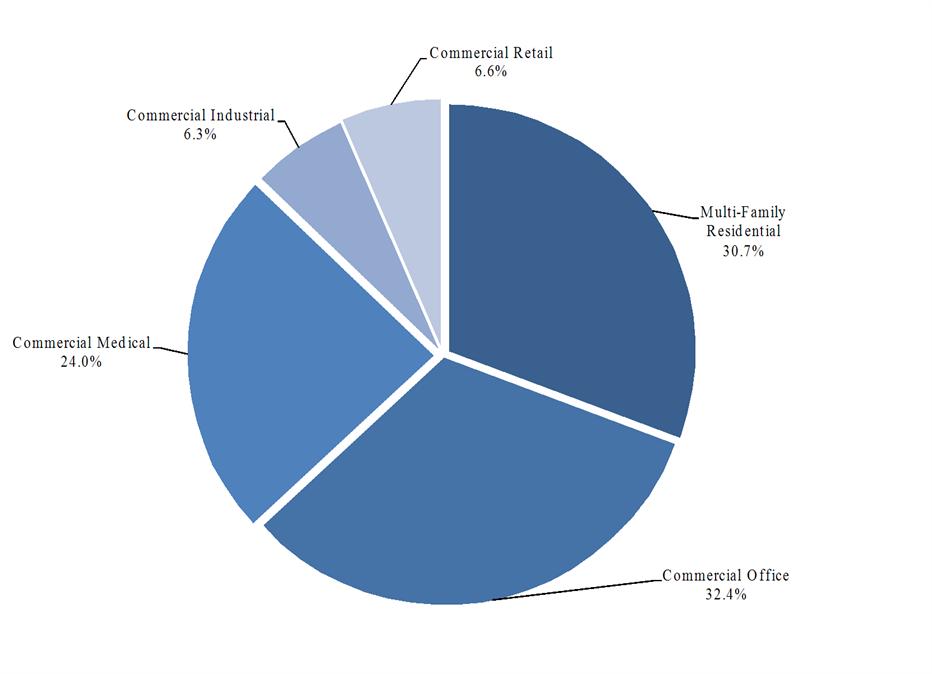
Investment Cost by Segment – Third Quarter Fiscal 2010
With investments in the multi-family residential and commercial office, medical, industrial and retail segments, IRET’s diversified portfolio helps to provide stability during market fluctuations in returns from specific property types.
INVESTORS REAL ESTATE TRUST AND SUBSIDIARIES
CONDENSED CONSOLIDATED BALANCE SHEETS (unaudited)
(in thousands)
|
01/31/2010
|
10/31/2009
|
07/31/2009
|
04/30/2009
|
01/31/2009
|
||||||||||||||||
|
ASSETS
|
||||||||||||||||||||
|
Real estate investments
|
||||||||||||||||||||
|
Property owned
|
$ | 1,793,995 | $ | 1,749,489 | $ | 1,737,466 | $ | 1,729,585 | $ | 1,719,690 | ||||||||||
|
Less accumulated depreciation
|
(298,523 | ) | (286,555 | ) | (274,497 | ) | (262,871 | ) | (251,493 | ) | ||||||||||
| 1,495,472 | 1,462,934 | 1,462,969 | 1,466,714 | 1,468,197 | ||||||||||||||||
|
Development in progress
|
1,164 | 0 | 0 | 0 | 0 | |||||||||||||||
|
Unimproved land
|
5,987 | 5,966 | 5,713 | 5,701 | 5,695 | |||||||||||||||
|
Mortgage loans receivable, net of allowance
|
159 | 159 | 160 | 160 | 161 | |||||||||||||||
|
Total real estate investments
|
1,502,782 | 1,469,059 | 1,468,842 | 1,472,575 | 1,474,053 | |||||||||||||||
|
Other assets
|
||||||||||||||||||||
|
Cash and cash equivalents
|
47,790 | 102,732 | 43,935 | 33,244 | 31,022 | |||||||||||||||
|
Restricted cash
|
36,500 | 0 | 0 | 0 | 0 | |||||||||||||||
|
Marketable securities – available-for-sale
|
420 | 420 | 420 | 420 | 420 | |||||||||||||||
|
Receivable arising from straight-lining of rents, net of allowance
|
17,102 | 16,588 | 16,201 | 16,012 | 15,558 | |||||||||||||||
|
Accounts receivable, net of allowance
|
5,259 | 4,830 | 4,148 | 2,738 | 3,678 | |||||||||||||||
|
Real estate deposits
|
978 | 635 | 460 | 88 | 242 | |||||||||||||||
|
Prepaid and other assets
|
1,903 | 2,750 | 2,900 | 1,051 | 1,514 | |||||||||||||||
|
Intangible assets, net of accumulated amortization
|
52,797 | 48,118 | 49,820 | 52,173 | 55,663 | |||||||||||||||
|
Tax, insurance, and other escrow
|
10,044 | 6,661 | 7,984 | 7,261 | 8,271 | |||||||||||||||
|
Property and equipment, net of accumulated depreciation
|
1,332 | 1,450 | 1,293 | 1,015 | 1,436 | |||||||||||||||
|
Goodwill
|
1,392 | 1,392 | 1,392 | 1,392 | 1,392 | |||||||||||||||
|
Deferred charges and leasing costs, net of accumulated amortization
|
17,637 | 17,273 | 16,958 | 17,122 | 16,039 | |||||||||||||||
|
TOTAL ASSETS
|
$ | 1,695,936 | $ | 1,671,908 | $ | 1,614,353 | $ | 1,605,091 | $ | 1,609,288 | ||||||||||
|
LIABILITIES AND EQUITY
|
||||||||||||||||||||
|
LIABILITIES
|
||||||||||||||||||||
|
Accounts payable and accrued expenses
|
$ | 36,453 | $ | 29,760 | $ | 32,508 | $ | 32,773 | $ | 32,275 | ||||||||||
|
Revolving lines of credit
|
6,579 | 6,594 | 13,000 | 5,500 | 8,500 | |||||||||||||||
|
Mortgages payable
|
1,091,945 | 1,060,131 | 1,055,705 | 1,070,158 | 1,068,127 | |||||||||||||||
|
Other
|
1,368 | 1,421 | 1,455 | 1,516 | 1,636 | |||||||||||||||
|
TOTAL LIABILITIES
|
1,136,345 | 1,097,906 | 1,102,668 | 1,109,947 | 1,110,538 | |||||||||||||||
|
REDEEMABLE NONCONTROLLING INTERESTS – CONSOLIDATED REAL ESTATE ENTITIES
|
1,765 | 1,943 | 1,908 | 1,737 | 1,939 | |||||||||||||||
|
EQUITY
|
||||||||||||||||||||
|
Investors Real Estate Trust shareholders’ equity
|
||||||||||||||||||||
|
Preferred Shares of Beneficial Interest
|
27,317 | 27,317 | 27,317 | 27,317 | 27,317 | |||||||||||||||
|
Common Shares of Beneficial Interest
|
569,439 | 566,395 | 490,441 | 461,648 | 451,296 | |||||||||||||||
|
Accumulated distributions in excess of net income
|
(189,340 | ) | (176,580 | ) | (165,349 | ) | (155,956 | ) | (147,573 | ) | ||||||||||
|
Total Investors Real Estate Trust shareholders’ equity
|
407,416 | 417,132 | 352,409 | 333,009 | 331,040 | |||||||||||||||
|
Noncontrolling interests – Operating Partnership
|
139,448 | 143,260 | 145,120 | 148,199 | 153,566 | |||||||||||||||
|
Noncontrolling interests – consolidated real estate entities
|
10,962 | 11,667 | 12,248 | 12,199 | 12,205 | |||||||||||||||
|
Total equity
|
557,826 | 572,059 | 509,777 | 493,407 | 496,811 | |||||||||||||||
|
TOTAL LIABILITIES AND EQUITY
|
$ | 1,695,936 | $ | 1,671,908 | $ | 1,614,353 | $ | 1,605,091 | $ | 1,609,288 | ||||||||||
INVESTORS REAL ESTATE TRUST AND SUBSIDIARIES
CONDENSED CONSOLIDATED STATEMENTS OF OPERATIONS (unaudited)
(in thousands, except per share data)
|
Nine Months Ended
|
Three Months Ended
|
|||||||||||||||||||||||||||
|
OPERATING RESULTS
|
01/31/2010
|
01/31/2009
|
01/31/2010
|
10/31/2009
|
07/31/2009
|
04/30/2009
|
01/31/2009
|
|||||||||||||||||||||
|
Real estate revenue
|
$ | 180,547 | $ | 179,353 | $ | 60,130 | $ | 59,596 | $ | 60,821 | $ | 60,652 | $ | 60,934 | ||||||||||||||
|
Real estate expenses
|
74,910 | 73,656 | 26,009 | 24,485 | 24,416 | 24,495 | 25,899 | |||||||||||||||||||||
|
Gain on involuntary conversion
|
1,660 | 0 | 1,660 | 0 | 0 | 0 | 0 | |||||||||||||||||||||
|
Net operating income
|
107,297 | 105,697 | 35,781 | 35,111 | 36,405 | 36,157 | 35,035 | |||||||||||||||||||||
|
Interest
|
(52,048 | ) | (51,307 | ) | (17,447 | ) | (17,200 | ) | (17,401 | ) | (17,436 | ) | (17,341 | ) | ||||||||||||||
|
Depreciation/amortization
|
(44,702 | ) | (42,276 | ) | (15,078 | ) | (14,981 | ) | (14,643 | ) | (14,438 | ) | (14,550 | ) | ||||||||||||||
|
Administrative expenses, advisory and trustee services
|
(4,775 | ) | (3,906 | ) | (1,790 | ) | (1,498 | ) | (1,487 | ) | (976 | ) | (1,336 | ) | ||||||||||||||
|
Other expenses
|
(1,468 | ) | (1,157 | ) | (536 | ) | (498 | ) | (434 | ) | (283 | ) | (313 | ) | ||||||||||||||
|
Impairment of real estate investment
|
(1,678 | ) | 0 | (818 | ) | (860 | ) | 0 | (338 | ) | 0 | |||||||||||||||||
|
Other income
|
507 | 688 | 252 | 126 | 129 | 234 | 152 | |||||||||||||||||||||
|
Gain on sale of other investments
|
0 | 54 | 0 | 0 | 0 | 0 | 0 | |||||||||||||||||||||
|
Net income
|
$ | 3,133 | $ | 7,793 | $ | 364 | $ | 200 | $ | 2,569 | $ | 2,920 | $ | 1,647 | ||||||||||||||
|
Net (income) loss attributable to noncontrolling interest – Operating Partnership
|
(381 | ) | (1,631 | ) | 39 | 59 | (479 | ) | (596 | ) | (284 | ) | ||||||||||||||||
|
Net loss (income) attributable to noncontrolling interests – consolidated real estate entities
|
2 | 97 | 49 | 26 | (73 | ) | (57 | ) | 15 | |||||||||||||||||||
|
Net income attributable to Investors Real Estate Trust
|
2,754 | 6,259 | 452 | 285 | 2,017 | 2,267 | 1,378 | |||||||||||||||||||||
|
Dividends to preferred shareholders
|
(1,779 | ) | (1,779 | ) | (593 | ) | (593 | ) | (593 | ) | (593 | ) | (593 | ) | ||||||||||||||
|
NET INCOME (LOSS) AVAILABLE TO COMMON SHAREHOLDERS
|
$ | 975 | $ | 4,480 | $ | (141 | ) | $ | (308 | ) | $ | 1,424 | $ | 1,674 | $ | 785 | ||||||||||||
|
Per Share Data
|
||||||||||||||||||||||||||||
|
Net income per common share – basic & diluted
|
$ | .02 | $ | .08 | $ | .00 | $ | .00 | $ | .02 | $ | .03 | $ | .02 | ||||||||||||||
|
Percentage of Revenues
|
||||||||||||||||||||||||||||
|
Real estate expenses
|
41.5 | % | 41.1 | % | 43.3 | % | 41.1 | % | 40.1 | % | 40.4 | % | 42.5 | % | ||||||||||||||
|
Interest
|
28.8 | % | 28.6 | % | 29.0 | % | 28.9 | % | 28.6 | % | 28.7 | % | 28.5 | % | ||||||||||||||
|
Depreciation/amortization
|
24.8 | % | 23.6 | % | 25.1 | % | 25.1 | % | 24.1 | % | 23.8 | % | 23.9 | % | ||||||||||||||
|
General and administrative
|
2.6 | % | 2.2 | % | 3.0 | % | 2.5 | % | 2.4 | % | 1.6 | % | 2.2 | % | ||||||||||||||
|
Net income
|
1.7 | % | 4.3 | % | 0.6 | % | 0.3 | % | 4.2 | % | 4.8 | % | 2.7 | % | ||||||||||||||
|
Ratios
|
||||||||||||||||||||||||||||
|
EBITDA(1)/Interest expense
|
1.92 | x | 1.96 | x | 1.88 | x | 1.88 | x | 1.98 | x | 1.99 | x | 1.93 | x | ||||||||||||||
|
EBITDA/Interest expense plus preferred distributions
|
1.85 | x | 1.90 | x | 1.82 | x | 1.82 | x | 1.92 | x | 1.92 | x | 1.86 | x | ||||||||||||||
|
(1)
|
See Definitions on page 26. EBITDA is a non-GAAP measure; see page 9 for a reconciliation of EBITDA to net income (loss).
|
INVESTORS REAL ESTATE TRUST AND SUBSIDIARIES
FUNDS FROM OPERATIONS (unaudited)
(in thousands, except per share and unit data)
|
Nine Months Ended
|
Three Months Ended
|
|||||||||||||||||||||||||||
|
01/31/2010
|
01/31/2009
|
01/31/2010
|
10/31/2009
|
07/31/2009
|
04/30/2009
|
01/31/2009
|
||||||||||||||||||||||
|
Funds From Operations(1)
|
||||||||||||||||||||||||||||
|
Net income attributable to Investors Real Estate Trust
|
$ | 2,754 | $ | 6,259 | $ | 452 | $ | 285 | $ | 2,017 | $ | 2,267 | $ | 1,378 | ||||||||||||||
|
Less dividends to preferred shareholders
|
(1,779 | ) | (1,779 | ) | (593 | ) | (593 | ) | (593 | ) | (593 | ) | (593 | ) | ||||||||||||||
|
Net income (loss) available to common shareholders
|
975 | 4,480 | (141 | ) | (308 | ) | 1,424 | 1,674 | 785 | |||||||||||||||||||
|
Adjustments:
|
||||||||||||||||||||||||||||
|
Noncontrolling interests – Operating Partnership
|
381 | 1,631 | (39 | ) | (59 | ) | 479 | 596 | 284 | |||||||||||||||||||
|
Depreciation and amortization
|
44,390 | 41,935 | 14,865 | 14,926 | 14,599 | 14,360 | 14,454 | |||||||||||||||||||||
|
Gain on depreciable property sales
|
0 | (54 | ) | 0 | 0 | 0 | 0 | 0 | ||||||||||||||||||||
|
Funds from operations applicable to common shares and Units
|
$ | 45,746 | $ | 47,992 | $ | 14,685 | $ | 14,559 | $ | 16,502 | $ | 16,630 | $ | 15,523 | ||||||||||||||
|
FFO per share and unit - basic and diluted
|
$ | 0.52 | $ | 0.60 | $ | 0.16 | $ | 0.16 | $ | 0.20 | $ | 0.21 | $ | 0.19 | ||||||||||||||
|
Weighted average shares and units
|
88,284 | 79,642 | 94,516 | 87,162 | 83,223 | 80,361 | 80,038 | |||||||||||||||||||||
|
(1)
|
See Definitions on page 26.
|
INVESTORS REAL ESTATE TRUST AND SUBSIDIARIES
EARNINGS BEFORE INTEREST, TAXES, DEPRECIATION AND AMORTIZATION (EBITDA) (unaudited)
(in thousands)
|
Nine Months Ended
|
Three Months Ended
|
|||||||||||||||||||||||||||
|
01/31/2010
|
01/31/2009
|
01/31/2010
|
10/31/2009
|
07/31/2009
|
04/30/2009
|
01/31/2009
|
||||||||||||||||||||||
|
EBITDA(1)
|
||||||||||||||||||||||||||||
|
Net income attributable to Investors Real Estate Trust
|
$ | 2,754 | $ | 6,259 | $ | 452 | $ | 285 | $ | 2,017 | $ | 2,267 | $ | 1,378 | ||||||||||||||
|
Adjustments:
|
||||||||||||||||||||||||||||
|
Noncontrolling interests – Operating Partnership
|
381 | 1,631 | (39 | ) | (59 | ) | 479 | 596 | 284 | |||||||||||||||||||
|
Income before noncontrolling interests – Operating Partnership
|
3,135 | 7,890 | 413 | 226 | 2,496 | 2,863 | 1,662 | |||||||||||||||||||||
|
Add:
|
||||||||||||||||||||||||||||
|
Interest
|
52,048 | 51,307 | 17,447 | 17,200 | 17,401 | 17,436 | 17,341 | |||||||||||||||||||||
|
Depreciation/amortization related to real estate investments
|
42,986 | 40,821 | 14,486 | 14,432 | 14,068 | 13,825 | 14,023 | |||||||||||||||||||||
|
Amortization related to non-real estate investments
|
1,716 | 1,455 | 592 | 549 | 575 | 613 | 527 | |||||||||||||||||||||
|
Amortization related to real estate revenues(2)
|
92 | (136 | ) | 28 | 30 | 34 | 3 | (27 | ) | |||||||||||||||||||
|
Less:
|
||||||||||||||||||||||||||||
|
Interest income
|
(268 | ) | (556 | ) | (140 | ) | (62 | ) | (66 | ) | (51 | ) | (123 | ) | ||||||||||||||
|
Gain on sale of real estate, land and other investments
|
0 | (54 | ) | 0 | 0 | 0 | 0 | 0 | ||||||||||||||||||||
|
EBITDA
|
$ | 99,709 | $ | 100,727 | $ | 32,826 | $ | 32,375 | $ | 34,508 | $ | 34,689 | $ | 33,403 | ||||||||||||||
|
(1)
|
See Definitions on page 26.
|
|
(2)
|
Included in real estate revenue in the Statement of Operations.
|
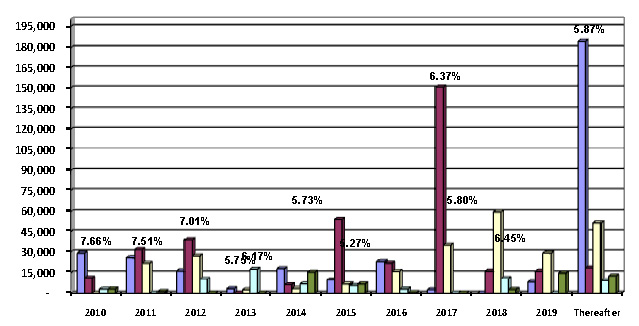
INVESTORS REAL ESTATE TRUST AND SUBSIDIARIES
LONG-TERM MORTGAGE DEBT ANALYSIS
(in thousands)
Debt Maturity Schedule
Annual Expirations
Total Mortgage Debt
|
|
|||||||||||||||||||||
|
Fiscal Year
|
Fixed Debt
|
Variable Debt
|
Total Debt
|
Weighted
Average(1)
|
% of
Total Debt
|
||||||||||||||||
| 2010 | $ | 35,895 | $ | 0 | $ | 35,895 | 7.66 | % | 3.3 | % | |||||||||||
| 2011 | 79,798 | 3,403 | 83,201 | 7.51 | % | 7.6 | % | ||||||||||||||
| 2012 | 92,452 | 0 | 92,452 | 7.01 | % | 8.5 | % | ||||||||||||||
| 2013 | 22,892 | 0 | 22,892 | 5.75 | % | 2.1 | % | ||||||||||||||
| 2014 | 47,685 | 962 | 48,647 | 6.17 | % | 4.5 | % | ||||||||||||||
| 2015 | 81,343 | 0 | 81,343 | 5.73 | % | 7.4 | % | ||||||||||||||
| 2016 | 99,949 | 247 | 100,196 | 5.27 | % | 9.2 | % | ||||||||||||||
| 2017 | 187,915 | 0 | 187,915 | 6.37 | % | 17.2 | % | ||||||||||||||
| 2018 | 88,884 | 0 | 88,884 | 5.80 | % | 8.1 | % | ||||||||||||||
| 2019 | 66,800 | 659 | 67,459 | 6.45 | % | 6.2 | % | ||||||||||||||
|
Thereafter
|
282,651 | 410 | 283,061 | 5.87 | % | 25.9 | % | ||||||||||||||
|
Total maturities
|
$ | 1,086,264 | $ | 5,681 | $ | 1,091,945 | 6.21 | % | 100.0 | % | |||||||||||
|
(1)
|
Weighted average interest rate of debt that matures in fiscal year.
|
|
01/31/2010
|
10/31/2009
|
07/31/2009
|
04/30/2009
|
01/31/2009
|
||||||||||||||||
|
Balances Outstanding
|
||||||||||||||||||||
|
Mortgage
|
||||||||||||||||||||
|
Fixed rate
|
$ | 1,086,264 | $ | 1,054,363 | $ | 1,046,530 | $ | 1,060,581 | $ | 1,053,527 | ||||||||||
|
Variable rate
|
5,681 | 5,768 | 9,175 | 9,577 | 14,600 | |||||||||||||||
|
Mortgage total
|
1,091,945 | 1,060,131 | 1,055,705 | 1,070,158 | 1,068,127 | |||||||||||||||
|
Weighted Average Interest Rates
|
||||||||||||||||||||
|
Secured
|
6.21 | % | 6.27 | % | 6.31 | % | 6.30 | % | 6.34 | % | ||||||||||
INVESTORS REAL ESTATE TRUST AND SUBSIDIARIES
LONG-TERM MORTGAGE DEBT DETAIL AS OF JANUARY 31, 2010
|
Property
|
Maturity Date
|
Fiscal 2010
|
Fiscal 2011
|
Fiscal 2012
|
Fiscal 2013
|
Thereafter
|
Total(1)
|
||||||||||||||||||
|
Multi-Family Residential
|
|||||||||||||||||||||||||
|
Dakota Hill at Valley Ranch - Irving, TX(2)
|
2/1/2010
|
$ | 22,396 | $ | 0 | $ | 0 | $ | 0 | $ | 0 | $ | 22,396 | ||||||||||||
|
Southbrook & Mariposa - Topeka, KS(3)
|
2/1/2010
|
3,125 | 0 | 0 | 0 | 0 | 3,125 | ||||||||||||||||||
|
Kirkwood Manor - Bismarck, ND(2)
|
5/1/2010
|
0 | 1,880 | 0 | 0 | 0 | 1,880 | ||||||||||||||||||
|
The Meadows I - Jamestown, ND
|
8/1/2010
|
0 | 895 | 0 | 0 | 0 | 895 | ||||||||||||||||||
|
The Meadows II - Jamestown, ND
|
8/1/2010
|
0 | 895 | 0 | 0 | 0 | 895 | ||||||||||||||||||
|
17 South Main Apartments - Minot, ND
|
11/1/2010
|
0 | 194 | 0 | 0 | 0 | 194 | ||||||||||||||||||
|
401 South Main Apartments - Minot, ND
|
11/1/2010
|
0 | 681 | 0 | 0 | 0 | 681 | ||||||||||||||||||
|
Minot 4th Street Apartments - Minot, ND
|
11/1/2010
|
0 | 97 | 0 | 0 | 0 | 97 | ||||||||||||||||||
|
Minot 11th Street Apartments - Minot, ND
|
11/1/2010
|
0 | 97 | 0 | 0 | 0 | 97 | ||||||||||||||||||
|
Minot Fairmont Apartments - Minot, ND
|
11/1/2010
|
0 | 389 | 0 | 0 | 0 | 389 | ||||||||||||||||||
|
Minot Westridge Apartments - Minot, ND
|
11/1/2010
|
0 | 1,944 | 0 | 0 | 0 | 1,944 | ||||||||||||||||||
|
Olympic Village - Billings, MT
|
11/1/2010
|
0 | 7,564 | 0 | 0 | 0 | 7,564 | ||||||||||||||||||
|
Southview Apartments - Minot, ND
|
11/1/2010
|
0 | 720 | 0 | 0 | 0 | 720 | ||||||||||||||||||
|
Valley Park Manor - Grand Forks, ND
|
11/1/2010
|
0 | 2,684 | 0 | 0 | 0 | 2,684 | ||||||||||||||||||
|
Valley Park Manor - Grand Forks, ND
|
11/1/2010
|
0 | 815 | 0 | 0 | 0 | 815 | ||||||||||||||||||
|
Ridge Oaks Apartments - Sioux City, IA
|
2/1/2011
|
0 | 2,585 | 0 | 0 | 0 | 2,585 | ||||||||||||||||||
|
Sunset Trail I - Rochester, MN
|
3/1/2011
|
0 | 3,888 | 0 | 0 | 0 | 3,888 | ||||||||||||||||||
|
Sunset Trail II - Rochester, MN
|
3/1/2011
|
0 | 3,770 | 0 | 0 | 0 | 3,770 | ||||||||||||||||||
|
Oakwood - Sioux Falls, SD
|
6/1/2011
|
0 | 0 | 3,428 | 0 | 0 | 3,428 | ||||||||||||||||||
|
Oxbow - Sioux Falls, SD
|
6/1/2011
|
0 | 0 | 3,735 | 0 | 0 | 3,735 | ||||||||||||||||||
|
Chateau Apartments - Minot, ND
|
7/1/2011
|
0 | 0 | 1,776 | 0 | 0 | 1,776 | ||||||||||||||||||
|
Oakmont Apartments - Sioux Falls, SD
|
9/1/2011
|
0 | 0 | 3,691 | 0 | 0 | 3,691 | ||||||||||||||||||
|
Canyon Lake Apartments - Rapid City, SD
|
10/1/2011
|
0 | 0 | 2,663 | 0 | 0 | 2,663 | ||||||||||||||||||
|
The Meadows III - Jamestown, ND
|
11/1/2011
|
0 | 0 | 979 | 0 | 0 | 979 | ||||||||||||||||||
|
Monticello Apartments - Monticello, MN
|
3/1/2013
|
0 | 0 | 0 | 3,101 | 0 | 3,101 | ||||||||||||||||||
|
Summary of Debt due after Fiscal 2013
|
0 | 0 | 0 | 0 | 252,963 | 252,963 | |||||||||||||||||||
|
Sub-Total Multi-Family Residential
|
$ | 25,521 | $ | 29,098 | $ | 16,272 | $ | 3,101 | $ | 252,963 | $ | 326,955 | |||||||||||||
|
Commercial Office
|
|||||||||||||||||||||||||
|
Northgate II - Maple Grove, MN(2)
|
2/1/2010
|
$ | 1,280 | $ | $ | 0 | $ | 0 | $ | 0 | $ | 1,280 | |||||||||||||
|
Southeast Tech Center - Eagan, MN(2)
|
2/1/2010
|
3,463 | 0 | 0 | 0 | 3,463 | |||||||||||||||||||
|
Brenwood - Minnetonka, MN
|
10/1/2010
|
0 | 7,469 | 0 | 0 | 0 | 7,469 | ||||||||||||||||||
|
Nicollet VII - Burnsville, MN
|
12/1/2010
|
0 | 4,000 | 0 | 0 | 0 | 4,000 | ||||||||||||||||||
|
Dewey Hill Business Center - Edina, MN
|
1/1/2011
|
0 | 2,604 | 0 | 0 | 0 | 2,604 | ||||||||||||||||||
|
Plymouth IV - Plymouth, MN
|
1/1/2011
|
0 | 3,194 | 0 | 0 | 0 | 3,194 | ||||||||||||||||||
|
Plymouth V - Plymouth, MN
|
1/1/2011
|
0 | 4,596 | 0 | 0 | 0 | 4,596 | ||||||||||||||||||
|
Whitewater Plaza - Minnetonka, MN
|
3/1/2011
|
0 | 2,651 | 0 | 0 | 0 | 2,651 | ||||||||||||||||||
|
Whitewater Plaza - Minnetonka, MN
|
3/1/2011
|
0 | 1,374 | 0 | 0 | 0 | 1,374 | ||||||||||||||||||
|
2030 Cliff Road - Eagan, MN
|
4/1/2011
|
0 | 475 | 0 | 0 | 0 | 475 | ||||||||||||||||||
|
Cold Spring Center - St. Cloud, MN
|
4/1/2011
|
0 | 4,080 | 0 | 0 | 0 | 4,080 | ||||||||||||||||||
|
Pillsbury Business Center - Edina, MN
|
4/1/2011
|
0 | 921 | 0 | 0 | 0 | 921 | ||||||||||||||||||
|
Golden Hills Office Center - Golden Valley, MN
|
7/1/2011
|
0 | 0 | 14,394 | 0 | 0 | 14,394 | ||||||||||||||||||
|
Wells Fargo Center - St Cloud, MN
|
7/1/2011
|
0 | 0 | 6,693 | 0 | 0 | 6,693 | ||||||||||||||||||
|
Interlachen Corporate Center - Eagan, MN
|
10/11/2011
|
0 | 0 | 9,666 | 0 | 0 | 9,666 | ||||||||||||||||||
|
Bloomington Business Plaza - Bloomington, MN
|
12/1/2011
|
0 | 0 | 4,203 | 0 | 0 | 4,203 | ||||||||||||||||||
|
Wirth Corporate Center - Golden Valley, MN
|
2/1/2012
|
0 | 0 | 4,085 | 0 | 0 | 4,085 | ||||||||||||||||||
|
Summary of Debt due after Fiscal 2013
|
0 | 0 | 0 | 0 | 281,946 | 281,946 | |||||||||||||||||||
|
Sub-Total Commercial Office
|
$ | 4,743 | $ | 31,364 | $ | 39,041 | $ | 0 | $ | 281,946 | $ | 357,094 | |||||||||||||
INVESTORS REAL ESTATE TRUST AND SUBSIDIARIES
LONG-TERM MORTGAGE DEBT DETAIL AS OF JANUARY 31, 2010 (continued)
|
Property
|
Maturity Date
|
Fiscal 2010
|
Fiscal 2011
|
Fiscal 2012
|
Fiscal 2013
|
Thereafter
|
Total(1)
|
||||||||||||||||||
|
Commercial Medical
|
|||||||||||||||||||||||||
|
Edina 6545 France SMC I - Edina, MN
|
1/1/2011
|
$ | 0 | $ | 21,721 | $ | 0 | $ | 0 | $ | 0 | $ | 21,721 | ||||||||||||
|
Edina 6525 France SMC II - Edina, MN
|
6/1/2011
|
0 | 0 | 9,739 | 0 | 0 | 9,739 | ||||||||||||||||||
|
Edina 6405 France Medical - Edina, MN
|
1/1/2012
|
0 | 0 | 9,172 | 0 | 0 | 9,172 | ||||||||||||||||||
|
Edina 6363 France Medical - Edina, MN
|
4/1/2012
|
0 | 0 | 8,019 | 0 | 0 | 8,019 | ||||||||||||||||||
|
Fox River Cottages - Grand Chute, WI
|
5/1/2012
|
0 | 0 | 0 | 2,277 | 0 | 2,277 | ||||||||||||||||||
|
Summary of Debt due after Fiscal 2013
|
0 | 0 | 0 | 0 | 235,929 | 235,929 | |||||||||||||||||||
|
Sub-Total Commercial Medical
|
$ | 0 | $ | 21,721 | $ | 26,930 | $ | 2,277 | $ | 235,929 | $ | 286,857 | |||||||||||||
|
Commercial Industrial
|
|||||||||||||||||||||||||
|
Lexington Commerce Center - Eagan, MN(2)
|
2/1/2010
|
$ | 2,786 | $ | 0 | $ | 0 | $ | 0 | $ | 0 | $ | 2,786 | ||||||||||||
|
Eagan 2785 & 2795 Highway 55 - Eagan, MN
|
6/1/2011
|
0 | 0 | 3,722 | 0 | 0 | 3,722 | ||||||||||||||||||
|
Stone Container - Roseville, MN
|
2/1/2012
|
0 | 0 | 4,018 | 0 | 0 | 4,018 | ||||||||||||||||||
|
Minnetonka 13600 County Road 62 - Minnetonka, MN
|
2/27/2012
|
0 | 0 | 2,469 | 0 | 0 | 2,469 | ||||||||||||||||||
|
Dixon Avenue Industrial Park - Des Moines, IA
|
1/1/2013
|
0 | 0 | 0 | 7,609 | 0 | 7,609 | ||||||||||||||||||
|
Bloomington 2000 West 94th Street - Bloomington, MN
|
3/1/2013
|
0 | 0 | 0 | 4,009 | 0 | 4,009 | ||||||||||||||||||
|
Roseville 2929 Long Lake Road - Roseville, MN
|
3/1/2013
|
0 | 0 | 0 | 5,896 | 0 | 5,896 | ||||||||||||||||||
|
Summary of Debt due after Fiscal 2013
|
0 | 0 | 0 | 0 | 34,789 | 34,789 | |||||||||||||||||||
|
Sub-Total Commercial Industrial
|
$ | 2,786 | $ | 0 | $ | 10,209 | $ | 17,514 | $ | 34,789 | $ | 65,298 | |||||||||||||
|
Commercial Retail
|
|||||||||||||||||||||||||
|
Grand Forks MedPark Mall - Grand Forks, ND(4)
|
3/1/2010
|
$ | 2,845 | $ | 0 | $ | 0 | $ | 0 | $ | 0 | $ | 2,845 | ||||||||||||
|
Minot Plaza - Minot, ND
|
8/1/2010
|
0 | 618 | 0 | 0 | 0 | 618 | ||||||||||||||||||
|
Kentwood Thomasville Furniture - Kentwood, MI
|
2/1/2011
|
0 | 400 | 0 | 0 | 0 | 400 | ||||||||||||||||||
|
Summary of Debt due after Fiscal 2013
|
0 | 0 | 0 | 51,878 | 51,878 | ||||||||||||||||||||
|
Sub-Total Commercial Retail
|
$ | 2,845 | $ | 1,018 | $ | 0 | $ | 0 | $ | 51,878 | $ | 55,741 | |||||||||||||
|
Total
|
$ | 35,895 | $ | 83,201 | $ | 92,452 | $ | 22,892 | $ | 857,505 | $ | 1,091,945 | |||||||||||||
|
(1)
|
Totals are principal balances as of January 31, 2010.
|
|
(2)
|
Refinanced on February 1, 2010.
|
|
(3)
|
Loan balance paid off on 2/1/2010; currently under application to refinance.
|
|
(4)
|
Loan balance paid off on 3/1/2010; currently in discussion with lenders for refinance.
|
INVESTORS REAL ESTATE TRUST AND SUBSIDIARIES
CAPITAL ANALYSIS
(in thousands, except per share and unit amounts)
|
01/31/2010
|
10/31/2009
|
07/31/2009
|
04/30/2009
|
01/31/2009
|
||||||||||||||||
|
Equity Capitalization
|
||||||||||||||||||||
|
Common shares outstanding
|
73,966 | 73,502 | 63,788 | 60,304 | 59,127 | |||||||||||||||
|
Operating partnership (OP) units outstanding
|
20,853 | 20,962 | 20,837 | 20,838 | 21,184 | |||||||||||||||
|
Total common shares and OP units outstanding
|
94,819 | 94,464 | 84,625 | 81,142 | 80,311 | |||||||||||||||
|
Market price per common share (closing price at end of period)
|
$ | 8.73 | $ | 8.37 | $ | 9.31 | $ | 9.25 | $ | 9.95 | ||||||||||
|
Equity capitalization-common shares and OP units
|
$ | 827,770 | $ | 790,664 | $ | 787,859 | $ | 750,564 | $ | 799,094 | ||||||||||
|
Recorded book value of preferred shares
|
$ | 27,317 | $ | 27,317 | $ | 27,317 | $ | 27,317 | $ | 27,317 | ||||||||||
|
Total equity capitalization
|
$ | 855,087 | $ | 817,981 | $ | 815,176 | $ | 777,881 | $ | 826,411 | ||||||||||
|
Debt Capitalization
|
||||||||||||||||||||
|
Total mortgage debt
|
$ | 1,091,945 | $ | 1,060,131 | $ | 1,055,705 | $ | 1,070,158 | $ | 1,068,127 | ||||||||||
|
Total capitalization
|
$ | 1,947,032 | $ | 1,878,112 | $ | 1,870,881 | $ | 1,848,039 | $ | 1,894,538 | ||||||||||
|
Total debt to total capitalization
|
0.56:1
|
0.56:1
|
0.56:1
|
0.58:1
|
0.56:1
|
|||||||||||||||
|
Earnings to fixed charges(1)
|
1.03 | x | 1.02 | x | 1.11 | x | 1.16 | x | 1.08 | x | ||||||||||
|
Earnings to combined fixed charges and preferred distributions(1)
|
0.99 | x | 0.98 | x | 1.08 | x | 1.13 | x | 1.05 | x | ||||||||||
|
Debt service coverage ratio(1)
|
1.36 | x | 1.36 | x | 1.39 | x | 1.42 | x | 1.39 | x | ||||||||||
|
Distribution Data
|
||||||||||||||||||||
|
Common shares and units outstanding at record date
|
94,497 | 84,818 | 84,280 | 80,323 | 80,018 | |||||||||||||||
|
Total common distribution paid
|
$ | 16,205 | $ | 14,504 | $ | 14,370 | $ | 13,656 | $ | 13,562 | ||||||||||
|
Common distribution per share and unit
|
$ | .1715 | $ | .1710 | $ | .1705 | $ | 0.1700 | $ | 0.1695 | ||||||||||
|
Payout ratio (FFO per share and unit basis)(1)
|
107.2 | % | 106.9 | % | 85.3 | % | 81.0 | % | 89.2 | % | ||||||||||
|
(1)
|
See Definitions on page 26.
|
INVESTORS REAL ESTATE TRUST AND SUBSIDIARIES
STABILIZED PROPERTIES NET OPERATING INCOME SUMMARY
(in thousands)
|
Stabilized Properties(1)
|
Stabilized Properties
|
|||||||||||||||||||||||
|
Three Months Ended
January 31,
|
Nine Months Ended
January 31,
|
|||||||||||||||||||||||
|
Segment
|
2010
|
2009
|
%
Change
|
2010
|
2009
|
%
Change
|
||||||||||||||||||
|
Multi-Family Residential
|
$ | 8,809 | $ | 9,752 | (9.7 | %) | $ | 27,863 | $ | 29,623 | (5.9 | %) | ||||||||||||
|
Commercial Office
|
11,059 | 11,183 | (1.1 | %) | 34,165 | 34,023 | 0.4 | % | ||||||||||||||||
|
Commercial Medical
|
9,158 | 8,736 | 4.8 | % | 27,927 | 26,796 | 4.2 | % | ||||||||||||||||
|
Commercial Industrial
|
1,981 | 2,530 | (21.7 | %) | 6,291 | 7,066 | (11.0 | %) | ||||||||||||||||
|
Commercial Retail
|
1,952 | 2,347 | (16.8 | %) | 6,510 | 7,042 | (7.6 | %) | ||||||||||||||||
| $ | 32,959 | $ | 34,548 | (4.6 | %) | $ | 102,756 | $ | 104,550 | (1.7 | %) | |||||||||||||
|
(1)
|
For Three and Nine Months Ended January 31, 2010, stabilized properties excluded:
|
|
Multi-Family Residential -
|
Minot 4th Street Apartments, Minot, ND; Minot 11th Street Apartments, Minot, ND; Minot Fairmont Apartments, Minot, ND; Minot Westridge Apartments, Minot, ND; Thomasbrook Apartments, Lincoln, NE; Evergreen Apartments, Isanti, MN; 401 South Main, Minot, ND and IRET Corporate Plaza, Minot, ND.
Total number of units, 433. Occupancy % for the three and nine months ended January 31, 2010, 88.8% and 89.5%, respectively.
|
|
Commercial Office -
|
Bismarck 715 E Broadway, Bismarck, ND; 401 South Main, Minot, ND; IRET Corporate Plaza, Minot, ND, 12 South Main Street, Minot, ND and Minot 2505 16th St SW, Minot, ND.
Total square footage, 87,810. Occupancy % for the three and nine months ended January 31, 2010, 23.5% and 16.7%, respectively.
|
|
Commercial Medical -
|
2828 Chicago Avenue, Minneapolis, MN; Casper 1930 E 12th Street (Park Place), Casper, WY; Casper 3955 E 12th Street (Meadow Wind), Casper, WY; Cheyenne 4010 N College Drive (Aspen Wind), Cheyenne, WY; Cheyenne 4060 N College Drive (Sierra Hills), Cheyenne, WY and Laramie 1072 N 22nd Street (Spring Wind), Laramie, WY.
Total square footage, 294,238. Occupancy % for the three and nine months ended January 31, 2010, 93.9% and 91.3%, respectively.
|
|
Commercial Industrial -
|
Minnetonka 13600 County Road 62, Minnetonka, MN and Clive 2075 NW 94th St., Clive, IA.
Total square footage, 112,494. Occupancy % for the three and nine months ended January 31, 2010, 100% and 100.0%, respectively.
|
|
|
For Three and Nine Months ended January 31, 2009, stabilized properties excluded:
|
|
Multi-Family Residential -
|
Minot 4th Street Apartments, Minot, ND; Minot 11th Street Apartments, Minot, ND; Minot Fairmont Apartments, Minot, ND; Minot Westridge Apartments, Minot, ND, Thomasbrook Apartments, Lincoln, NE; Evergreen Apartments, Isanti, MN and 401 South Main, Minot, ND and IRET Corporate Plaza, Minot, ND.
Total number of units, 409. Occupancy % for the three and nine months ended January 31, 2009, 86.7% and 88.5%, respectively.
|
|
Commercial Office -
|
401 South Main, Minot, ND; Bismarck 715 E Broadway, Bismarck, ND and IRET Corporate Plaza, Minot, ND.
Total square footage, 76,835. Occupancy % for the three and nine months ended January 31, 2009, 100.0% and 100.0%, respectively.
|
|
Commercial Medical -
|
2828 Chicago Avenue, Minneapolis, MN.
Total square footage, 56,239. Occupancy % for the three and nine months ended January 31, 2009, 73.3% and 70.9%, respectively.
|
|
Commercial Industrial -
|
Minnetonka 13600 County Road 62, Minnetonka, MN.
Total square footage, 69,984. Occupancy % for the three and nine months ended January 31, 2010, 100% and 100.0%, respectively.
|
INVESTORS REAL ESTATE TRUST AND SUBSIDIARIES
NET OPERATING INCOME DETAIL
(in thousands)
|
Three Months Ended January 31, 2010
|
||||||||||||||||||||||||||||
|
Reporting Segments
|
||||||||||||||||||||||||||||
|
Multi-Family
Residential
|
Commercial
Office
|
Commercial
Medical
|
Commercial
Industrial
|
Commercial
Retail
|
Corporate and
Other
|
Total
|
||||||||||||||||||||||
|
Real estate rental revenue
|
||||||||||||||||||||||||||||
|
Stabilized(1)
|
$ | 18,207 | $ | 20,221 | $ | 12,686 | $ | 2,992 | $ | 3,314 | $ | 0 | $ | 57,420 | ||||||||||||||
|
Non-Stabilized
|
853 | 82 | 1,537 | 238 | 0 | 0 | 2,710 | |||||||||||||||||||||
|
Total
|
19,060 | 20,303 | 14,223 | 3,230 | 3,314 | 0 | 60,130 | |||||||||||||||||||||
|
Real estate expenses
|
||||||||||||||||||||||||||||
|
Stabilized(1)
|
9,398 | 9,162 | 3,528 | 1,011 | 1,362 | 0 | 24,461 | |||||||||||||||||||||
|
Non-Stabilized
|
462 | 71 | 953 | 62 | 0 | 0 | 1,548 | |||||||||||||||||||||
|
Total
|
9,860 | 9,233 | 4,481 | 1,073 | 1,362 | 0 | 26,009 | |||||||||||||||||||||
|
Gain on involuntary conversion
|
||||||||||||||||||||||||||||
|
Non-Stabilized
|
1,660 | 0 | 0 | 0 | 0 | 0 | 1,660 | |||||||||||||||||||||
|
Total
|
1,660 | 0 | 0 | 0 | 0 | 0 | 1,660 | |||||||||||||||||||||
|
Stabilized(1)
|
8,809 | 11,059 | 9,158 | 1,981 | 1,952 | 0 | 32,959 | |||||||||||||||||||||
|
Non-Stabilized
|
2,051 | 11 | 584 | 176 | 0 | 0 | 2,822 | |||||||||||||||||||||
|
Net operating income
|
$ | 10,860 | $ | 11,070 | $ | 9,742 | $ | 2,157 | $ | 1,952 | $ | 0 | $ | 35,781 | ||||||||||||||
|
Reconciliation of NOI to net income (loss) available to common shareholders
|
||||||||||||||||||||||||||||
|
Interest expense
|
$ | (5,061 | ) | $ | (5,737 | ) | $ | (4,327 | ) | $ | (1,021 | ) | $ | (856 | ) | $ | (445 | ) | $ | (17,447 | ) | |||||||
|
Depreciation/amortization
|
(3,947 | ) | (4,258 | ) | (3,125 | ) | (827 | ) | (957 | ) | (1,964 | ) | (15,078 | ) | ||||||||||||||
|
Administrative, advisory and trustee fees
|
0 | 0 | 0 | 0 | 0 | (1,790 | ) | (1,790 | ) | |||||||||||||||||||
|
Other expenses
|
0 | 0 | 0 | 0 | 0 | (536 | ) | (536 | ) | |||||||||||||||||||
|
Impairment of real estate investments
|
0 | 0 | 0 | (818 | ) | 0 | (818 | ) | ||||||||||||||||||||
|
Other income
|
0 | 0 | 0 | 0 | 0 | 252 | 252 | |||||||||||||||||||||
|
Net income (loss)
|
1,852 | 1,075 | 2,290 | 309 | (679 | ) | (4,483 | ) | 364 | |||||||||||||||||||
|
Net income attributable to noncontrolling interests – Operating Partnership
|
0 | 0 | 0 | 0 | 0 | 39 | 39 | |||||||||||||||||||||
|
Net (income) loss attributable to noncontrolling interests – consolidated real estate entities
|
0 | 0 | 0 | 0 | 0 | 49 | 49 | |||||||||||||||||||||
|
Net income (loss) attributable to Investors Real Estate Trust
|
1,852 | 1,075 | 2,290 | 309 | (679 | ) | (4,395 | ) | 452 | |||||||||||||||||||
|
Dividends to preferred shareholders
|
0 | 0 | 0 | 0 | 0 | (593 | ) | (593 | ) | |||||||||||||||||||
|
NET INCOME (LOSS) AVAILABLE TO COMMON SHAREHOLDERS
|
$ | 1,852 | $ | 1,075 | $ | 2,290 | $ | 309 | $ | (679 | ) | $ | (4,988 | ) | $ | (141 | ) | |||||||||||
|
(1)
|
For Three and Nine Months Ended January 31, 2010, stabilized properties excluded:
|
|
Multi-Family Residential -
|
Minot 4th Street Apartments, Minot, ND; Minot 11th Street Apartments, Minot, ND; Minot Fairmont Apartments, Minot, ND; Minot Westridge Apartments, Minot, ND; Thomasbrook Apartments, Lincoln, NE; Evergreen Apartments, Isanti, MN; 401 South Main, Minot, ND and IRET Corporate Plaza, Minot, ND.
Total number of units, 433. Occupancy % for the three and nine months ended January 31, 2010, 88.8% and 89.5%, respectively.
|
|
Commercial Office -
|
Bismarck 715 E Broadway, Bismarck, ND; 401 South Main, Minot, ND; IRET Corporate Plaza, Minot, ND, 12 South Main Street, Minot, ND and Minot 2505 16th St SW, Minot, ND.
Total square footage, 87,810. Occupancy % for the three and nine months ended January 31, 2010, 23.5% and 16.7%, respectively.
|
|
Commercial Medical -
|
2828 Chicago Avenue, Minneapolis, MN; Casper 1930 E 12th Street (Park Place), Casper, WY; Casper 3955 E 12th Street (Meadow Wind), Casper, WY; Cheyenne 4010 N College Drive (Aspen Wind), Cheyenne, WY; Cheyenne 4060 N College Drive (Sierra Hills), Cheyenne, WY and Laramie 1072 N 22nd Street (Spring Wind), Laramie, WY.
Total square footage, 294,238. Occupancy % for the three and nine months ended January 31, 2010, 93.9% and 91.3%, respectively.
|
|
Commercial Industrial -
|
Minnetonka 13600 County Road 62, Minnetonka, MN and Clive 2075 NW 94th St., Clive, IA.
Total square footage, 112,494. Occupancy % for the three and nine months ended January 31, 2010, 100% and 100.0%, respectively.
|
INVESTORS REAL ESTATE TRUST AND SUBSIDIARIES
NET OPERATING INCOME DETAIL
(in thousands)
|
Three Months Ended January 31, 2009
|
||||||||||||||||||||||||||||
|
Reporting Segments
|
||||||||||||||||||||||||||||
|
Multi-Family
Residential
|
Commercial
Office
|
Commercial
Medical
|
Commercial
Industrial
|
Commercial
Retail
|
Corporate and
Other
|
Total
|
||||||||||||||||||||||
|
Real estate rental revenue
|
||||||||||||||||||||||||||||
|
Stabilized(1)
|
$ | 18,788 | $ | 20,725 | $ | 12,916 | $ | 3,411 | $ | 3,972 | $ | 0 | $ | 59,812 | ||||||||||||||
|
Non-Stabilized
|
606 | 68 | 430 | 18 | 0 | 0 | 1,122 | |||||||||||||||||||||
|
Total
|
19,394 | 20,793 | 13,346 | 3,429 | 3,972 | 0 | 60,934 | |||||||||||||||||||||
|
Real estate expenses
|
||||||||||||||||||||||||||||
|
Stabilized(1)
|
9,036 | 9,542 | 4,180 | 881 | 1,625 | 0 | 25,264 | |||||||||||||||||||||
|
Non-Stabilized
|
370 | 6 | 255 | 4 | 0 | 0 | 635 | |||||||||||||||||||||
|
Total
|
9,406 | 9,548 | 4,435 | 885 | 1,625 | 0 | 25,899 | |||||||||||||||||||||
|
Net Operating Income (NOI)
|
||||||||||||||||||||||||||||
|
Stabilized(1)
|
9,752 | 11,183 | 8,736 | 2,530 | 2,347 | 0 | 34,548 | |||||||||||||||||||||
|
Non-Stabilized
|
236 | 62 | 175 | 14 | 0 | 0 | 487 | |||||||||||||||||||||
|
Net operating income
|
$ | 9,988 | $ | 11,245 | $ | 8,911 | $ | 2,544 | $ | 2,347 | $ | 0 | $ | 35,035 | ||||||||||||||
|
Reconciliation of NOI to net income (loss) available to common shareholders
|
||||||||||||||||||||||||||||
|
Interest (expense) income
|
$ | (4,982 | ) | $ | (5,956 | ) | $ | (4,247 | ) | $ | (951 | ) | $ | (984 | ) | $ | (221 | ) | $ | (17,341 | ) | |||||||
|
Depreciation/amortization
|
(3,561 | ) | (5,218 | ) | (3,251 | ) | (1,239 | ) | (685 | ) | (596 | ) | (14,550 | ) | ||||||||||||||
|
Administrative, advisory and trustee fees
|
0 | 0 | 0 | 0 | 0 | (1,336 | ) | (1,336 | ) | |||||||||||||||||||
|
Other expenses
|
0 | 0 | 0 | 0 | 0 | (313 | ) | (313 | ) | |||||||||||||||||||
|
Other income
|
0 | 0 | 0 | 0 | 0 | 152 | 152 | |||||||||||||||||||||
|
Net income (loss)
|
1,445 | 71 | 1,413 | 354 | 678 | (2,314 | ) | 1,647 | ||||||||||||||||||||
|
Net income attributable to noncontrolling interests – Operating Partnership
|
0 | 0 | 0 | 0 | 0 | (284 | ) | (284 | ) | |||||||||||||||||||
|
Net (income) loss attributable to noncontrolling interests – consolidated real estate entities
|
0 | 0 | 0 | 0 | 0 | 15 | 15 | |||||||||||||||||||||
|
Net income (loss) attributable to Investors Real Estate Trust
|
1,445 | $ | 71 | $ | 1,413 | $ | 354 | $ | 678 | $ | (2,583 | ) | $ | 1,378 | ||||||||||||||
|
Dividends to preferred shareholders
|
0 | 0 | 0 | 0 | 0 | (593 | ) | (593 | ) | |||||||||||||||||||
|
NET INCOME (LOSS) AVAILABLE TO COMMON SHAREHOLDERS
|
$ | 1,445 | $ | 71 | $ | 1,413 | $ | 354 | $ | 678 | $ | (3,176 | ) | $ | 785 | |||||||||||||
|
(1)
|
For Three and Nine Months ended January 31, 2009, stabilized properties excluded:
|
|
Multi-Family Residential -
|
Minot 4th Street Apartments, Minot, ND; Minot 11th Street Apartments, Minot, ND; Minot Fairmont Apartments, Minot, ND; Minot Westridge Apartments, Minot, ND, Thomasbrook Apartments, Lincoln, NE; Evergreen Apartments, Isanti, MN and 401 South Main, Minot, ND and IRET Corporate Plaza, Minot, ND.
Total number of units, 409. Occupancy % for the three and nine months ended January 31, 2009, 86.7% and 88.5%, respectively.
|
|
Commercial Office -
|
401 South Main, Minot, ND; Bismarck 715 E Broadway, Bismarck, ND and IRET Corporate Plaza, Minot, ND.
Total square footage, 76,835. Occupancy % for the three and nine months ended January 31, 2009, 100.0% and 100.0%, respectively.
|
|
Commercial Medical -
|
2828 Chicago Avenue, Minneapolis, MN.
Total square footage, 56,239. Occupancy % for the three and nine months ended January 31, 2009, 73.3% and 70.9%, respectively.
|
|
Commercial Industrial -
|
Minnetonka 13600 County Road 62, Minnetonka, MN.
Total square footage, 69,984. Occupancy % for the three and nine months ended January 31, 2010, 100% and 100.0%, respectively.
|
INVESTORS REAL ESTATE TRUST AND SUBSIDIARIES
NET OPERATING INCOME DETAIL
(in thousands)
|
Nine Months Ended January 31, 2010
|
||||||||||||||||||||||||||||
|
Reporting Segments
|
||||||||||||||||||||||||||||
|
Multi-Family
Residential
|
Commercial
Office
|
Commercial
Medical
|
Commercial
Industrial
|
Commercial
Retail
|
Corporate and
Other
|
Total
|
||||||||||||||||||||||
|
Real estate rental revenue
|
||||||||||||||||||||||||||||
|
Stabilized(1)
|
$ | 54,887 | $ | 61,776 | $ | 38,760 | $ | 9,355 | $ | 10,060 | $ | 0 | $ | 174,838 | ||||||||||||||
|
Non-Stabilized
|
2,512 | 176 | 2,412 | 609 | 0 | 0 | 5,709 | |||||||||||||||||||||
|
Total
|
57,399 | 61,952 | 41,172 | 9,964 | 10,060 | 0 | 180,547 | |||||||||||||||||||||
|
Real estate expenses
|
||||||||||||||||||||||||||||
|
Stabilized(1)
|
27,024 | 27,611 | 10,833 | 3,064 | 3,550 | 0 | 72,082 | |||||||||||||||||||||
|
Non-Stabilized
|
1,209 | 155 | 1,302 | 162 | 0 | 0 | 2,828 | |||||||||||||||||||||
|
Total
|
28,233 | 27,766 | 12,135 | 3,226 | 3,550 | 0 | 74,910 | |||||||||||||||||||||
|
Gain on involuntary conversion
|
||||||||||||||||||||||||||||
|
Non-Stabilized
|
1,660 | 0 | 0 | 0 | 0 | 0 | 1,660 | |||||||||||||||||||||
|
Total
|
1,660 | 0 | 0 | 0 | 0 | 0 | 1,660 | |||||||||||||||||||||
|
Net Operating Income (NOI)
|
||||||||||||||||||||||||||||
|
Stabilized(1)
|
27,863 | 34,165 | 27,927 | 6,291 | 6,510 | 0 | 102,756 | |||||||||||||||||||||
|
Non-Stabilized
|
2,963 | 21 | 1,110 | 447 | 0 | 0 | 4,541 | |||||||||||||||||||||
|
Net operating income
|
$ | 30,826 | $ | 34,186 | $ | 29,037 | $ | 6,738 | $ | 6,510 | $ | 0 | $ | 107,297 | ||||||||||||||
|
Reconciliation of NOI to net income (loss) available to common shareholders
|
||||||||||||||||||||||||||||
|
Interest expense
|
$ | (14,972 | ) | $ | (17,343 | ) | $ | (12,516 | ) | $ | (2,960 | ) | $ | (2,666 | ) | $ | (1,591 | ) | $ | (52,048 | ) | |||||||
|
Depreciation/amortization
|
(11,403 | ) | (15,488 | ) | (10,613 | ) | (2,710 | ) | (2,368 | ) | (2,120 | ) | (44,702 | ) | ||||||||||||||
|
Administrative, advisory and trustee fees
|
0 | 0 | 0 | 0 | 0 | (4,775 | ) | (4,775 | ) | |||||||||||||||||||
|
Other expenses
|
0 | 0 | 0 | 0 | 0 | (1,468 | ) | (1,468 | ) | |||||||||||||||||||
|
Impairment of real estate investments
|
0 | 0 | 0 | (1,678 | ) | 0 | (1,678 | ) | ||||||||||||||||||||
|
Other income
|
0 | 0 | 0 | 0 | 0 | 507 | 507 | |||||||||||||||||||||
|
Net income (loss)
|
4,451 | 1,355 | 5,908 | 1,068 | (202 | ) | (9,447 | ) | 3,133 | |||||||||||||||||||
|
Net income attributable to noncontrolling interests – Operating Partnership
|
0 | 0 | 0 | 0 | 0 | (381 | ) | (381 | ) | |||||||||||||||||||
|
Net (income) loss attributable to noncontrolling interests – consolidated real estate entities
|
0 | 0 | 0 | 0 | 0 | 2 | 2 | |||||||||||||||||||||
|
Net income (loss) attributable to Investors Real Estate Trust
|
4,451 | 1,355 | 5,908 | 1,068 | (202 | ) | (9,826 | ) | 2,754 | |||||||||||||||||||
|
Dividends to preferred shareholders
|
0 | 0 | 0 | 0 | 0 | (1,779 | ) | (1,779 | ) | |||||||||||||||||||
|
NET INCOME (LOSS) AVAILABLE TO COMMON SHAREHOLDERS
|
$ | 4,451 | $ | 1,355 | $ | 5,908 | $ | 1,068 | $ | (202 | ) | $ | (11,605 | ) | $ | 975 | ||||||||||||
|
(1)
|
For Three and Nine Months Ended January 31, 2010, stabilized properties excluded:
|
|
Multi-Family Residential -
|
Minot 4th Street Apartments, Minot, ND; Minot 11th Street Apartments, Minot, ND; Minot Fairmont Apartments, Minot, ND; Minot Westridge Apartments, Minot, ND; Thomasbrook Apartments, Lincoln, NE; Evergreen Apartments, Isanti, MN; 401 South Main, Minot, ND and IRET Corporate Plaza, Minot, ND.
Total number of units, 433. Occupancy % for the three and nine months ended January 31, 2010, 88.8% and 89.5%, respectively.
|
|
Commercial Office -
|
Bismarck 715 E Broadway, Bismarck, ND; 401 South Main, Minot, ND; IRET Corporate Plaza, Minot, ND, 12 South Main Street, Minot, ND and Minot 2505 16th St SW, Minot, ND.
Total square footage, 87,810. Occupancy % for the three and nine months ended January 31, 2010, 23.5% and 16.7%, respectively.
|
|
Commercial Medical -
|
2828 Chicago Avenue, Minneapolis, MN; Casper 1930 E 12th Street (Park Place), Casper, WY; Casper 3955 E 12th Street (Meadow Wind), Casper, WY; Cheyenne 4010 N College Drive (Aspen Wind), Cheyenne, WY; Cheyenne 4060 N College Drive (Sierra Hills), Cheyenne, WY and Laramie 1072 N 22nd Street (Spring Wind), Laramie, WY.
Total square footage, 294,238. Occupancy % for the three and nine months ended January 31, 2010, 93.9% and 91.3%, respectively.
|
|
Commercial Industrial -
|
Minnetonka 13600 County Road 62, Minnetonka, MN and Clive 2075 NW 94th St., Clive, IA.
Total square footage, 112,494. Occupancy % for the three and nine months ended January 31, 2010, 100% and 100.0%, respectively.
|
INVESTORS REAL ESTATE TRUST AND SUBSIDIARIES
NET OPERATING INCOME DETAIL
(in thousands)
|
Nine Months Ended January 31, 2009
|
||||||||||||||||||||||||||||
|
Reporting Segments
|
||||||||||||||||||||||||||||
|
Multi-Family
Residential
|
Commercial
Office
|
Commercial
Medical
|
Commercial
Industrial
|
Commercial
Retail
|
Corporate and
Other
|
Total
|
||||||||||||||||||||||
|
Real estate rental revenue
|
||||||||||||||||||||||||||||
|
Stabilized(1)
|
$ | 55,785 | $ | 62,188 | $ | 38,532 | $ | 9,482 | $ | 10,963 | $ | 0 | $ | 176,950 | ||||||||||||||
|
Non-Stabilized
|
1,612 | 133 | 640 | 18 | 0 | 0 | 2,403 | |||||||||||||||||||||
|
Total
|
57,397 | 62,321 | 39,172 | 9,500 | 10,963 | 0 | 179,353 | |||||||||||||||||||||
|
Real estate expenses
|
||||||||||||||||||||||||||||
|
Stabilized(1)
|
26,162 | 28,165 | 11,736 | 2,416 | 3,921 | 0 | 72,400 | |||||||||||||||||||||
|
Non-Stabilized
|
898 | 29 | 325 | 4 | 0 | 0 | 1,256 | |||||||||||||||||||||
|
Total
|
27,060 | 28,194 | 12,061 | 2,420 | 3,921 | 0 | 73,656 | |||||||||||||||||||||
|
Net Operating Income (NOI)
|
||||||||||||||||||||||||||||
|
Stabilized(1)
|
29,623 | 34,023 | 26,796 | 7,066 | 7,042 | 0 | 104,550 | |||||||||||||||||||||
|
Non-Stabilized
|
714 | 104 | 315 | 14 | 0 | 0 | 1,147 | |||||||||||||||||||||
|
Net operating income
|
$ | 30,337 | $ | 34,127 | $ | 27,111 | $ | 7,080 | $ | 7,042 | $ | 0 | $ | 105,697 | ||||||||||||||
|
Reconciliation of NOI to net income (loss) available to common shareholders
|
||||||||||||||||||||||||||||
|
Interest (expense) income
|
$ | (14,749 | ) | $ | (17,803 | ) | $ | (12,717 | ) | $ | (2,841 | ) | $ | (2,986 | ) | $ | (211 | ) | $ | (51,307 | ) | |||||||
|
Depreciation/amortization
|
(10,532 | ) | (15,469 | ) | (9,538 | ) | (2,972 | ) | (2,105 | ) | (1,660 | ) | (42,276 | ) | ||||||||||||||
|
Administrative, advisory and trustee fees
|
0 | 0 | 0 | 0 | 0 | (3,906 | ) | (3,906 | ) | |||||||||||||||||||
|
Other expenses
|
0 | 0 | 0 | 0 | 0 | (1,157 | ) | (1,157 | ) | |||||||||||||||||||
|
Other income
|
0 | 0 | 0 | 0 | 0 | 688 | 688 | |||||||||||||||||||||
|
Gain on sale of other investments
|
0 | 0 | 0 | 0 | 0 | 54 | 54 | |||||||||||||||||||||
|
Net income (loss)
|
5,056 | 855 | 4,856 | 1,267 | 1,951 | (6,192 | ) | 7,793 | ||||||||||||||||||||
|
Net income attributable to noncontrolling interests – Operating Partnership
|
0 | 0 | 0 | 0 | 0 | (1,631 | ) | (1,631 | ) | |||||||||||||||||||
|
Net (income) loss attributable to noncontrolling interests – consolidated real estate entities
|
0 | 0 | 0 | 0 | 0 | 97 | 97 | |||||||||||||||||||||
|
Net income (loss) attributable to Investors Real Estate Trust
|
5,056 | 855 | 4,856 | 1,267 | 1,951 | (7,726 | ) | 6,259 | ||||||||||||||||||||
|
Dividends to preferred shareholders
|
0 | 0 | 0 | 0 | 0 | (1,779 | ) | (1,779 | ) | |||||||||||||||||||
|
NET INCOME (LOSS) AVAILABLE TO COMMON SHAREHOLDERS
|
$ | 5,056 | $ | 855 | $ | 4,856 | $ | 1,267 | $ | 1,951 | $ | (9,505 | ) | $ | 4,480 | |||||||||||||
|
(1)
|
For Three and Nine Months ended January 31, 2009, stabilized properties excluded:
|
|
Multi-Family Residential -
|
Minot 4th Street Apartments, Minot, ND; Minot 11th Street Apartments, Minot, ND; Minot Fairmont Apartments, Minot, ND; Minot Westridge Apartments, Minot, ND, Thomasbrook Apartments, Lincoln, NE; Evergreen Apartments, Isanti, MN and 401 South Main, Minot, ND and IRET Corporate Plaza, Minot, ND.
Total number of units, 409. Occupancy % for the three and nine months ended January 31, 2009, 86.7% and 88.5%, respectively.
|
|
Commercial Office -
|
401 South Main, Minot, ND; Bismarck 715 E Broadway, Bismarck, ND and IRET Corporate Plaza, Minot, ND.
Total square footage, 76,835. Occupancy % for the three and nine months ended January 31, 2009, 100.0% and 100.0%, respectively.
|
|
Commercial Medical -
|
2828 Chicago Avenue, Minneapolis, MN.
Total square footage, 56,239. Occupancy % for the three and nine months ended January 31, 2009, 73.3% and 70.9%, respectively.
|
|
Commercial Industrial -
|
Minnetonka 13600 County Road 62, Minnetonka, MN.
Total square footage, 69,984. Occupancy % for the three and nine months ended January 31, 2010, 100% and 100.0%, respectively.
|
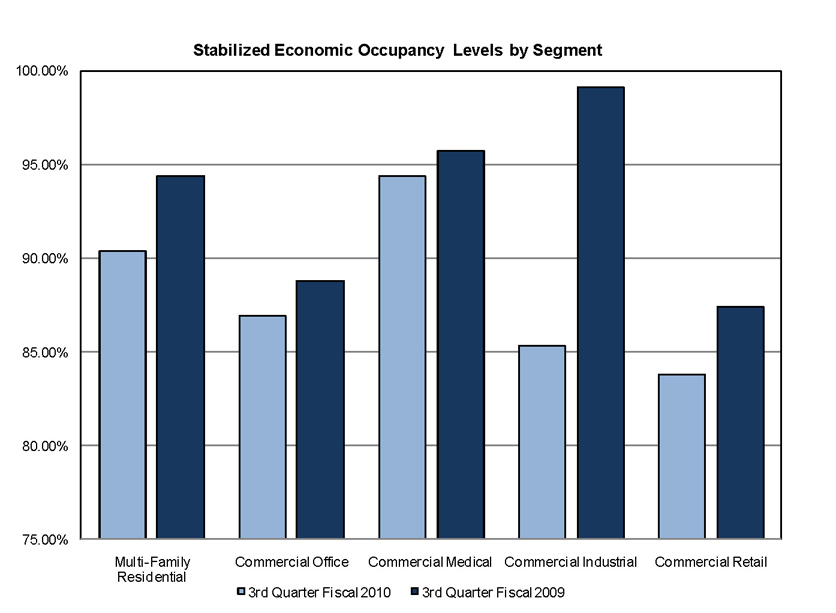
INVESTORS REAL ESTATE TRUST AND SUBSIDIARIES
STABILIZED PROPERTIES AND OVERALL ECONOMIC OCCUPANCY LEVELS BY SEGMENT
3rd Quarter Fiscal 2010 vs. 3rd Quarter Fiscal 2009
|
Segments
|
Stabilized Properties
|
All Properties
|
||
|
3rd Quarter
|
3rd Quarter
|
3rd Quarter
|
3rd Quarter
|
|
|
Fiscal 2010
|
Fiscal 2009
|
Fiscal 2010
|
Fiscal 2009
|
|
|
Multi-Family Residential
|
90.4%
|
94.4%
|
90.4%
|
94.2%
|
|
Commercial Office
|
86.9%
|
88.8%
|
86.0%
|
88.8%
|
|
Commercial Medical
|
94.4%
|
95.7%
|
94.3%
|
95.0%
|
|
Commercial Industrial
|
85.3%
|
99.1%
|
86.1%
|
99.1%
|
|
Commercial Retail
|
83.8%
|
87.4%
|
83.8%
|
87.4%
|
INVESTORS REAL ESTATE TRUST AND SUBSIDIARIES
COMMERCIAL LEASING SUMMARY
for the three and nine months ended January 31, 2010
|
Three Months Ended January 31, 2010
|
||||||||||||||||||||||||
|
New(1)
|
Renew(2)
|
Total
|
Expiring(3)
|
Net Change
|
Percentage
Change
|
|||||||||||||||||||
|
Gross Square Footage
|
||||||||||||||||||||||||
|
Commercial Office
|
47,097 | 161,169 | 208,266 | 19,690 | 188,576 | |||||||||||||||||||
|
Commercial Medical
|
0 | 9,335 | 9,335 | 18,142 | (8,807 | ) | ||||||||||||||||||
|
Commercial Industrial
|
5,000 | 46,294 | 51,294 | 5,000 | 46,294 | |||||||||||||||||||
|
Commercial Retail
|
4,922 | 67,381 | 72,303 | 61,153 | 11,150 | |||||||||||||||||||
|
Total All Segments
|
57,019 | 284,179 | 341,198 | 103,985 | 237,213 | |||||||||||||||||||
|
Weighted Average Rental Rates(3)
|
||||||||||||||||||||||||
|
Commercial Office
|
$ | 11.57 | $ | 15.91 | $ | 14.93 | $ | 10.76 | $ | 4.17 | 38.8 | % | ||||||||||||
|
Commercial Medical
|
0.00 | 19.36 | 19.36 | 19.00 | 0.36 | 1.9 | % | |||||||||||||||||
|
Commercial Industrial
|
10.80 | 7.21 | 7.56 | 16.50 | (8.94 | ) | (54.2 | %) | ||||||||||||||||
|
Commercial Retail
|
9.47 | 5.64 | 5.90 | 3.57 | 2.33 | 65.3 | % | |||||||||||||||||
|
Total All Segments
|
$ | 11.32 | $ | 12.17 | $ | 12.03 | $ | 8.24 | $ | 3.79 | 46.0 | % | ||||||||||||
|
Nine Months Ended January 31, 2010
|
||||||||||||||||||||||||
|
New(1)
|
Renew(2)
|
Total
|
Expiring(3)
|
Net Change
|
Percentage
Change
|
|||||||||||||||||||
|
Gross Square Footage
|
||||||||||||||||||||||||
|
Commercial Office
|
64,637 | 490,719 | 555,356 | 341,598 | 213,758 | |||||||||||||||||||
|
Commercial Medical
|
15,030 | 54,594 | 69,624 | 49,227 | 20,3.97 | |||||||||||||||||||
|
Commercial Industrial
|
5,000 | 139,195 | 144,195 | 271,062 | (126,867 | ) | ||||||||||||||||||
|
Commercial Retail
|
75,669 | 199,419 | 275,088 | 159,955 | 115,133 | |||||||||||||||||||
|
Total All Segments
|
160,336 | 883,927 | 1,044,263 | 821,842 | 222,421 | |||||||||||||||||||
|
Weighted Average Rental Rates
|
||||||||||||||||||||||||
|
Commercial Office
|
$ | 10.38 | $ | 12.98 | $ | 12.68 | $ | 12.04 | $ | 0.64 | 5.3 | % | ||||||||||||
|
Commercial Medical
|
19.34 | 21.18 | 20.78 | 20.19 | 0.59 | 2.9 | % | |||||||||||||||||
|
Commercial Industrial
|
10.80 | 4.54 | 4.76 | 3.42 | 1.34 | 39.2 | % | |||||||||||||||||
|
Commercial Retail
|
12.72 | 6.41 | 8.15 | 6.09 | 2.06 | 33.8 | % | |||||||||||||||||
|
Total All Segments
|
$ | 12.34 | $ | 10.67 | $ | 10.93 | $ | 8.53 | $ | 2.40 | 28.1 | % | ||||||||||||
|
Three Months Ended January 31, 2010
|
Nine Months Ended January 31, 2010
|
|||||||||||
|
New(1)
|
Renew(2)
|
Total
|
New(1)
|
Renew(2)
|
Total
|
|||||||
|
Weighted Average Term of New/Renewed Leased
|
||||||||||||
|
Commercial Office
|
5.9
|
3.4
|
4.3
|
4.5
|
3.4
|
3.6
|
||||||
|
Commercial Medical
|
0.0
|
2.0
|
2.0
|
5.7
|
4.5
|
4.7
|
||||||
|
Commercial Industrial
|
0.2
|
3.0
|
2.1
|
0.2
|
4.4
|
3.6
|
||||||
|
Commercial Retail
|
2.6
|
3.0
|
2.9
|
3.1
|
3.0
|
3.0
|
||||||
|
Total All Segments
|
4.4
|
3.1
|
3.5
|
4.0
|
3.5
|
3.6
|
||||||
|
(1)
|
Does not include leases in place on acquired properties.
|
|
(2)
|
Renewals may include leases that have renewed prior to expiration date. Square footage or rental rate changes on renewals are included in calculation.
|
|
(3)
|
Expired leases include leases with tenants who have vacated or renewed. Excluded from expired leases are leases that have been amended to extend the term, including leases on a month-to-month basis.
|
INVESTORS REAL ESTATE TRUST AND SUBSIDIARIES
COMMERCIAL LEASING SUMMARY
for the three and nine months ended January 31, 2010
|
3rd Quarter Fiscal 2010 Total
|
Year-To-Date Total
|
|||||||||||||||||||||||
|
New
|
Renew
|
Total Dollars
|
New
|
Renew
|
Total Dollars
|
|||||||||||||||||||
|
Tenant Improvements
|
||||||||||||||||||||||||
|
Commercial Office
|
$ | 93,950 | $ | 1,421,323 | $ | 1,515,273 | $ | 292,011 | $ | 2,203,547 | $ | 2,495,558 | ||||||||||||
|
Commercial Medical
|
0 | 0 | 0 | 98,164 | 1,070,171 | 1,168,335 | ||||||||||||||||||
|
Commercial Industrial
|
0 | 89,985 | 89,985 | 0 | 161,385 | 161,385 | ||||||||||||||||||
|
Commercial Retail
|
10,540 | 3,418 | 13,958 | 359,528 | 15,102 | 374,630 | ||||||||||||||||||
|
Subtotal
|
$ | 104,490 | $ | 1,514,726 | $ | 1,619,216 | $ | 749,703 | $ | 3,450,205 | $ | 4,199,908 | ||||||||||||
|
Tenant Improvements per square foot
|
||||||||||||||||||||||||
|
Commercial Office
|
$ | 1.99 | $ | 8.82 | $ | 7.28 | $ | 4.52 | $ | 4.49 | $ | 4.49 | ||||||||||||
|
Commercial Medical
|
0.00 | 0.00 | 0.00 | 6.53 | 19.60 | 16.78 | ||||||||||||||||||
|
Commercial Industrial
|
0.00 | 1.94 | 1.75 | 0.00 | 1.16 | 1.12 | ||||||||||||||||||
|
Commercial Retail
|
2.14 | 0.05 | 0.19 | 4.75 | 0.08 | 1.36 | ||||||||||||||||||
|
All Segments
|
$ | 1.83 | $ | 5.33 | $ | 4.75 | $ | 4.68 | $ | 3.90 | $ | 4.02 | ||||||||||||
|
Leasing Costs
|
||||||||||||||||||||||||
|
Commercial Office
|
$ | 292,988 | $ | 1,942,270 | $ | 2,235,258 | $ | 336,947 | $ | 2,758,488 | $ | 3,095,435 | ||||||||||||
|
Commercial Medical
|
0 | 18,930 | 18,930 | 58,971 | 283,151 | 342,122 | ||||||||||||||||||
|
Commercial Industrial
|
2,250 | 115,752 | 118,002 | 2,250 | 197,541 | 199,791 | ||||||||||||||||||
|
Commercial Retail
|
0 | 6,399 | 6,399 | 209,515 | 101,972 | 311,487 | ||||||||||||||||||
|
Subtotal
|
$ | 295,238 | $ | 2,083,351 | $ | 2,378,589 | $ | 607,683 | $ | 3,341,152 | $ | 3,948,835 | ||||||||||||
|
Leasing Costs per square foot
|
||||||||||||||||||||||||
|
Commercial Office
|
$ | 6.22 | $ | 12.05 | $ | 10.73 | $ | 5.21 | $ | 5.62 | $ | 5.57 | ||||||||||||
|
Commercial Medical
|
0.00 | 2.03 | 2.03 | 3.92 | 5.19 | 4.91 | ||||||||||||||||||
|
Commercial Industrial
|
0.45 | 2.50 | 2.30 | 0.45 | 1.42 | 1.39 | ||||||||||||||||||
|
Commercial Retail
|
0.00 | 0.09 | 0.09 | 2.77 | 0.51 | 1.13 | ||||||||||||||||||
|
All Segments
|
$ | 5.18 | $ | 7.33 | $ | 6.97 | $ | 3.79 | $ | 3.78 | $ | 3.78 | ||||||||||||
|
Tenant Improvements and Leasing Costs
|
||||||||||||||||||||||||
|
Commercial Office
|
$ | 386,938 | 3,363,593 | 3,750,531 | $ | 628,958 | $ | 4,962,035 | $ | 5,590,993 | ||||||||||||||
|
Commercial Medical
|
0 | 18,930 | 18,930 | 157,135 | 1,353,322 | 1,510,457 | ||||||||||||||||||
|
Commercial Industrial
|
2,250 | 205,737 | 207,987 | 2,250 | 358,926 | 361,176 | ||||||||||||||||||
|
Commercial Retail
|
10,540 | 9,817 | 20,357 | 569,043 | 117,074 | 686,117 | ||||||||||||||||||
|
Total
|
$ | 399,728 | $ | 3,598,077 | $ | 3,997,805 | $ | 1,357,386 | $ | 6,791,357 | $ | 8,148,743 | ||||||||||||
|
Tenant Improvements and Leasing Costs per square foot
|
||||||||||||||||||||||||
|
Commercial Office
|
$ | 8.22 | $ | 20.87 | $ | 18.01 | $ | 9.73 | $ | 10.11 | $ | 10.07 | ||||||||||||
|
Commercial Medical
|
0.00 | 2.03 | 2.03 | 10.45 | 24.79 | 21.69 | ||||||||||||||||||
|
Commercial Industrial
|
0.45 | 4.44 | 4.05 | 0.45 | 2.58 | 2.50 | ||||||||||||||||||
|
Commercial Retail
|
2.14 | 0.15 | 0.28 | 7.52 | 0.59 | 2.49 | ||||||||||||||||||
|
All Segments
|
$ | 7.01 | $ | 12.66 | $ | 11.72 | $ | 8.47 | $ | 7.68 | $ | 7.80 | ||||||||||||
INVESTORS REAL ESTATE TRUST AND SUBSIDIARIES
MULTI-FAMILY RESIDENTIAL SUMMARY
|
Three Months Ended
|
||||||||||||||||||||
|
01/31/2010
|
10/31/2009
|
07/31/2009
|
04/30/2009
|
01/31/2009
|
||||||||||||||||
|
Number of Units
|
9,669 | 9,669 | 9,645 | 9,645 | 9,645 | |||||||||||||||
|
Average Investment Per Unit
|
||||||||||||||||||||
|
Stabilized
|
$ | 55,739 | $ | 55,479 | $ | 55,179 | $ | 54,960 | $ | 54,790 | ||||||||||
|
Non-Stabilized
|
79,217 | 77,214 | 81,566 | 82,555 | 62,537 | |||||||||||||||
| $ | 56,790 | $ | 56,452 | $ | 56,298 | $ | 56,130 | $ | 55,082 | |||||||||||
|
Average Scheduled Rent per Unit
|
||||||||||||||||||||
|
Stabilized
|
$ | 716 | $ | 713 | $ | 711 | $ | 711 | $ | 708 | ||||||||||
|
Non-Stabilized
|
721 | 723 | 714 | 712 | 631 | |||||||||||||||
| $ | 717 | $ | 714 | $ | 711 | $ | 711 | $ | 705 | |||||||||||
|
Total Receipts per Unit
|
||||||||||||||||||||
|
Stabilized
|
$ | 657 | $ | 664 | $ | 660 | $ | 671 | $ | 678 | ||||||||||
|
Non-Stabilized
|
657 | 654 | 659 | 603 | 558 | |||||||||||||||
| $ | 657 | $ | 664 | $ | 660 | $ | 668 | $ | 674 | |||||||||||
|
Occupancy %
|
||||||||||||||||||||
|
Stabilized
|
90.4 | % | 91.7 | % | 91.1 | % | 93.1 | % | 94.4 | % | ||||||||||
|
Non-Stabilized
|
88.8 | % | 88.7 | % | 91.2 | % | 83.4 | % | 86.8 | % | ||||||||||
| 90.4 | % | 91.5 | % | 91.1 | % | 92.7 | % | 94.2 | % | |||||||||||
|
Operating Expenses as a % of Scheduled Rent
|
||||||||||||||||||||
|
Stabilized
|
47.4 | % | 44.7 | % | 44.6 | % | 43.8 | % | 46.1 | % | ||||||||||
|
Non-Stabilized
|
49.4 | % | 32.3 | % | 50.6 | % | 55.1 | % | 54.1 | % | ||||||||||
|
Total
|
47.4 | % | 44.1 | % | 44.9 | % | 44.3 | % | 46.4 | % | ||||||||||
INVESTORS REAL ESTATE TRUST AND SUBSIDIARIES
10 LARGEST COMMERCIAL TENANTS – BASED ON ANNUALIZED BASE RENT(1)
as of January 31, 2010
|
Tenant
|
Number of
Properties
|
Average
Remaining
Lease Term
in Months
|
% of Total
Commercial
Segments’
Minimum
Rents
|
Aggregate
Rentable
Square Feet
|
% of Aggregate
Occupied
Square
Feet
|
|
Affiliates of Edgewood Vista
|
19
|
229
|
9.8%
|
909,591
|
8.7%
|
|
St. Lukes Hospital of Duluth, Inc.
|
6
|
66
|
3.5%
|
198,775
|
1.9%
|
|
Fairview Health
|
8
|
52
|
2.4%
|
179,831
|
1.7%
|
|
Applied Underwriters
|
3
|
85
|
2.2%
|
141,724
|
1.4%
|
|
Best Buy Co., Inc. (NYSE: BBY)
|
2
|
10
|
1.9%
|
224,650
|
2.1%
|
|
HealthEast Care System
|
1
|
109
|
1.7%
|
114,316
|
1.1%
|
|
UGS Corp.
|
1
|
19
|
1.6%
|
122,567
|
1.2%
|
|
Smurfit - Stone Container (NASDAQ: SSCC)
|
2
|
41
|
1.5%
|
424,147
|
4.1%
|
|
Microsoft (NASDAQ: MSFT)
|
1
|
43
|
1.4%
|
122,040
|
1.2%
|
|
Nebraska Orthopedic Hospital
|
1
|
230
|
1.3%
|
61,758
|
0.6%
|
|
Total/Weighted Average
|
106
|
27.3%
|
2,499,399
|
24.1%
|
|
(1)
|
See Definitions on page 26.
|
INVESTORS REAL ESTATE TRUST AND SUBSIDIARIES
LEASE EXPIRATIONS
as of January 31, 2010
|
Fiscal Year
|
Number of
Leases
|
Rentable
Square Feet
|
% of Rentable
Square Feet
|
Annualized
Rent*
|
Average
Rental
Rate
|
% of
Annualized Rent
|
||||||||||||||||||
|
Commercial Office
|
||||||||||||||||||||||||
|
2010
|
14 | 88,431 | 2.1 | % | $ | 981,503 | $ | 11.10 | 1.8 | % | ||||||||||||||
|
2011
|
72 | 676,250 | 16.3 | % | 8,714,632 | 12.89 | 16.2 | % | ||||||||||||||||
|
2012
|
57 | 742,720 | 17.9 | % | 9,842,773 | 13.25 | 18.4 | % | ||||||||||||||||
|
2013
|
39 | 526,276 | 12.7 | % | 6,607,758 | 12.56 | 12.3 | % | ||||||||||||||||
|
2014
|
36 | 541,534 | 13.0 | % | 7,058,508 | 13.03 | 13.2 | % | ||||||||||||||||
|
2015 and thereafter
|
72 | 1,575,075 | 38.0 | % | 20,410,760 | 12.96 | 38.1 | % | ||||||||||||||||
| 290 | 4,150,286 | 100.0 | % | $ | 53,615,934 | $ | 12.92 | 100.0 | % | |||||||||||||||
|
Commercial Medical
|
||||||||||||||||||||||||
|
2010
|
5 | 16,493 | 0.8 | % | $ | 350,782 | $ | 21.27 | 0.9 | % | ||||||||||||||
|
2011
|
16 | 66,150 | 3.0 | % | 1,189,722 | 17.99 | 3.0 | % | ||||||||||||||||
|
2012
|
30 | 102,335 | 4.6 | % | 2,093,556 | 20.46 | 5.3 | % | ||||||||||||||||
|
2013
|
20 | 78,943 | 3.6 | % | 1,468,133 | 18.60 | 3.7 | % | ||||||||||||||||
|
2014
|
24 | 146,515 | 6.6 | % | 3,029,121 | 20.67 | 7.6 | % | ||||||||||||||||
|
2015 and thereafter
|
96 | 1,798,828 | 81.4 | % | 31,463,942 | 17.49 | 79.5 | % | ||||||||||||||||
| 191 | 2,209,264 | 100.0 | % | $ | 39,595,256 | $ | 17.92 | 100.0 | % | |||||||||||||||
|
Commercial Industrial
|
||||||||||||||||||||||||
|
2010
|
1 | 23,782 | 1.0 | % | $ | 141,406 | $ | 5.95 | 1.5 | % | ||||||||||||||
|
2011
|
14 | 1,059,253 | 42.0 | % | 3,573,305 | 3.37 | 36.5 | % | ||||||||||||||||
|
2012
|
5 | 383,210 | 15.2 | % | 1,214,545 | 3.17 | 12.4 | % | ||||||||||||||||
|
2013
|
3 | 214,335 | 8.5 | % | 1,106,269 | 5.16 | 11.3 | % | ||||||||||||||||
|
2014
|
5 | 169,396 | 6.7 | % | 786,164 | 4.46 | 8.0 | % | ||||||||||||||||
|
2015 and thereafter
|
9 | 671,224 | 26.6 | % | 2,968,514 | 4.42 | 3.03 | % | ||||||||||||||||
| 37 | 2,521,200 | 100.0 | % | $ | 9,790,203 | $ | 3.88 | 100.0 | % | |||||||||||||||
|
Commercial Retail
|
||||||||||||||||||||||||
|
2010
|
12 | 24,655 | 2.2 | % | $ | 273,503 | $ | 11.09 | 2.9 | % | ||||||||||||||
|
2011
|
55 | 222,252 | 19.7 | % | 2,120,134 | 9.54 | 22.6 | % | ||||||||||||||||
|
2012
|
33 | 282,655 | 25.1 | % | 1,528,588 | 5.41 | 16.3 | % | ||||||||||||||||
|
2013
|
18 | 74,457 | 6.6 | % | 520,362 | 6.99 | 5.5 | % | ||||||||||||||||
|
2014
|
19 | 64,677 | 5.7 | % | 720,926 | 11.15 | 7.7 | % | ||||||||||||||||
|
2015 and thereafter
|
38 | 459,074 | 40.7 | % | 4,219,193 | 9.19 | 45.0 | % | ||||||||||||||||
| 175 | 1,127,770 | 100.0 | % | $ | 9,382,706 | $ | 8.32 | 100.0 | % | |||||||||||||||
|
Commercial Total
|
||||||||||||||||||||||||
|
2010
|
32 | 153,361 | 1.6 | % | $ | 1,747,194 | $ | 11.39 | 1.6 | % | ||||||||||||||
|
2011
|
157 | 2,023,905 | 20.2 | % | 15,597,793 | 7.71 | 13.9 | % | ||||||||||||||||
|
2012
|
125 | 1,510,920 | 15.1 | % | 14,679,462 | 9.72 | 13.1 | % | ||||||||||||||||
|
2013
|
80 | 894,011 | 8.9 | % | 9,702,522 | 10.85 | 8.6 | % | ||||||||||||||||
|
2014
|
84 | 922,122 | 9.2 | % | 11,594,719 | 12.57 | 10.3 | % | ||||||||||||||||
|
2015 and thereafter
|
215 | 4,504,201 | 45.0 | % | 59,062,409 | 13.11 | 52.5 | % | ||||||||||||||||
| 693 | 10,008,520 | 100.0 | % | $ | 112,384,099 | $ | 11.23 | 100.0 | % | |||||||||||||||
* Annualized Rent is monthly scheduled rent as of January 31, 2010 (cash basis), multiplied by 12.
INVESTORS REAL ESTATE TRUST AND SUBSIDIARIES
FISCAL 2010 ACQUISITION SUMMARY
as of January 31, 2010
($’s in thousands)
|
Property
|
Location
|
Segment Type
|
Acquisition
Date
|
Square
Feet/Units
|
Leased
Percentage
At
Acquisition
|
January 31,
2010 Leased
Percentage
|
Acquisition
Cost
|
||||||||||||
|
Clive 2075 NW 94th Street
|
Clive, IA
|
Commercial Industrial
|
August 5, 2009
|
42,510 | 100 | % | 100 | % | $ | 3,350 | |||||||||
|
Minot 2505 16th Street SW
|
Minot, ND
|
Commercial Office
|
October 1, 2009
|
15,000 | 93.8 | % | 93.8 | % | 2,400 | ||||||||||
|
Fargo 1320 4th Street N
|
Fargo, ND
|
Unimproved Land
|
November 13, 2009
|
NA
|
NA
|
NA
|
395 | ||||||||||||
|
Casper 1930 E 12th Street (Park Place)
|
Casper, WY
|
Commercial Medical
|
December 30, 2009
|
65,160 | 94.6 | % | 94.6 | % | 7,339 | ||||||||||
|
Casper 3955 E 12th Street (Meadow Wind)
|
Casper, WY
|
Commercial Medical
|
December 30, 2009
|
35,629 | 100.0 | % | 100.0 | % | 7,339 | ||||||||||
|
Cheyenne 4010 N College Drive (Aspen Wind)
|
Cheyenne, WY
|
Commercial Medical
|
December 30, 2009
|
47,509 | 94.5 | % | 94.5 | % | 12,457 | ||||||||||
|
Cheyenne 4060 N College Drive (Sierra Hills)
|
Cheyenne, WY
|
Commercial Medical
|
December 30, 2009
|
54,072 | 75.6 | % | 75.6 | % | 9,560 | ||||||||||
|
Laramie 1072 N 22nd Street (Spring Wind)
|
Laramie, WY
|
Commercial Medical
|
December 30, 2009
|
35,629 | 100.0 | % | 100.0 | % | 8,305 | ||||||||||
|
Total Square Feet
|
295,509 | $ | 51,145 | ||||||||||||||||
|
Total Units
|
0 | ||||||||||||||||||
Definitions
January 31, 2010
Annualized base rent (ABR) is calculated as monthly base rent (cash basis) per the lease, as of the reporting period, multiplied by 12.
Debt to total market capitalization is total debt from the balance sheet divided by the sum of total debt from the balance sheet plus the market value of shares outstanding at the end of the period.
Debt service coverage ratio is computed by dividing earnings before interest income and expense, depreciation, amortization and gain on sale of real estate by interest expense and principal amortization.
EBITDA is earnings before interest, taxes, depreciation and amortization. We consider EBITDA to be an appropriate supplemental performance measure because it eliminates depreciation, interest and the gain/loss from property dispositions, which permits investors to view income from operations without the effect of non-cash depreciation or the cost of debt; however, EBIDTA as we calculate it has not been adjusted for the effect of nonrecurring events such as asset impairment and gain/loss on involuntary conversion. EBITDA is a non-GAAP measure. EBITDA as calculated by us is not comparable to EBITDA reported by other REITs that do not define EBITDA exactly as we do.
Funds from operations (FFO) - The National Association of Real Estate Investment Trusts, Inc. (NAREIT) defines FFO as net income (computed in accordance with generally accepted accounting principles, excluding gains/losses from sales of property plus real estate depreciation and amortization. FFO is a non-GAAP measure. We consider FFO to be a standard supplemental measure for equity real estate investment trusts because it facilitates an understanding of the operating performance of properties without giving effect to real estate depreciation and amortization, which assume that the value of real estate assets diminishes predictably over time. Since real estate values instead historically rise or fall with market conditions, we believe that FFO provides investors and management with a more accurate indication of our financial and operating results.
Payout ratio (FFO per share and unit basis) - The ratio of the current quarterly distribution rate per common share and unit divided by quarterly FFO per share and unit.
Ratio of earnings to fixed charges - The ratio of earnings to fixed charges is computed by dividing earnings by fixed charges. For this purpose, earnings consist of income from continuing operations plus fixed charges and preferred distributions, less adjustments for noncontrolling interests - consolidated real estate entities, capitalized interest and preferred distributions. Fixed charges consist of mortgage and loan interest expense, whether expensed or capitalized, the amortization of debt expense and capitalized interest.
Ratio of earnings to combined fixed charges and preferred distributions - The ratio of earnings to combined fixed charges and preferred distributions is computed by dividing earnings by combined fixed charges and preferred distributions. For this purpose, earnings consist of income from continuing operations plus fixed charges and preferred distributions, less adjustments for noncontrolling interests - consolidated real estate entities, capitalized interest and preferred distributions. Combined fixed charges and preferred distributions consist of fixed charges (mortgage and loan interest expense, whether expensed or capitalized, the amortization of debt expense and capitalized interest) and preferred distributions.
Stabilized properties are those properties owned for the entirety of both periods being compared. While results presented on a stabilized property basis are not determined in accordance with GAAP, management believes that measuring performance on a stabilized property basis is useful to investors and to management because it enables evaluation of how the Company’s properties are performing year over year.