Attached files
Table of Contents
UNITED STATES
SECURITIES AND EXCHANGE COMMISSION
Washington, D.C. 20549
FORM 10-K
| x | ANNUAL REPORT PURSUANT TO SECTION 13 OR 15(d) OF THE SECURITIES EXCHANGE ACT OF 1934 |
For the fiscal year ended December 31, 2009
or
| ¨ | TRANSITION REPORT PURSUANT TO SECTION 13 OR 15(d) OF THE SECURITIES EXCHANGE ACT OF 1934 |
For the transition period from to
Commission file number: 001-33296
NATIONAL CINEMEDIA, INC.
(Exact name of registrant as specified in its charter)
| Delaware | 20-5665602 | |
| (State or other jurisdiction of incorporation or organization) |
(I.R.S. Employer Identification No.) | |
| 9110 East Nichols Avenue, Suite 200 Centennial, Colorado |
80112-3405 | |
| (Address of principal executive offices) | (Zip Code) | |
Registrant’s telephone number, including area code: (303) 792-3600
Securities registered pursuant to Section 12(b) of the Act:
| Common Stock, par value $0.01 per share | The NASDAQ Stock Market LLC | |
| (Title of each class) | (Name of each exchange on which registered) |
Securities registered pursuant to Section 12(g) of the Act: None
Indicate by check mark if the registrant is a well-known seasoned issuer, as defined in Rule 405 of the Securities Act. Yes ¨ No x
Indicate by check mark if the registrant is not required to file reports pursuant to Section 13 or Section 15(d) of the Act. Yes ¨ No x
Indicate by check mark whether the registrant (1) has filed all reports required to be filed by Section 13 or 15(d) of the Securities Exchange Act of 1934 during the preceding 12 months (or for such shorter period that the registrant was required to file such reports), and (2) has been subject to such filing requirements for the past 90 days. Yes x No ¨
Indicate by check mark whether the registrant has submitted electronically and posted on its corporate Web site, if any, every Interactive Data File required to be submitted and posted pursuant to Rule 405 of Regulation S-T (§232.405 of this chapter) during the preceding 12 months (or for such shorter period that the registrant was required to submit and post such files). Yes ¨ No ¨
Indicate by check mark if disclosure of delinquent filers pursuant to Item 405 of Regulation S-K (§229.405 of this chapter) is not contained herein, and will not be contained, to the best of registrant’s knowledge, in definitive proxy or information statements incorporated by reference in Part III of this Form 10-K or any amendment to this Form 10-K. x
Indicate by check mark whether the registrant is a large accelerated filer, an accelerated filer, a non-accelerated filer, or a smaller reporting company. See the definitions of “large accelerated filer,” “accelerated filer” and “smaller reporting company” in Rule 12b-2 of the Exchange Act.
| Large accelerated filer | ¨ | Accelerated filer | x | |||
| Non-accelerated filer | ¨ (Do not check if a smaller reporting company) | Smaller reporting company | ¨ | |||
Indicate by check mark whether the registrant is a shell company (as defined in Rule 12b-2 of the Exchange Act). Yes ¨ No x
Based on the closing sales price on July 2, 2009, the aggregate market value of the voting and non-voting common stock held by non-affiliates of the registrant was $561,897,479.
As of March 2, 2010, 43,095,024 shares of the registrant’s common stock, par value of $0.01 per share, were outstanding.
DOCUMENTS INCORPORATED BY REFERENCE
Certain portions of the registrant’s definitive proxy statement to be used in connection with its Annual Meeting of Stockholders and to be filed within 120 days of December 31, 2009 are incorporated by reference into Part III, Items 10-14, of this report on Form 10-K.
Table of Contents
| Page | ||||
| PART I | ||||
| Item 1. | 3 | |||
| Item 1A. | 24 | |||
| Item 1B. | 38 | |||
| Item 2. | 38 | |||
| Item 3. | 38 | |||
| Item 4. | 38 | |||
| PART II | ||||
| Item 5. | 39 | |||
| Item 6. | 41 | |||
| Item 7. | Management’s Discussion and Analysis of Financial Condition and Results of Operations |
45 | ||
| Item 7A. | 57 | |||
| Item 8. | 57 | |||
| Item 9. | Changes in and Disagreements With Accountants on Accounting and Financial Disclosure |
57 | ||
| Item 9A. | 58 | |||
| Item 9B. | 60 | |||
| PART III | ||||
| Item 10. | 60 | |||
| Item 11. | 60 | |||
| Item 12. | Security Ownership of Certain Beneficial Owners and Management and Related Stockholder Matters |
60 | ||
| Item 13. | 60 | |||
| Item 14. | 60 | |||
| PART IV | ||||
| Item 15. | 61 | |||
| 62 | ||||
Table of Contents
PART I
The information in this Form 10-K contains certain forward-looking statements, including statements related to trends in the Company’s business. The Company’s actual results may differ materially from the results discussed in the forward-looking statements. Factors that might cause such a difference include those discussed in “Business”, “Risk Factors” and “Management’s Discussion and Analysis of Financial Condition and Results of Operations”, and “Forward Looking Statements” as well as those discussed elsewhere in this Form 10-K.
In this document, unless the context otherwise requires:
| • | “NCM Inc.,” “ the Company,” “we,” “us” or “our” refer to National CineMedia, Inc., a Delaware corporation, and its consolidated subsidiary National CineMedia, LLC; |
| • | “NCM LLC” refers to National CineMedia, LLC, a Delaware limited liability company, which commenced operations on April 1, 2005, and is the current operating company for our business, which NCM Inc. acquired an interest in, and became a member and the sole manager of, upon completion of our initial public offering (the “offering”), which closed on February 13, 2007; |
| • | “AMC” refers to AMC Entertainment Inc. and its subsidiaries, National Cinema Network, Inc., or “NCN,” which contributed assets used in the operations of NCM LLC and formed NCM LLC in March 2005, and American Multi-Cinema, Inc., which became party to an amended and restated exhibitor services agreement (“ESA”) with NCM LLC upon completion of the offering; |
| • | “Cinemark” refers to Cinemark Holdings, Inc. and its subsidiaries, Cinemark Media, Inc., which joined NCM LLC in July 2005, and Cinemark USA, Inc., which became party to an amended and restated ESA with NCM LLC upon completion of the offering; and |
| • | “Regal” refers to Regal Entertainment Group and its subsidiaries, Regal CineMedia Corporation, or “RCM,” which contributed assets used in the operations of NCM LLC, Regal CineMedia Holdings, LLC, which formed NCM LLC in March 2005, and Regal Cinemas, Inc., which became party to an amended and restated ESA with NCM LLC upon completion of the offering. |
| Item 1. | Business |
The Company
NCM, Inc., a Delaware corporation organized on October 5, 2006 is a holding company that manages its consolidated operating subsidiary NCM LLC. NCM, Inc. has no business operations or material assets other than its ownership interest of approximately 41.5% of the common membership units in NCM LLC acquired in connection with our initial public offering as discussed more fully in “Corporate History” below. NCM LLC’s founding members, AMC, Cinemark and Regal, the three largest motion picture exhibition companies in the United States, hold the remaining 58.5% of NCM LLC’s common membership units. Our primary source of cash flow from operations is distributions from NCM LLC pursuant to the NCM LLC operating agreement. We also receive management fees pursuant to a management services agreement between us and NCM LLC that fund NCM, Inc.’s costs primarily associated with our five executive officers.
NCM LLC has long-term exhibitor services agreements (“ESAs”) with NCM LLC’s founding members and multi-year agreements with several other theatre operators whom we refer to as network affiliates. The ESAs and network affiliate agreements grant NCM LLC exclusive rights in their theatres, subject to limited exceptions, to sell advertising, meeting and communication services and to distribute entertainment programming through our Fathom Events divisions.
3
Table of Contents
Description of Business
Overview
We operate the largest digital in-theatre network in North America that allows us to distribute advertising and Fathom business and consumer events utilizing our proprietary store and forward digital content network (“DCN”) and live digital broadcast network (“DBN”). We currently derive revenue principally from the following activities:
| • | Advertising: We develop, produce, sell and distribute several versions of a branded, on-screen pre-feature entertainment and advertising program called “FirstLook,” along with advertising programming on our lobby entertainment network (“LEN”) in theatre lobbies. For the year ended December 31, 2009, advertising accounted for 88% of our total revenue; |
| • | Fathom Events: We distribute, through our Fathom Events divisions, entertainment programming and business communication and marketing content to theatres across our DCN (for pre-recorded events) and DBN (for both live and pre-recorded events). We also facilitate live and pre-recorded networked and single-site meetings, church services, and corporate marketing/communication events in the movie theatres throughout our theatre network. For the year ended December 31, 2009, Fathom Events accounted for 12% of our total revenue. |
We believe that the reach, scope and digital delivery capability of our network provide an effective platform for national and local advertisers to reach a large, young and affluent audience on a highly-targeted, engaging and measurable basis. Our network is currently located in 47 states and the District of Columbia and covers all of the top 25, as well as 49 of the top 50, Designated Market Areas®, or DMAs®, and 171 DMAs® in total. DMA® is a registered trademark of Nielsen Media Research, Inc. During 2009, approximately 667 million patrons, representing approximately 48% of the total U.S. theatre attendance, attended movies shown in theatres included in our network. As of December 31, 2009, we had a total of 16,803 screens in our network, representing 44% of the total movie screens in the U.S., some of which do not show advertising. A summary of the screens in our network is set forth in the table below:
Our Network*
(As of December 31, 2009)
| Screens | |||||||||
| Theatres | Digital | Total | % of Total | ||||||
| Founding Members |
1,096 | 13,344 | 14,401 | 85.7 | % | ||||
| Network Affiliates |
225 | 2,069 | 2,402 | 14.3 | % | ||||
| Total |
1,321 | 15,413 | 16,803 | 100.0 | % | ||||
| * | Excludes Consolidated Theatres as discussed below |
Star Theatres screens, which are part of the Loews Cineplex Entertainment Inc, a wholly-owned subsidiary of AMC (“AMC Loews”), became a part of our network in the first quarter of 2009, after expiration of the run-out of certain pre-existing contractual obligations for on-screen advertising. As of December 31, 2009, Star Theatres operated 8 theatres with 138 screens.
On April 30, 2008, Regal acquired Consolidated Theatres. As of December 31, 2009, Consolidated Theatres operated 28 theatres with 399 screens. In accordance with the ESA, these acquisitions became part of our network in exchange for the issuance of new NCM LLC units as defined in the Common Unit Adjustment Agreement. The Consolidated Theatres screens, which are subject to the run-out of certain pre-existing contractual obligations for on-screen advertising, become a part of our network in 2011.
4
Table of Contents
On January 19, 2010, AMC announced it had entered into a definitive agreement with Kerasotes ShowPlace Theatres, LLC (“Kerasotes”) in which AMC will acquire substantially all of the Kerasotes theatres. Kerasotes, located in mid-sized, suburban and metropolitan markets primarily in the Midwest, owned 96 theatres and 973 screens as of January 2010. Upon completion of the acquisition of the Kerasotes theatres by AMC, our network affiliate agreement with Kerasotes will terminate and the theatres will become subject to the AMC ESA upon the issuance of additional NCM LLC units as set-forth in the Common Unit Adjustment Agreement. The addition of Kerasotes to AMC does not increase our screen count or attendance as it represents a movement from a network affiliate agreement to the ESA structure. After the Common Unit Adjustment, we expect our affiliate expense will be reduced and as a result our Adjusted OIBDA and Adjusted OIBDA margins should increase. (See Item 6. Selected Financial Data for a discussion of Adjusted OIBDA and Adjusted OIBDA margins.)
On-Screen Advertising
Our on-screen digital FirstLook pre-feature show consists of national and local advertising, as well as behind the scenes “making of” and other entertainment content provided by our content partners. The pre-feature show generally ranges in length from 20 to 30 minutes and ends at or about the advertised show time. We distribute several versions of FirstLook including versions for each movie rating that are customized with the theatre circuits branding and a version called FirstLook Play designed for a young audience and played generally before “G” rated animated films.
The majority of our entertainment content segments are provided to us under exclusive multi-year contractual arrangements with leading media and entertainment companies that we refer to as content partners. Under the terms of the contracts, our content partners make available to us original content segments and make commitments (generally two years) to buy a portion of our advertising inventory at a specified CPM. The original content produced by these content partners typically features behind-the-scenes interviews with producers, directors and actors or “making-of” segments relating to feature films or upcoming broadcast or cable television shows. In addition, we have an exclusive cell phone courtesy public service announcement (“PSA”) reminding moviegoers to silence their cell phones and refrain from texting during the showing of the feature film.
National advertising is sold on a CPM (cost per thousand) impressions basis, while local advertising is sold on a per-screen, per-week basis. While we generally sell our network as a national network by movie rating or groups of ratings, we also have the ability to sell portions of our network on a regional basis or by individual movie or movie genre grouping, offering national advertisers a way to target specific audience demographics, various price points and overall cost levels, which expands the number of potential clients.
The pre-feature advertising begins with a three to five-minute looping segment that consists of a digital carousel of static and moving slide images primarily for local advertisers. This digital carousel can loop partially or repeatedly and provides a mechanism to contract or expand depending on the time between feature film presentations. The local advertisements shown in the digital carousel are generally our lowest cost advertising inventory. We often bundle time in the digital carousel presentation with other local on-screen or lobby advertising inventory.
Following the conclusion of the digital carousel, the branded FirstLook pre-show commences. FirstLook and FirstLook Play were created in order to provide a more entertaining pre-feature program for theatre patrons and a more effective advertising platform for our advertising clients by integrating full-motion local and national advertising with entertainment content segments primarily provided by our content partners.
FirstLook is comprised of up to four segments, each approximately four to seven minutes in length. Segment four, the first section of FirstLook, begins approximately 20 to 25 minutes prior to the advertised show time and generally includes local advertising. Segment three typically begins approximately 18 minutes prior to the advertised show time and features primarily 15 or 30-second local or regional advertisements by individual theatres, or across an entire DMA or series of DMAs. Segment three also includes a two and one-half minute
5
Table of Contents
entertainment content segment. Segment two and segment one run closest to the advertised show time and feature primarily national advertisements. Both segment two and segment one include a two and one-half minute entertainment content segment provided by our content partners, along with national advertisements which are generally 30 or 60 seconds. Segment two and segment one begin approximately 13 minutes and eight minutes, respectively, before the advertised show time.
Approximately 92% of our total screens are part of our DCN representing approximately 93% of our total network attendance. The remaining non-digital screens display national advertisements on 35 mm film or “rolling stock” and local advertisements using slide carousels.
The film trailers that typically run before the feature film are not part of FirstLook. Film trailers do not begin until after the FirstLook program ends at or about the advertised show time.
We offer multiple versions of FirstLook each month that include advertising content that is appropriate for a specific film rating category and branding of the specific theatre operator. This programming flexibility provides advertisers with the ability to target specific audience demographics and gives us the ability to ensure that the content and advertising is age-appropriate for the movie audience. We rotate the entertainment content segments between theatres approximately every two weeks to ensure that frequent moviegoers are entertained by fresh content segments.
Our goal in creating FirstLook as a branded entertainment program is to create a new “first release window” for advertising into the marketplace, similar to the way films are released first in cinemas. To that end, we encourage advertisers to provide us with advertisements before they are shown on other media platforms, different versions of those advertisements, or original content that is specifically created for cinema. We also offer pre- and post-production services to our clients (primarily local), for a fee, to enhance the quality of the content we display.
The FirstLook program also includes time slots for founding member and network affiliate advertisements to promote various activities associated with the operation of the theatres, including concessions, on-line ticketing partners, gift card and loyalty programs, special events presented by the theatre operator and vendors of services provided to theatres, so long as such promotion is incidental to the vendor’s service or products sold in the theatre. This time is provided by us to the theatre operator at no charge and generally includes 45 seconds within 15 minutes of show time, 15 seconds of which will be placed within 11 minutes of show time, and the remainder placed at our discretion. We may move the placement of the theatre operator advertisements up to one minute further from the advertised movie show time if we sell additional advertising units to third parties that precede the founding member advertisements.
Under the ESAs, beginning in 2009 the last 60 seconds of the FirstLook program was sold to our founding members. Prior to 2009, 90 seconds had been sold to certain of our founding members. This time is used to satisfy their on-screen advertising commitments under their beverage concessionaire agreements. This time is priced on an agreed CPM, which increases each year as specified in the ESA.
The arrangements with NCM LLC’s founding members relating to on-screen advertising for their beverage concessionaires and the agreements with our content partners and cell phone PSA represented approximately $116.9 million or 31% of our total revenue for the year ended December 31, 2009.
Lobby Network and Promotions
Lobby Entertainment Network. Our LEN is a network of television and high-definition plasma screens strategically located throughout the lobbies of a majority of our digitally equipped theatres. As of December 31, 2009, our LEN had 2,640 screens in 1,188 founding member and network affiliate theatres connected to our DCN. The LEN screens are strategically placed in high-traffic locations such as concession stands and film
6
Table of Contents
queuing and other waiting areas. Programming on our LEN consists of an approximately 30-minute loop of five branded entertainment content segments created specifically for the lobby with advertisements running between each segment. Our LEN programming has the same programming flexibility as the FirstLook on-screen programming. The LEN is currently displaying the same program simultaneously on all lobby screens within a given theatre, which we believe provides the maximum impact for our advertisers. We sell national and local advertising on the LEN individually or bundled with on-screen or other lobby promotions. The LEN programming includes up to two minutes for founding member advertisements to promote activities associated with the operation of the theatres, including concessions, ticketing partners, gift card and loyalty programs, special events presented by the theatre operator, vendors of services provided to theatres, so long as such promotion is incidental to the vendor’s service. Additionally, subject to certain limitations, the LEN programming includes up to two minutes (one minute of which we provide to the founding member at no cost and one minute of which the founding member may purchase) to promote certain non-exclusive cross-marketing relationships entered into by the theatre operators for the purpose of increasing theatre attendance, which we call strategic programs.
Under the terms of the ESAs, the founding members also have the right to install additional screens in their theatre lobbies, which would not display our LEN programming, and would be used to promote strategic programs or their theatre concessions, ticketing partners, gift card and loyalty programs, special events presented by the founding member and vendors of services provided to theatres, so long as such promotion is incidental to the vendor’s service.
Lobby Promotions. We also sell a wide variety of advertising and promotional products in our theatre lobbies. These products can be sold individually or bundled with on-screen or LEN advertising. Lobby promotions typically include:
| • | advertising on tickets and concession items such as beverage cups, popcorn bags and kids’ trays; |
| • | coupons and promotional materials, which are customizable by film or film rating category and are distributed to ticket buyers at the box office; |
| • | product sampling and display; and |
| • | signage throughout the lobbies, including posters, banners, counter cards, danglers, floor mats, standees and window clings. |
Under the terms of the ESAs, the founding members may conduct a limited number of lobby promotions at no charge in connection with the promotion of motion pictures and their strategic programs; however, such activities will not reduce the lobby promotions inventory available to us.
Our ability to provide in-lobby marketing and promotional placements in conjunction with our other marketing solutions allows us to provide integrated marketing products to advertisers with multiple interactions with theatre patrons throughout the movie-going experience, which we believe is a competitive advantage over other national media platforms.
Branded Entertainment Web Sites
In 2009, we launched our branded consumer entertainment web site, NCM.com and updated our FathomEvents.com website. NCM.com is meant to be an extension of our FirstLook pre-show to expand our advertising reach to online consumers and provide an opportunity to create a unique integrated bundle of marketing products for our clients. As part of our advertising network strategy, we are developing and operating the site through our existing media production and technology group and selling the advertising primarily through our existing sales forces and believe that a new revenue stream with attractive margins can be developed with limited investment. We will employ several marketing strategies to drive traffic to NCM.com and FathomEvents.com including using our FirstLook pre-show to market the site. During 2009, FathomEvents.com
7
Table of Contents
was integrated with NCM.com as part of an online advertising network that we operate, market and sell. As of December 2009, our online advertising network included approximately 40 entertainment websites. This vertically integrated online ad network provides advertisers the ability to target online entertainment consumers while providing publishers a way to benefit from NCM’s sales infrastructure ad bundling with NCM’s in-theatre network.
Fathom Events
Our Fathom Events business focuses on the marketing and distribution across our digital network of live and pre-recorded entertainment programming to consumers and meeting and communication services to businesses. We believe our network provides a highly attractive high-definition distribution network to content owners to be used for individual programs or program series and also creates promotional opportunities for national brands. Our Fathom Consumer events have included live and pre-recorded concerts featuring contemporary music, opera and symphony, DVD product releases and marketing events, theatrical premieres, Broadway plays, live sporting events and other special events. Event content is broadcast live over our DBN or on a pre-recorded basis over both our DBN and DCN and may be encrypted for piracy protection. As of December 31, 2009, our network has the capability to deliver:
| • | live high definition or “up-converted” standard definition content to over 500 theatres with up to four screens per theatre; and |
| • | high-definition pre-recorded content to virtually all our 15,413 digital screens on our DCN network. |
We advertise our entertainment events either through a digital trailer shown after FirstLook or advertisements during FirstLook using unsold advertising inventory, on lobby posters, on our LEN, or NCM.com and FathomEvents.com internet site and in some cases through radio trade-outs or paid media in select publications. We have developed content and cross-marketing relationships with several live content promotion companies and other owners of entertainment content. We believe that these partnerships and other new relationships that we are establishing will provide us with a consistent supply of programming as a Fathom relationship provides additional marketing channels for bands, promoters and content owners. During 2009 we had several successful live events, including the New York Metropolitan Opera (“Met”), This American Life, DCI Live, Glenn Beck’s Common Sense Tour, Glenn Beck’s Christmas Sweater: A Return to Redemption and the Mayweather/Marquez fight.
Our Fathom Business division facilitates live and pre-recorded networked and single-site business meetings, corporate events and church services in movie theatres. These events are typically scheduled from Monday through Thursday during off-peak hours while theatre attendance for movies is traditionally low. Clients can also communicate on a live basis to audiences located in auditoriums connected to the majority of our DBN locations. As of December 31, 2009, there were 420 locations connected to our DBN for our corporate marketing events. At all of our DCN locations, in-person presentations can be made or pre-recorded content can be distributed over our DCN and presented as part of a national presentation. All content can be encrypted to protect against piracy. Our business communications and marketing events enhance the educational and entertainment value of a presentation by utilizing the big screen, stadium seating, high-resolution digital projection and audio. Our network also facilitates large meetings in multiple locations across the U.S. We are able to offer our corporate clients a single point of contact and standardized pricing across our network, which dramatically increases the efficiency of booking multi-location events. We promote our Fathom Events divisions throughout the theatre, on the internet and through other select media outlets such as trade publications. Recent corporate marketing events have included corporate meetings to announce a merger or acquisition, training seminars, product launches, religious services and sales and marketing events.
Sales and Marketing
In-Theatre Advertising. We sell our in-theatre and online advertising products and event sponsorships through our national and local sales teams through our regional sales offices. We market our advertising products
8
Table of Contents
through our marketing group located primarily in our New York City sales offices. Our national sales staff is located in our sales offices in New York City, Woodland Hills (outside Los Angeles) and Chicago.
We currently have 30 sales personnel (including management and sales support staff) within our national sales group. During 2009, approximately 32% of the total compensation of the national sales staff was related to bonus or commission, which is based on achieving certain sales targets, with commissions or bonuses shared across the entire team in order to enhance coordination and teamwork. Our national sales organization has proven to be highly profitable and scalable as we have not added a significant number of sales personnel as our network has expanded.
Our local and regional sales staff is located throughout the country, covering on average approximately 115 screens each and generally selling directly to our local clients. During 2009, approximately 75% of the compensation for local sales staff was based on an individual sales commission on collected sales. As our network and local business grows, it may require the addition of sales personnel to cover the new markets or screens. We currently have 150 sales personnel (including management and sales support staff) within our local and regional sales groups.
Over the past several years, we have increased our national and local (including regional) advertising revenue by expanding the number of clients and product categories through sales outreach and several marketing tactics, including expansion and improvement of research provided to clients. We aggressively market and sell directly to clients as well as advertising agencies. We also on occasion place advertising in national trade publications and execute direct mail and internet marketing for our local advertising business. We have a public relations department, a marketing department and a research department and on occasion have commissioned third-party market research to assist our sales team. We believe that improved research regarding cinema advertising and our network has provided our customers with compelling statistical evidence of the superiority of our advertising products relative to television and other traditional advertising mediums based on metrics such as brand recognition, message recall, and likeability. In addition, we believe we are capturing increasing market share from traditional advertising media by establishing cinema advertising as a more accountable and effective advertising medium relative to other media. We currently have 29 personnel based in New York and Denver that focus on the marketing, research and public relation aspects of our advertising business.
Fathom Events. We have a staff of 33 (including management) that is dedicated to sales and a staff of eight that market our Fathom Events business. In fiscal 2009, we facilitated approximately 9,800 Fathom Business events (a decrease of 6.7% over 2008), and held 59 Fathom Consumer events (an increase of 26% over 2008) attended by approximately 1,800,000 patrons (an increase of 38% over 2008). The Fathom Business services are marketed primarily through trade publications, on the internet and attendance at various trade shows. Fathom Consumer events are marketed primarily using the FirstLook pre-show, trailers after FirstLook, through our NCM.com and FathomEvents.com websites and internet sites of our programming partners and other cross marketing activities with content providers.
Media and Creative Services
Our media and creative services department uses state of the art, proprietary and non-proprietary technologies and practices to ensure the highest possible cinema quality presentation for the creation of the FirstLook, LEN presentations and all of our other in-theatre marketing products. We believe the expertise of this group in optimizing content for cinema playback within our FirstLook pre-show and our internet sites, NCM.com and FathomEvents.com, has been instrumental in our ability to provide a better experience for the theatre patron and to enhance our ability to attract and retain our on-screen advertising clients and new network affiliates to our network. We provide a full spectrum of production and post-production services on a per contract basis, for a fee, including audio enhancements, color correction and noise reduction. While most of the content we receive from our clients is high definition, as part of our post-production process we “up-convert” any standard definition content that we receive to high-definition format and quality cinema surround sound, ensuring a high quality,
9
Table of Contents
high impact presentation of our clients’ content and advertisements. Our expertise and experience in cinematic production and our ability to tailor advertisements developed for television to a high-definition cinema playback format facilitates the ability of national advertisers to display content originally provided for television thus optimizing their original investment for the big-screen presentation. We also offer creative services to our clients (primarily local), developing full sight, sound and motion high-definition advertisements from concept to completion. This service substantially reduces the obstacles for smaller clients to invest in cinema-quality advertising. During 2009 we produced over 60% of the local advertisements that played across our networks. Additionally, our media and creative services ensure the consistent image and sound quality of the pre-feature and event content distributed over our network, which we believe has a positive impact on the audience reaction to and recall of our content and advertisements, as well as the overall quality of movie-goers’ experience. Certain of our founding members also engage us for the production of their on-screen concession product advertisements and policy trailers, pursuant to the terms of the ESAs.
Technology and Other Corporate Branding
We utilize our digital media expertise, our proprietary digital content software (“DCS”) and various digital network technologies to deliver high-quality cinema advertising and live and pre-recorded Fathom events to our network theatres. These technologies facilitate the delivery of a high quality entertainment experience and provide advertising clients a lower cost and more programming flexibility than 35 mm “rolling stock” historically used in cinema advertising. Moreover, our technology allows significant operational and scheduling flexibility to our advertising clients that can target various demographic groups by location, movie rating or movie and measure advertising audience size and efficiently monitor and provide audit data of the on-screen playback.
We employ two satellite networks to distribute content to our theatres. Our DCN, which is the combination of a satellite distribution network and a terrestrial network utilizing several carriers, is used to distribute our FirstLook and FirstLook Play content to 15,413 screens, 1,178 theatres and over 3.3 million seats. Our DBN satellite network is used to support our live Fathom events by broadcasting live feeds to over 680 screens in over 500 theatres and more than 180,000 theatre seats.
The satellite technology we use provides a cost-effective means to deliver live and pre-recorded digital content to theatres. We employ a variety of technologies that “wrap” around the satellite process to help ensure uninterrupted service to theatres. For example, our DCS software has automated implementation capabilities that allow for data files to be multicast to theatres over a large footprint. Our digital content system operated in our network operations center (“NOC”) combined with in-theatre systems that are connected to the in-theatre management systems are interfaced with our satellite provider network to dynamically control the quality, placement, timing of playback and completeness of content within specific auditoriums. The integrated DCN (including the DCS software) is controlled by our NOC in our Centennial, Colorado headquarters, which supports and monitors over 50,000 in-theatre hardware devices and more than 280,000 alarm points on the network.
Through our NOC, we have access to and can monitor and initiate repairs to the equipment in our entire digital network of theatres. Our NOC operates 24 hours a day, seven days a week. Digital content is uploaded from our NOC and distributed through the DCN to theatres well in advance of playback. The content is delivered via multicast technology to all theatres in our network and received by our theatre management system where it is held until displayed in specified theatre auditoriums according to its contract terms. Each theatre auditorium has a client- server architecture that controls the content to be shown in the auditoriums or over the LEN in the theatre lobby. After the theatre management system receives digital content from the DCN, confirmation of content playback is returned via satellite to our NOC to be included in “post” reports provided to our advertising clients.
In 2009, after several years of discussions, we began the transition of our production capabilities to the new digital cinema platform, including the ability to distribute and display 3D advertising and events. As part of this
10
Table of Contents
effort, our capabilities are being expanded to encode digital content files for the digital cinema standard (JPEG 2000). The industry rollout of the digital cinema projectors and servers for feature films is expected to accelerate in 2010. We believe that we are ready to transition our advertising, Fathom Events businesses to these new digital cinema projectors as they are deployed. As the majority of the cost of the digital cinema deployment will be funded by others, it is not expected to create a significant increase in capital expenditures and is not expected to have a significant impact on our Adjusted OIBDA as increases in our operating costs are expected to be offset by the sales benefits associated with the higher quality projection and ability to do 3D advertising and events.
Our Competitive Strengths
We believe that our key competitive strengths include:
Superior, Targeted National Advertising Network
We believe that our national advertising network allows for effective targeting of marketing messages to a large, young and affluent audience that delivers measurable results, yielding a superior return on investment for advertisers as compared to many traditional national and local media platforms. As a result, we are able to compete effectively for marketing spending by local and national advertisers through our relationships with a diversified group of local and national advertising brands and agencies throughout the U.S. Following are the key competitive strengths of our advertising business:
| • | Extensive National Market Coverage. Our contractual agreements with our founding members and network affiliates provide long-term exclusive access, subject to limited exceptions, to the largest network of digitally equipped theatres in the U.S. and allow us to sell advertising nationwide which we distribute using our DCN and DCS. As of December 31, 2009, our network included 15,413 digital screens (13,344 operated by our founding members) and 16,803 screens in total (14,401 operated by our founding members) located in 1,321 theatres (1,096 operated by our founding members) in 47 states and the District of Columbia. The total network theatre attendance was approximately 667 million during 2009 (584 million from our founding members), which represented approximately 48% of the total U.S. theatre attendance for the year. Our network also provides us with access to some of the most modern and highly attended theatres in the industry, as measured by screens per location and attendance per screen. The average screens per theatre in our network was 12.7 screens, 1.8 times the U.S. theatre industry average, and the aggregate attendance per screen of theatres included in our network as of December 31, 2009 was 39,114, versus the U.S. theatre industry of indoor screens of 36,605, as reported by the National Association of Theatre Owners (“NATO”) as of December 31, 2009. In addition, our theatre network has access to the largest U.S. markets, including all of the top 25, as well as 49 of the top 50, U.S. DMAs®, and 171 DMAs® in total. As of December 31, 2009, approximately 75% of our screens (77% of our attendance) are located within the top 50 U.S. DMAs® and approximately 36% (40% of our attendance) are located within the top 10 U.S. DMAs®. At the end of 2009, theatres within our network represented approximately 67% of the total theatre attendance in theatres that showed national advertising in both the top 10 and top 25 U.S. DMAs®, providing a very attractive platform for national advertisers who want exposure in larger markets. We plan to continue to expand our network through the addition of new network affiliates and through the addition of new theatres built or acquired by our founding members or existing network affiliates. This expansion will improve our ability to compete with other national advertising mediums. |
| • | Targeted, Flexible Advertising Medium. Our digital network technology gives us flexibility in distributing content to our entire audience, or to specific theatres, geographic regions, or demographic groups based on film title or film rating category. As a result, our clients can deliver a targeted advertising message utilizing high quality sight, sound and motion across our national network. Our technology also shortens distribution lead times, reduces ours and our client’s operating costs and enables us to respond quickly to client requests to change advertising content. |
| • | Access to a Highly Attractive Demographic Segment. We offer advertisers the ability to reach young and affluent consumers. According to a Nielsen Media Research study conducted in the third quarter of |
11
Table of Contents
| 2009, typical movie-goers are young, with 47% between the ages of 12-34; affluent, with a mean household income of over $74,000 compared to a national mean of approximately $60,500; and well-educated, with 47% having a college or post-graduate degree compared to 28% of the general population. We believe that this demographic is highly coveted by advertisers and is difficult to reach effectively using traditional media platforms. |
| • | Engaged Theatre Audience. We believe that cinema advertising benefits from the visual quality and impact of the “big screen” and digital surround sound presented in a distraction-free engaged theatre environment. According to industry studies, theatre advertising is more effective than advertising shown on television in terms of unaided recall rates. Cinema advertising is one of the few media platforms that the viewer does not have the ability to skip or turn off. |
| • | Superior Audience Measurability. We receive film-by-film, rating-by-rating and theatre-by-theatre attendance information weekly from NCM LLC’s founding members and the majority of network affiliates, which allows us to report to clients the audience size for each showing of a film and our pre-show. We also complete third-party research that provides us with the percentage of the total attendance that are in their seats at various times prior to the advertised show time. We believe this ability to provide advertisers with audience counts gives us a distinct competitive advantage over traditional media platforms that are based on extrapolations of a very small sample of the total audience. In addition to the studies of when theatre patrons are in their seats, we also provide our advertisers with information regarding the demographics of the cinema audience and the effectiveness of a given advertisement using research from several third-party research companies such as Nielsen Media Research and Mediamark Research Inc. We also work closely with third-party research companies to measure the recall, likeability, and brand message of our cinema advertisements. |
Innovative, Branded Digital Pre-Feature Content
We believe that our digital entertainment and advertising pre-feature programs, FirstLook and FirstLook Play, provide a high-quality entertainment experience for patrons and an effective marketing platform for advertisers. We have branded our pre-feature shows, FirstLook, to reinforce our goal of creating the “first release window” for advertising into the marketplace, similar to the way that films are released first in cinemas. This strategy provides more original content for the audience and more impact for the advertiser. We have also designed the FirstLook programs with separate local and national “pods” to ensure that advertisements of similar production quality are shown together. Also, our relationships with our content partners provide high quality entertainment content that is dispersed throughout the show. These multi-year contracts with our content partners, contracts for cell phone courtesy PSA and arrangements to satisfy our founding members’ on-screen marketing obligations to their beverage concessionaires. In addition to providing a higher quality pre-show these multi-year contracts accounted for 31% of our total revenue in the year ended December 31, 2009. In addition, the design of the FirstLook pre-shows and our distribution technology ensures that all advertisements end by the advertised show time. According to customer research conducted by us and independent research companies, the production of a higher quality branded pre-feature program improves the entertainment experience for patrons and the effectiveness of the advertising message.
Integrated Marketing Products
In addition to providing on-screen advertising opportunities using our DCN, we offer advertisers the opportunity to integrate and reinforce their on-screen advertisements with various in-lobby and online marketing. Our in-lobby marketing programs include advertisements sold on television or high-definition plasma screens, posters, tickets, box office coupon handouts, popcorn bags and beverage cups and on-site product sampling opportunities. Our online marketing includes ad placement on our NCM.com and FathomEvents.com websites and throughout our online advertising network that currently includes approximately 40 entertainment websites (including NCM.com and FathomEvents.com) with approximately 40 million monthly unique visitors. According to a Nielsen Media Research study conducted in the third quarter of 2009, movie patrons spend, on average, 10.5
12
Table of Contents
minutes in the theatre lobby prior to going into the auditorium, including time at the concession stand. By integrating our online and in-lobby marketing products with on-screen advertising, patrons are exposed to consistent marketing messages through multiple touch points during the entire movie-going experience from the choice of a film online through the viewing of the film in the theatres. Also, by integrating on-screen advertising with our online and in-lobby marketing programs, we believe our advertisers can extend the exposure for their brands and products and create an interactive “relationship” with the consumer that is not available with broadcast or cable television or traditional display advertising. Our marketing team assists advertisers in creating entertaining, fully integrated online and cinema marketing campaigns with maximum impact. We have also recently launched our wireless mobile applications that will provide clients another advertising platform that can be packaged with our in-theatre and online products.
Scalable, State-of-the-Art Digital Content Distribution Technology
Our proprietary software provides many distribution, scheduling, reporting and auditing features. The flexibility of our DCN allows us to create different versions of the FirstLook and our LEN and to distribute these programs by theatre, region, film, film genre group or film rating category. Our technology also provides the ability to electronically change advertisements from our NOC as required by advertising clients, which shortens lead times, provides increased flexibility to change messages or target specific audiences, facilitate two-way interaction amongst participants attending meetings in our auditoriums and significantly reduces the cost as compared to distributing advertisements on 35 mm film. Our NOC, digital content system and other network software provide us with the capability to directly monitor in-theatre network devices and various maintenance alarm technology within our theatre network on a real-time 24/7 basis, providing the high network reliability and timely reporting required by our advertising clients. Our use of the combination of a satellite and terrestrial network technology, combined with the design and functionality of our digital content system software and NOC infrastructure make our network efficient and scalable. We are currently monitoring over 50,000 network devices and more than 280,000 alarm points. Our digital content system plays over 2.7 million digital content files per day through integrated software and network technologies. Given the scalability of our NOC and distribution technology, the number of devices and alarm points could be increased with minimal additional expenditures. While our network capabilities are now primarily used within the theatre environment, we believe they could be easily adapted to the digital cinema and other out-of-home environments.
Strong Operating Margins with Limited Capital Requirements
Our annual adjusted operating income before depreciation and amortization (“OIBDA”) margins have been consistently strong, at approximately 50%. See “Item 6. Selected Financial Data—Notes to the Selected Historical Financial and Operating Data” for a discussion of the calculation of adjusted OIBDA margin and the reconciliation to operating income. Our founding members have also invested substantial capital to deploy, expand and upgrade the network within their theatres. Due to the network investments made by our founding members in new and acquired theatres and the requirements in the ESAs to make future investments for equipment replacements and the scalable nature of our NOC and other infrastructure, we do not expect to make major capital investments to grow our operations as our network of theatres expands. The combination of our strong operating margins and our limited capital expenditures has allowed us to generate significant free cash flow (defined as consolidated net income (or loss) plus depreciation and amortization and minus capital expenditures) before distributions to NCM LLC’s founding members. In the year ended December 31, 2009, our capital expenditures were $8.6 million, of which $0.5 million related to investments in network equipment to add new network affiliate theatres. We believe our expected level of free cash flow generation should provide us with the strategic and financial flexibility to pursue growth opportunities and make dividend payments to our stockholders.
Unique Combination of Management Competencies
Our management team has a unique combination of competencies and experience in advertising sales and marketing, digital media production and post-production, theatre operations and digital network design and
13
Table of Contents
operations. The majority of our senior management team was assembled during the formation of RCM, one of NCM LLC’s joint predecessor companies, in early 2002 and thus has worked together for several years building our business. Our senior management has many years of experience in their respective areas of expertise. We believe that this experience and unique combination of competencies can be leveraged effectively across our existing asset base and technology infrastructure, creating significant operating efficiencies and high returns on invested capital.
Dividend Policy
Our dividend policy is described in “Item 5. Market for Registrant’s Common Equity, Related Stockholder Matters and Issuer Purchases of Equity Securities—Dividend Policy”.
Our Strategy
The digital evolution of the media business and our unique asset base and combination of management competencies will provide us with an opportunity to become a new breed of national digital media network. Our primary strategic initiatives are to:
Leverage Our Core Management Competencies
We have a high quality management team with a combination of core management competencies including: (i) media sales and marketing, (ii) digital technology development and operation and (iii) digital media production and distribution. Our ability to effectively leverage these core competencies across our theatre and online advertising networks and our Fathom Events network has been a key part of our past success and will continue to be a key part of our future growth plan. We believe we can create near and long term equity value by selling more of our in-theatre advertising inventory and leveraging our client relationship base, creativity and technical expertise to develop complementary new in-theatre marketing products and improve our selling proposition by creating integrated marketing products that bundle our theatres, online inventory and Fathom network sponsorships. By leveraging our existing core competencies and challenging our management to be creative and innovative, we can create value with very little incremental capital investment.
Expand Our Advertising Client Base
We intend to increase our market share of U.S. advertising spending and our advertising inventory utilization by expanding commercial relationships with our existing advertising clients and by expanding our advertising client base. Despite a very difficult economy in 2009, we were successful in adding 38 first-time clients and 18 additional clients that had last advertised with us in 2006 or 2007, representing sales of approximately $21 million and $34 million, respectively. We will also continue to aggressively market and sell the positive attributes of cinema relative to other mediums and improve our level of client service and expand the suite of in-theatre, online and Fathom Events sponsorship marketing products sold to our clients. While an increasing number of companies now make cinema advertising part of their media buying plan, there are still many large advertisers and product categories that do not yet include meaningful cinema advertising expenditures in their marketing budgets. We have recently made progress in expanding categories such as military, domestic auto, quick-service restaurants, toys, retail, packaged goods, and financial services. We believe that over time, as market awareness and third-party data on the effectiveness of cinema advertising grows, we expect to increase our revenue from these and other client categories.
We continue to increase the amount of local advertising sold in our pre-feature show and have begun to more aggressively market and sell our local advertising inventory. Our strategy to employ senior sales positions to focus exclusively on larger local clients such as car dealer associations has proven successful and we are expanding this effort to the quick-service restaurant, casual dining and tourism categories. We have also utilized direct marketing campaigns to businesses within a specified radius of our network theatres, with positive results.
14
Table of Contents
These campaigns are often combined with theatre lobby promotions and advertising. Due to the relatively low percentage of local advertising inventory sold today in many of our theatres, we believe that a growth opportunity exists for our local and regional business.
Increase Our National CPM
In 2009, our national on-screen advertising CPM was approximately 2.2 times the average U.S. primetime premium network television CPM as reported by Intermedia Dimensions 2010. We believe that this premium does not yet fully reflect the positive attributes of cinema advertising relative to other advertising mediums including the highly targeted nature of our impressions, higher recall rates, ability to provide measurable and informative demographic audience data to our clients and, most importantly, the inability to turn off or skip our advertising messages. According to research studies, cinema advertising CPMs as a multiple of primetime network television CPMs are much higher in more mature cinema advertising markets such as Europe and Australia. Given these positive attributes, we believe that cinema CPMs in the U.S. will continue to increase over time as a result of our ability to sell more of our advertising inventory and thus create a more favorable supply-demand relationship.
Expand Our Geographic Coverage and Reach
We continue to expand the reach and geographic coverage of our national digital network by connecting additional theatres to our network that NCM LLC’s founding members buy or build and through additional network affiliate agreements with other theatre circuits. The ESAs require that all founding member new or acquired theatres be added to our network in return for the issuance of new NCM LLC units per the Common Unit Adjustment Agreement. In 2011, the Consolidated theatre circuit acquired by Regal will join our network when the existing screen advertising agreement expires. Consolidated theatres will add approximately 399 screens. Our strategy for attracting new network affiliates is to focus primarily on larger regional circuits in the larger metropolitan areas or in geographic areas where we do not currently have significant market coverage. For example, in October 2009 we announced network affiliate agreements with Cobb Theatres, Galaxy Theatres, LLC and Storyteller Theatres Corporation. These three exhibitors currently operate a combined 23 theatres and 268 screens which should deliver approximately 9.1 million attendees for NCM. During 2009 we also added Starplex Cinemas, ShowBiz Cinemas and Picture Show Theatres to our national network for a combined total of 34 additional theatres and 310 screens which should deliver approximately 12.7 million attendees for NCM LLC.
Expand our Internet/Mobile Platform
Advertising clients are increasingly seeking new ways to create integrated marketing solutions across multiple digital platforms. By bundling our in-theatre marketing products with online offerings provided by our consumer websites NCM.com and FathomEvents.com and the entertainment websites that are part of our online advertising network, we allow clients to benefit from a bundle of digital marketing products focused on the entertainment consumer. Our online advertising network and mobile platforms launched in 2009 creates an entertainment focused advertising network that provides smaller entertainment websites access to our national and local sales force as well as rich media widgets and other content created by our media production group.
Expand Our Live and Pre-Recorded Fathom Events Businesses
The continued expansion and improvement of the technical capabilities of our DCN and DBN will provide benefits to our Fathom Events business. Today, virtually all of our digitally equipped screens have the capability to show pre-recorded content. During 2009, we continued to expand our live broadcast capabilities to over 500 locations (from approximately 475 in 2008) with over 180,000 seats in 49 of the top 50 DMAs®, and 152 DMAs® in total. During 2010 we will be upgrading the projection capabilities of our existing network and DCN and DBN technologies with the higher quality digital cinema systems as they are deployed into our network theatres. We expect the improvements to projection technology and expansion of our network will improve the
15
Table of Contents
quality and broaden our capabilities to distribute various kinds of live and pre-recorded entertainment programming, including 3D programming. By expanding our live distribution capabilities, we expect to attract more non-film live and pre-recorded Fathom events, and, as a result, expand our audience and increase our event ticket revenue. In addition to marketing and creating direct relationships with content owners, we will also look to form strategic alliances with promoters and distributors to gain access to high quality content. We have cross-marketing relationships with several content owners, producers and live concert promotion companies. We believe these and other relationships will provide us with a consistent supply of programming and an additional marketing channel for bands, promoters and content owners. For example, our agreement with the Met to distribute live and pre-recorded events nationally across our digital network has been well received by patrons across the country and is the type of relationships that we will pursue in the future.
Increase Market Awareness of Our Fathom Business Division to Expand Our Client Base and Increase Revenue
Our Fathom Business division provides a unique venue for corporate communication and customer marketing that offers advantages over hotels and other traditional meeting venues. Unlike traditional hotel venues, we provide a single point of contact for national event booking and coordination and utilize digital distribution and projection technology. In addition, we also have the ability to bundle meetings with the screening of a film or Fathom Consumer entertainment event, sometimes before the film opens to the general public, in a product known as “Meeting” and a Movie or Fathom Consumer entertainment Event. We believe we can attract more clients to our network theatres and increase the revenue of our Fathom Business division by raising market awareness of the unique benefits of hosting marketing events or corporate meetings at our locations and through the increase in the number of theatres equipped to host live broadcasts completed in 2008 and 2009. In an effort to expand the awareness and client base, we have employed several local and national marketing strategies to communicate the value proposition associated with our Fathom Business division. Marketing strategies include advertising in theatres within the FirstLook pre-show program and on the Internet, implementing e-mail/direct mail campaigns to Fortune 500 CEOs and holding demand generation seminars for prospects in our network theatres and via webinars and virtual conferences. Our advertising sales group also cross-sells our Fathom Business products whenever possible.
Upgrade our Advertising Sales and Inventory Management Systems
We are currently upgrading and improving our advertising sales and inventory management systems. We believe that these upgrades and improvements should enable us to respond more promptly to client requests for proposals, and should provide real-time access to pricing and availability information that allows us to manage our inventory and CPMs more efficiently, improve our management reporting and data analysis and provide the ability to manage a larger network as we add network affiliates and additional theatres acquired or built by our founding members.
Expand into Other Out-of-Home Networks
In 2007, we invested in IdeaCast, Inc. (“IdeaCast”), and in 2008 entered into a put/call relationship with IdeaCast’s lender to provide additional convertible debt funding. In 2009 we settled the put/call relationship with IdeaCast’s lender, acquired the convertible debt and foreclosed on the IdeaCast assets, which were then transferred to another out-of-home digital advertising company, resulting in NCM owning a minority interest in the new combined company called RMG Networks, Inc. (“RMG”). RMG is a provider of advertising to fitness centers and health clubs throughout the U.S. In addition to health clubs, the RMG sales team sells inventory in other out-of-home advertising networks including coffee shops and airlines. This investment is meant to provide an incubation platform for other out-of-home digital advertising networks while our management team focuses on maximizing the growth opportunities associated with our core advertising and Fathom Events businesses. We believe that out-of-home targeted advertising networks should continue to grow in importance as a percentage of advertising spending, providing a future growth engine for NCM as our cinema advertising business matures.
16
Table of Contents
Corporate History
Our business operations are conducted by NCM LLC, which was formed on March 29, 2005, by AMC and Regal as a joint venture that combined the cinema advertising and Fathom Events operations of Regal’s subsidiary, RCM, and the cinema advertising operations of AMC’s subsidiary, NCN. On July 15, 2005, Cinemark joined NCM LLC as a founding member. Because Cinemark had a pre-existing contract with another cinema advertising provider, NCM LLC began selling advertising for Cinemark’s screens on an exclusive basis beginning on January 1, 2006, subject to the run-out of certain pre-existing contractual obligations for on-screen advertising through April 1, 2006. By May 2006, all of Cinemark’s digital screens were connected to our DCN. On January 26, 2006, AMC completed the acquisition of the AMC Loews theatre circuit. The AMC Loews screens became part of our national theatre network on June 1, 2008 (subject to certain run-out provisions), with the exception of Star Theatres, which became part of our network in February 2009.
On February 7, 2007, the SEC declared effective our Registration Statement on Form S-1 (“Registration Statement”) for our initial public offering and the offering was completed on February 13, 2007. In the offering, we sold 42 million shares of our common stock, including 4 million shares pursuant to the underwriters’ over-allotment option, at $21.00 per share. The aggregate gross proceeds from the sale of the 42 million shares of our common stock were $882.0 million. The aggregate net proceeds to us were $826.2 million, after deducting an aggregate of $48.5 million in underwriting discounts and commissions paid to the underwriters, and payment of approximately $7.3 million of direct costs of the offering.
As a result of the IPO and related restructuring as discussed in more detail below, NCM Inc. became 100% owned by the public (including management) and acquired 44.8% of the LLC units of NCM LLC on the date of the IPO. In accordance with our contractual agreements with our founding members, subsequent to the IPO 7,584,807 additional LLC units have been issued to the founding members related to the addition of 34.8 million net attendees to our network from the net effect of new builds, acquisitions and theatre disposals. As of December 31, 2009, NCM Inc. owned 41.5% of NCM LLC. In addition to the growth of our network from new founding member attendees, we have also added 82.8 million attendees since the IPO through network affiliate agreements with certain third-party theatre circuits, which expire at various dates.
Reorganization
The following transactions, which we refer to collectively as the reorganization, occurred in connection with the completion of our initial public offering of our stock that closed on February 13, 2007:
| • | NCM LLC’s agreements with its founding members were amended and restated, including the ESAs and the NCM LLC operating agreement; |
| • | NCM LLC entered into the amended and restated AMC Loews screen integration agreement with AMC pursuant to which AMC pays NCM LLC an amount that approximates the OIBDA we would have generated if we were able to sell advertising in the AMC Loews theatre chain on an exclusive basis; such AMC Loews payments were made quarterly for a specified time period; |
| • | NCM LLC split the number of outstanding common membership units so that a common membership unit was acquired with the proceeds from the initial offering of one share of our common stock after underwriting discounts and commissions and offering expenses; |
| • | NCM LLC was recapitalized on a non-cash basis with a distribution to the founding members of one common membership unit and one preferred membership unit in exchange for each outstanding common membership unit; |
| • | NCM Inc. became a member and the sole manager of NCM LLC following the purchase from NCM LLC of a number of common membership units equal to the number of shares of common stock sold in the offering prior to the underwriters over-allotment; the units were purchased with $746.1 million of the net proceeds of the offering at a price per unit equal to the public offering price per share, less underwriting discounts and commissions and offering expenses; |
17
Table of Contents
| • | NCM LLC used $686.3 million of the proceeds it received to pay NCM LLC’s founding members for their agreeing to modify NCM LLC’s payment obligations under the ESAs; |
| • | options to acquire our common stock were substituted for options to acquire common membership units in NCM LLC, and restricted common stock was issued in substitution for restricted units that were granted to NCM LLC option holders as “IPO awards”; and |
| • | NCM LLC redeemed all the preferred membership units in NCM LLC at an aggregate price of $769.5 million using $709.7 of net proceeds of the $725.0 million term loan that is a part of our senior secured credit facility, as described under “Management’s Discussion and Analysis of Financial Condition and Results of Operations —Financial Condition and Liquidity — Financings — Senior Secured Credit Facility” below, together with $59.8 million of proceeds from the purchase of NCM LLC units. |
NCM LLC’s Founding Members
Regal Entertainment Group
Regal operates the largest theatre circuit in the U.S. based on total number of screens. As of December 31, 2009, Regal operated 548 theatres with a total of 6,768 screens, all of which are located in the U.S. For the fiscal year ended December 31, 2009, Regal’s theatres had total attendance of over 244 million and Regal reported total revenue of approximately $2.9 billion.
On April 30, 2008, Regal acquired Consolidated Theatres. Consolidated Theatres has an existing contract for on-screen advertising with another cinema advertising provider. Pursuant to the amended ESAs and Common Unit Adjustment Agreement, Regal effectively elected to receive 2,913,754 newly issued NCM LLC common units prior to the expiration of the contract with the third-party advertiser. As a result, Regal must make payments pursuant to the ESAs on a quarterly basis in arrears through 2011 in accordance with certain run-out provisions.
AMC Entertainment Inc.
AMC is the second largest theatre circuit in the U.S. based on total number of screens. As of December 31, 2009, AMC owned, operated or held interests in 299 theatres with a total of 4,528 screens globally, with approximately 95%, or 4,289, of its screens in the U.S. (including AMC Loews). For the twelve months ended December 31, 2009, AMC’s theatres had total worldwide attendance of over 199 million and AMC had revenue of $2.4 billion.
In January 2010, AMC announced an agreement to acquire Kerasotes, which AMC expects to complete in the second quarter of 2010, subject to customary closing conditions and regulatory approval. Kerasotes is an existing network affiliate of NCM LLC. Pursuant to the amended ESAs and Common Unit Adjustment Agreement, AMC is required to add Kerasotes to our national theatre network on an exclusive basis, and, at the time Kerasotes theatres are added to our network, AMC would be entitled to receive NCM LLC common units based on the attendance at Kerasotes. The addition of Kerasotes to AMC does not increase our screen count or attendance as it represents a movement from a network affiliate agreement to the ESA structure. After the Common Unit Adjustment, we expect our affiliate expense will be reduced and as a result our Adjusted OIBDA and Adjusted OIBDA margins should increase.
Cinemark, Inc.
Cinemark is the third largest theatre circuit in the U.S. based on total number of screens. As of December 31, 2009, Cinemark operated 424 theatres with a total of 4,896 screens globally, with approximately 78%, or 3,830, of its screens in the U.S. For the twelve months ended December 31, 2009, Cinemark’s theatres had total worldwide attendance of over 236 million and reported total revenue of $2.0 billion.
18
Table of Contents
Agreements with NCM LLC’s Founding Members
Exhibitor Services Agreements
NCM LLC has been the exclusive provider of in-theatre advertising (subject to certain pre-existing contractual obligations for on-screen advertising and other limited exceptions for the benefit of the founding members) in the founding members’ theatres pursuant to agreements entered into with AMC and Regal in March 2005 and with Cinemark in July 2005.
In connection with the completion of the IPO, we entered into amended and restated ESAs with NCM LLC’s founding members. Key provisions of the agreements include:
| • | a term of 30 years beginning February 13, 2007 (the term relating to Fathom Events is initially five years with provisions for automatic renewal if certain financial performance conditions are met for additional five year terms through the 30 year initial term); |
| • | a five-year right of first refusal (except for the Fathom Business and Consumer divisions), which begins one year prior to the end of the term of the ESA; |
| • | exclusive rights to provide advertising for the founding members’ theatres subject to the founding members’ rights to do the following on a limited basis: |
| • | promote activities associated with theatre operations on screen, on the LEN and in the lobby (including on additional video screens in theatre lobbies); and |
| • | promote, on the LEN and in theatre lobbies only, certain non-exclusive cross-marketing arrangements with third parties entered into by the founding members which are designed to promote the theatres and the movie-going experience to increase attendance and revenue; |
| • | payment of a monthly theatre access fee to the founding members; |
| • | a right for the founding members to purchase up to 90 seconds of on-screen advertising time during the pre-feature program at a specified rate (intended to initially approximate a market rate with annual increases of 8% in year one and two and 6% in years three and four and market increases thereafter). This time, which was 60 seconds for 2009 and is expected to be 60 seconds in the foreseeable future, satisfies the founding members’ obligation to provide certain on-screen advertising to their beverage concessionaires pursuant to their beverage concessionaire agreements; |
| • | requires founding members to make available to NCM LLC all acquired and newly constructed theatres for connection to the DCN, less the effect of any closed (prior to the expiration of their existing lease term) or sold theatres in exchange for newly issued NCM LLC units; |
| • | primary responsibility of the founding members to install network equipment in newly built theatres and to ensure that 90% of screens owned by founding members are digital; |
| • | primary responsibility of NCM LLC to obtain, repair, maintain and replace the equipment not included in or on the theatre necessary to operate the DCN; and |
| • | an exclusive right to operate the Fathom Business and Consumer divisions within the founding member theatres through December 31, 2011, with an automatic five-year extension based on achieving certain financial tests. |
Intellectual Property Rights
We have been granted a perpetual, royalty-free license from NCM LLC’s founding members to use certain proprietary software for the delivery of digital advertising and other content through our DCN to screens in the U.S. We have made improvements to this software since the IPO date and we own those improvements, except for improvements that were developed jointly by us and the founding members.
19
Table of Contents
We also have licensed intellectual property that is the subject of several U.S. patent applications relating to scheduling in-theatre advertising and digital content as well as matters relating to digital projector automation. These licenses are governed by the pre-reorganization license agreement.
We have secured U.S. trademark registrations for NCM and National CineMedia and have applied for several others. It is our practice to defend our trademarks and other intellectual property rights, including the associated goodwill, from infringement by others. We are aware that other persons or entities may use names and marks containing variations of our registered trademarks and other marks and trade names. Potentially, claims alleging infringement of intellectual property rights, such as trademark infringement, could be brought against us by the users of those other names and marks. If any such infringement claim were to prove successful in preventing us from either using or prohibiting a competitor’s use of our registered trademarks or other marks or trade names then our ability to build brand identity could be negatively impacted.
Customers
Advertising Customers. Our advertising business has a diverse customer base, consisting of national and local advertisers. We have business relationships with over one hundred national advertisers across a wide variety of industries. During the year ended December 31, 2009, we derived 70.7% of our advertising revenue from our content partners and other national clients (including advertising agencies that represent our clients), 10.8% from founding member beverage agreements and 18.5% from our relationships with thousands of local advertisers across the country (including advertising agencies that represent these clients).
Each of NCM LLC’s founding members have a relationship with a beverage concessionaire under which they are obligated to provide on-screen advertising time as part of their agreement to purchase syrup. During 2009, we provided 60 seconds of on-screen advertising time to our founding members. The ESAs provide for the founding members to purchase this on-screen advertising time at a rate (intended to approximate a market rate) that is provided in the ESA.
Content Partners. We have multi-year contractual relationships that provide entertainment content segments in the FirstLook program and minimum annual advertising spending commitments with several entertainment and media companies. These agreements require that the content partners will provide non-commercial content segments that are entertaining, informative or educational in nature and will purchase a specified dollar amount of advertising at a specified CPM over a two-year period with options to renew, exercisable at the content partner’s option. We also have an exclusive cell phone courtesy public service announcement (“PSA”) reminding moviegoers to silence their cell phones and refrain from texting during feature films. During 2009, the total advertising purchased by these content partners and cell phone PSAs represented 21.2% of our total revenues.
Competition
Our advertising business competes in the over $162 billion U.S. advertising industry with many other forms of marketing media, including television, radio, print media, internet and outdoor display advertising. While cinema advertising represents a small portion of the advertising industry today, we believe it is well positioned to capitalize on the shift of advertising spending away from traditional mass media to more targeted and measurable forms of digital media. As the number of digital media platforms continues to increase, the ability to target narrow consumer demographics and to provide measurable third-party marketing information has become increasingly important. We believe that proliferation of digital technology enabling improved data collection may increase advertisers’ demand for digital advertising platforms and that cinema advertising is well positioned to benefit from these broad market trends.
Through the visual quality and impact of the “big screen” and surround sound, we are able to display high impact advertising impressions to our audiences. According to an IAG Research study conducted in 2008, in certain instances our cinema advertising generated message recall rates up to four times greater than the same
20
Table of Contents
advertising shown on television. Given the scale and technical capabilities of our digital network, we are able to tailor our advertising programs with more flexibility and to a broader audience than other cinema advertising companies, providing a more entertaining consumer experience and a more effective advertising platform for advertisers.
Our advertising business also competes with other providers of cinema advertising, which vary substantially in size, including Screenvision and Unique Screen Media (owned by Cinedigm Digital Cinema Corp.). As one of the largest providers of cinema advertising in the U.S., we believe that we are able to generate economies of scale, operating efficiencies and enhanced opportunities for our clients to access a national and local audience and allowing us to better compete with television and other national advertising networks.
Our Fathom Consumer entertainment programming business competes with other broadcast and cable networks, large-scale public venues, including concert halls and other public meeting venues, and cable, broadcast and on-demand television events. We believe that the combination of our national theatre network, geographic distribution and high quality sight and sound presentation offers content owners and sponsors an effective venue for live and pre-recorded events such as music, sporting and other entertainment events.
Our Fathom Business division competes with a number of venues including hotels, conference facilities, restaurants, arenas and other convention properties, as well as virtual meetings hosted on-line and across private teleconferencing networks. We believe that the combination of our ability to offer clients access to conveniently located theatres with big screens, stadium seating, high-resolution digital projection and audio in multiple locations with ample free parking in most locations offers clients an attractive venue for meetings. Also, we offer a single point of contact and standardized pricing for our services, which is a competitive advantage when booking multi-location marketing or other types of corporate events. In addition, we offer clients the ability to combine a movie or Fathom event with the meeting, which also differentiates us from other meeting venues.
Seasonality
Our revenue and operating results are seasonal in nature, coinciding with the timing of marketing expenditures by our advertising clients, and to a lesser extent, to the attendance patterns within the film exhibition industry. Advertising expenditures tend to be higher during the second, third, and fourth fiscal quarters and are correlated to new product releases and seasonal marketing priorities of our clients. Theatrical attendance is generally highest during the summer and year-end holiday season coinciding with the release of blockbuster films. As a result, our first quarter typically has less revenue and OIBDA than the other quarters of a given year.
Employees
We employed 600 people as of December 31, 2009, which includes employees in our Centennial, Colorado headquarters, people employed in our advertising sales offices in New York, Los Angeles and Chicago, our technology offices in Minneapolis and local advertising account executives and field maintenance technicians that work primarily from their homes throughout the U.S. None of our employees are covered by collective bargaining agreements. We believe that our relationship with our employees is good.
Government Regulation
Currently, we are not subject to regulations specific to the sale and distribution of cinema advertising that we need to comply with in our operations. We are subject to federal, state and local laws that govern businesses generally such as wage and hour and worker compensation laws.
Available Information
We maintain a website at NCM.com, on which we will post free of charge our annual reports on Form 10-K, quarterly reports on Form 10-Q, current reports on Form 8-K, and any amendments to these reports under the
21
Table of Contents
heading “Investor Relations” located at the bottom of the page as soon as reasonably practicable after we electronically file such material with, or furnish it to, the Securities and Exchange Commission (the “SEC”). We also regularly post information about the Company on the Investor Relations page. We do not incorporate the information on our website into this document and you should not consider any information on, or that can be accessed through, our website as part of this document. You may read and copy any materials we file with the SEC at the Securities and Exchange Commission Public Reference Room at 100 F. Street, N.E., Washington, D.C. 20549. The SEC also maintains a website that contains our reports and other information at www.sec.gov.
Executive Officers of the Registrant
Shown below are the names, ages as of December 31, 2009, and current positions of our executive officers, except Earl B. Weihe who was appointed as an executive officer in January 2010. There are no family relationships between any of the persons listed below, or between any of such persons and any of the directors of the Company or any persons nominated or chosen by the Company to become a director or executive officer of the Company.
| Name |
Age | Position | ||
| Kurt C. Hall | 50 | President, Chief Executive Officer and Chairman | ||
| Clifford E. Marks | 48 | President of Sales and Marketing | ||
| Gary W. Ferrera | 47 | Executive Vice President and Chief Financial Officer | ||
| Ralph E. Hardy | 58 | Executive Vice President and General Counsel | ||
| Earl B. Weihe | 61 | Executive Vice President and Chief Operations Officer |
Kurt C. Hall. Mr. Hall was appointed President, Chief Executive Officer and Chairman of NCM Inc. in February 2007 and held those same positions with NCM LLC since March 2005. He has also served as Chairman, President and Chief Executive Officer of NCM Inc. since October 2006. Prior to his current position, from May 2002 to May 2005, Mr. Hall served as Co-Chairman and Co-Chief Executive Officer of Regal Entertainment Group and President and Chief Executive Officer of its media subsidiary Regal CineMedia Corporation. Since 1988, Mr. Hall has held various executive positions with United Artists Theatre Company, and its predecessor companies, including CEO when it became part of Regal Entertainment Group in 2002. In 2009, Mr. Hall joined the board of directors of RMG and serves as a member of its compensation committee.
Clifford E. Marks. Mr. Marks was appointed NCM Inc.’s President of Sales and Marketing in February 2007 and held those same positions with NCM LLC since March 2005. He has been an advertising, marketing and sales professional for 25 years. Prior to his current position, Mr. Marks served as president of sales and marketing with Regal Entertainment Group’s media subsidiary, Regal CineMedia Corporation, from May 2002 to May 2005. Before joining Regal CineMedia, Mr. Marks was a senior vice president at ESPN/ABC Sports where he oversaw its advertising sales organization from 1998 to May 2002.
Gary W. Ferrera. Mr. Ferrera was appointed Executive Vice President and Chief Financial Officer of NCM Inc. in February 2007 and held those same positions with NCM LLC since May 2006. Mr. Ferrera has held positions in accounting and finance since 1991. From October 2005 to May 2006, he served as an independent consultant. Mr. Ferrera served as the interim Chief Financial Officer of the German cable company iesy Hessen, GmbH (now known as Unity Media), from March to October 2005. From February 2000 to February 2005, Mr. Ferrera held positions in both the U.S. and Europe with Citigroup’s Global Corporate and Investment Bank where he spent the majority of that time advising and financing European media companies. Prior to his business career, Mr. Ferrera served for over seven years in U.S. Army Special Operations and Intelligence. Mr. Ferrera graduated magna cum laude with a BS in Accounting from Bentley College and received an MBA from the Kellogg School of Management, Northwestern University.
Ralph E. Hardy. Mr. Hardy was appointed Executive Vice President and General Counsel of NCM Inc. in February 2007 and held those same positions with NCM LLC since March 2005. Prior to his current position,
22
Table of Contents
from May 2002 to May 2005, Mr. Hardy served as Executive Vice President and General Counsel for Regal CineMedia Corporation. Since 1989, Mr. Hardy has held various legal executive positions with United Artists Theatre Company and its predecessors.
Earl B. Weihe. Mr. Weihe was appointed as Executive Vice President and Chief Operations Officer of NCM Inc. in January 2010. Prior to this appointment, Mr. Weihe served as Senior Vice President of Operations for NCM LLC since July 2005. From his original hire in March 2002 until July 2005, Mr. Weihe served as Vice President of Operations for NCM LLC and its predecessor, Regal CineMedia Corporation.
Forward-Looking Statements
In addition to historical information, some of the information in this Annual Report on Form 10-K includes “forward-looking statements” within the meaning of Section 27A of the Securities Act of 1933, as amended, and Section 21E of the Securities Exchange Act of 1934, as amended (the “Exchange Act”). All statements other than statements of historical facts included in this Form 10-K, including, without limitation, certain statements under “Business”, “Risk Factors” and “Management’s Discussion and Analysis of Financial Condition and Results of Operations”, may constitute forward-looking statements. In some cases, you can identify these “forward-looking statements” by the specific words, including but not limited to “may,” “will,” “should,” “expects,” “forecast,” “project,” “intend,” “plans,” “anticipates,” “believes,” “estimates,” “predicts,” “potential” or “continue” or the negative of those words and other comparable words. These forward-looking statements involve known and unknown risks and uncertainties, assumptions and other factors, including, but not limited to, the following:
| • | national, regional and local economic conditions that may affect the markets in which we operate; |
| • | the levels of expenditures on advertising in general and cinema advertising in particular; |
| • | increased competition within the overall advertising industry and cinema advertising segments of the overall advertising market; |
| • | technological changes and innovations, including alternative methods for delivering movies to consumers; |
| • | the popularity of major motion picture releases and level of theatre attendance; |
| • | shifts in population and other demographics; |
| • | our ability to renew expiring advertising contracts at favorable rates, or to replace them with new contracts that are comparably favorable to us; |
| • | our need for, and ability to obtain, additional funding for acquisitions and operations; |
| • | risks and uncertainties relating to our significant indebtedness and investments; |
| • | fluctuations in operating costs and capital expenditures; |
| • | changes in market interest rates; and |
| • | changes in accounting principles, policies or guidelines. |
This list of factors that may affect future performance and the accuracy of forward-looking statements are illustrative and not exhaustive. Our actual results, performance or achievements could differ materially from those indicated in these statements as a result of certain factors as more fully discussed under “Risk Factors” below. Our historical financial data discussed prior to the completion of the Company’s IPO reflects the historical results of operations and financial position of NCM LLC. Accordingly, such historical financial data does not give effect to the reorganization and the NCM LLC senior secured credit facility completed as part of the NCM, Inc. IPO.
23
Table of Contents
| Item 1A. | Risk Factors |
Ownership of the common stock of the Company involves certain risks. Holders of the Company’s securities and prospective investors should consider carefully the following risks and other information in this document, including our historical financial statements and related notes, in evaluating an investment in the Company’s common stock. If any of the following risks actually occur, our business, financial condition and operating results could be adversely affected. As a result, the trading price of our common stock could decline, perhaps significantly.
Risks Related to Our Business and Industry
Changes in the ESAs with, or lack of support by, NCM LLC’s founding members could adversely affect our revenue, growth and profitability
The ESAs with NCM LLC’s founding members are critical to our business. The three ESAs each have an initial term of 30 years beginning February 13, 2007 and provide us with a five-year right of first refusal, which begins one year prior to the end of the term of the ESA. The term of the ESAs as they relate to Fathom Events, is approximately five years from the IPO with provisions for automatic renewal of an additional five years, if certain financial performance conditions are met. NCM LLC’s founding members’ theatres represent approximately 86% of the screens and approximately 88% of the attendance in our network as of December 31, 2009. If any one of the ESAs were terminated, not renewed at its expiration or found to be unenforceable, it would have a material adverse effect on our revenue, profitability and financial condition.
The ESAs require the cooperation, investment and support of the founding members, the absence of which could adversely affect us. Pursuant to the ESAs, NCM LLC’s founding members must make investments to replace digital network equipment within their theatres and equip newly constructed theatres with digital network equipment. If the founding members do not have adequate financial resources or operational strength, and if they do not replace equipment or equip new theatres to maintain the level of operating functionality that we have today, or if such equipment becomes obsolete, we may have to make additional capital expenditures or our advertising, Fathom Events revenue and operating margins may decline. If the founding members reject advertising or choose not to participate in certain Fathom Business or Consumer events under the terms of the ESAs because they believe it would adversely affect their film attendance levels or the reputation of their company, our revenue from these businesses would be reduced.
If the non-competition provisions of the ESAs are deemed unenforceable, NCM LLC’s founding members could compete against us and our business could be adversely affected
With certain limited exceptions, each of the ESAs prohibits the applicable founding member from engaging in any of the business activities that we provide in the founding member’s theatres under the ESA, and from owning interests in other entities that compete with us. These provisions are intended to prevent the founding members from harming our business by providing cinema advertising services directly to their theatres or by entering into agreements with third-party cinema advertising providers. However, under state and federal law, a court may determine that a non-competition covenant is unenforceable, in whole or in part, for reasons including, but not limited to, the court’s determination that the covenant:
| • | is not necessary to protect a legitimate business interest of the party seeking enforcement; |
| • | unreasonably restrains the party against whom enforcement is sought; or |
| • | is contrary to the public interest. |
Enforceability of a non-competition covenant is determined by a court based on all of the facts and circumstances of the specific case at the time enforcement is sought. For this reason, it is not possible for us to predict whether, or to what extent, a court would enforce the non-competition provisions contained in the ESAs.
24
Table of Contents
If a court were to determine that the non-competition provisions are unenforceable, the founding members could compete directly against us or enter into an agreement with another cinema advertising provider that competes against us. Any inability to enforce the non-competition provisions, in whole or in part could cause our revenue to decline.
If one of NCM LLC’s founding members declares bankruptcy, the ESA with that founding member may be rejected, renegotiated or deemed unenforceable or our network could be adversely affected by the disposition of theatres
Each of NCM LLC’s founding members currently has a significant amount of indebtedness, which is below investment grade. In 2000 and 2001, several major motion picture exhibition companies filed for bankruptcy. For example, each of United Artists, Edwards Theatres, Regal Cinemas, General Cinemas and Loews Cineplex filed for bankruptcy during 2000 or 2001. The industry-wide construction of larger, more expensive megaplexes featuring stadium seating in the late 1990s that rendered existing, smaller, sloped-floor theatres under long-term leases obsolete and unprofitable, were significant contributing factors to these bankruptcies. If a bankruptcy case were commenced by or against a founding member, it is possible that all or part of the ESA with that founding member could be rejected by a trustee in the bankruptcy case pursuant to Section 365 or Section 1123 of the United States Bankruptcy Code, or by the founding member, and thus not be enforceable. Alternatively, the founding member could seek to renegotiate the ESA in a manner less favorable to us than the existing agreement. In addition, the founding member could seek to sell or otherwise dispose of theatres, which might result in the removal of those theatres from our network if the acquirer did not agree to continue to allow us to sell advertising in the acquired theaters, which would likely result in the surrender of LLC units from the founding member. Because we sell advertising based on the number of theatre patrons that will view the advertisement, a reduction in the number of theatres in our network could reduce our advertising revenue.
The effects of the recent and ongoing global economic crisis may adversely impact our business, operating results or financial condition
As widely reported, financial markets in the U.S., Europe and Asia have been experiencing extreme disruption over the past year. Unfavorable changes in economic conditions, including declining consumer confidence, concerns about inflation or deflation, the threat of a continuing recession, increases in the rates of default and bankruptcy and extreme volatility in the credit and equity markets, may lead our customers to cease doing business with us or to reduce or delay that business or their payments to us, and our results of operations and financial condition could be adversely affected by these actions. These challenging economic conditions also may result in:
| • | increased competition for fewer advertising, business meeting and entertainment programming dollars; |
| • | pricing pressure that may adversely affect revenue and gross margin; |
| • | difficulty forecasting, budgeting and planning due to limited visibility into the spending plans of current or prospective customers; or |
| • | customer financial difficulty and increased risk of doubtful accounts receivable. |
Additionally, we use interest rate swaps to reduce our exposure to various interest rate risks, which qualify for hedge accounting for financial reporting purposes. Volatile fluctuations in market conditions could cause these instruments to become ineffective for hedge accounting purposes, which could require any gains or losses associated with these instruments to be reported in our earnings each period. Uncertainty about current global economic conditions could also continue to increase the volatility of our stock price. We are unable to predict the duration and severity of the current disruption in financial markets and adverse economic conditions in the U.S. and other countries.
25
Table of Contents
The markets for advertising, meeting management and event content are competitive and we may be unable to compete successfully
The market for advertising is very competitive. Cinema advertising is a small component of the overall U.S. advertising market and thus we must compete with established, larger and better known national and local media platforms and newly emerging media platforms such as the Internet. We compete for advertising directly with all media platforms, including radio and television broadcasting, cable and satellite television services, various local print media, billboards and Internet portals and search engines.
We also compete directly with other cinema advertising companies. We expect these competitors to devote significant effort to maintaining and growing their respective positions in the cinema advertising segment. We also expect existing competitors and new entrants to the cinema advertising business to constantly revise and improve their business models in light of challenges from us or competing media platforms. If we cannot respond effectively to advances by our competitors, our business may be adversely affected.
Our Fathom Business division facilitates live and pre-recorded events in theatre auditoriums. These events are typically scheduled from Monday through Thursday during off-peak hours while theatre attendance for movies is traditionally low. This business competes for customers with a number of venues including hotels, conference facilities, restaurants, arenas and other convention properties, as well as virtual meetings hosted on-line or over private teleconferencing networks. Accordingly, our ability to increase sales in our Fathom Business division is contingent on our ability to attract new customers and compete effectively against other well-established and well-capitalized venues.
Our Fathom Consumer division focuses on the distribution of entertainment programming products. It includes live and pre-recorded concerts and music events, concert and DVD product releases, theatrical premieres, Broadway plays, as well as live sports and other special events. This business competes for music, sports and other entertainment programming with other national networks, some of which offer greater geographic reach and larger audiences. Accordingly, our ability to source a consistent flow of programming is contingent on our ability to develop and sustain relationships with content owners.
Because we rely heavily on NCM LLC’s founding members’ ability to attract customers, any reduction in attendance at founding member theatres could decrease our revenue
Our business is affected by the success of NCM LLC’s founding members, who operate in a highly competitive industry. From the late 1990s through 2002, the number of movie screens and the level of theatre attendance in the U.S. increased substantially, as movie theatres began to offer new amenities such as stadium seating, improved projection quality and superior sound systems. Box office attendance increased in 2009 compared to 2008, declined in 2008 compared to 2007, increased in each of 2007 and 2006 and declined in each of 2005, 2004 and 2003. If theatre attendance declines in the future, one or more of NCM LLC’s founding members may face financial difficulties and could be forced to sell or close theatres or reduce the number of screens it builds or upgrades. Attendance may also decline if the founding members fail to maintain their theatres and provide amenities that consumers prefer, or if they cannot compete successfully on pricing. NCM LLC’s founding members also may not successfully compete for licenses to exhibit quality films and are not assured a consistent supply of motion pictures since they do not have long-term arrangements with major film distributors. Any of these circumstances could reduce our revenue because our national advertising revenue, and local advertising to a lesser extent, depends on the number of theatre patrons who view our advertising and pre-feature show.
Significant declines in theatre attendance could reduce the attractiveness of cinema advertising
The value of our advertising business could be adversely affected by a long-term multi-year decline in theatre attendance or even the perception by media buyers that our network attendance and geographic coverage
26
Table of Contents
were expected to decline significantly over the next several years. Factors that could reduce attendance at our network theatres include the following:
| • | the shortening of the “release window” between the release of major motion pictures in the theatres and release to alternative methods for delivering movies to consumers, such as DVD or HD DVD, cable television, downloads via the Internet, video discs and cassettes, video on demand, satellite and pay-per-view services; |
| • | any reduction in consumer confidence or disposable income in general that reduces the demand for motion pictures or adversely affects the motion picture production industry; and |
| • | the success of first-run motion pictures, which depends upon the production and marketing efforts of the major studios and the attractiveness of the movies to patrons. |
The loss of any major content partner or advertising customer could significantly reduce our revenue
We derive a significant portion of our revenue from our contracts with our content partners, cell phone PSA and NCM LLC’s founding members’ agreements to purchase on-screen advertising for their beverage concessionaires. NCM LLC’s or its predecessor company’s relationships with certain content partners date back as far as December 2002. None of these companies individually accounted for over 10% of our total revenue during the year ended December 31, 2009. However, the agreements with the content partners, cell phone PSA and beverage advertising with the founding members in aggregate accounted for approximately 30.7% of our total revenue during the year ended December 31, 2009. Because we derive a significant percentage of our total revenue from a relatively small number of large companies, the loss of any one or more of them as a customer could decrease our revenue and adversely affect our current and future operating results.
We generate a high percentage of our revenue and OIBDA from advertising, and the reduction in spending by or loss of advertisers could have a serious adverse effect on our business
We generated approximately 88% of our total revenue in the year ended December 31, 2009 from advertising sales. A substantial portion of our advertising inventory is covered by contracts with terms as low as one month. Advertisers will not continue to do business with us if they believe our advertising medium is ineffective or overly expensive. In addition, large advertisers generally have set advertising budgets, most of which are focused on traditional media platforms. Reductions in the size of advertisers’ budgets due to local or national economic trends or other factors could result in lower spending on cinema advertising in general or our advertising business in particular. If we are unable to remain competitive and provide value to our advertisers, they may reduce their advertising purchases or stop placing advertisements with us, which would negatively affect our revenue and ability to generate new business from advertising clients.
If we do not maintain our technological advantage, our business could fail to grow and revenue and operating margins could decline
Failure to successfully or cost-effectively implement upgrades to our software systems to maintain our technological competitiveness could limit our ability to increase our revenue and more effectively leverage our digital platform. Any failure by us to upgrade our technology to remain current with technological changes, including digital cinema, that may be adopted by other providers of cinema advertising or other advertising platforms could hurt our ability to compete with those companies. Under the terms of the ESAs with NCM LLC’s founding members, the founding members are required to provide technology that is consistent with that in place at the signing of the ESA. We may request that NCM LLC’s founding members upgrade the equipment or software installed in their theatres. We must negotiate with NCM LLC’s founding members as to the terms of such upgrade, including cost sharing terms, if any. If we are not able to come to an agreement on an upgrade request, we may elect to pay for the upgrades requested which could result in our incurring significant capital expenditures, which could adversely affect our results of operations. In addition, the failure or delay in implementation of such upgrades or problems with the integration of our systems and software with the digital cinema systems, if such integration is pursued, could slow or prevent the growth of our business.
27
Table of Contents
Our business relies heavily on our technology systems, and any failures or disruptions may materially and adversely affect our operations
The temporary or permanent loss of our computer equipment and software systems, through sabotage, operating malfunction, software virus, human error, natural disaster, power loss, terrorist attacks, or other catastrophic events, could disrupt our operations and cause a material adverse impact. These problems may arise in both internally developed systems and the systems of third-party service providers. If our technology systems were to fail and we were unable to recover in a timely way, we would be unable to fulfill critical business functions, which could lead to a loss of customers and could harm our reputation. Technological breakdown could also interfere with our ability to comply with financial reporting and other regulatory requirements.
Our business and operations are experiencing rapid growth, and we may be unable to effectively manage or continue our growth
We have experienced, and may continue to experience, rapid growth in our headcount and operations, which has placed, and could continue to place, significant demands on our management and operational infrastructure. If we do not effectively manage our growth, the quality of our services could suffer, which could negatively affect our brand, our relationships with our advertising clients and digital content suppliers and our operating results. To effectively manage this growth, we will need to continue to improve our digital content system distribution software and our internal management systems, including our advertising inventory optimization, management and reporting systems. These systems enhancements and improvements will require allocation of financial and management resources. If the improvements are not implemented successfully in a timely manner or at all, our ability to manage our growth will be impaired and we may have to make significant additional expenditures to address these issues.
Our preliminary plans for developing additional revenue opportunities may not be implemented, may require substantial expenditures and may not be achieved
In addition to our strategy to grow our advertising and Fathom Events divisions, we are also considering other potential opportunities for revenue growth, which we describe in “Business—Our Strategy—Expand our Internet/Mobile Platform” and “—Expand into Other Out-of-Home Networks”. For example, we have a minority interest in a company called RMG. We believe that out-of-home targeted advertising networks should continue to grow in importance as a percentage of advertising spending, providing a future growth engine for NCM as our cinema advertising business matures. We may decide to continue to expand our network technology and sales capabilities outside of theatres as our theatre advertising business matures in the future. In addition, the development of our internet and mobile initiative is at an early stage, and may not deliver the benefits we have projected.
Because we have a limited operating history as a public company, it is difficult to evaluate our business and prospects
NCM LLC’s predecessor company, RCM, began operations in February 2002. NCM LLC was formed on March 29, 2005, as a joint venture that combined the operations of subsidiaries of AMC and Regal. Cinemark joined as a founding member on July 15, 2005. Our founding members have made several acquisitions including Century and Loews and as recently announced, Kerasotes. We have entered into new network affiliate agreements with Cobb Theatres, Galaxy Theatres LLC, Storyteller Theatres Corporation, Starplex Cinemas, ShowBiz Cinemas, Picture Show Theatres and may enter into more in the future. As a result, we have a limited operating history from which you can compare corresponding periods and evaluate our business. We may encounter risks and difficulties frequently experienced by newly formed companies in rapidly evolving businesses. If we are unsuccessful in executing our business strategy, we may be unable to:
| • | increase our revenue and expand our client base; |
| • | operate, support, expand, develop and improve our software and other systems; |
28
Table of Contents
| • | continue to produce high operating income margins; and |
| • | respond to technological changes. |
Our historical financial information may not be representative of our financial results as an independent public company or our future financial performance
Certain of our historical financial information included in this document does not reflect our financial condition, results of operations and cash flows as they would have been achieved during the periods presented as a separate, stand-alone public entity. Certain of our historical financial statements do not necessarily reflect the costs that we would have incurred had we operated as an independent stand-alone public entity. These costs include higher corporate overhead, interest expense and income taxes.
Our historical financial information includes the consolidated financial statements of RCM and NCN, the joint predecessor companies of NCM LLC, for periods prior to March 2005 and does not include any information related to Cinemark. Although historical financial information on AMC’s theatre advertising subsidiary, NCN, is presented herein, there is no historical financial information on the combined operations of both NCN and RCM prior to the formation of NCM LLC. Additionally, the historical financial statements of RCM and NCN include payments to their parent companies at different rates than those in effect after the formation of NCM LLC, which rates changed again after completion of the financing transaction and reorganization.
Because Cinemark had a pre-existing contract with another cinema advertising provider, NCM LLC began selling advertising for Cinemark’s screens on an exclusive basis beginning on January 1, 2006 (subject to the run-out of certain pre-existing contractual obligations for on-screen advertising through April 1, 2006). In addition, our historical financial information does not include any information related to theatres operated by Loews, which AMC acquired on January 26, 2006, and which became part of our theatre network beginning on June 1, 2008, or Century, which Cinemark acquired on October 5, 2006, and which became a part of our theatre network on an exclusive basis, subject to limited exceptions, on the closing date of the acquisition. The historical results of operations of NCM LLC, RCM and NCN have been significantly impacted by related party transactions that we have entered into, as further discussed in the historical financial statements included elsewhere in this document, and the future operating results of NCM Inc. will also be significantly impacted by related party transactions entered into in connection with our initial public offering. As a result, this information may not be representative of our future financial performance.
We depend upon our senior management and our business may be adversely affected if we cannot retain them
Our success depends upon the retention of our experienced senior management with specialized industry and technical knowledge and/or industry relationships. We might not be able to find qualified replacements for our senior management if their services were no longer available to us; accordingly, the loss of critical members of our senior management team could have a material adverse effect on our ability to effectively pursue our business strategy and our relationships with advertisers and content partners. We do not have key-man life insurance covering any of our employees.
Our technology may infringe on rights owned by others, which may interfere with our ability to provide services, and our web site may expose us to increased liability or expense under intellectual property, privacy or other laws
We may discover that the technology we use infringes patent, copyright, or other intellectual property rights owned by others. In addition, we cannot assure you that our competitors will not claim rights in patents, copyrights, or other intellectual property that will prevent, limit or interfere with our ability to provide our services either in the U.S. or in international markets. Further, the laws of certain foreign countries may not protect our intellectual property rights to the same extent as do the laws of the U.S.
29
Table of Contents
Our NCM.com web site, which we launched in late 2008, is an entertainment and media portal containing content regarding movies, television and other media, much of which is obtained from third party content providers. The web site includes features enabling users to access and download content on the web site, add their own content to the web site, and modify certain content on the web site. In order to take advantage of some of these features, users will be required to establish an account on the web site and, as a result, we will collect and maintain personal information about those users.
Each of these features could result in legal liability. For example, use of third-party content could expose us to claims of infringement on the intellectual property rights of others; and the failure, or perceived failure, to comply with federal, state or international privacy or consumer protection-related laws or regulations or our posted privacy policies could result in actions against us by governmental entities or others. Any such claim or action could result in significant adverse effects on our business and financial results because of, for example, increased costs (such as legal defense, damages owing to third parties, and increased licensing fees to acquire third-party content) and reduction or elimination of content or features from our web site. In addition, a number of other U.S. federal laws, including those referenced below, may impact our business as a result of our new web site. The Digital Millennium Copyright Act has provisions that limit, but do not necessarily eliminate, liability for posting, or linking to third-party web sites that include, materials that infringe copyrights or other rights. Portions of the Communications Decency Act are intended to provide statutory protections to online service providers who distribute third-party content. The Child Online Protection Act and the Children’s Online Privacy Protection Act restrict the distribution of materials considered harmful to children and impose additional restrictions on the ability of online services to collect information from minors. The costs of compliance with these and other regulations may be significant and may increase in the future as a result of changes in the regulations or the interpretation of them. Any failure on our part to comply with these laws and regulations may subject us to additional liabilities.
Our revenue and Adjusted OIBDA fluctuate from quarter to quarter and may be unpredictable, which could increase the volatility of our stock price
Typically, our revenue and Adjusted OIBDA are lowest in the first quarter of the calendar year as advertising clients scale back their advertising budgets following the year-end holiday season, and our revenue is highest during the summer and the holiday season when theatre attendance is normally highest. However, a weak advertising market, the poor performance of films released in a given quarter or a disruption in the release schedule of films could affect results for the entire fiscal year and significantly affect quarter-to-quarter results. Because our results vary widely from quarter to quarter and may be unpredictable, our financial results for one quarter cannot necessarily be compared to another quarter and may not be indicative of our financial performance in subsequent quarters. These variations in our financial results could contribute to volatility in our stock price.
The ESAs allow the founding members to engage in activities that might compete with certain elements of our business, which could reduce our revenue and growth potential
The ESAs contain certain limited exceptions to our exclusive right to use the founding members’ theatres for our advertising business. The founding members have the right to enter into strategic cross-marketing relationships with third-party, unaffiliated businesses for the purpose of generating increased attendance or revenue (other than revenue from the sale of advertising) and, subject to certain limits, can use one minute on the LEN and certain types of lobby promotions, at no cost, for the purpose of promoting the products or services of those businesses while at the same time promoting the theatre circuit or the movie-going experience. Subject to certain limits, they can also purchase an additional minute of advertising on the LEN for these cross-marketing promotions. The use of LEN or lobby promotions by NCM LLC’s founding members for these advertisements and programs could result in the founding members creating relationships with advertisers that could adversely affect our current LEN and lobby promotions advertising revenue and profitability as well as the potential we have to grow that advertising revenue in the future. The LEN and lobby promotions represented 6.6% of our total advertising revenue for the year ended December 31, 2009. The founding members will not have the right to use
30
Table of Contents
their movie screens (including the FirstLook program or otherwise) for promoting these cross-marketing relationships, and thus we will have the exclusive rights to advertise on the movie screens, except for limited advertising related to theatre operations, and to package such on-screen advertising with the LEN advertising and lobby promotions.
The founding members also have the right to install a second network of video monitors in the theatre lobbies in excess of those required to be installed by the founding members for the LEN. This additional lobby video network, which we refer to as the founders’ lobby network, is to be used by the founding members to promote products or services related to operating the theatres, such as concessions and loyalty programs. The presence of the founders’ lobby network within the lobby areas could reduce the effectiveness of our LEN, thereby reducing our current LEN advertising revenue and profitability and adversely affecting future revenue potential associated with that marketing platform.
Risks Related to Our Corporate Structure
We are a holding company with no operations of our own, and we will depend on distributions and payments under the management services agreement from NCM LLC to meet our ongoing obligations and to pay cash dividends on our common stock
We are a holding company with no operations of our own and have no independent ability to generate revenue. Consequently, our ability to obtain operating funds depends upon distributions from NCM LLC. The distribution of cash flows and other transfers of funds by NCM LLC to us are subject to statutory and contractual restrictions based upon NCM LLC’s financial performance, including NCM LLC’s compliance with the covenants in its senior secured credit facility and the NCM LLC operating agreement. The NCM LLC senior secured credit facility limits NCM LLC’s ability to distribute cash to its members, including us, based upon certain leverage tests, with exceptions for, among other things, payment of our income taxes and a management fee to NCM Inc. pursuant to the terms of the management services agreement. We will be unable to pay dividends to our stockholders or pay other expenses outside the ordinary course of business if NCM LLC fails to comply with these covenants and is unable to distribute cash to us.
Pursuant to the management services agreement between us and NCM LLC, NCM LLC makes payments to us to fund our day-to-day operating expenses, such as payroll. However, if NCM LLC cannot make the payments pursuant to the management services agreement, we may be unable to cover these expenses.
As a member of NCM LLC, we incur income taxes on our proportionate share of any net taxable income of NCM LLC. We have structured the NCM LLC senior secured credit facility to allow NCM LLC to distribute cash to its members (including us and the founding members) in amounts sufficient to cover their tax liabilities and management fees, if any. To the extent we need funds to pay such taxes or for any other purpose, and NCM LLC is unable to provide such funds because of limitations in the NCM LLC senior secured credit facility or other restrictions, it could have a material adverse effect on our business, financial condition, results of operations or prospects.
NCM LLC’s substantial debt obligations could impair our financial condition or prevent us from achieving our business goals
NCM LLC is party to a $725.0 million term loan that is part of a senior secured credit facility. The agreements governing NCM LLC’s debt obligations contain restrictive covenants that limit NCM LLC’s ability to take specified actions and prescribe minimum financial maintenance requirements that NCM LLC must meet. Because NCM LLC is our only operating subsidiary, complying with these restrictions may prevent NCM LLC from taking actions that we believe would help us to grow our business. For example, NCM LLC may be unable to make acquisitions, investments or capital expenditures as a result of such covenants. Moreover, if NCM LLC
31
Table of Contents
violates those restrictive covenants or fails to meet the minimum financial requirements, it would be in default, which could, in turn, result in defaults under other obligations of NCM LLC or us. Any such defaults could materially impair our financial condition and liquidity.
The senior secured credit facility also includes an $80 million revolving credit facility. As of December 31, 2009, the amount outstanding under the revolving credit facility was $74.0 million. The amount outstanding under the revolving credit facility has been fully drawn by us on a voluntary basis as a result of issues affecting the credit markets in general and the Lehman Brothers Holdings Inc. (“Lehman”) bankruptcy (see additional discussion below) in particular. If we are not able to replace Lehman as administrative agent we do not expect to repay any of the amount and will accumulate cash balances. NCM LLC’s cash and cash equivalents was $37.8 million at December 31, 2009, while NCM Inc.’s consolidated cash and cash equivalents was $91.1 million at December 31, 2009.
If NCM LLC is unable to meet its debt service obligations, it or we could be forced to restructure or refinance the obligations, seek additional equity financing or sell assets. We may be unable to restructure or refinance these obligations, obtain additional equity financing or sell assets on satisfactory terms or at all. In addition, NCM LLC’s indebtedness could have other negative consequences for us, including without limitation:
| • | limiting NCM LLC’s ability to obtain financing in the future; |
| • | requiring much of NCM LLC’s cash flow to be dedicated to interest obligations and making it unavailable for other purposes; |
| • | limiting NCM LLC’s liquidity and operational flexibility in changing economic, business and competitive conditions which could require NCM LLC to consider deferring planned capital expenditures, reducing discretionary spending, selling assets, restructuring existing debt or deferring acquisitions or other strategic opportunities; and |
| • | making NCM LLC more vulnerable to an increase in interest rates, a downturn in our operating performance or a decline in general economic conditions. |
In addition, NCM LLC has been working with LCPI and its other lenders with the goal of having LCPI’s agency function transferred to another bank within NCM LLC’s lender group and restructuring LCPI’s outstanding $14.0 million revolving loan such that (i) it would not be required to be repaid, nor would it share in any pro rata prepayments of the revolving loans, until the final maturity date of the revolving credit facility, and (ii) it would not be available for reborrowing in the event that it was prepaid. Until these LCPI issues are resolved, however, NCM LLC is not anticipating repaying any of its revolver borrowings as it would effectively result in a permanent reduction of its revolving credit facility, to the extent of the payments against LCPI borrowings.
NCM LLC’s founding members or their affiliates may have interests that differ from those of our public stockholders and they may be able to influence our affairs
So long as a founding member beneficially owns at least 5% of NCM LLC’s issued and outstanding common membership units, approval of at least 90% of the directors then in office (provided that if the board has less than ten directors, then the approval of at least 80% of the directors then in office) will be required before we may take any of the following actions or we, in our capacity as manager of NCM LLC, may authorize NCM LLC to take any of the following actions:
| • | assign, transfer, sell or pledge all or a portion of the membership units of NCM LLC beneficially owned by NCM Inc.; |
| • | acquire, dispose, lease or license assets with an aggregate value exceeding 20% of the fair market value of the business of NCM LLC operating as a going concern; |
32
Table of Contents
| • | merge, reorganize, recapitalize, reclassify, consolidate, dissolve, liquidate or enter into a similar transaction; |
| • | incur any funded indebtedness or repay, before due, any funded indebtedness with a fixed term in an aggregate amount in excess of $15 million per year; |
| • | issue, grant or sell shares of NCM Inc. common stock, preferred stock or rights with respect to common or preferred stock, or NCM LLC membership units or rights with respect to membership units, except under specified circumstances; |
| • | amend, modify, restate or repeal any provision of NCM Inc.’s certificate of incorporation or bylaws or the NCM LLC operating agreement; |
| • | enter into, modify or terminate certain material contracts not in the ordinary course of business as defined under applicable securities laws; |
| • | except as specifically set forth in the NCM LLC operating agreement, declare, set aside or pay any redemption of, or dividends with respect to membership interests; |
| • | amend any material terms or provisions (as defined in the Nasdaq rules) of NCM Inc.’s equity incentive plan or enter into any new equity incentive compensation plan; |
| • | make any change in the current business purpose of NCM Inc. to serve solely as the manager of NCM LLC or any change in the current business purpose of NCM LLC to provide the services as set forth in the ESAs; and |
| • | approve any actions relating to NCM LLC that could reasonably be expected to have a material adverse tax effect on the founding members. |
Pursuant to a director designation agreement, so long as a founding member owns at least 5% of NCM LLC’s issued and outstanding common membership units, such founding member will have the right to designate a total of two nominees to our ten-member board of directors who will be voted upon by our stockholders. If, at any time, any founding member owns less than 5% of NCM LLC’s then issued and outstanding common membership units, then such founding member shall cease to have any rights of designation.
If any director designee to our board designated by NCM LLC’s founding members is not appointed to our board, nominated by us or elected by our stockholders, as applicable, then each of the founding members (so long as such founding member continues to own 5% of NCM LLC’s issued and outstanding common membership units) will be entitled to approve specified actions of NCM LLC.
For purposes of calculating the 5% ownership threshold for the supermajority director approval rights and director designation agreement provisions discussed above, shares of our common stock held by a founding member and received upon redemption of NCM LLC common membership units will be counted toward the threshold. Common membership units issued to NCM Inc. in connection with the redemption of common membership units by a founding member will be excluded, so long as such founding member continues to hold the common stock acquired through such redemption or such founding member has disposed of such shares of common stock to another founding member. Shares of our common stock otherwise acquired by the founding members will also be excluded, unless such shares of common stock were transferred by one founding member to another and were originally received by the transferring founding member upon redemption of NCM LLC common membership units.
Under these circumstances, our corporate governance documents will allow NCM LLC’s founding members and their affiliates to exercise a greater degree of influence in the operation of our business and that of NCM LLC and the management of our affairs and those of NCM LLC than is typically available to stockholders of a publicly-traded company. Even if NCM LLC’s founding members or their affiliates own a minority economic interest (but not less than 5%) in NCM LLC, they may be able to continue exerting such degree of influence over us and NCM LLC.
33
Table of Contents
Different interests among NCM LLC’s founding members or between NCM LLC’s founding members and us could prevent us from achieving our business goals
For the foreseeable future, we expect that our board of directors will include directors and executive officers of NCM LLC’s founding members and other directors who may have commercial or other relationships with NCM LLC’s founding members. NCM LLC’s founding members compete with each other in the operation of their respective businesses and could have individual business interests that may conflict with those of the other founding members. Their differing interests could make it difficult for us to pursue strategic initiatives that require consensus among NCM LLC’s founding members.
In addition, the structural relationship we have with NCM LLC’s founding members could create conflicts of interest among the founding members, or between the founding members and us, in a number of areas relating to our past and ongoing relationships. There is not any formal dispute resolution procedure in place to resolve conflicts between us and a founding member or between founding members. We may not be able to resolve any potential conflicts between us and a founding member and, even if we do, the resolution may be less favorable to us than if we were negotiating with an unaffiliated party.
The corporate opportunity provisions in our certificate of incorporation could enable the founding members to benefit from corporate opportunities that might otherwise be available to us
Our certificate of incorporation contains provisions related to corporate opportunities that may be of interest to both NCM LLC’s founding members and us. It provides that if a corporate opportunity is offered to us, NCM LLC or one or more of the officers, directors or stockholders (both direct and indirect) of NCM Inc. or a member of NCM LLC that relates to the provision of services to motion picture theatres, use of theatres for any purpose, sale of advertising and promotional services in and around theatres and any other business related to the motion picture theatre business (except services as provided in the ESAs as from time to time amended and except as may be offered to one of our officers in his capacity as an officer), no such person shall be liable to us or any of our stockholders (or any affiliate thereof) for breach of any fiduciary or other duty by reason of the fact that such person pursues or acquires such business opportunity, directs such business opportunity to another person or fails to present such business opportunity, or information regarding such business opportunity, to us. This provision applies even if the business opportunity is one that we might reasonably be deemed to have pursued or had the ability or desire to pursue if granted the opportunity to do so.
In addition, our certificate of incorporation and the NCM LLC operating agreement expressly provide that NCM LLC’s founding members may have other business interests and may engage in any other businesses not specifically prohibited by the terms of the certificate of incorporation, including the exclusivity provisions of the ESAs. The parent companies of the founding members are not bound by the ESAs and therefore could develop new media platforms that could compete for advertising dollars with our services. Further, we may also compete with the founding members or their affiliates in the area of employee recruiting and retention. These potential conflicts of interest could have a material adverse effect on our business, financial condition, results of operations or prospects if attractive corporate opportunities are allocated by the founding members to themselves or their other affiliates or we lose key personnel to them.
The agreements between us and NCM LLC’s founding members were made in the context of an affiliated relationship and may contain different terms than comparable agreements with unaffiliated third parties
The ESAs and the other contractual agreements that we have with NCM LLC’s founding members were negotiated in the context of an affiliated relationship in which representatives of NCM LLC’s founding members and their affiliates comprised our entire board of directors. As a result, the financial provisions and the other terms of these agreements, such as covenants, contractual obligations on our part and on the part of NCM LLC’s founding members, and termination and default provisions may be less favorable to us than terms that we might have obtained in negotiations with unaffiliated third parties in similar circumstances.
34
Table of Contents
Our certificate of incorporation and bylaws contain anti-takeover protections that may discourage or prevent strategic transactions, including a takeover of our company, even if such a transaction would be beneficial to our stockholders
Provisions contained in our certificate of incorporation and bylaws, the NCM LLC operating agreement, provisions of the Delaware General Corporation Law (“DGCL”), could delay or prevent a third party from entering into a strategic transaction with us, even if such a transaction would benefit our stockholders. For example, our certificate of incorporation and bylaws:
| • | establish supermajority approval requirements by our directors before our board may take certain actions; |
| • | authorize the issuance of “blank check” preferred stock that could be issued by our board of directors to increase the number of outstanding shares, making a takeover more difficult and expensive; |
| • | establish a classified board of directors; |
| • | allow removal of directors only for cause; |
| • | prohibit stockholder action by written consent; |
| • | do not permit cumulative voting in the election of directors, which would otherwise allow less than a majority of stockholders to elect director candidates; and |
| • | provide that the founding members will be able to exercise a greater degree of influence over the operations of NCM LLC, which may discourage other nominations to our board of directors, if any director nominee designated by the founding members is not elected by our stockholders. |
These restrictions could keep us from pursuing relationships with strategic partners and from raising additional capital, which could impede our ability to expand our business and strengthen our competitive position. These restrictions could also limit stockholder value by impeding a sale of us or NCM LLC.
Any future issuance of membership units by NCM LLC and subsequent redemption of such units for common stock could dilute the voting power of our existing common stockholders and adversely affect the market value of our common stock
The Common Unit Adjustment Agreement and the ESAs provide that we will issue common membership units of NCM LLC to account for changes in the number of theatre screens NCM LLC’s founding members operate. Historically, each of the founding members has increased the number of screens it operates. If this trend continues, NCM LLC may issue additional common membership units to the founding members to reflect their increase in net screen count. Each common membership unit may be redeemed in exchange for, at our option, shares of our common stock on a one-for-one basis or a cash payment equal to the market price of one share of our common stock. If a significant number of common membership units were issued to NCM LLC’s founding members, the founding members elected to redeem such units, and we elected to issue common stock rather than cash upon redemption, the voting power of our common stockholders could be diluted. Other than the maximum number of authorized shares of common stock in our certificate of incorporation, there is no limit on the number of shares of our common stock that we may issue upon redemption of a founding member’s common membership units in NCM LLC.
Our future issuance of preferred stock could dilute the voting power of our common stockholders and adversely affect the market value of our common stock
The future issuance of shares of preferred stock with voting rights may adversely affect the voting power of the holders of our other classes of voting stock, either by diluting the voting power of our other classes of voting stock if they vote together as a single class, or by giving the holders of any such preferred stock the right to block an action on which they have a separate class vote even if the action were approved by the holders of our other classes of voting stock.
35
Table of Contents
The future issuance of shares of preferred stock with dividend or conversion rights, liquidation preferences or other economic terms favorable to the holders of preferred stock could adversely affect the market price for our common stock by making an investment in the common stock less attractive. For example, investors in the common stock may not wish to purchase common stock at a price above the conversion price of a series of convertible preferred stock because the holders of the preferred stock would effectively be entitled to purchase common stock at the lower conversion price causing economic dilution to the holders of common stock.
If we or NCM LLC’s founding members are determined to be an investment company, we would become subject to burdensome regulatory requirements and our business activities could be restricted
We do not believe that we are an “investment company” under the Investment Company Act of 1940, as amended. As sole manager of NCM LLC, we control NCM LLC, and our interest in NCM LLC is not an “investment security” as that term is used in the Investment Company Act. If we were to stop participating in the management of NCM LLC, our interest in NCM LLC could be deemed an “investment security” for purposes of the Investment Company Act. Generally, a company is an “investment company” if it owns investment securities having a value exceeding 40% of the value of its total assets (excluding U.S. government securities and cash items). Our sole material asset is our equity interest in NCM LLC. A determination that such asset was an investment security could result in our being considered an investment company under the Investment Company Act. As a result, we would become subject to registration and other burdensome requirements of the Investment Company Act. In addition, the requirements of the Investment Company Act could restrict our business activities, including our ability to issue securities.
We and NCM LLC intend to conduct our operations so that we are not deemed an investment company under the Investment Company Act. However, if anything were to occur that would cause us to be deemed an investment company, we would become subject to restrictions imposed by the Investment Company Act. These restrictions, including limitations on our capital structure and our ability to enter into transactions with our affiliates, could make it impractical for us to continue our business as currently conducted and could have a material adverse effect on our financial performance and operations.
We also rely on representations of NCM LLC’s founding members that they are not investment companies under the Investment Company Act. If any founding member were deemed an investment company, the restrictions placed upon that founding member might inhibit its ability to fulfill its obligations under its ESA or restrict NCM LLC’s ability to borrow funds.
Our tax receivable agreement with the founding members is expected to reduce the amount of overall cash flow that would otherwise be available to us and will increase our potential exposure to the financial condition of the founding members
Our initial public offering and related transactions have the effect of reducing the amounts NCM Inc. would otherwise pay in the future to various tax authorities as a result of an increase in its proportionate share of tax basis in NCM LLC’s tangible and intangible assets. We have agreed in our tax receivable agreement with the founding members to pay to the founding members 90% of the amount by which NCM Inc.’s tax payments to various tax authorities are reduced as a result of the increase in tax basis. Pursuant to the terms of the tax receivable agreement, we made payments of $13.3 million to the founding members in 2009 with respect to our 2008 taxable year and we estimate that in 2010 an additional $2.0 million will be payable with respect to the 2008 taxable year and that $15.6 million will be payable with respect to the 2009 taxable year. After paying these reduced amounts to tax authorities, if it is determined as a result of an income tax audit or examination that any amount of NCM Inc.’s claimed tax benefits should not have been available, NCM Inc. may be required to pay additional taxes and possibly penalties and interest to one or more tax authorities. If this were to occur, and if one or more of the founding members was insolvent or bankrupt or otherwise unable to make payment under its indemnification obligation under the tax receivable agreement, then NCM Inc.’s financial condition could be materially impaired.
36
Table of Contents
The substantial number of shares that are eligible for sale could cause the market price for our common stock to decline or make it difficult for us to sell equity securities in the future
We cannot predict the effect, if any, that market sales of shares of common stock or the availability of shares of common stock for sale will have on the market price of our common stock from time to time. Sales of substantial amounts of shares of our common stock in the public market, or the perception that those sales will occur, could cause the market price of our common stock to decline or make future offerings of our equity securities more difficult. If we are unable to sell equity securities at times and prices that we deem appropriate, we may be unable to fund growth.
The 42,121,747 shares of common stock outstanding at December 31, 2009 are freely tradable, except for 216,688 shares held by our affiliates. In addition, the founding members may receive up to 59,435,758 shares of common stock, which initially will be unregistered, upon redemption of their outstanding common membership units of NCM LLC. These shares of common stock will constitute “restricted securities” under the Securities Act of 1933, as amended, or the Securities Act. Provided the holders comply with the holding periods and other conditions prescribed in Rule 144 under the Securities Act, all but 216,688 of these unregistered shares of common stock cease to be restricted securities and become freely tradable.
Additionally, 590,374 shares of non-vested restricted stock are outstanding and 3,126,560 shares of our common stock will be issuable upon exercise of stock options that vest through 2013. As of December 31, 2009, 648,359 stock options have vested and are exercisable. Once the options and restricted stock become vested and/or exercisable, as applicable, to the extent they are not held by one of our affiliates, the shares acquired upon vesting or exercise are freely tradable.
Our stock price may be volatile
Before our initial public offering in February 2007, there was no public market for our common stock, and an active trading market for our common stock may not continue. The stock market in general has experienced extreme price and volume fluctuations over the last several months as investment companies have been forced to sell to pay-off debt. These broad market fluctuations or actions of individual holders of our stock may adversely affect the market price of our common stock, regardless of our actual operating performance. Our stock price may fluctuate or decline due to a variety of factors, including:
| • | actual or anticipated quarterly fluctuations in our operating results; |
| • | changes in expectations of future financial performance or changes in estimates of securities analysts; |
| • | changes in the market valuations of other companies; |
| • | announcements relating to actions of other media companies, strategic relationships, acquisitions or industry consolidation; |
| • | terrorist acts or wars; and |
| • | general economic, market and political conditions not related to our business. |
Failure of our internal control over financial reporting could harm our business and financial results
Our management is responsible for establishing and maintaining effective internal control over financial reporting. Internal control over financial reporting is a process to provide reasonable assurance regarding the reliability of financial reporting for external purposes in accordance with GAAP. Because of its inherent limitations, internal control over financial reporting is not intended to provide absolute assurance that we would prevent or detect a misstatement of our financial statements or fraud. Any failure to maintain an effective system of internal control over financial reporting could limit our ability to report our financial results accurately and timely or to detect and prevent fraud. The identification of a material weakness in the future could cause a loss of
37
Table of Contents
investor confidence and decline in the market price of our common stock. We may not be able to timely remediate any material weaknesses that may be identified in future periods or maintain all of the controls necessary for continued compliance. Likewise, we cannot assure you that we will be able to retain sufficient skilled finance and accounting personnel.
| Item 1B. | Unresolved Staff Comments |
None.
| Item 2. | Properties |
Information with respect to our corporate headquarters and regional offices is presented below. We own no material real property. We believe that all of our present facilities are adequate for our current needs and that additional space is available for future expansion on acceptable terms.
| Location |
Facility |
Size | ||
| Centennial, CO (1) | Headquarters (including the network operations center) | 58,894 sq. ft. | ||
| Centennial, CO (2) | Additional headquarters space | 12,881 sq. ft. | ||
| Chicago, IL (3) | Regional Office | 3,242 sq. ft. | ||
| New York, NY (4) | Regional Office | 13,299 sq. ft. | ||
| Woodland Hills, CA (5) | Regional Office | 6,062 sq. ft. | ||
| Minneapolis, MN (6) | Regional Office | 5,926 sq. ft. |
| (1) | This facility is leased through December 31, 2013 with a termination option at December 31, 2010. |
| (2) | This facility is leased through January 31, 2011. |
| (3) | This facility is leased through September 30, 2014. |
| (4) | This facility is leased through April 30, 2015. |
| (5) | This facility is leased through May 31, 2012. |
| (6) | This facility is leased through February 29, 2015. |
| Item 3. | Legal Proceedings |
We are sometimes involved in legal proceedings arising in the ordinary course of business. We are not aware of any litigation currently pending that would have a material adverse affect on our operating results or financial condition.
| Item 4. | Reserved |
38
Table of Contents
PART II
| Item 5. | Market for Registrant’s Common Equity, Related Stockholder Matters and Issuer Purchases of Equity Securities |
Our common stock, $0.01 par value, is traded on The NASDAQ Global Market under the symbol “NCMI” since February 8, 2007 (our IPO was effective February 13, 2007). There were approximately 112 shareholders of record as of March 2, 2010 (not including beneficial holders of shares held in “street name”). The following table sets forth the historical high and low sales prices per share for our common stock as reported on The NASDAQ Global Market for the fiscal periods indicated.
| Fiscal 2009 | |||||||||
| High | Low | Declared Dividend | |||||||
| First Quarter (January 2, 2009 – April 2, 2009) |
$ | 14.85 | $ | 7.97 | $ | 0.16 | |||
| Second Quarter (April 3, 2009 – July 2, 2009) |
$ | 15.79 | $ | 11.03 | $ | 0.16 | |||
| Third Quarter (July 3, 2009 – October 1, 2009) |
$ | 17.78 | $ | 12.18 | $ | 0.16 | |||
| Fourth Quarter (October 2, 2009 – December 31, 2009) |
$ | 17.22 | $ | 14.07 | $ | 0.16 | |||
| Fiscal 2008 | |||||||||
| High | Low | Declared Dividend | |||||||
| First Quarter (December 28, 2007 – March 27, 2008) |
$ | 25.95 | $ | 19.21 | $ | 0.15 | |||
| Second Quarter (March 28, 2008 – June 26, 2008) |
$ | 23.22 | $ | 11.25 | $ | 0.16 | |||
| Third Quarter (June 27, 2008 – September 25, 2008) |
$ | 14.27 | $ | 9.00 | $ | 0.16 | |||
| Fourth Quarter (September 26, 2008 – January 1, 2009) |
$ | 11.81 | $ | 4.79 | $ | 0.16 | |||
Dividend Policy
We intend to distribute over time a substantial portion of our free cash flow (distributions from NCM LLC less income taxes and payments under the tax sharing agreement with the founding members) in the form of quarterly dividends to our stockholders. The declaration, payment, timing and amount of any future dividends payable by us will be at the sole discretion of our board of directors who will take into account general economic and business conditions, our financial condition, our available cash, our current and anticipated cash needs, and any other factors that the board considers relevant. Under Delaware law, dividends may be payable only out of surplus, which is our total assets minus total liabilities less the par value of our common stock, or, if we have no surplus, out of our net profits for the fiscal year in which the dividend is declared and/or the preceding fiscal year.
Use of Proceeds from Sale of Registered Securities
None.
Unregistered Sales of Equity Securities and Use of Proceeds
None.
Share Repurchase Program
None.
Issuer Purchases of Equity Securities
None.
39
Table of Contents
Equity Compensation Plan
See “Item 12. Security Ownership of Certain Beneficial Owners and Management and Related Stockholder Matters” for information regarding securities authorized for issuance under our equity compensation plans.
Stock Performance Graph
The following graph compares the cumulative total shareholder return on the common stock of the Company for the period February 8, 2007 (the closing price on the first trading date) through December 31, 2009 with the Russell 2000 Index and the Dow Jones US Media Agencies TSM. The comparisons in the graph below are based upon historical data and are not indicative of, or intended to forecast, future performance of our common stock.
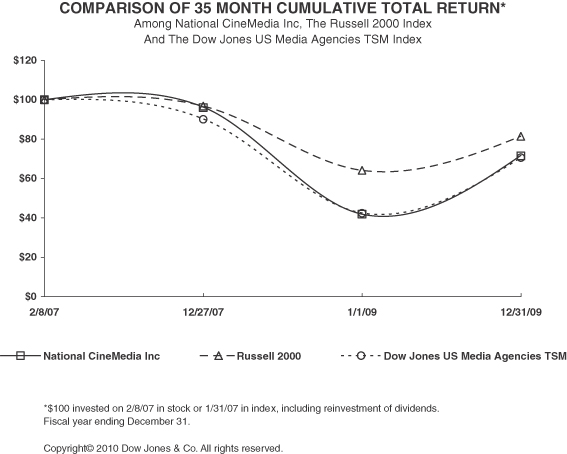
| February 8, 2007 |
December 27, 2007 |
January 1, 2009 |
December 31, 2009 | |||||
| National CineMedia Inc. |
100.00 | 96.19 | 41.85 | 71.67 | ||||
| The Russell 2000 Index |
100.00 | 96.81 | 64.10 | 81.52 | ||||
| Dow Jones US Media Agencies TSM |
100.00 | 90.27 | 42.43 | 70.65 |
40
Table of Contents
| Item 6. | Selected Financial Data |
Selected Historical Financial and Operating Data
The following table sets forth our historical selected financial and operating data for the periods indicated. The selected financial and operating data should be read together with the other information contained in this document, including “Business-Corporate History”, “Business-Reorganization,” “Management’s Discussion and Analysis of Financial Condition and Results of Operations,” the audited historical financial statements and the notes thereto included elsewhere in this document, and historical interim consolidated financial statements, which have not been included in this document.
The results of operations data for the years ended December 31, 2009, January 1, 2009 and December 27, 2007 and the balance sheet data as of December 31, 2009 and January 1, 2009 are derived from the audited financial statements of NCM, Inc. and NCM LLC included elsewhere in this document. The balance sheet data as of December 27, 2007 is derived from the audited financial statements of NCM, Inc. (not presented herein).
The results of operations data for the year ended December 28, 2006 and the nine months ended December 29, 2005 and the balance sheet data as of December 28, 2006 and December 29, 2005 are derived from the audited financial statements (not presented herein) of predecessor NCM LLC.
The results of operations data for RCM, a joint predecessor of NCM LLC, for the three months ended March 31, 2005 and the balance sheet as of March 31, 2005 are derived from the audited financial statements (not presented herein) of RCM.
The results of operations data for NCN, a joint predecessor of NCM LLC, for the 14 weeks ended March 31, 2005 and the balance sheet data as of March 31, 2005 are derived from the audited financial statements (not presented herein) of NCN.
The historical financial statements for periods prior to February 13, 2007 do not reflect what our results of operations and financial position would have been had we been a stand-alone, public company for the periods presented. Specifically, such historical results of operations do not give effect to the matters set forth below:
| • | the terms of the ESAs, which differ from NCM LLC’s prior contractual arrangements with NCM LLC’s founding members and have on going material significance to NCM LLC’s results of operations, (i) assign legacy contracts to NCM LLC, (ii) make additional inventory of lobby promotions, Fathom business and consumer events available to NCM LLC on a pre-approved basis, (iii) make additional theatre advertising inventory available to NCM LLC, to sell such inventory at stated rates to the founding members in order for them to fulfill their on-screen advertising commitments to their beverage concessionaires, and (iv) change the formula for the calculation of the circuit share expense (known as the theatre access fee in the ESAs); |
| • | adjustments to income tax provisions to account for NCM, Inc.’s status as a taxable entity with an ownership interest in NCM LLC; |
| • | the elimination of non-recurring restructuring charges at NCN relating to the formation of NCM LLC; |
| • | the completion of the non-cash recapitalization of NCM LLC pursuant to which existing members of NCM LLC received one common membership unit and one preferred membership unit in exchange for each outstanding common membership unit; |
| • | the completion of the financing transaction, pursuant to which the preferred membership units issued to the founding members in a non-cash recapitalization of NCM LLC were redeemed from the proceeds of a term loan that is part of our new senior secured credit facility; |
| • | the completion of the IPO and the use of proceeds there from as set forth in this document, including our acquisition of 44.8% of the common membership units in NCM LLC at the date of the IPO, which will be accounted for by our consolidation of NCM LLC; and |
| • | the payment by NCM LLC of a portion of the proceeds it received from us to NCM LLC’s founding members for their agreeing to modify our payment obligations under the ESAs. |
41
Table of Contents
| Results of Operations Data ($ in millions, except per |
Year Ended Dec. 31, 2009 |
Year Ended Jan. 1, 2009 |
Post-IPO Period Feb. 13, 2007 through Dec. 27, 2007 |
National CineMedia, LLC | Predecessor -National Cinema Network, Inc. |
Predecessor -Regal CineMedia Corp. | ||||||||||||||||||||||||||||
| Pre-IPO Period Dec. 29, 2006 through Feb. 12, 2007 |
Year Ended Dec. 28, 2006 |
Nine Months Ended Dec. 29, 2005 |
Fourteen Week Period Ended Mar. 31 2005 |
Three Months Ended Mar. 31, 2005 | ||||||||||||||||||||||||||||||
| REVENUE: |
||||||||||||||||||||||||||||||||||
| Advertising |
$ | 335.1 | $ | 330.3 | $ | 282.7 | $ | 20.6 | $ | 188.2 | $ | 56.0 | $ | 15.5 | $ | 15.6 | ||||||||||||||||||
| Administrative Fees—Members |
— | — | — | 0.1 | 5.4 | 30.8 | — | — | ||||||||||||||||||||||||||
| Fathom Events |
45.5 | 38.9 | 25.4 | 2.9 | 25.4 | 11.7 | — | 2.1 | ||||||||||||||||||||||||||
| Other |
0.1 | 0.3 | 0.2 | — | 0.3 | 0.3 | — | 0.1 | ||||||||||||||||||||||||||
| TOTAL REVENUE |
380.7 | 369.5 | 308.3 | 23.6 | 219.3 | 98.8 | 15.5 | 17.8 | ||||||||||||||||||||||||||
| EXPENSES: |
||||||||||||||||||||||||||||||||||
| Advertising Operating Costs |
20.0 | 18.7 | 9.1 | 1.1 | 9.2 | 6.3 | 3.5 | 0.9 | ||||||||||||||||||||||||||
| Fathom Events Operating Costs |
29.1 | 25.1 | 15.4 | 1.4 | 11.1 | 5.4 | — | 0.8 | ||||||||||||||||||||||||||
| Network Costs |
18.6 | 17.0 | 13.3 | 1.7 | 14.7 | 9.2 | 1.1 | 2.4 | ||||||||||||||||||||||||||
| Theatre Access Fees/Circuit Share Costs—Members |
52.7 | 49.8 | 41.5 | 14.4 | 130.1 | 38.6 | 5.5 | 2.4 | ||||||||||||||||||||||||||
| Selling and Marketing |
50.2 | 47.9 | 40.9 | 5.2 | 38.2 | 24.9 | 3.2 | 4.4 | ||||||||||||||||||||||||||
| Administrative and other |
26.3 | 24.9 | 20.1 | 2.8 | 17.0 | 9.8 | 2.7 | 3.4 | ||||||||||||||||||||||||||
| Deferred Stock Compensation |
— | — | — | — | — | — | — | 0.3 | ||||||||||||||||||||||||||
| Severance Plan Costs |
— | 0.5 | 1.5 | 0.4 | 4.2 | 8.5 | — | — | ||||||||||||||||||||||||||
| Depreciation and Amortization |
15.6 | 12.4 | 5.0 | 0.7 | 4.8 | 3.0 | 1.0 | 0.4 | ||||||||||||||||||||||||||
| TOTAL EXPENSES |
212.5 | 196.3 | 146.8 | 27.7 | 229.3 | 105.7 | 17.0 | 15.0 | ||||||||||||||||||||||||||
| Operating Income (Loss) |
168.2 | 173.2 | 161.5 | (4.1 | ) | (10.0 | ) | (6.9 | ) | (1.5 | ) | 2.8 | ||||||||||||||||||||||
| Interest Expense, Net |
49.5 | 77.0 | 57.2 | 0.1 | 0.5 | — | — | — | ||||||||||||||||||||||||||
| Non-Operating Loss |
— | 11.5 | — | — | — | — | — | — | ||||||||||||||||||||||||||
| Income (Loss) Before Income Taxes |
118.7 | 84.7 | 104.3 | (4.2 | ) | (10.5 | ) | (6.9 | ) | (1.5 | ) | 2.8 | ||||||||||||||||||||||
| Income Taxes |
16.6 | 13.7 | 16.4 | — | — | — | (0.6 | ) | 1.1 | |||||||||||||||||||||||||
| Equity loss from investments |
0.8 | — | — | — | — | — | — | — | ||||||||||||||||||||||||||
| CONSOLIDATED NET INCOME (LOSS) |
101.3 | 71.0 | 87.9 | (4.2 | ) | (10.5 | ) | (6.9 | ) | (0.9 | ) | 1.7 | ||||||||||||||||||||||
| Less: Net Income Attributable to Noncontrolling Interests |
75.2 | 55.1 | 63.1 | — | — | — | — | — | ||||||||||||||||||||||||||
| Less: Distributions to Noncontrolling Interest in Excess of Proportionate Share of Earnings |
— | 14.9 | — | — | — | — | — | — | ||||||||||||||||||||||||||
| NET INCOME (LOSS) Attributable to NCM, Inc. |
$ | 26.1 | $ | 1.0 | $ | 24.8 | $ | (4.2 | ) | $ | (10.5 | ) | $ | (6.9 | ) | $ | (0.9 | ) | $ | 1.7 | ||||||||||||||
| Earnings per NCM, Inc. share, Basic and Diluted |
$ | 0.62 | $ | 0.02 | $ | 0.59 | — | — | — | — | — | |||||||||||||||||||||||
42
Table of Contents
| Other Financial and Operating Data ($ in millions, except cash dividend declared per common share and advertising contract value per attendee) |
Year Ended Dec. 31, 2009 |
Year Ended Jan. 1, 2009 |
Post-IPO Period Feb. 13, 2007 through Dec. 27, 2007 |
National CineMedia, LLC | Predecessor -National Cinema Network, Inc. |
Predecessor -Regal Cinemedia Corp. |
||||||||||||||||||||||||||||||||
| Pre-IPO Period Dec. 29, 2006 through Feb. 12, 2007 |
Year Ended Dec. 28, 2006 |
Nine Months Ended Dec. 29, 2005 |
Fourteen Week Period Ended Mar. 31 2005 |
Three Months Ended Mar. 31, 2005 |
||||||||||||||||||||||||||||||||||
| OIBDA (1) |
$ | 183.8 | $ | 185.6 | $ | 166.5 | $ | (3.4 | ) | $ | (5.2 | ) | $ | (3.9 | ) | $ | (0.5 | ) | $ | 3.2 | ||||||||||||||||||
| Adjusted OIBDA (1) |
189.3 | 189.5 | 171.1 | (2.7 | ) | 0.9 | 4.6 | (0.5 | ) | 3.5 | ||||||||||||||||||||||||||||
| Adjusted OIBDA Margin (1) |
49.7 | % | 51.3 | % | 55.5 | % | NM | 0.4 | % | 4.7 | % | NM | 19.7 | % | ||||||||||||||||||||||||
| Capital Expenditures |
$ | 8.6 | $ | 16.7 | $ | 14.4 | $ | 0.6 | $ | 6.6 | $ | 5.9 | — | $ | 1.4 | |||||||||||||||||||||||
| Cash Dividend Declared per Common Share |
$ | 0.64 | $ | 0.63 | $ | 0.45 | — | — | — | — | — | |||||||||||||||||||||||||||
| Founding Member Screens at Period End (2) |
14,401 | 14,331 | 13,261 | * | ** | 13,127 | 9,696 | 3,144 | 6,258 | |||||||||||||||||||||||||||||
| Total Screens at Period End (3) |
16,803 | 17,313 | 15,265 | * | ** | 14,081 | 10,766 | 5,001 | 6,550 | |||||||||||||||||||||||||||||
| Digital Screens at Period End (4) |
15,413 | 15,263 | 13,254 | * | ** | 11,463 | 8,713 | 2,523 | 5,674 | |||||||||||||||||||||||||||||
| Total Attendance for Period (in millions) (5) |
667.2 | 643.0 | 504.3 | 70.8 | 545.9 | 311.3 | 41.5 | 58.6 | ||||||||||||||||||||||||||||||
| Total Advertising Contract Value (6) |
$ | 335.1 | $ | 330.3 | $ | 282.7 | $ | 20.9 | $ | 205.1 | $ | 144.0 | $ | 15.5 | $ | 15.6 | ||||||||||||||||||||||
| Total Advertising Contract Value per Attendee (6) |
$ | 0.50 | $ | 0.51 | $ | 0.56 | $ | 0.30 | $ | 0.38 | $ | 0.46 | $ | 0.37 | $ | 0.27 | ||||||||||||||||||||||
***—Not materially different than year ended December 28, 2006
| Balance Sheet Data (in millions) | As of Dec. 31, 2009 |
As of Jan. 1, 2009 |
As of Dec. 27, 2007 |
As of Dec. 28, 2006 |
As of Dec. 29, 2005 |
Predecessor -National Cinema Network, Inc. |
Predecessor -Regal Cinemedia Corp. | |||||||||||||||||||||
| As of Mar. 31 2005 |
As of Mar. 31, 2005 | |||||||||||||||||||||||||||
| Cash and cash equivalents |
$ | 91.1 | $ | 69.2 | $ | 20.8 | $ | 6.7 | $ | — | $ | — | $ | 2.8 | ||||||||||||||
| Receivables, Net |
89.3 | 92.2 | 93.2 | 63.9 | 36.6 | 20.1 | 15.8 | |||||||||||||||||||||
| Property and Equipment, Net |
23.7 | 28.0 | 22.2 | 12.6 | 10.0 | 0.7 | 5.2 | |||||||||||||||||||||
| Total Assets |
628.2 | 609.6 | 463.6 | 90.0 | 48.8 | 60.8 | 48.2 | |||||||||||||||||||||
| Borrowings |
799.0 | 799.0 | 784.0 | 10.0 | 1.3 | — | — | |||||||||||||||||||||
| Equity/(deficit) |
(493.1 | ) | (526.3 | ) | (572.4 | ) | 3.5 | 9.8 | 0.1 | 41.2 | ||||||||||||||||||
| Total Liabilities and Equity |
628.2 | 609.6 | 463.6 | 90.0 | 48.8 | 60.8 | 48.2 | |||||||||||||||||||||
43
Table of Contents
Notes to the Selected Historical Financial and Operating Data
1. OIBDA, Adjusted OIBDA and Adjusted OIBDA margin are not financial measures calculated in accordance with generally accepted accounting principles (“GAAP”) in the U.S (reconciliation to GAAP financial measures are presented in the table below). OIBDA represents operating income (loss) before depreciation and amortization expense. Adjusted OIBDA excludes from OIBDA non-cash severance plan costs, share based payment costs and deferred stock compensation. Adjusted OIBDA margin is calculated by dividing Adjusted OIBDA by total revenue. These non-GAAP financial measures are used by management to evaluate operating performance, to forecast future results and as a basis for compensation. The Company believes these are important supplemental measures of operating performance because they eliminate items that have less bearing on its operating performance and so highlight trends in its core business that may not otherwise be apparent when relying solely on GAAP financial measures. The Company believes the presentation of these measures is relevant and useful for investors because it enables them to view performance in a manner similar to the method used by the Company’s management, helps improve their ability to understand the Company’s operating performance and makes it easier to compare the Company’s results with other companies that may have different depreciation and amortization policies, and non-cash share based compensation programs or different interest rates or debt levels or income tax rates. A limitation of these measures, however, is that they exclude depreciation and amortization, which represent a proxy for the periodic costs of certain capitalized tangible and intangible assets used in generating revenues in the Company’s business. In addition, Adjusted OIBDA has the limitation of not reflecting the effect of the Company’s non-cash severance plan costs, share based payment costs and deferred stock compensation. OIBDA or Adjusted OIBDA should not be regarded as an alternative to operating income, consolidated net income or as indicators of operating performance, nor should they be considered in isolation of, or as substitutes for financial measures prepared in accordance with GAAP. The Company believes that operating income is the most directly comparable GAAP financial measure to OIBDA. Because not all companies use identical calculations, these presentations may not be comparable to other similarly titled measures of other companies.
OIBDA and Adjusted OIBDA do not reflect the AMC Loews or Consolidated Theatres integration payments. The integration payments received are added to Adjusted OIBDA to determine our compliance with financial covenants under our senior secured credit facility. AMC made Loews payments to NCM LLC pursuant to the Loews screen integration agreement, which was $0.1 million, $4.7 million and $11.2 million for the years ended December 31, 2009 and January 1, 2009 and the 2007 post-IPO period, respectively. Regal made Consolidated Theatres payments to NCM LLC pursuant to the revised ESAs, which were $3.2 million, $2.8 million for the years ended December 31, 2009 and January 1, 2009, respectively.
2. Represents the total number of screens within our advertising network operated by NCM LLC’s founding members. Excludes AMC Loews screens for all periods presented. Excludes Century screens for periods presented through October 2006.
3. Represents the sum of founding member screens and network affiliate screens.
4. Represents the total number of screens that are connected to our DCN.
5. Represents the total attendance within our advertising network. Excludes AMC Loews screens for all periods prior to June 2008 and excludes Star Theatres for periods prior to March 2009. Excludes Consolidated Theatres for all periods presented. Excludes Century screens for periods through October 2006 as presented.
6. Includes advertising revenue plus legacy contract value (representing agreements between the founding members and third-party advertisers which existed prior to the IPO which were assigned to NCM LLC at the time of the IPO) for all historical periods.
44
Table of Contents
The following table reconciles operating income (loss) to OIBDA and Adjusted OIBDA for the periods presented:
| ($ in millions) | Year Ended Dec. 31, 2009 |
Year Ended Jan. 1, 2009 |
Post-IPO Period Feb. 13, 2007 through Dec. 27, 2007 |
National CineMedia, LLC | Predecessor -National Cinema Network, Inc. |
Predecessor -Regal CineMedia Corp. |
||||||||||||||||||||||||||||||||
| Pre-IPO Period Dec. 29, 2006 through Feb. 12, 2007 |
Year Ended Dec. 28, 2006 |
Nine Months Ended Dec. 29, 2005 |
Fourteen Week Period Ended Mar. 31 2005 |
Three Months Ended Mar. 31, 2005 |
||||||||||||||||||||||||||||||||||
| Operating income (loss) |
$ | 168.2 | $ | 173.2 | $ | 161.5 | $ | (4.1 | ) | $ | (10.0 | ) | $ | (6.9 | ) | $ | (1.5 | ) | $ | 2.8 | ||||||||||||||||||
| Depreciation and amortization |
15.6 | 12.4 | 5.0 | 0.7 | 4.8 | 3.0 | 1.0 | 0.4 | ||||||||||||||||||||||||||||||
| OIBDA |
$ | 183.8 | $ | 185.6 | $ | 166.5 | $ | (3.4 | ) | $ | (5.2 | ) | $ | (3.9 | ) | $ | (0.5 | ) | $ | 3.2 | ||||||||||||||||||
| Severance plan costs |
— | 0.5 | 1.5 | 0.4 | 4.2 | 8.5 | — | — | ||||||||||||||||||||||||||||||
| Share-based compensation costs/Deferred stock compensation (1) |
5.5 | 3.4 | 3.1 | 0.3 | 1.9 | — | — | 0.3 | ||||||||||||||||||||||||||||||
| Adjusted OIBDA |
$ | 189.3 | $ | 189.5 | $ | 171.1 | $ | (2.7 | ) | $ | 0.9 | $ | 4.6 | $ | (0.5 | ) | $ | 3.5 | ||||||||||||||||||||
| Total Revenue |
$ | 380.7 | $ | 369.5 | $ | 308.3 | $ | 23.6 | $ | 219.3 | $ | 98.8 | $ | 15.5 | $ | 17.8 | ||||||||||||||||||||||
| Adjusted OIBDA margin |
49.7 | % | 51.3 | % | 55.5 | % | NM | 0.4 | % | 4.7 | % | NM | 19.7 | % | ||||||||||||||||||||||||
| (1) | Share-based payments costs are included in network operations, selling and marketing and administrative expense in the accompanying financial statements. |
| Item 7. | Management’s Discussion and Analysis of Financial Condition and Results of Operations |
As discussed in Part 1, some of the information in this Annual Report on Form 10-K includes “forward-looking statements” within the meaning of Section 27A of the Securities Act of 1933, as amended, and Section 21E of the Securities Exchange Act of 1934 (the “Exchange Act”), as amended. All statements other than statements of historical facts included in this Form 10-K, including, without limitation, certain statements under “Management’s Discussion and Analysis of Financial Condition and Results of Operations”, may constitute forward-looking statements. In some cases, you can identify these “forward-looking statements” by the specific words, including but not limited to “may,” “should,” “expects,” “plans,” “anticipates,” “believes,” “estimates,” “predicts,” “potential” or “continue” or the negative of those words and other comparable words. These forward-looking statements involve risks and uncertainties. The following discussion and analysis should be read in conjunction with our historical financial statements and the related notes thereto included elsewhere in this document.
Our historical financial data discussed below prior to the completion of the Company’s IPO reflects the historical results of operations and financial position of NCM LLC and its joint predecessors, RCM and NCN. Accordingly, historical financial data does not give effect to the reorganization and the NCM LLC senior secured credit facility completed as part of the NCM, Inc. IPO. See “Business-Corporate History”, “Business- Reorganization,” “—Financial Condition and Liquidity-Financings” and “Summary Historical Operating Data” included elsewhere in this document. In the following discussion and analysis, the term net income refers to net income attributable to NCM, Inc.
45
Table of Contents
Overview
NCM operates the largest digital in-theatre network in North America, for the distribution of advertising, and Fathom Business and Consumer Events. Our revenue is principally derived from the sale of advertising and, to a lesser extent, from our Fathom Events business. We have long-term ESAs with NCM LLC’s founding members and multi-year agreements with several other unrelated theatre operators, whom we refer to as network affiliates. The ESAs with the founding members and network affiliate agreements grant us exclusive rights, subject to limited exceptions, to sell advertising and meeting services and distribute entertainment programming in those theatres. Our advertising and Fathom Events business are distributed primarily to theatres that are digitally equipped with our proprietary DCN technology. In excess of 90% of the aggregate founding member and network affiliate theatre attendance is included in our digital network.
Management focuses on several measurements that we believe provide us with the necessary ratios and key performance indicators for us to manage our business and to determine how we are performing versus our internal goals and targets, and against the performance of our competitors and other benchmarks in the marketplace in which we operate. Senior executives hold monthly meetings with managers and staff to discuss and analyze operating results and address significant variances to budget in an effort to identify trends and changes in our business. We focus on many operating metrics including changes in OIBDA, Adjusted OIBDA and Adjusted OIBDA margin, as defined and discussed in “Item 6. Selected Financial Data—Notes to the Selected Historical Financial and Operating Data”, as some of our primary measurement metrics. In addition, we pay particular attention to our monthly advertising performance measurements, including advertising inventory utilization, pricing (CPM), local and total advertising revenue per attendee and the number of Fathom Events locations and revenue per location. Finally, we monitor our operating cash flow and related financial leverage and revolving credit facility availability and cash balances to ensure that debt obligations and future declared dividends can be met while providing adequate cash cushions.
Summary Historical and Operating Data
You should read this information together with the other information contained in this document, including “Business-Corporate History” and “Business-Reorganization,” and our audited historical financial statements and the notes thereto included elsewhere in this document.
The following table presents operating data and OIBDA. See “Item 6. Selected Financial Data—Notes to the Selected Historical Financial and Operating Data” for a discussion of the calculation of Adjusted OIBDA and reconciliation to operating income.
| (In millions, except per share data) | Year Ended Dec. 31, 2009 |
Year Ended Jan. 1, 2009 |
Post-IPO Period Ended Dec. 27, 2007 |
Pre-IPO Period Ended Feb. 12, 2007 |
||||||||||||||
| Revenue |
$ | 380.7 | $ | 369.5 | $ | 308.3 | $ | 23.6 | ||||||||||
| Operating income (loss) |
$ | 168.2 | $ | 173.2 | $ | 161.5 | $ | (4.1 | ) | |||||||||
| Adjusted OIBDA |
$ | 189.3 | $ | 189.5 | $ | 171.1 | $ | (2.7 | ) | |||||||||
| Adjusted OIBDA margin |
49.7 | % | 51.3 | % | 55.5 | % | NM | |||||||||||
| Net Income (loss) Attributable to NCM, Inc. |
$ | 26.1 | $ | 1.0 | $ | 24.8 | $ | (4.2 | ) | |||||||||
| Net Income per NCM, Inc. Basic Share |
$ | 0.62 | $ | 0.02 | $ | 0.59 | — | |||||||||||
| Net Income per NCM, Inc. Diluted Share |
$ | 0.62 | $ | 0.02 | $ | 0.59 | — | |||||||||||
| Total advertising contract value ($ in millions) |
$ | 335.1 | $ | 330.3 | $ | 282.7 | $ | 20.9 | ||||||||||
| Total theater attendance (in millions) |
667.2 | 643.0 | 504.3 | 70.8 | ||||||||||||||
| Total advertising contract value per attendee |
$ | 0.50 | $ | 0.51 | $ | 0.56 | $ | 0.30 | ||||||||||
46
Table of Contents
Basis of Presentation
Prior to the completion of the IPO, NCM LLC was wholly-owned by its founding members. In connection with the offering, NCM Inc. purchased newly issued common membership units from NCM LLC and common membership units from the founding members, and became a member of and the sole manager of NCM LLC. We entered into several agreements to effect the reorganization and the financing transaction and certain amendments were made to the existing ESAs to govern the relationships among NCM LLC and the founding members after the completion of these transactions.
The results of operations data discussed herein were derived from the audited consolidated financial statements and accounting records of NCM Inc. and NCM LLC and should be read in conjunction with the notes thereto. The results of operations data for the period ended December 27, 2007 are presented in two periods, the 2007 pre-IPO period and the 2007 post-IPO period. Separate periods have been presented because there were significant changes at the time of the IPO due to the ESA modifications and related expenses thereunder, the new debt agreements and significant changes to revenue arrangements and contracts with the founding members. The historical financial data of NCM LLC prior to the IPO may not be indicative of the Company’s post-IPO performance nor will such data reflect what its financial position and results of operations would have been had it operated as an independent publicly traded company during the pre-IPO periods presented.
We have a 52-week or 53-week fiscal year ending on the first Thursday after December 25. Fiscal years 2009 and 2007 contained 52 weeks while fiscal year 2008 contained 53 weeks. Throughout this document, we refer to our fiscal years as set forth below:
| Fiscal Year Ended |
Reference in this Document | |
| December 31, 2009 |
2009 | |
| January 1, 2009 |
2008 | |
| December 27, 2007 (Period December 29, 2006 through February 12, 2007) |
2007 pre-IPO period | |
| December 27, 2007 (Period February 13, 2007 through December 27, 2007) |
2007 post-IPO period |
Results of Operations
Years Ended December 31, 2009 and January 1, 2009
Revenue. Total revenue of the Company for the year ended December 31, 2009 was $380.7 million compared to $369.5 million for the 2008 period, an increase of $11.2 million, or 3.0% over the 2008 period. The increase in total revenue was the result of an increase in total advertising revenue of 1.5% (including revenue from our founding member beverage concessionaire agreements, or “beverage revenue”) and a 17.0% increase in Fathom Events revenue.
National advertising revenues of $273.1 million (including $36.3 million of beverage revenue) for the year ended December 31, 2009 increased 2.5% from $266.4 million (including $43.3 million of beverage revenue) of revenue for the 2008 period. National advertising revenue (excluding beverage revenue) for the year ended December 31, 2009 increased $13.7 million or 6.1% to $236.8 million compared to $223.1 million for the 2008 period, primarily due to an increase in inventory utilization (excluding beverage revenue) to 87.5% for the year ended December 31, 2009 as compared to 79.7% for the year ended January 1, 2009 and a 6.4% increase in advertising impressions available for sale. The increase in inventory utilization was primarily due to the continued broadening of our overall client base. The impact on revenue from inventory utilization and impressions was somewhat offset by a 5.5% decrease in CPMs due to a soft market television pricing environment. The decrease in payments from the founding members for their beverage concessionaire agreements was primarily due to a reduction in the amount of beverage advertising time acquired by two of our founding members from 90 to 60 seconds, as compared to the 90 seconds acquired during the year ended January 1, 2009, offset slightly by a contractual annual 8% increase in beverage advertising CPM and the additional attendance increase associated with the Consolidated Theatres acquired by Regal in the second quarter of 2008.
47
Table of Contents
Local advertising revenue decreased $1.9 million or 3.0% to $62.0 million for the year ended December 31, 2009 compared to $63.9 million for the 2008 period. The decrease is primarily due to one less week in the fiscal year and the economic conditions present in 2009 and its effect on local and regional businesses. Local revenue per theatre attendee decreased slightly to $0.09 per attendee for the full year of 2009 compared to $0.10 for the 2008 period, due to the combination of slightly lower revenue coupled with a 3.8% attendance increase across our network.
Total advertising revenue per attendee for the year ended December 31, 2009 was $0.50 per attendee, which represents a decrease of 1.96% compared to the 2008 period. The slight decrease in the advertising contract value per attendee was due to the impact of a 1.5% increase in revenue versus a 3.8% increase in theatre attendance, excluding beverage revenue, total advertising revenue per attendee increased 2.3%.
Fathom Events revenue increased $6.6 million, or 17%, to $45.5 million for the year ended December 31, 2009 compared to the 2008 period. This increase was due to continued growth in our Fathom Consumer events division offset by a decrease in our Fathom Business events division which was adversely impacted by the soft economy as larger corporate clients delayed their marketing and employee communication events. Our Fathom Consumer events business revenue benefited from the continued expansion of our live network capabilities and broadening of programming distributed over our theatre network, resulting in a 49.8% increase in the Consumer division’s number of event locations.
Operating expenses. Total operating expenses for the year ended December 31, 2009 were $212.5 million compared to $196.3 million for the 2008 period. The 8.3% increase in 2009 compared to the 2008 period was primarily the result of an increase in advertising operating costs, Fathom Events costs, network costs and selling and marketing costs, which are primarily the result of the increase in our national advertising (excluding beverage) and Fathom Events revenues. Set forth below is a discussion of the more significant operating expenses.
Advertising operating costs. Advertising operating costs of $20.0 million for the year ended December 31, 2009 increased 7.0% over the $18.7 million for the 2008 period. This increase was primarily the result of the increase in national advertising revenue (excluding beverage) resulting in an increase of 16.0% in associated payments made to our advertising affiliates pursuant to our contractual agreements under which the payment is based on a percentage of revenue displayed in those theatres. This is due to an increase of 1.1% in advertising affiliate attendance. The overall number of network affiliate screens decreased for 2009 as compared to 2008, due to the loss of one advertising affiliate during 2008. Network affiliate screens represented 14.3% of total network screens for 2009 versus 17.2% in 2008.
Fathom Events operating costs. Fathom Events operating costs of $29.1 million for the year ended December 31, 2009 increased 15.9% compared to $25.1 million during the 2008 periods due to the increase in revenues associated with a 27.7% increase in the number of events and the high level of variable event expenses associated with those events.
Network costs. Network costs of $18.6 million for the year ended December 31, 2009 increased 9.4% compared to $17.0 million for the 2008 period due primarily to the increase in size of our digital network and increased maintenance expenses related to aging network equipment in theatres. Total digital network screens operated during 2009 increased to 15,413 from 15,263 in 2008, or an increase of approximately 1.0%.
Theatre access fees. Theatre access fees were $52.7 million for the year ended December 31, 2009 compared to $49.8 million for the 2008 period. The increase for 2009 versus the 2008 period was the result of a 4.2% increase in founding member attendance, including the addition of AMC Loews for the full year ended December 31, 2009.
Selling and marketing costs. Selling and marketing costs increased to $50.2 million for the year ended December 31, 2009 compared to $47.9 million for the 2008 period, or an increase of 4.8%. Selling and marketing costs have increased primarily due to increases in personnel and operating costs of our on-line
48
Table of Contents
business as well as increased marketing initiatives to support our expanding business, an increase in bad debt expense primarily related to our local advertising business, offset slightly by a decrease in local sales commissions associated with lower sales revenues.
Administrative and other costs. Administrative and other costs for the year ended December 31, 2009 was $26.3 million compared to $24.9 million for the 2008 period, an increase of 5.6% primarily due to increased personnel costs, including share based compensation expense, partially offset by a decrease in professional fees, travel and other costs due to various cost savings efforts implemented by management during the year.
Depreciation and amortization. Depreciation and amortization expense increased 25.8% in 2009 compared to the 2008 period primarily as a result of increased depreciation on capital expenditures made to support the growth of our network, including network equipment installed in network affiliate theatres and amortization expense recognized on additional intangible assets associated with new founding member theatres added to our network in accordance with the Common Unit Adjustment Agreement.
Net income. Net income generated for the year ended December 31, 2009 was $26.1 million compared to net income for January 1, 2009 of $1.0 million, primarily related to lower net interest expense offset by a higher provision for income taxes, an increase in net income attributable to noncontrolling interests and a prior year impairment charge and charge for distributions to noncontrolling interests in excess of proportionate share of earnings. The decrease in net interest expense is primarily due to a $7.0 million non-cash credit for the year ended December 31, 2009 as compared to a $14.2 million non-cash charge for the year ended January 1, 2009 in interest expense related to the change in fair value of our interest rate hedge of our senior secured credit facility due to the bankruptcy of Lehman as discussed in Note 12 to the consolidated financial statements included elsewhere in this document, as well as lower market interest rates on the unhedged portion of our debt. For the year ended January 1, 2009, we had an $11.5 million non-operating impairment charge which related to our investment in a start-up advertising company as discussed in Note 11 to the consolidated financial statements included elsewhere in this document. The increase in income taxes is due to higher pre-tax income and an increase in the effective state income tax rate. The increase in the net amount attributable to noncontrolling interest is primarily due to the higher amount of income allocable to the noncontrolling interests in fiscal 2008, caused by the items discussed above including the impact of additional common membership units issued in 2009 and by distributions to noncontrolling interest in excess of proportionate share of earnings of $14.9 million recorded for the year ended January 1, 2009 as discussed in Note 7 to the consolidated financial statements included elsewhere in this document.
Year Ended January 1, 2009 and the 2007 Pre and Post-IPO Periods
Revenue. Total revenue of the Company for the year ended January 1, 2009 was $369.5 million compared to $308.3 million for the 2007 post-IPO period and $23.6 million for the 2007 pre-IPO period, an increase of $37.6 million, or 11.3% over the combined pre and post-IPO periods. The increase in total revenue was the result of an increase in advertising revenue of 8.9% (including beverage revenue that commenced on February 13, 2007) and a 37.5% increase in Fathom events revenue.
National advertising revenues of $266.4 million (including $43.3 million of beverage revenue) for the year ended January 1, 2009 increased from $243.1 million (including $40.9 million of beverage revenue) of combined revenue for the 2007 pre and post-IPO periods, reflecting the strong second half of 2008 scatter market that offset a weak first half of 2008 and an increase in payments from the founding member beverage concessionaire agreements. National advertising revenue (excluding beverage revenue) for the year ended January 1, 2009 increased $20.8 million or 10.3% to $223.1 million for the year ended January 1, 2009 compared to $202.2 million for the combined 2007 pre and post-IPO periods, primarily due to a 13.4% increase in CPMs (excluding beverage revenue) and 10.8% increase in advertising impressions available for sale, which was offset by a decrease in national advertising inventory utilization (excluding beverage revenue) to 79.7% from 87.0%. The decrease in utilization is due primarily to the increase in advertising impressions related primarily to affiliate
49
Table of Contents
theatres added to our network in the second half of 2007 and 2008, on which there is generally a ramping-up period associated with new affiliate additions as those new screens are integrated into client proposals. The increase in payments from the founding members related to their beverage concessionaire agreements was due to the fact that 2007 payments did not begin until the IPO date offset by a reduction in contracted beverage advertising time from 90 seconds to 60 seconds by one of our founding members during 2008.
Local advertising revenue increased $3.7 million or 6.1% to $63.9 million for the year ended January 1, 2009 compared to $60.2 million for the combined 2007 pre and post-IPO periods. The increase is primarily due to the increase in total average screens in our advertising network, including AMC Loews. Local revenue per theatre attendee remained consistent for the full year of 2008 compared to combined 2007 pre and post-IPO periods at $0.10 per attendee, despite the addition of 978 network affiliate theatre screens and over 1,000 AMC Loews screens (to which we did not have full inventory access until December 2008 due to certain run-out provisions).
Total advertising contract value per attendee for the year ended January 1, 2009 was $0.51 per attendee, which represents a decrease of 1.96% compared to 2007 pre and post-IPO periods. The slight decrease in the advertising contract value per attendee was primarily due to the impact of integrating new network affiliate and AMC Loews screens into our sales process. There is generally a three-month lag time once the theatres have been connected to our network before they are fully integrated into our sales process.
Fathom Events revenue increased $10.6 million, or 37.5%, to $38.9 million for the year ended January 1, 2009 compared to the combined 2007 pre and post-IPO periods as a result of a 69.3% increase in the number of events and due to the success of several Fathom events.
Operating expenses. Total operating expenses for the year ended January 1, 2009 were $196.3 million compared to $146.8 million for the 2007 post-IPO period and $27.7 million for the 2007 pre-IPO period. The 12.5% increase in 2008 compared to the combined 2007 pre and post-IPO periods was primarily the result of an increase in advertising operating costs and selling and marketing costs, which are the result of the increase in the size of our network and a higher percentage of network affiliate screens and an increase in Fathom Events operating costs which are the result of the increase in the number of events.
Advertising operating costs. Advertising operating costs of $18.7 million for the year ended January 1, 2009 increased 83.3% over the combined $10.2 million 2007 pre and post-IPO period. This increase was primarily the result of the 48.8% increase in the number of network affiliate screens and associated payments made to our advertising affiliates pursuant to our contractual agreements under which the payment is based on a percentage of revenue displayed in those theatres. Network affiliate screens represented 17.2% of total network screens for 2008 versus 13.1% in 2007.
Fathom Events operating costs. Fathom Events operating costs of $25.1 million for the year ended January 1, 2009 increased 49.4% compared to $16.8 million during the combined 2007 pre and post-IPO periods due to a 69.3% increase in the number of events and the high level of variable event expenses associated with those events.
Network costs. Network costs of $17.0 million for the year ended January 1, 2009 increased 13.3% compared to $15.0 million for the combined 2007 pre and post-IPO periods due primarily to the increase in size of our network as well as operating costs associated with our internet site. Total network screens operated during 2008 increased to 17,313 from 15,265 in 2007, or an increase of approximately 13.4%.
Theatre access fees/circuit share costs. Theatre access fees were $49.8 million for the year ended January 1, 2009 compared to $41.5 million for the 2007 post-IPO period. The circuit share expense for the 2007 pre-IPO period was $14.4 million. The decrease for 2008 versus the combined 2007 pre and post-IPO periods was the result of changes in the payment structure in the ESAs that became effective upon the completion of the IPO discussed above, combined with a February 2008 increase in the rate per digital screen, offset by a slight decrease in 2008 founding member attendance.
50
Table of Contents
Selling and marketing costs. Selling and marketing costs increased to $47.9 million for the year ended January 1, 2009 compared to $46.1 million for the combined 2007 pre and post-IPO periods, or an increase of 3.9%. Selling and marketing costs have increased primarily due to an expansion in the local sales force and an increase in local sales commissions (associated with increased sales) and higher direct marketing costs associated with the increase in the number of Fathom business and consumer events. There was also an increase in the provision for bad debt reflecting the broader local client base and higher local revenue.
Administrative and other costs. Administrative and other costs for the year ended January 1, 2009 was $24.9 million compared to $22.9 million for the combined 2007 pre and post-IPO periods, an increase of 8.7% primarily due to increased professional fees and personnel costs associated with being a public company and additional personnel associated with the growth in our network and higher activity in our Fathom Events divisions.
Depreciation and amortization. Depreciation and amortization expense increased in 2008 compared to the combined 2007 pre and post-IPO periods primarily as a result of increased depreciation on additional equipment in network affiliate theatres and investments in software development and other network infrastructure made to support the growth of our network and amortization expense recognized on additional intangible assets recorded related to activity associated with the annual Common Unit Adjustment.
Net income (loss). Net income generated for the year ended January 1, 2009 was $1.0 million compared to net income for the 2007 post-IPO period of $24.8 million and a net loss for the 2007 pre-IPO period of $4.2 million due to an increase in operating income, decreased income taxes and noncontrolling interest, which was offset by a non-operating impairment charge, higher net interest expense and distributions to noncontrolling interest in excess of proportionate share of earnings. The increase in net interest expense is primarily due to a $14.2 million non-cash charge to interest expense related to the change in the status of our interest rate swap that is not accounted for as a cash flow hedge due to the bankruptcy of Lehman as discussed in Note 12 to the consolidated financial statements included elsewhere in this document, partially offset by lower market interest rates on the unhedged portion of our debt. The $11.5 million non-operating impairment charge related to our investment in a start-up advertising company as discussed in Note 11 to the consolidated financial statements included elsewhere in this document. The decrease in income taxes is due to lower pre-tax income, partially offset by an increase in our effective tax rate caused primarily by a valuation allowance we recorded against the deferred tax asset related to the non-operating impairment charge. The decrease in the amount attributable to noncontrolling interest is primarily due to the lower amount of income allocable to the noncontrolling interest, caused by the items discussed above offset by additional common membership units issued in 2008 and by distributions to noncontrolling interest in excess of proportionate share of earnings of $14.9 million recorded for the year ended January 1, 2009 as discussed in Note 7 to the consolidated financial statements included elsewhere in this document.
Known Trends and Uncertainties
The current challenging macro-economic environment, especially in the local marketplace, and late breaking national television scatter advertising market in general, present uncertainties that could impact our results of operations, including the timing and amount of spending from our advertising clients and collections of accounts receivable. However, we are cautiously optimistic that the impact to our business will be mitigated due to factors including the growth in our advertising client base, the effectiveness of cinema advertising relative to other mediums, and the impact of our broader national network and the related increase in salable impressions. As noted previously, in 2009 we added several new affiliate theatres to our national network including: American Cinemas: Galaxy Theatres, LLC; LA Live Theatres; Storyteller Theatres Corporation; Starplex Cinemas and ShowBiz Cinemas. These additions have added nearly 18.1 million new attendees on a full-year pro-forma basis, representing in excess of 170 million new salable advertising impressions. Our sales force either has or will integrate these additional impressions into the advertising sales process during 2010 and we expect that the yield on these attendees to be positive in 2010. We believe that the continued growth of our network will continue to strengthen our selling proposition in comparison to other national advertising platforms.
51
Table of Contents
Under the ESAs, up to 90 seconds of the FirstLook program can be sold to our founding members to satisfy their on-screen advertising commitments under their beverage concessionaire agreements. During 2009, we sold 60 seconds to our founding members. We expect to continue to sell 60 seconds of time to the founding members in 2010 and sell the other 30 seconds to other advertising clients.
On January 19, 2010, AMC announced it had entered into a definitive agreement with Kerasotes in which AMC will acquire substantially all of the assets of Kerasotes. Pursuant to the amended ESAs and Common Unit Adjustment Agreement, the Kerasotes theatres will be subject to the AMC ESA and at the time Kerasotes theatres are added to our network, AMC would be entitled to receive NCM LLC common units in accordance with the Common Unit Adjustment Agreement and theatre access fees in accordance with the ESA. The addition of Kerasotes to AMC does not increase our screen count or attendance as it represents a movement from a network affiliate agreement to the ESA structure. After the Common Unit Adjustment, we expect our affiliate expense to be reduced, partially offset by increases in the theatre access fee and beverage revenue and as a result our Adjusted OIBDA and Adjusted OIBDA margins should increase.
Our effective tax rate for the years ended December 31, 2009, January 1, 2009 and the 2007 post-IPO period was 37.6%, 46.1% and 39.8%, respectively. During fiscal 2008 our effective tax rate included the effect of a valuation allowance. Our tax rate is affected by recurring items and the relative amount of income that NCM, Inc. earns in various state and local jurisdictions, which we expect to be fairly consistent in the near term. It is also affected by discrete items that may occur in any given year, but are not consistent from year to year. Refer to Note 5 for additional details on our effective tax rate.
Financial Condition and Liquidity
Liquidity and Capital Resources
As of December 31, 2009, our cash and cash equivalents balance was $91.1 million, an increase of $21.9 million compared to the balance of $69.2 million as of January 1, 2009.
NCM LLC has an aggregate revolving credit facility commitment of $80.0 million with a consortium of banks. On September 15, 2008, Lehman Brothers Holdings Inc. (“Lehman”) filed for protection under Chapter 11 of the federal Bankruptcy Code in the United States Bankruptcy Court for the Southern District of New York. NCM LLC’s revolving credit facility includes $20.0 million with Lehman Commercial Paper Inc. (“LCPI”), a subsidiary of Lehman. As of December 31, 2009, NCM LLC has borrowed $14.0 million from LCPI under the revolving credit facility. LCPI failed to fund its undrawn commitment of $6.0 million. On February 3, 2010, LCPI assigned the $6.0 million commitment to Barclays Bank (“Barclays”). In addition, NCM LLC has been working with LCPI and its other lenders with the goal of having LCPI’s agency function transferred to another bank within NCM LLC’s lender group and restructuring LCPI’s outstanding $14.0 million revolving loan such that (i) it would not be required to be repaid, nor would it share in any pro rata prepayments of the revolving loans, until the final maturity date of the revolving credit facility and (ii) it would not be available for reborrowing in the event that it was prepaid. Until these LCPI issues are resolved, however, NCM LLC is not anticipating repaying any of its revolver borrowings as it would effectively result in a permanent reduction of its revolving credit facility, to the extent of the payments against LCPI borrowings.
The increase in our liquidity position from January 1, 2009 was due to cash flow generated from operating activities exceeding the cash used in investing and financing activities, as follows (in millions):
| Year Ended Dec. 31, 2009 |
Year Ended Jan. 1, 2009 |
Post-IPO Period Ended Dec. 27, 2007 |
Pre-IPO Period Ended Feb. 13, 2007 |
|||||||||||||||
| Operating cash flow |
$ | 138.3 | $ | 124.5 | $ | 37.3 | $ | 2.2 | ||||||||||
| Investing cash flow |
$ | (10.4 | ) | $ | (7.5 | ) | $ | (30.2 | ) | $ | (0.5 | ) | ||||||
| Financing cash flow |
$ | (106.0 | ) | $ | (68.6 | ) | $ | 5.4 | $ | (0.1 | ) | |||||||
52
Table of Contents
| • | Operating Activities. The increase in funds provided by operating activities for the year ended December 31, 2009 versus the 2008 period was primarily due to higher revenue levels and changes in the timing of the collection of accounts receivable balances and the timing of payments for normal operating expenditures. |
| • | Investing Activities. The increase in cash used for investing activities for the year ended December 31, 2009 versus the 2008 period was primarily due to a decrease in the sale of short term investments off set by lower levels of capital expenditures. The 2008 period included amounts for the purchase of equipment and related installation for certain network affiliate theatres. |
| • | Financing Activities. The increase in cash used for financing activities for the year ended December 31, 2009 versus the 2008 period was primarily due to lower net proceeds from borrowings and higher available cash distributions to our founding members related to higher levels of available cash as defined in the operating agreement. |
Our cash balances will fluctuate due to the timing of collections of accounts receivable balances and operating expenditure payments, as well as available cash payments (as defined) to NCM LLC’s founding members, interest payments on our term loan, income tax payments, tax sharing payments to our founding members and quarterly dividends to NCM, Inc.’s common shareholders pursuant to our dividend policy.
Sources of capital and capital requirements. NCM, Inc.’s primary source of liquidity and capital resources are distributions from NCM LLC. NCM LLC’s primary sources of liquidity and capital resources are generated by its operating activities and cash on hand.
Management believes that cash on hand and future funds generated from NCM LLC’s operations should be sufficient to fund working capital requirements, NCM LLC’s debt service requirements, and capital expenditures and other investing requirements, through the next 12 months. Cash flows generated by NCM LLC’s distributions to NCM, Inc. and the founding members can be impacted by the seasonality experienced in advertising revenues at NCM LLC. NCM LLC is required pursuant to terms of the operating agreement effective as of February 13, 2007 to distribute its available cash, as defined in the operating agreement, to its members (the founding members and NCM, Inc.). The available cash distribution to the members of NCM LLC for the year ended December 31, 2009 was $139.3 million, of which $57.8 million was NCM, Inc.’s portion. NCM, Inc. will use cash received from the available cash distributions to fund income taxes, payments associated with the tax sharing agreement with the founding members and current and future dividends as declared by the board of directors, including a dividend declared in January 2010 of $0.16 per share (approximately $6.9 million) which will be paid on April 1, 2010. Distributions from NCM LLC and NCM, Inc. cash balances should be sufficient to fund NCM, Inc.’s tax sharing payments to the founding member circuits, income taxes and its regular dividend.
Capital expenditures. Capital expenditures of NCM LLC have typically been related to equipment required for our NOC and content production and post-production facilities, digital content system and “back-office” capitalized software upgrades developed primarily by our programmers, office leasehold improvements, desktop equipment for use by our employees, and in certain cases, the costs necessary to digitize all or a portion of a network affiliate’s theatres when they are added to our network. Capital expenditures for the year ended December 31, 2009 were $8.6 million (including $0.5 million associated with network affiliate additions) compared to $16.7 million (including $5.3 million associated with network affiliate additions) for the 2008 period. The capital expenditures have typically been satisfied through cash flow from operations. All capital expenditures related to the DCN within NCM LLC’s founding members’ theatres have been made by the founding members under the ESAs. We expect they will continue to be made by the founding members in accordance with the ESAs.
We expect to make approximately $8.0 million to $10.0 million of capital expenditures in fiscal 2010, primarily for upgrades to our digital content system, distribution software and our internal management systems, including our advertising inventory optimization, management and reporting systems, our internet site and
53
Table of Contents
network equipment related to newly built network affiliate theatres. We expect these upgrades and improvements to our management reporting systems, which are intended to provide additional advertising scheduling and placement flexibility for our clients, should enhance our operating efficiencies, including allowing us to better manage our advertising inventory, and prepare us for continued growth. Our capital expenditures may be increased should we decide to add any additional network affiliates to our network. We expect that additional expenditures, if any, would be funded in part by additional cash flows associated with those new network affiliates. The commitments associated with our operating lease requirements are included in “Contractual and Other Obligations” below. We also expect 2010 depreciation and amortization to increase over 2009 due to the addition of the future common unit adjustment intangible assets.
Financings
Senior secured credit facility. On February 13, 2007, concurrently with the closing of the IPO of NCM Inc., NCM LLC entered into a senior secured credit facility with a group of lenders. The facility consists of a six-year $80.0 million revolving credit facility and an eight-year, $725.0 million term loan facility. The net proceeds of the term loan were used, together with $59.8 million of proceeds from the offering, to redeem all the preferred membership units of NCM LLC for an aggregate price of $769.5 million. The term loan will be due on the eighth anniversary of the funding. The revolving credit facility portion is available, subject to certain conditions, for general corporate purposes of the Company in the ordinary course of business and for other transactions permitted under the credit agreement, and a portion is available for letters of credit. The obligations under the credit facility are secured by a lien on substantially all of the assets of NCM LLC. The outstanding balance of the term loan facility at December 31, 2009 was $725.0 million. The outstanding balance under the revolving credit facility at December 31, 2009 was $74.0 million. As of December 31, 2009, the effective rate on the term loan was 5.59% including the effect of the interest rate swaps (both those accounted for as hedges and those not). The interest rate swaps hedged $550.0 million of the $725.0 million term loan at a fixed interest rate of 6.734% while the unhedged portion was at an interest rate of 2.01%. The weighted-average interest rate on the unhedged revolver was 1.99%. Commencing with the fourth fiscal quarter in fiscal year 2008, the applicable margin for the revolving credit facility will be determined quarterly and will be subject to adjustment based upon a consolidated net senior secured leverage ratio for NCM LLC and its subsidiaries (the ratio of secured funded debt less unrestricted cash and cash equivalents, over a non-GAAP measure defined in the credit agreement which is equivalent to Adjusted OIBDA). The senior secured credit facility also contains a number of covenants and financial ratio requirements, with which the Company was in compliance at December 31, 2009, including the amount of debt that is required to be hedged. The debt covenants require 50% of the term loan, or $362.5 million to be hedged at a fixed rate. As of December 31, 2009, the Company had approximately 76% hedged. Of the $550.0 million that is hedged, $137.5 million was with Lehman Brothers Special Financing (“LBSF”), a subsidiary of Lehman. On February 8, 2010 NCM LLC entered into a Novation Agreement with LBSF and Barclays pursuant to which Barclays took on all the obligations of LBSF with regard to these hedging arrangements, as further described in Note 17 to the consolidated financial statements included elsewhere in this document. The Company expects to remain in compliance with its covenants and financial ratio requirements as set forth in its credit facility for 2010 based on its budgets.
Critical Accounting Policies
The significant accounting policies of NCM LLC are described in Note 1 of the financial statements. Certain accounting policies involve significant judgments, assumptions and estimates by management that have a material impact on the carrying value of certain assets and liabilities, which management considers critical accounting policies. The judgments, assumptions and estimates used by management are based on historical experience, knowledge of the accounts and other factors, which are believed to be reasonable under the circumstances and are evaluated on an ongoing basis. Because of the nature of the judgments and assumptions made by management, actual results could differ from these judgments and estimates, which could have a material impact on the carrying values of assets and liabilities and the results of operations of NCM LLC.
54
Table of Contents
Allowance for doubtful accounts. The allowance for doubtful accounts represents management’s estimate of probable credit losses inherent in its trade receivables, which represent a significant asset on the balance sheet. Estimating the amount of the allowance for doubtful accounts requires significant judgment and the use of estimates related to the amount and timing of estimated losses based on historical loss experience, consideration of current economic trends and conditions and debtor-specific factors, all of which may be susceptible to significant change. Account receivable balances are charged against the allowance, while recoveries of amounts previously charged are credited to the allowance. A provision for bad debt is charged to operations based on management’s periodic evaluation of the factors previously mentioned, as well as other pertinent factors. To the extent actual outcomes differ from management estimates, additional provision for bad debt could be required that could adversely affect earnings or financial position in future periods.
Share-based compensation. The Company’s Equity Incentive Plan is treated as an equity plan under the provisions of ASC Topic 718 Compensation – Stock Compensation (formerly SFAS No. 123(R)), and the determination of fair value of options for accounting purposes requires that management make complex estimates and judgments. We utilize the Black-Scholes option price model to estimate the fair value of our options. This model requires that the Company make estimates of various factors used. The following assumptions were used in the valuation of the options:
| • | Expected life of options— The expected life of the options is determined by using the average of the vesting and contractual terms of the options (the “simplified method” as described in SEC Staff Accounting Bulletin 110). Due to the short length of time over which our options have been outstanding, the Company has not developed a historical option exercise experience and has determined that the simplified method is a reasonable basis to estimate the expected life of the options. |
| • | Risk free interest rate—The risk-free interest rate is determined by using the applicable Treasury rates as of the grant dates, commensurate with the expected terms of the options. |
| • | Expected volatility—NCM closed its IPO on February 13, 2007. Since the length of time our shares have been publicly traded is shorter than the contractual terms of our options, we believe historical volatility may not be completely representative of future stock price trends. As a result, we estimate expected volatility based on comparable companies and industry indexes for historic stock price volatility. Until such time as we have sufficient historical information to derive an implied volatility we expect to continue to use this method as long as we believe such companies are comparable to us. |
| • | Dividend yield—The estimated dividend yield was determined using management’s expectations based on estimated cash flow characteristics and expected long-term dividend policy. |
Income Taxes. We account for income taxes in accordance with ASC Topic 740 – Income Taxes (formerly SFAS No. 109, as clarified by FIN No. 48), which requires an asset and liability approach to financial accounting and reporting for income taxes. Accordingly, deferred tax assets and liabilities arise from the differences between the tax basis of an asset or liability and its reported amount in the consolidated financial statements. Deferred tax amounts are determined using the tax rates expected to be in effect when the taxes will actually be paid or refunds received, as provided under currently enacted tax law. Valuation allowances are to be established when necessary to reduce deferred tax assets to the amount expected to be realized. We currently have a $1.9 million valuation allowance against certain of our deferred tax assets as we believe it is more likely than not that we will not realize such assets in future periods. In addition, due to the basis differences resulting from our IPO date transactions and subsequent adjustments pursuant to the Common Unit Adjustment Agreement, and entry into the tax receivable agreement with our founding members, we are required to make cash payments to the founding members in amounts equal to 90% of our actual tax benefit realized from the tax amortization of the basis difference for certain deferred assets noted above. The requirements of the tax receivable agreement, as amended, are highly technical and complex and involve management’s judgment, including judgments to determine hypothetical taxing outcomes exclusive of the IPO date transaction and agreements. If we were to fail to meet certain of the requirements of the tax receivable agreement, we could be subject to additional payments to taxing authorities or to our founding members.
55
Table of Contents
In addition, we are subject to the examination of our income tax returns by the Internal Revenue Service and other tax authorities. We are subject to examination by tax authorities for years beginning with 2007.
Recent Accounting Pronouncements
For a discussion of the recent accounting pronouncements relevant to our business operations, see the information provided under Note 1 to the consolidated financial statements included elsewhere in this document.
Related-Party Transactions
For a discussion of the related-party transactions, see the information provided under Note 7 to the consolidated financial statements included elsewhere in this document.
Off-Balance Sheet Arrangements
Our operating lease obligations, which primarily include office leases, are not reflected on our balance sheet. See “Contractual and Other Obligations” for further detail. We do not believe these arrangements are material to our current or future financial condition, results of operations, liquidity, capital resources or capital expenditures.
Contractual and Other Obligations
Our contractual obligations at December 31, 2009 were as follows:
| Payments Due by Period | |||||||||||||||
| Total | less than 1 year |
1-3 years | 3-5 years | more than 5 years | |||||||||||
| (in millions) | |||||||||||||||
| Borrowings (1) |
$ | 803.3 | $ | 4.3 | $ | — | $ | 74.0 | $ | 725.0 | |||||
| Future interest on borrowings (2) |
226.4 | 47.6 | 134.9 | 43.9 | — | ||||||||||
| Office leases |
9.2 | 2.2 | 6.0 | 1.0 | — | ||||||||||
| Network affiliate agreements (3) |
21.2 | 7.1 | 12.8 | 1.3 | — | ||||||||||
| Payable to founding members under tax sharing agreement (4) |
139.5 | 17.6 | 31.2 | 31.2 | 59.5 | ||||||||||
| Total contractual cash obligations |
$ | 1,199.6 | $ | 78.8 | $ | 184.9 | $ | 151.4 | $ | 784.5 | |||||
| (1) | In addition, we have a variable rate revolving credit agreement of $74.0 million at December 31, 2009. Debt service requirements under this agreement depend on the amounts borrowed and the level of the base interest rate, in addition to a commitment fee on the unused portion of the revolving credit facility. See further discussion of the secured credit facility under “—Financial Condition and Liquidity-Financings” above. |
| (2) | The amounts of future interest payments in the table above are based on the amount outstanding on the term loan, estimated rates of interest over the term of the variable rate portion and the rates in effect on our interest rate swaps. The terms of the senior secured credit facility required us to hedge the cash flow variability of interest for at least 50% of the term loan. In March of 2007, NCM LLC entered into fixed interest rate swap arrangements hedging $550.0 million ($137.5 million of which was with Lehman and in February 2010 was transferred to Barclays) of the $725.0 million senior secured credit facility at a fixed interest rate of 6.734%. In addition, we have a variable rate revolving credit agreement. Debt service requirements under this agreement depend on the amounts borrowed and the level of the base interest rate, in addition to a commitment fee on the unused portion of the revolving credit facility. See further discussion of the secured credit facility under “—Financial Condition and Liquidity-Financings” above. |
56
Table of Contents
| (3) | The value in this table represents the maximum potential payout. No amounts have ever been paid under these agreements and no liabilities are recorded as of December 31, 2009. For additional details see the information provided under Note 11 to the consolidated financial statements included elsewhere in this document. |
| (4) | The tax receivable agreement entered into at the completion of our IPO provides for the payment by us to the founding members of 90% of the amount of cash savings, if any, in U.S. federal, state and local income tax or franchise tax that we actually realize as a result of certain increases in our proportionate share of tax basis in NCM LLC’s tangible and intangible assets. The payments to the founding members are based, in part, on actual annual income and as such, will vary based on our operating results. The value in the table represents the estimated amounts payable under the tax receivable agreement as of December 31, 2009. |
The amended and restated ESAs entered into at the completion of our IPO require payments based on a combination of founding member attendance and the number of digital screens of each founding member. The amount relating to the attendance factor will vary from quarter to quarter and year to year as theatre attendance varies while the amount relating to the screens factor will be more predictable but will also vary quarter to quarter and year to year as screens are converted to digital screens and other screens are added or removed through acquisition, divestiture or closure activities of the founding members. The payments made to founding members also will vary due to the escalation of the rates paid for each factor pursuant to the amended and restated ESAs. The table above does not include amounts payable under the amended and restated ESAs as they are based on variable factors, which are not capable of precise estimation.
Seasonality
The levels of revenue, operating income, consolidated net income, OIBDA and Adjusted OIBDA are seasonal in nature, coinciding with the timing of marketing expenditures by our advertising clients and to the quarter’s film revenue and related attendance patterns within the film exhibition industry. Advertising expenditures tend to be higher during the second, third, and fourth fiscal quarters and are correlated to new product releases and marketing cycles and higher theatre attendance. Theatrical attendance is generally highest during the summer and year-end holiday season coinciding with the release of blockbuster films. As a result, we typically have less revenue, operating income, consolidated net income, OIBDA and Adjusted OIBDA and our operating margins are lower in the first quarter than the other quarters of a given year. Given this variability, the results of one quarter are not necessarily indicative of results for the next or any future quarter.
| Item 7A. | Quantitative and Qualitative Disclosures About Market Risk |
The primary market risk to which we are exposed is interest rate risk. An increase or decrease in interest rates would affect interest costs relating to the variable portion of our senior secured debt facility, which is not covered under the hedging agreement. We have entered into a fixed interest rate swap arrangements that hedge $550.0 million of the $725.0 million term loan at a fixed interest rate of 6.734%. As of December 31, 2009, there was an aggregate of $175.0 million of variable rate debt outstanding on the term portion of our facility that was not covered by interest rate swaps, and $74.0 million of variable rate debt outstanding on the revolver portion of our facility. A 100 basis point fluctuation in market interest rates would have increased or decreased our interest expense by approximately $2.5 million for an annual period, net of the effect of interest rate swaps. Because each of our interest rate swaps was in a liability position at December 31, 2009, we are not currently exposed to counterparty risk related to the swaps.
| Item 8. | Financial Statements and Supplementary Data |
See Index to Financial Statements and Supplemental Information on page F-1.
| Item 9. | Changes in and Disagreements with Accountants on Accounting and Financial Disclosure |
Not applicable.
57
Table of Contents
| Item 9A. | Controls and Procedures |
Effectiveness of Disclosure Controls and Procedures. We maintain disclosure controls and procedures that are designed to ensure that information required to be disclosed by us in the reports that we file or submit to the SEC under the Exchange Act, as amended, is recorded, processed, summarized and reported within the time periods specified by the Commission’s rules and forms, and that information is accumulated and communicated to our management, including the Chief Executive Officer (principal executive officer) and Chief Financial Officer (principal financial and accounting officer) as appropriate to allow timely decisions regarding required disclosure. As of December 31, 2009, our management evaluated, with the participation of the Chief Executive Officer and Chief Financial Officer, the effectiveness of the Company’s disclosure controls and procedures pursuant to Rules 13a-15(e) and 15d-15(e) of the Exchange Act. Based on that evaluation, the Company’s management concluded that the Company’s disclosure controls and procedures as of December 31, 2009 were effective.
Management’s Annual Report on Internal Control over Financial Reporting. Management is responsible for establishing and maintaining, and has established and maintains, adequate internal control over financial reporting, as such term is defined in Exchange Act Rules 13a-15(f) and 15d-15(f). As of December 31, 2009, our management evaluated, with the participation of the Chief Executive Officer (principal executive officer) and Chief Financial Officer (principal financial and accounting officer), the effectiveness of the Company’s internal control over financial reporting based on the framework in Internal Control — Integrated Framework issued by the Committee of Sponsoring Organizations of the Treadway Commission. Based on that evaluation, the Company’s management concluded that the Company’s internal control over financial reporting as of December 31, 2009 was effective.
Because of its inherent limitations, internal control over financial reporting may not prevent or detect misstatements. Projections of any evaluation of effectiveness to future periods are subject to the risk that controls may become inadequate because of changes in conditions, or that the degree of compliance with the policies or procedures may deteriorate.
The effectiveness of our internal control over financial reporting as of December 31, 2009 has been attested by the Company’s registered public accounting firm, Deloitte & Touche LLP, as stated in its report, which appears herein.
Changes in Internal Control over Financial Reporting. During the quarter ended December 31, 2009, the Company changed its internal controls over financial reporting by developing a formal internal implementation program for all new accounting literature, specifying the steps to be taken and the timeline for completing our analysis of the adoption.
58
Table of Contents
REPORT OF INDEPENDENT REGISTERED PUBLIC ACCOUNTING FIRM
To the Board of Directors and Stockholders of
National CineMedia, Inc.
Centennial, Colorado
We have audited the internal control over financial reporting of National CineMedia, Inc. and subsidiary (the “Company”) as of December 31, 2009, based on criteria established in Internal Control — Integrated Framework issued by the Committee of Sponsoring Organizations of the Treadway Commission. The Company’s management is responsible for maintaining effective internal control over financial reporting and for its assessment of the effectiveness of internal control over financial reporting, included in the accompanying Management’s Annual Report on Internal Control over Financial Reporting. Our responsibility is to express an opinion on the Company’s internal control over financial reporting based on our audit.
We conducted our audit in accordance with the standards of the Public Company Accounting Oversight Board (United States). Those standards require that we plan and perform the audit to obtain reasonable assurance about whether effective internal control over financial reporting was maintained in all material respects. Our audit included obtaining an understanding of internal control over financial reporting, assessing the risk that a material weakness exists, testing and evaluating the design and operating effectiveness of internal control based on the assessed risk, and performing such other procedures as we considered necessary in the circumstances. We believe that our audit provides a reasonable basis for our opinion.
A company’s internal control over financial reporting is a process designed by, or under the supervision of, the company’s principal executive and principal financial officers, or persons performing similar functions, and effected by the company’s board of directors, management, and other personnel to provide reasonable assurance regarding the reliability of financial reporting and the preparation of financial statements for external purposes in accordance with generally accepted accounting principles. A company’s internal control over financial reporting includes those policies and procedures that (1) pertain to the maintenance of records that, in reasonable detail, accurately and fairly reflect the transactions and dispositions of the assets of the company; (2) provide reasonable assurance that transactions are recorded as necessary to permit preparation of financial statements in accordance with generally accepted accounting principles, and that receipts and expenditures of the company are being made only in accordance with authorizations of management and directors of the company; and (3) provide reasonable assurance regarding prevention or timely detection of unauthorized acquisition, use, or disposition of the company’s assets that could have a material effect on the financial statements.
Because of the inherent limitations of internal control over financial reporting, including the possibility of collusion or improper management override of controls, material misstatements due to error or fraud may not be prevented or detected on a timely basis. Also, projections of any evaluation of the effectiveness of the internal control over financial reporting to future periods are subject to the risk that the controls may become inadequate because of changes in conditions, or that the degree of compliance with the policies or procedures may deteriorate.
In our opinion, the Company maintained, in all material respects, effective internal control over financial reporting as of December 31, 2009, based on the criteria established in Internal Control — Integrated Framework issued by the Committee of Sponsoring Organizations of the Treadway Commission.
We have also audited, in accordance with the standards of the Public Company Accounting Oversight Board (United States), the consolidated financial statements as of and for the year ended December 31, 2009 of the Company and our report dated March 9, 2010 expressed an unqualified opinion on those financial statements.
| /s/ Deloitte & Touche LLP |
| Denver, Colorado |
| March 9, 2010 |
59
Table of Contents
| Item 9B. | Other Information |
None.
PART III
| Item 10. | Directors, Executive Officers and Corporate Governance |
For information with respect to our directors, see our definitive Proxy Statement under the heading “Board Composition”, which information is incorporated herein by reference. Information regarding our audit committee financial expert and the members of the audit committee are incorporated in this item by reference from our Proxy Statement under the heading “Meetings of the Board of Directors and Committees.”
The information required in this item regarding our executive officers is set forth in Part I of this Annual Report on Form 10-K under the heading “Executive Officers of the Registrant.”
Information regarding compliance with Section 16(a) of the Exchange Act by our directors and executive officers and holders of ten percent of a registered class of our equity securities is incorporated in this item by reference from our Proxy Statement under the heading “Section 16(a) Beneficial Ownership Reporting Compliance.”
Our Board adopted a Code of Business Conduct and Ethics that applies to all of our employees, including our board of directors, chief executive officer and chief financial officer. The Code of Business Conduct and Ethics sets forth the Company’s conflict of interest policy, records retention policy, insider trading policy and policies for protection of the Company’s property, business opportunities and proprietary information. Our Code of Business Conduct and Ethics is available free of charge on our website at NCM.com under the tab “Investor Relations– Corporate Governance.” We intend to post on our website any amendments to, or waivers from our Code of Business conduct and Ethics applicable to senior financial executives.
| Item 11. | Executive Compensation |
The information required by this item regarding compensation of executive officers and directors is incorporated herein by reference from the Proxy Statement under the heading “Compensation of Executive Officers.”
| Item 12. | Security Ownership of Certain Beneficial Owners and Management and Related Stockholder Matters |
For information with respect to the security ownership of directors, executive officers and holders of more than 5% of a class of our voting securities see the Proxy Statement under the heading “Beneficial Ownership”, which information is incorporated herein by reference.
For equity incentive plan information see the Proxy Statement under the heading “Equity Incentive Plan Information”, which information is incorporated herein by reference.
| Item 13. | Certain Relationships and Related Party Transactions |
For information with respect to certain relationships and related transactions, see the Proxy Statement under the heading “Certain Relationships and Related Party Transactions,” which information is incorporated herein by reference.
| Item 14. | Principal Accounting Fees and Services |
The information required by this item with respect to principal accounting fees and services is incorporated herein by reference from the Proxy Statement under the heading “Fees Paid to Independent Auditors.”
60
Table of Contents
PART IV
| Item 15. | Exhibits and Financial Statement Schedules |
(a) (1) and (a) (2) Financial statements and financial statement schedules
See Index to Financial Statements on page F-1.
(b) Exhibits
See Exhibit Index, beginning on page 63.
(c) Financial Statement Schedules
Financial Statement Schedules not included herein have been omitted because they are either not required, not applicable, or the information is otherwise included herein.
61
Table of Contents
Pursuant to the requirements of Section 13 or 15(d) of the Securities Exchange Act of 1934, the registrant has duly caused this report to be signed on its behalf by the undersigned, thereunto duly authorized.
| NATIONAL CINEMEDIA, INC. | ||||
| (Registrant) | ||||
| Dated: | March 9, 2010 | /S/ KURT C. HALL | ||
| Kurt C. Hall President and Chief Executive Officer (Principal Executive Officer) | ||||
| Dated: | March 9, 2010 | /S/ GARY W. FERRERA | ||
| Gary W. Ferrera Executive Vice President and Chief Financial Officer (Principal Accounting and Financial Officer) | ||||
Pursuant to the requirements of the Securities Exchange Act of 1934, this report has been signed below by the following persons on behalf of the registrant and in the capacities and on the dates indicated.
| Signature |
Title |
Date | ||
| /S/ KURT C. HALL |
President, Chief Executive Officer | March 9, 2010 | ||
| Kurt C. Hall | (Principal Executive Officer) | |||
| /S/ GARY W. FERRERA |
Executive Vice President and Chief Financial Officer | March 9, 2010 | ||
| Gary W. Ferrera | (Principal Accounting and Financial Officer) | |||
| /S/ MICHAEL L. CAMPBELL |
Director | March 9, 2010 | ||
| Michael L. Campbell | ||||
| /S/ LAWRENCE A. GOODMAN |
Director | March 9, 2010 | ||
| Lawrence A. Goodman | ||||
| /S/ DAVID R. HAAS |
Director | March 9, 2010 | ||
| David R. Haas | ||||
| /S/ JAMES R. HOLLAND, JR. |
Director | March 9, 2010 | ||
| James R. Holland, Jr. | ||||
| /S/ STEPHEN L. LANNING |
Director | March 9, 2010 | ||
| Stephen L. Lanning | ||||
| /S/ GERARDO I. LOPEZ |
Director | March 9, 2010 | ||
| Gerardo I. Lopez | ||||
| /S/ EDWARD H. MEYER |
Director | March 9, 2010 | ||
| Edward H. Meyer | ||||
| /S/ LEE ROY MITCHELL |
Director | March 9, 2010 | ||
| Lee Roy Mitchell | ||||
| /S/ SCOTT N. SCHNEIDER |
Director | March 9, 2010 | ||
| Scott N. Schneider | ||||
62
Table of Contents
INDEX TO EXHIBITS
| Exhibit |
Reference |
Description | ||
| 3.1 | (1) | Amended and Restated Certificate of Incorporation. | ||
| 3.2 | (2) | Amended and Restated Bylaws. | ||
| 10.1 | (3) | National CineMedia, LLC Third Amended and Restated Limited Liability Company Operating Agreement dated as of February 13, 2007, by and among American Multi-Cinema, Inc., Cinemark Media, Inc., Regal CineMedia Holdings, LLC and National CineMedia, Inc. | ||
| 10.1.1 | (24) | First Amendment to Third Amended and Restated Limited Liability Company Operating Agreement of National CineMedia, LLC dated as of March 16, 2009, by and among American Multi-Cinema, Inc., Cinemark Media, Inc., Regal CineMedia Holdings, LLC and National CineMedia, Inc. | ||
| 10.2 | (3) | Exhibitor Services Agreement dated as of February 13, 2007, by and between National CineMedia, Inc. and American Multi-Cinema, Inc. (Confidential treatment granted as to certain portions, which portions were omitted and filed separately with the Commission.) | ||
| 10.2.1 | (20) | Amendment to Exhibitor Services Agreement dated as of November 5, 2008, by and between National CineMedia LLC and American Multi-Cinema, Inc. (Confidential treatment granted as to certain portions, which portions were omitted and filed separately with the Commission.) | ||
| 10.3 | (3) | Exhibitor Services Agreement dated as of February 13, 2007, by and between National CineMedia, Inc. and Cinemark USA, Inc. (Confidential treatment granted as to certain portions, which portions were omitted and filed separately with the Commission.) | ||
| 10.3.1 | (21) | Amendment to Exhibitor Services Agreement dated as of November 5, 2008, by and between National CineMedia LLC and Cinemark USA, Inc. (Confidential treatment granted as to certain portions, which portions were omitted and filed separately with the Commission.) | ||
| 10.4 | (3) | Exhibitor Services Agreement dated as of February 13, 2007, by and between National CineMedia, Inc. and Regal Cinemas, Inc. (Confidential treatment granted as to certain portions, which portions were omitted and filed separately with the Commission.) | ||
| 10.4.1 | (22) | Amendment to Exhibitor Services Agreement dated as of November 5, 2008, by and between National CineMedia LLC and Regal Cinemas, Inc. (Confidential treatment granted as to certain portions, which portions were omitted and filed separately with the Commission.) | ||
| 10.5 | (3) | ESA Payment Letter dated as of February 13, 2007, by and among National CineMedia, Inc., American Multi-Cinema, Inc., Cinemark USA, Inc. and Regal Cinemas, Inc. | ||
| 10.6 | (3) | Common Unit Adjustment Agreement dated as of February 13, 2007, by and among National CineMedia, Inc., National CineMedia, LLC, Regal CineMedia Holdings, LLC, American Multi-Cinema, Inc., Cinemark Media, Inc, Regal Cinemas, Inc. and Cinemark USA, Inc. (Confidential treatment granted as to certain portions, which portions were omitted and filed separately with the Commission.) | ||
| 10.7 | (3) | Tax Receivable Agreement dated as of February 13, 2007, by and among National CineMedia, Inc., National CineMedia, LLC, Regal CineMedia Holdings, LLC, Cinemark Media, Inc., Regal Cinemas, Inc., American Multi-Cinema, Inc. and Cinemark USA, Inc. | ||
63
Table of Contents
| Exhibit |
Reference |
Description | ||
| 10.7.1 | (19) | Second Amendment to Tax Receivable Agreement dated as of April 29, 2008, by and among National CineMedia, Inc., National CineMedia, LLC, Regal CineMedia Holdings, LLC, Cinemark Media, Inc., Regal Cinemas, Inc., American Multi-Cinema, Inc. and Cinemark USA, Inc. | ||
| 10.8 | (3) | First Amended and Restated Loews Screen Integration Agreement by and between National CineMedia, LLC and American Multi-Cinema, Inc. (Confidential treatment granted as to certain portions, which portions were omitted and filed separately with the Commission.) | ||
| 10.9 | (3) | Second Amended and Restated Software License Agreement dated as of February 13, 2007, by and among American Multi-Cinema, Inc., Regal CineMedia Corporation, Cinemark USA, Inc., Digital Cinema Implementation Partners, LLC and National CineMedia, LLC. | ||
| 10.10 | (3) | Director Designation Agreement dated as of February 13, 2007, by and among National CineMedia, Inc., American Multi-Cinema, Inc., Cinemark Media, Inc. and Regal CineMedia Holdings, LLC. | ||
| 10.11 | (3) | Registration Rights Agreement dated as of February 13, 2007, by and among National CineMedia, Inc., American Multi-Cinema, Inc., Regal CineMedia Holdings, LLC and Cinemark Media, Inc. | ||
| 10.12 | (3) | Management Services Agreement dated as of February 13, 2007, by and among National CineMedia, Inc. and National CineMedia, LLC. | ||
| 10.13 | (3) | $805,000,000 Credit Agreement dated as of February 13, 2007, by and among National CineMedia, LLC, as borrower; the Lenders (as defined therein; Lehman Brothers Inc. and J.P. Morgan Securities, Inc., as arrangers; JPMorgan Chase Bank, N.A., as syndication agent; Credit Suisse (USA) LLC and Morgan Stanley Senior Funding, Inc., as co-documentation agents; and Lehman Commercial Paper Inc., as administrative agent (including forms of Term Note, Revolving Credit Note and Swing Line Note). | ||
| 10.14 | (3) | Employment Agreement dated as of February 13, 2007, by and among National CineMedia, Inc., National CineMedia, LLC and Kurt C. Hall. + | ||
| 10.14.1 | (23) | First Amendment to Employment Agreement effective as of January 1, 2009, by and among National CineMedia, Inc., National CineMedia, LLC and Kurt C. Hall. + | ||
| 10.15 | (3) | Employment Agreement dated as of February 13, 2007, by and among National CineMedia, Inc., National CineMedia, LLC and Clifford E. Marks. + | ||
| 10.15.1 | (23) | First Amendment to Employment Agreement effective as of January 1, 2009, by and among National CineMedia, Inc., National CineMedia, LLC and Clifford E. Marks. + | ||
| 10.16 | (3) | Employment Agreement dated as of February 13, 2007, by and among National CineMedia, Inc., National CineMedia, LLC and Gary W. Ferrera. + | ||
| 10.16.1 | (23) | First Amendment to Employment Agreement effective as of January 1, 2009, by and among National CineMedia, Inc., National CineMedia, LLC and Gary W. Ferrera. + | ||
| 10.17.2 | (27) | Separation Agreement and Release and Consulting Agreement dated as of December 2, 2009 by and among National CineMedia, Inc., National CineMedia, LLC and Thomas C. Galley. + | ||
| 10.18 | (3) | Employment Agreement dated as of February 13, 2007, by and among National CineMedia, Inc., National CineMedia, LLC and Ralph E. Hardy. + | ||
64
Table of Contents
| Exhibit |
Reference |
Description | ||
| 10.18.1 | (23) | First Amendment to Employment Agreement effective as of January 1, 2009, by and among National CineMedia, Inc., National CineMedia, LLC and Ralph E. Hardy. + | ||
| 10.19 | (4) | National CineMedia, Inc. 2007 Equity Incentive Plan. + | ||
| 10.19.1 | (23) | First Amendment to National CineMedia, Inc. 2007 Equity Incentive Plan. + | ||
| 10.19.2 | (25) | Second Amendment to National CineMedia, Inc. 2007 Equity Incentive Plan. + | ||
| 10.20 | (5) | Form of Option Substitution Award. + | ||
| 10.21 | (6) | Form of Restricted Stock Substitution Award. + | ||
| 10.22 | (7) | Form of Stock Option Agreement. + | ||
| 10.22.1 | (23) | Form of 2009 Stock Option Agreement. + | ||
| 10.22.2 | * | Form of 2010 Stock Option Agreement. + | ||
| 10.23 | (8) | Form of Restricted Stock Agreement. + | ||
| 10.23.1 | (23) | Form of 2009 Restricted Stock Agreement. + | ||
| 10.23.2 | * | Form of 2010 Restricted Stock Agreement. + | ||
| 10.24 | (9) | Confirmation of Swap, dated as of June 12, 2007, between National CineMedia, LLC and Morgan Stanley Capital Services Inc. | ||
| 10.25 | (10) | ISDA Master Agreement dated as of March 2, 2007, between National CineMedia, LLC and Morgan Stanley Capital Services and Schedule. | ||
| 10.26 | (11) | National CineMedia, Inc. Executive Officer 2007 Performance Bonus Plan + | ||
| 10.27 | (12) | Confirmation of Swap, dated as of July 25, 2007, between National CineMedia, LLC and Credit Suisse International. | ||
| 10.28 | (13) | ISDA Master Agreement dated as of March 2, 2007, between National CineMedia, LLC and Credit Suisse International and Schedule. | ||
| 10.29 | (14) | Confirmation of Swap, dated as of August 6, 2007, between National CineMedia, LLC and JPMorgan Chase Bank, N.A. | ||
| 10.30 | (15) | ISDA Master Agreement dated as of August 6, 2007, between National CineMedia, LLC and JPMorgan Chase Bank, N.A. | ||
| 10.32 | (17) | ISDA Master Agreement dated as of September 14, 2007, between National CineMedia, LLC and Lehman Brothers Special Financing, Inc. | ||
| 10.34 | (23) | Form of Restricted Stock Unit Agreement. + | ||
| 10.35 | (26) | National CineMedia, Inc. 2009 Performance Bonus Plan + | ||
| 10.36 | * | ISDA Novation Agreement dated as of February 4, 2010, between National CineMedia, LLC, Lehman Brothers Special Financing Inc. and Barclays Bank PLC. | ||
| 10.37 | * | Confirmation of Swap, dated as of February 16, 2010, between National CineMedia, LLC and Barclays Bank PLC. | ||
| 21.1 | * | List of Subsidiaries. | ||
65
Table of Contents
| Exhibit |
Reference |
Description | ||
| 23.1 | * | Consent of Deloitte & Touche LLP. | ||
| 31.1 | * | Rule 13a-14(a) Certification of Chief Executive Officer | ||
| 31.2 | * | Rule 13a-14(a) Certification of Chief Financial Officer | ||
| 32.1 | ** | Certification of Chief Executive Officer Pursuant to 18 U.S.C. Section 1350 | ||
| 32.2 | ** | Certification of Chief Financial Officer Pursuant to 18 U.S.C. Section 1350 | ||
| 99.1 | (23) | The audited financial statements of National CineMedia, LLC as of and for the year ended January 1, 2009 (and comparative periods). | ||
| 99.1.1 | * | The audited financial statements of National CineMedia, LLC as of and for the year ended December 31, 2009 (and comparative periods). | ||
| * | Filed herewith. |
| ** | Furnished herewith. |
| + | Management contract. |
| (1) | Incorporated by reference to Exhibit 4.1 from the Registrant’s Registration Statement on Form S-8 (File No. 333-140652) filed on February 13, 2007. |
| (2) | Incorporated by reference to Exhibit 4.2 from the Registrant’s Registration Statement on Form S-8 (File No. 333-140652) filed on February 13, 2007. |
| (3) | Incorporated by reference to Exhibits of the same number from the Registrant’s Current Report on Form 8-K (File No. 001-33296) filed on February 16, 2007. |
| (4) | Incorporated by reference to Exhibit 4.3 from the Registrant’s Registration Statement on Form S-8 (File No. 333-140652) filed on February 13, 2007. |
| (5) | Incorporated by reference to Exhibit 4.4 from the Registrant’s Registration Statement on Form S-8 (File No. 333-140652) filed on February 13, 2007. |
| (6) | Incorporated by reference to Exhibit 4.5 from the Registrant’s Registration Statement on Form S-8 (File No. 333-140652) filed on February 13, 2007. |
| (7) | Incorporated by reference to Exhibit 4.6 from the Registrant’s Registration Statement on Form S-8 (File No. 333-140652) filed on February 13, 2007. |
| (8) | Incorporated by reference to Exhibit 4.7 from the Registrant’s Registration Statement on Form S-8 (File No. 333-140652) filed on February 13, 2007. |
| (9) | Incorporated by reference to Exhibit 10.1 from the Registrant’s Quarterly Report on Form 10-Q (File No. 001-33296) filed on August 10, 2007. |
| (10) | Incorporated by reference to Exhibit 10.2 from the Registrant’s Quarterly Report on Form 10-Q (File No. 001-33296) filed on August 10, 2007. |
| (11) | Incorporated by reference to Exhibit 10.1 from the Registrant’s Current Report on Form 8-K (File No. 001-33296) filed on August 30, 2007. |
| (12) | Incorporated by reference to Exhibit 10.1 from the Registrant’s Quarterly Report on Form 10-Q (File No. 001-33296) filed on November 9, 2007. |
| (13) | Incorporated by reference to Exhibit 10.2 from the Registrant’s Quarterly Report on Form 10-Q (File No. 001-33296) filed on November 9, 2007. |
| (14) | Incorporated by reference to Exhibit 10.3 from the Registrant’s Quarterly Report on Form 10-Q (File No. 001-33296) filed on November 9, 2007. |
| (15) | Incorporated by reference to Exhibit 10.4 from the Registrant’s Quarterly Report on Form 10-Q (File No. 001-33296) filed on November 9, 2007. |
66
Table of Contents
| (16) | Incorporated by reference to Exhibit 10.5 from the Registrant’s Quarterly Report on Form 10-Q (File No. 001-33296) filed on November 9, 2007. |
| (17) | Incorporated by reference to Exhibit 10.6 from the Registrant’s Quarterly Report on Form 10-Q (File No. 001-33296) filed on November 9, 2007. |
| (18) | Incorporated by reference to Appendix B from the Registrant’s Definitive Proxy Statement on Form Def 14-A (File No. 001-33296) filed on March 28, 2008. |
| (19) | Incorporated by reference to Exhibit 10.1 from the Registrant’s Current Report on Form 8-K (File No. 001-33296) filed on May 5, 2008. |
| (20) | Incorporated by reference to Exhibit 10.1 from the Registrant’s Current Report on Form 8-K (File No. 001-33296) filed on November 6, 2008. |
| (21) | Incorporated by reference to Exhibit 10.2 from the Registrant’s Current Report on Form 8-K (File No. 001-33296) filed on November 6, 2008. |
| (22) | Incorporated by reference to Exhibit 10.3 from the Registrant’s Current Report on Form 8-K (File No. 001-33296) filed on November 6, 2008. |
| (23) | Incorporated by reference to Exhibits of the same number from the Registrant’s Annual Report on Form 10-K (File No. 001-33296) filed on March 6, 2009. |
| (24) | Incorporated by reference to Exhibit 10.1.1 from the Registrant’s Quarterly Report on Form 10-Q (File No. 001-33296) filed on August 7, 2009. |
| (25) | Incorporated by reference to Appendix B from the Registrant’s Definitive Proxy Statement on Form Def 14-A (File No. 001-33296) filed on March 19, 2009. |
| (26) | Incorporated by reference to Appendix A from the Registrant’s Definitive Proxy Statement on Form Def 14-A (File No. 001-33296) filed on March 19, 2009. |
| (27) | Incorporated by reference to Exhibit 10.1 from the Registrant’s Current Report on Form 8-K (File No. 001-33296) filed on December 21, 2009. |
67
Table of Contents
INDEX TO FINANCIAL STATEMENTS
| Page | ||
| National CineMedia, Inc. and Subsidiary |
||
| F-2 | ||
| F-3 | ||
| F-4 | ||
| F-5 | ||
| F-6 | ||
| F-7 | ||
| F-9 | ||
F-1
Table of Contents
REPORT OF INDEPENDENT REGISTERED PUBLIC ACCOUNTING FIRM
To the Board of Directors and Stockholders of
National CineMedia, Inc.
Centennial, Colorado
We have audited the accompanying consolidated balance sheets of National CineMedia, Inc. and subsidiary as of December 31, 2009 and January 1, 2009 and the related statements of operations, equity / (deficit) and comprehensive income and cash flows for the years ended December 31, 2009 and January 1, 2009 and for the period February 13, 2007 through December 27, 2007 and the statements of operations, members’ equity / (deficit) and comprehensive income and cash flows for National CineMedia, LLC for the period December 29, 2006 through February 12, 2007 (National CineMedia, Inc. and National CineMedia, LLC are collectively referred to as the “Company”). These financial statements are the responsibility of the Company’s management. Our responsibility is to express an opinion on the financial statements based on our audits.
We conducted our audits in accordance with the standards of the Public Company Accounting Oversight Board (United States). Those standards require that we plan and perform the audit to obtain reasonable assurance about whether the financial statements are free of material misstatement. An audit includes examining, on a test basis, evidence supporting the amounts and disclosures in the financial statements. An audit also includes assessing the accounting principles used and significant estimates made by management, as well as evaluating the overall financial statement presentation. We believe that our audits provide a reasonable basis for our opinion.
In our opinion, such consolidated financial statements present fairly, in all material respects, the financial position of National CineMedia, Inc. and subsidiary as of December 31, 2009 and January 1, 2009 and the results of their operations and their cash flows for the years ended December 31, 2009 and January 1, 2009 and for the period February 13, 2007 through December 27, 2007 and for National CineMedia, LLC results of its operations and its cash flows for the period December 29, 2006 through February 12, 2007, in conformity with accounting principles generally accepted in the United States of America.
We have also audited, in accordance with the standards of the Public Company Accounting Oversight Board (United States), the Company’s internal control over financial reporting as of December 31, 2009, based on the criteria established in Internal Control—Integrated Framework issued by the Committee of Sponsoring Organizations of the Treadway Commission and our report dated March 9, 2010 expressed an unqualified opinion on the Company’s internal control over financial reporting.
/s/ Deloitte & Touche LLP
Denver, Colorado
March 9, 2010
F-2
Table of Contents
NATIONAL CINEMEDIA, INC. AND SUBSIDIARY
CONSOLIDATED BALANCE SHEETS
(In millions, except share and per share data)
| December 31, 2009 | January 1, 2009 | |||||||
| ASSETS |
||||||||
| CURRENT ASSETS: |
||||||||
| Cash and cash equivalents |
$ | 91.1 | $ | 69.2 | ||||
| Receivables, net of allowance of $3.6 and $2.6 million, respectively |
89.3 | 92.2 | ||||||
| Prepaid expenses |
1.6 | 1.6 | ||||||
| Income taxes receivable |
— | 3.6 | ||||||
| Other current assets |
3.0 | 0.8 | ||||||
| Total current assets |
185.0 | 167.4 | ||||||
| PROPERTY AND EQUIPMENT, net of accumulated depreciation of $39.3 and $27.0 million, respectively |
23.7 | 28.0 | ||||||
| INTANGIBLE ASSETS, net of accumulated amortization of $4.4 and $1.5 million, respectively |
134.2 | 111.8 | ||||||
| OTHER ASSETS: |
||||||||
| Deferred tax assets, net of valuation allowance of $1.9 and $2.0 million, respectively |
267.7 | 290.4 | ||||||
| Debt issuance costs, net |
9.2 | 11.1 | ||||||
| Equity method investment |
7.4 | — | ||||||
| Other long-term assets |
1.0 | 0.9 | ||||||
| Total other assets |
285.3 | 302.4 | ||||||
| TOTAL |
$ | 628.2 | $ | 609.6 | ||||
| LIABILITIES AND EQUITY/(DEFICIT) |
||||||||
| CURRENT LIABILITIES: |
||||||||
| Amounts due to founding members |
29.8 | 25.6 | ||||||
| Payable to founding members under tax sharing agreement |
17.6 | 17.0 | ||||||
| Accrued expenses |
12.9 | 6.7 | ||||||
| Income tax payable |
3.8 | — | ||||||
| Current portion of long-term debt |
4.3 | — | ||||||
| Accrued payroll and related expenses |
9.3 | 7.5 | ||||||
| Accounts payable |
11.7 | 11.3 | ||||||
| Deferred revenue and other current liabilities |
2.8 | 3.6 | ||||||
| Total current liabilities |
92.2 | 71.7 | ||||||
| OTHER LIABILITIES: |
||||||||
| Borrowings |
799.0 | 799.0 | ||||||
| Deferred tax liability |
53.3 | 54.1 | ||||||
| Payable to founding members under tax sharing agreement |
121.9 | 118.9 | ||||||
| Interest rate swap agreements |
54.6 | 87.7 | ||||||
| Other long-term liabilities |
0.3 | 4.5 | ||||||
| Total other liabilities |
1,029.1 | 1,064.2 | ||||||
| Total liabilities |
1,121.3 | 1,135.9 | ||||||
| COMMITMENTS AND CONTINGENCIES (NOTE 11) |
||||||||
| EQUITY/(DEFICIT): |
||||||||
| NCM, Inc. Stockholders’ Equity: |
||||||||
| Preferred stock, $0.01 par value; 10,000,000 shares authorized, none issued and outstanding, respectively |
— | — | ||||||
| Common stock, $0.01 par value; 120,000,000 shares authorized, 42,121,747 and 42,109,966 issued and outstanding, respectively |
0.4 | 0.4 | ||||||
| Additional paid in capital (deficit) |
(490.2 | ) | (494.9 | ) | ||||
| Accumulated other comprehensive loss |
(11.8 | ) | (18.7 | ) | ||||
| Retained earnings (distributions in excess of earnings) |
(14.5 | ) | (13.1 | ) | ||||
| Total NCM, Inc. stockholders’ equity/(deficit) |
(516.1 | ) | (526.3 | ) | ||||
| Noncontrolling interests |
23.0 | — | ||||||
| Total equity/(deficit) |
(493.1 | ) | (526.3 | ) | ||||
| TOTAL |
$ | 628.2 | $ | 609.6 | ||||
See accompanying notes to consolidated financial statements.
F-3
Table of Contents
NATIONAL CINEMEDIA, INC. AND SUBSIDIARY
CONSOLIDATED STATEMENTS OF OPERATIONS
(In millions, except share and per share data)
| Year Ended December 31, 2009 |
Year Ended January 1, 2009 |
Period February 13, 2007 through December 27, 2007 |
Period December 29, 2006 through February 12, 2007 |
|||||||||||||||
| REVENUE: |
||||||||||||||||||
| Advertising (including revenue from founding members of $36.3, $43.3, $40.9 and $0.0 million, respectively) |
$ | 335.1 | $ | 330.3 | $ | 282.7 | $ | 20.6 | ||||||||||
| Administrative fees—founding members |
— | — | — | 0.1 | ||||||||||||||
| Fathom Events |
45.5 | 38.9 | 25.4 | 2.9 | ||||||||||||||
| Other |
0.1 | 0.3 | 0.2 | — | ||||||||||||||
| Total |
380.7 | 369.5 | 308.3 | 23.6 | ||||||||||||||
| OPERATING EXPENSES: |
||||||||||||||||||
| Advertising operating costs |
20.0 | 18.7 | 9.1 | 1.1 | ||||||||||||||
| Fathom Events operating costs |
29.1 | 25.1 | 15.4 | 1.4 | ||||||||||||||
| Network costs |
18.6 | 17.0 | 13.3 | 1.7 | ||||||||||||||
| Theatre access fees/circuit share costs—founding members |
52.7 | 49.8 | 41.5 | 14.4 | ||||||||||||||
| Selling and marketing costs |
50.2 | 47.9 | 40.9 | 5.2 | ||||||||||||||
| Administrative and other costs |
26.3 | 24.9 | 20.1 | 2.8 | ||||||||||||||
| Severance plan costs |
— | 0.5 | 1.5 | 0.4 | ||||||||||||||
| Depreciation and amortization |
15.6 | 12.4 | 5.0 | 0.7 | ||||||||||||||
| Total |
212.5 | 196.3 | 146.8 | 27.7 | ||||||||||||||
| OPERATING INCOME (LOSS) |
168.2 | 173.2 | 161.5 | (4.1 | ) | |||||||||||||
| Interest Expense and Other, Net: |
||||||||||||||||||
| Borrowings |
47.1 | 51.8 | 48.0 | 0.1 | ||||||||||||||
| Change in derivative fair value |
(7.0 | ) | 14.2 | — | — | |||||||||||||
| Accretion of interest on the discounted payable to founding members under tax sharing agreement |
11.8 | 12.0 | 9.9 | — | ||||||||||||||
| Interest income and other |
(2.4 | ) | (1.0 | ) | (0.7 | ) | — | |||||||||||
| Total |
49.5 | 77.0 | 57.2 | 0.1 | ||||||||||||||
| Impairment and related loss |
— | 11.5 | — | — | ||||||||||||||
| INCOME (LOSS) BEFORE INCOME TAXES |
118.7 | 84.7 | 104.3 | (4.2 | ) | |||||||||||||
| Provision for Income Taxes |
16.6 | 13.7 | 16.4 | — | ||||||||||||||
| Equity loss from investment, net |
0.8 | — | — | — | ||||||||||||||
| CONSOLIDATED NET INCOME (LOSS) |
101.3 | 71.0 | 87.9 | (4.2 | ) | |||||||||||||
| Less: Net Income Attributable to Noncontrolling Interests |
75.2 | 55.1 | 63.1 | — | ||||||||||||||
| Less: Distributions to Noncontrolling Interest in Excess of Proportionate Share of Earnings |
— | 14.9 | — | — | ||||||||||||||
| NET INCOME (LOSS) ATTRIBUTABLE TO NCM, INC |
$ | 26.1 | $ | 1.0 | $ | 24.8 | $ | (4.2 | ) | |||||||||
| EARNINGS PER NCM, INC. COMMON SHARE: |
||||||||||||||||||
| Basic |
$ | 0.62 | $ | 0.02 | $ | 0.59 | ||||||||||||
| Diluted |
$ | 0.62 | $ | 0.02 | $ | 0.59 | ||||||||||||
| WEIGHTED AVERAGE SHARES OUTSTANDING: |
||||||||||||||||||
| Basic |
42,118,639 | 42,040,879 | 42,000,000 | |||||||||||||||
| Diluted |
42,403,135 | 42,041,305 | 42,182,811 | |||||||||||||||
See accompanying notes to consolidated financial statements.
F-4
Table of Contents
NATIONAL CINEMEDIA, INC. AND SUBSIDIARY
CONSOLIDATED STATEMENTS OF EQUITY/(DEFICIT) AND COMPREHENSIVE INCOME
(In millions, except share data)
| Consolidated | NCM, Inc. | Noncontrolling Interest |
|||||||||||||||||||||||
| Class A Common Stock |
|||||||||||||||||||||||||
| Additional Paid in Capital (Deficit) |
Retained Earnings (Distrib. in Excess of Earnings) |
Accum. Other Comprehensive Income (Loss) |
|||||||||||||||||||||||
| Shares | Amount | ||||||||||||||||||||||||
| Balance— January 1, 2009 |
$ | (526.3 | ) | 42,109,966 | $ | 0.4 | $ | (494.9 | ) | $ | (13.1 | ) | $ | (18.7 | ) | $ | — | ||||||||
| Distributions to Members |
(81.6 | ) | — | — | — | — | — | (81.6 | ) | ||||||||||||||||
| Subsidiary equity issued for purchase of intangible asset |
28.5 | — | — | 11.8 | — | — | 16.7 | ||||||||||||||||||
| Impacts of subsidiary ownership changes |
(14.7 | ) | — | — | (11.4 | ) | — | 0.4 | (3.7 | ) | |||||||||||||||
| Comprehensive Income (loss): |
|||||||||||||||||||||||||
| Unrealized gain on cash flow hedge, net of tax |
21.7 | — | — | — | — | 6.5 | 15.2 | ||||||||||||||||||
| Net income (loss), net of tax |
101.3 | — | — | — | 26.1 | — | 75.2 | ||||||||||||||||||
| Total Comprehensive Income, net of tax |
123.0 | 26.1 | 6.5 | 90.4 | |||||||||||||||||||||
| Share-based compensation |
5.5 | 11,781 | — | 4.3 | — | — | 1.2 | ||||||||||||||||||
| Cash dividends declared $0.64 per share |
(27.5 | ) | — | — | — | (27.5 | ) | — | — | ||||||||||||||||
| Balance—December 31, 2009 |
$ | (493.1 | ) | 42,121,747 | $ | 0.4 | $ | (490.2 | ) | $ | (14.5 | ) | $ | (11.8 | ) | $ | 23.0 | ||||||||
| Balance — December 27, 2007 |
$ | (572.4 | ) | 42,000,000 | $ | 0.4 | $ | (581.1 | ) | $ | 12.2 | $ | (3.9 | ) | $ | — | |||||||||
| Distributions to Members |
(75.5 | ) | — | — | — | — | — | (75.5 | ) | ||||||||||||||||
| Contributions from Members |
5.2 | — | — | — | — | — | 5.2 | ||||||||||||||||||
| Subsidiary equity issued for purchase of intangible asset |
116.1 | — | — | 49.2 | — | — | 66.9 | ||||||||||||||||||
| Impacts of subsidiary ownership changes |
1.1 | — | — | (0.2 | ) | — | 0.2 | 1.1 | |||||||||||||||||
| Comprehensive Income (loss): |
|||||||||||||||||||||||||
| Unrealized (loss) on cash flow hedge, net of tax |
(49.1 | ) | — | — | — | — | (15.0 | ) | (34.1 | ) | |||||||||||||||
| Net income (loss), net of tax |
71.0 | — | — | — | 1.0 | — | 70.0 | ||||||||||||||||||
| Total Comprehensive Income, net of tax |
21.9 | 1.0 | (15.0 | ) | 35.9 | ||||||||||||||||||||
| Share-based compensation |
3.6 | 109,966 | — | 3.0 | — | — | 0.6 | ||||||||||||||||||
| Cash dividends declared $0.63 per share |
(26.3 | ) | — | — | — | (26.3 | ) | — | — | ||||||||||||||||
| Recovery of Deficit in Noncontrolling Interest |
— | — | — | 34.2 | — | — | (34.2 | ) | |||||||||||||||||
| Balance—January 1, 2009 |
$ | (526.3 | ) | 42,109,966 | $ | 0.4 | $ | (494.9 | ) | $ | (13.1 | ) | $ | (18.7 | ) | $ | — | ||||||||
(continued)
F-5
Table of Contents
NATIONAL CINEMEDIA, INC. AND SUBSIDIARY
CONSOLIDATED STATEMENTS OF EQUITY/(DEFICIT) AND COMPREHENSIVE INCOME
(In millions, except share data)
| Consolidated | NCM, Inc. | Noncontrolling Interest |
|||||||||||||||||||||||
| Class A Common Stock |
|||||||||||||||||||||||||
| Additional Paid in Capital (Deficit) |
Retained Earnings (Distrib. in Excess of Earnings) |
Accum. Other Comprehensive Income (Loss) |
|||||||||||||||||||||||
| Shares | Amount | ||||||||||||||||||||||||
| Balance—February 13, 2007 |
$ | — | — | $ | — | $ | — | $ | — | $ | — | $ | — | ||||||||||||
| Issuance of common stock |
826.2 | 42,000,000 | 0.4 | 825.8 | — | — | — | ||||||||||||||||||
| NCM, Inc. investment in subsidiary |
— | — | — | (824.6 | ) | — | — | 824.6 | |||||||||||||||||
| IPO date transactions |
(1,411.7 | ) | — | — | 120.4 | — | — | (1,532.1 | ) | ||||||||||||||||
| Reclass deficit in noncontrolling interest to NCM, Inc. |
— | — | — | (707.5 | ) | — | — | 707.5 | |||||||||||||||||
| Balance—IPO |
$ | (585.5 | ) | 42,000,000 | 0.4 | (585.9 | ) | — | — | — | |||||||||||||||
| Distributions to Members |
(65.8 | ) | — | — | — | — | — | (65.8 | ) | ||||||||||||||||
| Contributions from Members |
12.5 | — | — | — | — | — | 12.5 | ||||||||||||||||||
| Impacts of subsidiary ownership changes |
(0.1 | ) | — | — | — | — | — | (0.1 | ) | ||||||||||||||||
| Comprehensive Income (loss): |
|||||||||||||||||||||||||
| Unrealized (loss) on cash flow hedge, net of tax |
(11.9 | ) | — | — | — | — | (3.9 | ) | (8.0 | ) | |||||||||||||||
| Net income (loss), net of tax |
87.9 | — | — | — | 24.8 | — | 63.1 | ||||||||||||||||||
| Total Comprehensive Income, net of tax |
76.0 | 24.8 | (3.9 | ) | 55.1 | ||||||||||||||||||||
| Share-based compensation |
3.1 | — | — | 2.5 | — | — | 0.6 | ||||||||||||||||||
| Cash dividends declared $0.45 per share |
(12.6 | ) | — | — | — | (12.6 | ) | — | — | ||||||||||||||||
| Recovery of Deficit in Noncontrolling Interest |
— | — | — | 2.3 | — | — | (2.3 | ) | |||||||||||||||||
| Balance—December 27, 2007 |
$ | (572.4 | ) | 42,000,000 | $ | 0.4 | $ | (581.1 | ) | $ | 12.2 | $ | (3.9 | ) | $ | — | |||||||||
| Class A Common Stock |
Additional Paid in Capital (Deficit) |
Retained Earnings |
Accum. Other Comprehensive Income (Loss) |
Total | ||||||||||
| Shares | Amount | |||||||||||||
| Members’ Equity/(Deficit) | ||||||||||||||
| Balance—December 28, 2006 |
3.5 | |||||||||||||
| Contribution of Severance Plan payments |
0.4 | |||||||||||||
| Net loss |
(4.2 | ) | ||||||||||||
| Balance—February 12, 2007 |
$ | (0.3 | ) | |||||||||||
See accompanying notes to consolidated financial statements.
F-6
Table of Contents
NATIONAL CINEMEDIA, INC. AND SUBSIDIARY
CONSOLIDATED STATEMENTS OF CASH FLOWS
(In millions)
| Year Ended December 31, 2009 |
Year Ended January 1, 2009 |
Period February 13, 2007 through December 27, 2007 |
Period December 29, 2006 through February 12, 2007 |
|||||||||||||||
| CASH FLOWS FROM OPERATING ACTIVITIES: |
||||||||||||||||||
| Consolidated net income (loss) |
$ | 101.3 | $ | 71.0 | $ | 87.9 | $ | (4.2 | ) | |||||||||
| Adjustments to reconcile consolidated net income (loss) to net cash provided by (used in) operating activities: |
||||||||||||||||||
| Deferred income tax expense |
13.3 | 8.2 | 9.7 | — | ||||||||||||||
| Depreciation and amortization |
15.6 | 12.4 | 5.0 | 0.7 | ||||||||||||||
| Non-cash share-based compensation |
5.5 | 3.9 | 4.6 | 0.7 | ||||||||||||||
| Non-cash impairment and related loss |
— | 11.5 | — | — | ||||||||||||||
| Accretion of interest on the discounted payable to founding members under tax sharing agreement |
11.8 | 12.0 | 9.9 | — | ||||||||||||||
| Net unrealized hedging transactions |
(7.0 | ) | 14.2 | — | — | |||||||||||||
| Equity in losses from investment |
0.8 | — | — | — | ||||||||||||||
| Amortization of debt issuance costs |
1.9 | 1.9 | 1.7 | — | ||||||||||||||
| Payment to founding members under tax sharing arrangement |
(13.3 | ) | (14.5 | ) | — | — | ||||||||||||
| Changes in operating assets and liabilities: |
||||||||||||||||||
| Receivables—net |
2.9 | 1.0 | (41.8 | ) | 12.6 | |||||||||||||
| Accounts payable and accrued expenses |
7.9 | (1.9 | ) | 13.9 | (4.4 | ) | ||||||||||||
| Amounts due to founding members |
1.4 | (0.6 | ) | (51.2 | ) | (3.7 | ) | |||||||||||
| Income taxes and other |
(3.8 | ) | 5.4 | (2.4 | ) | 0.5 | ||||||||||||
| Net cash provided by operating activities |
138.3 | 124.5 | 37.3 | 2.2 | ||||||||||||||
| CASH FLOWS FROM INVESTING ACTIVITIES: |
||||||||||||||||||
| Purchases of property and equipment |
(8.4 | ) | (16.6 | ) | (13.8 | ) | (0.5 | ) | ||||||||||
| Increase in investment in affiliate |
(2.0 | ) | — | (7.0 | ) | — | ||||||||||||
| Purchases of short-term investments |
— | — | (9.4 | ) | — | |||||||||||||
| Proceeds from sale of short-term investments |
— | 9.1 | — | — | ||||||||||||||
| Net cash used in investing activities |
(10.4 | ) | (7.5 | ) | (30.2 | ) | (0.5 | ) | ||||||||||
| CASH FLOWS FROM FINANCING ACTIVITIES: |
||||||||||||||||||
| Payment of dividends |
(27.5 | ) | (26.3 | ) | (12.6 | ) | — | |||||||||||
| Proceeds from borrowings |
— | 139.0 | 924.0 | 13.0 | ||||||||||||||
| Repayments of borrowings |
(3.0 | ) | (124.0 | ) | (150.0 | ) | (13.0 | ) | ||||||||||
| Proceeds from founding member contributions |
3.6 | 9.7 | 7.5 | — | ||||||||||||||
| Distribution to founding members |
(79.1 | ) | (67.2 | ) | (1,579.8 | ) | — | |||||||||||
| Proceeds from stock option exercises |
— | 0.6 | — | — | ||||||||||||||
| Repurchase of stock for restricted stock tax withholding |
— | (0.4 | ) | — | — | |||||||||||||
| Sale of common stock |
— | — | 882.0 | — | ||||||||||||||
| Payment of offering costs and fees |
— | — | (51.1 | ) | (0.1 | ) | ||||||||||||
| Payment of debt issuance costs |
— | — | (14.6 | ) | — | |||||||||||||
| Net cash provided by (used in) financing activities |
(106.0 | ) | (68.6 | ) | 5.4 | (0.1 | ) | |||||||||||
| CHANGE IN CASH AND CASH EQUIVALENTS |
21.9 | 48.4 | 12.5 | 1.6 | ||||||||||||||
| CASH AND CASH EQUIVALENTS: |
||||||||||||||||||
| Beginning of period |
69.2 | 20.8 | 8.3 | 6.7 | ||||||||||||||
| End of period |
$ | 91.1 | $ | 69.2 | $ | 20.8 | $ | 8.3 | ||||||||||
See accompanying notes to consolidated financial statements.
F-7
Table of Contents
NATIONAL CINEMEDIA, INC. AND SUBSIDIARY
CONSOLIDATED STATEMENTS OF CASH FLOWS (CONTINUED)
(In millions)
| Year Ended December 31, 2009 |
Year Ended January 1, 2009 |
Period February 13, 2007 through December 27, 2007 |
Period December 29, 2006 through February 12, 2007 | |||||||||||
| Supplemental disclosure of non-cash financing and investing activity: |
||||||||||||||
| Contribution for severance plan payments |
$ | — | $ | 0.5 | $ | 1.5 | $ | 0.4 | ||||||
| Increase in distributions payable to members |
$ | 31.1 | $ | 28.3 | $ | 20.4 | — | |||||||
| Contributions from members collected after period end |
$ | — | $ | 0.4 | $ | 3.7 | — | |||||||
| Integration payment from members collected after period end |
$ | 1.2 | $ | 1.2 | — | — | ||||||||
| Purchase of an intangible asset with subsidiary equity |
$ | 28.5 | $ | 116.1 | — | — | ||||||||
| Settlement of put liability by issuance of debt |
$ | 7.0 | — | — | — | |||||||||
| Assets acquired in settlement of put liability |
$ | 2.5 | — | — | — | |||||||||
| Increase in property and equipment not requiring cash in the period |
— | — | $ | 0.6 | — | |||||||||
| Liability and equity recorded upon recognition of deferred tax assets and liabilities related to IPO-date transactions: |
||||||||||||||
| Payable to founding members under tax sharing agreement |
— | — | $ | 125.8 | — | |||||||||
| Additional paid-in-capital |
— | — | $ | 119.6 | — | |||||||||
| Deferred offering costs reclassified to equity |
— | — | $ | 4.7 | — | |||||||||
| Supplemental disclosure of cash flow information: |
||||||||||||||
| Cash paid for interest |
$ | 38.8 | $ | 48.3 | $ | 44.0 | $ | 0.1 | ||||||
| Cash paid for income taxes |
$ | 2.1 | $ | 0.9 | $ | 8.1 | — | |||||||
See accompanying notes to consolidated financial statements.
F-8
Table of Contents
1. THE COMPANY AND SUMMARY OF SIGNIFICANT ACCOUNTING POLICIES
Formation of Business
National CineMedia, Inc. (“NCM, Inc.”) is incorporated in Delaware as a holding company with the sole purpose of being a member and sole manager of National CineMedia, LLC (“NCM LLC”). The terms “NCM”, “the Company” or “we” shall, unless the context otherwise requires, be deemed to include the consolidated entity. NCM LLC operates the largest digital in-theatre network in North America, allowing NCM to distribute advertising, Fathom Business meeting services and Fathom Consumer entertainment services under long-term exhibitor services agreements (“ESAs”) with American Multi-Cinema, Inc. (“AMC”), a wholly owned subsidiary of AMC Entertainment, Inc. (“AMCE”), Regal Cinemas, Inc., a wholly owned subsidiary of Regal Entertainment Group (“Regal”), and Cinemark USA, Inc. (“Cinemark USA”), a wholly owned subsidiary of Cinemark Holdings, Inc. (“Cinemark”). AMC, Regal and Cinemark and their affiliates are referred to in this document as “founding members”. NCM LLC also provides such services to certain third-party theater circuits under multi-year network affiliate agreements, which expire at various dates.
NCM LLC was formed through the combination of the operations of National Cinema Network, Inc. (“NCN”), a wholly owned subsidiary of AMCE, and Regal CineMedia Corporation (“RCM”), a wholly owned subsidiary of Regal. All assets contributed to and liabilities assumed by NCM LLC were recorded on NCM LLC’s accounting records in the amounts as reflected on the Members’ historic accounting records, based on the application of accounting principles as provided in under ASC Topic 805- Business Combinations (formerly under Emerging Issues Task Force (“EITF”) 98–4, Accounting by a Joint Venture for Businesses Received at its Formation). Although legally structured as a limited liability company, NCM LLC was considered a joint venture for accounting purposes given the joint control provisions of the operating agreement among the members, consistent with ASC Topic 323 – Investments – Equity Method and Joint Venture (formerly Accounting Principles Board (“APB”) Opinion No. 18, The Equity Method of Accounting for Investments in Common Stock). RCM and NCN are each considered to be predecessors of NCM LLC. Cinemark became a founding member on July 15, 2005 through units, which were issued to Cinemark Media, Inc. (“Cinemark Media”), a wholly owned subsidiary of Cinemark USA, Inc.
Initial Public Offering and Related Transactions
On February 13, 2007, NCM, Inc. closed its initial public offering (“IPO”) of 42,000,000 shares of common stock at a price to the public of $21.00 per share. NCM, Inc. received net proceeds of approximately $826.2 million, after deducting underwriting discounts and commissions and offering expenses of approximately $55.8 million.
NCM, Inc. used the net proceeds from the IPO to purchase a 44.8% interest in NCM LLC, paying NCM LLC $746.1 million, which included reimbursement to NCM LLC for expenses it advanced related to the IPO and paying the founding members $78.5 million for a portion of the NCM LLC units owned by them. As the managing member of NCM LLC, NCM, Inc. consolidates the operations of NCM LLC. Remaining proceeds of approximately $1.6 million were retained by NCM, Inc. NCM LLC paid $686.3 million of the funds received from NCM, Inc. to the founding members as consideration for their agreement to modify the then-existing ESAs. Proceeds received by NCM LLC from NCM, Inc. of $59.8 million, together with $709.7 million net proceeds from NCM LLC’s new senior secured credit facility, were used to redeem $769.5 million in NCM LLC preferred units held by the founding members. The preferred units were created immediately prior to the IPO in a non-cash recapitalization of each membership unit into one common unit and one preferred unit. Immediately prior to this non-cash recapitalization, the existing common units and employee unit options were split on a 44,291-to-1 basis. All unit and per unit amounts in these financial statements reflect the impact of this split.
At December 31, 2009, NCM LLC had 101,557,505 membership units outstanding, of which 42,121,747 (41.5%) were owned by NCM, Inc., 25,425,689 (25.0%) were owned by RCM, 18,821,114 (18.5%) were owned by AMC, and 15,188,955 (15.0%) were owned by Cinemark.
F-9
Table of Contents
The ESAs with the founding members were amended and restated in conjunction with the IPO. Subject to limited exceptions, under the ESAs NCM LLC is the exclusive provider of advertising services to the founding members for a 30-year term (with a five-year right of first refusal commencing one year before the end of the term) beginning February 13, 2007 and Fathom Events services to the founding members for an initial five-year term, with an automatic five-year renewal providing certain financial tests are met. In exchange for the right to provide these services to the founding members, NCM LLC is required to pay to the founding members a theatre access fee which is a specified calculation based on the attendance at the founding member theatres and the number of digital screens in founding member theatres. Prior to the IPO, NCM LLC paid to the founding members a percentage of NCM LLC’s advertising revenue as advertising circuit share. Upon the completion of the IPO, the founding members made additional time available for sale by NCM LLC, subject to a first right to purchase the time, if needed, by the founding members to fulfill advertising obligations with their in-theatre beverage concessionaries.
Basis of Presentation
The Company has prepared its consolidated financial statements and related notes in accordance with accounting principles generally accepted in the United States of America (“GAAP”) and the rules and regulations of the Securities and Exchange Commission (“SEC”).
The Company’s historical financial data may not be indicative of the Company’s future performance nor will such data reflect what its financial position and results of operations would have been had it operated as an independent publicly traded company during the entirety of all periods presented. The Company’s IPO was completed in February 2007. In addition, as a result of the various related-party agreements discussed in Note 7, the operating results as presented are not necessarily indicative of the results that might have occurred if all agreements were with non-related third parties.
The founding members received all of the proceeds from the IPO and the related issuance of debt, except for amounts needed to pay out-of-pocket costs of the financings and other expenses, and $10.0 million to repay outstanding amounts under NCM LLC’s then-existing revolving line of credit agreement. In conformity with accounting guidance of the SEC concerning monetary consideration paid to promoters, such as the founding members, in exchange for property conveyed by the promoters, the excess over predecessor cost was treated as a special distribution. Because the founding members had no cost basis in the ESAs, all payments to the founding members with the proceeds of the IPO and related debt, amounting to approximately $1.456 billion, have been accounted for as distributions, except for the payments to liquidate accounts payable to the founding members arising from the ESAs. The distributions by NCM LLC to the founding members made at the date of the IPO resulted in a consolidated stockholders’ deficit.
The results of operations for the period ended December 27, 2007 are presented in two periods, reflecting operations prior to and subsequent to the IPO. The period from December 29, 2006 through February 12, 2007 is referred to as the “2007 pre-IPO period”. The period from February 13, 2007 through December 27, 2007 is referred to as the “2007 post-IPO period”. Separate periods have been presented because there were significant changes at the time of the IPO including modifications to the ESAs and related expenses thereunder, and significant changes to revenue arrangements and contracts with the founding members. The financial statements for both the 2007 pre-IPO period and 2007 post-IPO period give effect to allocations of revenues and expenses made using relative percentages of founding member attendance or days in each period, discrete events and other methods management considered a reasonable reflection of the results for such periods.
F-10
Table of Contents
Earnings Per NCM, Inc. Share, Basic and Diluted
Basic earnings per share is computed on the basis of the weighted average number of common shares outstanding. Diluted earnings per share is computed on the basis of the weighted average number of common shares outstanding plus the effect of potentially dilutive common stock options, and restricted stock using the treasury stock method. The components of basic and diluted earnings per NCM, Inc, share are as follows:
| Year Ended December 31, 2009 |
Year Ended January 1, 2009 |
Period February 13, 2007 through December 27, 2007 | |||||||
| Net Income Attributable to NCM, Inc. (in millions) |
$ | 26.1 | $ | 1.0 | $ | 24.8 | |||
| Weighted average shares outstanding: |
|||||||||
| Basic |
42,118,639 | 42,040,879 | 42,000,000 | ||||||
| Add: Dilutive effect of stock options and restricted stock |
284,496 | 426 | 182,811 | ||||||
| Diluted |
42,403,135 | 42,041,305 | 42,182,811 | ||||||
| Earnings per NCM, Inc. share: |
|||||||||
| Basic |
$ | 0.62 | $ | 0.02 | $ | 0.59 | |||
| Diluted |
$ | 0.62 | $ | 0.02 | $ | 0.59 | |||
The effect of the 59,003,528, 55,608,459 and 51,850,951 convertible NCM LLC common units held by the founding members for the years ended December 31, 2009, January 1, 2009 and the 2007 post-IPO period, respectively, has been excluded from the calculation of diluted weighted average shares and earnings per NCM, Inc. share as they were antidilutive. In addition, there were 681,754, 915,499 and 20,904 stock options and 18,793, 52,208 and 2,575 non-vested shares for the years ended December 31, 2009, January 1, 2009 and the 2007 post-IPO period, respectively, excluded from the calculation as they are antidilutive, primarily as exercise prices on stock options and intrinsic value of restricted stock shares were above the average market value.
Summary of Significant Accounting Policies
Accounting Period—The Company operates on a 52-week fiscal year, with the fiscal year ending on the first Thursday after December 25, which, in certain years, results in a 53-week year, as was the case for fiscal year 2008.
Estimates—The preparation of financial statements in conformity with GAAP requires management to make estimates and assumptions that affect the reported amounts of assets and liabilities and disclosure of contingent assets and liabilities at the date of the financial statements and the reported amounts of revenues and expenses during the reporting period. Significant estimates include those related to the reserve for uncollectible accounts receivable, equity-based compensation and income taxes. Actual results could differ from those estimates.
Consolidation—NCM, Inc. consolidates the accounts of NCM LLC under the provision of ASC Topic 810 Consolidation (formerly EITF Issue No. 04-5, Determining Whether a General Partner, or the General Partners as a Group, Controls a Limited Partnership or Similar Entity When the Limited Partners Have Certain Rights). Under Topic 810, a managing member of a limited liability company (“LLC”) is presumed to control the LLC, unless the non-managing members have the right to dissolve the entity or remove the managing member without cause, or if the non-managing members have substantive participating rights. The non-managing members of NCM LLC do not have either dissolution rights or removal rights. NCM, Inc. has evaluated the provisions of the NCM LLC membership agreement and has concluded that the various rights of the non-managing members are
not substantive participation rights under Topic 810, as they do not limit NCM, Inc.’s ability to make decisions in
F-11
Table of Contents
the ordinary course of business. In addition, the Company adopted accounting guidance for noncontrolling interests effective January 2, 2009, which changed the manner of presentation and related disclosures for the noncontrolling interest in a subsidiary. The presentation changes are reflected retrospectively in the Company’s consolidated financial statements and Note 13. ASC Topic 810 also changed the measurement principles for noncontrolling interests by permitting the recognition of a deficit balance. Since the measurement principles cannot be applied retrospectively, the deficit in NCM LLC’s equity accounts due to distributions at the time of the IPO and related transactions, are reported at zero for all periods through January 1, 2009. The noncontrolling interest in NCM LLC’s deficit through January 1, 2009, has been charged against NCM Inc.’s additional paid-in capital (deficit).
Segment Reporting— Segments are accounted for under ASC Topic 280 Segment Reporting (formerly Statement of Financial Accounting Standards (“SFAS”) No. 131, Disclosures about Segments of an Enterprise and Related Information). Refer to Note 14.
Revenue Recognition—Advertising revenue is recognized in the period in which an advertising contract is fulfilled against the contracted theatre attendees. Advertising revenue is recorded net of make-good provisions to account for delivered attendance that is less than contracted attendance. When remaining delivered attendance is provided in subsequent periods, that portion of the revenue earned is recognized in that period. Deferred revenue refers to the unearned portion of advertising contracts. All deferred revenue is classified as a current liability. Fathom Events revenue is recognized in the period in which the event is held.
Operating Costs—Advertising-related operating costs primarily include personnel and other costs related to advertising fulfillment, and to a lesser degree, production costs of non-digital advertising, and payments due to unaffiliated theatre circuits under the network affiliate agreements.
Fathom Events operating costs include equipment rental, catering, movie tickets acquired primarily from the founding members, revenue share under the amended and restated ESAs and other direct costs of the meeting or event.
In the 2007 pre-IPO period and prior periods, circuit share costs were fees payable to the founding members for the right to exhibit advertisements within the theatres, based on a percentage of advertising revenue. In the 2007 post-IPO period and subsequent periods, under the amended and restated ESAs, a payment to the founding members of a theatre access fee, in lieu of circuit share expense, comprised of a payment per theatre attendee and a payment per digital screen, both of which escalate over time, is reflected in expense.
Network costs include personnel, satellite bandwidth, repairs, and other costs of maintaining and operating the digital network and preparing advertising and other content for transmission across the digital network. These costs are not specifically allocable between the advertising business and the Fathom Events business.
Leases—The Company leases various office facilities under operating leases with terms ranging from 3 to 8 years. We calculate straight-line rent expense over the initial lease term and renewals that are reasonably assured.
Advertising Costs—Costs related to advertising and other promotional expenditures are expensed as incurred. Due to the nature of our business, we have an insignificant amount of advertising costs included in selling and marketing costs on the statement of operations.
Cash and Cash Equivalents—All highly liquid debt instruments and investments purchased with an original maturity of three months or less are classified as cash equivalents. These are cash balances in a bank in excess of the federally insured limits or in the form of a money market demand account with a major financial institution.
F-12
Table of Contents
Restricted Cash—At December 31, 2009 and January 1, 2009, other non-current assets included restricted cash of $0.3 million, which secures a letter of credit used as a lease deposit on NCM LLC’s New York office.
Receivables—Bad debts are provided for using the allowance for doubtful accounts method based on historical experience and management’s evaluation of outstanding receivables at the end of the period. Receivables are written off when management determines amounts are uncollectible. Trade accounts receivable are uncollateralized and represent a large number of geographically dispersed debtors. At December 31, 2009 there was one advertising agency group through which the Company sources national advertising revenue representing approximately 19% of the Company’s outstanding gross receivable balance; however, none of the individual contracts related to the advertising agency were more than 10% of advertising revenue. At January 1, 2009, there was one client and one advertising agency group through which the Company sources national advertising revenue representing approximately 10% and 20%, respectively, of the Company’s outstanding gross receivable balance; however, none of the individual contracts related to the advertising agency were more than 10% of advertising revenue. The collectability risk is reduced by dealing with large, national advertising agencies and clients who have strong reputations in the advertising industry and stable financial positions.
Receivables consisted of the following, in millions:
| As of December 31, 2009 |
As of January 1, 2009 |
|||||||
| Trade accounts |
$ | 91.6 | $ | 92.4 | ||||
| Other |
1.3 | 2.4 | ||||||
| Less allowance for doubtful accounts |
(3.6 | ) | (2.6 | ) | ||||
| Total |
$ | 89.3 | $ | 92.2 | ||||
Long-lived Assets—Property and equipment is stated at cost, net of accumulated depreciation or amortization. Refer to Note 2. Major renewals and improvements are capitalized, while replacements, maintenance, and repairs that do not improve or extend the lives of the respective assets are expensed currently. In general, the equipment associated with the digital network that is located within the theatre is owned by the founding members, while equipment outside the theatre is owned by the Company. The Company records depreciation and amortization using the straight-line method over the following estimated useful lives:
| Equipment |
4-10 years | |
| Computer hardware and software |
3-5 years | |
| Leasehold improvements |
Lesser of lease term or asset life |
We account for the costs of software and web site development costs developed or obtained for internal use in accordance with ASC Subtopic 350-40 Internal Use Software (formerly American Institute of Certified Public Accountants Statement of Position (“SOP”) 98-1, Accounting for the Costs of Computer Software Developed or Obtained for Internal Use) and ASC Subtopic 350-50 Website Development Costs (formerly EITF 00-2, Accounting for Web Site Development Costs). The subtopics require the capitalization of certain costs incurred in developing or obtaining software for internal use. The majority of our software costs and web site development costs, which are included in equipment, are depreciated over three to five years. As of December 31, 2009 and January 1, 2009, we had a net book value of $11.0 million and $11.8 million, respectively, of capitalized software and web site development costs. We recorded approximately $6.7 million, $4.9 million, $2.8 million and $0.3 million for the years ended December 31, 2009, January 1, 2009, the 2007 post-IPO period and the 2007 pre-IPO period, respectively, in depreciation expense. As of December 31, 2009, January 1, 2009 and the 2007 post-IPO period we recorded $1.6 million, $1.2 million and $1.3 million in research and development expense, respectively.
Construction in progress includes costs relating to installations of our equipment into affiliate theatres. Assets under construction are not depreciated until placed into service.
F-13
Table of Contents
Intangible assets consist of contractual rights and are stated at cost, net of accumulated amortization. Refer to Note 3. The Company records amortization using the straight-line method over the estimated useful life of the intangibles.
We assess impairment of long-lived assets pursuant with ASC Topic 360 Property, Plant and Equipment (formerly SFAS No. 144, Accounting for the Impairment or Disposal of Long-Lived Assets) annually. This includes determining if certain triggering events have occurred that could affect the value of an asset. Thus far, we have recorded no impairment charges related to long-lived assets.
Amounts Due to/from Founding Members—Amounts due to/from founding members in the 2009 and 2008 periods include amounts due for the theatre access fee, offset by a receivable for advertising time purchased by the founding members, as well as revenue share earned for Fathom Events plus any amounts outstanding under other contractually obligated payments. Payments to or received from the founding members against outstanding balances are made monthly.
Income Taxes— Income taxes are accounted for under the asset and liability method, which requires recognition of deferred tax assets and liabilities for the expected future tax consequences of events that have been included in the financial statements. Under this method, deferred tax assets and liabilities are determined based on the differences between the financial statements and tax basis of assets and liabilities using enacted tax rates in effect for the year in which differences are expected to be recovered or settled pursuant to the provisions of Topic 740 Income Taxes (formerly SFAS No. 109, Accounting for Income Taxes). The effect of a change in tax rates on deferred tax assets and liabilities is recognized in income in the period that includes the enactment date.
The Company records a valuation allowance if it is deemed more likely than not that all or a portion of its deferred income tax assets will not be realized, which will be assessed on an on-going basis. In addition, income tax rules and regulations are subject to interpretation and the application of those rules and regulations require judgment by the Company and may be challenged by the taxation authorities. The Company follows ASC Topic 740-10-25 (formerly FASB Interpretation (“FIN”) No. 48, Accounting for Uncertainty in Income Taxes—an interpretation of FASB Statement No. 109 (“FIN 48”)), which requires the use of a two-step approach for recognizing and measuring tax benefits taken or expected to be taken in a tax return and disclosures regarding uncertainties in income tax positions. Only tax positions that meet the more likely than not recognition threshold are recognized. The Company’s unrecognized tax benefits or related interest and penalties is immaterial. Refer to Note 5.
During the year ended January 1, 2009 and the period February 13, 2007 through December 27, 2007, the Company presented the provision for income taxes including the amounts attributable to the noncontrolling interests and presented the noncontrolling interests net of its proportionate share of the income tax provision. However, after further review of ASC 740 Income Taxes, the Company determined that since NCM LLC is a pass-through entity for income tax purposes, the income tax provision for the Company should be presented only for the Company’s income tax obligation on its portion of NCM LLC’s earnings and should not include amounts calculated on the noncontrolling interests’ portion of NCM LLC’s taxable earnings. As a result, the Company has restated its Consolidated Statements of Operations to reduce its provision for income taxes by $21.3 million and $25.5 million with a corresponding increase in net income attributable to noncontrolling interests for the year ended January 1, 2009 and the period February 13, 2007 through December 27, 2007, respectively. The correction has no effect on net income attributable to NCM, Inc., earnings per share, nor any impact to the Consolidated Balance Sheets or on Consolidated Cash Flows from Operations.
The following is a summary of the effects of the restatement on our (a) Consolidated Statement of Operations for the year ended January 1, 2009 and for the period February 13, 2007 through December 27, 2007; (b) Consolidated Statement of Cash Flows for the year ended January 1, 2009 and for the period February 13, 2007 through December 27, 2007; and (c) Consolidated Statement of Equity/(Deficit) and Comprehensive Income as of January 1, 2009 and December 27, 2007.
F-14
Table of Contents
| CONSOLIDATED STATEMENTS OF OPERATIONS | ||||||||||||||||
| Year Ended January 1, 2009 | Period February 13, 2007 through December 27, 2007 |
|||||||||||||||
| As Previously Reported |
As Restated | As Previously Reported |
As Restated | |||||||||||||
| Provision for Income Taxes |
$ | 35.0 | $ | 13.7 | $ | 41.9 | $ | 16.4 | ||||||||
| Consolidated Net Income (Loss) |
$ | 49.7 | $ | 71.0 | $ | 62.4 | $ | 87.9 | ||||||||
| Net Income Attributable to Noncontrolling Interests |
$ | 33.8 | $ | 55.1 | $ | 37.6 | $ | 63.1 | ||||||||
| CONSOLIDATED STATEMENTS OF CASH FLOWS | ||||||||||||||||
| Year Ended January 1, 2009 | Period February 13, 2007 through December 27, 2007 |
|||||||||||||||
| As Previously Reported |
As Restated | As Previously Reported |
As Restated | |||||||||||||
| Consolidated Net Income (Loss) |
$ | 49.7 | $ | 71.0 | $ | 62.4 | $ | 87.9 | ||||||||
| Deferred income tax expense |
$ | 7.3 | $ | 8.2 | $ | 14.3 | $ | 9.7 | ||||||||
| Income taxes and other |
$ | 13.1 | $ | 5.4 | $ | 18.5 | $ | (2.4 | ) | |||||||
| CONSOLIDATED STATEMENTS OF EQUITY/(DEFICIT) | ||||||||||||||||
| At January 1, 2009 | ||||||||||||||||
| As Previously Reported | As Restated | |||||||||||||||
| Consolidated | Noncontrolling Interest |
Consolidated | Noncontrolling Interest |
|||||||||||||
| Impacts of subsidiary ownership changes |
$ | 8.7 | $ | 8.7 | $ | 1.1 | $ | 1.1 | ||||||||
| Comprehensive Income (Loss): |
||||||||||||||||
| Unrealized (loss) on cash flow hedge, net of tax |
$ | (35.4 | ) | $ | (20.4 | ) | $ | (49.1 | ) | $ | (34.1 | ) | ||||
| Net income, net of tax |
$ | 49.7 | $ | 48.7 | $ | 71.0 | $ | 70.0 | ||||||||
| Total Comprehensive Income, net of tax |
$ | 14.3 | $ | 28.3 | $ | 21.9 | $ | 35.9 | ||||||||
| At December 27, 2007 | ||||||||||||||||
| As Previously Reported | As Restated | |||||||||||||||
| Consolidated | Noncontrolling Interest |
Consolidated | Noncontrolling Interest |
|||||||||||||
| Impacts of subsidiary ownership changes |
$ | 22.2 | $ | 22.2 | $ | (0.1 | ) | $ | (0.1 | ) | ||||||
| Comprehensive Income (Loss): |
||||||||||||||||
| Unrealized (loss) on cash flow hedge, net of tax |
$ | (8.7 | ) | $ | (4.8 | ) | $ | (11.9 | ) | $ | (8.0 | ) | ||||
| Net income, net of tax |
$ | 62.4 | $ | 37.6 | $ | 87.9 | $ | 63.1 | ||||||||
| Total Comprehensive Income, net of tax |
$ | 53.7 | $ | 32.8 | $ | 76.0 | $ | 55.1 | ||||||||
F-15
Table of Contents
Accumulated Other Comprehensive Income/Loss—Accumulated other comprehensive income/loss is composed of the following (in millions):
| Year Ended Dec. 31, 2009 |
Year Ended Jan. 1, 2009 |
Period February 13, 2007 through December 27, 2007 |
||||||||||
| Beginning Balance |
$ | (18.7 | ) | $ | (3.9 | ) | $ | — | ||||
| Change in fair value on cash flow hedge, net of tax of $(3.9), $10.1 and $2.5 million, respectively |
20.9 | (49.4 | ) | (11.9 | ) | |||||||
| Noncontrolling interest |
(15.2 | ) | 34.1 | 8.0 | ||||||||
| Impact of change in ownership |
0.4 | 0.2 | — | |||||||||
| Reclassifications into earnings, net of tax of $(0.5), $(0.1) and $0 million, respectively |
0.8 | 0.3 | — | |||||||||
| Ending Balance |
$ | (11.8 | ) | $ | (18.7 | ) | $ | (3.9 | ) | |||
Debt Issuance Costs—In relation to the issuance of long-term debt discussed in Note 8, we have a balance of $9.2 million and $11.1 million in deferred financing costs as of December 31, 2009 and January 1, 2009, respectively. These debt issuance costs are being amortized over the terms of the underlying obligation and are included in interest expense. For the years ended December 31, 2009, January 1, 2009, 2007 post-IPO period, and the 2007 pre-IPO period we amortized $1.9 million, $1.9 million, $1.7 million and $0.0, respectively.
Fair Value of Financial Instruments—The carrying amounts of cash and cash equivalents, the revolving credit facility and other notes payable as reported in the Company’s balance sheets approximate their fair values due to their short maturity or floating rate terms, as applicable. The carrying amounts and fair values of interest rate swap agreements are the same since the Company accounts for these instruments at fair value. The Company has estimated the fair value of its term loan based on an average of three non-binding broker quotes and our reasonability analysis to be $688.8 million and $514.8 million at December 31, 2009 and January 1, 2009, respectively. The carrying value of the term loan was $725.0 million as of December 31, 2009 and January 1, 2009.
Equity Method Investments— The Company accounts for its investment in RMG Networks, Inc., (“RMG”) (formerly Danoo, Inc.) under the equity method of accounting as required by ASC Topic 323-10 Investments – Equity Method and Joint Ventures (formerly APB No. 18, The Equity Method of Accounting for Investments in Common Stock) because we exert “significant influence” over, but do not control, the policy and decisions of RMG (see Note 11). As of December 31, 2009, the Company owns approximately 24% of the issued and outstanding preferred and common stock of RMG (before considering out-of-the-money warrants). The Company’s investment is $7.4 million. The investment in RMG and the Company’s share of its operating results are not material to the Company’s financial position or results of operations and as a result summarized financial information is not presented.
Share-Based Compensation—Stock-based employee compensation is accounted for at fair value under ASC Topic 718 Compensation – Stock Compensation (formerly SFAS No. 123(R), Share-Based Payment). The Company adopted Topic 718 on December 30, 2005 prospectively for new equity based grants, as there were no equity based grants prior to the date of adoption. Refer to Note 9.
F-16
Table of Contents
Recent Accounting Pronouncements
The Company adopted ASC Topic 810-10 Consolidation (formerly SFAS No. 160, Noncontrolling Interests in Consolidated Financial Statements – an amendment of ARB No. 51) effective January 2, 2009. Topic 810-10 changes the manner of presentation and related disclosures for the noncontrolling interest in a subsidiary (formerly referred to as a minority interest) and for the deconsolidation of a subsidiary. The presentation changes are reflected retrospectively in the Company’s consolidated financial statements and Note 13. Topic 810-10 also changes the measurement principles for noncontrolling interests by permitting the recognition of a deficit balance. Since the measurement principles cannot be applied retrospectively, the noncontrolling interest in the deficit in NCM LLC’s equity accounts due to distributions at the time of the IPO and related transactions, is reported at zero for all periods through January 1, 2009. The noncontrolling interest in NCM LLC’s deficit through January 1, 2009, has been charged against NCM Inc.’s additional paid-in capital (deficit).
ASC Topic 815-10 Derivatives and Hedging (formerly SFAS No. 161, Disclosures about Derivative Instruments and Hedging Activities) was adopted by the Company effective January 2, 2009. The guidance under Topic 815-10 changes the manner of presentation and related disclosures of the fair values of derivative instruments and their gains and losses (see Note 12).
In April 2009, the Company adopted ASC Topic 820-10-65 Fair Value Measurements and Disclosures (formerly FASB Staff Position No. SFAS 157-4, Determining Fair Value When the Volume and Level of Activity for the Asset or Liability Have Significantly Decreased and Identifying Transactions That Are Not Orderly). The standard provides additional guidance for estimating fair value in accordance with Topic 820-10-65 when the volume and level of activity for the asset or liability have significantly decreased and includes guidance on identifying circumstances that indicate if a transaction is not orderly. The Company adopted this pronouncement effective April 3, 2009 with no impact on its consolidated financial statements.
In June 2009, the FASB finalized SFAS No. 167, Amending FASB interpretation No. 46(R), and subsequently ASU 2009-17, Consolidations (Topic 810): Improvements to Financial Reporting Involved with Variable Interest Entities. The provisions of ASC 810 amends the definition of the primary beneficiary of a variable interest entity and will require the Company to make an assessment each reporting period of its variable interests. The Company adopted this pronouncement effective January 1, 2010 with no impact on its consolidated financial statements.
In July 2009, the FASB issued SFAS No. 168, The Hierarchy of Generally Accepted Accounting Principles. SFAS 168 codified all previously issued accounting pronouncements, eliminating the prior hierarchy of accounting literature, in a single source for authoritative U.S. GAAP recognized by the FASB to be applied by nongovernmental entities. SFAS 168, now ASC Topic 105-10 Generally Accepted Accounting Principles, is effective for financial statements issued for interim and annual periods ending after September 15, 2009. The adoption of this pronouncement did not have an effect on the consolidated financial statements.
In August 2009, the FASB issued Accounting Standards Update (“ASU”) No. 2009-05, Measuring Liabilities at Fair Value, which clarifies, among other things, that when a quoted price in an active market for the identical liability is not available, an entity must measure fair value using one or more specified techniques. The Company adopted the pronouncement effective July 2, 2009 with no impact on its consolidated financial statements.
In October 2009, the FASB issued ASU No. 2009-13, Multiple-Deliverable Revenue Arrangements, which revises the existing multiple-element revenue arrangements guidance and changes the determination of when the individual deliverables included in a multiple-element revenue arrangement may be treated as separate units of accounting, modifies the manner in which the transaction consideration is allocated across the separately identified deliverables and expands the disclosures required for multiple-element revenue arrangements. The pronouncement is effective for financial statements issued after December 31, 2010. The Company does not expect the pronouncement to have a material effect on its consolidated financial statements.
F-17
Table of Contents
In January 2010, the FASB issued ASU No. 2010-02, Accounting and Reporting for Decreases in Ownership of a Subsidiary, which clarifies the scope of decreases in ownership for certain transactions. The pronouncement is effective for interim and annual periods beginning after December 15, 2009 and will be applied retrospectively to the period the Company first adopted SFAS No. 160 (January 2, 2009). The Company does not expect the pronouncement to have a material effect on its consolidated financial statements.
In January 2010, the FASB issued ASU No. 2010-06, Improving Disclosures about Fair Value Measurements, which requires additional disclosures about (1) the different classes of assets and liabilities measured at fair value, (2) the valuation techniques and inputs used, (3) the activity in Level 3 fair value measurements, and (4) the transfers between Levels 1, 2 and 3. The new disclosures are effective for financial statements issued for interim and annual periods beginning after December 15, 2009. The Company does not expect the pronouncement to have a material effect on its consolidated financial statements.
The Company has considered all other recently issued accounting pronouncements and does not believe the adoption of such pronouncements will have a material impact on its consolidated financial statements.
2. PROPERTY AND EQUIPMENT (in millions)
| As of December 31, 2009 |
As of January 1, 2009 |
|||||||
| Equipment |
$ | 60.6 | $ | 53.3 | ||||
| Leasehold Improvements |
1.6 | 1.4 | ||||||
| Less accumulated depreciation |
(39.3 | ) | (27.0 | ) | ||||
| Subtotal |
22.9 | 27.7 | ||||||
| Construction in Progress |
0.8 | 0.3 | ||||||
| Total property and equipment |
$ | 23.7 | $ | 28.0 | ||||
For the years ended December 31, 2009, January 1, 2009, 2007 post-IPO period and 2007 pre-IPO period we recorded depreciation of $12.5 million, $10.2 million, $4.8 million and $0.6 million respectively.
3. INTANGIBLE ASSETS
During 2008, NCM LLC issued 2,544,949 common membership units to its founding members in connection with its rights of exclusive access to net new theatres and projected attendees added by the founding members to NCM LLC’s network and 2,913,754 common membership units to Regal in connection with the closing of its acquisition of Consolidated Theatres (see Note 7). The Company recorded an intangible asset of $116.1 million representing the contractual rights. During the first quarter of 2009, NCM LLC issued 2,126,104 common membership units to its founding members in exchange for the rights to exclusive access to net new theatre screens and projected attendees added by the founding members to NCM LLC’s network. As a result, NCM LLC recorded an intangible asset at fair value of $28.5 million. The Company based the fair value of the intangible assets on the fair value of the common membership units issued on the date of grants, which are freely convertible into the Company’s common stock.
Pursuant to ASC Topic 350-10 Intangibles – Goodwill and Other (formerly SFAS No. 142, Goodwill and Other Intangible Assets), the intangible assets have a finite useful life and the Company amortizes the assets over the remaining useful life corresponding with the ESAs. Amortization of the asset related to Regal Consolidated Theatres will not begin until after 2011 since the Company will not have access to on-screen advertising in the Regal Consolidated Theatres until the run-out of their existing on–screen advertising agreement.
F-18
Table of Contents
| As of December 31, 2009 |
As of January 1, 2009 |
|||||||
| (in millions) | ||||||||
| Beginning balance |
$ | 111.8 | $ | — | ||||
| Purchase of intangible asset subject to amortization |
28.5 | 116.1 | ||||||
| Less integration payments |
(3.2 | ) | (2.8 | ) | ||||
| Less amortization expense |
(2.9 | ) | (1.5 | ) | ||||
| Total intangible assets |
$ | 134.2 | $ | 111.8 | ||||
For the years ended December 31, 2009 and January 1, 2009 we recorded amortization of $2.9 million and $1.5 million, respectively.
The estimated aggregate amortization expense for each of the five succeeding years are as follows (in millions):
| 2010 |
$ | 3.0 | |
| 2011 |
4.9 | ||
| 2012 |
4.9 | ||
| 2013 |
4.9 | ||
| 2014 |
4.9 |
4. ACCRUED EXPENSES (in millions)
| As of December 31, 2009 |
As of January 1, 2009 | |||||
| Make-good Reserve |
$ | 0.3 | $ | 1.3 | ||
| Accrued Interest |
9.8 | 4.0 | ||||
| Other accrued expenses |
2.8 | 1.4 | ||||
| Total accrued expenses |
$ | 12.9 | $ | 6.7 | ||
5. INCOME TAXES
The Company has provided total income taxes, as follows (in millions):
| Year Ended December 31, 2009 |
Year Ended January 1, 2009 |
Period February 13, 2007 through December 27, 2007 |
||||||||||
| Current : |
||||||||||||
| Federal |
$ | 2.9 | $ | 4.8 | $ | 6.1 | ||||||
| State |
0.4 | 0.7 | 0.6 | |||||||||
| Total current income taxes |
$ | 3.3 | $ | 5.5 | $ | 6.7 | ||||||
| Deferred : |
||||||||||||
| Federal |
$ | 11.6 | $ | 5.5 | $ | 8.8 | ||||||
| State |
1.8 | 0.7 | 0.9 | |||||||||
| Total deferred income taxes |
$ | 13.4 | $ | 6.2 | $ | 9.7 | ||||||
| Valuation allowance |
(0.1 | ) | 2.0 | — | ||||||||
| Total income tax provision on Consolidated Statements of Operations |
$ | 16.6 | $ | 13.7 | $ | 16.4 | ||||||
| Income tax (benefit) on other comprehensive income |
$ | 4.4 | $ | (10.0 | ) | $ | (2.5 | ) | ||||
F-19
Table of Contents
A reconciliation of the provision for income taxes as reported and the amount computed by multiplying income before taxes, less noncontrolling interest, by the U.S. federal statutory rate of 35% was (in millions):
| Year Ended December 31, 2009 |
Year Ended January 1, 2009 |
Period February 13, 2007 through December 27, 2007 |
||||||||||
| Provision calculated at federal statutory income tax rate: |
||||||||||||
| Income (Loss) Before Income Taxes |
$ | 41.2 | $ | 29.6 | $ | 36.5 | ||||||
| Less: Noncontrolling Interests |
(26.3 | ) | (19.2 | ) | (22.1 | ) | ||||||
| Income (Loss) Attributable to NCM, Inc. |
14.9 | 10.4 | 14.4 | |||||||||
| State and local income taxes, net of federal benefit |
2.1 | 1.4 | 1.4 | |||||||||
| Change in valuation allowance |
(0.1 | ) | 2.0 | — | ||||||||
| Other |
(0.3 | ) | (0.1 | ) | 0.6 | |||||||
| Total income tax provision |
$ | 16.6 | $ | 13.7 | $ | 16.4 | ||||||
Significant components of the Company’s deferred tax assets and deferred tax liability consisted of the following (in millions):
| As of December 31, 2009 |
As of January 1, 2009 |
|||||||
| Deferred tax assets: |
||||||||
| Excess of tax basis over book basis – investment in consolidated subsidiary NCM LLC (1)(2) |
$ | 255.4 | $ | 272.5 | ||||
| Unrealized loss on hedging transactions and investments |
12.4 | 17.1 | ||||||
| Other |
4.8 | 3.6 | ||||||
| Total deferred tax assets |
272.6 | 293.2 | ||||||
| Valuation allowance |
(1.9 | ) | (2.0 | ) | ||||
| Total deferred tax assets, net of valuation allowance (3) |
$ | 270.7 | $ | 291.2 | ||||
| Deferred tax liabilities: |
||||||||
| Discount on liability for income taxes payable to founding members under tax sharing agreement (4) |
$ | 51.0 | $ | 51.5 | ||||
| Other |
2.4 | 2.8 | ||||||
| Total deferred tax liabilities (5) |
$ | 53.4 | $ | 54.3 | ||||
| (1) | The Company recorded a tax basis adjustment to reflect the Company’s share of the tax basis in excess of the book basis in the underlying assets of NCM LLC. NCM LLC made an election under Section 754 of the Internal Revenue Code when its tax return was prepared resulting in the positive tax basis adjustment on its tax-basis balance sheet of the Company for its acquired share of NCM LLC’s assets. The vast majority of this tax basis adjustment is attributable to intangible assets that are amortized over the remainder of the 15-year period for federal income tax purposes. For the year ended December 31, 2009, this caused a reduction in the basis of $9.2 million. |
The deferred tax asset for the investment in NCM LLC reflects the tax effected difference between the Company’s tax basis and its financial reporting basis. The basis difference results in part from the payments made to the founding members at the date of the IPO that were accounted for as distributions under
F-20
Table of Contents
generally accepted accounting principles, but which are treated as creating an amortizable asset for federal income tax purposes. In addition, the Company recorded a step-up in tax basis related to the investment in NCM LLC, which was not recorded for financial reporting purposes. Finally, the Company recorded a step-up in tax basis as a result of payments made by NCM, Inc. to the founding members under the tax receivable agreement.
| (2) | For federal income tax purposes, an amortizable intangible asset was created on the tax-basis balance sheet of NCM LLC as a result of the founding members agreeing to modify NCM LLC’s payment obligations under the ESAs and as a result of the common unit adjustments, which are further described in Note 3. However, due to differences in tax and book measurement principles, there was a temporary difference in the recorded amounts for tax and book purposes. The amount reflects the tax effect of NCM, Inc.’s share of this intangible asset, which is amortized over the remainder of the 30-year life for federal income tax purposes. For the year ended December 31, 2009, this caused a reduction in the basis of $5.4 million. |
| (3) | Represents $3.0 million and $0.8 million included in “Other current assets” and $267.7 million and $290.4 million in “Deferred tax assets” at December 31, 2009 and January 1, 2009, respectively, in the Consolidated Balance Sheets. |
| (4) | NCM Inc. recorded a long-term payable to founding members related to the tax receivable agreement, which is recorded at its present value. The discount on this liability is a temporary difference that resulted in a deferred tax liability. We recorded accretion of interest on the discounted payable of $11.8 million and $12.0 million for the year ended December 31, 2009 and January 1, 2009, respectively. |
| (5) | Represents $0.1 million and $0.2 million included in “Deferred revenue and other current liabilities” and $53.3 million and $54.1 million in “Deferred tax liability” at December 31, 2009 and January 1, 2009, respectively, in the Consolidated Balance Sheets. |
On the IPO date, NCM Inc. and the founding members entered into a tax receivable agreement. Under the terms of this agreement, NCM Inc. will make cash payments to the founding members in amounts equal to 90% of NCM Inc.’s actual tax benefit realized from the tax amortization of the intangible assets described above. For purposes of the tax receivable agreement, cash savings in income and franchise tax will be computed by comparing NCM Inc.’s actual income and franchise tax liability to the amount of such taxes that NCM Inc. would have been required to pay had there been no increase in NCM Inc.’s proportionate share of tax basis in NCM LLC’s tangible and intangible assets and had the tax receivable agreement not been entered into. The tax receivable agreement shall generally apply to NCM Inc.’s taxable years up to and including the 30th anniversary date of the offering. The payment made in 2008 was $14.5 million for the 2007 post-IPO period. The payment made in 2009 was $13.3 million for the 2008 period and in 2010 the Company expects to make an additional $2.0 million payment with respect to the 2008 taxable year and of $15.6 million with respect to the 2009 taxable year.
In assessing the realizable value of deferred tax assets, primarily arising in connection with the IPO, management considered whether it is more likely than not that some portion or all of the deferred tax assets will not be realized. The ultimate realization of deferred tax assets is dependent upon the generation of future taxable income during the periods in which these temporary differences become deductible. The Company has recorded a valuation allowance against deferred tax assets of $1.9 million and $2.0 million at December 31, 2009 and January 1, 2009, respectively, for its deferred assets related to the impairment loss recorded for an investment for which management believes it is more likely than not that these deferred tax assets will not be realized in future periods.
As of December 31, 2009 or January 1, 2009, there were no material expense or liability recorded for payment of interest and penalties associated with uncertain tax positions or material unrecognized tax positions.
The Company is subject to taxation in the U.S. and various states. As of December 31, 2009, the Company’s tax years beginning with 2007 are subject to examination by the tax authorities. Prior to February 13, 2007, as an LLC, NCM LLC allocated all of its earnings to its founding members.
F-21
Table of Contents
6. CAPITAL STOCK
As of December 31, 2009, the Company has authorized capital stock of 120,000,000 shares of common stock, par value of $0.01 per share, and 10,000,000 shares of preferred stock, par value of $0.01 per share. There were no shares of preferred stock issued or outstanding as of December 31, 2009. There were 42,121,747 shares of common stock issued and outstanding as of December 31, 2009.
The holders of common stock are entitled to one vote per share on all matters submitted for action by the stockholders. Holders of common stock are entitled to share equally, share for share, in declared dividends.
The authorized but unissued shares of common stock and preferred stock are available for future issuance without stockholder approval. These additional shares may be used for a variety of corporate purposes, including future public offerings to raise additional capital, corporate acquisitions, exchange on a one-for-one basis under the Founders’ right to convert their NCM LLC membership units into Company common stock, and employee benefit plans.
In addition, as of December 31, 2009, the Company had 3,237,319 shares reserved for future issuance under its Equity Incentive Plan.
7. RELATED-PARTY TRANSACTIONS
Years Ended December 31, 2009 and January 1, 2009 and the 2007 Post-IPO Period–
Pursuant to the ESAs, the Company makes monthly theatre access fee payments to the founding members, comprised of a payment per theatre attendee and a payment per digital screen with respect to the founding member theatres included in our network. Also, the founding members are purchasing 60 seconds of on-screen advertising time (with a right to purchase up to 90 seconds) for the year ended December 31, 2009 to satisfy their obligations under their beverage concessionaire agreements at a specified 30 second equivalent cost per thousand (“CPM”) impressions. For the year ended January 1, 2009 two of the founding members purchased 90 seconds and one purchased 60 seconds of on-screen advertising time under their beverage concessionaire agreement. For the 2007 post IPO period, all three founding members purchased 90 seconds of on-screen time. The total theatre access fee to the founding members for the years ended December 31, 2009, January 1, 2009 and the 2007 post-IPO period is $52.7 million, $49.8 million and $41.5 million, respectively. The total revenue related to the beverage concessionaire agreements for the years ended December 31, 2009, January 1, 2009 and the 2007 post-IPO period is $36.3 million, $43.3 million and $40.9 million, respectively. In addition, the Company makes payments to the founding members for use of their screens and theatres for its Fathom Events businesses. These payments are at rates (percentage of event revenue) included in the ESAs based on the nature of the event. Payments to the founding members for these events totaled $6.7 million, $6.0 million and $3.8 million for the years ended December 31, 2009, January 1, 2009 and the 2007 post-IPO period, respectively.
Also, pursuant to the terms of the NCM LLC Operating Agreement in place since the close of the IPO, NCM LLC is required to make mandatory distributions on a proportionate basis to its members of available cash, as defined in the NCM LLC Operating Agreement, on a quarterly basis in arrears. Balances for the years ended December 31, 2009, January 1, 2009 and the 2007 post-IPO period are as follows (in millions):
| 2009 | 2008 | Post-IPO | |||||||
| AMC |
$ | 25.8 | $ | 24.3 | $ | 22.2 | |||
| Cinemark |
20.8 | 18.5 | 16.7 | ||||||
| Regal |
34.9 | 32.7 | 26.9 | ||||||
| NCM, Inc. |
57.8 | 55.6 | 53.3 | ||||||
| Total |
$ | 139.3 | $ | 131.1 | $ | 119.1 | |||
F-22
Table of Contents
During the fiscal year ended January 1, 2009, the Company recorded $14.9 million of distributions (adjusted for distributions funded by cash capital contributions from the founding members) to the noncontrolling interests in excess of their proportionate share of earnings, with a corresponding credit to additional paid in capital (deficit) pursuant to EITF No. 95-7, Implementation Issued Related to the Treatment of Minority Interests in Certain Real Estate Investments Trusts. Beginning with the adoption of SFAS No. 160 at the start of our 2009 fiscal year, EITF No. 95-7 has been nullified and the Company returned to recording all distributions through equity in the same manner it had done prior to 2008. SFAS No. 160 prohibited retrospective adoption.
On January 26, 2006, AMC acquired the Loews Cineplex Entertainment Inc. (“AMC Loews”) theatre circuit. The Loews screen integration agreement, effective as of January 5, 2007 and amended and restated as of February 13, 2007, between NCM LLC and AMC, committed AMC to cause substantially all of the theatres it acquired as part of the Loews theatre circuit to be included in the NCM digital network in accordance with the ESAs on June 1, 2008. In accordance with the Loews screen integration agreement, prior to June 1, 2008 AMC paid the Company amounts based on an agreed-upon calculation to reflect cash amounts that approximated what NCM LLC would have generated if the Company sold on-screen advertising in the Loews theatre chain on an exclusive basis. These AMC Loews payments were made on a quarterly basis in arrears through May 31, 2008, with the exception of Star Theatres, which were paid through February 2009 in accordance with certain run-out provisions. For the years ended December 31, 2009, January 1, 2009 and the 2007 post-IPO period, the AMC Loews payment was $0.1 million, $4.7 million and $11.2 million respectively. The AMC Loews payment was recorded directly to NCM LLC’s members’ equity account.
On April 30, 2008, Regal acquired Consolidated Theatres and NCM issued common membership units to Regal upon the closing of its acquisition in exchange for the right to exclusive access to the theatres (see Note 3). The Consolidated Theatres had a pre-existing advertising agreement and, as a result, Regal must make “integration” payments pursuant to the ESAs on a quarterly basis in arrears through 2011 in accordance with certain run-out provisions. For the years ended December 31, 2009 and January 1, 2009, the Consolidated Theatres payment was $3.2 million and $2.8 million, respectively and represents a cash element of the consideration received for the common membership units issued.
Amounts due to/from founding members at December 31, 2009 were comprised of the following (in millions):
| AMC | Cinemark | Regal | Total | |||||||||||||
| Theatre access fees, net of beverage revenues |
$ | 0.5 | $ | 0.4 | $ | 0.5 | $ | 1.4 | ||||||||
| Cost and other reimbursement |
(0.5 | ) | (0.5 | ) | (0.5 | ) | (1.5 | ) | ||||||||
| Distributions payable, net |
9.9 | 7.9 | 12.1 | 29.9 | ||||||||||||
| Total |
$ | 9.9 | $ | 7.8 | $ | 12.1 | $ | 29.8 | ||||||||
Amounts due to/from founding members at January 1, 2009 were comprised of the following (in millions):
| AMC | Cinemark | Regal | Total | |||||||||||||
| Theatre access fees, net of beverage revenues |
$ | (0.1 | ) | $ | — | $ | 0.7 | $ | 0.6 | |||||||
| Cost and other reimbursement |
(1.1 | ) | (0.5 | ) | (0.6 | ) | (2.2 | ) | ||||||||
| Distributions payable, net |
8.9 | 7.0 | 11.3 | 27.2 | ||||||||||||
| Total |
$ | 7.7 | $ | 6.5 | $ | 11.4 | $ | 25.6 | ||||||||
See Note 5 for information regarding taxes payable to founding members under tax sharing agreement.
F-23
Table of Contents
2007 Pre-IPO Period –
At the formation of NCM LLC and upon the admission of Cinemark as a founding member, circuit share arrangements and administrative services fee arrangements were in place with each founding member. Circuit share cost and administrative fee revenue by founding member were as follows (in millions):
| Pre-IPO Period December 29, 2006 through February 12, 2007 | ||||||
| Circuit Share Cost |
Administrative Fee Revenue | |||||
| AMC |
$ | 4.1 | $ | — | ||
| Cinemark |
3.7 | 0.1 | ||||
| Regal |
6.6 | — | ||||
| Total |
$ | 14.4 | $ | 0.1 | ||
At the closing of the IPO, the founding members entered into amended and restated ESAs, which, among other things, amended the circuit share structure in favor of the theatre access fee structure.
Pursuant to the agreements entered into at the completion of the IPO, amounts owed to the founding members through the date of the IPO of $50.8 million were paid by NCM LLC on March 15, 2007.
Other –
During the years ended December 31, 2009, January 1, 2009, the 2007 post-IPO period, and the 2007 pre-IPO period, AMC, Cinemark and Regal purchased $1.9 million, $2.3 million, $1.4 million and $0.1 million respectively, of NCM LLC’s advertising inventory for their own use. The value of such purchases are calculated by reference to NCM LLC’s advertising rate card and is included in advertising revenue.
Included in Fathom Events operating costs is $1.0 million, $1.8 million, $3.3 million and $0.2 million for the years ended December 31, 2009, January 1, 2009, the 2007 post-IPO period and the 2007 pre-IPO period respectively, related to purchases of movie tickets and concession products from the founding members primarily for marketing resale to NCM LLC’s customers.
8. BORROWINGS
On February 13, 2007, concurrently with the closing of the IPO of NCM, Inc., NCM LLC entered into a senior secured credit facility with a group of lenders. The facility consists of a six-year $80.0 million revolving credit facility and an eight-year, $725.0 million term loan facility. The revolving credit facility portion is available, subject to certain conditions, for general corporate purposes of the Company in the ordinary course of business and for other transactions permitted under the credit agreement, and a portion is available for letters of credit.
The outstanding balance of the term loan facility at December 31, 2009 and January 1, 2009 was $725.0 million. The outstanding balance under the revolving credit facility at December 31, 2009 and January 1, 2009 was $74.0 million. As of December 31, 2009, the effective rate on the term loan was 5.59% including the effect of the interest rate swaps (both those accounted for as hedges and those not). The interest rate swaps hedged $550.0 million of the $725.0 million term loan at a fixed interest rate of 6.734% while the unhedged portion was at an interest rate of 2.01%. The weighted-average interest rate on the unhedged revolver was 1.99%. Commencing with the fourth fiscal quarter in fiscal year 2008, the applicable margin for the revolving credit facility is determined quarterly and is subject to adjustment based upon a consolidated net senior secured leverage ratio for NCM LLC and its subsidiaries (the ratio of secured funded debt less unrestricted cash and cash
F-24
Table of Contents
equivalents, over a non-GAAP measure defined in the credit agreement which is equivalent to Adjusted OIBDA). The senior secured credit facility also contains a number of covenants and financial ratio requirements, with which the Company was in compliance at December 31, 2009, including the consolidated net senior secured leverage ratio. There are no distribution restrictions as long as the Company is in compliance with its debt covenants. As of December 31, 2009, our consolidated net senior secured leverage ratio was 4.0 times the covenant. The debt covenants also require 50% of the term loan, or $362.5 million to be hedged at a fixed rate. As of December 31, 2009, the Company had approximately $550 million or 76% hedged. Of the $550.0 million that is hedged, $137.5 million is with Lehman Brothers Special Financing (“LBSF”). As described further in Note 17, in February 2010 LBSF transferred its interest rate swap agreement to Barclays Bank PLC (“Barclays”). See Note 12 for an additional discussion of the interest rate swaps.
On September 15, 2008, Lehman Brothers Holdings Inc. (“Lehman”) filed for protection under Chapter 11 of the federal Bankruptcy Code in the United States Bankruptcy Court for the Southern District of New York. NCM LLC has an aggregate revolving credit facility commitment of $80.0 million with a consortium of banks, including $20.0 million with Lehman Commercial Paper Inc. (“LCPI”), a subsidiary of Lehman. As of December 31, 2009, NCM LLC borrowed $14.0 million from LCPI under the revolving credit facility. Following the bankruptcy filing, LCPI failed to fund a borrowing request related to its undrawn commitment of $6.0 million. On February 3, 2010, LCPI assigned the $6.0 million commitment to Barclays. Until the LCPI issues are resolved, NCM LLC is not anticipating repaying any of its revolver borrowings as it would effectively result in a permanent reduction of its revolving credit facility, to the extent of any payments of LCPI commitments. In addition, NCM LLC has been working with LCPI and its other lenders with the goal of having LCPI’s agency function transferred to another bank within NCM LLC’s lender group and restructuring LCPI’s outstanding $14.0 million revolving loan such that (i) it would not be required to be repaid, nor would it share in any pro rata prepayments of the revolving loans, until the final maturity date of the revolving credit facility, and (ii) it would not be available for reborrowing in the event that it was prepaid. Until these LCPI issues are resolved, however, NCM LLC is not anticipating repaying any of its revolver borrowings as it would effectively result in a permanent reduction of its revolving credit facility, to the extent of the payments against LCPI borrowings.
On March 19, 2009, the Company gave an $8.5 million note payable to Credit Suisse, Cayman Islands Branch (“Credit Suisse”) with no stated interest to settle the $10.0 million contingent put obligation and to acquire the $20.7 million outstanding principal balance of debt of IdeaCast, Inc. (“IdeaCast”) (together with all accrued interest and other lender costs required to be reimbursed by IdeaCast). Quarterly payments to Credit Suisse began on April 15, 2009 and will continue through January 15, 2011. At issuance the Company recorded the note at a present value of $7.0 million. At December 31, 2009, $4.3 million of the balance is recorded in current liabilities and $0.3 million is included in non-current liabilities. Interest on the note is accreted at the Company’s estimated incremental cost of debt based on then current market indicators over the term of the loan to interest expense. The amount of interest expense recognized on the note for the year ended December 31, 2009 was $0.7 million. See Note 11 “—Contingent Put Obligation” for additional discussion of the IdeaCast restructuring.
Future Maturities of Long-Term Borrowings—
The scheduled annual maturities on the credit facility for the next five years as of December 31, 2009 are as follows (in millions);
| 2010 |
$ | 4.3 | |
| 2011 |
— | ||
| 2012 |
— | ||
| 2013 |
74.0 | ||
| 2014 |
— | ||
| Thereafter |
725.0 | ||
| Total |
$ | 803.3 | |
F-25
Table of Contents
9. SHARE-BASED COMPENSATION
On April 4, 2006, NCM LLC’s board of directors approved the NCM LLC 2006 Unit Option Plan, under which 1,131,728 units were outstanding as of December 28, 2006. Under certain circumstances, holders of unit options could put the options to NCM LLC for cash. As such, the Unit Option Plan was accounted for as a liability plan and the liability was measured at its fair value at each reporting date. The valuation of the liability was determined based on provisions of ASC Topic 718 Compensation – Stock Compensation (formerly SFAS No. 123(R)), and factored into the valuation that the options were granted in contemplation of an IPO. The Company used the estimated pricing of the IPO at the time of the grant to determine the equity value, for each unit underlying the options. The Unit Option Plan allowed for additional equity awards to be issued to outstanding option holders in the event of the occurrence of an IPO, with the purpose of the additional option awards or restricted units being to ensure that the economic value of outstanding unit options, as defined in the agreement, held just prior to an IPO was maintained by the option holder immediately after the offering.
At the date of the IPO, the Company adopted the NCM, Inc. 2007 Equity Incentive Plan. Under the Equity Incentive Plan, the Company issued stock options on 1,589,625 shares of common stock to holders of outstanding unit options in substitution of the unit options and also issued 262,466 shares of restricted stock. In connection with the conversion at the date of the IPO, and pursuant to the antidilution adjustment terms of the Unit Option Plan, the exercise price and the number of shares of common stock subject to options held by the Company’s option holders were adjusted to prevent dilution and restore their economic position to that existing immediately before the IPO. The Equity Incentive Plan is treated as an equity plan under the provisions of Topic 718, and the existing liability under the Unit Option Plan at the end of the 2007 pre-IPO period of $2.3 million was reclassified to equity at the IPO date.
As of December 31, 2009, there were 7,076,000 shares of common stock available for issuance or delivery under the Equity Incentive Plan. Options awarded under the Equity Incentive Plan are generally granted with an exercise price equal to the market price of NCM, Inc. common stock on the date of the grant. Upon vesting of the awards, NCM LLC will issue common membership units to the Company equal to the number of shares of the Company’s common stock represented by such awards. Under the fair value recognition provisions of Topic 718, the Company recognizes stock-based compensation net of an estimated forfeiture rate, and therefore only recognizes stock-based compensation cost for those shares expected to vest over the requisite service period of the award. Options generally vest annually over a three or five-year period and have either 10-year or 15-year contractual terms. A forfeiture rate of 5% was estimated for all employees to reflect the potential separation of employees.
The Company recognized $3.1 million, $2.1 million, $1.9 million, and $0.3 million for the year ended December 31, 2009, January 1, 2009, the 2007 post-IPO period, and the 2007 pre-IPO period, respectively, of share-based compensation expense for these options and $0.1 million and $0.1 million were capitalized during the year ended December 31, 2009 and January 1, 2009, respectively. The income tax benefit recognized in the income statement for share-based compensation was approximately $0.5 million, $0.7 million and $0.8 million for the years ended December 31, 2009 and January 1, 2009 and the post-IPO period, respectively. There was no income tax provision prior to the IPO. As of December 31, 2009, unrecognized compensation cost related to nonvested options was approximately $7.1 million, which will be recognized over a weighted average remaining period of 2.33 years.
The weighted average grant date fair value of granted options was $2.17, $3.77 and $6.23 for the years ended December 31, 2009 and January 1, 2009 and the 2007 post-IPO period, respectively. The intrinsic value of options exercised during the year was $0.2 million for both years ended December 31, 2009 and January 1, 2009. During the year ended December 31, 2009 there was an immaterial amount of cash received on options exercised and $0.6 million received for the 2008 period. For the year ended December 31, 2009 there was no income tax benefit realized from exercises. The total fair value of awards vested during the years ended December 31, 2009 and January 1, 2009 was $0.3 million and $3.9 million, respectively. There were no options vested or exercised prior to the 2008 fiscal year.
F-26
Table of Contents
The fair value of each option grant is estimated on the date of grant using the Black-Scholes option pricing model, which requires that the Company make estimates of various factors. The following assumptions were used in the valuation of the options:
| Fiscal 2009 | Fiscal 2008 | Fiscal 2007 | ||||
| Expected life of options |
6.5 years | 6.5 years | 6.5 to 9 years | |||
| Risk free interest rate |
2.23% to 3.70% | 3.74% to 4.09% | 4.1% to 4.9% | |||
| Expected volatility |
30% | 30% | 30% | |||
| Dividend yield |
3% | 3% | 3% | |||
Activity in the Equity Incentive Plan, as converted, is as follows:
| Shares | Weighted Average Exercise Price |
Weighted Average Remaining Contractual Life (in years) |
Aggregate Intrinsic Value (in millions) | ||||||||
| Outstanding at January 1, 2009 |
2,025,099 | $ | 17.33 | ||||||||
| Granted |
1,156,515 | 9.53 | |||||||||
| Exercised |
(1,800 | ) | 5.35 | ||||||||
| Forfeited |
(53,254 | ) | 14.35 | ||||||||
| Outstanding at December 31, 2009 |
3,126,560 | $ | 14.51 | 9.9 | $ | 9.2 | |||||
| Exercisable at December 31, 2009 |
648,359 | $ | 17.67 | 10.5 | $ | 0.2 | |||||
| Vested and Expected to Vest at December 31, 2009 |
3,090,782 | $ | 14.52 | 9.9 | $ | 9.0 | |||||
The following table summarizes information about the stock options at December 31, 2009, including the weighted average remaining contractual life and weighted average exercise price:
| Options Outstanding | Options Exercisable | |||||||||||
| Range of Exercise Price |
Number Outstanding at Dec. 31, 2009 |
Weighted Average Remaining Life (in years) |
Weighted Average Exercise Price |
Number Exercisable at Dec. 31, 2009 |
Weighted Average Exercise Price | |||||||
| $5.35 – $9.22 |
1,126,350 | 9.0 | $ | 9.06 | 7,800 | $ | 5.35 | |||||
| $11.59 – $15.04 |
136,408 | 8.9 | 13.47 | 14,600 | 12.33 | |||||||
| $16.35 – $18.01 |
1,409,436 | 11.3 | 16.52 | 476,280 | 16.56 | |||||||
| $19.37 – $21.00 |
301,500 | 7.5 | 20.35 | 96,000 | 20.59 | |||||||
| $24.04 – $29.05 |
152,866 | 10.1 | 25.40 | 53,679 | 25.59 | |||||||
| 3,126,560 | 9.9 | $ | 14.51 | 648,359 | $ | 17.67 | ||||||
Non-vested (Restricted) Stock – The Company has a non-vested stock program as part of the Equity Incentive Plan. The plan provides for non-vested stock awards to officers, board members and other key employees. Under the non-vested stock program, common stock of the Company may be granted at no cost to officers, board members and key employees, subject to a continued employment restriction and as such restrictions lapse, the award vests in that proportion. The participants are entitled to cash dividends and to vote their respective shares, although the sale and transfer of such shares is prohibited and the shares are subject to forfeiture during the restricted period. The shares are also subject to the terms and provisions of the Equity
F-27
Table of Contents
Incentive Plan. Non-vested stock awards granted in 2009 include performance vesting conditions, which permit vesting to the extent that the Company achieves specified non-GAAP targets at the end of the three-year period. Non-vested stock granted to non-employee directors vest after one year. Compensation cost is valued based on the market price on the grant date and is expensed over the vesting period.
The following table represents the shares of non-vested stock:
| Shares | Weighted Average Grant- Date Fair Value | |||||
| Non-vested as of January 1, 2009 |
203,618 | $ | 20.91 | |||
| Granted |
424,555 | 9.50 | ||||
| Forfeited |
(12,500 | ) | 10.10 | |||
| Vested |
(25,299 | ) | 21.93 | |||
| Non-vested as of December 31, 2009 |
590,374 | $ | 13.15 | |||
The Company recorded $2.4 million, $1.3 million and $1.2 million in compensation expense related to such outstanding non-vested shares during the years ended December 31, 2009, January 1, 2009 and the 2007 post-IPO period. Minimal amounts were capitalized during the 2009 fiscal year. The income tax benefit recognized in the income statement for non-vested shares was approximately $0.4 million, $0.4 million and $0.5 million for the years ended December 31, 2009, January 1, 2009 and the post-IPO period, respectively. As of December 31, 2009, unrecognized compensation cost related to non-vested stock was approximately $5.1 million, which will be recognized over a weighted average remaining period of 2.27 years. The total fair value of awards vested during the year ended December 31, 2009 was $0.3 million.
10. EMPLOYEE BENEFIT PLANS
NCM sponsors the NCM 401(k) Profit Sharing Plan (the “Plan”) under Section 401(k) of the Internal Revenue Code of 1986, as amended, for the benefit of substantially all full-time employees. The Plan provides that participants may contribute up to 20% of their compensation, subject to Internal Revenue Service limitations. Employee contributions are invested in various investment funds based upon election made by the employee. The Company made discretionary contributions of $0.8 million, $0.8 million, and $0.6 million during the years ended December 31, 2009, January 1, 2009 and December 27, 2007, respectively.
11. COMMITMENTS AND CONTINGENCIES
The Company is subject to claims and legal actions in the ordinary course of business. The Company believes such claims will not have a material adverse effect on its financial position or results of operations.
Operating Lease Commitments
The Company leases office facilities for its headquarters in Centennial, Colorado and also in various cities for its sales and marketing personnel as sales offices. The Company has no capital lease obligations. Total lease expense for the years ended December 31, 2009, January 1, 2009, 2007 post-IPO period and the 2007 pre-IPO period, was $2.3 million, $2.0 million, $1.3 million, and $0.3 million, respectively.
F-28
Table of Contents
Future minimum lease payments under noncancelable operating leases as of December 31, 2009 are as follows (in millions):
| 2010 |
$ | 2.2 | |
| 2011 |
2.1 | ||
| 2012 |
2.0 | ||
| 2013 |
1.9 | ||
| 2014 |
0.8 | ||
| Thereafter |
0.2 | ||
| Total |
$ | 9.2 | |
Contingent Put Obligation
On April 29, 2008, NCM LLC, IdeaCast, the IdeaCast lender and certain of its stockholders agreed to a financial restructuring of IdeaCast. Among other things, the restructuring resulted in the lender being granted an option to “put,” or require NCM LLC to purchase, up to $10 million of the funded convertible debt at par, on or after December 31, 2010 through March 31, 2011. The put was accounted for under ASC Topic 460-10 Guarantees (formerly FIN No. 45 (as amended), Guarantor’s Accounting and Disclosure Requirements for Guarantees, Including Indirect Guarantees of Indebtedness of Others). During the fourth quarter of 2008, the Company determined that the initial investment and call right in IdeaCast were other-than-temporarily impaired due to IdeaCast’s defaults on its senior debt and liquidity issues and that the put obligation was probable. The Company estimated a liability at January 1, 2009 of $4.5 million, which represented the excess of the estimated probable loss on the put (net of estimated recoveries from the net assets of IdeaCast that serve as collateral for the convertible debt) obligation over the unamortized ASC Topic 460-10 liability. The total amount of the impairment and related loss recorded in the fourth quarter of 2008 was $11.5 million.
On March 19, 2009, NCM LLC, IdeaCast and IdeaCast’s lender agreed to certain transactions with respect to the IdeaCast Credit Agreement. Among other things, these agreements resulted in (i) the termination of the Put and the Call; (ii) the transfer, sale and assignment by IdeaCast’s lender to NCM LLC of all of its right, title and interest under the Credit Agreement, including without limitation the loans outstanding under the Credit Agreement; (iii) the resignation of IdeaCast’s lender, and the appointment of NCM LLC, as administrative agent and collateral agent under the Credit Agreement; and (iv) the delivery by NCM LLC to IdeaCast’s lender of a non-interest bearing promissory note in the amount of $8.5 million payable through January 2011. On June 16, 2009, NCM LLC’s interest in the Credit Agreement was assigned to NCM Out-Of-Home, LLC (“OOH”), which was a wholly-owned subsidiary of NCM LLC. OOH was also appointed as administrative agent and collateral agent under the Credit Agreement. On June 16, 2009, OOH, as IdeaCast’s senior secured lender, foreclosed on substantially all of the assets of IdeaCast, consisting of certain tangible and intangible assets (primarily equipment, business processes and contracts with health clubs and programming partners). The assets were valued at approximately $8.2 million. On June 29, 2009, NCM LLC transferred its ownership interest in OOH to RMG, a digital advertising company, in exchange for approximately 24% of the equity (excluding out-of-the-money warrants) of RMG on a fully diluted basis through a combination of convertible preferred stock, common stock and common stock warrants (refer to Note 1-Equity Method Investments). The Company’s investment in RMG was valued at the fair value of the assets contributed.
Minimum Revenue Guarantees
As part of the network affiliate agreements entered in the ordinary course of business under which the Company sells advertising for display in various theatre chains other than those of the founding members of NCM LLC, the Company has agreed to certain minimum revenue guarantees. If an affiliate achieves the attendance set forth in their respective agreement, the Company has guaranteed minimum revenue for the network affiliate per attendee if such amount paid under the revenue share arrangement is less than its guaranteed
F-29
Table of Contents
amount. The amount and term varies for each network affiliate, but ranges from 2-5 years. The maximum potential amount of future payments the Company could be required to make pursuant to the minimum revenue guarantees is $21.2 million over the remaining terms of the network affiliate agreements. For the years ended December 31, 2009 and January 1, 2009 the Company had no liabilities recorded for these obligations as such guarantees are less than the expected share of revenue paid to the affiliate.
12. FAIR VALUE MEASUREMENTS AND DERIVATIVE INSTRUMENTS
Fair Value Measurements—The fair values of the Company’s assets and liabilities measured on a recurring basis pursuant to ASC Topic 820-10 Fair Value Measurements and Disclosures (formerly FAS No. 157, Fair Value Measurements and Disclosures) are as follows (in millions):
| At December 31, 2009 |
Fair Value Measurements at Reporting Date Using | |||||||||
| Quoted Prices in Active Markets for Identical Assets (Level 1) |
Significant Other Observable Inputs (Level 2) |
Significant Unobservable Inputs (Level 3) | ||||||||
| LIABILITIES: |
||||||||||
| Interest Rate Swap Agreements |
$ | 54.6 | — | $ | 54.6 | — | ||||
Derivative Instruments—NCM LLC has interest rate swap agreements with four counterparties that, at their inception, qualified for and were designated as cash flow hedges against interest rate exposure on $550.0 million of the variable rate debt obligations under the senior secured credit facility. The interest rate swap agreements have the effect of converting a portion of the Company’s variable rate debt to a fixed rate of 6.734%. All interest rate swaps were entered into for risk management purposes. The Company has no derivatives for other purposes.
On September 15, 2008, Lehman filed for protection under Chapter 11 of the Federal Bankruptcy Code in the United States Bankruptcy Court for the Southern District of New York. LBSF is the counterparty to a notional amount of $137.5 million of NCM LLC’s interest rate swaps, and Lehman is a guarantor of LBSF’s obligations under such swap. NCM LLC notified LBSF on September 18, 2008 that, as a result of the bankruptcy of Lehman, an event of default had occurred under the swap with respect to which LBSF was the defaulting party. On October 3, 2008, LBSF also filed for Chapter 11 protection, which constituted another default by LBSF under the swap. As a result, as permitted under the terms of NCM LLC’s swap agreement with LBSF, the Company has withheld interest rate swap payments aggregating $5.5 million in the year ended December 31, 2009 and $1.5 million in the year ended January 1, 2009 that were due to LBSF, and has further notified LBSF that the bankruptcy and insolvency of both Lehman and LBSF constitute default events under the swap. As of December 31, 2009 the interest rate swap agreement had not been terminated.
The Company performed an effectiveness test for the swaps with LBSF as of September 14, 2008, the day immediately prior to the default date, and determined they were effective on that date. As a result, the fair values of the interest rate swap on that date was recorded as a liability with an offsetting amount recorded in other comprehensive income. Cash flow hedge accounting was discontinued on September 15, 2008 due to the event of default and the inability of the Company to continue to demonstrate the swap would be effective. The Company continues to record the interest rate swap with LBSF at fair value with any change in the fair value recorded in the statement of operations.
There was an $8.3 million decrease and a $13.8 million increase in the fair value of the liability for the years ended December 31, 2009 and January 1, 2009, respectively, which the Company recorded as a component of interest expense. In accordance with Topic 815 Derivatives and Hedging, the net derivative loss as of September 14, 2008 related to the discontinued cash flow hedge with LBSF shall continue to be reported in
F-30
Table of Contents
accumulated other comprehensive income unless it is probable that the forecasted transaction will not occur by the end of the originally specified time period. Accordingly, the net derivative loss is being amortized to interest expense over the remaining term of the interest rate swap through February 13, 2015. The amount amortized during the years ended December 31, 2009 and January 1, 2009 were $1.3 million and $0.4 million, respectively. The Company estimates approximately $1.3 million will be amortized to interest expense in the next 12 months.
Both at inception and on an on-going basis the Company performs an effectiveness test using the hypothetical derivative method. The fair values of the interest rate swaps with the counterparties other than LBSF (representing notional amounts of $412.5 million associated with a like amount of the variable rate debt) are recorded on the Company’s balance sheet as a liability with the change in fair value recorded in other comprehensive income since the instruments other than LBSF were determined to be perfectly effective at December 31, 2009 and January 1, 2009. There were no amounts reclassified into current earnings due to ineffectiveness during the periods presented other than as described below.
The fair value of the Company’s interest rate swap is based on dealer quotes, and represents an estimate of the amount the Company would receive or pay to terminate the agreements taking into consideration various factors, including current interest rates and the forward yield curve for 3-month LIBOR.
At December 31, 2009 and January 1, 2009, the estimated fair value and line item caption of derivative instruments recorded were as follows (in millions):
| Liability Derivatives | ||||||||||
| As of December 31, 2009 | As of January 1, 2009 | |||||||||
| Balance Sheet Location |
Fair Value |
Balance Sheet Location |
Fair Value | |||||||
| Derivatives designated as hedging instruments: |
||||||||||
| Interest Rate Swaps |
Other Liabilities | $ | 40.9 | Other Liabilities | $ | 65.8 | ||||
| Derivatives not designated as hedging instruments: |
||||||||||
| Interest Rate Swaps |
Other Liabilities | $ | 13.7 | Other Liabilities | $ | 21.9 | ||||
| Total derivatives |
$ | 54.6 | $ | 87.7 | ||||||
The effect of derivative instruments in cash flow hedge relationships on the consolidated financial statements for the year ended December 31, 2009, January 1, 2009, the 2007 post-IPO period were as follows (in millions):
| Unrealized Gain (Loss) Recognized in NCM, Inc’s OCI (Pre-tax) |
Realized Gain (Loss) Recognized in Interest Expense (Pre-tax) | |||||||||||||||||||||||
| Year Ended Dec. 31, 2009 |
Year Ended Jan. 1, 2009 |
Period Feb. 13, 2007 through Dec. 27, 2007 |
Year Ended Dec. 31, 2009 |
Year Ended Jan. 1, 2009 |
Period Feb. 13, 2007 through Dec. 27, 2007 | |||||||||||||||||||
| Interest Rate Swaps |
$ | 9.3 | $ | (67.9 | ) | $ | (12.3 | ) | $ | (16.7 | ) | $ | (8.8 | ) | $ | 2.1 | ||||||||
There was $1.3 million and $0.4 million $0.0 million and $0.0 million of ineffectiveness recognized for the years ended December 31, 2009, January 1, 2009, the 2007 post-IPO period and the 2007 pre-IPO period, respectively.
F-31
Table of Contents
The effect of derivative not designated as hedging instruments under Topic 815 on the consolidated financial statements for the years ended December 31, 2009, January 1, 2009, the 2007 post-IPO period and the 2007 pre-IPO period were as follows (in millions):
| Gain or (Loss) Recognized in Interest Expense (Pre-tax) | |||||||||||
| Year Ended Dec. 31, 2009 |
Year Ended Jan. 1, 2009 |
Period Feb. 13, 2007 through Dec. 27, 2007 | |||||||||
| Borrowings |
$ | (6.2 | ) | $ | (1.0 | ) | $ | — | |||
| Change in derivative fair value |
7.0 | (14.2 | ) | — | |||||||
| Total |
$ | 0.8 | $ | (15.2 | ) | $ | — | ||||
13. NONCONTROLLING INTERESTS
The table below presents the changes in NCM, Inc.’s equity resulting from net income attributable to NCM, Inc. and transfers to or from noncontrolling interests (in millions):
| Year Ended December 31, 2009 |
Year Ended January 1, 2009 |
Period February 13, 2007 through December 27, 2007 |
Period December 29, 2006 through February 12, 2007 |
|||||||||||||||
| Net income (loss) attributable to NCM, Inc. |
$ | 26.1 | $ | 1.0 | $ | 24.8 | $ | (4.2 | ) | |||||||||
| Subsidiary equity issued for purchase of intangible asset |
11.8 | 49.2 | — | — | ||||||||||||||
| Impacts of subsidiary ownership changes |
(11.4 | ) | (0.2 | ) | — | — | ||||||||||||
| NCM, Inc. investment in subsidiary |
— | — | (824.6 | ) | — | |||||||||||||
| Reclass deficit in noncontrolling interest to NCM, Inc. |
— | — | (707.5 | ) | — | |||||||||||||
| Recovery of deficit in noncontrolling interest |
— | 34.2 | 2.3 | — | ||||||||||||||
| Change from net income (loss) attributable to NCM, Inc. and transfers from noncontrolling interests |
$ | 26.5 | $ | 84.2 | $ | (1,505.0 | ) | $ | (4.2 | ) | ||||||||
14. SEGMENT REPORTING
Advertising is the principal business activity of the Company and is the Company’s reportable segment under the requirements of ASC Topic 280, Segment Reporting. Advertising revenue accounts for 88.0%, 89.4%, 91.7% and 87.7% of consolidated revenue for the years ended December 31, 2009, January 1, 2009, the post IPO period and the pre IPO period, respectively. Fathom Consumer Events and Fathom Business Events are operating segments under ASC Topic 280, but do not meet the quantitative thresholds for segment reporting. The following table presents revenues less directly identifiable expenses to arrive at operating income net of direct expenses for the Advertising reportable segment, the combined Fathom Events operating segments, and Network, Administrative and Unallocated costs. Management does not evaluate its segments on a fully allocated cost basis. Therefore, the measure of segment operating income net of direct expenses shown below is not prepared on the same basis as operating income in the consolidated statement of operations and the results below are not indicative of what segment results of operations would have been had it been operated on a fully allocated cost basis. Management cautions that it would be inappropriate to assume that unallocated operating costs are incurred proportional to segment revenue or any directly identifiable segment expenses. Unallocated operating
F-32
Table of Contents
costs consist primarily of network costs, general and administrative costs and other unallocated costs including depreciation and amortization. Management does not track segment assets and, therefore, segment asset information is not presented.
| Year Ended December 31, 2009 (in millions) | ||||||||||||
| Advertising | Other | Network, Administrative and Unallocated Costs |
Consolidated | |||||||||
| Revenue |
$ | 335.1 | $ | 45.5 | $ | 0.1 | $ | 380.7 | ||||
| Operating costs |
72.7 | 29.1 | 101.8 | |||||||||
| Selling and marketing costs |
40.6 | 8.6 | 1.0 | 50.2 | ||||||||
| Other costs |
2.8 | 0.9 | 3.7 | |||||||||
| Operating income, net of direct expenses |
$ | 219.0 | $ | 6.9 | ||||||||
| Network, administrative and other costs |
56.8 | 56.8 | ||||||||||
| Consolidated Operating Income |
$ | 168.2 | ||||||||||
| Year Ended January 1, 2009 (in millions) | ||||||||||||
| Advertising | Other | Network, Administrative and Unallocated Costs |
Consolidated | |||||||||
| Revenue |
$ | 330.3 | $ | 38.9 | $ | 0.3 | $ | 369.5 | ||||
| Operating costs |
68.5 | 25.1 | 93.6 | |||||||||
| Selling and marketing costs |
38.5 | 8.3 | 1.1 | 47.9 | ||||||||
| Other costs |
2.8 | 0.8 | 3.6 | |||||||||
| Operating income, net of direct expenses |
$ | 220.5 | $ | 4.7 | ||||||||
| Network, administrative and other costs |
51.2 | 51.2 | ||||||||||
| Consolidated Operating Income |
$ | 173.2 | ||||||||||
| Period February 13, 2007 through December 27, 2007 (in millions) | ||||||||||||
| Advertising | Other | Network, Administrative and Unallocated Costs |
Consolidated | |||||||||
| Revenue |
$ | 282.7 | $ | 25.4 | $ | 0.2 | $ | 308.3 | ||||
| Operating costs |
50.6 | 15.4 | 66.0 | |||||||||
| Selling and marketing costs |
32.2 | 7.4 | 1.3 | 40.9 | ||||||||
| Other costs |
2.4 | 0.4 | 2.8 | |||||||||
| Operating income, net of direct expenses |
$ | 197.5 | $ | 2.2 | ||||||||
| Network, administrative and other costs |
37.1 | 37.1 | ||||||||||
| Consolidated Operating Income |
$ | 161.5 | ||||||||||
F-33
Table of Contents
| Period December 29, 2006 through February 12, 2007 (in millions) |
|||||||||||||
| Advertising | Other | Network, Administrative and Unallocated Costs |
Consolidated | ||||||||||
| Revenue |
$ | 20.7 | $ | 2.9 | $ | 23.6 | |||||||
| Operating costs |
15.5 | 1.4 | 16.9 | ||||||||||
| Selling and marketing costs |
4.4 | 0.8 | 5.2 | ||||||||||
| Other costs |
0.3 | 0.1 | 0.4 | ||||||||||
| Operating income, net of direct expenses |
$ | 0.5 | $ | 0.6 | |||||||||
| Network, administrative and other costs |
$ | 5.2 | 5.2 | ||||||||||
| Consolidated Operating Income (Loss) |
($ | 4.1 | ) | ||||||||||
The following is a summary of revenues by category, in millions:
| Year Ended December 31, 2009 |
Year Ended January 1, 2009 |
Period February 13, 2007 through December 27, 2007 |
Period December 29, 2006 through February 12, 2007 | |||||||||||
| National Advertising Revenue |
$ | 236.8 | $ | 223.1 | $ | 187.1 | $ | 15.3 | ||||||
| Founding Member Advertising Revenue |
36.3 | 43.3 | 40.9 | — | ||||||||||
| Regional Advertising Revenue |
62.0 | 63.9 | 54.7 | 5.4 | ||||||||||
| Fathom Consumer Revenue |
28.6 | 20.2 | 8.2 | 1.4 | ||||||||||
| Fathom Business Revenue |
16.9 | 18.7 | 17.2 | 1.5 | ||||||||||
| Other Revenue |
0.1 | 0.3 | 0.2 | — | ||||||||||
| Total Revenues |
$ | 380.7 | $ | 369.5 | $ | 308.3 | $ | 23.6 | ||||||
15. VALUATION AND QUALIFYING ACCOUNTS (in millions)
| Year Ended December 31, 2009 |
Year Ended January 1, 2009 |
Period February 13, 2007 through December 27, 2007 |
Period December 29, 2006 through February 12, 2007 |
|||||||||||||||
| ALLOWANCE FOR DOUBTFUL ACCOUNTS: |
||||||||||||||||||
| Balance at beginning of period |
$ | 2.6 | $ | 1.5 | $ | 1.1 | $ | 1.1 | ||||||||||
| Provision for bad debt |
2.4 | 2.3 | 1.0 | 0.1 | ||||||||||||||
| Write-offs, net |
(1.4 | ) | (1.2 | ) | (0.6 | ) | (0.1 | ) | ||||||||||
| Balance at end of period |
$ | 3.6 | $ | 2.6 | $ | 1.5 | $ | 1.1 | ||||||||||
| VALUATION ALLOWANCE ON DEFERRED TAX ASSETS: |
||||||||||||||||||
| Balance at beginning of period |
$ | 2.0 | $ | — | $ | — | $ | — | ||||||||||
| Valuation allowance recorded |
— | 2.0 | — | — | ||||||||||||||
| Adjustment |
(0.1 | ) | — | — | — | |||||||||||||
| Balance at end of period |
$ | 1.9 | $ | 2.0 | $ | — | $ | — | ||||||||||
F-34
Table of Contents
16. QUARTERLY FINANCIAL DATA (UNAUDITED) (in millions, except per share data)
| 2009 | First Quarter |
Second Quarter |
Third Quarter |
Fourth Quarter |
||||||||||
| Operations: |
||||||||||||||
| Revenues |
$ | 73.5 | $ | 92.9 | $ | 95.7 | $ | 118.6 | ||||||
| Operating Expenses |
51.3 | 53.0 | 49.4 | 58.8 | ||||||||||
| Consolidated Net income |
8.3 | 26.0 | 26.4 | 40.6 | ||||||||||
| Net income (loss) attributable to NCM, Inc. |
1.2 | 7.1 | 6.6 | 11.2 | ||||||||||
| Earnings (loss) per NCM, Inc. share, Basic |
0.03 | 0.17 | 0.16 | 0.26 | ||||||||||
| Earnings (loss) per NCM, Inc. share, Diluted |
0.03 | 0.17 | 0.16 | 0.26 | ||||||||||
| 2008 | First Quarter |
Second Quarter |
Third Quarter |
Fourth Quarter |
||||||||||
| Operations: |
||||||||||||||
| Revenues |
$ | 62.7 | $ | 86.7 | $ | 107.7 | $ | 112.4 | ||||||
| Operating Expenses |
45.0 | 47.6 | 50.5 | 53.2 | ||||||||||
| Consolidated Net income |
2.0 | 20.2 | 37.9 | 10.9 | ||||||||||
| Net income (loss) attributable to NCM, Inc. |
(0.4 | ) | 4.3 | 10.9 | (13.8 | ) | ||||||||
| Earnings (loss) per NCM, Inc. share, Basic |
(0.01 | ) | 0.10 | 0.26 | (0.33 | ) | ||||||||
| Earnings (loss) per NCM, Inc. share, Diluted |
(0.01 | ) | 0.10 | 0.26 | (0.33 | ) | ||||||||
17. SUBSEQUENT EVENTS
On January 14, 2010, the Company declared a cash dividend of $0.16 per share on each share of the Company’s common stock (including outstanding restricted stock) to stockholders of record on March 18, 2010 to be paid on April 1, 2010.
Effective February 8, 2010, NCM LLC entered into a novation agreement with Lehman Brothers Special Financing Inc. (“Lehman”) and Barclays Bank PLC (“Barclays”) whereby Lehman transferred to Barclays all the rights, liabilities, duties and obligations of NCM LLC’s interest rate swap agreement with Lehman with identical terms. NCM LLC accepted Barclays as its sole counterparty with respect to the new agreement. The term runs until February 13, 2015, subject to earlier termination upon the occurrence of certain specified events. Subject to the terms of the new agreement, NCM LLC or Barclays will make payments at specified intervals based on the variance between LIBOR and a fixed rate of 4.984% on a notional amount of $137,500,000. NCM LLC effectively pays a rate of 6.734% on this notional amount inclusive of the 1.75% margin currently required by NCM LLC’s credit agreement. The agreement with Barclays is secured by the assets of NCM LLC on a pari passu basis with the credit agreement (as defined in Note 8) and the other interest rates swaps that were entered into by NCM LLC. In consideration of Lehman entering into the transfer, NCM LLC agreed to pay to Lehman the full amount of interest rate swap payments withheld aggregating $7.0 million and an immaterial amount of default interest. The Company expects to redesignate the Barclays interest rate swap agreement as a cash flow hedge.
Effective February 3, 2010, LCPI entered into an assignment and assumption agreement with Barclays whereby LCPI transferred to Barclays the remaining unfunded revolving credit commitment of $6.0 million.
F-35