Attached files
| file | filename |
|---|---|
| EX-32.2 - EX-32.2 - National CineMedia, Inc. | ncmi-ex322_8.htm |
| EX-32.1 - EX-32.1 - National CineMedia, Inc. | ncmi-ex321_11.htm |
| EX-31.2 - EX-31.2 - National CineMedia, Inc. | ncmi-ex312_10.htm |
| EX-31.1 - EX-31.1 - National CineMedia, Inc. | ncmi-ex311_6.htm |
| EX-23.1 - EX-23.1 - National CineMedia, Inc. | ncmi-ex231_13.htm |
| EX-21.1 - EX-21.1 - National CineMedia, Inc. | ncmi-ex211_7.htm |
| EX-10.27.2 - EX-10.27.2 - National CineMedia, Inc. | ncmi-ex10272_363.htm |
| EX-10.26.10 - EX-10.26.10 - National CineMedia, Inc. | ncmi-ex102610_362.htm |
| EX-10.26.9 - EX-10.26.9 - National CineMedia, Inc. | ncmi-ex10269_364.htm |
UNITED STATES
SECURITIES AND EXCHANGE COMMISSION
Washington, D.C. 20549
FORM 10-K
|
☒ |
ANNUAL REPORT PURSUANT TO SECTION 13 OR 15(d) OF THE SECURITIES EXCHANGE ACT OF 1934 |
For the fiscal year ended December 29, 2016
or
|
☐ |
TRANSITION REPORT PURSUANT TO SECTION 13 OR 15(d) OF THE SECURITIES EXCHANGE ACT OF 1934 |
For the transition period from __________________ to __________________
Commission file number: 001-33296
NATIONAL CINEMEDIA, INC.
(Exact name of registrant as specified in its charter)
|
Delaware |
|
20-5665602 |
|
(State or other jurisdiction of |
|
(I.R.S. Employer |
|
|
|
|
|
9110 East Nichols Avenue, Suite 200 |
|
|
|
Centennial, Colorado |
|
80112-3405 |
|
(Address of principal executive offices) |
|
(Zip Code) |
Registrant’s telephone number, including area code: (303) 792-3600
Securities registered pursuant to Section 12(b) of the Act:
|
Common Stock, par value $0.01 per share |
|
The NASDAQ Stock Market LLC |
|
(Title of each class) |
|
(Name of each exchange on which registered) |
Securities registered pursuant to Section 12(g) of the Act: None
Indicate by check mark if the registrant is a well-known seasoned issuer, as defined in Rule 405 of the Securities Act. Yes ☑ No ☐
Indicate by check mark if the registrant is not required to file reports pursuant to Section 13 or Section 15(d) of the Act. Yes ☐ No ☑
Indicate by check mark whether the registrant (1) has filed all reports required to be filed by Section 13 or 15(d) of the Securities Exchange Act of 1934 during the preceding 12 months (or for such shorter period that the registrant was required to file such reports), and (2) has been subject to such filing requirements for the past 90 days. Yes ☑ No ☐
Indicate by check mark whether the registrant has submitted electronically and posted on its corporate website, if any, every Interactive Data File required to be submitted and posted pursuant to Rule 405 of Regulation S-T (§232.405 of this chapter) during the preceding 12 months (or for such shorter period that the registrant was required to submit and post such files). Yes ☑ No ☐
Indicate by check mark if disclosure of delinquent filers pursuant to Item 405 of Regulation S-K (§229.405 of this chapter) is not contained herein, and will not be contained, to the best of registrant’s knowledge, in definitive proxy or information statements incorporated by reference in Part III of this Form 10-K or any amendment to this Form 10-K. ☐
Indicate by check mark whether the registrant is a large accelerated filer, an accelerated filer, a non-accelerated filer, or a smaller reporting company. See the definitions of “large accelerated filer,” “accelerated filer” and “smaller reporting company” in Rule 12b-2 of the Exchange Act.
|
Large accelerated filer |
|
☑ |
|
Accelerated filer |
|
☐ |
|
Non-accelerated filer |
|
☐ (Do not check if a smaller reporting company) |
|
Smaller reporting company |
|
☐ |
Indicate by check mark whether the registrant is a shell company (as defined in Rule 12b-2 of the Act). Yes ☐ No ☑
Based on the closing sales price on June 30, 2016, the aggregate market value of the voting and non-voting common stock held by non-affiliates of the registrant was $906,947,844.
As of February 20, 2017, 63,035,309 shares of the registrant’s common stock (including unvested restricted stock), par value of $0.01 per share, were outstanding.
DOCUMENTS INCORPORATED BY REFERENCE
Certain portions of the registrant’s definitive proxy statement to be used in connection with its Annual Meeting of Stockholders and to be filed within 120 days of December 29, 2016 are incorporated by reference into Part III, Items 10-14, of this report on Form 10-K.
|
|
|
|
|
Page |
|
|
|
|
|
|
|
|
|
|
|
|
|
Item 1. |
|
|
5 |
|
|
|
|
|
|
|
|
Item 1A. |
|
|
15 |
|
|
|
|
|
|
|
|
Item 1B. |
|
|
27 |
|
|
|
|
|
|
|
|
Item 2. |
|
|
27 |
|
|
|
|
|
|
|
|
Item 3. |
|
|
27 |
|
|
|
|
|
|
|
|
Item 4. |
|
|
27 |
|
|
|
|
|
|
|
|
|
|
|
|
|
|
|
|
|
|
|
|
Item 5. |
|
|
27 |
|
|
|
|
|
|
|
|
Item 6. |
|
|
30 |
|
|
|
|
|
|
|
|
Item 7. |
|
Management’s Discussion and Analysis of Financial Condition and Results of Operations |
|
33 |
|
|
|
|
|
|
|
Item 7A. |
|
|
49 |
|
|
|
|
|
|
|
|
Item 8. |
|
|
49 |
|
|
|
|
|
|
|
|
Item 9. |
|
Changes in and Disagreements with Accountants on Accounting and Financial Disclosure |
|
49 |
|
|
|
|
|
|
|
Item 9A. |
|
|
49 |
|
|
|
|
|
|
|
|
Item 9B. |
|
|
52 |
|
|
|
|
|
|
|
|
|
|
|
|
|
|
|
|
|
|
|
|
Item 10. |
|
|
52 |
|
|
|
|
|
|
|
|
Item 11. |
|
|
52 |
|
|
|
|
|
|
|
|
Item 12. |
|
Security Ownership of Certain Beneficial Owners and Management and Related Stockholder Matters |
|
52 |
|
|
|
|
|
|
|
Item 13. |
|
Certain Relationships and Related Transactions, and Director Independence |
|
52 |
|
|
|
|
|
|
|
Item 14. |
|
|
52 |
|
|
|
|
|
|
|
|
|
|
|
|
|
|
|
|
|
|
|
|
Item 15. |
|
|
53 |
|
|
|
|
|
|
|
|
|
54 |
|||
In this document, unless the context otherwise requires:
|
|
• |
“NCM, Inc.,” “the Company,” “we,” “us” or “our” refer to National CineMedia, Inc., a Delaware corporation, and its consolidated subsidiary National CineMedia, LLC. |
|
|
• |
“NCM LLC” refers to National CineMedia, LLC, a Delaware limited liability company, which commenced operations on April 1, 2005, and is the current operating company for our business, which NCM, Inc. acquired an interest in, and became a member and the sole manager of, upon completion of our initial public offering, or “IPO,” which closed on February 13, 2007. |
|
|
• |
“ESAs” refers to the amended and restated exhibitor services agreements entered into by NCM LLC with each of NCM LLC’s founding members upon completion of the IPO, which were further amended and restated on December 26, 2013 in connection with the sale of the Fathom Events business. |
|
|
• |
“AMC” refers to AMC Entertainment Inc. and its subsidiaries, National Cinema Network, Inc., or “NCN,” which contributed assets used in the operations of NCM LLC and formed NCM LLC in March 2005, AMC ShowPlace Theatres, Inc., which joined NCM LLC in June 2010 in connection with AMC’s acquisition of Kerasotes ICON Theatres, AMC Starplex, LLC, which joined NCM LLC in December 2015 in connection with AMC’s acquisition of Starplex Cinemas and American Multi-Cinema, Inc., which is a party to an ESA with NCM LLC. |
|
|
• |
“Cinemark” refers to Cinemark Holdings, Inc. and its subsidiaries, Cinemark Media, Inc., which joined NCM LLC in July 2005, and Cinemark USA, Inc., which is a party to an ESA with NCM LLC. |
|
|
• |
“Regal” refers to Regal Entertainment Group and its subsidiaries, Regal CineMedia Corporation, or “RCM,” which contributed assets used in the operations of NCM LLC, Regal CineMedia Holdings, LLC, which formed NCM LLC in March 2005, and Regal Cinemas, Inc., which is a party to an ESA with NCM LLC. |
|
|
• |
“Founding members” refers to AMC, Cinemark and Regal. |
|
|
• |
“OIBDA” refers to operating income before depreciation and amortization expense. |
|
|
• |
“Adjusted OIBDA” excludes from OIBDA non-cash share based payment costs, merger-related administrative costs and CEO transition costs. |
|
|
• |
“Adjusted OIBDA margin” is calculated by dividing Adjusted OIBDA by total revenue. |
|
|
• |
“DCN” refers to NCM LLC’s Digital Content Network. |
Cautionary Statement Regarding Forward-Looking Statements
In addition to historical information, some of the information in this Form 10-K includes “forward-looking statements.” All statements other than statements of historical facts included in this Form 10-K, including, without limitation, certain statements under “Business,” “Risk Factors” and “Management’s Discussion and Analysis of Financial Condition and Results of Operations,” may constitute forward-looking statements. In some cases, you can identify these “forward-looking statements” by the specific words, including but not limited to “may,” “will,” “can,” “should,” “expects,” “forecast,” “project,” “intend,” “plans,” “anticipates,” “believes,” “estimates,” “predicts,” “potential” or “continue” or the negative of those words and other comparable words. These forward-looking statements involve known and unknown risks and uncertainties, assumptions and other factors, including, but not limited to, the following:
Risks Related to Our Business and Industry
|
|
• |
Significant declines in theater attendance or viewership of the FirstLook pre-show; |
|
|
• |
our plans for developing additional revenue opportunities may not be implemented and may not be achieved; |
|
|
• |
competition within the overall advertising industry; |
|
|
• |
failure to effectively manage or continue our growth; |
|
|
• |
not maintaining our technological advantage; |
|
|
• |
national, regional and local economic conditions; |
3
|
|
• |
our inability to retain or replace our senior management; |
|
|
• |
changes to relationships with NCM LLC’s founding members; |
|
|
• |
founding member and network affiliate government regulation could slow growth; |
|
|
• |
failures or disruptions in our technology systems; |
|
|
• |
infringement of our technology on intellectual property rights owned by others; |
|
|
• |
the content we distribute and user information we collect and maintain through our in-theater, online or mobile services may expose us to liability; |
|
|
• |
changes in regulations relating to the Internet or other areas of our online or mobile services; |
|
|
• |
our revenue and Adjusted OIBDA fluctuate from quarter to quarter and may be unpredictable, which could increase the volatility of our stock price; |
Risks Related to Our Corporate Structure
|
|
• |
we are a holding company with no operations of our own, and we depend on distributions and payments under the NCM LLC operating and management services agreements from NCM LLC to meet our ongoing obligations and to pay cash dividends on our common stock; |
|
|
• |
risks and uncertainties relating to our significant indebtedness and investments, including the availability and adequacy of cash flows to meet our debt service requirements and any other indebtedness that we may incur in the future; |
|
|
• |
NCM LLC’s founding members or their affiliates may have interests that differ from those of us or our public stockholders and they may be able to influence our affairs, compete with us or benefit from corporate opportunities that might otherwise be available to us; |
|
|
• |
future issuance of membership units or preferred stock could dilute the interest of our common stockholders; |
|
|
• |
determination that NCM, Inc. or any of NCM LLC’s founding members is an investment company; |
|
|
• |
determination that any amount of our tax benefits under the tax receivable agreement should not have been available; |
|
|
• |
the effect on our stock price from the substantial number of our shares eligible for sale by the founding members; and |
|
|
• |
other factors described under “Risk Factors” or elsewhere in this Annual Report on Form 10-K. |
This list of factors that may affect future performance and the accuracy of forward-looking statements are illustrative and not exhaustive. Our actual results, performance or achievements could differ materially from those indicated in these statements as a result of additional factors as more fully discussed in the section titled “Risk Factors,” and elsewhere in this Annual Report on Form 10-K. Given these uncertainties, readers are cautioned not to place undue reliance on our forward-looking statements.
All subsequent written and oral forward-looking statements attributable to us or to persons acting on our behalf are expressly qualified in their entirety by these cautionary statements. We disclaim any intention or obligation to update publicly any forward-looking statements, whether as a result of new information, future events or otherwise, except as may be required under applicable securities laws.
4
The Company
NCM, Inc., a Delaware corporation, was organized on October 5, 2006 and began operations on February 13, 2007 upon completion of its IPO. NCM, Inc. is a holding company that manages its consolidated subsidiary, NCM LLC. NCM, Inc. has no business operations or material assets other than its cash and ownership interest of approximately 43.7% of the common membership units in NCM LLC as of December 29, 2016. NCM LLC’s founding members, AMC, Cinemark and Regal, the three largest motion picture exhibition companies in the U.S., held the remaining 56.3% of NCM LLC’s common membership units as of December 29, 2016. NCM, Inc.’s primary source of cash flow from operations is distributions from NCM LLC pursuant to the NCM LLC operating agreement. NCM, Inc. also receives management fees pursuant to a management services agreement with NCM LLC in exchange for providing specific management services to NCM LLC.
NCM LLC has long-term ESAs with the founding members (over 20 years remaining as of December 29, 2016) and multi-year agreements with certain third-party theater circuits, referred to in this document as “network affiliates,” which expire at various dates between July 14, 2017 and July 22, 2031. The ESAs and network affiliate agreements grant NCM LLC exclusive rights in their theaters to sell advertising, subject to limited exceptions.
Our Business
We are America's Movie Network. As the #1 weekend network for Millennials (age 18-34) in the U.S., we are the connector between brands and movie audiences.
We currently derive revenue principally from the sale of advertising to national, regional and local businesses in FirstLook, our cinema advertising and entertainment pre-show seen on movie screens across the U.S. We also sell advertising on our Lobby Entertainment Network (“LEN”), a series of strategically-placed screens located in movie theater lobbies, as well as other forms of advertising and promotions in theater lobbies. In addition, we sell online and mobile advertising through our Cinema Accelerator digital product to reach entertainment audiences beyond the theater.
We believe that the broad reach and digital delivery of our network provides an effective platform for national, regional and local advertisers to reach a large, young, engaged and affluent audience on a targeted and measurable basis.
On-Screen Advertising
FirstLook—Our on-screen FirstLook pre-show was created to provide a more entertaining pre-movie experience for theater patrons while serving as an incremental revenue source for our theater circuit partners. It consists of national, regional and local advertising, as well as long-form entertainment and advertising content provided to us under exclusive multi-year arrangements with leading media, entertainment, technology and other companies (“content partners”).
FirstLook generally ranges in length from 20 to 30 minutes and ends at or about the advertised show time, when the movie trailers and feature film begin. The trailers that run before the feature film are not part of FirstLook.
Because FirstLook is customized by theater circuit, theater location/market, film rating, film genre and film title, we produce and distribute many different versions of FirstLook each month. This programming flexibility provides advertisers with the ability to target specific audience demographics and geographic locations, and gives us the ability to ensure that the content and advertising is age-appropriate for the movie audience. It also enables us to incorporate the branding of a specific theater circuit if desired. We rotate FirstLook’s long-form content segments between theaters approximately every two weeks to ensure that frequent moviegoers are entertained by fresh content.
We also have the capability to deliver three-dimensional (“3-D”) advertising campaigns within a 3-D version of the FirstLook pre-show program prior to 3-D feature films.
All versions of FirstLook are produced by our internal creative team, which is cost-effective and gives us significant flexibility. We also offer pre- and post-production advertising creative services to our clients (primarily local clients who may not have their own creative agency) for a fee.
5
Show Structure—FirstLook is comprised of up to four segments, each approximately four to seven minutes in length.
|
|
• |
Segment four is the first section of FirstLook and begins approximately 20 to 30 minutes prior to the advertised show time and generally includes local advertising. |
|
|
• |
Segment three typically begins approximately 18 minutes prior to the advertised show time and features primarily 15 or 30-second local or regional advertisements by individual theaters, or across an entire DMA® or geographic region, as well as a long-form entertainment content segment from one of our content partners. |
|
|
• |
Segment two begins approximately 13 minutes before the advertised show time and features primarily national and regional advertisements, which are generally 30 or 60 seconds, as well as a long-form entertainment content segment from one of our content partners. |
|
|
• |
Segment one runs closest to the advertised show time at approximately 8 minutes and features primarily national advertisements, which are generally 30 or 60 seconds, as well as a long-form entertainment content segment from one of our content partners. Segment one also includes an advertisement for the founding members’ beverage supplier and a public service announcement (“PSA”). |
The FirstLook pre-show typically includes the following.
National, Regional and Local Advertising—On-screen advertising in FirstLook is sold on a cost per thousand (“CPM”) basis to national clients. We generally sell our national advertising units across our national network by film rating or groups of ratings, or by individual film or film genre grouping. This ability to target various groups of films offers national advertisers a way to target specific audience demographics at various price points and overall cost levels, which we believe expands the number of potential clients.
Local and regional advertising is primarily sold on a per-screen, per-week basis and can also be sold on a CPM basis. Beginning in 2016, the FirstLook pre-show inventory also became available in the STRATA system, a media buying and selling software which allows advertising agencies to buy cinema in the National Spot TV marketplace. Being able to buy both TV and cinema locally in the National Spot marketplace makes it significantly easier for agencies to include cinema in the media mix for their clients and allows us to tap into a new pool of advertising dollars budgeted for National Spot.
Our cinema advertising business has a diverse customer base, consisting of national, regional and local advertisers. As of December 29, 2016, 504 national advertisers across a wide variety of industries have advertised with us. During the year ended December 29, 2016, we derived 70% of our advertising revenue from national clients (including advertising agencies that represent our clients) and 24% of our advertising revenue from thousands of regional and local advertisers across the country (including advertising agencies that represent these clients).
Content. The majority of our entertainment and advertising content segments are provided to us by content partners. Under the terms of the contracts, our content partners make available to us original entertainment content segments that are entertaining, informative or educational in nature in the FirstLook program and make commitments to buy a portion of our advertising inventory at a specified CPM over a one or two-year period with options to renew, exercisable at the content partner’s option. The original content produced by these content partners typically features behind-the-scenes looks at the “making-of” feature films, upcoming broadcasts, cable television shows, or technology products. In 2016, all of our content partners provided approximately two-minute segments.
PSA. We have two-year agreements to exhibit a 40-second courtesy “silence your cell phone” PSA reminding moviegoers to silence their cell phones and refrain from texting during feature films, one with an insurance company and another a candy company which expire at the end of 2017.
3-D Advertising. We also sell 3-D advertising, which runs prior to select 3-D films. These 3-D advertisements are placed at the end of the FirstLook pre-show, after a message instructing the movie audience to put on their 3-D glasses, so that the glasses can be kept on throughout the remainder of FirstLook, the film trailers and the 3-D feature film to provide for a better experience. 3-D advertisements provide average advertising CPMs that are higher than average two-dimensional (“2-D”) pricing due primarily to the fact that 3-D advertisements have heightened recall (based on third-party research).
6
Beverage Advertising—We also have a long-term agreement to exhibit the advertising of the founding members’ beverage supplier. Under the ESAs, up to 90 seconds of the FirstLook program can be sold to the founding members to satisfy their on-screen advertising commitments under their beverage concessionaire agreements at a rate intended to approximate a market rate (per the ESA, the annual CPM change equals the prior year annual percentage change in the advertising CPM charged to unaffiliated third parties during segment one (closest to showtime) of the FirstLook pre-show, limited to the highest advertising CPM being then-charged by NCM LLC). Each of the founding members has a relationship with a beverage concessionaire under which they are obligated to provide on-screen advertising time as part of their agreement to purchase branded beverages sold in their theaters. During 2016, we sold 60 seconds to two of the founding members and 30 seconds to one of the founding members. During 2016, the beverage concessionaire revenue from the founding members’ beverage agreements was 6% of our total revenue.
Theater Circuit Messaging—The FirstLook program also includes time slots for the founding members and network affiliates to advertise various activities associated with the operations of the theaters, including concessions, online ticketing partners, gift card and loyalty programs, special events presented by the theater operator and vendors of services provided to theaters, so long as such promotion is incidental to the vendor’s service or products sold in the theater. This time is provided to the theater operator at no charge and generally includes 45 seconds within 15 minutes of show time, 15 seconds of which will be placed within 12 minutes of show time, and the remainder placed at our discretion.
Lobby Advertising
Lobby Entertainment Network—Our LEN is a network of video screens strategically located throughout the lobbies of all digitally equipped founding members’ theaters, as well as the majority of our network affiliate theaters. As of December 29, 2016, our LEN had 3,029 screens in 1,505 theaters in our network. The LEN screens are placed in high-traffic locations such as concession stands, box offices and other waiting areas. Programming on our LEN consists of an approximately 30-minute loop of branded entertainment content segments created specifically for the lobby with advertisements running between each segment. We have the scheduling flexibility to send different LEN programming to each theater through our DCN, and the same program is displayed simultaneously on all lobby screens within a given theater, which we believe provides the maximum impact for our advertisers.
We sell national and local advertising on the LEN individually or bundled with on-screen or other lobby promotions.
The LEN programming includes up to two minutes for founding members’ advertisements to promote activities associated with the operation of the theaters, including concessions, ticketing partners, gift card and loyalty programs, special events presented by the theater operator and vendors of services provided to theaters, so long as such promotion is incidental to the vendor’s service. Additionally, subject to certain limitations, the LEN programming includes up to two minutes (one minute of which we provide to the founding members at no cost and one minute of which the founding members may purchase) to promote certain non-exclusive cross-marketing relationships entered into by the theater operators for the purpose of increasing theater attendance, which we call “strategic programs.”
Under the terms of the ESAs, the founding members also have the right to install additional screens in their theater lobbies which would not display our LEN programming, but would be used to promote strategic programs or products sold in their theater concessions, bars and dining operations, ticketing partner promotions, gift card and loyalty programs, special events presented by the founding member and vendors of services provided to theaters, so long as such promotion is incidental to the vendor’s service.
Lobby Promotions
We also sell a wide variety of advertising and promotional products in theater lobbies. These products can be sold individually or bundled with on-screen, LEN, online or mobile advertising. Lobby promotions typically include:
|
|
• |
advertising on concession items such as beverage cups, popcorn bags and kids’ trays; |
|
|
• |
coupons and promotional materials, which are customizable by film and are distributed to ticket buyers at the box office or as they exit the theater; |
|
|
• |
tabling displays, product demonstrations and sampling; |
|
|
• |
touch-screen display units and kiosks; and |
|
|
• |
signage throughout the lobbies, including posters, banners, counter cards, danglers, floor mats, standees and window clings. |
7
Under the terms of the ESAs, the founding members may conduct a limited number of lobby promotions at no charge in connection with strategic programs that promote motion pictures; however, such activities will not reduce the lobby promotions inventory available to us.
Our ability to provide in-lobby marketing and promotional placements in conjunction with our cinema advertising products allows us to offer integrated marketing solutions to advertisers that provide multiple touchpoints with theater patrons throughout the movie-going experience, which we believe is a competitive advantage over other national media platforms.
Digital Advertising
The Cinema Accelerator digital product expands cinema advertising beyond the theater environment to reach digitally-connected moviegoers before and after the movie experience, both online and on mobile devices. Cinema Accelerator identifies moviegoers through exclusive first party data sources including geo-location services, beacons and transaction data for the moviegoers that enter the theaters in our network. Using the moviegoer as our filter, we can target specific demographics, genres or layer on other data to provide to our clients with a match against their target audience. Digital ads are then distributed through multiple channels, including online and mobile banners, online and mobile pre-roll video and Facebook newsfeeds to reach moviegoers wherever they may be seeking entertainment information and content.
We sell Cinema Accelerator through a digital sales group that is embedded as part of our national and local sales organizations to enable collaborative, integrated selling.
We believe that new digital products and revenue could be developed and additional in-theater advertisements could be sold as integrated marketing packages with digital offerings as discussed in “Business – Our Strategy”.
Our Network
In-theater advertising and entertainment content is distributed across NCM LLC’s national theater network — the largest digital in-theater network in North America.
Through the use of our proprietary DCN and Digital Content Software (“DCS”), we are able to schedule, deliver, play and reconcile advertising and entertainment content for FirstLook and the LEN on a national, regional, local, theater and auditorium level.
Our DCN is the combination of a satellite distribution network and a terrestrial network, and we also employ a variety of technologies that “wrap” around the satellite process to help provide uninterrupted service to our network of theaters. The DCN is controlled by our Network Operations Center (“NOC”) located in our headquarters in Centennial, CO, which operates 24 hours a day, seven days a week to proactively monitor and manage approximately 670,000 alarm points and approximately 108,000 hardware devices in movie theaters throughout the country. Our NOC interfaces with our satellite provider network to dynamically control the quality, placement, timing of playback and completeness of content within specific auditoriums, and it also allows us to monitor and initiate repairs to the equipment in our digital network of theaters.
Advertising and entertainment content for our FirstLook pre-show and LEN is uploaded from our NOC and is then delivered via multicast technology to all theaters in our network and received by our theater management system, where it is held until displayed in specified theater auditoriums and lobbies according to contract terms. Each theater auditorium and lobby has a hardware and software architecture that controls the content to be shown. After the theater management system receives advertising/entertainment content, confirmation of content playback is returned via satellite to our NOC to be included in “post” reports provided to our advertising clients.
More than 700 million moviegoers annually attend theaters that are currently under contract to present the FirstLook pre-show and LEN programming, including the founding members and over 40 leading national and regional theater network affiliates. A summary of the screens and theaters in our advertising network is set forth in the table below:
Our Network
(As of December 29, 2016)
|
|
|
Advertising Network |
|
|||||||||
|
|
|
Theaters |
|
|
Total Screens |
|
|
% of Total |
|
|||
|
Founding Members |
|
|
1,274 |
|
|
|
17,022 |
|
|
|
82.8 |
% |
|
Network Affiliates |
|
|
348 |
|
|
|
3,526 |
|
|
|
17.2 |
% |
|
Total |
|
|
1,622 |
|
|
|
20,548 |
|
|
|
100.0 |
% |
8
As of December 29, 2016, our FirstLook pre-show was displayed on 100% of network movie screens using digital projectors, with approximately 98% of those screens receiving content through our DCN, representing approximately 98% of our total network attendance. As of December 29, 2016, 18,585, or 90%, of 20,548 total digital screens are equipped with more powerful digital cinema projectors, with the remainder comprised of LCD projectors. Those screens not connected to our DCN display national and regional advertisements on digital projectors with content delivered on USB drives that are shipped to the theaters via overnight delivery services.
Our Team
We had 615 employees as of December 29, 2016. Our employees are located in our Centennial, Colorado headquarters, in our advertising sales offices in New York, Los Angeles, Chicago, and Detroit, and our software development office in Minneapolis. We also have many local advertising account executives and field maintenance technicians that work primarily from their homes throughout the U.S. None of our employees are covered by collective bargaining agreements. We believe that we have a good relationship with our employees.
Sales, Marketing, Research and Creative—We sell our in-theater and online advertising products through our national, local and regional sales teams.
As of December 29, 2016, we had 46 advertising sales and client development related personnel (including management and sales support staff) within our national sales group. During 2016, approximately 30% of the total compensation of the national sales staff was related to bonus or commission, which is based on achieving certain sales targets in order to enhance coordination and teamwork. Our national sales organization has proven to be profitable and scalable, as we have not added a significant number of sales personnel as our network has expanded. Our national sales staff is located in our sales offices in New York City, Woodland Hills, CA (outside Los Angeles), Chicago and Detroit.
Our local and regional advertising sales staff, comprised of account directors and telesales representatives, is located throughout the country, with each covering an average of 112 screens per representative. Their responsibility is to sell cinema advertising to local clients as well as larger regional advertisers. During 2016, approximately 72% of the compensation for local sales staff was based on an individual sales commission on collected sales. As our network and local business grows, it may require the addition of sales personnel to cover the new markets or screens. As of December 29, 2016, we had 202 sales personnel (including management and sales support staff) within our local and regional sales groups, the majority of which work out of their homes located within the markets they sell.
We market our advertising products through our marketing group located primarily in our New York City sales office. We aggressively market and sell directly to clients as well as advertising agencies, including our participation in the television upfront advertising selling process (the “Upfront”), which is launched each year with a presentation to clients and advertising agencies in New York City during the main TV Upfront week. Based on the success of our Upfront efforts, we believe that we are capturing additional market share from traditional advertising media platforms such as broadcast and cable television. We also believe that enhanced research regarding cinema advertising and expanded analytics about our network has aided our sales efforts by providing our customers with compelling statistical evidence of the superiority of our cinema advertising products relative to other advertising mediums based on metrics such as brand recognition, message recall, and likeability which can enable them to target their customers. Our research team conducts our own proprietary studies, and we also commission third-party market research to assist our sales team. We also promote our advertising products through public relations, social media and advertising in national trade publications. As of December 29, 2016, this team had 34 personnel based primarily in New York that focus on the marketing, research, public relations and corporate development aspects of our business.
Our media and creative services department, based primarily in our Centennial, CO headquarters, uses state-of-the-art proprietary and non-proprietary technologies and practices to ensure the highest possible cinematic image and sound quality for our FirstLook pre-show and LEN programming distributed over our network. We provide a full spectrum of 2-D and 3-D production and post-production services to our advertising clients on a per contract fee basis, or as part of their advertising commitment, including audio enhancements, color correction and noise reduction. We believe that our expertise in creating and optimizing content for cinema playback within our FirstLook pre-show has been instrumental in our ability to provide a better experience for movie audiences, as well as enhances our ability to attract and retain our on-screen advertising clients and build and retain relationships with network affiliates. For national clients, our expertise in cinematic production and our ability to tailor advertisements developed for television, online or mobile to the high-definition cinema playback format required for the big screen allows our media team to use existing advertising creative, making it easier to add cinema to their media mix. For local clients, our ability to serve as a creative agency and develop full sight, sound and motion high-definition
9
cinema advertisements to meet their needs and budget reduces a significant barrier to entry for smaller businesses. During 2016, we produced and performed post-production services for approximately 41% of the local advertisements that played across our network. The founding members also engage us for the production of their on-screen concession product advertisements and policy trailers. As of December 29, 2016, we had 59 personnel that focused on the media, production and creative services aspects of our business.
Operations and Planning—As of December 29, 2016, we had 109 personnel based primarily in our Centennial, CO headquarters that focused on the sales operations, planning and network operations aspects of our business.
Enterprise Information Systems, Finance, Legal, People & Organization, Affiliate Partnerships and Administration—As of December 29, 2016, we had 165 personnel based primarily in our Centennial, CO headquarters that focused on the Enterprise Information Systems, Finance, Legal, People & Organization (human resources), Affiliate Partnerships and Administration aspects of our business.
Competition
Our advertising business competes in the estimated $191 billion U.S. advertising industry with many other forms of marketing media, including television, radio, print, internet, mobile and outdoor display advertising. While cinema advertising represents a small portion of the overall advertising industry today, we believe it is well positioned to capitalize on the shift of advertising spending away from traditional media, in particular television where consumers can skip advertisements through DVRs and other new digital technology, to newer and more targeted forms of media.
Our advertising business also competes with many other providers of cinema advertising, which vary substantially in size. As the largest cinema advertising network in the U.S., we believe that we are able to generate economies of scale, operating efficiencies and enhanced opportunities for our clients to reach an engaged movie audience on both a national and local level that allow us to better compete for premium video dollars in the larger advertising marketplace.
Competitive Strengths
We believe that several strengths position us well to compete in an increasingly fragmented media landscape.
Superior National Advertising Network
We believe that our cinema advertising network is an attractive option for marketers on both a national and local level, and delivers measurable results for our clients that are comparable, and indeed superior, to the television, online and mobile, or other video advertising networks that we compete against in the marketplace.
Extensive National Market Coverage—Our contractual agreements with the founding members and network affiliates provide long-term exclusive access (subject to limited exceptions) to sell cinema advertising across the largest network of digitally-equipped theaters in the U.S. This allows us to offer advertisers the broad reach and national scale that they need in an increasingly fragmented media marketplace.
As of December 29, 2016:
|
|
• |
Our advertising network consisted of 20,548 screens (17,022 operated by the founding members) located in 1,622 theaters (1,274 operated by the founding members) in 48 states and the District of Columbia, including each of the top 25 and 50 DMAs®, and 189 DMAs® in total; |
|
|
• |
Approximately 73% of our screens (77% of our attendance) were located within the top 50 U.S. DMAs® and approximately 32% of our screens (37% of our attendance) were located within the top 10 U.S. DMAs®. Theaters within our network represented approximately 70%, 68%, and 66% of the total theater attendance in theaters that present advertising in the top 10, top 25 and top 50 U.S. DMAs®, respectively and 63% for all DMAs®, providing a very attractive platform for national advertisers who want exposure in larger markets or on a national basis; |
|
|
• |
Our total annual network theater attendance was approximately 688.8 million (586.2 million from the founding members), which decreased 0.8% compared to 2015. Our network of modern theaters represented approximately 57% of the total U.S. theater attendance, with some of the most highly attended theaters in the industry, as measured by screens per location and attendance per screen; |
|
|
• |
The average screens per theater in our network was 12.7 screens, 1.8 times the U.S. theater industry average, and the aggregate annual attendance per screen of theaters included in our network during 2016 was 33,523, versus the U.S. theater industry average attendance per indoor screen of 32,893, using metrics reported by the National Association of Theatre Owners (“NATO”). |
10
Scalable, State-of-the-Art Digital Content Distribution Technology—Our use of the combination of satellite and terrestrial network technology, combined with the design and functionality of our DCS and NOC infrastructure, makes our network efficient and scalable and also allows us to target specific audiences and provide advertising scheduling flexibility and reporting. We have also focused our efforts on shortening lead times through our Turbo initiative to accelerate the delivery time of media from proposal to on-screen across our network of movie theaters nationwide. While we had been able to offer this to national clients previously, this has also allowed us to shorten the lead-times for local and regional advertisers to run their ads in the FirstLook pre-show to less than 72 hours from proposal to delivery of the ad on screen (comparable to TV), which is a significant improvement over the cinema industry’s traditional turn-around time frame and gives businesses that rely on time-sensitive promotional advertising strategies, such as car dealerships, retail stores and Quick Service Restaurants (“QSR”), the opportunity to take advantage of the power of cinema.
This scalability of our distribution technology has allowed us to expand our cinema advertising network with minimal additional capital expenditures or personnel, and we expect to benefit from this scalability in the future as we add new theaters from the founding members, our existing network affiliate relationships and the addition of new network affiliates.
Millennials, Content and Data
We believe that the Millennial audiences (age 18-34) in our network of theaters, the premium content of Hollywood films and our FirstLook pre-show, and the advances we have made in cinema advertising data all give us a competitive advantage in the media marketplace.
Access to a Highly Attractive, Engaged Audience—We offer advertisers the ability to reach highly-coveted target demographics, including young, affluent, and educated moviegoers. According to Nielsen Cinema Audience Reports for 2016, 54% of the NCM LLC audience were between the ages of 12-34 and our Millennial movie-going audience (age 18-34) grew over 16% in 2015, compared to 2014 and was up 4% in 2016. Further, 38% of NCM LLC moviegoers have a household income greater than $100,000 (versus 28% of the general population) and 37% have received a Bachelor’s degree or higher (versus 29% of the general population) according to the 2016 Doublebase GfK MRI Study.
Because of the impact of cinema’s state-of-the-art immersive video and audio presentation, we also believe that movie audiences are highly engaged with the advertising and entertainment content that they view in our distraction-free theater environment. According to industry research, cinema advertising has significantly higher recall rates than advertising shown on television. And, cinema is one of the few advertising mediums where the ability to skip or turn off the marketing messages is limited.
Innovative, Branded Pre-Feature Content—The film content created by Hollywood studios is considered by many to be the finest entertainment content in the world, which creates a highly-desirable advertising environment for brands. We believe that our entertainment and advertising pre-feature program, FirstLook, provides a high-quality entertainment experience for theater audiences and an effective marketing platform for advertisers. By partnering with leading media, entertainment, technology and other companies, we are able to provide better original content for our audience and more impact for the advertiser. Because we offer local and national “pods” within our FirstLook pre-show, we are consistent with the placement of ads on television networks, which allows us to be more easily integrated into traditional sight-sound-and-motion media buys.
Superior Audience Measurability and Targeting—As with many other advertising mediums, we are measured by third-party research companies such as Nielsen Holdings PLC that provide us with the percentage of the total attendance in their seats at various times during our FirstLook pre-show. What differentiates us from other advertising mediums, however, is that we also receive monthly attendance information by film, by rating and by screen for all of the founding member theaters and the theaters operated by our network affiliates, which allows us to report the actual audience size for each showing of a film, including our FirstLook pre-show. We believe that the ability to provide this level of detailed information to our clients gives us a distinct competitive advantage over traditional media platforms whose measurement is based only on extrapolations of a very small sample of the total audience.
During 2016, we continued to invest in our inventory management systems to expand our ability to target audiences by film genre. Our Cinema Audience Targeting Optimizer (“CATO”) now allows advertisers to go beyond targeting by the Motion Picture Association of America (“MPAA”) rating (G/PG, PG13 and R) to build media schedules at the film and genre level, more effectively targeting a brand’s key audience by matching it to the movie titles and/or genres that can best deliver that audience in a given campaign schedule.
11
In 2016, we also began the development of our cloud-based Data Management Platform (“DMP”) which we believe will allow us to provide even more robust campaign data and analytics to our clients. To further enhance the connection between brands and movie audiences, we will also be filtering media schedules through our new DMP – the first of its kind in the cinema industry – which will allow us to offer transaction-based insights, better targeted campaigns and closed-loop return on investment.
Integrated Marketing Products
Our ability to bundle our on-screen advertising opportunities with integrated lobby, online and mobile marketing products allow us to offer advertisers multiple touchpoints to reach movie audiences before, during and after the film to execute true 360-degree marketing programs. We believe these multiple marketing impressions throughout the entire entertainment experience allows our advertisers to extend the exposure for their brands and products and create a more engaging relationship with the consumer that is not available with broadcast or cable television or traditional display advertising.
Contractual Theater Circuit Partner and Advertiser Relationships
Our exclusive multi-year contractual relationships with our founding members and network affiliates allow us to offer advertisers a national network with the scale, flexibility and targeting to meet their marketing needs. Our exclusive multi-year contractual relationships with our content partners and PSA sponsors, as well as our agreements to satisfy the founding members’ on-screen marketing obligations to their beverage concessionaires, provide us with a significant upfront revenue commitment, accounting for approximately 30% of our total revenue for the year ended December 29, 2016. In addition, our participation in the annual advertising Upfront marketplace has allowed us to secure significant annual upfront commitments from national advertisers looking to secure premium cinema inventory.
Strong Operating Margins with Limited Capital Requirements
Our annual Adjusted OIBDA margins have been consistently strong, ranging from approximately 49% to 52% over the last five years. (Refer to “Item 6. Selected Financial Data-Notes to the Selected Historical Financial and Operating Data” for a discussion of the calculation of Adjusted OIBDA margin, which is a non-GAAP financial measure, and the reconciliation to operating income.) In addition, the founding members and their Digital Cinema Integration Partners, LLC (“DCIP”) joint venture have invested substantial capital to deploy, expand and upgrade the network equipment within their theaters including the recent deployment of the newer and higher quality digital cinema equipment. Due to the network equipment investments made by the founding members and network affiliates (in some cases through the DCIP digital cinema implementation joint venture) in new and acquired theaters and the requirements in the ESAs for the founding members to make future investments for equipment replacements, and the scalable nature of our NOC and other infrastructure, we do not expect to make major capital investments to grow our operations as our network of theaters expands.
Our capital expenditures have ranged from approximately 2% to 3% of revenues over the last five years. For the year ended December 29, 2016, our capital expenditures were $13.3 million, of which only $1.1 million primarily related to investments in network equipment to add new network affiliate theaters. We believe our expected level of Adjusted OIBDA and capital expenditures should provide us with the strategic and financial flexibility to pursue the further expansion of our national theater network, invest in other growth opportunities and continue to make dividend payments to our stockholders.
Our Strategy
We are continuing to pursue a growth strategy that involves growing our network affiliate partnerships, growing on-screen revenue, expanding digital product offerings, ensuring that we are the first choice for our customers, developing our people and capabilities, and allocating resources to strategy.
Grow the Business
We intend to focus on growing our business in the following strategic ways.
Grow Affiliate Partnerships—Our relationships with our exhibitors are a key and renewed focus of our business. In 2016, we created a new Affiliate Partnership team dedicated to serving the needs of our founding member theater circuits and our more than 40 network affiliates nationwide. We continuously seek to expand our theater circuit customer base and add new network affiliate partners to our network that will allow us to increase our revenue by increasing the number of impressions we have available to sell to advertisers. It is also important to note that, under the terms of the ESAs and common unit adjustment agreement with the founding members and our network affiliate agreements, all new theaters built or acquired (subject to existing advertising sales agreements) by the founding members or network affiliates will become part of our network. Since NCM Inc.’s February 2007 IPO, the founding members have added approximately 4,000 net new
12
screens and 38 network affiliates have been added to our network with approximately 2,600 screens. During 2016, we added 187 net screens from the founding members and network affiliates and thus far in 2017 we have entered into contracts to add new affiliates with 370 screens. We expect this expansion to continue to improve our geographic coverage and enhance our ability to compete with other national advertising mediums, which will allow our exhibitor customers to maximize the advertising value of their audiences.
Grow On-Screen Revenue—We plan to continue our successful strategy of selling our inventory like premium video in the larger advertising marketplace, once again utilizing the annual television upfront selling process to maximize our use of inventory. This Upfront strategy has yielded positive results over the past five years, and we believe that the increased market awareness among media buyers and clients raises our credibility as a medium and allows us to gain upfront commitments traditionally made exclusively to cable and broadcast television networks, and more recently online and mobile networks. Further, we believe it will help to increase our share of video advertising spending by increasing the number of clients and client industries that buy our network. Over time, this greater shift toward more Upfront commitments allows us to bundle several flights throughout the year and stabilize month-to-month and quarter-to-quarter CPM volatility by increasing overall inventory utilization and balancing that utilization throughout the year. Consistent with the television industry upfront booking practices, a portion of our upfront commitments have cancellation options or options to reduce the amount that advertisers may purchase that could reduce what is ultimately spent by clients that have made upfront commitments and we would need to rely on the scatter market to replace those commitments.
At our fifth annual Upfront presentation in May of 2016 during the TV Upfront week, we announced several initiatives for better data-enhanced targeting, including CATO, which allows advertisers to go beyond targeting by MPAA rating to build media schedules at the film and genre level, and our new DMP – the first of its kind in the cinema industry – which will allow us to offer transaction-based insights, better targeted campaigns and closed-loop return on investment. We believe that these enhanced targeting capabilities will help to attract and retain a larger and more diverse range of advertising clients and thus grow our revenue.
We also intend to increase our market share of local and regional advertising spending by aggressively pursuing further integration into agency planning and buying tools, such as our relationship with STRATA, a leader in media buying and selling software, which allowed agencies to buy cinema advertising in the National Spot marketplace for the first time in 2016. By making NCM an option in this and other industrywide and in-house agency planning and buying systems, we believe we can remove barriers to entry by incorporating cinema into media plans and tapping into new pools of advertising dollars. We also plan to introduce additional ways to optimize our regional inventory into our regional sales process, including expanding national, and instituting dynamic pricing that is responsive to week-to-week market demand and inventory availability on a regional level as we have successfully done on a national level.
Collect and Leverage Movie Audience Data—We intend to continue to secure additional data partnerships that will allow us to collect and leverage movie audience data to enhance the attractiveness of our cinema advertising products to advertisers. In addition, we plan to enhance and expand our digital marketing products beyond our Cinema Accelerator product, which identifies moviegoers’ mobile devices as they enter a theater, and re-engages them with a brand’s messages wherever they are consuming content — on mobile devices, social media, or online.
Reinvent the Lobby—As our founding member and network affiliate theater circuit partners continue to reinvent their lobby business, we plan to work with them and follow their lead to leverage technology partnerships and stabilize other lobby inventory to make the lobby a better source of advertising revenue for both our advertising customers and our circuit partners.
Be the First Choice for Customers
Our approach is to always strive to be the first choice for our customers, including our advertising and agency customers, our exhibitors, and movie studios. By offering innovative on-screen, in-lobby and digital cinema advertising solutions to connect brands to unique, engaged and valuable young adult audiences at scale, we believe we can offer our advertiser and agency customers a valuable and effective marketing option that cannot be duplicated in any other medium. As the first choice for our customers, we can continue to expand our advertising client base and increase our market share of U.S. advertising spending. Our national sales team was successful in adding 34 clients in 2016 that were first time clients or had not advertised with us since our IPO. These new clients added in 2016 included companies in the apparel, beer, cable TV, computer hardware, department store, financial products and services, fitness, home audio equipment, home product, hotels and resorts, internet site, movie studio, personal care product, prepared food, family restaurant, supermarket, telecommunication hardware, tourism, toy and video game industries. Despite this growth, we believe there are still thousands of potential clients that currently advertise on other mediums such as television but have yet to advertise on our
13
network. These strategies are designed to expand our relationships with existing advertising clients and broaden our advertising client base in new and existing client industries.
Develop People and Capabilities
Our success is tied to the quality of our management and staff. In order to ensure that we retain and attract high quality personnel, we seek to foster and maintain a culture that focuses on teamwork, personal growth, inclusion and diversity. We will continue to make meaningful investments in internal and external training programs for our management and staff to ensure that our personnel have, or build, the skillsets necessary to support our evolution and growth objectives. We have also adopted a succession plan that includes short-term and long-term planning elements to allow us to successfully continue operations should any of our senior management team become unavailable to us.
Resources to Strategy
We will continue to assess and eliminate off-target resources for a strategic focus on the future of NCM. We will be allocating resources to continuity and growth, with a focus from our staff on financial responsibility with company resources.
Dividend Policy
Our dividend policy is described in “Item 5. Market for Registrant’s Common Equity, Related Stockholder Matters and Issuer Purchases of Equity Securities—Dividend Policy”.
Intellectual Property Rights
We have been granted a perpetual, royalty-free license from the founding members to use certain proprietary software for the delivery of digital advertising and other content through our DCN to screens in the U.S. We have made improvements to this software since the IPO date and we own those improvements exclusively, except for improvements that were developed jointly by us and the founding members.
We have secured U.S. trademark registrations for NCM, National CineMedia, NCM Media Networks, and Movie Night Out. It is our practice to defend our trademarks and other intellectual property rights, including the associated goodwill, from infringement by others. We are aware that other persons or entities may use names and marks containing variations of our registered trademarks and other marks and trade names. Potentially, claims alleging infringement of intellectual property rights, such as trademark infringement, could be brought against us by the users of those other names and marks. If any such infringement claim were to prove successful in preventing us from either using or prohibiting a competitor’s use of our registered trademarks or other marks or trade names, our ability to build brand identity could be negatively impacted.
Government Regulation
Currently, we are not subject to regulations specific to the sale and distribution of cinema advertising. We are subject to federal, state and local laws that govern businesses generally such as wage and hour and worker compensation laws.
Available Information
We maintain a website at www.ncm.com, on which we will post free of charge our annual reports on Form 10-K, quarterly reports on Form 10-Q, current reports on Form 8-K, and any amendments to these reports under the heading “Investor Relations” located at the bottom of the page as soon as reasonably practicable after we electronically file such material with, or furnish it to, the Securities and Exchange Commission (the “SEC”). We also regularly post information about the Company on the Investor Relations page. We do not incorporate the information on our website into this document and you should not consider any information on, or that can be accessed through, our website as part of this document. You may read and copy any materials we file with the SEC at the Securities and Exchange Commission Public Reference Room at 100 F. Street, N.E., Washington, D.C. 20549. The SEC also maintains a website that contains our reports and other information at www.sec.gov.
Executive Officers of the Registrant
Shown below are the names, ages as of the filing date of this Form 10-K, and current positions of our executive officers. There are no family relationships between any of the persons listed below, or between any of such persons and any of the directors of the Company or any persons nominated or chosen by the Company to become a director or executive officer of the Company.
14
|
Name |
|
Age |
|
Position |
|
Andrew J. England |
|
52 |
|
Chief Executive Officer and Director |
|
Clifford E. Marks |
|
55 |
|
President |
|
Katherine L. Scherping |
|
57 |
|
Chief Financial Officer |
|
Ralph E. Hardy |
|
66 |
|
Executive Vice President and General Counsel |
|
Geri R. House |
|
40 |
|
Executive Vice President, People and Organization |
Andrew J. England. Mr. England was appointed Chief Executive Officer and Director of NCM, Inc. on January 1, 2016. Mr. England has a long career in marketing, previously serving as the Executive Vice President and Chief Marketing Officer of MillerCoors, LLC from 2010 until July 2015. From 2008 to 2010, Mr. England served as the Chief Marketing Officer of the then newly formed MillerCoors, LLC. From 2006 to 2008 he served as Chief Marketing Officer of Coors Brewing Co. Prior to that, Mr. England was Vice President and General Manager of Hershey’s Snacks division, Director of the Reese’s Brand, and carried out various marketing and brand management roles for over ten years at Nabisco Biscuit Company and Cadbury Schweppes. Mr. England holds a Master of Business Administration degree from Stanford University and a bachelor’s degree in Engineering Science from Durham University in the United Kingdom.
Clifford E. Marks. Mr. Marks was appointed President of NCM, Inc. in May 2016. Prior to his current position, Mr. Marks served as President of Sales and Marketing of NCM, Inc. in February 2007 and held those same positions with NCM LLC since March 2005. He has been an advertising, marketing and sales professional for 25 years. Mr. Marks also served as president of sales and marketing with Regal Entertainment Group’s media subsidiary, Regal CineMedia Corporation, from May 2002 to May 2005. Before joining Regal CineMedia, Mr. Marks was a senior vice president at ESPN/ABC Sports where he oversaw its advertising sales organization from 1998 to May 2002.
Katherine L. Scherping. Ms. Scherping was appointed Chief Financial Officer in August 2016. Prior to joining NCM, Inc., Ms. Scherping served as interim President and Chief Executive Officer of QCE LLC and subsidiaries (d/b/a Quiznos) since June 2016 to July 2016 and as Chief Financial Officer from December 2013 to July 2016. From October 2011 through July 2016, Ms. Scherping was a consultant for Deloitte LLP, providing leadership training to partners and other executives. From June 2005 to July 2011, she served as Chief Financial Officer of Red Robin Gourmet Burgers, Inc. Ms. Scherping holds a Bachelor of Science degree in accounting from Northern Illinois University and is a certified public accountant.
Ralph E. Hardy. Mr. Hardy was appointed Executive Vice President and General Counsel of NCM, Inc. in February 2007 and held those same positions with NCM LLC since March 2005. Prior to his current position, from May 2002 to May 2005, Mr. Hardy served as Executive Vice President and General Counsel for Regal CineMedia Corporation. From 1989 to 2002, Mr. Hardy has held various legal executive positions with United Artists Theatre Company and its predecessors.
Geri R. House. Ms. House was appointed Executive Vice President, People and Organization of NCM, Inc. on January 19, 2017, and held that same position with NCM LLC since January 2015. Prior to this position, from November 2010 to January 2015, Ms. House served as Senior Vice President, People and Organization for NCM LLC, and from February 2010 to November 2010 as Vice President, Deputy General Counsel and Assistant Secretary for NCM LLC. From 2002 to 2010, Ms. House was in a private practice with two international law firms, Hogan Lovells and Faegre Baker Daniels, where she specialized in commercial litigation as well as employment litigation and counseling. Ms. House holds a Bachelor of Arts degree from Simon Fraser University in Canada and a Juris Doctor degree from Harvard Law School.
Ownership of the common stock and other securities of the Company involves certain risks. Holders of the Company’s securities and prospective investors should consider carefully the following risks and other information in this document, including our historical financial statements and related notes included herein. The risks and uncertainties described in this document are not the only ones facing us. If any of the risks and uncertainties described in this document actually occur, our business, financial condition and results of operations could be adversely affected in a material way. This could cause the trading price of our common stock to decline, perhaps significantly, and you may lose part or all of your investment.
Risks Related to Our Business and Industry
Significant declines in theater attendance or viewership of our FirstLook pre-show could reduce the attractiveness of cinema advertising and could reduce our revenue
Our business is affected by the level of attendance at the founding member’s theaters and to a lesser extent our network affiliates, who operate in a highly competitive industry whose attendance is reliant on the presence of motion pictures that
15
attract audiences. Over the last 20 years, theater attendance has fluctuated from year to year but on average has remained relatively flat at an aggregate annual growth rate of less than 0.5%. The value of our advertising business could be adversely affected by a decline in theater attendance or even the perception by media buyers that our network is no longer relevant to their marketing plan due to the decreases in attendance and geographic coverage. Further, the value of our national on-screen advertising and to a lesser extent our local and regional advertising is based on the number of theater patrons that are in their seats and thus have the opportunity to view the FirstLook pre-show. Factors that could reduce attendance at our network theaters or viewership of our FirstLook pre-show include the following:
|
|
• |
if NCM LLC’s network theater circuits cannot compete with other out-of-home entertainment due to an increase in the use of alternative film delivery methods (and the shortening of the “release window” between the release of major motion pictures to the alternative delivery methods), including network, syndicated cable and satellite television and DVDs, as well as video-on-demand, pay-per-view services, video streaming and downloads via the Internet; |
|
|
• |
theater circuits in NCM LLC’s network continue to renovate auditoriums in certain of their theaters to install new larger, more comfortable seating, which reduces the number of seats in a theater auditorium. This renovation has been viewed favorably by patrons and many theater circuits have noted an intent to continue such renovations; |
|
|
• |
many theater circuits in NCM LLC’s network offer reserved seating (utilized in approximately 19% of our network as of December 29, 2016), often in the newly renovated theaters described above, which allows patrons to reserve a seat which could affect how early patrons arrive to the theater and reduce the number of patrons that are in a theater seat to view the FirstLook pre-show; |
|
|
• |
changes in theater operating policies and patron amenities, including the number and length of trailers for upcoming films that are played prior to the start of the feature film, which if the length of trailers increases, it could result in the FirstLook pre-show starting further out from the show time of the film; |
|
|
• |
any reduction in consumer confidence or disposable income in general that reduces the demand for motion pictures or adversely affects the motion picture production industry; |
|
|
• |
the success of first-run motion pictures, which depends upon the production and marketing efforts of the major studios and the attractiveness and value proposition of the movies to consumers compared to other forms of entertainment; |
|
|
• |
if the theaters in our network fail to maintain their theaters and provide amenities that consumers prefer; |
|
|
• |
if studios begin to reduce the number of feature films produced and their investments in those films or reduce the investments made to market those films; |
|
|
• |
if future theater attendance declines significantly over an extended time period, one or more of the founding members or network affiliates may face financial difficulties and could be forced to sell or close theaters or reduce the number of screens it builds or upgrades; and |
|
|
• |
NCM LLC’s network theater circuits also may not successfully compete for licenses to exhibit quality films and are not assured a consistent supply of motion pictures since they do not have long-term arrangements with major film distributors. |
Any of these circumstances could reduce our revenue because our national advertising revenue, and local advertising to a lesser extent, depends on the number of theater patrons who view our advertising and pre-feature show.
Our plans for developing additional revenue opportunities may not be implemented and may not be achieved
We are considering potential opportunities for revenue growth, which we describe in “Business—Our Strategy.” The development of our online and mobile advertising network and mobile apps, as well as, collecting and leveraging movie audience data, and the integration of these marketing products with our core on-screen and theater lobby production is at an
16
early stage and is under increasing competitive pressure from many online and mobile networks and others, and may not deliver the future benefits that we are expecting. Should these offerings not continue to grow in importance to advertising clients and agencies, they may not provide a way to help expand our cinema advertising business as it matures and begins to compete with new or improved advertising platforms including online and mobile video services.
The markets for advertising are competitive and we may be unable to compete successfully
The market for advertising is very competitive. Cinema advertising is a small component of video advertising in the U.S. and thus, we must compete with established, larger and better known national and local media platforms such as cable, broadcast and satellite television networks and other video media platforms including those distributed on the internet and mobile networks. In addition to these video advertising platforms, we compete to a lesser extent for advertising directly with several additional media platforms, including radio, various local print media and billboards. We also compete with several other local and national cinema advertising companies. We expect all of these competitors to devote significant effort to maintaining and growing their business at our expense. We also expect existing competitors and new entrants to the advertising business, most notably the online and mobile advertising companies, to constantly revise and improve their business models to meet expectations of advertising clients or competing media platforms, including us. If we cannot respond effectively to changes in the media marketplace in response to new entrants or advances by our existing competitors, our business may be adversely affected.
Our business and operations have experienced growth, and we may be unable to effectively manage or continue the growth of our network and advertising inventory
We have experienced, and may continue to experience, growth in our headcount and operations, which has placed, and could continue to place, significant demands on our management and operational infrastructure. If we do not effectively manage our growth, the quality of our services could suffer, which could negatively affect our brand and our relationships with our current advertising clients. High turnover, loss of specialized talent or insufficient capital could also place significant demands on management and the success of the organization. Additionally, we may not be able to continue to expand our network and our advertising inventory which could negatively affect our ability to add new advertising clients. To effectively manage this growth and continue to expand our network and inventory, we will need to continue to improve our systems. These enhancements and improvements could require an additional allocation of financial and management resources. If the improvements are not implemented successfully in a timely manner, our ability to manage our limited advertising inventory, create improved audience targeting capabilities for our clients and continue our growth in the future will be impaired and we may have to make significant additional expenditures to address these issues. Further, the amount of inventory we have to sell is limited by the length of the FirstLook pre-show and in order to maintain growth we will need to expand the number of theaters and screens in our network. If we are unable to maintain the size of our network, or grow our network, our revenue and operating results could be adversely impacted.
If we do not continue to upgrade our technology, our business could fail to grow and revenue and operating margins could decline
Failure to successfully or cost-effectively implement upgrades to our in-theater advertising network and proposal and inventory control, audience targeting and other management systems could limit our ability to offer our clients innovative unique, integrated and targeted marketing products, which could limit our future revenue growth. New advertising platforms such as online and mobile networks, and traditional mediums including television networks are beginning to use new digital technology to reach a broader audience with more targeted marketing products, and failure by us to upgrade our technology could hurt our ability to compete with those companies. Under the ESAs, the founding members are required to provide technology that is consistent with that in place at the signing of the ESA. We may request that the founding members upgrade the equipment or software installed in their theaters, but we must negotiate with the founding members as to the terms of such upgrade, including cost sharing terms, if any. If we are not able to come to an agreement on a future upgrade request, we may elect to pay for the upgrades requested which could result in our incurring significant capital expenditures, which could adversely affect our results. Over the last several years, we have been upgrading our proposal and inventory control systems, and developing enhancements to these systems that will allow us to target theater audiences more effectively. The failure or delay in implementation of such upgrades or problems with the integration with our other systems and software could slow or prevent the growth of our business in the future. In addition, the failure or delay in implementation of such upgrades or problems with the integration of our systems and software could slow or prevent the growth of our business.
17
Economic uncertainty or deterioration in economic conditions may adversely impact our business, operating results or financial condition
The financial markets have experienced in the not so distant past extreme disruption and volatility and certain parts of the world-wide economy remain fragile. A future decline in consumer confidence in the U.S. may lead to decreased demand for our services or delay in payments by our advertising customers. As a result, our results of operations and financial condition could be adversely affected. These challenging economic conditions also may result in:
|
|
• |
increased competition for fewer advertising and entertainment programming dollars; |
|
|
• |
pricing pressure that may adversely affect revenue and gross margin; |
|
|
• |
reduced credit availability and/or access to capital markets; |
|
|
• |
difficulty forecasting, budgeting and planning due to limited visibility into the spending plans of current or prospective customers; or |
|
|
• |
customer financial difficulty and increased risk of uncollectible accounts. |
Our Adjusted OIBDA is derived from high margin advertising revenue, and the reduction in spending by or loss of a national or group of local advertisers could have a meaningful adverse effect on our business
We generated all of our Adjusted OIBDA from our high margin advertising business. A substantial portion of our advertising revenue relates to contracts with terms of a month or less. Advertisers will not continue to do business with us if they believe our advertising medium is ineffective or overly expensive. In addition, large advertisers generally have set advertising budgets, most of which are focused on traditional media platforms like television and recently online and mobile networks. Reductions in the size of advertisers’ budgets due to local or national economic trends, a shift in spending to new advertising mediums like the internet and mobile platforms or other factors could result in lower spending on cinema advertising. Because of the high incremental margins on our individual advertising contracts, if we are unable to remain competitive and provide value to our advertising clients, they may reduce their advertising purchases or stop placing advertisements with us, which on large contracts even the loss of a small number of clients would negatively affect our Adjusted OIBDA.
The loss of any major content partner or advertising customer could significantly reduce our revenue
We derive a significant portion of our revenue from our contracts with our content partners, PSAs and NCM LLC’s founding members’ agreements to purchase on-screen advertising for their beverage concessionaires. We currently have marketing relationships with eight content partners, seven of which expire in 2017 and one in 2018. None of these companies individually accounted for over 10% of our total revenue during the year ended December 29, 2016. However, the agreements with the content partners, PSAs and beverage advertising with the founding members in aggregate accounted for approximately 30%, 30% and 34% of our total revenue during the years ended December 29, 2016, December 31, 2015 and January 1, 2015, respectively. Because we derive a significant percentage of our total revenue from a relatively small number of large companies, the loss of one or more of them as a customer could decrease our revenue and adversely affect current and future operating results.
We depend upon our senior management and our business may be adversely affected if we cannot retain or replace them
Our success depends in part upon the retention of our experienced senior management with specialized industry, sales and technical knowledge and/or industry relationships. In August 2015, our former Chief Executive Officer announced his resignation and, following a defined search process conducted by our Board of Directors, a new Chief Executive Officer was appointed in January 2016. We also appointed a Chief Financial Officer in August 2016 following a defined search process by our Board of Directors. Our Chief Financial Officer position was previously split between our Interim Co-Chief Financial Officers. If other critical members of our senior management team or other employees with special skills leave, we might not be able to find qualified internal or external replacements; accordingly, the loss of critical members of our senior management team and key employees could have a material adverse effect on our ability to effectively pursue our business strategy and our relationships with advertisers and content partners. We do not have key-man life insurance covering any of our employees.
18
Changes in the ESAs with, or lack of support by, the founding members could adversely affect our revenue, growth and profitability
The ESAs with the founding members are critical to our business. The three ESAs each have an initial term of 30 years beginning February 13, 2007 and provide us with a five-year right of first refusal, which begins one year prior to the end of the term of the ESA on February 13, 2037. The founding members’ theaters represent approximately 83% of the screens and approximately 85% of the attendance in our network as of December 29, 2016. If any one of the ESAs was terminated, not renewed at its expiration or found to be unenforceable, it would have a material adverse effect on our revenue, profitability and financial condition.
The ESAs require the continuing cooperation, investment and support of the founding members, the absence of which could adversely affect us. Pursuant to the ESAs, the founding members must make investments to replace digital network equipment within their theaters and equip newly constructed theaters with digital network equipment. If the founding members do not have adequate financial resources or operational strength, and if they do not replace equipment or equip new theaters to maintain the level of operating functionality that we have today, or if such equipment becomes obsolete, we may have to make additional capital expenditures or our advertising revenue and operating margins may decline.
If the non-competition provisions of the ESAs are deemed unenforceable, the founding members could compete against us and our business could be adversely affected
With certain limited exceptions, each of the ESAs prohibits the applicable founding member from engaging in any of the business activities that we provide in the founding member’s theaters under the amended ESAs, and from owning interests in other entities that compete with us. These provisions are intended to prevent the founding members from harming our business by providing cinema advertising services directly to their theaters or by entering into agreements with third-party cinema advertising providers. However, under state and federal law, a court may determine that a non-competition covenant is unenforceable, in whole or in part, for reasons including, but not limited to, the court’s determination that the covenant:
|
|
• |
is not necessary to protect a legitimate business interest of the party seeking enforcement; |
|
|
• |
unreasonably restrains the party against whom enforcement is sought; or |
|
|
• |
is contrary to the public interest. |
Enforceability of a non-competition covenant is determined by a court based on all of the facts and circumstances of the specific case at the time enforcement is sought. For this reason, it is not possible for us to predict whether, or to what extent, a court would enforce the non-competition provisions contained in the ESAs. If a court were to determine that the non-competition provisions are unenforceable, the founding members could compete directly against us or enter into an agreement with another cinema advertising provider that competes against us. Any inability to enforce the non-competition provisions, in whole or in part could cause our revenue to decline.
If one of the founding members declared bankruptcy, the ESA with that founding member may be rejected, renegotiated or deemed unenforceable
Each of the founding members currently has a significant amount of indebtedness, which is rated below investment grade. In 2000 and 2001, several major motion picture exhibition companies filed for bankruptcy, including United Artists, Edwards Theatres and Regal Cinemas (which are predecessor companies to Regal), and General Cinemas and Loews Cineplex (which are predecessor companies to AMC). The industry-wide construction of larger, more expensive megaplexes featuring stadium seating in the late 1990s that rendered existing, smaller, sloped-floor theaters under long-term leases obsolete and unprofitable, were significant contributing factors to these bankruptcies. If a bankruptcy case were commenced by or against a founding member, it is possible that all or part of the ESA with that founding member could be rejected by a trustee in the bankruptcy case pursuant to Section 365 or Section 1123 of the United States Bankruptcy Code, or by the founding member, and thus not be enforceable. Alternatively, the founding member could seek to renegotiate the ESA in a manner less favorable to us than the existing agreement. Should the founding member seek to sell or otherwise dispose of theaters or remove theaters from our network through bankruptcy or for other business reasons, if the acquirer did not agree to continue to allow us to sell advertising in the acquired theaters the number of theaters in our advertising networks would be reduced which in turn would reduce the number of advertising impressions available to us and thus could reduce our advertising revenue.
19
The ESAs allow the founding members to engage in activities that might compete with certain elements of our business, which could reduce our revenue and growth potential
The ESAs contain certain limited exceptions to our exclusive right to use the founding members’ theaters for our advertising business. The founding members have the right to enter into a limited number of strategic cross-marketing relationships with third-party, unaffiliated businesses for the purpose of generating increased attendance or revenue (other than revenue from the sale of advertising). These strategic marketing relationships can include the use of one minute on the LEN and certain types of lobby promotions and can be provided at no cost, but only for the purpose of promoting the products or services of those businesses while at the same time promoting the theater circuit or the movie-going experience. The use of LEN or lobby promotions by the founding members for these advertisements and programs could result in the founding members creating relationships with advertisers that could adversely affect our current LEN and lobby promotions advertising revenue and profitability as well as the potential we have to grow that advertising revenue in the future. The LEN and lobby promotions represented approximately 4% of our total advertising revenue for the year ended December 29, 2016. The founding members do not have the right to use their movie screens (including the FirstLook pre-show or otherwise) for promoting these cross-marketing relationships, and thus we will have the exclusive rights to advertise on the movie screens, except for limited advertising related to theater operations.
The founding members also have the right to install a second network of video monitors in the theater lobbies in excess of those required to be installed for the LEN. This additional lobby video network, which we refer to as the founding members’ lobby network, may be used by the founding members to promote products or services related to operating the theaters, such as concessions and loyalty programs. The presence of the founding members’ lobby network within the lobby areas could reduce the effectiveness of our LEN, thereby reducing our current LEN advertising revenue and profitability and adversely affecting future revenue potential associated with that marketing platform.
The founding members and our network affiliates are subject to substantial government regulation, which could slow their future growth of locations and screens and in turn slow our growth prospects.
The founding members and our network affiliates are subject to various federal, state and local laws, regulations and administrative practices affecting their movie theater business, including provisions regulating antitrust, health and sanitation standards, access for those with disabilities, environmental, and licensing. Some of these laws and regulations also apply directly to us and NCM LLC. Changes in existing laws or implementation of new laws, regulations and practices could have a significant impact on the founding members, our network affiliates’ and our respective businesses. For example, to the extent that antitrust laws, regulation and enforcement policy restrict the ability of the founding members or the network affiliates to acquire additional theaters, it may slow the future growth of those founding members or network affiliates and in turn the growth of our network.
Our business relies heavily on our technology systems, and any failures or disruptions may materially and adversely affect our operations
In the conduct of our business, we rely on information technology networks and systems, some of which are managed by third parties, to process, transmit and store electronic information and manage and support a variety of business processes and activities. The temporary or permanent loss of our computer equipment and software systems, through cyber and other security threats, operating malfunction, software virus, human error, natural disaster, power loss, terrorist attacks, or other catastrophic events, could disrupt our operations and cause a material adverse impact. These problems may arise in both internally developed systems and the systems of third-party service providers. We devote significant resources to maintaining a disaster recovery location separate from our operations, network security and other measures to protect our network from unauthorized access and misuse. However, depending on the nature and scope of a disruption, if our technology systems were to fail and we were unable to recover in a timely way through our disaster recovery site, we would be unable to fulfill critical business functions, which could lead to a loss of customers and could harm our reputation. Technological breakdown could also interfere with our ability to comply with financial reporting and other regulatory requirements.
Our business, services, or technology may infringe on intellectual property rights owned by others, which may interfere with our ability to provide services or expose us to increased liability or expense
Intellectual property rights of our business include the copyrights, trademarks, trade secrets and patents of our in-theater, online, and mobile services, including the websites we operate at ncm.com, movienightout.com and firstlookonline.com, our mobile app Movie Night Out®, and the features and functionality, content, and software we make available through those websites and app. We rely on our own intellectual property rights as well as intellectual property rights obtained from third parties to conduct our business and provide our in-theater, online, and mobile services. We may
20
discover that our business or the technology we use to provide our in-theater, online, or mobile services infringes patent, copyright, or other intellectual property rights owned by others. In addition, our competitors or others may claim rights in patents, copyrights, or other intellectual property rights that will prevent, limit or interfere with our ability to provide our in-theater, online, or mobile services either in the U.S. or in international markets. Further, the laws of certain foreign countries may not protect our intellectual property rights to the same extent as do the laws of the U.S.
The content we distribute through our in-theater, online or mobile services may expose us to liability
Our in-theater, online, and mobile services facilitate the distribution of content. This content includes advertising-related content, as well as, movie and television content, music and other media, much of which is obtained from third parties. Our websites also include features enabling users to upload or add their own content to the websites and modify certain content on the websites. As a distributor of content, we face potential liability for negligence, copyright, patent or trademark infringement, or other claims based on the content that we distribute. We or entities that we license content from may not be adequately insured or indemnified to cover claims of these types or liability that may be imposed on us.
The user information we collect and maintain through our online and mobile services may expose us to liability
In order to take advantage of some of the online and mobile services we provide, users are required to establish an account on one of our websites. As a result, we will collect and maintain personal identifying information about those users. We also collect and maintain personal identifying information about users who view certain advertising displayed through our online and mobile services. The collection and use of personal identifiable information is governed by federal and state privacy, information security and consumer protection-related laws and regulations. These laws continue to evolve and may be inconsistent from one jurisdiction to another. Compliance with all such laws and regulations may increase our operating costs and adversely impact our ability to interact with users of our online and mobile services. Our collection and use of personal identifying information regarding users of our online and mobile services could result in legal liability. For example, the failure, or perceived failure, to comply with federal or state privacy information security or consumer protection-related laws or regulations or our posted privacy policies could result in actions against us by governmental entities or others. If an actual or perceived breach of our data occurs, the market perception of the effectiveness of our security measures could be harmed, and we could lose users of these services and the associated benefits from gathering such user data.
Changes in regulations relating to the Internet or other areas of our online or mobile services may result in the need to alter our business practices or incur greater operating expenses
A number of regulations, including those referenced below, may impact our business as a result of our online or mobile services. The Digital Millennium Copyright Act has provisions that limit, but do not necessarily eliminate, liability for posting, or linking to third-party websites that include materials that infringe copyrights or other rights. Portions of the Communications Decency Act are intended to provide statutory protections to online service providers who distribute third-party content. The Child Online Protection Act and the Children’s Online Privacy Protection Act restrict the distribution of materials considered harmful to children and impose additional restrictions on the ability of online services to collect information from minors. The costs of compliance with these regulations, and other regulations relating to our online and mobile services or other areas of our business, may be significant. The manner in which these and other regulations may be interpreted or enforced may subject us to potential liability, which in turn could have an adverse effect on our business, results of operations, or financial condition. Changes to these and other regulations may impose additional burdens on us or otherwise adversely affect our business and financial results because of, for example, increased costs relating to legal compliance, defense against adverse claims or damages, or the reduction or elimination of features, functionality or content from our online or mobile services. Likewise, any failure on our part to comply with these and other regulations may subject us to additional liabilities.
Our revenue and Adjusted OIBDA fluctuate from quarter to quarter and may be unpredictable, which could increase the volatility of our stock price
A weak advertising market or the shift in spending of a major client from one quarter to another, the performance of films released in a given quarter, a disruption in the release schedule of films or changes in the television scatter market could significantly affect quarter-to-quarter results or even affect results for the entire fiscal year. Because our results may vary from quarter to quarter and may be unpredictable, our financial results for one quarter cannot necessarily be compared to another quarter or the same quarter in prior years and may not be indicative of our financial performance in subsequent quarters. These variations in our financial results could contribute to volatility in our stock price.
21
Risks Related to Our Corporate Structure
We are a holding company with no operations of our own, and we depend on distributions and payments under the NCM LLC operating and management services agreements from NCM LLC to meet our ongoing obligations and to pay cash dividends on our common stock
We are a holding company with no operations of our own and have no independent ability to generate cash flow other than interest income on cash balances. Consequently, our ability to obtain operating funds primarily depends upon distributions from NCM LLC. The distribution of cash flows and other transfers of funds by NCM LLC to us are subject to statutory and contractual restrictions based upon NCM LLC’s financial performance, including NCM LLC’s compliance with the covenants in its senior secured credit facility and indentures, and the NCM LLC operating agreement. The NCM LLC senior secured credit facility and indentures limit NCM LLC’s ability to distribute cash to its members, including us, based upon certain leverage tests, with exceptions for, among other things, payment of our income taxes and a management fee to NCM, Inc. pursuant to the terms of the management services agreement (incorporated in the ESA). Refer to the information provided under Note 9 to the audited Consolidated Financial Statements included elsewhere in this document for leverage discussion. The declaration of future dividends on our common stock, will be at the discretion of our Board of Directors and will depend upon many factors, including NCM LLC’s results of operations, financial condition, earnings, capital requirements, limitations in our debt agreements and legal requirements. Once the NCM, Inc. cash balances and investments are extinguished, we will be unable to pay dividends to our stockholders or pay other expenses outside the ordinary course of business if NCM LLC fails to comply with these covenants and is unable to distribute cash to us quarterly.
Pursuant to the management services agreement between us and NCM LLC, NCM LLC makes payments to us to fund our day-to-day operating expenses, such as payroll. However, if NCM LLC has insufficient cash flow to make the payments pursuant to the management services agreement, we may be unable to cover these expenses.
As a member of NCM LLC, we incur income taxes on our proportionate share of any net taxable income of NCM LLC. We have structured the NCM LLC senior secured credit facility and indentures to allow NCM LLC to distribute cash to its members (including us and NCM LLC’s founding members) in amounts sufficient to cover their tax liabilities and management fees, if any. To the extent that NCM LLC has insufficient cash flow to make such payments, it could have a material adverse effect on our business, financial condition, results of operations or prospects.
NCM LLC’s substantial debt obligations could impair our financial condition or prevent us from achieving our business goals
NCM LLC is party to substantial debt obligations. The senior secured credit facility and indentures contain restrictive covenants that limit NCM LLC’s ability to take specified actions and prescribe minimum financial maintenance requirements that NCM LLC must meet. Because NCM LLC is our only operating subsidiary, complying with these restrictions may prevent NCM LLC from taking actions that we believe would help us to grow our business. For example, NCM LLC may be unable to make acquisitions, investments or capital expenditures as a result of such covenants. Moreover, if NCM LLC violates those restrictive covenants or fails to meet the minimum financial requirements, it would be in default, which could, in turn, result in defaults under other obligations of NCM LLC. Any such defaults could materially impair our financial condition and liquidity. For further information, refer to Note 9 to the audited Consolidated Financial Statements included elsewhere in this document.
If NCM LLC is unable to meet its debt service obligations, it could be forced to restructure or refinance the obligations, seek additional equity financing or sell assets. We may be unable to restructure or refinance these obligations, obtain additional equity financing or sell assets on satisfactory terms or at all. In addition, NCM LLC’s indebtedness could have other negative consequences for us, including without limitation:
|
|
• |
limiting NCM LLC’s ability to obtain financing in the future; |
|
|
• |
requiring much of NCM LLC’s cash flow to be dedicated to interest obligations and making it unavailable for other purposes, including payments to its members (including NCM, Inc.); |
|
|
• |
limiting NCM LLC’s liquidity and operational flexibility in changing economic, business and competitive conditions which could require NCM LLC to consider deferring planned capital expenditures, reducing discretionary spending, selling assets, restructuring existing debt or deferring acquisitions or other strategic opportunities; and |
|
|
• |
making NCM LLC more vulnerable to an increase in interest rates, a downturn in our operating performance or decline in general economic conditions. |
22
Despite NCM LLC’s current levels of debt, it or NCM, Inc. may still incur substantially more debt, including secured debt, which would increase the risks associated with NCM LLC’s level of debt
The agreements relating to NCM LLC’s debt, including the Notes due 2022, Notes due 2026 and the senior secured credit facility, limit but do not prohibit NCM LLC’s ability to incur additional debt, and do not place any restrictions on NCM, Inc.’s ability to incur debt. Accordingly, NCM, Inc. or NCM LLC could incur additional debt in the future, including additional debt under the senior secured credit facility, additional senior or senior subordinated notes and additional secured debt. If new debt is added to current debt levels, the related risks that we now face, including those described above under “—NCM LLC’s substantial debt obligations could impair our financial condition or prevent us from achieving our business goals,” could intensify.
NCM LLC’s founding members or their affiliates may have interests that differ from those of our public stockholders and they may be able to influence our affairs
So long as an NCM LLC founding member beneficially owns at least 5% of NCM LLC’s issued and outstanding common membership units, approval of at least 90% of the directors then in office (provided that if the board has less than ten directors, then the approval of at least 80% of the directors then in office) will be required before we may take any of the following actions or we, in our capacity as manager of NCM LLC, may authorize NCM LLC to take any of the following actions:
|
|
• |
assign, transfer, sell or pledge all or a portion of the membership units of NCM LLC beneficially owned by NCM, Inc.; |
|
|
• |
acquire, dispose, lease or license assets with an aggregate value exceeding 20% of the fair market value of the business of NCM LLC operating as a going concern; |
|
|
• |
merge, reorganize, recapitalize, reclassify, consolidate, dissolve, liquidate or enter into a similar transaction; |
|
|
• |
incur any funded indebtedness or repay, before due, any funded indebtedness with a fixed term in an aggregate amount in excess of $15.0 million per year; |
|
|
• |
issue, grant or sell shares of NCM, Inc. common stock, preferred stock or rights with respect to common or preferred stock, or NCM LLC membership units or rights with respect to membership units, except under specified circumstances; |
|
|
• |
amend, modify, restate or repeal any provision of NCM, Inc.’s certificate of incorporation or bylaws or the NCM LLC operating agreement; |
|
|
• |
enter into, modify or terminate certain material contracts not in the ordinary course of business as defined under applicable securities laws; |
|
|
• |
except as specifically set forth in the NCM LLC operating agreement, declare, set aside or pay any redemption of, or dividends with respect to membership interests; |
|
|
• |
amend any material terms or provisions (as defined in the NASDAQ rules) of NCM, Inc.’s equity incentive plan or enter into any new equity incentive compensation plan; |
|
|
• |
make any change in the current business purpose of NCM, Inc. to serve solely as the manager of NCM LLC or any change in the current business purpose of NCM LLC to provide the services as set forth in the ESAs; and |
|
|
• |
approve any actions relating to NCM LLC that could reasonably be expected to have a material adverse tax effect on NCM LLC’s founding members. |
Pursuant to a director designation agreement, so long as an NCM LLC founding member owns at least 5% of NCM LLC’s issued and outstanding common membership units, such NCM LLC founding member will have the right to designate a total of two nominees to our nine-member Board of Directors who will be voted upon by our stockholders. One such designee by each NCM LLC founding member must meet the independence requirements of the stock exchange on which our common stock is listed. If, at any time, any NCM LLC founding member owns less than 5% of NCM LLC’s then issued and outstanding common membership units, then such NCM LLC founding member shall cease to have any rights of designation.
If any director designee to our board designated by NCM LLC’s founding members is not appointed to our board, nominated by us or elected by our stockholders, as applicable, then each of NCM LLC’s founding members (so long as such
23
NCM LLC founding member continues to own at least 5% of NCM LLC’s issued and outstanding common membership units) will be entitled to approve specified actions of NCM LLC.
For purposes of calculating the 5% ownership threshold for the supermajority director approval rights and director designation agreement provisions discussed above, shares of our common stock held by a founding member and received upon redemption of NCM LLC common membership units will be counted toward the threshold. Common membership units issued to NCM, Inc. in connection with the redemption of common membership units by a NCM LLC founding member will be excluded, so long as such NCM LLC founding member continues to hold the common stock acquired through such redemption or such NCM LLC founding member has disposed of such shares of common stock to another NCM LLC founding member. Shares of our common stock otherwise acquired by NCM LLC’s founding members will also be excluded, unless such shares of common stock were transferred by one NCM LLC founding member to another and were originally received by the transferring NCM LLC founding member upon redemption of NCM LLC common membership units.
Under these circumstances, our corporate governance documents will allow the founding members and their affiliates to exercise a greater degree of influence in the operation of our business and that of NCM LLC and the management of our affairs and those of NCM LLC than is typically available to stockholders of a publicly-traded company. Even if NCM LLC’s founding members or their affiliates own a minority economic interest (but not less than 5%) in NCM LLC, they may be able to continue exerting such degree of influence over us and NCM LLC.
Different interests among the founding members or between the founding members and us could prevent us from achieving our business goals
For the foreseeable future, we expect that our Board of Directors will include directors and certain executive officers of our founding members and other directors who may have commercial or other relationships with NCM LLC’s founding members. The majority of NCM LLC’s outstanding membership interests also are owned by NCM LLC’s founding members. NCM LLC’s founding members compete with each other in the operation of their respective businesses and could have individual business interests that may conflict with those of the other founding members. Their differing interests could make it difficult for us to pursue strategic initiatives that require consensus among NCM LLC’s founding members.
In addition, the structural relationship we have with NCM LLC’s founding members could create conflicts of interest among NCM LLC’s founding members, or between NCM LLC’s founding members and us, in a number of areas relating to our past and ongoing relationships. There is not any formal dispute resolution procedure in place to resolve conflicts between us and an NCM LLC founding member or between NCM LLC founding members. We may not be able to resolve any potential conflicts between us and an NCM LLC founding member and, even if we do, the resolution may be less favorable to us than if we were negotiating with an unaffiliated party.
The corporate opportunity provisions in our certificate of incorporation could enable NCM LLC’s founding members to benefit from corporate opportunities that might otherwise be available to us
Our certificate of incorporation contains provisions related to corporate opportunities that may be of interest to both NCM LLC’s founding members and us. It provides that if a corporate opportunity is offered to us, NCM LLC or one or more of the officers, directors or stockholders (both direct and indirect) of NCM, Inc. or a member of NCM LLC that relates to the provision of services to motion picture theaters, use of theaters for any purpose, sale of advertising and promotional services in and around theaters and any other business related to the motion picture theater business (except services as provided in the ESAs as from time to time amended and except as may be offered to one of our officers in his capacity as an officer), no such person shall be liable to us or any of our stockholders (or any affiliate thereof) for breach of any fiduciary or other duty by reason of the fact that such person pursues or acquires such business opportunity, directs such business opportunity to another person or fails to present such business opportunity, or information regarding such business opportunity, to us. This provision applies even if the business opportunity is one that we might reasonably be deemed to have pursued or had the ability or desire to pursue if granted the opportunity to do so.
In addition, our certificate of incorporation and the NCM LLC operating agreement expressly provide that NCM LLC’s founding members may have other business interests and may engage in any other businesses not specifically prohibited by the terms of the certificate of incorporation, including the exclusivity provisions of the ESAs. The parent companies of NCM LLC’s founding members are not bound by the ESAs and therefore could develop new media platforms that could compete for advertising dollars with our services. Further, we may also compete with NCM LLC’s founding members or their affiliates in the area of employee recruiting and retention. These potential conflicts of interest could have a material adverse effect on our business, financial condition, results of operations or prospects if attractive corporate opportunities are allocated by NCM LLC’s founding members to themselves or their other affiliates or we lose key personnel to them.
24
The agreements between us and NCM LLC’s founding members were made in the context of an affiliated relationship and may contain different terms than comparable agreements with unaffiliated third parties
The ESAs and the other contractual agreements that we have with NCM LLC’s founding members were originally negotiated in the context of an affiliated relationship in which representatives of NCM LLC’s founding members and their affiliates comprised our entire Board of Directors. As a result, the financial provisions and the other terms of these agreements, such as covenants, contractual obligations on our part and on the part of NCM LLC’s founding members and termination and default provisions may be less favorable to us than terms that we might have obtained in negotiations with unaffiliated third parties in similar circumstances.
Our certificate of incorporation and bylaws contain anti-takeover protections that may discourage or prevent strategic transactions, including a takeover of our company, even if such a transaction would be beneficial to our stockholders
Provisions contained in our certificate of incorporation and bylaws, the NCM LLC operating agreement, provisions of the Delaware General Corporation Law (“DGCL”), could delay or prevent a third party from entering into a strategic transaction with us, even if such a transaction would benefit our stockholders. For example, our certificate of incorporation and bylaws:
|
|
• |
establish supermajority approval requirements by our directors before our board may take certain actions; |
|
|
• |
authorize the issuance of “blank check” preferred stock that could be issued by our Board of Directors to increase the number of outstanding shares, making a takeover more difficult and expensive; |
|
|
• |
establish a classified Board of Directors; |
|
|
• |
allow removal of directors only for cause; |
|
|
• |
prohibit stockholder action by written consent; |
|
|
• |
do not permit cumulative voting in the election of directors, which would otherwise allow less than a majority of stockholders to elect director candidates; and |
|
|
• |
provide that NCM LLC’s founding members will be able to exercise a greater degree of influence over the operations of NCM LLC, which may discourage other nominations to our Board of Directors, if any director nominee designated by NCM LLC’s founding members is not elected by our stockholders. |
These restrictions could keep us from pursuing relationships with strategic partners and from raising additional capital, which could impede our ability to expand our business and strengthen our competitive position. These restrictions could also limit stockholder value by impeding a sale of us or NCM LLC. Further, these restrictions could restrict or limit certain investors from owning our stock.
Any future issuance of membership units by NCM LLC and subsequent redemption of such units for common stock could dilute the voting power of our existing common stockholders and adversely affect the market value of our common stock
The common unit adjustment agreement and the ESAs provide that we will issue common membership units of NCM LLC to account for changes in the number of theater screens NCM LLC’s founding members operate and which are made part of our advertising network. Historically, in most years each of NCM LLC’s founding members has increased the number of screens it operates. If this trend continues, NCM LLC may issue additional common membership units to NCM LLC’s founding members to reflect their increase in net screen count. Each common membership unit may be redeemed in exchange for, at our option, shares of our common stock on a one-for-one basis or a cash payment equal to the market price of one share of our common stock. If a significant number of common membership units were issued to NCM LLC’s founding members, NCM LLC’s founding members elected to redeem such units, and we elected to issue common stock rather than cash upon redemption, the voting power of our common stockholders could be diluted. Other than the maximum number of authorized shares of common stock in our certificate of incorporation, there is no limit on the number of shares of our common stock that we may issue upon redemption of an NCM LLC founding member’s common membership units in NCM LLC. For further information, refer to Note 4 to the audited Consolidated Financial Statements included elsewhere in this document.
Our future issuance of preferred stock could dilute the voting power of our common stockholders and adversely affect the market value of our common stock
The future issuance of shares of preferred stock with voting rights may adversely affect the voting power of the holders of our other classes of voting stock, either by diluting the voting power of our other classes of voting stock if they vote
25
together as a single class, or by giving the holders of any such preferred stock the right to block an action on which they have a separate class vote even if the action were approved by the holders of our other classes of voting stock.
The future issuance of shares of preferred stock with dividend or conversion rights, liquidation preferences or other economic terms favorable to the holders of preferred stock could adversely affect the market price for our common stock by making an investment in the common stock less attractive. For example, investors in the common stock may not wish to purchase common stock at a price above the conversion price of a series of convertible preferred stock because the holders of the preferred stock would effectively be entitled to purchase common stock at the lower conversion price causing economic dilution to the holders of common stock.
If we or NCM LLC’s founding members are determined to be an investment company, we would become subject to burdensome regulatory requirements and our business activities could be restricted
We do not believe that we are an “investment company” under the Investment Company Act of 1940, as amended. As sole manager of NCM LLC, we control NCM LLC, and our interest in NCM LLC is not an “investment security” as that term is used in the Investment Company Act of 1940. If we were to stop participating in the management of NCM LLC, our interest in NCM LLC could be deemed an “investment security” for purposes of the Investment Company Act of 1940. Generally, a company is an “investment company” if it owns investment securities having a value exceeding 40% of the value of its total assets (excluding U.S. government securities and cash items). Our sole material asset is our equity interest in NCM LLC. A determination that such asset was an investment security could result in our being considered an investment company under the Investment Company Act of 1940. As a result, we would become subject to registration and other burdensome requirements of the Investment Company Act. In addition, the requirements of the Investment Company Act of 1940 could restrict our business activities, including our ability to issue securities.
We and NCM LLC intend to conduct our operations so that we are not deemed an investment company under the Investment Company Act. However, if anything were to occur that would cause us to be deemed an investment company, we would become subject to restrictions imposed by the Investment Company Act of 1940. These restrictions, including limitations on our capital structure and our ability to enter into transactions with our affiliates, could make it impractical for us to continue our business as currently conducted and could have a material adverse effect on our financial performance and operations.
We also rely on representations of NCM LLC’s founding members that they are not investment companies under the Investment Company Act. If any NCM LLC founding member were deemed an investment company, the restrictions placed upon that NCM LLC founding member might inhibit its ability to fulfill its obligations under its ESA or restrict NCM LLC’s ability to borrow funds.
Our tax receivable agreement with NCM LLC’s founding members is expected to reduce the amount of overall cash flow that would otherwise be available to us and will increase our potential exposure to the financial condition of NCM LLC’s founding members
Our initial public offering and related transactions have the effect of reducing the amounts NCM, Inc. would otherwise pay in the future to various tax authorities as a result of an increase in its proportionate share of tax basis in NCM LLC’s tangible and intangible assets. We have agreed in our tax receivable agreement with NCM LLC’s founding members to pay to NCM LLC’s founding members 90% of the amount by which NCM, Inc.’s tax payments to various tax authorities are reduced as a result of the increase in tax basis. After paying these reduced amounts to tax authorities, if it is determined as a result of an income tax audit or examination that any amount of NCM, Inc.’s claimed tax benefits should not have been available, NCM, Inc. may be required to pay additional taxes and possibly penalties and interest to one or more tax authorities. If this were to occur and if one or more of NCM LLC’s founding members was insolvent or bankrupt or otherwise unable to make payment under its indemnification obligation under the tax receivable agreement, then NCM, Inc.’s financial condition could be negatively impacted.
The substantial number of shares that are eligible for sale could cause the market price for our common stock to decline or make it difficult for us to sell equity securities in the future
We cannot predict the effect, if any, that market sales of shares of common stock by NCM LLC’s founding members will have on the market price of our common stock from time to time. Sales of substantial amounts of shares of our common stock in the public market, or the perception that those sales will occur, could cause the market price of our common stock to decline or make future offerings of our equity securities more difficult. We expect AMC over the next 28 months to dispose of shares of NCM, Inc. as required by the settlement agreement between AMC and the U.S. Department of Justice (the “DOJ”) entered into in connection with AMC’s recent acquisition of Carmike Cinemas. See “Management’s Discussion and Analysis of Financial Condition and Results of Operations – Known Trends and Uncertainties – Trends Related to
26
Ownership in NCM LLC.” If we are unable to sell equity securities at times and prices that we deem appropriate, we may be unable to fund growth. The founding members may receive up to 77,320,333 shares of common stock as of December 29, 2016 upon redemption of their outstanding common membership units of NCM LLC. The resale of these shares of common stock has been registered as required by the terms of the registration rights agreement between NCM Inc. and the founding members. Additionally, once options and restricted stock held by our employees become vested and/or exercisable, as applicable, to the extent that they are not held by one of our affiliates, the shares acquired upon vesting or exercise are freely tradable. Refer to Note 10 to the audited Consolidated Financial Statements included elsewhere in this document.
None.
Information with respect to our corporate headquarters and regional offices is presented below as of December 29, 2016. We own no material real property. We believe that all of our present facilities are adequate for our current needs and that additional space is available for future expansion on acceptable terms.
|
Location |
|
Facility |
|
Size |
|
Centennial, CO (1) |
|
Headquarters (including the NOC) |
|
82,721 sq. ft. |
|
Chicago, IL (2) |
|
Advertising Sales Office |
|
3,971 sq. ft. |
|
New York, NY (3) |
|
Advertising Sales Office |
|
17,498 sq. ft. |
|
Woodland Hills, CA (4) |
|
Advertising Sales Office |
|
6,062 sq. ft. |
|
Minneapolis, MN (5) |
|
Software Development Office |
|
5,989 sq. ft. |
|
Newport Beach, CA (6) |
|
Regional Advertising Sales Office |
|
1,417 sq. ft. |
|
Detroit, MI (7) |
|
Advertising Sales Office |
|
200 sq. ft. |
|
(1) |
This facility is leased through June 30, 2021. |
|
(2) |
This facility is leased through September 30, 2017. |
|
(3) |
This facility is leased through April 30, 2017. A new property in New York, NY (21,892 sq. ft.) will be leased beginning March 1, 2017 through April 30, 2032. |
|
(4) |
This facility is leased through November 30, 2019. |
|
(5) |
This facility is leased through September 30, 2022. |
|
(6) |
This facility is leased through July 31, 2019. |
|
(7) |
This facility is leased through March 22, 2017. |
We are sometimes involved in legal proceedings arising in the ordinary course of business. We are not aware of any other litigation currently pending that would have a material adverse effect on our operating results or financial condition.
Not applicable.
|
Item 5. |
Market for Registrant’s Common Equity, Related Stockholder Matters and Issuer Purchases of Equity Securities |
Market Information
Our common stock, $0.01 par value, has traded on The NASDAQ Global Market under the symbol “NCMI” since February 8, 2007 (our IPO closed on February 13, 2007). There were 184 stockholders of record as of February 20, 2017 (does not include beneficial holders of shares held in “street name”). The following table sets forth the historical high and low sales prices per share for our common stock as reported on The NASDAQ Global Market for the fiscal periods indicated and the amount of cash dividends declared per share.
27
|
|
Fiscal 2016 |
|
||||||||||
|
|
|
High |
|
|
Low |
|
|
Cash Dividend Declared Per Share |
|
|||
|
First Quarter (January 1, 2016 – March 31, 2016) |
|
$ |
15.71 |
|
|
$ |
14.08 |
|
|
$ |
0.22 |
|
|
Second Quarter (April 1, 2016 – June 30, 2016) |
|
$ |
15.76 |
|
|
$ |
13.47 |
|
|
$ |
0.22 |
|
|
Third Quarter (July 1, 2016 – September 29, 2016) |
|
$ |
16.10 |
|
|
$ |
14.38 |
|
|
$ |
0.22 |
|
|
Fourth Quarter (September 30, 2016 – December 29, 2016) |
|
$ |
16.05 |
|
|
$ |
13.37 |
|
|
$ |
0.22 |
|
|
|
|
|
|
|
|
|
|
|
|
|
|
|
|
|
|
Fiscal 2015 |
|
|||||||||
|
|
|
High |
|
|
Low |
|
|
Cash Dividend Declared Per Share |
|
|||
|
First Quarter (January 2, 2015 – April 2, 2015) |
|
$ |
15.77 |
|
|
$ |
13.65 |
|
|
$ |
0.22 |
|
|
Second Quarter (April 3, 2015 – July 2, 2015) |
|
$ |
16.76 |
|
|
$ |
14.33 |
|
|
$ |
0.22 |
|
|
Third Quarter (July 3, 2015 – October 1, 2015) |
|
$ |
16.04 |
|
|
$ |
11.97 |
|
|
$ |
0.22 |
|
|
Fourth Quarter (October 2, 2015 – December 31, 2015) |
|
$ |
16.33 |
|
|
$ |
13.15 |
|
|
$ |
0.22 |
|
Dividend Policy
We intend to distribute over time a substantial portion of our free cash flow (distributions from NCM LLC less income taxes and payments under the tax receivable agreement with the founding members) in the form of dividends to our stockholders. The declaration, payment, timing and amount of any future dividends payable will be at the sole discretion of our Board of Directors who will take into account general economic and advertising market business conditions, our financial condition, our available cash, our current and anticipated cash needs, and any other factors that the Board of Directors considers relevant. Under Delaware law, dividends may be payable only out of surplus, which is our total assets minus total liabilities less the par value of our common stock, or, if we have no surplus, out of our net profits for the fiscal year in which the dividend is declared and/or the preceding fiscal year. For tax purposes, our dividends paid in 2015 and 2016 were treated as a return of capital to stockholders.
Use of Proceeds from Sale of Registered Securities
None.
Unregistered Sales of Equity Securities and Use of Proceeds
NCM, Inc.’s Amended and Restated Certificate of Incorporation and the Third Amended and Restated Limited Liability Company Operating Agreement, as amended, of NCM LLC provide a redemption right to the NCM LLC members to exchange common membership units of NCM LLC for shares of NCM, Inc.’s common stock on a one-for-one basis, or at NCM, Inc.’s option, a cash payment equal to the market price of one share of NCM, Inc.’s common stock.
On December 21, 2015, NCM LLC received a Notice of Redemption from AMC, and NCM, Inc.’s Board of Directors authorized the exchange of 200,000 units for 200,000 shares of NCM, Inc. common stock. In connection with delivering the Notice of Redemption, AMC surrendered common membership units to NCM LLC for cancellation and NCM, Inc. contributed shares of its common stock to NCM LLC in exchange for an amount of newly issued common units equal to the number of units surrendered by AMC. NCM LLC distributed the shares of NCM, Inc.’s common stock to AMC to complete the redemption on December 30, 2015. The issuance of shares in this redemption was exempt from registration as the transaction by NCM, Inc. did not involve a public offering. As of December 29, 2016, these shares had not been sold and AMC owned 200,000 shares of NCM, Inc. common stock.
On November 22, 2016, NCM, Inc. issued 40,000 shares of its common stock, subject to restrictions, to an operating company in connection with the execution of a multi-year commercial agreement. The shares are restricted and subject to vesting and forfeiture provisions, whereby, 20,000 shares vest at the end of the initial five-year term of the commercial agreement and the remaining 20,000 shares would vest at the end of a five-year renewal period, if renewed. The shares have not been registered under the Securities Act of 1933, as amended (the “Securities Act”), and were issued pursuant to the exemption from registration contained in Section 4(a)(2) of the Securities Act.
Share Repurchase Program
None.
28
Issuer Purchases of Equity Securities
The table below provides information about shares delivered to the Company from restricted stock held by Company employees upon vesting for the purpose of funding the recipient’s tax withholding obligations.
|
Period |
|
(a) Total Number of Shares Purchased |
|
|
(b) Average Price Paid Per Share |
|
|
(c) Total Number of Shares Purchased as Part of Publicly Announced Plans or Programs |
|
|
(d) Maximum Number (or Approximate Dollar Value) of Shares that may yet be Purchased under the Plans or Programs |
|||
|
September 30, 2016 through October 27, 2016 |
|
|
— |
|
|
$ |
— |
|
|
|
— |
|
|
N/A |
|
October 28, 2016 through December 1, 2016 |
|
|
6,556 |
|
|
$ |
13.63 |
|
|
|
— |
|
|
N/A |
|
December 2, 2016 through December 29, 2016 |
|
|
— |
|
|
$ |
— |
|
|
|
— |
|
|
N/A |
Equity Compensation Plan
Refer to “Item 12. Security Ownership of Certain Beneficial Owners and Management and Related Stockholder Matters” for information regarding securities authorized for issuance under our equity compensation plans which is incorporated in this Item by this reference.
Stock Performance Graph
The following graph compares the cumulative total stockholder return on the common stock of the Company (including dividends paid) for the period December 29, 2011 through December 29, 2016 with the Russell 2000 Index and the Dow Jones US Media TSM.
The comparisons in the graph below are based upon historical data and are not indicative of, or intended to forecast, future performance of our common stock. 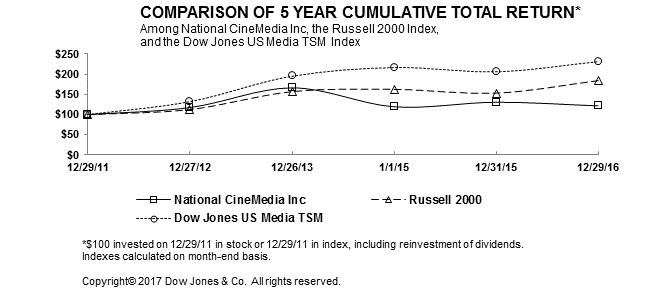
|
|
Dec. 29, 2011 |
|
|
Dec. 27, 2012 |
|
|
Dec. 26, 2013 |
|
|
Jan. 1, 2015 |
|
|
Dec. 31, 2015 |
|
|
Dec. 29, 2016 |
|
||||||
|
National CineMedia, Inc. |
|
100.00 |
|
|
|
117.46 |
|
|
|
166.17 |
|
|
|
119.45 |
|
|
|
130.59 |
|
|
|
121.70 |
|
|
Russell 2000 |
|
100.00 |
|
|
|
112.41 |
|
|
|
156.06 |
|
|
|
161.71 |
|
|
|
152.47 |
|
|
|
182.98 |
|
|
Dow Jones US Media TSM |
|
100.00 |
|
|
|
132.41 |
|
|
|
195.84 |
|
|
|
217.41 |
|
|
|
206.92 |
|
|
|
232.19 |
|
29
Selected Historical Financial and Operating Data
The following table sets forth our historical selected financial and operating data for the periods indicated. The selected financial and operating data should be read in conjunction with the other information contained in this document, including “Business,” “Management’s Discussion and Analysis of Financial Condition and Results of Operations”, the audited historical Consolidated Financial Statements and the notes thereto included elsewhere in this document, and historical audited Consolidated Financial Statements, which have not been included in this document.
The results of operations data for the years ended December 29, 2016, December 31, 2015 and January 1, 2015 and the balance sheet data as of December 29, 2016 and December 31, 2015 are derived from the audited Consolidated Financial Statements of NCM, Inc. included elsewhere in this document. The results of operations data for the years ended December 26, 2013 and December 27, 2012 and the balance sheet data as of January 1, 2015, December 26, 2013 and December 27, 2012 are derived from the audited Consolidated Financial Statements of NCM, Inc.
|
Results of Operations Data |
Years Ended |
|
||||||||||||||||||
|
($ in millions, except per share data) |
Dec. 29, 2016 |
|
|
Dec. 31, 2015 |
Jan. 1, 2015 |
|
|
Dec. 26, 2013 |
|
|
Dec. 27, 2012 |
|
||||||||
|
REVENUE: |
|
|
|
|
|
|
|
|
|
|
|
|
|
|
|
|
|
|
|
|
|
Advertising |
$ |
|
447.6 |
|
|
$ |
446.5 |
|
|
$ |
394.0 |
|
|
$ |
426.3 |
|
|
$ |
409.5 |
|
|
Fathom Events |
|
|
— |
|
|
|
— |
|
|
|
— |
|
|
|
36.5 |
|
|
|
39.3 |
|
|
Total |
|
|
447.6 |
|
|
|
446.5 |
|
|
|
394.0 |
|
|
|
462.8 |
|
|
|
448.8 |
|
|
OPERATING EXPENSES: |
|
|
|
|
|
|
|
|
|
|
|
|
|
|
|
|
|
|
|
|
|
Advertising operating costs |
|
|
30.0 |
|
|
|
30.8 |
|
|
|
26.4 |
|
|
|
29.0 |
|
|
|
31.3 |
|
|
Fathom Events operating costs |
|
|
— |
|
|
|
— |
|
|
|
— |
|
|
|
25.5 |
|
|
|
29.0 |
|
|
Network costs |
|
|
17.1 |
|
|
|
17.8 |
|
|
|
18.3 |
|
|
|
19.4 |
|
|
|
19.8 |
|
|
Theater access fees—founding members |
|
|
75.1 |
|
|
|
72.5 |
|
|
|
70.6 |
|
|
|
69.4 |
|
|
|
64.5 |
|
|
Selling and marketing costs |
|
|
72.8 |
|
|
|
72.3 |
|
|
|
57.6 |
|
|
|
61.5 |
|
|
|
60.5 |
|
|
Merger termination fee and related merger costs |
|
|
— |
|
|
|
34.3 |
|
|
|
7.5 |
|
|
|
— |
|
|
|
— |
|
|
Administrative and other costs |
|
|
43.8 |
|
|
|
38.6 |
|
|
|
29.5 |
|
|
|
29.4 |
|
|
|
31.5 |
|
|
Depreciation and amortization |
|
|
35.8 |
|
|
|
32.2 |
|
|
|
32.4 |
|
|
|
26.6 |
|
|
|
20.4 |
|
|
Total |
|
|
274.6 |
|
|
|
298.5 |
|
|
|
242.3 |
|
|
|
260.8 |
|
|
|
257.0 |
|
|
OPERATING INCOME |
|
|
173.0 |
|
|
|
148.0 |
|
|
|
151.7 |
|
|
|
202.0 |
|
|
|
191.8 |
|
|
NON-OPERATING EXPENSES |
|
|
76.8 |
|
|
|
66.5 |
|
|
|
76.2 |
|
|
|
52.0 |
|
|
|
99.8 |
|
|
INCOME BEFORE INCOME TAXES |
|
|
96.2 |
|
|
|
81.5 |
|
|
|
75.5 |
|
|
|
150.0 |
|
|
|
92.0 |
|
|
Provision for income taxes |
|
|
9.2 |
|
|
|
17.8 |
|
|
|
9.9 |
|
|
|
20.2 |
|
|
|
26.7 |
|
|
CONSOLIDATED NET INCOME |
|
|
87.0 |
|
|
|
63.7 |
|
|
|
65.6 |
|
|
|
129.8 |
|
|
|
65.3 |
|
|
Less: Net income attributable to noncontrolling interests |
|
|
61.6 |
|
|
|
48.3 |
|
|
|
52.2 |
|
|
|
88.6 |
|
|
|
51.9 |
|
|
NET INCOME ATTRIBUTABLE TO NCM, Inc. |
$ |
|
25.4 |
|
|
$ |
15.4 |
|
|
$ |
13.4 |
|
|
$ |
41.2 |
|
|
$ |
13.4 |
|
|
EARNINGS PER NCM, INC. COMMON SHARE: |
|
|
|
|
|
|
|
|
|
|
|
|
|
|
|
|
|
|
|
|
|
Basic |
$ |
|
0.42 |
|
|
$ |
0.26 |
|
|
$ |
0.23 |
|
|
$ |
0.74 |
|
|
$ |
0.25 |
|
|
Diluted |
$ |
|
0.42 |
|
|
$ |
0.26 |
|
|
$ |
0.23 |
|
|
$ |
0.73 |
|
|
$ |
0.24 |
|
30
|
Other Financial and Operating Data |
|
Years Ended |
|
|||||||||||||||||
|
(in millions, except cash dividend declared per common share and screen data) |
|
Dec. 29, 2016 |
|
|
Dec. 31, 2015 |
|
|
Jan. 1, 2015 |
|
|
Dec. 26, 2013 |
|
|
Dec. 27, 2012 |
|
|||||
|
OIBDA (1) |
|
$ |
208.8 |
|
|
$ |
180.2 |
|
|
$ |
184.1 |
|
|
$ |
228.6 |
|
|
$ |
212.2 |
|
|
Adjusted OIBDA (1) |
|
$ |
230.7 |
|
|
$ |
229.9 |
|
|
$ |
199.3 |
|
|
$ |
234.5 |
|
|
$ |
221.2 |
|
|
Adjusted OIBDA margin (1) |
|
|
51.5 |
% |
|
|
51.5 |
% |
|
|
50.6 |
% |
|
|
50.7 |
% |
|
|
49.3 |
% |
|
Capital expenditures |
|
$ |
13.3 |
|
|
$ |
13.0 |
|
|
$ |
8.8 |
|
|
$ |
10.6 |
|
|
$ |
10.4 |
|
|
Cash dividend declared per common share |
|
$ |
0.88 |
|
|
$ |
0.88 |
|
|
$ |
1.38 |
|
|
$ |
0.88 |
|
|
$ |
0.88 |
|
|
Founding member screens at period end (2) (6) |
|
|
17,022 |
|
|
|
16,981 |
|
|
|
16,497 |
|
|
|
16,562 |
|
|
|
15,528 |
|
|
Total screens at period end (3) (6) |
|
|
20,548 |
|
|
|
20,361 |
|
|
|
20,109 |
|
|
|
19,878 |
|
|
|
19,359 |
|
|
DCN screens at period end (4) (6) |
|
|
20,080 |
|
|
|
19,760 |
|
|
|
19,251 |
|
|
|
19,054 |
|
|
|
18,491 |
|
|
Total attendance for period (5) (6) |
|
|
688.8 |
|
|
|
694.7 |
|
|
|
688.2 |
|
|
|
699.2 |
|
|
|
690.4 |
|
|
|
|
As of |
|
|||||||||||||||||
|
Balance Sheet Data (in millions) |
|
Dec. 29, 2016 |
|
|
Dec. 31, 2015 |
|
|
Jan. 1, 2015 |
|
|
Dec. 26, 2013 |
|
|
Dec. 27, 2012 |
|
|||||
|
Cash, cash equivalents and marketable securities (7) |
|
$ |
68.7 |
|
|
$ |
85.4 |
|
|
$ |
80.6 |
|
|
$ |
126.0 |
|
|
$ |
106.6 |
|
|
Receivables, net |
|
|
160.5 |
|
|
|
148.9 |
|
|
|
116.5 |
|
|
|
120.4 |
|
|
|
98.5 |
|
|
Property and equipment, net |
|
|
29.6 |
|
|
|
25.1 |
|
|
|
22.4 |
|
|
|
25.6 |
|
|
|
25.7 |
|
|
Total assets (8) |
|
|
1,057.4 |
|
|
|
1,084.3 |
|
|
|
991.4 |
|
|
|
1,067.3 |
|
|
|
810.5 |
|
|
Borrowings, gross |
|
|
935.0 |
|
|
|
936.0 |
|
|
|
892.0 |
|
|
|
890.0 |
|
|
|
879.0 |
|
|
Payable to founding members under tax receivable agreement |
|
|
161.8 |
|
|
|
166.5 |
|
|
|
166.3 |
|
|
|
172.6 |
|
|
|
157.1 |
|
|
Equity/(deficit) |
|
|
(181.2 |
) |
|
|
(171.7 |
) |
|
|
(208.7 |
) |
|
|
(146.1 |
) |
|
|
(356.4 |
) |
|
Total liabilities and equity (8) |
|
|
1,057.4 |
|
|
|
1,084.3 |
|
|
|
991.4 |
|
|
|
1,067.3 |
|
|
|
810.5 |
|
Notes to the Selected Historical Financial and Operating Data
|
|
(1) |
Operating Income Before Depreciation and Amortization (“OIBDA”), Adjusted OIBDA and Adjusted OIBDA margin are not financial measures calculated in accordance with GAAP in the United States. OIBDA represents operating income before depreciation and amortization expense. Adjusted OIBDA excludes from OIBDA non-cash share based payment costs, the merger termination fee and related merger costs and Chief Executive Officer transition costs. Adjusted OIBDA margin is calculated by dividing Adjusted OIBDA by total revenue. Our management uses these non-GAAP financial measures to evaluate operating performance, to forecast future results and as a basis for compensation. The Company believes these are important supplemental measures of operating performance because they eliminate items that have less bearing on its operating performance and highlight trends in its core business that may not otherwise be apparent when relying solely on GAAP financial measures. The Company believes the presentation of these measures is relevant and useful for investors because it enables them to view performance in a manner similar to the method used by the Company’s management, helps improve their ability to understand the Company’s operating performance and makes it easier to compare the Company’s results with other companies that may have different depreciation and amortization policies, non-cash share based compensation programs, levels of mergers and acquisitions, CEO turnover, interest rates, debt levels or income tax rates. A limitation of these measures, however, is that they exclude depreciation and amortization, which represent a proxy for the periodic costs of certain capitalized tangible and intangible assets used in generating revenues in the Company’s business. In addition, Adjusted OIBDA has the limitation of not reflecting the effect of the Company’s share based payment costs, costs associated with the terminated merger with Screenvision, LLC (“Screenvision”), or costs associated with the resignation of the Company’s former Chief Executive Officer. OIBDA or Adjusted OIBDA should not be regarded as an alternative to operating income, net income or as indicators of operating performance, nor should they be considered in isolation of, or as substitutes for financial measures prepared in accordance with GAAP. The Company believes that operating income is the most directly comparable GAAP financial measure to OIBDA. Because not all companies use identical calculations, these non-GAAP presentations may not be comparable to other similarly titled measures of other companies, or calculations in the Company’s debt agreement. |
31
OIBDA and Adjusted OIBDA do not reflect integration payments as integration payments are recorded as a reduction to intangible assets. Integration payments received are added to Adjusted OIBDA to determine our compliance with financial covenants under our senior secured credit facility and included in available cash distributions to NCM LLC’s founding members. During the years ended December 29, 2016, December 31, 2015, January 1, 2015, December 26, 2013 and December 27, 2012, the Company recorded integration payments of $2.6 million, $2.7 million, $2.2 million, $2.8 million, and $0.0 million, respectively, from NCM LLC’s founding members.
|
|
(2) |
Represents the total number of screens within NCM LLC’s advertising network operated by NCM LLC’s founding members. |
|
|
(3) |
Represents the total screens within NCM LLC’s advertising network. |
|
|
(4) |
Represents the total number of screens that are connected to the DCN. |
|
|
(5) |
Represents the total attendance within NCM LLC’s advertising network. |
|
|
(6) |
Excludes screens and attendance associated with certain Cinemark Rave and AMC Rave theaters for all periods presented. Refer to Note 4 to the audited Consolidated Financial Statements included elsewhere in this document. |
|
|
(7) |
Includes short-term and long-term marketable securities. |
|
|
(8) |
During the first quarter of 2016, the Company adopted Accounting Standards Update 2015-03, Interest – Imputation of Interest (Subtopic 835-30): Simplifying the Presentation of Debt Issuance Costs (“ASU 2015-03”) and Accounting Standards Update 2015-15, Interest – Imputation of Interest (“ASU 2015-15”), on a retrospective basis, which provide guidance for simplifying the presentation of debt issuance costs. In connection with the adoption of ASU 2015-03 and ASU 2015-15, the Company reclassified net deferred financing costs related to NCM LLC’s term loans, secured and unsecured notes in the Consolidated Balance Sheet as a direct deduction from the carrying amount of those borrowings, while net deferred financing costs related to the revolving credit facility remained an asset in the Consolidated Balance Sheet. The amounts presented above for total assets and total liabilities and equity reflect this reclassification as of December 29, 2016 and December 31, 2015. Amounts presented as of January 1, 2015, December 26, 2013 and December 27, 2012 do not reflect the reclassification. If adjusted, the reclassification for ASU 2015-03 and ASU 2015-15 would reduce both total assets and total liabilities and equity shown above by $12.7 million, $14.8 million and $14.6 million as of January 1, 2015, December 26, 2013 and December 27, 2012, respectively. |
The following table reconciles operating income to OIBDA and Adjusted OIBDA for the periods presented (dollars in millions):
|
|
|
Years Ended |
|
|||||||||||||||||
|
|
|
Dec. 29, 2016 |
|
|
Dec. 31, 2015 |
|
|
Jan. 1, 2015 |
|
|
Dec. 26, 2013 |
|
|
Dec. 27, 2012 |
|
|||||
|
Operating income |
|
$ |
173.0 |
|
|
$ |
148.0 |
|
|
$ |
151.7 |
|
|
$ |
202.0 |
|
|
$ |
191.8 |
|
|
Depreciation and amortization |
|
|
35.8 |
|
|
|
32.2 |
|
|
|
32.4 |
|
|
|
26.6 |
|
|
|
20.4 |
|
|
OIBDA |
|
$ |
208.8 |
|
|
$ |
180.2 |
|
|
$ |
184.1 |
|
|
$ |
228.6 |
|
|
$ |
212.2 |
|
|
Share-based compensation costs (1) |
|
|
18.3 |
|
|
|
14.8 |
|
|
|
7.7 |
|
|
|
5.9 |
|
|
|
9.0 |
|
|
Merger-related administrative costs (2) |
|
|
— |
|
|
|
34.3 |
|
|
|
7.5 |
|
|
|
— |
|
|
|
— |
|
|
CEO transition costs (3) |
|
|
3.6 |
|
|
|
0.6 |
|
|
|
— |
|
|
|
— |
|
|
|
— |
|
|
Adjusted OIBDA |
|
$ |
230.7 |
|
|
$ |
229.9 |
|
|
$ |
199.3 |
|
|
$ |
234.5 |
|
|
$ |
221.2 |
|
|
Total revenue |
|
$ |
447.6 |
|
|
$ |
446.5 |
|
|
$ |
394.0 |
|
|
$ |
462.8 |
|
|
$ |
448.8 |
|
|
Adjusted OIBDA margin |
|
|
51.5 |
% |
|
|
51.5 |
% |
|
|
50.6 |
% |
|
|
50.7 |
% |
|
|
49.3 |
% |
|
|
(1) |
Share-based payments costs are included in network operations, selling and marketing and administrative expense in the accompanying audited Consolidated Financial Statements. |
|
|
(2) |
Merger termination fee and related merger costs primarily include the merger termination payment and legal, accounting, advisory and other professional fees associated with the terminated merger with Screenvision. |
|
|
(3) |
Chief Executive Officer transition costs represent severance, consulting and related other costs. |
The Company has also presented total operating expenses before the merger termination fee and related merger costs within its results of operations section below which is not a financial measure calculated in accordance with GAAP. Operating expenses before the merger termination fee and related merger costs represent operating costs less costs associated with the terminated Screenvision merger. This non-GAAP financial measure is used to provide readers a comparison of our 2016 results to our 2015 results without including the impact of the nonrecurring merger termination fee and related merger costs. The Company believes this is an important supplemental measure because it eliminates these nonrecurring costs to
32
highlight trends in its ongoing business that may not otherwise be apparent when relying solely on GAAP financial measures. Operating expenses before the merger termination fee and related merger costs should not be regarded as an alternative to operating expenses or as an indicator of operating performance, nor should it be considered in isolation of, or as a substitute for financial measures prepared in accordance with GAAP. The Company believes that total operating expenses is the most directly comparable GAAP financial measure.
As discussed in Part 1, some of the information in this Annual Report on Form 10-K includes “forward-looking statements” within the meaning of Section 27A of the Securities Act of 1933, as amended, and Section 21E of the Securities Exchange Act of 1934 (the “Exchange Act”), as amended. All statements other than statements of historical facts included in this Form 10-K, including, without limitation, certain statements under “Management’s Discussion and Analysis of Financial Condition and Results of Operations”, may constitute forward-looking statements. In some cases, you can identify these “forward-looking statements” by the specific words, including but not limited to “may,” “should,” “expects,” “plans,” “anticipates,” “believes,” “estimates,” “predicts,” “potential” or “continue” or the negative of those words and other comparable words. These forward-looking statements involve risks and uncertainties. The following discussion and analysis should be read in conjunction with our historical financial statements and the related notes thereto included elsewhere in this document. In the following discussion and analysis, the term net income refers to net income attributable to NCM, Inc.
Overview
We are America's Movie Network. As the #1 weekend network for Millennials (age 18-34) in the U.S., we are the connector between brands and movie audiences. We currently derive revenue principally from the sale of advertising to national, regional and local businesses in FirstLook, our cinema advertising and entertainment pre-show seen on movie screens across the U.S. We also sell advertising on our LEN, a series of strategically-placed screens located in movie theater lobbies, as well as other forms of advertising and promotions in theater lobbies. In addition, we sell online and mobile advertising through our Cinema Accelerator digital product to reach entertainment audiences beyond the theater. We have long-term ESAs (over 20 years remaining as of December 29, 2016) and multi-year agreements with network affiliates, which expire at various dates between July 14, 2017 and July 22, 2031. The weighted average remaining term (based on attendance) of the ESAs and the network affiliate agreements is 18.1 years as of December 29, 2016. The ESAs and network affiliate agreements grant NCM LLC exclusive rights in their theaters to sell advertising, subject to limited exceptions. Our FirstLook pre-show and LEN programming are distributed predominantly via satellite through our proprietary DCN. Approximately 98% of the aggregate founding member and network affiliate theater attendance is generated by theaters connected to our DCN (the remaining screens receive advertisements on USB drives) and 100% of the FirstLook pre-show is projected on digital projectors (90% digital cinema projectors and 10% LCD projectors).
Management focuses on several measurements that we believe provide us with the necessary ratios and key performance indicators to manage our business, determine how we are performing versus our internal goals and targets, and against the performance of our competitors and other benchmarks in the marketplace in which we operate. Senior executives hold meetings at least once per quarter with officers, managers and staff to discuss and analyze operating results and address significant variances to budget and prior year in an effort to identify trends and changes in our business. We focus on many operating metrics including changes in revenue, OIBDA, Adjusted OIBDA and Adjusted OIBDA margin, as defined and discussed in “Notes to the Selected Historical Financial and Operating Data” above, as some of our primary measurement metrics. In addition, we monitor our monthly advertising performance measurements, including advertising inventory utilization, national and local advertising pricing (CPM), local and regional advertising rate per screen per week, local and regional and total advertising revenue per attendee. We also monitor free cash flow, the dividend coverage ratio, financial leverage (net debt divided by Adjusted OIBDA), cash balances and revolving credit facility availability to ensure debt covenant compliance and that there is adequate cash availability to fund our working capital needs and debt obligations and current and future dividends declared by our Board of Directors.
Recent Transactions
On May 5, 2014, NCM, Inc. entered into an Agreement and Plan of Merger (the “Merger Agreement”) to merge with Screenvision. On November 3, 2014, the DOJ filed a lawsuit seeking to enjoin the merger. On March 16, 2015, NCM, Inc. announced the termination of the Merger Agreement and the lawsuit was dismissed. After the Merger Agreement was terminated, NCM LLC reimbursed NCM, Inc. for certain expenses pursuant to an indemnification agreement among NCM LLC, NCM, Inc. and the founding members. On March 17, 2015, NCM LLC paid Screenvision an approximate $26.8 million termination payment on behalf of NCM, Inc. During the year ended December 31, 2015, NCM LLC also either paid directly or reimbursed NCM, Inc. for the legal and other merger-related costs of approximately $15.0 million ($7.5 million
33
incurred by NCM, Inc. during the year ended January 1, 2015 and approximately $7.5 million incurred by NCM LLC during the year ended December 31, 2015). NCM, Inc. and the founding members each bore a pro rata portion of the termination fee and the related merger expenses based on their aggregate ownership percentages in NCM LLC when the expenses were incurred.
Our operating results may be affected by a variety of internal and external factors and trends described more fully in the section entitled “Risk Factors” in this Form 10-K.
Summary Historical and Operating Data
You should read this information in conjunction with the other information contained in this document, and our audited historical financial statements and the notes thereto included elsewhere in this document.
The following table presents operating data and Adjusted OIBDA (dollars in millions, except share and margin data). Refer to “Item 6. Selected Financial Data—Notes to the Selected Historical Financial and Operating Data” for a discussion of the calculation of Adjusted OIBDA and reconciliation to operating income.
|
|
Years Ended |
|
|
% Change |
|
|||||||||||||||
|
($ in millions) |
Dec. 29, 2016 |
|
|
Dec. 31, 2015 |
Jan. 1, 2015 |
|
|
2015 to 2016 |
|
|
2014 to 2015 |
|
||||||||
|
Revenue |
$ |
|
447.6 |
|
|
$ |
446.5 |
|
|
$ |
394.0 |
|
|
|
0.2 |
% |
|
|
13.3 |
% |
|
Operating expenses: |
|
|
|
|
|
|
|
|
|
|
|
|
|
|
|
|
|
|
|
|
|
Advertising |
|
|
173.9 |
|
|
|
173.6 |
|
|
|
154.6 |
|
|
|
0.2 |
% |
|
|
12.3 |
% |
|
Network, administrative and unallocated costs |
|
|
100.7 |
|
|
|
90.6 |
|
|
|
80.2 |
|
|
|
11.1 |
% |
|
|
13.0 |
% |
|
Merger termination fee and related merger costs (1) |
|
|
— |
|
|
|
34.3 |
|
|
|
7.5 |
|
|
|
(100.0 |
%) |
|
NM |
|
|
|
Total operating expenses |
|
|
274.6 |
|
|
|
298.5 |
|
|
|
242.3 |
|
|
|
(8.0 |
%) |
|
|
23.2 |
% |
|
Operating income |
|
|
173.0 |
|
|
|
148.0 |
|
|
|
151.7 |
|
|
|
16.9 |
% |
|
|
(2.4 |
%) |
|
Non-operating expenses |
|
|
76.8 |
|
|
|
66.5 |
|
|
|
76.2 |
|
|
|
15.5 |
% |
|
|
(12.7 |
%) |
|
Income tax expense |
|
|
9.2 |
|
|
|
17.8 |
|
|
|
9.9 |
|
|
|
(48.3 |
%) |
|
|
79.8 |
% |
|
Net income attributable to noncontrolling interests |
|
|
61.6 |
|
|
|
48.3 |
|
|
|
52.2 |
|
|
|
27.5 |
% |
|
|
(7.5 |
%) |
|
Net income attributable to NCM, Inc. |
$ |
|
25.4 |
|
|
$ |
15.4 |
|
|
$ |
13.4 |
|
|
|
64.9 |
% |
|
|
14.9 |
% |
|
|
|
|
|
|
|
|
|
|
|
|
|
|
|
|
|
|
|
|
|
|
|
Net income per NCM, Inc. basic share |
$ |
|
0.42 |
|
|
$ |
0.26 |
|
|
$ |
0.23 |
|
|
|
61.5 |
% |
|
|
13.0 |
% |
|
Net income per NCM, Inc. diluted share |
$ |
|
0.42 |
|
|
$ |
0.26 |
|
|
$ |
0.23 |
|
|
|
61.5 |
% |
|
|
13.0 |
% |
|
|
|
|
|
|
|
|
|
|
|
|
|
|
|
|
|
|
|
|
|
|
|
Adjusted OIBDA |
$ |
|
230.7 |
|
|
$ |
229.9 |
|
|
$ |
199.3 |
|
|
|
0.3 |
% |
|
|
15.4 |
% |
|
Adjusted OIBDA margin |
|
|
51.5 |
% |
|
|
51.5 |
% |
|
|
50.6 |
% |
|
|
0.0 |
% |
|
|
0.9 |
% |
|
Total theater attendance (in millions) (2) |
|
|
688.8 |
|
|
|
694.7 |
|
|
|
688.2 |
|
|
|
(0.8 |
%) |
|
|
0.9 |
% |
NM = Not meaningful.
|
|
(1) |
Merger termination fee and related merger costs primarily include the merger termination payment and legal, accounting, advisory and other professional fees associated with the terminated merger with Screenvision. |
|
|
(2) |
Represents the total attendance within NCM LLC’s advertising network, excluding screens and attendance associated with certain AMC Rave and Cinemark Rave theaters that are currently part of another cinema advertising network for all periods presented. Refer to Note 4 to the audited Consolidated Financial Statements included elsewhere in this document. |
Basis of Presentation
Prior to the completion of the IPO, NCM LLC was wholly-owned by its founding members. In connection with the offering, NCM, Inc. purchased newly issued common membership units from NCM LLC and common membership units from NCM LLC’s founding members, and became a member of and the sole manager of NCM LLC. We entered into several agreements to effect the reorganization and the financing transaction and certain amendments were made to the existing ESAs to govern the relationships among NCM LLC and NCM LLC’s founding members after the completion of these transactions.
The results of operations data discussed herein were derived from the audited Consolidated Financial Statements and accounting records of NCM, Inc. and should be read in conjunction with the notes thereto.
34
We have a 52-week or 53-week fiscal year ending on the first Thursday after December 25. Fiscal year 2014 contained 53 weeks. Fiscal years 2015 and 2016 contained 52 weeks. Our 2017 fiscal year will contain 52 weeks. Throughout this document, we refer to our fiscal years as set forth below:
|
|
|
Reference in |
|
Fiscal Year Ended |
|
this Document |
|
December 29, 2016 |
|
2016 |
|
December 31, 2015 |
|
2015 |
|
January 1, 2015 |
|
2014 |
Results of Operations
Fiscal Years 2016 and 2015
Revenue. Total revenue increased $1.1 million, or 0.2%, from $446.5 million for the year ended December 31, 2015 to $447.6 million for the year ended December 29, 2016. The following is a summary of revenue by category (in millions):
|
|
|
Fiscal Year |
|
|
$ Change |
|
|
% Change |
|
|||||||
|
|
|
2016 |
|
|
2015 |
|
|
2015 to 2016 |
|
|
2015 to 2016 |
|
||||
|
National advertising revenue |
|
$ |
311.9 |
|
|
$ |
307.0 |
|
|
$ |
4.9 |
|
|
|
1.6 |
% |
|
Local and regional advertising revenue |
|
|
107.0 |
|
|
|
109.5 |
|
|
|
(2.5 |
) |
|
|
(2.3 |
%) |
|
Founding member advertising revenue from beverage concessionaire agreements |
|
|
28.7 |
|
|
|
30.0 |
|
|
|
(1.3 |
) |
|
|
(4.3 |
%) |
|
Total revenue |
|
$ |
447.6 |
|
|
$ |
446.5 |
|
|
$ |
1.1 |
|
|
|
0.2 |
% |
The following table shows data on revenue per attendee for the years ended December 29, 2016 and December 31, 2015:
|
|
|
Fiscal Year |
|
|
% Change |
|
||||||
|
|
|
2016 |
|
|
2015 |
|
|
2015 to 2016 |
|
|||
|
National advertising revenue per attendee |
|
$ |
0.453 |
|
|
$ |
0.442 |
|
|
|
2.5 |
% |
|
Local and regional advertising revenue per attendee |
|
$ |
0.155 |
|
|
$ |
0.158 |
|
|
|
(1.9 |
%) |
|
Total advertising revenue (excluding founding member beverage revenue) per attendee |
|
$ |
0.608 |
|
|
$ |
0.600 |
|
|
|
1.3 |
% |
|
Total advertising revenue per attendee |
|
$ |
0.650 |
|
|
$ |
0.643 |
|
|
|
1.1 |
% |
|
Total theater attendance (in millions) (1) |
|
|
688.8 |
|
|
|
694.7 |
|
|
|
(0.8 |
%) |
|
|
(1) |
Represents the total attendance within NCM LLC’s advertising network, excluding screens and attendance associated with certain AMC Rave and Cinemark Rave theaters for all periods presented. Refer to Note 4 to the audited Consolidated Financial Statements included elsewhere in this document. |
National advertising revenue. The $4.9 million, or 1.6%, increase in national advertising revenue (excluding beverage revenue from the founding members) was due primarily to a 9.6% increase in national advertising CPMs (excluding beverage) during the year ended December 29, 2016 compared to the year ended December 31, 2015 and a $5.4 million increase in online, mobile and other revenue not included in the inventory measured by impressions sold or by CPMs. The increase in national advertising CPMs was due primarily to higher CPMs on upfront commitments year over year and to a lesser extent higher CPMs in the scatter market as well. These increases to revenue were partially offset by an 8.2% decrease in impressions sold during the year ended December 29, 2016, compared to the year ended December 31, 2015. The decrease in impressions sold was due primarily to fewer impressions sold during the first half of 2016, compared to the first half of 2015. The decrease in impressions sold resulted in a decrease in national inventory utilization, from 128.3% in 2015 to 118.4% in 2016 on a 0.8% decrease in network attendance. Inventory utilization is calculated as utilized impressions divided by total advertising impressions, which is based on eleven 30-second salable national advertising units in our FirstLook pre-show, which can be expanded, should market demand dictate.
Local and regional advertising revenue. The $2.5 million, or 2.3%, decrease in local and regional advertising revenue was driven by a decrease in revenue from contracts greater than $100,000, whereby they had a 6.9% decrease in contract volume and a 5.6% decrease in average contract value during 2016, compared to 2015. The decrease in revenue from contracts greater than $100,000 was driven by fewer contracts that were greater than $1 million. This was
35
partially offset by revenue from contracts less than $100,000 which increased 2.5% in contract volume primarily related to the expansion of our salesforce and diversification of our client base.
Founding member beverage revenue. The $1.3 million, or 4.3%, decrease in national advertising revenue from the founding members’ beverage concessionaire agreements was due to a decrease of $3.0 million related to one of the founding members reducing the length of its beverage advertising unit by 30 seconds beginning July 1, 2015, partially offset by a 5.7% increase in beverage revenue CPMs. The 2016 beverage revenue CPM is based on the change in CPM during segment one of the FirstLook pre-show from 2014 to 2015, which increased 5.7%.
Operating expenses. Total operating expenses decreased $23.9 million, or 8.0%, from $298.5 million for the year ended December 31, 2015 to $274.6 million for the year ended December 29, 2016. The following table shows the changes in operating expense for the year ended December 29, 2016 and December 31, 2015 (in millions):
|
|
|
Fiscal Year |
|
|
$ Change |
|
|
% Change |
|
|||||||
|
|
|
2016 |
|
|
2015 |
|
|
2015 to 2016 |
|
|
2015 to 2016 |
|
||||
|
Advertising operating costs |
|
$ |
30.0 |
|
|
$ |
30.8 |
|
|
$ |
(0.8 |
) |
|
|
(2.6 |
%) |
|
Network costs |
|
|
17.1 |
|
|
|
17.8 |
|
|
|
(0.7 |
) |
|
|
(3.9 |
%) |
|
Theater access fees—founding members |
|
|
75.1 |
|
|
|
72.5 |
|
|
|
2.6 |
|
|
|
3.6 |
% |
|
Selling and marketing costs |
|
|
72.8 |
|
|
|
72.3 |
|
|
|
0.5 |
|
|
|
0.7 |
% |
|
Administrative and other costs |
|
|
43.8 |
|
|
|
38.6 |
|
|
|
5.2 |
|
|
|
13.5 |
% |
|
Depreciation and amortization |
|
|
35.8 |
|
|
|
32.2 |
|
|
|
3.6 |
|
|
|
11.2 |
% |
|
Total operating expenses before the merger termination fee and related merger costs |
|
|
274.6 |
|
|
|
264.2 |
|
|
|
10.4 |
|
|
|
3.9 |
% |
|
Merger termination fee and related merger costs |
|
|
— |
|
|
|
34.3 |
|
|
|
(34.3 |
) |
|
|
(100.0 |
%) |
|
Total operating expenses |
|
$ |
274.6 |
|
|
$ |
298.5 |
|
|
$ |
(23.9 |
) |
|
|
(8.0 |
%) |
Advertising operating costs. Advertising operating costs decreased $0.8 million, or 2.6%, from $30.8 million for the year ended December 31, 2015 to $30.0 million for the year ended December 29, 2016. This decrease was primarily due to a $0.4 million decrease in personnel related expenses and $0.2 million lower on-screen production costs during year ended December 29, 2016, compared to the year ended December 31, 2015.
Network costs. Network costs decreased $0.7 million, or 3.9%, from $17.8 million for the year ended December 31, 2015 to $17.1 million for the year ended December 29, 2016 due primarily to a decrease of $0.5 million in network maintenance costs related to our DCN.
Theater access fees—founding members. Theater access fees increased $2.6 million, or 3.6%, from $72.5 million for the year ended December 31, 2015 to $75.1 million for the year ended December 29, 2016. The increase was due to a $2.6 million increase in the fee associated with the number of founding member digital screens that are connected to the DCN, including higher quality digital cinema projectors and related equipment. The $2.6 million increase in digital screen fees increased $1.5 million related to an annual 5% rate increase specified in the ESAs and $1.1 million from an increase in the number of founding member screens equipped with higher quality digital cinema equipment. Theater access fees based upon founding member attendance remained consistent during 2016, compared to 2015 as founding member attendance remained flat year over year.
Selling and marketing costs. Selling and marketing costs increased $0.5 million, or 0.7%, from $72.3 million for the year ended December 31, 2015 to $72.8 million for the year ended December 29, 2016. This increase was primarily due to an increase of $0.9 million in online publisher expense related to higher online and mobile revenue, a $0.8 million increase in marketing research expenses and $0.7 million due to a non-cash impairment charge on an investment obtained in exchange for advertising services. These increases to selling and marketing costs were partially offset by a $1.7 million decrease in personnel related expenses due primarily to lower commission and bonus expense during the year ended December 29, 2016, compared to the year ended December 31, 2015.
Administrative and other costs. Administrative and other costs increased $5.2 million, or 13.5%, from $38.6 million for the year ended December 31, 2015 to $43.8 million for the year ended December 29, 2016 due primarily to a $3.0 million increase in CEO transition costs, which consisted primarily of severance and consulting costs to our former CEO, a $0.7 million increase in personnel-related costs related primarily to higher non-cash share based compensation expense associated with modifying equity awards with our former CEO, a $0.7 million increase in franchise and other non-income based tax expenses and a $0.6 million increase in professional service costs.
36
Depreciation and amortization. Depreciation and amortization expense increased $3.6 million, or 11.2%, from $32.2 million for the year ended December 31, 2015 to $35.8 million for the year ended December 29, 2016. The increase was due to an increase in amortization expense of intangible assets related primarily to founding member common unit adjustments, partially offset by lower depreciation expense as assets became fully depreciated.
Merger termination fee and related merger costs. The merger termination fee and related merger costs were $34.3 million for the year ended December 31, 2015 due to the merger termination payment of approximately $26.8 million and approximately $7.5 million in primarily legal, accounting, advisory and other professional fees associated with the terminated Screenvision merger.
Non-operating expenses. Total non-operating expenses increased $10.3 million, or 15.5%, from $66.5 million for the year ended December 31, 2015 to $76.8 million for the year ended December 29, 2016. The following table shows the changes in non-operating expense for the years ended December 29, 2016 and December 31, 2015 (in millions):
|
|
|
Fiscal Year |
|
|
$ Change |
|
|
% Change |
|
|||||||
|
|
|
2016 |
|
|
2015 |
|
|
2015 to 2016 |
|
|
2015 to 2016 |
|
||||
|
Interest on borrowings |
|
$ |
54.0 |
|
|
$ |
52.2 |
|
|
$ |
1.8 |
|
|
|
3.4 |
% |
|
Interest income |
|
|
(1.5 |
) |
|
|
(1.6 |
) |
|
|
0.1 |
|
|
|
(6.3 |
%) |
|
Accretion of interest on the discounted payable to founding members under tax receivable agreement |
|
|
13.9 |
|
|
|
14.1 |
|
|
|
(0.2 |
) |
|
|
(1.4 |
%) |
|
Amortization of terminated derivatives |
|
|
— |
|
|
|
1.6 |
|
|
|
(1.6 |
) |
|
|
(100.0 |
%) |
|
Loss on early retirement of debt |
|
|
10.4 |
|
|
|
— |
|
|
|
10.4 |
|
|
|
100.0 |
% |
|
Other non-operating expense |
|
|
— |
|
|
|
0.2 |
|
|
|
(0.2 |
) |
|
|
(100.0 |
%) |
|
Total non-operating expenses |
|
$ |
76.8 |
|
|
$ |
66.5 |
|
|
$ |
10.3 |
|
|
|
15.5 |
% |
The increase in non-operating expense was due primarily to a $10.4 million loss on early retirement of debt recorded in the year ended December 29, 2016 as a result of the redemption of our Notes due 2021. The loss on early retirement of debt included an approximate $7.9 million redemption premium and the write-off of approximately $2.5 million in unamortized debt issuance costs. The interest on borrowings increased approximately $1.8 million in 2016 compared to 2015 due to the one-month period between the issuance of the Notes due 2026 in August 2016 and the redemption of the Notes due 2021 in September 2016, whereby interest was paid on both notes for one month, as well as, a higher LIBOR rate on our term loans during 2016 compared to 2015. These increases in non-operating expenses were partially offset by a $1.6 million decrease in the amortization of terminated derivatives as the amortization period ended in February 2015.
Net income. Net income increased $10.0 million from $15.4 million for the year ended December 31, 2015 to $25.4 million for the year ended December 29, 2016. The increase in net income was primarily due to an increase of $25.0 million in operating income, as described above, and a decrease of $8.6 million in income tax expense due primarily to a change of $7.8 million for a reserve for uncertain tax positions as $4.9 million of reserve was added during 2015 and $2.9 million was reversed during 2016 as the statute of limitations expired in the period. These increases to net income were partially offset by an increase of $10.3 million in non-operating expense, as described above, and a $13.3 million increase in income attributable to noncontrolling interests.
Fiscal Years 2015 and 2014
Revenue. Total revenue increased $52.5 million, or 13.3%, from $394.0 million for the year ended January 1, 2015 to $446.5 million for the year ended December 31, 2015. The following is a summary of revenue by category (in millions):
|
|
|
Fiscal Year |
|
|
$ Change |
|
|
% Change |
|
|||||||
|
|
|
2015 |
|
|
2014 |
|
|
2014 to 2015 |
|
|
2014 to 2015 |
|
||||
|
National advertising revenue |
|
$ |
307.0 |
|
|
$ |
255.9 |
|
|
$ |
51.1 |
|
|
|
20.0 |
% |
|
Local and regional advertising revenue |
|
|
109.5 |
|
|
|
99.7 |
|
|
|
9.8 |
|
|
|
9.8 |
% |
|
Founding member advertising revenue from beverage concessionaire agreements |
|
|
30.0 |
|
|
|
38.4 |
|
|
|
(8.4 |
) |
|
|
(21.9 |
%) |
|
Total revenue |
|
$ |
446.5 |
|
|
$ |
394.0 |
|
|
$ |
52.5 |
|
|
|
13.3 |
% |
37
The following table shows data on revenue per attendee for the years ended December 31, 2015 and January 1, 2015 (in millions):
|
|
|
Fiscal Year |
|
|
% Change |
|
||||||
|
|
|
2015 |
|
|
2014 |
|
|
2014 to 2015 |
|
|||
|
National advertising revenue per attendee |
|
$ |
0.442 |
|
|
$ |
0.372 |
|
|
|
18.8 |
% |
|
Local and regional advertising revenue per attendee |
|
$ |
0.158 |
|
|
$ |
0.145 |
|
|
|
9.0 |
% |
|
Total advertising revenue (excluding founding member beverage revenue) per attendee |
|
$ |
0.600 |
|
|
$ |
0.517 |
|
|
|
16.1 |
% |
|
Total advertising revenue per attendee |
|
$ |
0.643 |
|
|
$ |
0.573 |
|
|
|
12.2 |
% |
|
Total theater attendance (in millions) (1) |
|
|
694.7 |
|
|
|
688.2 |
|
|
|
0.9 |
% |
|
|
(1) |
Represents the total attendance within NCM LLC’s advertising network, excluding screens and attendance associated with certain AMC Rave and Cinemark Rave theaters for all periods presented. Refer to Note 4 to the audited Consolidated Financial Statements included elsewhere in this document. |
National advertising revenue. The $51.1 million, or 20.0%, increase in national advertising revenue (excluding beverage revenue from the founding members) was due primarily to a 14.2% increase in impressions sold during the year ended December 31, 2015, compared to the year ended January 1, 2015 and a 6.7% increase in national advertising CPMs (excluding beverage) during the year ended December 31, 2015, compared to the year ended January 1, 2015. The increase in impressions sold was driven by an increase in national inventory utilization from 115.7% for the year ended January 1, 2015 to 128.3% for the year ended December 31, 2015, due to an expansion of our client base and increased spending by certain existing clients, related in part to the success of our strategy to compete in the national television Upfront marketplace. Inventory utilization is calculated as utilized impressions divided by total advertising impressions, which is based on eleven 30-second salable national advertising units in our FirstLook pre-show, which can be expanded, should market demand dictate. This increase in impressions sold was also driven by an increase in our network theater attendance of 0.9% related to an overall increase in cinema industry attendance resulting from a stronger film release schedule and the addition of new network screens. The increase in CPMs relates primarily to our successful Upfront sales campaign and strong scatter market.
Local and regional advertising revenue. The $9.8 million, or 9.8%, increase in local and regional advertising revenue was driven by an increase of $6.9 million, or 21.7%, in revenue from larger regional contracts (greater than $100,000). The volume of contracts greater than $100,000 increased 33.9%, partially offset by a decrease of 9.1% in average contract value of contracts greater than $100,000. The increase in volume of contracts greater than $100,000 was due to the stronger film release schedule and higher sales to agencies responsible for larger regional advertising budgets. Revenue from local contracts under $100,000 increased 4.8% during the year ended December 31, 2015, compared to the year ended January 1, 2015.
Founding member beverage revenue. The $8.4 million, or 21.9%, decrease in national advertising revenue from the founding members’ beverage concessionaire agreements was due to a 14.4% decrease in beverage revenue CPMs and a decrease of 0.4% in founding member attendance during the year ended December 31, 2015, compared to the year ended January 1, 2015. The 2015 beverage revenue CPM is based on the change in CPM during segment one of the FirstLook pre-show from 2013 to 2014, which decreased 14.4%. Founding member beverage revenue also decreased by $2.7 million due to one of the founding members reducing the length of the beverage advertising unit from 60 seconds to 30 seconds beginning July 1, 2015. We have the right to sell the 30 second unit to other clients.
38
Operating expenses. Total operating expenses increased $56.2 million, or 23.2%, from $242.3 million for the year ended January 1, 2015 to $298.5 million for the year ended December 31, 2015. The following table shows the changes in operating expense for the year ended December 31, 2015 and January 1, 2015 (in millions):
|
|
|
Fiscal Year |
|
|
$ Change |
|
|
% Change |
|
|||||||
|
|
|
2015 |
|
|
2014 |
|
|
2014 to 2015 |
|
|
2014 to 2015 |
|
||||
|
Advertising operating costs |
|
$ |
30.8 |
|
|
$ |
26.4 |
|
|
$ |
4.4 |
|
|
|
16.7 |
% |
|
Network costs |
|
|
17.8 |
|
|
|
18.3 |
|
|
|
(0.5 |
) |
|
|
(2.7 |
%) |
|
Theater access fees—founding members |
|
|
72.5 |
|
|
|
70.6 |
|
|
|
1.9 |
|
|
|
2.7 |
% |
|
Selling and marketing costs |
|
|
72.3 |
|
|
|
57.6 |
|
|
|
14.7 |
|
|
|
25.5 |
% |
|
Administrative and other costs |
|
|
38.6 |
|
|
|
29.5 |
|
|
|
9.1 |
|
|
|
30.8 |
% |
|
Depreciation and amortization |
|
|
32.2 |
|
|
|
32.4 |
|
|
|
(0.2 |
) |
|
|
(0.6 |
%) |
|
Total operating expenses before the merger termination fee and related merger costs |
|
|
264.2 |
|
|
|
234.8 |
|
|
|
29.4 |
|
|
|
12.5 |
% |
|
Merger termination fee and related merger costs |
|
|
34.3 |
|
|
|
7.5 |
|
|
|
26.8 |
|
|
NM |
|
|
|
Total operating expenses |
|
$ |
298.5 |
|
|
$ |
242.3 |
|
|
$ |
56.2 |
|
|
|
23.2 |
% |
NM = Not meaningful.
Advertising operating costs. Advertising operating costs increased $4.4 million, or 16.7%, from $26.4 million for the year ended January 1, 2015 to $30.8 million for the year ended December 31, 2015. This increase was primarily the result of a $3.6 million increase in affiliate advertising payments which was driven by higher national and local advertising revenue and a 3.5% increase in the number of average affiliate screens for the year ended December 31, 2015, compared to the year ended January 1, 2015.
Network costs. Network costs decreased $0.5 million, or 2.7%, from $18.3 million for the year ended January 1, 2015 to $17.8 million for the year ended December 31, 2015 due primarily to a decrease of $0.5 million in personnel related expenses due primarily to lower salaries due to department realignment, partially offset by higher bonus expense due to improved performance against targets compared to 2014.
Theater access fees—founding members. Theater access fees increased $1.9 million, or 2.7%, from $70.6 million for the year ended January 1, 2015 to $72.5 million for the year ended December 31, 2015. The increase was due to a $2.0 million increase in the fee associated with the number of founding member digital screens that are connected to the DCN, including higher quality digital cinema projectors and related equipment. These fees increased $1.3 million related to an annual 5% rate increase specified in the ESAs and $0.7 million from an increase in the number of founding member screens equipped with the higher quality digital cinema equipment. This increase of $2.0 million was partially offset by a $0.1 million decrease in attendance related fees due to a 0.4% decrease in founding member attendance during the year ended December 31, 2015 compared to the year ended January 1, 2015.
Selling and marketing costs. Selling and marketing costs increased $14.7 million, or 25.5%, from $57.6 million for the year ended January 1, 2015 to $72.3 million for the year ended December 31, 2015. This increase was primarily due to an increase of $8.5 million in personnel related expenses due primarily to higher non-cash share-based compensation expense, higher commission expense and higher bonus expense, all primarily related to better performance against targets and higher revenue compared to 2014. Selling and marketing costs also increased due to an increase of $2.1 million in bad debt expense due to a smaller reserve in 2014 compared to 2015 and an increase of $1.2 million in non-cash barter expense.
Administrative and other costs. Administrative and other costs increased $9.1 million, or 30.8%, from $29.5 million for the year ended January 1, 2015 to $38.6 million for the year ended December 31, 2015 due primarily to a $7.7 million increase in personnel related expenses due primarily to higher non-cash share-based compensation expense and higher bonus expense, both primarily related to better performance against targets compared to 2014, as well as, an increase in salaries and related payroll tax and benefit costs. Administrative and other costs also increased due to approximately $0.8 million in higher legal and professional expenses during the year ended December 31, 2015 compared to the year ended January 1, 2015.
Depreciation and amortization. Depreciation and amortization expense decreased $0.2 million, or 0.6%, from $32.4 million for the year ended January 1, 2015 to $32.2 million for the year ended December 31, 2015 due to lower depreciation expense as assets became fully depreciated, partially offset by an increase in amortization expense of intangible assets related to new affiliate agreements and the founding member common unit adjustments.
39
Merger termination fee and related merger costs. Merger-related costs increased by $26.8 million from $7.5 million for the year ended January 1, 2015 to $34.4 million for the year ended December 31, 2015 due to the merger termination payment of approximately $26.8 million.
Non-operating expenses. Total non-operating expenses decreased $9.7 million, or 12.7%, from $76.2 million for the year ended January 1, 2015 to $66.5 million for the year ended December 31, 2015. The following table shows the changes in non-operating expense for the years ended December 31, 2015 and January 1, 2015 (in millions):
|
|
|
Fiscal Year |
|
|
$ Change |
|
|
% Change |
|
|||||||
|
|
|
2015 |
|
|
2014 |
|
|
2014 to 2015 |
|
|
2014 to 2015 |
|
||||
|
Interest on borrowings |
|
$ |
52.2 |
|
|
$ |
52.6 |
|
|
$ |
(0.4 |
) |
|
|
(0.8 |
%) |
|
Interest income |
|
|
(1.6 |
) |
|
|
(1.8 |
) |
|
|
0.2 |
|
|
|
(11.1 |
%) |
|
Accretion of interest on the discounted payable to founding members under tax receivable agreement |
|
|
14.1 |
|
|
|
14.6 |
|
|
|
(0.5 |
) |
|
|
(3.4 |
%) |
|
Amortization of terminated derivatives |
|
|
1.6 |
|
|
|
10.0 |
|
|
|
(8.4 |
) |
|
|
(84.0 |
%) |
|
Other non-operating expense |
|
|
0.2 |
|
|
|
0.8 |
|
|
|
(0.6 |
) |
|
|
(75.0 |
%) |
|
Total non-operating expenses |
|
$ |
66.5 |
|
|
$ |
76.2 |
|
|
$ |
(9.7 |
) |
|
|
(12.7 |
%) |
The decrease in non-operating expense was due primarily to an $8.4 million decrease in the amortization of terminated derivatives as the amortization period ended in February 2015, a decrease of $0.6 million in other non-operating expense and a decrease of $0.5 million in accretion of interest expense under the tax receivable agreement due primarily to changes in tax rates and NCM LLC ownership rates period over period.
Net income. Net income increased $2.0 million from $13.4 million for the year ended January 1, 2015 to $15.4 million for the year ended December 31, 2015. The increase in net income was primarily due to a decrease of $9.7 million in non-operating expense, as described above and a $3.9 million decrease in income attributable to noncontrolling interests, partially offset by a decrease in operating income of $3.7 million, as described further above, and an increase in income tax expense of $7.9 million due primarily to a $4.9 million tax reserve for uncertain tax positions and higher net income before taxes in the period.
Known Trends and Uncertainties
Trends and Uncertainties Related to our Business, Industry and Corporate Structure
Changes in the current macro-economic environment and changes in the national, regional and local advertising markets, present uncertainties that could impact our results of operations, including the timing and amount of spending from our advertising clients. These changes include increased competition related to the expansion of online and mobile advertising platforms. Further, we could negatively be impacted by factors that could reduce the viewership of our FirstLook pre-show, such as the expansion of reserve seating, an increase in the number and length of trailers for upcoming films and lower network attendance, which could result from shortening of release windows, more alternative methods of delivering movies to consumers, lower consumer confidence and disposable income and a decline in the motion picture box office. The impact to our business associated with these issues could be mitigated over time due to factors including the increase in salable advertising impressions, better geographic coverage related to the expansion of our network, diversification and growth of our advertising client base, improvements in FirstLook pre-show engagement ad upgrades to our inventory management and data management systems. We could also benefit if the effectiveness of cinema advertising improves relative to other advertising mediums. We continue to participate in the Upfronts and believe that over time, a shift toward more upfront commitments, would allow us to bundle several client flights throughout the year in an effort to stabilize month-to-month and quarter-to-quarter volatility. Consistent with the television industry upfront booking practices, a portion of our upfront commitments have cancellation options or options to reduce the amount that advertisers may purchase and we would need to rely on the scatter market to replace those commitments.
The net screens added to our network by the founding members and network affiliates during the year ended December 29, 2016 were as follows.
40
|
|
Number of screens |
|
||||||||||
|
|
|
Founding Members |
|
|
Network Affiliates |
|
|
Total |
|
|||
|
Balance as of December 31, 2015 |
|
|
16,981 |
|
|
|
3,380 |
|
|
|
20,361 |
|
|
New affiliates (1) |
|
|
— |
|
|
|
38 |
|
|
|
38 |
|
|
Openings, net of closures |
|
|
41 |
|
|
|
108 |
|
|
|
149 |
|
|
Balance as of December 29, 2016 |
|
|
17,022 |
|
|
|
3,526 |
|
|
|
20,548 |
|
|
|
(1) |
During the year ended December 29, 2016, we added three net new affiliates with 232 screens, partially offset by the loss of a theater circuit that was acquired by a circuit not in our network, resulting in 194 screens being removed from our network. |
We believe that adding screens and attendees to our network will provide our advertising clients with a better marketing product with increased reach and improved geographic coverage. We have begun to offer our advertising clients better audience targeting capabilities and more robust campaign data analytics that are expected to assist with our strategy to provide a better product offering to advertisers and thus expand our overall national client base. We also believe that the continued growth of our market coverage ubiquity and overall number of impressions will strengthen our selling proposition and competitive positioning against other national, regional and local video advertising platforms, including television, online and mobile video platforms and other out of home video advertising platforms.
In 2014, we experienced a decline of 16.4%, in national advertising CPMs (excluding beverage revenue) compared to the prior year due primarily to the increased competition from other national video networks, including online and mobile advertising platforms, television networks and other out-of-home video networks and the implementation of more aggressive seasonal and volume pricing strategies that contributed to the expansion of our inventory utilization related to the addition of new client categories that traditionally buy their television advertising at lower CPMs. After adjusting our pricing through 2014 to be more attractive to a broader number of potential clients, to compete more effectively with various forms of premium video advertising and reflect seasonal marketplace supply and demand characteristics, during 2015 and 2016, we experienced an increase of 6.7% and 9.6%, respectively, in national advertising CPMs (excluding beverage revenue). We experience even more substantial volatility quarter-to-quarter. This volatility in utilization can be driven by the loss or addition of one or more significant national contracts, whereby the timing and amount of these national contracts can be based upon the advertising budgets of our customers, product launches, the financial performance of our customers or other industry or macro-economic factors. We expect our CPMs and utilization to continue to be impacted period to period based upon the factors described above.
Under the ESAs, up to 90 seconds of the FirstLook program can be sold to NCM LLC’s founding members to satisfy their on-screen advertising commitments under their beverage concessionaire agreements. During the first six months of 2015, we sold 60 seconds to NCM LLC’s founding members. Beginning July 1, 2015, one of our founding members reduced their beverage advertising from 60 seconds to 30 seconds. We have the right to sell the 30 second unit to other clients. The other founding members’ current long-term contracts with their beverage suppliers require 60 seconds of beverage advertising, although such commitments could change in the future. Should the amount of time acquired as part of these beverage concessionaire agreements decline with the other founding members, this premium time will be available for sale to other clients. Per the ESAs, the time sold to the founding member beverage supplier is priced equal to the advertising CPM for the previous year charged to unaffiliated third parties during segment one (closest to show time) of the FirstLook pre-show, limited to the highest advertising CPM being then-charged by NCM LLC, which in 2016 increased 10.2%. Thus, the CPM on our beverage concessionaire revenue in 2017 will increase by 10.2%, compared to 2016.
In consideration for NCM LLC’s access to NCM LLC’s founding members’ theater attendees for on-screen advertising and use of lobbies and other space within NCM LLC’s founding members’ theaters for the LEN and lobby promotions, NCM LLC’s founding members receive a monthly theater access fee under the ESAs. The theater access fee is composed of a fixed payment per patron and a fixed payment per digital screen (connected to the DCN). The payment per theater patron increases by 8% every five years, with the next increase taking effect for fiscal year 2017, and the payment per digital screen increases annually by 5%. The theater access fee paid in the aggregate to all founding members cannot be less than 12% of NCM LLC’s aggregate advertising revenue (as defined in the ESA), or it will be adjusted upward to reach this minimum payment. Pursuant to ESAs, the theater access fee paid to the members of NCM LLC included an additional fee for access to the higher quality digital cinema systems. This additional fee will continue to increase as additional screens are equipped with the new digital cinema equipment and the fee increases annually by 5%. As of December 29, 2016, 90% of our founding member network screens were showing advertising on digital cinema projectors.
41
Trends and Uncertainties Related to Liquidity and Financial Performance
During the past several years, we amended our senior secured credit facility to extend the maturity, expand the revolver availability and reduce the interest rate spreads. In August 2016, we completed a private placement of $250.0 million in aggregate principal amount of 5.750% Senior Unsecured Notes due in 2026. A portion of the proceeds were used to redeem our $200.0 million 7.875% Senior Unsecured Notes due 2021. The remaining proceeds, after the payment of fees and the redemption premium were used to pay down the balance on our revolving credit facility. As a result of these financing transactions on our revolving credit facility and senior notes, we extended the average maturities of our debt and as of December 29, 2016, the average remaining maturity of our debt is 5.7 years. As of December 29, 2016, approximately 70% of our outstanding borrowings bear interest at fixed rates. The remaining 30% of our outstanding borrowings bear interest at variable rates and as such, our net income and earnings per share could fluctuate with interest rate fluctuations related to our borrowings. Refer to Note 9 to the audited Consolidated Financial Statements included elsewhere in this document.
At times our cash flow available for the payment of dividends (NCM LLC’s Adjusted OIBDA, less capital expenditures, interest expense, distributions to NCM LLC’s founding members, income taxes, tax receivable agreement payments to NCM LLC’s founding members and plus certain cash items) has been less than our regular dividend payment. Any deficit has been funded by NCM, Inc.’s cash and marketable securities balances. As of December 29, 2016, these cash and marketable securities balances totaled $58.0 million (excluding NCM LLC). We intend to pay a regular quarterly dividend for the foreseeable future at the discretion of the Board of Directors consistent with our intention to distribute over time a substantial portion of our free cash flow. The declaration, payment, timing and amount of any future dividends payable will be at the sole discretion of the Board of Directors who will take into account general economic and advertising market business conditions, the Company’s financial condition, available cash, current and anticipated cash needs, and any other factors that the Board of Directors considers relevant.
Our effective tax rate for the years ended December 29, 2016, December 31, 2015 and January 1, 2015 was 26.6%, 53.6% and 43.3%, respectively. Our tax rate is affected by recurring items and the relative amount of income that NCM, Inc. earns in various state and local jurisdictions. Our tax rate is also impacted by discrete items that may occur in any year. The decrease in the tax rate for the year ended December 29, 2016 was due to a reversal of a reserve for uncertain tax positions because the statute of limitations expired during the period. The increase in the tax rate of 10.3% between January 1, 2015 and December 31, 2015 is primarily the result of the establishment of a reserve for uncertain tax positions of $4.9 million. Due to the expiration of the statute of limitations, $2.9 million of that amount was reversed in 2016, contributing to a decrease in the rate of 27.0% during the period. As of December 29, 2016, we have federal and state net operating loss carryforwards of approximately $27.6 million and $47.5 million, respectively, which we expect to be able to utilize prior to their expiration. Refer to Note 6 to the audited Consolidated Financial Statements included elsewhere in this document.
Trends Related to Ownership in NCM LLC
In accordance with NCM LLC’s Common Unit Adjustment Agreement with its founding members, on an annual basis NCM LLC determines the amount of common membership units to be issued to or returned by the founding members based on theater additions or dispositions during the previous year. During the first quarter of 2016, NCM LLC issued 1,416,515 common membership units to its founding members for the rights to exclusive access to the theater screens and attendees added, net of dispositions by the founding members to NCM LLC’s network during 2015. NCM LLC recorded a net intangible asset of $21.1 million during the first quarter of 2016 as a result of the Common Unit Adjustment.
Overall, NCM Inc.’s ownership in NCM LLC decreased to 43.7% as of December 29, 2016 compared to 43.8% at December 31, 2015 due to the common unit adjustments described above, partially offset by the issuance of NCM, Inc. common stock upon the vesting of restricted stock or exercise of stock options, which has proportionally increased net income attributable to noncontrolling interests and decreased net income attributable to NCM, Inc.
42
In December 2016, AMC completed its acquisition of a large motion picture exhibitor, Carmike Cinemas, Inc. (“Carmike”). Following the acquisition, AMC retained Carmike’s ownership in another cinema advertising provider (Screenvision) and the long-term agreement with that provider to provide cinema advertising remains in effect. In connection with the acquisition, AMC and the DOJ entered into a settlement regarding certain actions that AMC must take in order to complete the acquisition. Among those, AMC is required to divest the majority of its equity interests in NCM LLC, so that by June 20, 2019 it owns no more than 4.99% of NCM LLC’s outstanding membership units. AMC must complete the divestiture per the following schedule: (i) on or before December 20, 2017, AMC must own no more than 15% of NCM LLC’s outstanding membership units, (ii) on or before December 20, 2018, AMC must own no more than 7.5% of NCM LLC’s outstanding membership units and (iii) on or before June 20, 2019, AMC must own no more than 4.99% of NCM LLC’s outstanding membership units. As required by the DOJ settlement, AMC also relinquished its governance rights in NCM LLC, including its seats on the NCM, Inc. Board of Directors as well as its rights to nominate any person to serve on the NCM, Inc. Board of Directors. As of December 29, 2016, AMC’s non-independent designee to the Board of Directors had resigned. Further, AMC is required to change the pre-show advertising provider for 24 identified theaters comprising 384 screens from NCM LLC to Screenvision or sell those theaters to a non-NCM network buyer. Seven of those 24 theaters either did not have a cinema advertising provider, they were already being sold by AMC or it was an encumbered theater that we were receiving integration payments for, such that 17 of the 24 theaters currently need to be transferred or sold. AMC is also required to divest 15 AMC or Carmike theaters covering 15 local markets. As of the date of this filing, we are not aware which of those 15 theaters will be in our network or if they would be sold to another founding member or network affiliate. These theater transfers or sales represent approximately 2% of our total network of theaters as of December 29, 2016.
Pursuant to NCM, Inc.’s Amended and Restated Certificate of Incorporation and NCM LLC’s Third Amended and Restated Limited Liability Company Operating Agreement, as amended, members of NCM LLC, other than NCM, Inc., may choose to have common membership units redeemed, and NCM, Inc. may elect to redeem through either a cash payment or the issuance of shares of its common stock on a one-for-one basis. If AMC redeems its common membership units for NCM, Inc. common stock, NCM, Inc.’s ownership will increase proportionally and the number of shares outstanding of NCM, Inc. common stock will increase. Further, the sale of AMC theaters or transfer of advertising on those theaters, may require AMC to transfer and surrender, and NCM LLC to cancel, common membership units related to the theater dispositions.
Financial Condition and Liquidity
Liquidity
Our cash balances can fluctuate due to the seasonality of our business and related timing of collections of accounts receivable balances and operating expenditure payments, as well as, available cash payments (as defined in the NCM LLC Operating Agreement) to the founding members, interest or principal payments on our term loan and the Notes due 2022 and Notes due 2026, income tax payments, tax receivable agreement payments to the founding members and amount of quarterly dividends to NCM, Inc.’s common stockholders.
A summary of our financial liquidity is as follows (in millions):
|
|
|
Years Ended |
|
|
$ Change |
|
||||||||||||||
|
|
|
December 29, 2016 |
|
|
December 31, 2015 |
|
|
January 1, 2015 |
|
|
2015 to 2016 |
|
|
2014 to 2015 |
|
|||||
|
Cash, cash equivalents and marketable securities (1) |
|
$ |
68.7 |
|
|
$ |
85.4 |
|
|
$ |
80.6 |
|
|
$ |
(16.7 |
) |
|
$ |
4.8 |
|
|
Revolver availability (2) |
|
|
158.8 |
|
|
|
69.0 |
|
|
|
113.0 |
|
|
|
89.8 |
|
|
|
(44.0 |
) |
|
Total liquidity |
|
$ |
227.5 |
|
|
$ |
154.4 |
|
|
$ |
193.6 |
|
|
$ |
73.1 |
|
|
$ |
(39.2 |
) |
|
(1) |
Included in cash and cash equivalents as of December 29, 2016, December 31, 2015 and January 1, 2015 there was $10.7 million, $3.0 million and $10.2 million, respectively, of cash held by NCM LLC which is not available to satisfy NCM, Inc.'s dividend payments and other NCM, Inc. obligations. |
|
(2) |
The revolving credit facility portion of NCM LLC’s total borrowings is available, subject to certain conditions, for general corporate purposes of NCM LLC in the ordinary course of business and for other transactions permitted under the senior secured credit facility, and a portion is available for letters of credit. NCM LLC’s total capacity under the revolving credit facility was $175.0 million as of December 29, 2016 and $135.0 million as of December 31, 2015 and January 1, 2015. |
43
We have generated and used cash as follows (in millions):
|
|
|
Years Ended |
|
|||||||||
|
|
|
2016 |
|
|
2015 |
|
|
2014 |
|
|||
|
Operating cash flow |
|
$ |
133.5 |
|
|
$ |
105.3 |
|
|
$ |
117.9 |
|
|
Investing cash flow |
|
$ |
(4.3 |
) |
|
$ |
1.4 |
|
|
$ |
(3.5 |
) |
|
Financing cash flow |
|
$ |
(137.9 |
) |
|
$ |
(88.4 |
) |
|
$ |
(155.7 |
) |
Cash Flows – Fiscal Years 2016 and 2015
Operating Activities. The $28.2 million increase in cash provided by operating activities for the year ended December 29, 2016 compared to the year ended December 31, 2015 was due primarily to a $23.3 million increase in consolidated net income, as described further above, and an increase in the change in accounts receivable of $22.0 million related to higher collections, partially offset by a $11.9 million decrease in the change in accounts payable and accrued expenses due primarily to lower accrued bonus expense.
Investing Activities. The $5.7 million decrease in cash provided by investing activities for the year ended December 29, 2016 compared to the year ended December 31, 2015 was due primarily to lower proceeds from the sale and maturity of marketable securities, net of purchases, of approximately $4.4 million and $1.4 million lower proceeds from notes receivable due to timing of the payments.
Financing Activities. The $49.5 million increase in cash used in financing activities during the year ended December 29, 2016 compared to the year ended December 31, 2015 was due primarily to higher repayments, net of proceeds, under our revolving credit facility of $95.0 million, partially offset by $42.1 million of proceeds from the issuance of the Notes due 2026, net of the redemption of the Notes due 2021.
Cash Flows – Fiscal Years 2015 and 2014
Operating Activities. The $12.7 million decrease in cash provided by operating activities for the year ended December 31, 2015 compared to the year ended January 1, 2015 was due primarily to a decrease in the change in accounts receivable primarily due to higher revenue and timing of collections in the period. The decrease was partially offset by an increase in the change in accounts payable and accrued expenses due primarily to higher accrued bonus expense.
Investing Activities. The $4.9 million increase in cash provided by investing activities for the year ended December 31, 2015 compared to the year ended January 1, 2015 was due primarily to higher proceeds from the sale and maturity of marketable securities, net of purchases, of approximately $8.5 million, partially offset by $3.9 million of higher purchases of property, plant and equipment during 2015.
Financing Activities. The $67.4 million decrease in cash used in financing activities during the year ended December 31, 2015 compared to the year ended January 1, 2015 was due primarily to $42.0 million greater proceeds from borrowings, net of repayments, due to higher borrowings on the revolving credit facility to pay the merger termination fee and related merger costs, as described above, and a decrease of approximately $28.7 million in cash dividends paid due primarily to the payment of an special cash dividend in 2014 that did not occur in 2015. These decreases to cash used in financing activities were partially offset by a $5.2 million decrease in distributions to the founding members.
Sources of Capital and Capital Requirements
NCM, Inc.’s primary source of liquidity and capital resources is the quarterly available cash distributions from NCM LLC as well as its existing cash balances and marketable securities, which as of December 29, 2016 were $58.0 million (excluding NCM LLC). NCM LLC’s primary sources of liquidity and capital resources are its cash provided by operating activities, availability under its revolving credit facility and cash on hand. Refer to Note 9 to the audited Consolidated Financial Statements included elsewhere in this document and “Financings” below for a detailed discussion of the debt transactions in 2015 and 2016.
Management believes that future funds generated from NCM LLC’s operations and cash on hand should be sufficient to fund working capital requirements, NCM LLC’s debt service requirements, and capital expenditure and other investing requirements, through the next twelve months. Cash flows generated by NCM LLC’s distributions to NCM, Inc. and the founding members can be impacted by the seasonality of advertising sales, stock option exercises, interest on borrowings under our revolving credit agreement and to a lesser extent theater attendance. NCM LLC is required pursuant to the terms of the NCM LLC Operating Agreement to distribute its available cash, as defined in the operating agreement, quarterly to its
44
members (the founding members and NCM, Inc.). The available cash distribution to the members of NCM LLC for the year ended December 29, 2016, net of the negative available cash generated in the first quarter of 2015 and netted against the second quarter of 2016 distribution, was approximately $132.6 million, of which approximately $57.5 million was distributed to NCM, Inc. NCM, Inc. expects to use cash received from future available cash distributions and its cash balances to fund payments associated with the tax receivable agreement with the founding members and current and future dividends as declared by the Board of Directors, including a dividend declared on January 19, 2017 of $0.22 per share (approximately $13.3 million) on each share of the Company’s common stock (not including outstanding restricted stock) to stockholders of record on March 9, 2017 to be paid on March 23, 2017. Distributions from NCM LLC and NCM, Inc. cash balances should be sufficient to fund payments associated with the tax receivable agreement with the founding members, income taxes and its regular dividend for the foreseeable future at the discretion of the Board of Directors dependent on anticipated cash needs, overall financial condition, future prospects for earnings, available cash and cash flows, as well as other relevant factors.
Capital Expenditures
Capital expenditures of NCM LLC have typically been capitalized software development or upgrades for our DCS and advertising proposal and inventory management and audience targeting and data management systems being developed primarily by our programmers and outside consultants, equipment required for our NOC and content production and post-production facilities, office leasehold improvements, desktop equipment for use by our employees, and in certain cases, the costs necessary to digitize all or a portion of a network affiliate’s theaters when they are added to our network. Capital expenditures for the year ended December 29, 2016 were $13.3 million (including $1.1 million associated with network affiliate additions) compared to $13.0 million (including $1.1 million associated with network affiliate additions) for the 2015 period. The capital expenditures have typically been satisfied through cash flow from operations. All capital expenditures related to the DCN within the founding members’ theaters have been made by the founding members under the ESAs. We expect they will continue to be made by the founding members in accordance with the ESAs.
We expect to make approximately $15.0 million to $16.0 million of capital expenditures in fiscal 2017, primarily for upgrades to our DCS distribution and content management software and our other internal management systems, including our proposal, inventory and audience targeting and data management systems, reporting systems, network equipment related to currently contracted network affiliate theaters, server and storage upgrades and software licensing. We expect these upgrades and improvements to our management reporting systems, which are intended to provide additional advertising scheduling and placement flexibility for our clients, should enhance our operating efficiencies, including allowing us to better manage our advertising inventory, create more targeted buys and provide more robust campaign data for our advertising clients to help drive future growth. Our capital expenditures will increase as we add additional network affiliates to our network. We expect that additional expenditures, if any, would be funded in part by additional cash flows associated with those new network affiliates. The commitments associated with our operating lease requirements are included in “Contractual and Other Obligations” below.
Financings
As of December 29, 2016, NCM LLC’s senior secured credit facility consisted of a $175.0 million revolving credit facility and a $270.0 million term loan. On May 26, 2016, NCM LLC entered into an incremental amendment of its senior secured credit facility whereby the revolving credit facility was increased by $40.0 million to $175.0 million. On June 18, 2014, NCM LLC entered into an incremental amendment of its senior secured credit facility whereby the revolving credit facility was increased by $25.0 million to $135.0 million. In addition, on July 2, 2014, NCM LLC entered into an amendment of its senior secured credit facility whereby the maturity date was extended by two years to November 26, 2019, which corresponds to the maturity date of the $270 million term loans.
On August 19, 2016, NCM LLC completed a private placement of $250.0 million in aggregate principal amount of 5.750% Senior Unsecured Notes. On September 19, 2016, NCM LLC redeemed its $200.0 million 7.875% Senior Unsecured Notes at a redemption price of 103.938% of the principal amount plus accrued and unpaid interest. On April 27, 2012, NCM LLC completed a private placement of $400.0 million in aggregate principal amount of 6.00% Senior Secured Notes for which the registered exchange offering was completed on November 26, 2012. For further information, refer to Note 9 to the audited Consolidated Financial Statements located elsewhere in this document.
The senior secured credit facility contains a number of covenants and financial ratio requirements, with which NCM LLC was in compliance at December 29, 2016, including a consolidated net senior secured leverage ratio as of December 29, 2016 of 3.0 versus a covenant of 6.5 times for each quarterly period. NCM LLC is permitted to make quarterly dividend payments and other payments based on leverage ratios for NCM LLC and its subsidiary so long as no default or event of
45
default has occurred and continues to occur. The quarterly dividend payments and other distributions are made if the consolidated net senior secured leverage ratio is less than or equal to 6.5 times.
There are no borrower distribution restrictions as long as NCM LLC’s consolidated net senior secured leverage ratio is below 6.5 times and NCM LLC is in compliance with its debt covenants. If there are limitations on the restricted payments, NCM LLC may not declare or pay any dividends, make any payments on account of NCM LLC, set aside assets for the retirement or other acquisition of capital stock of the borrower or any subsidiary, or make any other distribution for obligations of NCM LLC. When these restrictions are effective, NCM LLC may still pay the services fee and reimbursable costs pursuant to terms of the management agreement. NCM LLC can also make payments pursuant to the tax receivable agreement in the amount, and at the time necessary to satisfy the contractual obligations with respect to the actual cash tax benefits payable to NCM LLC’s founding members.
Critical Accounting Policies
The significant accounting policies of the Company are described in Note 1 to the audited Consolidated Financial Statements included elsewhere in this document. Certain accounting policies involve significant judgments, assumptions and estimates by management that have a material impact on the carrying value of certain assets and liabilities, which management considers critical accounting policies. The judgments, assumptions and estimates used by management are based on historical experience, knowledge of the accounts and other factors, which are believed to be reasonable under the circumstances and are evaluated on an ongoing basis. Because of the nature of the judgments and assumptions made by management, actual results could differ from these judgments and estimates, which could have a material impact on the carrying values of assets and liabilities and the results of operations of the Company.
Allowance for Doubtful Accounts
Nature of Estimates Required. The allowance for doubtful accounts represents management’s estimate of probable credit losses inherent in its trade receivables, which represent a significant asset on the balance sheet. Estimating the amount of the allowance for doubtful accounts requires significant judgment and the use of estimates related to the amount and timing of estimated losses based on historical loss experience, consideration of current economic trends and conditions and debtor-specific factors, all of which may be susceptible to significant change. Account receivable balances are charged against the allowance, while recoveries of amounts previously charged are credited to the allowance. A provision for bad debt is charged to operations based on management’s periodic evaluation of the factors previously mentioned, as well as, other pertinent factors. To the extent actual outcomes differ from management estimates, additional provision for bad debt could be required that could adversely affect earnings or financial position in future periods.
Sensitivity Analysis. As of December 29, 2016, our allowance for doubtful accounts was $6.3 million, or 3.8% of the gross accounts receivable balance. A 10% difference in the allowance for doubtful accounts as of December 29, 2016 would have affected net income attributable to NCM, Inc. by approximately $0.2 million.
Share-Based Compensation
Nature of Estimates Required. NCM, Inc.’s 2016 Equity Incentive Plan and its 2007 Equity Incentive Plan, as amended (the “Equity Incentive Plans”) are treated as equity plans under the provisions of Accounting Standards Codification ASC 718 – Compensation – Stock Compensation, and the determination of fair value of options, restricted stock and restricted stock units for accounting purposes requires that management make estimates and judgments. When stock options were granted prior to 2013, we used the Black-Scholes option pricing model to estimate the fair value of stock option grants, which was affected by our stock price and a number of assumptions, including expected volatility, expected life, risk-free interest rate and expected dividends.
The fair value of restricted stock and restricted stock units is based on the closing market price of our common stock on the date of grant. Compensation expense equal to the fair value of each restricted stock award or restricted stock unit is recognized ratably over the requisite service period. Certain of the restricted stock awards include performance vesting conditions, which permit vesting to the extent that the Company achieves specified non-GAAP targets at the end of the measurement period. Compensation expense is based on management’s projections and the probability of achievement of those expectations, which requires considerable judgment. We record a cumulative adjustment to share-based compensation expense in periods that we change our estimate of the number of shares expected to vest. Additionally, we ultimately adjust the expense recognized to reflect the actual vested shares following the resolution of the performance conditions. Further, for both stock options and restricted stock we estimate a forfeiture rate to reflect the potential separation of employees.
Assumptions and Approach Used. In determining the value of stock options, we estimated an expected dividend yield based upon our expectation of the dividend that would be paid out on the underlying shares during the expected term of the
46
option. Expected volatility is based on our historical stock prices using a mathematical formula to measure the standard deviation of the change in the natural logarithm of our underlying stock price over a period of time commensurate with the expected term. The risk-free interest rate is derived from the zero coupon rate on U.S. Treasury instruments with a term commensurate with the award’s expected term.
For restricted stock with vesting contingent on the achievement of Company performance conditions, the amount of compensation expense is estimated based on the expected achievement of the performance condition. This requires us to make estimates of the likelihood of the achievement of Company performance conditions, which is highly judgmental. We base our judgments as to the expected achievement of Company performance conditions based on the financial projections of the Company that are used by management for business purposes, which represent our best estimate of expected Company performance. We evaluate the assumptions used to value stock-based awards on a quarterly basis. If factors change and we employ different assumptions, stock-based compensation expense may differ significantly from what we have recorded in the past. If there are any modifications or cancellations of stock-based awards, we may be required to accelerate, increase or decrease any remaining, unrecognized stock-based compensation expense. To the extent that we grant additional stock-based awards, compensation expense will increase in relation to the fair value of the additional grants. Compensation expense may be significantly impacted in the future to the extent our estimates differ from actual results. Further, we estimate a forfeiture rate of restricted stock based upon historical forfeitures. If future forfeitures differ significantly from our past experience our compensation expense may be significantly impacted.
Income Taxes
Nature of Estimates Required. We account for income taxes in accordance with ASC 740 – Income Taxes, which requires an asset and liability approach to financial accounting and reporting for income taxes. Accordingly, deferred tax assets and liabilities arise from the differences between the tax basis of an asset or liability and its reported amount in the audited Consolidated Financial Statements. Deferred tax amounts are determined using the tax rates expected to be in effect when the taxes will actually be paid or refunds received, as provided under currently enacted tax law. Valuation allowances are to be established when necessary to reduce deferred tax assets to the amount expected to be realized. We have incurred taxable losses in recent years due primarily to amortization of intangible assets recorded on our tax returns resulting from an election by NCM LLC made under Internal Revenue Code §754 of the Internal Revenue Code to step-up the Company’s outside basis in its share of NCM LLC’s inside basis of assets under IRC §743(b). We currently have no valuation allowance against certain of our deferred tax assets as we expect future taxable income (as amortization of these items will cease) and we expect to be able to utilize our net operating loss carryforwards prior to their expiration. Further, we have and continue to expect to generate pre-tax book income. In addition, due to the basis differences resulting from our IPO-related transactions (including the tax receivable agreement with the founding members) and subsequent adjustments pursuant to the common unit adjustment agreement, we are required to make cash payments under the tax receivable agreement to the founding members in amounts equal to 90% of our actual tax benefit realized from the tax amortization of the basis difference for certain deferred assets noted above. The requirements of the tax receivable agreement, as amended, are highly technical and complex and involve management’s judgment, including judgments to determine hypothetical tax outcomes exclusive of the IPO date transaction and agreements. If we were to fail to meet certain of the requirements of the tax receivable agreement, we could be subject to additional payments to taxing authorities or to the founding members. We recognize the tax benefit from an uncertain tax position only when it is more likely than not, based on the technical merits of the position, that the tax position will be sustained upon examination, including the resolution of any related appeals or litigation. The tax benefits recognized in the consolidated financial statements from such a position are measured as the largest benefit that has a greater than fifty percent likelihood of being realized upon ultimate resolution.
We have established a reserve for material, known tax exposures. As of December 29, 2016, the total amount of the tax reserve was $2.0 million, including accrued interest and penalties, net of related items. Our reserve reflects management’s judgment as to the resolution of the issues involved if subject to judicial review or other settlement. While we believe our reserve is adequate to cover reasonably expected tax risks, there can be no assurance that, in all instances, an issue raised by a tax authority will be resolved at a financial cost that does not exceed its related reserve. With respect to the reserve, our income tax expense would include (i) any changes in tax reserves arising from material changes during the period in the facts and circumstances (i.e., new information) surrounding a tax issue and (ii) any difference from our tax position as recorded in the financial statements and the final resolution of a tax issue during the period. Such resolution could materially increase or decrease income tax expense in the Consolidated Financial Statements in future periods and could impact operating cash flows. While we believe that our reserves are adequate to cover reasonably expected tax risks, in the event that the ultimate resolution of our uncertain tax positions differs from our estimates, we may be exposed to material increases in income tax expense, which could materially impact our financial condition, results of operations and cash flows. Refer to Note 6 to the audited Consolidated Financial Statements included elsewhere in this document.
47
Sensitivity Analysis. For fiscal 2016, our provision for income taxes was $9.2 million. Changes in management’s estimates and assumptions regarding the enacted tax rate applied to deferred tax assets and liabilities, the ability to realize the value of deferred tax assets, or the timing of the reversal of tax basis differences and judgments used to determine hypothetical tax outcomes exclusive of the IPO date transaction and agreements could impact the provision for income taxes and change the effective tax rate. A one percent change in the effective tax rate from 26.6% to 27.6% would have increased the current year income tax provision by approximately $0.3 million.
Recent Accounting Pronouncements
For a discussion of the recent accounting pronouncements relevant to our business operations, refer to the information provided under Note 1 to the audited Consolidated Financial Statements included elsewhere in this document.
Related-Party Transactions
For a discussion of the related-party transactions, refer to the information provided under Note 8 to the audited Consolidated Financial Statements included elsewhere in this document.
Off-Balance Sheet Arrangements
Our operating lease obligations, which primarily include office leases, are not reflected on our balance sheet. Refer to “—Contractual and Other Obligations” for further detail. We do not believe these arrangements are material to our current or future financial condition, results of operations, liquidity, capital resources or capital expenditures.
Contractual and Other Obligations
Our contractual obligations as of December 29, 2016 were as follows:
|
|
|
Payments Due by Period (in millions) |
|
|||||||||||||||||
|
|
|
Within 1 fiscal year |
|
|
1-3 fiscal years |
|
|
3-5 fiscal years |
|
|
Thereafter |
|
|
Total |
|
|||||
|
Borrowings (1) |
|
$ |
— |
|
|
$ |
285.0 |
|
|
$ |
— |
|
|
$ |
650.0 |
|
|
$ |
935.0 |
|
|
Cash interest on borrowings (2) |
|
|
50.0 |
|
|
|
103.2 |
|
|
|
78.3 |
|
|
|
76.1 |
|
|
|
307.6 |
|
|
Office leases |
|
|
3.2 |
|
|
|
6.4 |
|
|
|
5.2 |
|
|
|
15.5 |
|
|
|
30.3 |
|
|
Network affiliate agreements (3) |
|
|
11.5 |
|
|
|
15.4 |
|
|
|
10.6 |
|
|
|
2.4 |
|
|
|
39.9 |
|
|
Payable to founding members under tax receivable agreement (4) |
|
|
18.4 |
|
|
|
40.0 |
|
|
|
41.6 |
|
|
|
61.9 |
|
|
|
161.9 |
|
|
Interest on payable to founding members under tax receivable agreement (5) |
|
|
13.9 |
|
|
|
28.2 |
|
|
|
28.4 |
|
|
|
40.3 |
|
|
|
110.8 |
|
|
Total contractual cash obligations |
|
$ |
97.0 |
|
|
$ |
478.2 |
|
|
$ |
164.1 |
|
|
$ |
846.2 |
|
|
$ |
1,585.5 |
|
|
(1) |
We have a $175.0 million variable rate revolving credit facility of which $160.0 million was outstanding as of December 29, 2016. Debt service requirements under this agreement depend on the amounts borrowed and the level of the base interest rate, in addition to a commitment fee on the unused portion of the revolving credit facility. Refer to further discussion of the secured credit facility under “—Financial Condition and Liquidity-Financings” above. |
|
(2) |
The amounts of future cash interest payments in the table above are based on the amount outstanding on the Senior Secured Notes, Senior Unsecured Notes, term loans and revolving credit facility, as well as, estimated rates of interest over the term of the variable rate revolving credit facility and term loan. The Senior Secured Notes due in 2022 are at a fixed rate of 6.00%. The Senior Unsecured Notes due in 2026 are at a fixed rate of 5.750%. In addition, we have variable rate term loans and a revolving credit facility. Debt service requirements under this agreement depend on the amounts borrowed and the level of the base interest rate, in addition to a commitment fee on the unused portion of the revolving credit facility. Refer to further discussion of the secured credit facility under “—Financial Condition and Liquidity-Financings” above. |
|
(3) |
The value in this table represents the maximum potential payout under the revenue guarantees made by NCM LLC to its network affiliates. During 2016, NCM LLC paid $0.1 million under these agreements and no liabilities were recorded as of December 29, 2016 for these obligations. For additional details refer to the information provided under Note 12 to the audited Consolidated Financial Statements included elsewhere in this document. |
48
|
such, will vary based on our operating results. The value in the table represents the estimated amounts payable under the tax receivable agreement as of December 29, 2016. |
|
(5) |
The tax receivable agreement described in footnote 4 above was discounted and recorded at present value. The value in the table represents the estimated accretion of interest that would be due on the discounted payable as of December 29, 2016. |
The ESAs require payments based on a combination of founding member attendance, the number of digital screens of each founding member and the number of higher quality digital cinema systems of each NCM LLC founding member. The amount relating to the attendance factor will vary from quarter to quarter and year to year as theater attendance varies, while the amount relating to the digital screens and digital cinema systems will also vary quarter to quarter and year to year as screens are converted to digital screens, other screens are added or removed through acquisition, divestiture or closure activities of the founding members and founding members convert to the higher quality digital cinema systems. The payments made to the founding members also will vary due to the escalation of the rates paid for each factor pursuant to the amended and restated ESAs. The rate per attendee increases 8% every five years, with the next such increase taking effect for fiscal year 2017, while the rate per digital screen and digital cinema system screen increase 5% annually. The table above does not include amounts payable under the ESAs as they are based on variable factors, which are not capable of precise estimation.
Seasonality
Our revenue and operating results are seasonal in nature, coinciding with the timing of marketing expenditures by our advertising clients and to a lesser extent the attendance patterns within the film exhibition industry. Both advertising expenditures and theater attendance tend to be higher during the second, third, and fourth fiscal quarters. Advertising revenue is primarily correlated with new product releases, advertising client marketing priorities and economic cycles and to a lesser extent theater attendance levels. The actual quarterly results for each quarter could differ materially depending on these factors or other risks and uncertainties. Based on our historical experience, our first quarter typically has less revenue than the other quarters of a given year due primarily to lower advertising client demand and lower theater industry attendance levels. Accordingly, there can be no assurances that seasonal variations will not materially affect our results of operations in the future.
The following table reflects the quarterly percentage of total revenue for the fiscal years ended 2014, 2015 and 2016:
|
|
|
First |
|
|
Second |
|
|
Third |
|
|
Fourth |
|
||||
|
|
|
Quarter |
|
|
Quarter |
|
|
Quarter |
|
|
Quarter |
|
||||
|
FY 2014 |
|
|
17.8 |
% |
|
|
25.4 |
% |
|
|
25.6 |
% |
|
|
31.2 |
% |
|
FY 2015 |
|
|
17.2 |
% |
|
|
27.2 |
% |
|
|
25.0 |
% |
|
|
30.6 |
% |
|
FY 2016 |
|
|
17.0 |
% |
|
|
25.8 |
% |
|
|
25.4 |
% |
|
|
31.8 |
% |
The primary market risk to which we are exposed is interest rate risk. The Notes due 2026 and the Notes due 2022 bear interest at fixed rates, and therefore are not subject to market risk. As of December 29, 2016, the interest rate risk that we are exposed to is related to our $175.0 million revolving credit facility and our $270.0 million term loan. A 100 basis point fluctuation in market interest rates underlying our term loan and revolving credit facility would have the effect of increasing or decreasing our cash interest expense by approximately $2.9 million for an annual period on the $15.0 million and $270.0 million outstanding as of December 29, 2016 on our revolving credit facility and term loan, respectively.
Refer to Index to Financial Statements and Supplemental Information on page F-1.
Not applicable.
Effectiveness of Disclosure Controls and Procedures. We maintain disclosure controls and procedures that are designed to ensure that information required to be disclosed by us in the reports that we file or submit to the SEC under the Exchange Act, as amended, is recorded, processed, summarized and reported within the time periods specified by the
49
Commission’s rules and forms, and that information is accumulated and communicated to our management, including the Chief Executive Officer (principal executive officer) and Chief Financial Officer (principal financial officer) as appropriate to allow timely decisions regarding required disclosure. As of December 29, 2016, our management evaluated, with the participation of the Chief Executive Officer and Chief Financial Officer, the effectiveness of the Company’s disclosure controls and procedures pursuant to Rules 13a-15(e) and 15d-15(e) of the Exchange Act. Based on that evaluation, the Company’s management concluded that the Company’s disclosure controls and procedures as of December 29, 2016 were effective.
Management’s Annual Report on Internal Control over Financial Reporting. Management is responsible for establishing and maintaining, and has established and maintains, adequate internal control over financial reporting, as such term is defined in Exchange Act Rules 13a-15(f) and 15d-15(f). As of December 29, 2016, our management evaluated, with the participation of the Chief Executive Officer (principal executive officer) and Chief Financial Officer (principal financial officer), the effectiveness of the Company’s internal control over financial reporting based on the framework in Internal Control— Integrated Framework (2013) issued by the Committee of Sponsoring Organizations of the Treadway Commission. Based on that evaluation, the Company’s management concluded that the Company’s internal control over financial reporting as of December 29, 2016 was effective.
Because of its inherent limitations, internal control over financial reporting may not prevent or detect misstatements. Projections of any evaluation of effectiveness to future periods are subject to the risk that controls may become inadequate because of changes in conditions, or that the degree of compliance with the policies or procedures may deteriorate.
The effectiveness of our internal control over financial reporting as of December 29, 2016 has been attested by the Company’s registered independent public accounting firm, Deloitte & Touche LLP, as stated in its report, which appears herein.
Changes in Internal Control over Financial Reporting.
There were no changes in the Company’s internal controls over financial reporting that occurred during the quarter ended December 29, 2016, that have materially affected, or are reasonably likely to materially affect, the Company’s internal controls over financial reporting.
50
REPORT OF INDEPENDENT REGISTERED PUBLIC ACCOUNTING FIRM
To the Board of Directors and Stockholders of
National CineMedia, Inc.
Centennial, Colorado
We have audited the internal control over financial reporting of National CineMedia, Inc. and subsidiary (the "Company") as of December 29, 2016, based on criteria established in Internal Control — Integrated Framework (2013) issued by the Committee of Sponsoring Organizations of the Treadway Commission. The Company's management is responsible for maintaining effective internal control over financial reporting and for its assessment of the effectiveness of internal control over financial reporting, included in the accompanying Management’s Annual Report on Internal Control over Financial Reporting. Our responsibility is to express an opinion on the Company's internal control over financial reporting based on our audit.
We conducted our audit in accordance with the standards of the Public Company Accounting Oversight Board (United States). Those standards require that we plan and perform the audit to obtain reasonable assurance about whether effective internal control over financial reporting was maintained in all material respects. Our audit included obtaining an understanding of internal control over financial reporting, assessing the risk that a material weakness exists, testing and evaluating the design and operating effectiveness of internal control based on the assessed risk, and performing such other procedures as we considered necessary in the circumstances. We believe that our audit provides a reasonable basis for our opinion.
A company's internal control over financial reporting is a process designed by, or under the supervision of, the company's principal executive and principal financial officers, or persons performing similar functions, and effected by the company's board of directors, management, and other personnel to provide reasonable assurance regarding the reliability of financial reporting and the preparation of financial statements for external purposes in accordance with generally accepted accounting principles. A company's internal control over financial reporting includes those policies and procedures that (1) pertain to the maintenance of records that, in reasonable detail, accurately and fairly reflect the transactions and dispositions of the assets of the company; (2) provide reasonable assurance that transactions are recorded as necessary to permit preparation of financial statements in accordance with generally accepted accounting principles, and that receipts and expenditures of the company are being made only in accordance with authorizations of management and directors of the company; and (3) provide reasonable assurance regarding prevention or timely detection of unauthorized acquisition, use, or disposition of the company's assets that could have a material effect on the financial statements.
Because of the inherent limitations of internal control over financial reporting, including the possibility of collusion or improper management override of controls, material misstatements due to error or fraud may not be prevented or detected on a timely basis. Also, projections of any evaluation of the effectiveness of the internal control over financial reporting to future periods are subject to the risk that the controls may become inadequate because of changes in conditions, or that the degree of compliance with the policies or procedures may deteriorate.
In our opinion, the Company maintained, in all material respects, effective internal control over financial reporting as of December 29, 2016, based on the criteria established in Internal Control — Integrated Framework (2013) issued by the Committee of Sponsoring Organizations of the Treadway Commission.
We have also audited, in accordance with the standards of the Public Company Accounting Oversight Board (United States), the consolidated financial statements as of and for the year ended December 29, 2016 of the Company and our report dated February 23, 2017 expressed an unqualified opinion on those financial statements.
/s/ Deloitte & Touche LLP
Denver, Colorado
February 23, 2017
51
None.
The information required by this item with respect to our directors is incorporated herein by reference from the Proxy Statement under the heading “Proposal 1- Election of Directors.”
The information required by this item regarding our executive officers is set forth in Part I of this Annual Report on Form 10-K under the heading “Executive Officers of the Registrant and is incorporated herein by this reference.”
Information regarding compliance with Section 16(a) of the Exchange Act by our directors and executive officers and holders of ten percent of a registered class of our equity securities is incorporated in this item by reference from the Proxy Statement under the heading “Section 16(a) Beneficial Ownership Reporting Compliance.”
Our Board adopted a Code of Business Conduct and Ethics that applies to all of our employees, including our Board of Directors, Chief Executive Officer and principal financial officer. The Code of Business Conduct and Ethics sets forth the Company’s conflict of interest policy, records retention policy, insider trading policy and policies for protection of the Company’s property, business opportunities and proprietary information. Our Code of Business Conduct and Ethics is available free of charge on our website at ncm.com under the tab “Investor Relations– Corporate Governance.” We intend to post on our website any amendments to, or waivers from our Code of Business Conduct and Ethics applicable to senior financial executives.
The information required by this item regarding compensation of executive officers and directors is incorporated herein by reference from the Proxy Statement under the headings “Compensation of Executive Officers,” “Compensation Committee Report” and “Compensation Committee Interlocks and Insider Participation”.
|
Item 12. |
Security Ownership of Certain Beneficial Owners and Management and Related Stockholder Matters |
For information with respect to the security ownership of directors, executive officers and holders of more than 5% of a class of our voting securities, refer to the Proxy Statement under the heading “Beneficial Ownership,” which information is incorporated herein by reference.
For Equity Incentive Plan information, refer to the Proxy Statement under the heading “Equity Compensation Plan”, which information is incorporated herein by reference.
For information with respect to certain relationships and related transactions, refer to the Proxy Statement under the heading “Certain Relationships and Related Party Transactions,” which information is incorporated herein by reference.
For information with respect to director independence, refer to the Proxy Statement under the heading “Proposal 1- Election of Directors,” which information is incorporated herein by reference.
The information required by this item with respect to principal accounting fees and services is incorporated herein by reference from the Proxy Statement under the heading “Fees Paid to Independent Auditors.”
52
(a) (1) and (a) (2) Financial statements and financial statement schedules
Refer to Index to Financial Statements on page F-1.
(b) Exhibits
Refer to Exhibit Index, beginning on page 56.
(c) Financial Statement Schedules
Financial Statement Schedules not included herein have been omitted because they are either not required, not applicable, or the information is otherwise included herein.
53
Pursuant to the requirements of Section 13 or 15(d) of the Securities Exchange Act of 1934, the registrant has duly caused this report to be signed on its behalf by the undersigned, thereunto duly authorized.
|
|
|
|
|
NATIONAL CINEMEDIA, INC. |
|
|
|
|
|
(Registrant) |
|
|
|
|
|
|
|
Dated: |
February 24, 2017 |
|
|
/s/ Andrew J. England |
|
|
|
|
|
Andrew J. England |
|
|
|
|
|
Chief Executive Officer and Director |
|
|
|
|
|
(Principal Executive Officer) |
|
|
|
|
|
|
|
Dated: |
February 24, 2017 |
|
|
/s/ Katherine L. Scherping |
|
|
|
|
|
Katherine L. Scherping |
|
|
|
|
|
Chief Financial Officer |
|
|
|
|
|
(Principal Financial and Accounting Officer) |
|
|
|
|
|
|
|
|
|
|
|
|
|
|
|
|
|
|
|
|
|
|
|
|
54
Pursuant to the requirements of the Securities Exchange Act of 1934, this report has been signed below by the following persons on behalf of the registrant and in the capacities and on the dates indicated.
|
Signature |
|
Title |
|
Date |
|
|
|
|
|
|
|
/s/ Andrew J. England |
|
Chief Executive Officer and Director |
|
February 24, 2017 |
|
Andrew J. England |
|
(Principal Executive Officer) |
|
|
|
|
|
|
|
|
|
/s/ Katherine L. Scherping |
|
Chief Financial Officer |
|
February 24, 2017 |
|
Katherine L. Scherping |
|
(Principal Financial and Accounting Officer) |
|
|
|
|
|
|
|
|
|
/s/ Scott N. Schneider |
|
Non-Employee Executive Chairman |
|
February 24, 2017 |
|
Scott N. Schneider |
|
|
||
|
|
|
|
|
|
|
/s/ Peter B. Brandow |
|
Director |
|
February 24, 2017 |
|
Peter B. Brandow |
|
|
||
|
|
|
|
|
|
|
/s/ Lawrence A. Goodman |
|
Director |
|
February 24, 2017 |
|
Lawrence A. Goodman |
|
|
||
|
|
|
|
|
|
|
/s/ David R. Haas |
|
Director |
|
February 24, 2017 |
|
David R. Haas |
|
|
||
|
|
|
|
|
|
|
/s/ Stephen L. Lanning |
|
Director |
|
February 24, 2017 |
|
Stephen L. Lanning |
|
|
||
|
|
|
|
|
|
|
/s/ Thomas F. Lesinski |
|
Director |
|
February 24, 2017 |
|
Thomas F. Lesinski |
|
|
||
|
|
|
|
|
|
|
/s/ Paula Williams Madison |
|
Director |
|
February 24, 2017 |
|
Paula Williams Madison |
|
|
||
|
|
|
|
|
|
|
/s/ Lee Roy Mitchell |
|
Director |
|
February 24, 2017 |
|
Lee Roy Mitchell |
|
|
||
|
|
|
|
|
|
55
|
|
|
|
Incorporation by Reference |
||||||
|
Exhibit |
Ref. |
Description |
Form |
SEC File No. |
Exhibit |
Filing Date |
|||
|
|
|
|
|
|
|
|
|||
|
3.1 |
|
Amended and Restated Certificate of Incorporation. |
10-Q |
001-33296 |
3.1 |
5/6/2011 |
|||
|
|
|
|
|
|
|
|
|||
|
3.2 |
|
Amended and Restated Bylaws. |
S-8 |
001-33296 |
4.2 |
2/13/2007 |
|||
|
|
|
|
|
|
|
|
|||
|
4.1 |
|
Indenture, dated as of July 5, 2011, by and between National CineMedia, LLC and Wells Fargo Bank, National Association, as trustee. |
8-K |
001-33296 |
4.1 |
7/7/2011 |
|||
|
|
|
|
|
|
|
|
|||
|
4.2 |
|
Form of 7.875% Senior Notes due 2021 (included in Exhibit 4.1). |
8-K |
001-33296 |
4.2 |
7/7/2011 |
|||
|
|
|
|
|
|
|
|
|||
|
4.3 |
|
Registration Rights Agreement, dated as of July 5, 2011, by and between National CineMedia, LLC and J.P. Morgan Securities LLC, as a representative of the Initial Purchasers named therein. |
8-K |
001-33296 |
4.3 |
7/7/2011 |
|||
|
|
|
|
|
|
|
|
|||
|
4.4 |
|
Indenture, dated as of April 27, 2012, by and between National CineMedia, LLC and Wells Fargo Bank, National Association, as trustee. |
8-K |
001-33296 |
4.1 |
4/30/2012 |
|||
|
|
|
|
|
|
|
|
|||
|
4.5 |
|
Form of 6.000% Senior Secured Notes due 2022 (included in Exhibit 4.4). |
8-K |
001-33296 |
4.2 |
4/30/2012 |
|||
|
|
|
|
|
|
|
|
|||
|
4.6 |
|
Registration Rights Agreement, dated as of April 27, 2012, by and between National CineMedia, LLC and Barclays Capital Inc., as representative of the Initial Purchasers named therein. |
8-K |
001-33296 |
4.3 |
4/30/2012 |
|||
|
|
|
|
|
|
|
|
|||
|
4.7 |
|
Indenture, dated as of August 19, 2016, by and between National CineMedia, LLC and Wells Fargo Bank, National Association, as trustee. |
8-K |
001-33296 |
4.1 |
8/19/2016 |
|||
|
|
|
|
|
|
|
|
|||
|
4.8 |
|
Form of 5.750% Senior Secured Notes due 2026 (included in Exhibit 4.1). |
8-K |
001-33296 |
4.2 |
8/19/2016 |
|||
|
|
|
|
|
|
|
|
|||
|
4.9 |
|
Registration Rights Agreement, dated as of August 19, 2016, by and between National CineMedia, LLC and J.P. Morgan Securities LLC, as representative of the Initial Purchasers named therein. |
8-K |
001-33296 |
4.3 |
8/19/2016 |
|||
|
|
|
|
|
|
|
|
|||
|
10.1 |
|
National CineMedia, LLC Third Amended and Restated Limited Liability Company Operating Agreement dated as of February 13, 2007, by and among American Multi-Cinema, Inc., Cinemark Media, Inc., Regal CineMedia Holdings, LLC and National CineMedia, Inc. |
8-K |
001-33296 |
10.1 |
2/16/2007 |
|||
|
|
|
|
|
|
|
|
|||
|
10.1.1 |
|
First Amendment to Third Amended and Restated Limited Liability Company Operating Agreement of National CineMedia, LLC dated as of March 16, 2009, by and among American Multi-Cinema, Inc., Cinemark Media, Inc., Regal CineMedia Holdings, LLC and National CineMedia, Inc. |
10-Q |
001-33296 |
10.1.1 |
8/7/2009 |
|||
|
|
|
|
|
|
|
|
|||
56
|
|
|
|
Incorporation by Reference |
||||||
|
Exhibit |
Ref. |
Description |
Form |
SEC File No. |
Exhibit |
Filing Date |
|||
|
|
Second Amendment to Third Amended and Restated Limited Liability Company Operating Agreement of National CineMedia, LLC dated as of August 6, 2010, by and among American Multi-Cinema, Inc., Cinemark Media, Inc., Regal CineMedia Holdings, LLC and National CineMedia, Inc. |
8-K |
001-33296 |
10.2 |
8/10/2010 |
||||
|
|
|
|
|
|
|
|
|||
|
10.1.3 |
|
Third Amendment to the Third Amended and Restated Limited Liability Company Operating Agreement of National CineMedia, LLC dated September 3, 2013, by and among American Multi-Cinema, Inc., AMC ShowPlace Theatres, Inc., Cinemark Media, Inc., Regal CineMedia Holdings, LLC, Regal Cinemas, Inc. and National CineMedia, Inc. |
8-K |
001-33296 |
10.1.3 |
9/9/2013 |
|||
|
|
|
|
|
|
|
|
|||
|
10.2 |
|
Amended and Restated Exhibitor Services Agreement dated as of December 26, 2013, by and between National CineMedia, LLC and American Multi-Cinema, Inc. (Portions omitted pursuant to request for confidential treatment and filed separately with the Commission.) |
10-K |
001-33296 |
10.2.4 |
2/21/2014 |
|||
|
|
|
|
|
|
|
|
|||
|
10.3 |
|
Amended and Restated Exhibitor Services Agreement dated as of December 26, 2013, by and between National CineMedia, LLC and Cinemark USA, Inc. (Portions omitted pursuant to request for confidential treatment and filed separately with the Commission.) |
10-K |
001-33296 |
10.3.4 |
2/21/2014 |
|||
|
|
|
|
|
|
|
|
|||
|
10.4 |
|
Amended and Restated Exhibitor Services Agreement dated as of December 26, 2013, by and between National CineMedia, LLC and Regal Cinemas, Inc. (Portions omitted pursuant to request for confidential treatment and filed separately with the Commission.) |
10-K |
001-33296 |
10.4.4 |
2/21/2014 |
|||
|
|
|
|
|
|
|
|
|||
|
10.5 |
|
Common Unit Adjustment Agreement dated as of February 13, 2007, by and among National CineMedia, Inc., National CineMedia, LLC, Regal CineMedia Holdings, LLC, American Multi-Cinema, Inc., Cinemark Media, Inc., Regal Cinemas, Inc. and Cinemark USA, Inc. (Confidential treatment granted as to certain portions, which portions were omitted and filed separately with the Commission.) |
8-K |
001-33296 |
10.6 |
2/16/2007 |
|||
|
|
|
|
|
|
|
|
|||
|
10.6 |
|
Tax Receivable Agreement dated as of February 13, 2007, by and among National CineMedia, Inc., National CineMedia, LLC, Regal CineMedia Holdings, LLC, Cinemark Media, Inc., Regal Cinemas, Inc., American Multi-Cinema, Inc. and Cinemark USA, Inc. |
8-K |
001-33296 |
10.7 |
2/16/2007 |
|||
|
|
|
|
|
|
|
|
|||
|
10.6.1 |
|
Second Amendment to Tax Receivable Agreement effective as of April 29, 2008, by and by and among NCM, Inc. and National CineMedia, LLC and the Founding Members and the ESA Parties, amending the Tax Receivable Agreement dated as of February 13, 2007 and as first amended by the First Amendment to the Tax Receivable Agreement effective as of August 7, 2007. |
8-K |
001-33296 |
10.1 |
5/5/2008 |
|||
|
|
|
|
|
|
|
|
|||
57
|
|
|
|
Incorporation by Reference |
||||||
|
Exhibit |
Ref. |
Description |
Form |
SEC File No. |
Exhibit |
Filing Date |
|||
|
|
First Amended and Restated Loews Screen Integration Agreement by and between National CineMedia, LLC and American Multi-Cinema, Inc. (Confidential treatment granted as to certain portions, which portions were omitted and filed separately with the Commission.) |
8-K |
001-33296 |
10.8 |
2/16/2007 |
||||
|
|
|
|
|
|
|
|
|||
|
10.8 |
|
Second Amended and Restated Software License Agreement dated as of February 13, 2007, by and among American Multi-Cinema, Inc., Regal CineMedia Corporation, Cinemark USA, Inc., Digital Cinema Implementation Partners, LLC and National CineMedia, LLC. |
8-K |
001-33296 |
10.9 |
2/16/2007 |
|||
|
|
|
|
|
|
|
|
|||
|
10.9 |
|
Director Designation Agreement dated as of February 13, 2007, by and among National CineMedia, Inc., American Multi-Cinema, Inc., Cinemark Media, Inc. and Regal CineMedia Holdings, LLC. |
8-K |
001-33296 |
10.10 |
2/16/2007 |
|||
|
|
|
|
|
|
|
|
|||
|
10.10 |
|
Registration Rights Agreement dated as of February 13, 2007, by and among National CineMedia, Inc., American Multi-Cinema, Inc., Regal CineMedia Holdings, LLC and Cinemark Media, Inc. |
8-K |
001-33296 |
10.11 |
2/16/2007 |
|||
|
|
|
|
|
|
|
|
|||
|
10.11 |
|
Management Services Agreement dated as of February 13, 2007, by and among National CineMedia, Inc. and National CineMedia, LLC. |
8-K |
001-33296 |
10.12 |
2/16/2007 |
|||
|
|
|
|
|
|
|
|
|||
|
10.12 |
|
Amended and Restated Credit Agreement among National CineMedia, LLC and Barclays Bank PLC, as Lead Arranger dated as of November 26, 2012. |
8-K |
001-33296 |
10.1 |
11/28/2012 |
|||
|
|
|
|
|
|
|
|
|||
|
10.12.1 |
|
Amendment No. 4 to the Credit Agreement dated as of February 13, 2007, as amended, restated, modified or otherwise supplemented, among National CineMedia LLC and Barclays Bank PLC, as administrative agent dated as of November 26, 2012. |
8-K |
001-33296 |
10.2 |
11/28/2012 |
|||
|
|
|
|
|
|
|
|
|||
|
10.12.2 |
|
Amendment No. 5 to the Credit Agreement dated as of February 13, 2007, as amended, restated, modified or otherwise supplemented, among National CineMedia LLC, certain lenders party thereto and Barclays Bank PLC, as administrative agent dated as of May 2, 2013. |
8-K |
001-33296 |
10.1 |
5/7/2013 |
|||
|
|
|
|
|
|
|
|
|||
|
10.12.3 |
|
Amendment No. 6 to the Credit Agreement dated as of February 13, 2007, as amended, restated, modified or otherwise supplemented, among National CineMedia LLC, certain lenders party thereto and Barclays Bank PLC, as administrative agent dated as of July 2, 2014. |
8-K |
001-33296 |
10.1 |
7/3/2014 |
|||
|
|
|
|
|
|
|
|
|||
|
10.13 |
|
Employment Agreement dated as of February 13, 2007, by and among National CineMedia, Inc., National CineMedia, LLC and Kurt C. Hall. + |
8-K |
001-33296 |
10.14 |
2/16/2007 |
|||
|
|
|
|
|
|
|
|
|||
|
10.13.1 |
|
First Amendment to Employment Agreement effective as of January 1, 2009, by and among National CineMedia, Inc., National CineMedia, LLC and Kurt C. Hall. + |
10-K |
001-33296 |
10.14.1 |
3/6/2009 |
|||
|
|
|
|
|
|
|
|
|||
58
|
|
|
|
Incorporation by Reference |
||||||
|
Exhibit |
Ref. |
Description |
Form |
SEC File No. |
Exhibit |
Filing Date |
|||
|
|
Separation Agreement dated as of October 18, 2015, by and between National CineMedia, Inc. and Kurt C. Hall. + |
8-K |
001-33296 |
10.1 |
10/21/2015 |
||||
|
|
|
|
|
|
|
|
|||
|
10.13.3 |
|
Consulting Agreement dated as of October 18, 2015, by and between National CineMedia, Inc. and Kurt C. Hall. + |
8-K |
001-33296 |
10.2 |
10/21/2015 |
|||
|
|
|
|
|
|
|
|
|||
|
10.14 |
|
Employment Agreement dated as of December 31, 2015, by and between National CineMedia, Inc. and Andrew J. England. + |
8-K |
001-33296 |
10.1 |
1/5/2016 |
|||
|
|
|
|
|
|
|
|
|||
|
10.15 |
|
Employment Agreement dated as of May 8, 2015, by and among National CineMedia, Inc., National CineMedia LLC and Clifford E. Marks. + |
10-Q |
001-33296 |
10.1 |
5/12/2015 |
|||
|
|
|
|
|
|
|
|
|||
|
10.16 |
|
Employment Agreement dated as of February 13, 2007, by and among National CineMedia, Inc., National CineMedia, LLC and Ralph E. Hardy. + |
8-K |
001-33296 |
10.18 |
2/16/2007 |
|||
|
|
|
|
|
|
|
|
|||
|
10.16.1 |
|
First Amendment to Employment Agreement effective as of January 1, 2009, by and among National CineMedia, Inc., National CineMedia, LLC and Ralph E. Hardy. + |
10-K |
001-33296 |
10.18.1 |
3/6/2009 |
|||
|
|
|
|
|
|
|
|
|||
|
10.17 |
|
Employment Agreement dated as of January 15, 2014, by and among National CineMedia, Inc., National CineMedia, LLC and Alfonso P. Rosabal, Jr. + |
8-K |
001-33296 |
10.1 |
1/22/2014 |
|||
|
|
|
|
|
|
|
|
|||
|
10.18 |
|
Retention Bonus Agreement dated January 29, 2016, between the Company and David J. Oddo. |
8-K |
001-33296 |
10.1 |
7/19/2016 |
|||
|
|
|
|
|
|
|
|
|||
|
10.19 |
|
Employment Agreement dated August 11, 2016, between the Company and Katherine L. Scherping. |
8-K |
001-33296 |
10.1 |
8/11/2016 |
|||
|
|
|
|
|
|
|
|
|||
|
10.20 |
|
Director Service Agreement dated January 22, 2016, among National CineMedia, Inc., National CineMedia, LLC and Scott Schneider. + |
8-K |
001-33296 |
10.1 |
1/26/2016 |
|||
|
|
|
|
|
|
|
|
|||
|
10.21 |
|
National CineMedia, Inc. 2007 Equity Incentive Plan. + |
8-K |
001-33296 |
10.2 |
5/2/2013 |
|||
|
|
|
|
|
|
|
|
|||
|
10.22 |
|
National CineMedia, Inc. 2016 Equity Incentive Plan. + |
S-8 |
001-33296 |
4.1 |
4/29/2016 |
|||
|
|
|
|
|
|
|
|
|||
|
10.23 |
|
Form of Option Substitution Award. + |
S-8 |
001-33296 |
4.4 |
2/13/2007 |
|||
|
|
|
|
|
|
|
|
|||
|
10.24 |
|
Form of Restricted Stock Substitution Award. + |
S-8 |
001-33296 |
4.5 |
2/13/2007 |
|||
|
|
|
|
|
|
|
|
|||
|
10.25 |
|
Form of Stock Option Agreement. + |
S-8 |
001-33296 |
4.6 |
2/13/2007 |
|||
|
|
|
|
|
|
|
|
|||
|
10.25.1 |
|
Form of 2009 Stock Option Agreement. + |
10-K |
001-33296 |
10.22.1 |
3/6/2009 |
|||
|
|
|
|
|
|
|
|
|||
|
10.25.2 |
|
Form of 2010 Stock Option Agreement. + |
10-K |
001-33296 |
10.22.2 |
3/9/2010 |
|||
|
|
|
|
|
|
|
|
|||
|
10.25.3 |
|
Form of 2011 Stock Option Agreement. + |
10-K |
001-33296 |
10.22.3 |
2/25/2011 |
|||
|
|
|
|
|
|
|
|
|||
|
10.25.4 |
|
Form of 2012 Stock Option Agreement. + |
10-K |
001-33296 |
10.22.4 |
2/24/2012 |
|||
|
|
|
|
|
|
|
|
|||
|
10.26 |
|
Form Restricted Stock Agreement. + |
S-8 |
001-33296 |
4.7 |
2/13/2007 |
|||
|
|
|
|
|
|
|
|
|||
|
10.26.1 |
|
Form of 2014 Restricted Stock Agreement (Time Based). + |
10-Q |
001-33296 |
10.1 |
5/6/2014 |
|||
|
|
|
|
|
|
|
|
|||
|
10.26.2 |
|
Form of 2014 Restricted Stock Agreement (Performance Based). + |
10-Q |
001-33296 |
10.2 |
5/6/2014 |
|||
|
|
|
|
|
|
|
|
|||
59
|
|
|
|
Incorporation by Reference |
||||||
|
Exhibit |
Ref. |
Description |
Form |
SEC File No. |
Exhibit |
Filing Date |
|||
|
|
Form of 2015 Restricted Stock Agreement (Time Based). + |
10-K |
001-33296 |
10.23.7 |
2/27/2015 |
||||
|
|
|
|
|
|
|
|
|||
|
10.26.4 |
|
Form of 2015 Restricted Stock Agreement (Performance Based). + |
10-K |
001-33296 |
10.23.8 |
2/27/2015 |
|||
|
|
|
|
|
|
|
|
|||
|
10.26.5 |
|
Form of 2016 Restricted Stock Agreement (Time Based). + |
10-K |
001-33296 |
10.23.7 |
2/26/2016 |
|||
|
|
|
|
|
|
|
|
|||
|
10.26.6 |
|
Form of 2016 Restricted Stock Agreement (Performance Based). + |
10-K |
001-33296 |
10.23.8 |
2/26/2016 |
|||
|
|
|
|
|
|
|
|
|||
|
10.26.7 |
|
Form of 2016 Restricted Stock Agreement under the National CineMedia, Inc. 2016 Equity Incentive Plan (Time Based). |
S-8 |
001-33296 |
4.2 |
4/29/2016 |
|||
|
|
|
|
|
|
|
|
|||
|
10.26.8 |
|
Form of 2016 Restricted Stock Agreement under the National CineMedia, Inc. 2016 Equity Incentive Plan (Performance Based). |
S-8 |
001-33296 |
4.3 |
4/29/2016 |
|||
|
|
|
|
|
|
|
|
|||
|
10.26.9 |
* |
Form of 2017 Restricted Stock Agreement (Time Based). + |
|
|
|
|
|||
|
|
|
|
|
|
|
|
|||
|
10.26.10 |
* |
Form of 2017 Restricted Stock Agreement (Performance Based). + |
|
|
|
|
|||
|
|
|
|
|
|
|
|
|||
|
10.27 |
|
Form of Restricted Stock Unit Agreement. + |
10-K |
001-33296 |
10.34 |
3/6/2009 |
|||
|
|
|
|
|
|
|
|
|||
|
10.27.1 |
|
Form of Restricted Stock Unit Agreement under the National CineMedia, Inc. 2016 Equity Plan. |
S-8 |
001-33296 |
4.4 |
4/29/2016 |
|||
|
|
|
|
|
|
|
|
|||
|
10.27.2 |
* |
Form of Restricted Stock Unit Agreement under the National CineMedia, Inc. 2016 Equity Plan, amended. |
|
|
|
|
|||
|
|
|
|
|
|
|
|
|||
|
10.28 |
|
National CineMedia, Inc. Executive Performance Bonus Plan. + |
8-K |
001-33296 |
10.1 |
5/2/2013 |
|||
|
|
|
|
|
|
|
|
|||
|
10.29 |
|
ISDA Master Agreement dated as of March 2, 2007, between National CineMedia, LLC and Morgan Stanley Capital Services and Schedule. |
10-Q |
001-33296 |
10.2 |
8/10/2007 |
|||
|
|
|
|
|
|
|
|
|||
|
10.30 |
|
ISDA Master Agreement dated as of March 2, 2007, between National CineMedia, LLC and Credit Suisse International and Schedule. |
10-Q |
001-33296 |
10.2 |
11/9/2007 |
|||
|
|
|
|
|
|
|
|
|||
|
10.31 |
|
ISDA Master Agreement dated as of August 6, 2007, between National CineMedia, LLC and JPMorgan Chase Bank, N.A. |
10-Q |
001-33296 |
10.4 |
11/9/2007 |
|||
|
|
|
|
|
|
|
|
|||
|
10.32 |
|
ISDA Novation Agreement dated as of February 4, 2010, between National CineMedia, LLC, Lehman Brothers Special Financing Inc. and Barclays Bank PLC. |
10-K |
001-33296 |
10.36 |
3/9/2010 |
|||
|
|
|
|
|
|
|
|
|||
|
10.33 |
|
ISDA Master Agreement dated as of February 4, 2010 between National CineMedia, LLC and Barclays Bank PLC. |
8-K |
001-33296 |
10.1 |
4/14/2010 |
|||
|
|
|
|
|
|
|
|
|||
|
21.1 |
* |
List of Subsidiaries. |
|
|
|
|
|||
|
|
|
|
|
|
|
|
|||
|
23.1 |
* |
Consent of Deloitte & Touche LLP. |
|
|
|
|
|||
|
|
|
|
|
|
|
|
|||
|
31.1 |
* |
Rule 13a-14(a) Certification of Chief Executive Officer. |
|
|
|
|
|||
|
|
|
|
|
|
|
|
|||
|
31.2 |
* |
Rule 13a-14(a) Certification of Chief Financial Officer. |
|
|
|
|
|||
60
|
|
|
|
Incorporation by Reference |
||||||
|
Exhibit |
Ref. |
Description |
Form |
SEC File No. |
Exhibit |
Filing Date |
|||
|
|
|
|
|
|
|
|
|||
|
32.1 |
** |
Certification of Chief Executive Officer Pursuant to 18 U.S.C. Section 1350. |
|
|
|
|
|||
|
|
|
|
|
|
|
|
|||
|
32.2 |
** |
Certification of Chief Financial Officer Pursuant to 18 U.S.C. Section 1350. |
|
|
|
|
|||
|
|
|
|
|
|
|
|
|||
|
101.INS |
* |
XBRL Instance Document. |
|
|
|
|
|||
|
|
|
|
|
|
|
|
|||
|
101.SCH |
* |
XBRL Taxonomy Extension Schema Document. |
|
|
|
|
|||
|
|
|
|
|
|
|
|
|||
|
101.CAL |
* |
XBRL Taxonomy Extension Calculation Linkbase Document. |
|
|
|
|
|||
|
|
|
|
|
|
|
|
|||
|
101.DEF |
* |
XBRL Taxonomy Extension Definition Linkbase Document. |
|
|
|
|
|||
|
|
|
|
|
|
|
|
|||
|
101.LAB |
* |
XBRL Taxonomy Extension Label Linkbase Document. |
|
|
|
|
|||
|
|
|
|
|
|
|
|
|||
|
101.PRE |
* |
XBRL Taxonomy Extension Presentation Linkbase Document. |
|
|
|
|
|||
|
* |
Filed herewith. |
|
** |
Furnished herewith. |
|
+ |
Management contract. |
61
|
|
|
Page |
|
National CineMedia, Inc. and Subsidiary |
|
|
|
|
|
|
|
|
F-2 |
|
|
|
|
|
|
Consolidated Balance Sheets as of December 29, 2016 and December 31, 2015 |
|
F-3 |
|
|
|
|
|
|
F-4 |
|
|
|
|
|
|
|
F-5 |
|
|
|
|
|
|
|
F-6 |
|
|
|
|
|
|
|
F-7 |
|
|
|
|
|
|
|
F-9 |
F-1
REPORT OF INDEPENDENT REGISTERED PUBLIC ACCOUNTING FIRM
To the Board of Directors and Stockholders of
National CineMedia, Inc.
Centennial, Colorado
We have audited the accompanying consolidated balance sheets of National CineMedia, Inc. and subsidiary (the "Company") as of December 29, 2016 and December 31, 2015 and the related consolidated statements of income, comprehensive income, equity/ (deficit), and cash flows for the years ended December 29, 2016, December 31, 2015 and January 1, 2015. These financial statements are the responsibility of the Company's management. Our responsibility is to express an opinion on the financial statements based on our audits.
We conducted our audits in accordance with the standards of the Public Company Accounting Oversight Board (United States). Those standards require that we plan and perform the audit to obtain reasonable assurance about whether the financial statements are free of material misstatement. An audit includes examining, on a test basis, evidence supporting the amounts and disclosures in the financial statements. An audit also includes assessing the accounting principles used and significant estimates made by management, as well as evaluating the overall financial statement presentation. We believe that our audits provide a reasonable basis for our opinion.
In our opinion, such consolidated financial statements present fairly, in all material respects, the financial position of National CineMedia, Inc. and subsidiary as of December 29, 2016 and December 31, 2015 and the results of their operations and their cash flows for the years ended December 29, 2016, December 31, 2015 and January 1, 2015, in conformity with accounting principles generally accepted in the United States of America.
We have also audited, in accordance with the standards of the Public Company Accounting Oversight Board (United States), the Company's internal control over financial reporting as of December 29, 2016, based on the criteria established in Internal Control — Integrated Framework (2013) issued by the Committee of Sponsoring Organizations of the Treadway Commission and our report dated February 23, 2017 expressed an unqualified opinion on the Company's internal control over financial reporting.
/s/ Deloitte & Touche LLP
Denver, Colorado
February 23, 2017
F-2
NATIONAL CINEMEDIA, INC. AND SUBSIDIARY
(In millions, except share and per share data)
|
|
|
December 29, 2016 |
|
|
December 31, 2015 |
|
||
|
ASSETS |
|
|
|
|
|
|
|
|
|
CURRENT ASSETS: |
|
|
|
|
|
|
|
|
|
Cash and cash equivalents |
|
$ |
23.0 |
|
|
$ |
31.7 |
|
|
Short-term marketable securities |
|
|
26.1 |
|
|
|
13.2 |
|
|
Receivables, net of allowance of $6.3 and $5.6, respectively |
|
|
160.5 |
|
|
|
148.9 |
|
|
Prepaid expenses |
|
|
3.1 |
|
|
|
2.8 |
|
|
Income tax receivable |
|
|
2.4 |
|
|
|
2.5 |
|
|
Current portion of notes receivable - founding members |
|
|
5.6 |
|
|
|
4.2 |
|
|
Other current assets |
|
|
0.4 |
|
|
|
0.3 |
|
|
Total current assets |
|
|
221.1 |
|
|
|
203.6 |
|
|
NON-CURRENT ASSETS: |
|
|
|
|
|
|
|
|
|
Property and equipment, net of accumulated depreciation of $64.1 and $64.1, respectively |
|
|
29.6 |
|
|
|
25.1 |
|
|
Intangible assets, net of accumulated amortization of $118.9 and $91.9, respectively |
|
|
560.5 |
|
|
|
566.7 |
|
|
Deferred tax assets |
|
|
209.1 |
|
|
|
217.1 |
|
|
Long-term notes receivable, net of current portion - founding members |
|
|
8.3 |
|
|
|
12.5 |
|
|
Other investments |
|
|
6.6 |
|
|
|
5.4 |
|
|
Long-term marketable securities |
|
|
19.6 |
|
|
|
40.5 |
|
|
Debt issuance costs, net |
|
|
1.9 |
|
|
|
2.3 |
|
|
Other assets |
|
|
0.7 |
|
|
|
0.5 |
|
|
Total non-current assets |
|
|
836.3 |
|
|
|
870.1 |
|
|
TOTAL ASSETS |
|
$ |
1,057.4 |
|
|
$ |
1,073.7 |
|
|
LIABILITIES AND EQUITY/(DEFICIT) |
|
|
|
|
|
|
|
|
|
CURRENT LIABILITIES: |
|
|
|
|
|
|
|
|
|
Amounts due to founding members |
|
|
42.7 |
|
|
|
35.5 |
|
|
Payable to founding members under tax receivable agreement |
|
|
18.4 |
|
|
|
26.2 |
|
|
Accrued expenses |
|
|
19.6 |
|
|
|
19.8 |
|
|
Accrued payroll and related expenses |
|
|
12.2 |
|
|
|
18.1 |
|
|
Accounts payable |
|
|
17.4 |
|
|
|
14.9 |
|
|
Deferred revenue |
|
|
10.3 |
|
|
|
10.2 |
|
|
Total current liabilities |
|
|
120.6 |
|
|
|
124.7 |
|
|
NON-CURRENT LIABILITIES: |
|
|
|
|
|
|
|
|
|
Long-term debt, net of debt issuance costs of $10.7 and $10.6, respectively |
|
|
924.3 |
|
|
|
925.4 |
|
|
Deferred tax liability |
|
|
48.3 |
|
|
|
50.1 |
|
|
Income tax payable |
|
|
2.0 |
|
|
|
4.9 |
|
|
Payable to founding members under tax receivable agreement |
|
|
143.4 |
|
|
|
140.3 |
|
|
Total non-current liabilities |
|
|
1,118.0 |
|
|
|
1,120.7 |
|
|
Total liabilities |
|
|
1,238.6 |
|
|
|
1,245.4 |
|
|
COMMITMENTS AND CONTINGENCIES (NOTE 12) |
|
|
|
|
|
|
|
|
|
EQUITY/(DEFICIT): |
|
|
|
|
|
|
|
|
|
NCM, Inc. Stockholders’ Equity/(Deficit): |
|
|
|
|
|
|
|
|
|
Preferred stock, $0.01 par value; 10,000,000 shares authorized, none issued and outstanding, respectively |
|
|
— |
|
|
|
— |
|
|
Common stock, $0.01 par value; 175,000,000 shares authorized, 59,874,412 and 59,239,154 issued and outstanding, respectively |
|
|
0.6 |
|
|
|
0.6 |
|
|
Additional paid in capital (deficit) |
|
|
(207.7 |
) |
|
|
(221.5 |
) |
|
Retained earnings (distributions in excess of earnings) |
|
|
(215.6 |
) |
|
|
(186.1 |
) |
|
Total NCM, Inc. stockholders’ equity/(deficit) |
|
|
(422.7 |
) |
|
|
(407.0 |
) |
|
Noncontrolling interests |
|
|
241.5 |
|
|
|
235.3 |
|
|
Total equity/(deficit) |
|
|
(181.2 |
) |
|
|
(171.7 |
) |
|
TOTAL LIABILITIES AND EQUITY/DEFICIT |
|
$ |
1,057.4 |
|
|
$ |
1,073.7 |
|
Refer to accompanying notes to Consolidated Financial Statements.
F-3
NATIONAL CINEMEDIA, INC. AND SUBSIDIARY
CONSOLIDATED STATEMENTS OF INCOME
(In millions, except share and per share data)
|
|
|
Years Ended |
|
|||||||||
|
|
|
December 29, 2016 |
|
|
December 31, 2015 |
|
|
January 1, 2015 |
|
|||
|
Revenue (including revenue from founding members of $29.1, $30.2 and $38.7, respectively) |
|
$ |
447.6 |
|
|
$ |
446.5 |
|
|
$ |
394.0 |
|
|
OPERATING EXPENSES: |
|
|
|
|
|
|
|
|
|
|
|
|
|
Advertising operating costs |
|
|
30.0 |
|
|
|
30.8 |
|
|
|
26.4 |
|
|
Network costs |
|
|
17.1 |
|
|
|
17.8 |
|
|
|
18.3 |
|
|
Theater access fees—founding members |
|
|
75.1 |
|
|
|
72.5 |
|
|
|
70.6 |
|
|
Selling and marketing costs |
|
|
72.8 |
|
|
|
72.3 |
|
|
|
57.6 |
|
|
Merger termination fee and related merger costs |
|
|
— |
|
|
|
34.3 |
|
|
|
7.5 |
|
|
Administrative and other costs |
|
|
43.8 |
|
|
|
38.6 |
|
|
|
29.5 |
|
|
Depreciation and amortization |
|
|
35.8 |
|
|
|
32.2 |
|
|
|
32.4 |
|
|
Total |
|
|
274.6 |
|
|
|
298.5 |
|
|
|
242.3 |
|
|
OPERATING INCOME |
|
|
173.0 |
|
|
|
148.0 |
|
|
|
151.7 |
|
|
NON-OPERATING EXPENSES: |
|
|
|
|
|
|
|
|
|
|
|
|
|
Interest on borrowings |
|
|
54.0 |
|
|
|
52.2 |
|
|
|
52.6 |
|
|
Interest income |
|
|
(1.5 |
) |
|
|
(1.6 |
) |
|
|
(1.8 |
) |
|
Accretion of interest on the discounted payable to founding members under tax receivable agreement |
|
|
13.9 |
|
|
|
14.1 |
|
|
|
14.6 |
|
|
Amortization of terminated derivatives |
|
|
— |
|
|
|
1.6 |
|
|
|
10.0 |
|
|
Loss on early retirement of debt |
|
|
10.4 |
|
|
|
— |
|
|
|
— |
|
|
Other non-operating expense |
|
|
— |
|
|
|
0.2 |
|
|
|
0.8 |
|
|
Total |
|
|
76.8 |
|
|
|
66.5 |
|
|
|
76.2 |
|
|
INCOME BEFORE INCOME TAXES |
|
|
96.2 |
|
|
|
81.5 |
|
|
|
75.5 |
|
|
Income tax expense |
|
|
9.2 |
|
|
|
17.8 |
|
|
|
9.9 |
|
|
CONSOLIDATED NET INCOME |
|
|
87.0 |
|
|
|
63.7 |
|
|
|
65.6 |
|
|
Less: Net income attributable to noncontrolling interests |
|
|
61.6 |
|
|
|
48.3 |
|
|
|
52.2 |
|
|
NET INCOME ATTRIBUTABLE TO NCM, INC. |
|
$ |
25.4 |
|
|
$ |
15.4 |
|
|
$ |
13.4 |
|
|
|
|
|
|
|
|
|
|
|
|
|
|
|
|
NET INCOME PER NCM, INC. COMMON SHARE: |
|
|
|
|
|
|
|
|
|
|
|
|
|
Basic |
|
$ |
0.42 |
|
|
$ |
0.26 |
|
|
$ |
0.23 |
|
|
Diluted |
|
$ |
0.42 |
|
|
$ |
0.26 |
|
|
$ |
0.23 |
|
|
WEIGHTED AVERAGE SHARES OUTSTANDING: |
|
|
|
|
|
|
|
|
|
|
|
|
|
Basic |
|
|
59,788,026 |
|
|
|
58,979,508 |
|
|
|
58,709,534 |
|
|
Diluted |
|
|
60,605,570 |
|
|
|
59,589,299 |
|
|
|
59,005,320 |
|
|
|
|
|
|
|
|
|
|
|
|
|
|
|
|
Dividends declared per common share |
|
$ |
0.88 |
|
|
$ |
0.88 |
|
|
$ |
1.38 |
|
Refer to accompanying notes to Consolidated Financial Statements.
F-4
NATIONAL CINEMEDIA, INC. AND SUBSIDIARY
CONSOLIDATED STATEMENTS OF COMPREHENSIVE INCOME
(In millions)
|
|
|
Years Ended |
|
|||||||||
|
|
|
December 29, 2016 |
|
|
December 31, 2015 |
|
|
January 1, 2015 |
|
|||
|
CONSOLIDATED NET INCOME, NET OF TAX OF $9.2, $17.8 AND $9.9, RESPECTIVELY |
|
$ |
87.0 |
|
|
$ |
63.7 |
|
|
$ |
65.6 |
|
|
OTHER COMPREHENSIVE INCOME, NET OF TAX: |
|
|
|
|
|
|
|
|
|
|
|
|
|
Amortization of terminated derivatives, net of tax of $0.0, $0.3 and $1.8, respectively |
|
|
— |
|
|
|
1.3 |
|
|
|
8.2 |
|
|
CONSOLIDATED COMPREHENSIVE INCOME |
|
|
87.0 |
|
|
|
65.0 |
|
|
|
73.8 |
|
|
Less: Comprehensive income attributable to noncontrolling interests |
|
|
61.6 |
|
|
|
49.2 |
|
|
|
57.6 |
|
|
COMPREHENSIVE INCOME ATTRIBUTABLE TO NCM, INC. |
|
$ |
25.4 |
|
|
$ |
15.8 |
|
|
$ |
16.2 |
|
Refer to accompanying notes to Consolidated Financial Statements.
F-5
NATIONAL CINEMEDIA, INC. AND SUBSIDIARY
CONSOLIDATED STATEMENTS OF EQUITY/ (DEFICIT)
(In millions, except share and per share data)
|
|
|
|
|
|
|
NCM, Inc. |
|
|
|
|
|
|||||||||||||||||
|
|
|
|
|
|
|
|
|
|
|
|
|
|
|
|
|
|
|
Retained |
|
|
|
|
|
|
|
|
|
|
|
|
|
|
|
|
|
|
|
|
|
|
|
|
|
Additional |
|
|
Earnings |
|
|
Accumulated |
|
|
|
|
|
|||
|
|
|
|
|
|
|
|
|
|
|
|
|
|
|
Paid in |
|
|
(Distribution |
|
|
Other |
|
|
|
|
|
|||
|
|
|
|
|
|
|
Common Stock |
|
|
Capital |
|
|
in Excess of |
|
|
Comprehensive |
|
|
Noncontrolling |
|
|||||||||
|
|
|
Consolidated |
|
|
Shares |
|
|
Amount |
|
|
(Deficit) |
|
|
Earnings) |
|
|
Loss |
|
|
Interest |
|
|||||||
|
Balance—December 26, 2013 |
|
$ |
(146.1 |
) |
|
|
58,519,137 |
|
|
$ |
0.6 |
|
|
$ |
(271.7 |
) |
|
$ |
(80.0 |
) |
|
$ |
(3.2 |
) |
|
$ |
208.2 |
|
|
Distributions to founding members |
|
|
(79.4 |
) |
|
|
— |
|
|
|
— |
|
|
|
— |
|
|
|
— |
|
|
|
— |
|
|
|
(79.4 |
) |
|
NCM LLC equity issued for purchase of intangible asset |
|
|
16.4 |
|
|
|
— |
|
|
|
— |
|
|
|
7.5 |
|
|
|
— |
|
|
|
— |
|
|
|
8.9 |
|
|
Income tax and other impacts of NCM LLC ownership changes |
|
|
0.1 |
|
|
|
— |
|
|
|
— |
|
|
|
(1.6 |
) |
|
|
— |
|
|
|
— |
|
|
|
1.7 |
|
|
Comprehensive income, net of tax |
|
|
73.8 |
|
|
|
— |
|
|
|
— |
|
|
|
— |
|
|
|
13.4 |
|
|
|
2.8 |
|
|
|
57.6 |
|
|
Share-based compensation issued |
|
|
(0.6 |
) |
|
|
231,789 |
|
|
|
— |
|
|
|
(0.6 |
) |
|
|
— |
|
|
|
— |
|
|
|
— |
|
|
Share-based compensation expense/capitalized |
|
|
7.8 |
|
|
|
— |
|
|
|
— |
|
|
|
5.3 |
|
|
|
— |
|
|
|
— |
|
|
|
2.5 |
|
|
Excess tax benefit from share-based compensation |
|
|
0.1 |
|
|
|
— |
|
|
|
— |
|
|
|
0.1 |
|
|
|
— |
|
|
|
— |
|
|
|
— |
|
|
Cash dividends declared $1.38 per share |
|
|
(80.8 |
) |
|
|
— |
|
|
|
— |
|
|
|
— |
|
|
|
(80.8 |
) |
|
|
— |
|
|
|
— |
|
|
Balance—January 1, 2015 |
|
$ |
(208.7 |
) |
|
|
58,750,926 |
|
|
$ |
0.6 |
|
|
$ |
(261.0 |
) |
|
$ |
(147.4 |
) |
|
$ |
(0.4 |
) |
|
$ |
199.5 |
|
|
Distributions to founding members |
|
|
(82.2 |
) |
|
|
— |
|
|
|
— |
|
|
|
— |
|
|
|
— |
|
|
|
— |
|
|
|
(82.2 |
) |
|
NCM LLC equity issued for purchase of intangible asset |
|
|
100.7 |
|
|
|
— |
|
|
|
— |
|
|
|
44.4 |
|
|
|
— |
|
|
|
— |
|
|
|
56.3 |
|
|
Income tax and other impacts of NCM LLC ownership changes |
|
|
(7.2 |
) |
|
|
— |
|
|
|
— |
|
|
|
(15.1 |
) |
|
|
— |
|
|
|
— |
|
|
|
7.9 |
|
|
Issuance of shares |
|
|
3.2 |
|
|
|
200,000 |
|
|
|
— |
|
|
|
3.2 |
|
|
|
— |
|
|
|
— |
|
|
|
— |
|
|
NCM, Inc. investment in NCM LLC |
|
|
(3.2 |
) |
|
|
— |
|
|
|
— |
|
|
|
(3.2 |
) |
|
|
— |
|
|
|
— |
|
|
|
— |
|
|
Comprehensive income, net of tax |
|
|
65.0 |
|
|
|
— |
|
|
|
— |
|
|
|
— |
|
|
|
15.4 |
|
|
|
0.4 |
|
|
|
49.2 |
|
|
Share-based compensation issued |
|
|
(0.1 |
) |
|
|
288,228 |
|
|
|
— |
|
|
|
(0.1 |
) |
|
|
— |
|
|
|
— |
|
|
|
— |
|
|
Share-based compensation expense/capitalized |
|
|
15.0 |
|
|
|
— |
|
|
|
— |
|
|
|
10.4 |
|
|
|
— |
|
|
|
— |
|
|
|
4.6 |
|
|
Excess tax benefit from share-based compensation |
|
|
(0.1 |
) |
|
|
— |
|
|
|
— |
|
|
|
(0.1 |
) |
|
|
— |
|
|
|
— |
|
|
|
— |
|
|
Cash dividends declared $0.88 per share |
|
|
(54.1 |
) |
|
|
— |
|
|
|
— |
|
|
|
— |
|
|
|
(54.1 |
) |
|
|
— |
|
|
|
— |
|
|
Balance—December 31, 2015 |
|
$ |
(171.7 |
) |
|
|
59,239,154 |
|
|
$ |
0.6 |
|
|
$ |
(221.5 |
) |
|
$ |
(186.1 |
) |
|
$ |
(0.0 |
) |
|
$ |
235.3 |
|
|
Distributions to founding members |
|
|
(75.1 |
) |
|
|
— |
|
|
|
— |
|
|
|
— |
|
|
|
— |
|
|
|
— |
|
|
|
(75.1 |
) |
|
NCM LLC equity issued for purchase of intangible asset |
|
|
21.1 |
|
|
|
— |
|
|
|
— |
|
|
|
9.2 |
|
|
|
— |
|
|
|
— |
|
|
|
11.9 |
|
|
Income tax and other impacts of NCM LLC ownership changes |
|
|
(2.0 |
) |
|
|
— |
|
|
|
— |
|
|
|
(3.4 |
) |
|
|
— |
|
|
|
— |
|
|
|
1.4 |
|
|
Comprehensive income, net of tax |
|
|
87.0 |
|
|
|
— |
|
|
|
— |
|
|
|
— |
|
|
|
25.4 |
|
|
|
— |
|
|
|
61.6 |
|
|
Share-based compensation issued |
|
|
(4.4 |
) |
|
|
635,258 |
|
|
|
— |
|
|
|
(4.4 |
) |
|
|
— |
|
|
|
— |
|
|
|
|
|
|
Share-based compensation expense/capitalized |
|
|
18.8 |
|
|
|
— |
|
|
|
— |
|
|
|
12.4 |
|
|
|
— |
|
|
|
— |
|
|
|
6.4 |
|
|
Cash dividends declared $0.88 per share |
|
|
(54.9 |
) |
|
|
— |
|
|
|
— |
|
|
|
— |
|
|
|
(54.9 |
) |
|
|
— |
|
|
|
— |
|
|
Balance—December 29, 2016 |
|
$ |
(181.2 |
) |
|
|
59,874,412 |
|
|
$ |
0.6 |
|
|
$ |
(207.7 |
) |
|
$ |
(215.6 |
) |
|
$ |
(0.0 |
) |
|
$ |
241.5 |
|
Refer to accompanying notes to Consolidated Financial Statements.
F-6
NATIONAL CINEMEDIA, INC. AND SUBSIDIARY
CONSOLIDATED STATEMENTS OF CASH FLOWS
(In millions)
|
|
|
Years Ended |
|
|||||||||
|
|
|
December 29, 2016 |
|
|
December 31, 2015 |
|
|
January 1, 2015 |
|
|||
|
CASH FLOWS FROM OPERATING ACTIVITIES: |
|
|
|
|
|
|
|
|
|
|
|
|
|
Consolidated net income |
|
$ |
87.0 |
|
|
$ |
63.7 |
|
|
$ |
65.6 |
|
|
Adjustments to reconcile consolidated net income to net cash provided by operating activities: |
|
|
|
|
|
|
|
|
|
|
|
|
|
Deferred income tax expense |
|
|
11.6 |
|
|
|
12.1 |
|
|
|
12.6 |
|
|
Depreciation and amortization |
|
|
35.8 |
|
|
|
32.2 |
|
|
|
32.4 |
|
|
Non-cash share-based compensation |
|
|
18.3 |
|
|
|
14.8 |
|
|
|
7.7 |
|
|
Excess tax benefit from share-based compensation |
|
|
— |
|
|
|
(0.1 |
) |
|
|
0.1 |
|
|
Accretion of interest on the discounted payable to founding members under tax receivable agreement |
|
|
13.9 |
|
|
|
14.1 |
|
|
|
14.6 |
|
|
Reversal of income tax reserve |
|
|
(2.9 |
) |
|
|
— |
|
|
|
— |
|
|
Amortization of terminated derivatives |
|
|
— |
|
|
|
1.6 |
|
|
|
10.0 |
|
|
Amortization of debt issuance costs |
|
|
2.6 |
|
|
|
2.6 |
|
|
|
2.8 |
|
|
Redemption premium paid and write-off of debt issuance costs related to redemption of Senior Notes due 2021 |
|
|
10.4 |
|
|
|
— |
|
|
|
— |
|
|
Other |
|
|
0.7 |
|
|
|
1.1 |
|
|
|
(0.2 |
) |
|
Cash distributions from non-consolidated entities |
|
|
0.2 |
|
|
|
0.2 |
|
|
|
— |
|
|
Changes in operating assets and liabilities: |
|
|
|
|
|
|
|
|
|
|
|
|
|
Receivables, net |
|
|
(13.5 |
) |
|
|
(35.5 |
) |
|
|
2.7 |
|
|
Accounts payable and accrued expenses |
|
|
(4.1 |
) |
|
|
7.8 |
|
|
|
(10.3 |
) |
|
Amounts due to founding members |
|
|
(0.1 |
) |
|
|
1.4 |
|
|
|
3.0 |
|
|
Payment to founding members under tax receivable agreement |
|
|
(25.3 |
) |
|
|
(21.1 |
) |
|
|
(27.1 |
) |
|
Deferred revenue |
|
|
— |
|
|
|
1.7 |
|
|
|
3.8 |
|
|
Income taxes and other |
|
|
(1.1 |
) |
|
|
8.7 |
|
|
|
0.2 |
|
|
Net cash provided by operating activities |
|
|
133.5 |
|
|
|
105.3 |
|
|
|
117.9 |
|
|
CASH FLOWS FROM INVESTING ACTIVITIES: |
|
|
|
|
|
|
|
|
|
|
|
|
|
Purchases of property and equipment |
|
|
(12.9 |
) |
|
|
(12.6 |
) |
|
|
(8.7 |
) |
|
Purchases of marketable securities |
|
|
(54.7 |
) |
|
|
(70.6 |
) |
|
|
(116.8 |
) |
|
Proceeds from sale and maturities of marketable securities |
|
|
62.8 |
|
|
|
83.1 |
|
|
|
120.8 |
|
|
Purchases of intangible assets from network affiliates |
|
|
(2.3 |
) |
|
|
(2.7 |
) |
|
|
(3.0 |
) |
|
Proceeds from note receivable - founding members |
|
|
2.8 |
|
|
|
4.2 |
|
|
|
4.2 |
|
|
Net cash (used in) provided by investing activities |
|
|
(4.3 |
) |
|
|
1.4 |
|
|
|
(3.5 |
) |
|
CASH FLOWS FROM FINANCING ACTIVITIES: |
|
|
|
|
|
|
|
|
|
|
|
|
|
Payment of dividends |
|
|
(54.6 |
) |
|
|
(52.3 |
) |
|
|
(81.0 |
) |
|
Proceeds from borrowings under the revolving credit facility |
|
|
126.0 |
|
|
|
215.0 |
|
|
|
138.0 |
|
|
Repayments of borrowings under the revolving credit facility |
|
|
(177.0 |
) |
|
|
(171.0 |
) |
|
|
(136.0 |
) |
|
Proceeds from issuance of Senior Notes due 2026 |
|
|
250.0 |
|
|
|
— |
|
|
|
— |
|
|
Redemption of Senior Notes due 2021 |
|
|
(207.9 |
) |
|
|
— |
|
|
|
— |
|
|
Payment of debt issuance costs |
|
|
(4.8 |
) |
|
|
— |
|
|
|
(0.6 |
) |
|
Founding member integration payments |
|
|
2.4 |
|
|
|
2.6 |
|
|
|
2.1 |
|
|
Distributions to founding members |
|
|
(67.6 |
) |
|
|
(82.7 |
) |
|
|
(77.5 |
) |
|
Excess tax benefit from share-based compensation |
|
|
— |
|
|
|
0.1 |
|
|
|
(0.1 |
) |
|
Proceeds from stock option exercises |
|
|
0.5 |
|
|
|
1.3 |
|
|
|
0.8 |
|
|
Repurchase of stock for restricted stock tax withholding |
|
|
(4.9 |
) |
|
|
(1.4 |
) |
|
|
(1.4 |
) |
|
Net cash used in financing activities |
|
|
(137.9 |
) |
|
|
(88.4 |
) |
|
|
(155.7 |
) |
|
CHANGE IN CASH AND CASH EQUIVALENTS |
|
|
(8.7 |
) |
|
|
18.3 |
|
|
|
(41.3 |
) |
|
Cash and cash equivalents at beginning of period |
|
|
31.7 |
|
|
|
13.4 |
|
|
|
54.7 |
|
|
Cash and cash equivalents at end of period |
|
$ |
23.0 |
|
|
$ |
31.7 |
|
|
$ |
13.4 |
|
Refer to accompanying notes to Consolidated Financial Statements.
F-7
NATIONAL CINEMEDIA, INC. AND SUBSIDIARY
CONSOLIDATED STATEMENTS OF CASH FLOWS (CONTINUED)
(In millions)
|
|
|
Years Ended |
|
|||||||||
|
|
|
December 29, 2016 |
|
|
December 31, 2015 |
|
|
January 1, 2015 |
|
|||
|
Supplemental disclosure of non-cash financing and investing activity: |
|
|
|
|
|
|
|
|
|
|
|
|
|
Purchase of an intangible asset with NCM LLC equity |
|
$ |
21.1 |
|
|
$ |
100.7 |
|
|
$ |
16.4 |
|
|
Accrued distributions to founding members |
|
$ |
39.9 |
|
|
$ |
32.4 |
|
|
$ |
32.9 |
|
|
Purchase of subsidiary equity with NCM, Inc. equity |
|
$ |
— |
|
|
$ |
3.2 |
|
|
$ |
— |
|
|
Increase in cost and equity method investments |
|
$ |
2.0 |
|
|
$ |
3.1 |
|
|
$ |
1.2 |
|
|
Increase (decrease) in dividends not requiring cash in the period |
|
$ |
0.3 |
|
|
$ |
1.8 |
|
|
$ |
(0.2 |
) |
|
Supplemental disclosure of cash flow information: |
|
|
|
|
|
|
|
|
|
|
|
|
|
Cash paid for interest |
|
$ |
52.5 |
|
|
$ |
49.7 |
|
|
$ |
49.9 |
|
|
Cash paid for income taxes, net of refunds |
|
$ |
0.5 |
|
|
$ |
(2.7 |
) |
|
$ |
(5.2 |
) |
Refer to accompanying notes to Consolidated Financial Statements.
F-8
NATIONAL CINEMEDIA, INC. AND SUBSIDIARY
NOTES TO CONSOLIDATED FINANCIAL STATEMENTS
|
1. |
BASIS OF PRESENTATION AND SUMMARY OF SIGNIFICANT ACCOUNTING POLICIES |
NCM, Inc. was incorporated in Delaware as a holding company with the sole purpose of becoming a member and sole manager of NCM LLC, a limited liability company owned by NCM, Inc., AMC, Regal and Cinemark. The terms “NCM”, “the Company” or “we” shall, unless the context otherwise requires, be deemed to include the consolidated entity. The Company operates the largest digital in-theater network in North America, allowing NCM LLC to sell advertising under ESAs with the founding members and certain third-party theater circuits under long-term network affiliate agreements referred to in this document as “network affiliates”, which have terms from three to twenty years.
As of December 29, 2016, NCM LLC had 137,194,745 common membership units outstanding, of which 59,874,412 (43.7%) were owned by NCM, Inc., 27,072,701 (19.7%) were owned by Regal, 26,384,644 (19.2%) were owned by Cinemark and 23,862,988 (17.4%) were owned by AMC. The membership units held by the founding members are exchangeable into NCM, Inc. common stock on a one-for-one basis.
Recent Transactions
On May 5, 2014, NCM, Inc. entered into the Merger Agreement to merge with Screenvision. On November 3, 2014, the DOJ filed a lawsuit seeking to enjoin the merger. On March 16, 2015, the Company announced the termination of the Merger Agreement and the lawsuit was dismissed. After the Merger Agreement was terminated, NCM LLC reimbursed NCM, Inc. for certain expenses pursuant to an indemnification agreement among NCM LLC, NCM, Inc. and the founding members. On March 17, 2015, NCM LLC paid Screenvision an approximate $26.8 million termination payment on behalf of NCM, Inc. During the year ended December 31, 2015, NCM LLC also either paid directly or reimbursed NCM, Inc. for the legal and other merger-related costs of approximately $15.0 million ($7.5 million incurred by NCM, Inc. during the year ended January 1, 2015 and approximately $7.5 million incurred by NCM LLC during the year ended December 31, 2015). The Company and the founding members each bore a pro rata portion of the merger termination fee and the related merger expenses based on their aggregate ownership percentages in NCM LLC when the expenses were incurred.
Basis of Presentation
The Company has prepared its Consolidated Financial Statements and related notes of NCM, Inc. in accordance with accounting principles generally accepted in the United States of America (“GAAP”) and the rules and regulations of the Securities and Exchange Commission (“SEC”). Certain reclassifications have been made to the prior years’ financial statements to conform to the current presentation (refer to Note 6—Income Taxes, whereby certain captions were broken out due to their significance in 2016 and/or 2015). These reclassifications had no effect on previously reported results of operations or retained earnings.
As a result of the various related-party agreements discussed in Note 8—Related Party Transactions, the operating results as presented are not necessarily indicative of the results that might have occurred if all agreements were with non-related third parties.
Advertising is the principal business activity of the Company and is the Company’s only reportable segment under the requirements of ASC 280 – Segment Reporting.
F-9
NATIONAL CINEMEDIA, INC. AND SUBSIDIARY
NOTES TO CONSOLIDATED FINANCIAL STATEMENTS
Estimates—The preparation of the financial statements in conformity with GAAP requires management to make estimates and assumptions that affect the reported amounts of assets and liabilities and disclosure of contingent assets and liabilities at the date of the financial statements and the reported amounts of revenues and expenses during the reporting period. Significant estimates include those related to the reserve for uncollectible accounts receivable, share-based compensation and income taxes. Actual results could differ from those estimates.
Significant Accounting Policies
Accounting Period— The Company has a 52-week or 53-week fiscal year ending on the first Thursday after December 25. Fiscal years 2015 and 2016 contained 52 weeks and fiscal year 2014 contained 53 weeks. Throughout this document, the fiscal years are referred to as set forth below:
|
|
|
Reference in |
|
Fiscal Year Ended |
|
this Document |
|
December 29, 2016 |
|
2016 |
|
December 31, 2015 |
|
2015 |
|
January 1, 2015 |
|
2014 |
Revenue Recognition—The Company derives revenue principally from the advertising business, which includes on-screen and lobby network (LEN) advertising and lobby promotions and advertising on entertainment websites and mobile applications owned by us and other companies. Revenue is recognized when persuasive evidence of an arrangement exists, delivery occurs or services are rendered, the sales price is fixed and determinable and collectability is reasonably assured. The Company considers the terms of each arrangement to determine the appropriate accounting treatment.
On-screen advertising consists of national and local advertising. National advertising is sold on a cost per thousand (CPM) basis, while local and regional advertising is sold on a per-screen, per-week basis and to a lesser extent on a CPM basis. The Company recognizes national advertising as impressions (or theater attendees) are delivered and recognizes local on-screen advertising revenue during the period in which the advertising airs as dictated by sales contracts. The Company recognizes revenue derived from lobby network and promotions when the advertising is displayed in theater lobbies and recognizes revenue from branded entertainment websites and mobile applications when the online or mobile impressions are served. The Company may make contractual guarantees to deliver a specified number of impressions to view the customers’ advertising. If those contracted number of impressions are not delivered, the Company will run additional advertising to deliver the contracted impressions at a later date. The deferred portion of the revenue associated with the undelivered impressions is referred to as a make-good provision. In rare cases, the Company will make a cash refund of the portion of the contract related to the undelivered impressions. The Company defers the revenue associated with the make-good until the advertising airs to the theater attendance specified in the advertising contract. The make-good provision is recorded within accrued expenses in the Consolidated Balance Sheets. The Company records deferred revenue when cash payments are received, or invoices are issued, in advance of revenue being earned. Deferred revenue is classified as a current liability as it is expected to be earned within the next twelve months.
The Company recorded non-cash revenue of $0.0 million, $3.1 million and $1.2 million during the years ended December 29, 2016, December 31, 2015 and January 1, 2015, respectively, where the Company received equity securities in privately held companies as consideration. The Company recorded the revenue at the estimated fair value of the advertising exchanged based upon the fair value of the advertising sold for cash within contracts.
Barter Transactions—The Company enters into barter transactions that exchange advertising program time for products and services used principally for selling and marketing activities. The Company records barter transactions at the estimated fair value of the advertising exchanged based on fair value received for similar advertising from cash paying customers. Revenues for advertising barter transactions are recognized when advertising is provided, and products and services received are charged to expense when used. Revenue from barter transactions for the years ended December 29, 2016, December 31, 2015 and January 1, 2015 was $2.5 million, $2.0 million and $1.3 million, respectively. Expense recorded from barter transactions for the years ended December 29, 2016, December 31, 2015 and January 1, 2015 was $2.3 million, $2.5 million and $1.2 million, respectively.
Operating Costs—Advertising-related operating costs primarily include personnel and other costs related to advertising fulfillment, payments due to unaffiliated theater circuits under the network affiliate agreements, and to a lesser extent, production costs of non-digital advertising.
F-10
NATIONAL CINEMEDIA, INC. AND SUBSIDIARY
NOTES TO CONSOLIDATED FINANCIAL STATEMENTS
Payments to the founding members of a theater access fee is comprised of a payment per theater attendee, a payment per digital screen and a payment per digital cinema projector equipped in the theaters, all of which escalate over time. Refer to Item 7—“Management’s Discussion and Analysis of Financial Condition and Results of Operations” included elsewhere in this document.
Network costs include personnel, satellite bandwidth, repairs, and other costs of maintaining and operating the digital network and preparing advertising and other content for transmission across the digital network.
Cash and Cash Equivalents—All highly liquid debt instruments and investments purchased with an original maturity of three months or less are classified as cash equivalents and are considered available-for-sale securities. There are cash balances in a bank in excess of the federally insured limits or in the form of a money market demand account with a major financial institution.
Restricted Cash—As of December 29, 2016 and December 31, 2015, other non-current assets included restricted cash of $0.3 million, which secures a letter of credit used as a lease deposit on the Company’s New York office.
Marketable Securities—The Company’s marketable securities are classified as available-for-sale and are reported at fair value. The fair value of substantially all securities is determined by quoted market information and pricing models using inputs based upon market information, including contractual terms, market prices and yield curves. The estimated fair value of securities for which there are no quoted market prices is based on similar types of securities that are traded in the market.
Concentration of Credit Risk and Significant Customers —Bad debts are provided for using the allowance for doubtful accounts method based on historical experience and management’s evaluation of outstanding receivables at the end of the period. Receivables are written off when management determines amounts are uncollectible. Trade accounts receivable are uncollateralized and represent a large number of geographically dispersed debtors. The collectability risk with respect to national and regional advertising is reduced by transacting with founding members or large, national advertising agencies who have strong reputations in the advertising industry and clients with stable financial positions. The Company has smaller contracts with thousands of local clients that are not individually significant. As of December 29, 2016 and December 31, 2015, there were no advertising agency groups or individual customers through which the Company sources national advertising revenue representing more than 10% of the Company’s outstanding gross receivable balance. During the years ended December 29, 2016, December 31, 2015 and January 1, 2015, there were no customers that accounted for more than 10% of revenue.
Receivables consisted of the following (in millions):
|
|
|
As of |
|
|||||
|
|
|
December 29, 2016 |
|
|
December 31, 2015 |
|
||
|
Trade accounts |
|
$ |
166.0 |
|
|
$ |
153.6 |
|
|
Other |
|
|
0.8 |
|
|
|
0.9 |
|
|
Less: Allowance for doubtful accounts |
|
|
(6.3 |
) |
|
|
(5.6 |
) |
|
Total |
|
$ |
160.5 |
|
|
$ |
148.9 |
|
Long-lived Assets—Property and equipment is stated at cost, net of accumulated depreciation or amortization. Generally, the equipment associated with the digital network of the founding member theaters is owned by the founding members, while the equipment associated with network affiliate theaters is owned by the Company. Major renewals and improvements are capitalized, while replacements, maintenance, and repairs that do not improve or extend the lives of the respective assets are expensed as incurred. The Company records depreciation and amortization using the straight-line method over the following estimated useful lives:
|
Equipment |
4-10 years |
|
Computer hardware and software |
3-5 years |
|
Leasehold improvements |
Lesser of lease term or asset life |
Software and website development costs developed or obtained for internal use are accounted for in accordance with ASC 350—Internal Use Software and ASC 350– Website Development Costs. The subtopics require the capitalization of certain costs incurred in developing or obtaining software for internal use. The majority of software costs related primarily to the Company’s inventory management systems and digital network distribution system (DCS) and website development costs, which are included in equipment, are depreciated over three to five years. As of December 29, 2016 and December 31,
F-11
NATIONAL CINEMEDIA, INC. AND SUBSIDIARY
NOTES TO CONSOLIDATED FINANCIAL STATEMENTS
2015, the Company had a net book value of $16.6 million and $7.4 million, respectively, of capitalized software and website development costs. Approximately $3.9 million, $5.0 million and $6.5 million was recorded for the years ended December 29, 2016, December 31, 2015 and January 1, 2015, respectively, in depreciation expense related to software and website development. For the years ended December 29, 2016, December 31, 2015 and January 1, 2015, the Company recorded $3.4 million, $1.5 million and $1.7 million in research and development expense, respectively.
The Company assesses impairment of long-lived assets pursuant with ASC 360 – Property, Plant and Equipment. This includes determining if certain triggering events have occurred that could affect the value of an asset. The Company recorded losses of $0.2 million, $0.4 million and $0.4 million related to the write-off of property, plant and equipment during the years ended December 29, 2016, December 31, 2015 and January 1, 2015, respectively.
Intangible assets—Intangible assets consist of contractual rights to provide its services within the theaters of the founding members and network affiliates and are stated at cost, net of accumulated amortization. The Company records amortization using the straight-line method over the contractual life of the intangibles, corresponding to the term of the ESAs or the term of the contract with the network affiliate. Intangible assets are tested for impairment at least annually during the fourth quarter or whenever events or changes in circumstances indicate the carrying value may not be fully recoverable. In its impairment testing, the Company estimates the fair value of its ESAs or network affiliate agreements by determining the estimated future cash flows associated with the ESAs or network affiliate agreements. If the estimated fair value is less than the carrying value, the intangible asset is written down to its estimated fair value. Significant judgment is involved in estimating long-term cash flow forecasts. The Company has not recorded impairment charges related to intangible assets.
Other Investments—Other investments consisted of the following (in millions):
|
|
|
As of |
|
|||||
|
|
|
December 29, 2016 |
|
|
December 31, 2015 |
|
||
|
Investment in AC JV, LLC (1) |
|
$ |
1.0 |
|
|
$ |
1.2 |
|
|
Other investments (2) |
|
|
5.6 |
|
|
|
4.2 |
|
|
Total |
|
$ |
6.6 |
|
|
$ |
5.4 |
|
|
|
(1) |
Refer to Note 8—Related Party Transactions. |
|
|
(2) |
The Company received equity securities in some privately held companies as consideration for advertising contracts. The equity securities were accounted for under the cost method and represent an ownership of less than 20%. The Company does not exert significant influence of these companies’ operating or financial activities. |
The Company reviews investments accounted for under the cost and equity methods for impairment whenever events or changes in circumstances indicate that the carrying amount of the investment may not be fully recoverable. In order to determine whether the carrying value of investments may have experienced an “other-than-temporary” decline in value necessitating the write-down of the recorded investment, the Company considers various factors including the investees financial condition and quality of assets, the length of time the investee has been operating, the severity and nature of losses sustained in current and prior years, qualifications in accountant’s reports due to liquidity or going concern issues, investee announcements of adverse changes, downgrading of investee debt, regulatory actions, loss of principal customers, negative operating cash flows or working capital deficiencies and the recording of an impairment charge by the investee for goodwill, intangible or long-lived assets. If a determination is made that an other-than-temporary impairment exists, the Company writes down its investment to fair value. During the years ended December 29, 2016, December 31, 2015 and January 1, 2015, the Company recorded other-than-temporary impairment charges of $0.7 million, $0.0 million and $0.0 million, respectively. The impairment charge during 2016 brought the investment to a remaining fair value of $0.0 million.
Amounts Due to/from Founding Members—Amounts due to/from founding members include amounts due for the theater access fee, offset by a receivable for advertising time purchased by the founding members on behalf of their beverage concessionaire plus any amounts outstanding under other contractually obligated payments. Payments to or received from the founding members against outstanding balances are made monthly. Available cash distributions are made quarterly.
Income Taxes— Income taxes are accounted for under the asset and liability method, which requires recognition of deferred tax assets and liabilities for the expected future tax consequences of events that have been included in the financial statements. Under this method, deferred tax assets and liabilities are determined based on the differences between the financial statements and tax basis of assets and liabilities using enacted tax rates in effect for the year in which differences are
F-12
NATIONAL CINEMEDIA, INC. AND SUBSIDIARY
NOTES TO CONSOLIDATED FINANCIAL STATEMENTS
expected to be recovered or settled pursuant to the provisions of ASC 740 – Income Taxes. The effect of a change in tax rates on deferred tax assets and liabilities is recognized in income in the period that includes the enactment date.
The Company records a valuation allowance if it is deemed more likely than not that all or a portion of its deferred income tax assets will not be realized, which will be assessed on an on-going basis. In addition, income tax rules and regulations are subject to interpretation and the application of those rules and regulations require judgment by the Company and may be challenged by the taxation authorities. The Company follows ASC 740-10-25, which requires the use of a two-step approach for recognizing and measuring tax benefits taken or expected to be taken in a tax return and disclosures regarding uncertainties in income tax positions. Only tax positions that meet the more likely than not recognition threshold are recognized.
The Company recognizes the tax benefits from uncertain tax positions only when it is more likely than not, based on the technical merits of the position, the tax position will be sustained upon examination, including the resolution of any related appeals or litigation. The tax benefits recognized in the Consolidated Financial Statements from such a position are measured as the largest benefit that has a greater than fifty percent likelihood of being realized upon ultimate resolution. The Company recognizes interest and penalties related to uncertain tax positions in income tax expense. Refer to Note 6—Income Taxes.
Debt Issuance Costs—In relation to the issuance of outstanding debt discussed in Note 9—Borrowings, there is a balance of $12.6 million and $12.9 million in deferred financing costs as of December 29, 2016 and December 31, 2015, respectively. The debt issuance costs are being amortized on a straight-line basis over the terms of the underlying obligations and are included in interest on borrowings, which approximates the effective interest method.
The changes in debt issuance costs are as follows (in millions):
|
|
|
Years Ended |
|
|||||||||
|
|
|
December 29, 2016 |
|
|
December 31, 2015 |
|
|
January 1, 2015 |
|
|||
|
Beginning balance |
|
$ |
12.9 |
|
|
$ |
15.5 |
|
|
$ |
17.7 |
|
|
Debt issuance payments |
|
|
4.8 |
|
|
|
— |
|
|
|
0.6 |
|
|
Amortization of debt issuance costs |
|
|
(2.6 |
) |
|
|
(2.6 |
) |
|
|
(2.8 |
) |
|
Write-off of debt issuance costs |
|
|
(2.5 |
) |
|
|
— |
|
|
|
— |
|
|
Ending balance |
|
$ |
12.6 |
|
|
$ |
12.9 |
|
|
$ |
15.5 |
|
Share-Based Compensation— Through 2012, the Company issued stock options, restricted stock and restricted stock units. Since 2013, the Company has only issued restricted stock and restricted stock units. Restricted stock and restricted stock units vest upon the achievement of Company three-year cumulative performance measures and service conditions or only service conditions whereby they vest ratably over three years. Compensation expense of restricted stock that vests upon the achievement of Company performance measures is based on management’s financial projections and the probability of achieving the projections, which require considerable judgment. A cumulative adjustment is recorded to share-based compensation expense in periods that management changes its estimate of the number of shares expected to vest. Ultimately, the Company adjusts the expense recognized to reflect the actual vested shares following the resolution of the performance conditions. Dividends are accrued when declared on unvested restricted stock that is expected to vest and are only paid with respect to shares that actually vest.
Compensation cost of stock options was based on the estimated grant date fair value using the Black-Scholes option pricing model, which requires that the Company make estimates of various factors. Under the fair value recognition provisions of ASC 718 Compensation – Stock Compensation, the Company recognizes share-based compensation net of an estimated forfeiture rate, and therefore only recognizes compensation cost for those shares expected to vest over the requisite service period of the award. Refer to Note 10—Share-Based Compensation for more information.
Fair Value Measurements— Fair value is the price that would be received from selling an asset or paid to transfer a liability in an orderly transaction between market participants at the measurement date. Fair value is estimated by applying the following hierarchy, which prioritizes the inputs used to measure fair value into three levels and bases the categorization within the hierarchy upon the lowest level of input that is available and significant to the fair value measurement:
Level 1 – Quoted prices in active markets for identical assets or liabilities.
F-13
NATIONAL CINEMEDIA, INC. AND SUBSIDIARY
NOTES TO CONSOLIDATED FINANCIAL STATEMENTS
Level 2 – Observable inputs other than quoted prices in active markets for identical assets and liabilities, quoted prices for identical or similar assets or liabilities in inactive markets, or other inputs that are observable or can be corroborated by observable market data for substantially the full term of the assets or liabilities.
Level 3 – Inputs that are generally unobservable and typically reflect management’s estimate of assumptions that market participants would use in pricing the asset or liability.
Derivative Instruments— NCM LLC terminated its interest rate swap agreements that were used to hedge its interest rate risk associated with its term loan. The Company amortized into earnings the balance in Accumulated Other Comprehensive Income (“AOCI”) related to these swaps over the remaining period of the term loan.
Consolidation—NCM, Inc. consolidates the accounts of NCM LLC under the provisions of ASC 810, Consolidation (“ASC 810”). Under Accounting Standards Update 2015-02, Consolidation (Topic 810): Amendments to the Consolidation Analysis (“ASU 2015-02”), a limited partnership is a variable interest entity unless a simple majority or lower threshold of all limited partners unrelated to the general partner have kick-out or participating rights. The non-managing members of NCM LLC do not have dissolution rights or removal rights. NCM, Inc. has evaluated the provisions of the NCM LLC membership agreement and has concluded that the various rights of the non-managing members are not substantive participating rights under ASC 810, as they do not limit NCM, Inc.’s ability to make decisions in the ordinary course of business. As such, the Company concluded that NCM LLC is a variable interest entity and determined that NCM, Inc. should consolidate the accounts of NCM LLC pursuant to ASU 2015-02 because 1) it has the power to direct the activities of NCM LLC in its role as managing member and 2) NCM, Inc. has the obligation to absorb losses of, or the right to receive benefits from, NCM LLC that could potentially be significant provided its 43.7% ownership in NCM LLC. Prior to the prospective adoption of ASU 2015-02 in the first quarter of 2016, the Company reached the same conclusion under previous guidance in ASC 810 to consolidate NCM LLC.
The following table presents the changes in NCM, Inc.’s equity resulting from net income attributable to NCM, Inc. and transfers to or from noncontrolling interests (in millions):
|
|
|
Years Ended |
|
|||||||||
|
|
|
December 29, 2016 |
|
|
December 31, 2015 |
|
|
January 1, 2015 |
|
|||
|
Net income attributable to NCM, Inc. |
|
$ |
25.4 |
|
|
$ |
15.4 |
|
|
$ |
13.4 |
|
|
NCM LLC equity issued for purchase of intangible asset |
|
|
9.2 |
|
|
|
44.4 |
|
|
|
7.5 |
|
|
Income tax and other impacts of NCM LLC ownership changes |
|
|
(3.4 |
) |
|
|
(15.1 |
) |
|
|
(1.6 |
) |
|
NCM, Inc. investment in NCM LLC |
|
|
— |
|
|
|
(3.2 |
) |
|
|
— |
|
|
Issuance of shares |
|
|
— |
|
|
|
3.2 |
|
|
|
— |
|
|
Change from net income attributable to NCM, Inc. and transfers from noncontrolling interests |
|
$ |
31.2 |
|
|
$ |
44.7 |
|
|
$ |
19.3 |
|
Recently Adopted Accounting Pronouncements
During the first quarter of 2016, the Company adopted Accounting Standards Update 2015-01, Income Statement Extraordinary and Unusual Items (Subtopic 225-20): Simplifying Income Statement Presentation by Eliminating the Concept of Extraordinary Items (“ASU 2015-01”) on a prospective basis, which eliminates the concept of extraordinary items from GAAP. Under ASU 2015-01, reporting entities will no longer be required to assess whether an underlying event or transaction is extraordinary, however, presentation and disclosure guidance for items that are unusual in nature or occur infrequently are retained, and are expanded to include items that are both unusual in nature and infrequently occurring. The adoption of ASU 2015-01 did not have a material impact on the audited Consolidated Financial Statements or notes thereto.
During the first quarter of 2016, the Company adopted ASU 2015-02 on a prospective basis. ASU 2015-02 amends current consolidation guidance by modifying the evaluation of whether limited partnerships and similar legal entities are variable interest entities or voting interest entities, eliminating the presumption that a general partner should consolidate a limited partnership, and affects the consolidation analysis of reporting entities that are involved with variable interest entities. The adoption of ASU 2015-02 did not have a material impact on the audited Consolidated Financial Statements or notes thereto.
F-14
NATIONAL CINEMEDIA, INC. AND SUBSIDIARY
NOTES TO CONSOLIDATED FINANCIAL STATEMENTS
During the first quarter of 2016, the Company adopted Accounting Standards Update 2015-03, on a retrospective basis, which provides guidance for simplifying the presentation of debt issuance costs. ASU 2015-03 requires that debt issuance costs be presented in the balance sheet as a direct deduction from the carrying amount of debt liability, consistent with debt discounts or premiums. The Company also adopted ASU 2015-15 on a retrospective basis, which states the SEC staff would not object to an entity deferring and presenting debt issuance costs as an asset and subsequently amortizing the deferred debt issuance costs ratably over the term of the line-of-credit arrangement, regardless of whether there are any outstanding borrowings on the line-of-credit arrangement. The Company reclassified net deferred financing costs related to the Company’s Term Loans, Senior Secured Notes and Senior Unsecured Notes in the audited Consolidated Balance Sheets as a direct deduction from the carrying amount of those borrowings, while net deferred financing costs related to the Company’s Revolving Credit Facility remained an asset in the audited Consolidated Balance Sheets. Upon adoption of ASU 2015-03 and ASU 2015-15, net deferred financing costs of $10.6 million in the December 31, 2015 audited Consolidated Balance Sheet were reclassified from an asset to a reduction of the carrying value of long-term debt.
During the first quarter of 2016, the Company adopted Accounting Standards Update 2015-05, Intangibles-Goodwill and Other – Internal-Use Software (Subtopic 350-40): Customer’s Accounting for Fees Paid in a Cloud Computing Arrangement (“ASU 2015-05”) on a prospective basis, which provides guidance on accounting for fees paid by a customer in a cloud computing arrangement. If a cloud computing arrangement includes a software license, then the customer should account for the software license element of the arrangement consistent with the acquisition of other software licenses. If a cloud computing arrangement does not include a software license, the customer should account for the arrangement as a service contract. The adoption of ASU 2015-05 did not have a material impact on the audited Consolidated Financial Statements or notes thereto.
During the first quarter of 2016, the Company adopted Accounting Standards Update 2015-17, Income Taxes (Topic 740) - Balance Sheet Classification of Deferred Taxes (“ASU 2015-17”) on a retrospective basis. ASU 2015-17 requires the presentation of deferred tax liabilities and assets be classified as non-current in a classified statement of financial position, which is a change from the Company’s historical presentation whereby certain of its deferred tax assets and liabilities were classified as current and the remainder were classified as non-current. Upon adoption of ASU 2015-17, current deferred tax assets of $6.2 million and current deferred tax liabilities of $0.5 million in the December 31, 2015 audited Consolidated Balance Sheet were reclassified as non-current.
During the fourth quarter of 2016, the Company early adopted Accounting Standards Update 2016-09, Compensation-Stock Compensation (Topic 718): Improvements to Employee Share-Based Payment Accounting (“ASU 2016-09”). The updated guidance changes how companies account for certain aspects of share-based payment awards to employees, including the accounting for income taxes, forfeitures and statutory tax withholding requirements, as well as classification in the statement of cash flows. The adoption of ASU 2016-09 did not have a material impact on the audited Consolidated Financial Statements or notes thereto.
Recently Issued Accounting Pronouncements
In May 2014, the Financial Accounting Standards Board (“FASB”) issued Accounting Standards Update 2014-09, Revenue from Contracts with Customers (Topic 606) (“ASU 2014-09”), which supersedes the revenue recognition requirements in Accounting Standards Codification 605, Revenue Recognition. The new revenue recognition standard requires entities to recognize revenue in a way that depicts the transfer of promised goods or services to customers in an amount that reflects the consideration to which the entity expects to be entitled to in exchange for those goods or services. In August 2015, the FASB revised the effective date for this standard to annual and interim periods beginning on or after December 15, 2017, with early adoption permitted, but not earlier than the original effective date of annual and interim periods beginning after December 15, 2016, for public entities. ASU 2014-09 allows for either a full retrospective or a modified retrospective transition method. The Company expects to adopt this guidance using the modified retrospective transition method during the first quarter of 2018. The Company expects to identify the same performance obligations under ASU 2014-09 as compared with deliverables and separate units of account previously identified. The Company does not expect the effect of adopting this guidance to be material to the audited Consolidated Financial Statements, however, the Company does expect additional disclosures in its notes to the audited Consolidated Financial Statements.
F-15
NATIONAL CINEMEDIA, INC. AND SUBSIDIARY
NOTES TO CONSOLIDATED FINANCIAL STATEMENTS
In January 2016, the FASB issued Accounting Standards Update 2016-01, Recognition and Measurement of Financial Assets and Financial Liabilities (“ASU 2016-01”), which requires equity investments that are not accounted for under the equity method of accounting to be measured at fair value with changes recognized in earnings (rather than reported through other comprehensive income) and updates certain presentation and disclosure requirements. The guidance is effective for reporting periods (interim and annual) beginning after December 15, 2017, for public companies and should be adopted on a prospective basis. The Company is currently assessing the impact of ASU 2016-01 on the audited Consolidated Financial Statements or notes thereto.
In February 2016, the FASB issued Accounting Standards Update 2016-02, Leases (Topic 842) (“ASU 2016-02”). ASU 2016-02 establishes a right-of-use (“ROU”) model that requires a lessee to record a ROU asset and a lease liability on the balance sheet for all leases with terms longer than 12 months. Leases will be classified as either finance or operating, with classification affecting the pattern of expense recognition in the income statement. The new standard is effective for fiscal years beginning after December 15, 2018, including interim periods within those fiscal years. A modified retrospective transition approach is required for lessees for capital and operating leases existing at, or entered into after, the beginning of the earliest comparative period presented in the financial statements, with certain practical expedients available. The Company is currently assessing the impact of ASU 2016-02 on the audited Consolidated Financial Statements or notes thereto.
In March 2016, the FASB issued Accounting Standards Update 2016-07, Investments- Equity Method and Joint Ventures: Simplifying the Transition to the Equity Method of Accounting (“ASU 2016-07”). ASU 2016-07 eliminates the requirement to apply the equity method of accounting retrospectively when a reporting entity obtains significant influence over a previously held investment. ASU 2016-07 is effective for fiscal years beginning after December 15, 2016, including interim periods within those fiscal years with early adoption permitted and is to be adopted on a prospective basis. The adoption of ASU 2016-07 is not expected to have a material effect on the audited Consolidated Financial Statements or notes thereto.
In June 2016, the FASB issued Accounting Standards Update 2016-13, Financial Instruments – Credit Losses (Topic 326), Measurement of Credit Losses on Financial Statements (“ASU 2016-13”), which requires a financial asset (or group of financial assets) measured at amortized cost basis to be presented at the net amount expected to be collected. The allowance for credit losses is a valuation account that is deducted from the amortized cost basis of the financial asset(s) to present the net carrying value at the amount expected to be collected on the financial asset. ASU 2016-13 is effective for fiscal years beginning after December 15, 2019, including interim periods within those fiscal years, with early adoption permitted and is to be adopted on a modified retrospective basis. The Company is currently evaluating the effect that adopting this guidance will have on the audited Consolidated Financial Statements or notes thereto.
In August 2016, the FASB issued Accounting Standards Update 2016-15, Statement of Cash Flows (Topic 230): Classification of Certain Cash Receipts and Cash Payments (“ASU 2016-15”), which provides guidance on how certain cash receipts and cash payments are to be presented and classified in the statement of cash flows. ASU 2016-15 is effective for fiscal years beginning after December 15, 2017, including interim periods within those fiscal years, with early adoption permitted. The Company does not expect the effect of adopting this guidance to have a material effect on the audited Consolidated Financial Statements or notes thereto.
In October 2016, the FASB issued Accounting Standards Update 2016-17, Consolidation (Topic 810): Interests Held through Related Parties That Are under Common Control (“ASU 2016-17”), which changes the evaluation of whether a reporting entity is the primary beneficiary of a variable interest entity by changing how a reporting entity that is a single decision maker of a variable interest entity treats indirect interests in the entity held through related parties that are under common control with the reporting entity. If a reporting entity satisfies the first characteristic of a primary beneficiary (such that it is the single decision maker of a variable interest entity), the amendments require that reporting entity, in determining whether it satisfies the second characteristic of a primary beneficiary, to include all of its direct variable interests in a variable interest entity and, on a proportionate basis, its indirect variable interests in a variable interest entity held through related parties, including related parties that are under common control with the reporting entity. ASU 2016-17 is effective for fiscal years beginning after December 15, 2016, including interim periods within those fiscal years, with early adoption permitted. The Company is currently evaluating the effect that adopting this guidance will have on the audited Consolidated Financial Statements or notes thereto.
In November 2016, the FASB issued Accounting Standards Update 2016-18, Statement of Cash Flows (Topic 230): Restricted Cash (“ASU 2016-18”), which requires that the reconciliation of the beginning-of-period and end-of-period amounts shown in the statement of cash flows include restricted cash and restricted cash equivalents. If restricted cash is presented separately from cash and cash equivalents on the balance sheet, companies will have to reconcile the amounts
F-16
NATIONAL CINEMEDIA, INC. AND SUBSIDIARY
NOTES TO CONSOLIDATED FINANCIAL STATEMENTS
presented on the statement of cash flows to the amounts on the balance sheet. Companies will also need to disclose information about the nature of the restrictions. ASU 2016-18 is effective for fiscal years beginning after December 15, 2017, including interim periods within those fiscal years. The Company is currently evaluating the effect that adopting this guidance will have on the audited Consolidated Financial Statements or notes thereto.
The Company has considered all other recently issued accounting pronouncements and does not believe the adoption of such pronouncements will have a material impact on its audited Consolidated Financial Statements or notes thereto.
|
2. |
EARNINGS PER SHARE |
Basic earnings per share is computed on the basis of the weighted average number of common shares outstanding. Diluted earnings per share is computed on the basis of the weighted average number of common shares outstanding plus the effect of potentially dilutive common stock options and restricted stock using the treasury stock method. The components of basic and diluted earnings per NCM, Inc. share are as follows:
|
|
Years Ended |
|
||||||||||
|
|
December 29, 2016 |
|
|
December 31, 2015 |
|
|
January 1, 2015 |
|
||||
|
Net income attributable to NCM, Inc. (in millions) |
|
$ |
25.4 |
|
|
$ |
15.4 |
|
|
$ |
13.4 |
|
|
Weighted average shares outstanding: |
|
|
|
|
|
|
|
|
|
|
|
|
|
Basic |
|
|
59,788,026 |
|
|
|
58,979,508 |
|
|
|
58,709,534 |
|
|
Add: Dilutive effect of stock options and restricted stock |
|
|
817,544 |
|
|
|
609,791 |
|
|
|
295,786 |
|
|
Diluted |
|
|
60,605,570 |
|
|
|
59,589,299 |
|
|
|
59,005,320 |
|
|
Earnings per NCM, Inc. share: |
|
|
|
|
|
|
|
|
|
|
|
|
|
Basic |
|
$ |
0.42 |
|
|
$ |
0.26 |
|
|
$ |
0.23 |
|
|
Diluted |
|
$ |
0.42 |
|
|
$ |
0.26 |
|
|
$ |
0.23 |
|
The effect of the 77,020,686, 71,439,992 and 69,306,057 exchangeable NCM LLC common units held by the founding members for the years ended December 29, 2016, December 31, 2015 and January 1, 2015, respectively, have been excluded from the calculation of diluted weighted average shares and earnings per NCM, Inc. share as they were antidilutive. NCM LLC common units do not participate in dividends paid on NCM Inc.’s common shares. In addition, there were 16,657, 64,519 and 72,533 stock options and non-vested (restricted) shares for the years ended December 29, 2016, December 31, 2015 and January 1, 2015, respectively, excluded from the calculation as they were antidilutive, primarily because exercise prices associated with those shares were above the average market value. The Company’s non-vested (restricted) shares do not meet the definition of a participating security as the dividends will not be paid if the shares do not vest.
|
3. |
PROPERTY AND EQUIPMENT |
The following is a summary of property and equipment, at cost less accumulated depreciation (in millions):
|
|
|
As of |
|
|||||
|
|
|
December 29, 2016 |
|
|
December 31, 2015 |
|
||
|
Equipment, computer hardware and software |
|
$ |
86.6 |
|
|
$ |
77.1 |
|
|
Leasehold improvements |
|
|
3.4 |
|
|
|
3.4 |
|
|
Less: Accumulated depreciation |
|
|
(64.1 |
) |
|
|
(64.1 |
) |
|
Subtotal |
|
|
25.9 |
|
|
|
16.4 |
|
|
Construction in progress |
|
|
3.7 |
|
|
|
8.7 |
|
|
Total property and equipment |
|
$ |
29.6 |
|
|
$ |
25.1 |
|
For the years ended December 29, 2016, December 31, 2015 and January 1, 2015, the Company recorded depreciation expense of $8.6 million, $9.6 million, and $11.1 million, respectively.
|
4. |
INTANGIBLE ASSETS |
The Company’s intangible assets consist of contractual rights to provide its services within the theaters of the founding members and network affiliates. The Company records amortization using the straight-line method over the contractual life of the intangibles, corresponding to the term of the ESAs or the term of the contract with the network affiliate. The Company’s intangible assets with the founding members are recorded at the fair market value of NCM, Inc.’s publicly traded stock as of the date on which the common membership units were issued. The NCM LLC common membership units are
F-17
NATIONAL CINEMEDIA, INC. AND SUBSIDIARY
NOTES TO CONSOLIDATED FINANCIAL STATEMENTS
fully convertible into NCM, Inc.’s common stock. The Company also records intangible assets for upfront fees paid to network affiliates upon commencement of a network affiliate agreement. Pursuant to ASC 350-10—Intangibles—Goodwill and Other, the Company’s intangible assets have a finite useful life and the Company amortizes the assets over the remaining useful life corresponding with the ESAs or the term of the contract with the network affiliate. If common membership units are issued to a founding member for newly acquired theaters that are subject to an existing on-screen advertising agreement with an alternative provider, the amortization of the intangible asset commences after the existing agreement expires and NCM LLC can utilize the theaters for all of its services. In addition, if common membership units are issued to a founding member for theaters under an existing on-screen advertising agreement with an alternative provider, NCM LLC may receive payments from the founding member pursuant to the ESAs on a quarterly basis in arrears in accordance with certain run-out provisions (“integration payments”). Integration payments approximate the advertising cash flow that the Company would have generated if it had exclusive access to sell advertising in the theaters with pre-existing advertising agreements. The integration payments are recorded as a reduction to net intangible assets, and not as part of operating income.
In accordance with NCM LLC’s Common Unit Adjustment Agreement with its founding members, on an annual basis NCM LLC determines the amount of common membership units to be issued to or returned by the founding members based on theater additions or dispositions during the previous year. In addition, NCM LLC’s Common Unit Adjustment Agreement requires that a Common Unit Adjustment occur for a specific founding member if its acquisition or disposition of theaters, in a single transaction or cumulatively since the most recent Common Unit Adjustment, results in an attendance increase or decrease of two percent or more in the total annual attendance of all founding members as of the last adjustment date.
The following is a summary of the Company’s intangible assets (in millions):
|
|
|
As of December 31, 2015 |
|
|
Additions (1) |
|
|
Amortization |
|
|
Integration Payments (3) |
|
|
As of December 29, 2016 |
|
|||||
|
Gross carrying amount |
|
$ |
658.6 |
|
|
$ |
23.4 |
|
|
$ |
— |
|
|
$ |
(2.6 |
) |
|
$ |
679.4 |
|
|
Accumulated amortization |
|
|
(91.9 |
) |
|
|
— |
|
|
|
(27.0 |
) |
|
|
— |
|
|
|
(118.9 |
) |
|
Total intangible assets, net |
|
$ |
566.7 |
|
|
$ |
23.4 |
|
|
$ |
(27.0 |
) |
|
$ |
(2.6 |
) |
|
$ |
560.5 |
|
|
|
|
As of January 1, 2015 |
|
|
Additions (2) |
|
|
Amortization |
|
|
Integration Payments (3) |
|
|
As of December 31, 2015 |
|
|||||
|
Gross carrying amount |
|
$ |
557.9 |
|
|
$ |
103.4 |
|
|
$ |
— |
|
|
$ |
(2.7 |
) |
|
$ |
658.6 |
|
|
Accumulated amortization |
|
|
(69.3 |
) |
|
|
— |
|
|
|
(22.6 |
) |
|
|
— |
|
|
|
(91.9 |
) |
|
Total intangible assets, net |
|
$ |
488.6 |
|
|
$ |
103.4 |
|
|
$ |
(22.6 |
) |
|
$ |
(2.7 |
) |
|
$ |
566.7 |
|
|
(1) |
During the first quarter of 2016, NCM LLC issued 1,416,515 common membership units to its founding members for the rights to exclusive access to net new theater screens and attendees added by the founding members to NCM LLC’s network during 2015. NCM LLC recorded a net intangible asset of $21.1 million in the first quarter of 2016 as a result of the Common Unit Adjustment. |
During 2016, the Company purchased intangible assets for $2.3 million associated with network affiliate agreements.
|
(2) |
During the first quarter of 2015, NCM LLC issued 2,160,915 common membership units to its founding members for the rights to exclusive access to net new theater screens and attendees added by the founding members to NCM LLC’s network during 2014. NCM LLC recorded a net intangible asset of $31.4 million in the first quarter of 2015 as a result of the Common Unit Adjustment. |
In December 2015, NCM LLC issued 4,399,324 common membership units to AMC for attendees added in connection with AMC’s acquisition of Starplex Cinemas and other newly built or acquired theaters. NCM LLC recorded a net intangible asset of approximately $69.3 million for this Common Unit Adjustment.
During 2015, the Company purchased intangible assets for $2.7 million associated with network affiliate agreements.
F-18
NATIONAL CINEMEDIA, INC. AND SUBSIDIARY
NOTES TO CONSOLIDATED FINANCIAL STATEMENTS
As of December 29, 2016 and December 31, 2015, the Company’s intangible assets related to the founding members, net of accumulated amortization was $529.9 million and $535.9 million, respectively with weighted average remaining lives of 20.2 years and 21.2 years as of December 29, 2016 and December 31, 2015, respectively.
As of December 29, 2016 and December 31, 2015, the Company’s intangible assets related to the network affiliates, net of accumulated amortization was $30.6 million and $30.8 million, respectively with weighted average remaining lives of 12.7 years and 13.9 years as of December 29, 2016 and December 31, 2015, respectively.
For the years ended December 29, 2016, December 31, 2015 and January 1, 2015, the Company recorded amortization expense of $27.0 million, $22.6 million and $20.6 million, respectively. The estimated aggregate amortization expense for each of the five succeeding years is as follows (in millions):
|
Year |
|
Amortization |
|
|
|
2017 |
|
$ |
27.6 |
|
|
2018 |
|
$ |
27.6 |
|
|
2019 |
|
$ |
27.3 |
|
|
2020 |
|
$ |
27.3 |
|
|
2021 |
|
$ |
27.3 |
|
|
5. |
ACCRUED EXPENSES |
The following is a summary of the Company’s accrued expenses (in millions):
|
|
|
As of |
|
|||||
|
|
|
December 29, 2016 |
|
|
December 31, 2015 |
|
||
|
Make-good reserve |
|
$ |
4.6 |
|
|
$ |
3.4 |
|
|
Accrued interest |
|
|
11.3 |
|
|
|
12.5 |
|
|
Deferred rent |
|
|
1.8 |
|
|
|
2.1 |
|
|
Other accrued expenses |
|
|
1.9 |
|
|
|
1.8 |
|
|
Total accrued expenses |
|
$ |
19.6 |
|
|
$ |
19.8 |
|
|
6. |
INCOME TAXES |
On the IPO date, NCM, Inc. and the founding members entered into a tax receivable agreement. Under the terms of this agreement, NCM, Inc. will make cash payments to the founding members in amounts equal to 90% of NCM, Inc.’s actual tax benefit realized from the tax amortization of the intangible assets described below. For purposes of the tax receivable agreement, cash savings in income and franchise tax will be computed by comparing NCM, Inc.’s actual income and franchise tax liability to the amount of such taxes that NCM, Inc. would have been required to pay had there been no increase in NCM, Inc.’s proportionate share of tax basis in NCM LLC’s tangible and intangible assets and had the tax receivable agreement not been entered into. The tax receivable agreement applies to NCM, Inc.’s taxable years up to and including the 30th anniversary date of the offering. The Company paid the founding members $27.1 million in 2014 ($0.1 million was for the 2012 tax year, $6.7 million was net operating loss carrybacks for the 2009, 2010 and 2011 tax years and $20.3 million for the 2013 tax year), $21.1 million in 2015 ($0.9 million was net operating loss carrybacks for the 2009, 2010 and 2011 tax year and $20.2 million for the 2014 tax year) and $25.3 million in 2016 ($2.7 million was net operating loss carrybacks for the 2013 tax year and $22.6 million was for the 2015 tax year).
F-19
NATIONAL CINEMEDIA, INC. AND SUBSIDIARY
NOTES TO CONSOLIDATED FINANCIAL STATEMENTS
The Company has provided total income taxes, as follows (in millions):
|
|
|
Years Ended |
|
|||||||||
|
|
|
December 29, 2016 |
|
|
December 31, 2015 |
|
|
January 1, 2015 |
|
|||
|
Current: |
|
|
|
|
|
|
|
|
|
|
|
|
|
Federal |
|
$ |
(2.6 |
) |
|
$ |
4.5 |
|
|
$ |
(3.3 |
) |
|
State |
|
|
0.2 |
|
|
|
1.2 |
|
|
|
0.4 |
|
|
Total current income tax expense/(benefit) |
|
$ |
(2.4 |
) |
|
$ |
5.7 |
|
|
$ |
(2.9 |
) |
|
Deferred: |
|
|
|
|
|
|
|
|
|
|
|
|
|
Federal |
|
$ |
10.6 |
|
|
$ |
9.8 |
|
|
$ |
10.3 |
|
|
State |
|
|
1.0 |
|
|
|
2.3 |
|
|
|
2.5 |
|
|
Total deferred income tax expense |
|
$ |
11.6 |
|
|
$ |
12.1 |
|
|
$ |
12.8 |
|
|
Total income tax provision on Consolidated Statements of Income |
|
$ |
9.2 |
|
|
$ |
17.8 |
|
|
$ |
9.9 |
|
|
Income tax expense on other comprehensive income |
|
$ |
— |
|
|
$ |
0.3 |
|
|
$ |
1.8 |
|
A reconciliation of the provision for income taxes as reported and the amount computed by multiplying income before taxes, less noncontrolling interest, by the U.S. federal statutory rate of 35% was (in millions):
|
|
|
Years Ended |
|
|||||||||
|
|
|
December 29, 2016 |
|
|
December 31, 2015 |
|
|
January 1, 2015 |
|
|||
|
Provision calculated at federal statutory income tax rate: |
|
|
|
|
|
|
|
|
|
|
|
|
|
Income before income taxes |
|
$ |
33.7 |
|
|
$ |
28.5 |
|
|
$ |
26.2 |
|
|
Less: Noncontrolling interests |
|
|
(21.6 |
) |
|
|
(16.9 |
) |
|
|
(18.3 |
) |
|
Income attributable to NCM, Inc. |
|
|
12.1 |
|
|
|
11.6 |
|
|
|
7.9 |
|
|
Current year change to enacted state rate |
|
|
(0.8 |
) |
|
|
0.8 |
|
|
|
0.8 |
|
|
State and local income taxes, net of federal benefit |
|
|
1.5 |
|
|
|
1.4 |
|
|
|
0.9 |
|
|
NCM LLC income taxes |
|
|
0.1 |
|
|
|
0.1 |
|
|
|
0.9 |
|
|
Share-based compensation |
|
|
0.3 |
|
|
|
0.3 |
|
|
|
0.9 |
|
|
Allocation to founding members under tax receivable agreement |
|
|
(1.9 |
) |
|
|
(1.5 |
) |
|
|
(1.8 |
) |
|
Uncertain tax positions (1) |
|
|
(2.9 |
) |
|
|
4.9 |
|
|
|
— |
|
|
NCM LLC membership unit issuance to NCM, Inc. |
|
|
0.9 |
|
|
|
0.2 |
|
|
|
— |
|
|
Other |
|
|
(0.1 |
) |
|
|
— |
|
|
|
0.3 |
|
|
Total income tax provision |
|
$ |
9.2 |
|
|
$ |
17.8 |
|
|
$ |
9.9 |
|
|
|
(1) |
During the year ended December 31, 2015, the Company established a reserve for material, known tax exposures of $4.9 million, including accrued interest and penalties. The reserve relates to tax exposures from prior periods (2010 through 2014). The impact of this reserve was a total out of period impact of $4.9 million to income tax expense and income tax payable in the Consolidated Financial Statements during 2015. During the years ended December 29, 2016, the Company reversed approximately $2.9 million of its reserve ($2.3 million of income tax benefits and $0.6 million of accrued interest and penalties) because the statute of limitations expired. Further information is provided below. |
Significant components of the Company’s deferred tax assets and deferred tax liability consisted of the following (in millions):
F-20
NATIONAL CINEMEDIA, INC. AND SUBSIDIARY
NOTES TO CONSOLIDATED FINANCIAL STATEMENTS
|
|
Years Ended |
|
||||||
|
|
|
December 29, 2016 |
|
|
December 31, 2015 |
|
||
|
Deferred tax assets: |
|
|
|
|
|
|
|
|
|
Investment in consolidated subsidiary NCM LLC (1)(2) |
|
$ |
182.9 |
|
|
$ |
198.3 |
|
|
Share-based compensation |
|
|
9.8 |
|
|
|
9.0 |
|
|
Net operating losses |
|
|
11.4 |
|
|
|
3.3 |
|
|
Accrued bonus |
|
|
1.7 |
|
|
|
2.7 |
|
|
Other |
|
|
3.3 |
|
|
|
3.8 |
|
|
Total deferred tax assets |
|
$ |
209.1 |
|
|
$ |
217.1 |
|
|
Deferred tax liabilities: |
|
|
|
|
|
|
|
|
|
Discount on liability for income taxes payable to founding members under tax sharing agreement (3) |
|
$ |
42.8 |
|
|
$ |
45.9 |
|
|
Depreciation and amortization |
|
|
3.5 |
|
|
|
2.0 |
|
|
Notes receivable |
|
|
1.5 |
|
|
|
2.0 |
|
|
Other |
|
|
0.5 |
|
|
|
0.2 |
|
|
Total deferred tax liabilities |
|
$ |
48.3 |
|
|
$ |
50.1 |
|
|
|
(1) |
NCM LLC made an election under Internal Revenue code (“IRC”) §754 of the Internal Revenue Code to step-up the Company’s outside basis in its share of NCM LLC’s inside basis of assets under IRC §743(b) resulting in a deferred tax asset for the Company’s acquired share of NCM LLC’s assets. The majority of this deferred tax asset is attributable to intangible assets that are amortized over the remainder of the 15-year period for federal income tax purposes and accounted for as distributions under U.S. generally accepted accounting principles. The Company recorded additional step-up in tax basis as a result of subsequent payments made by NCM, Inc. to the founding members under the tax receivable agreement resulting from amortization of the IRC §743(b) adjustment. |
|
|
(2) |
For federal income tax purposes, an amortizable intangible asset was created on the tax-basis balance sheet of NCM LLC as a result of the founding members agreeing to modify NCM LLC’s payment obligations under the ESAs and as a result of the common unit adjustments, which are further described in Note 4—Intangible Assets. The tax effect of NCM, Inc.’s share of the intangible asset is amortized over the remainder of the 30-year life for federal income tax purposes. Additionally, units issued under Common Unit Adjustments and subsequent payments to the founding members under the tax receivable agreement, create additional layers of tax basis amortized over the remaining period of the ESA. The ESA deferred tax asset was adjusted to reflect the changes in ownership that occurred during the year due primarily to the common unit adjustments. |
|
|
(3) |
NCM, Inc. recorded a long-term payable to founding members related to the tax receivable agreement, which is recorded at its present value. The discount on this liability is a temporary difference that resulted in a deferred tax liability. The Company recorded accretion of interest on the discounted payable of $13.9 million and $14.1 million for the year ended December 29, 2016 and December 31, 2015, respectively. |
As of December 29, 2016, the Company had gross federal net operating loss carryforwards of approximately $27.6 million, which expire in 2034 through 2036. As of December 29, 2016, the Company had gross state net operating loss carryforwards of approximately $47.5 million, which expire at various dates between 2017 and 2036. The Company reversed a valuation allowance it had against its capital loss carryforwards as of December 26, 2013, as some of the carryforwards were utilized in 2013 and the remainder were utilized in 2014. As of December 29, 2016, the Company had gross capital loss carryforwards of approximately $1.3 million, which expire in 2020.
The Company is subject to taxation in the U.S. and various states. The Company’s tax returns for the calendar years 2013 through 2015 remain open to examination by the IRS in their entirety. With respect to state taxing jurisdictions, the Company’s tax returns for calendar years ended 2008 through 2015 are eligible for examination by various state revenue services.
F-21
NATIONAL CINEMEDIA, INC. AND SUBSIDIARY
NOTES TO CONSOLIDATED FINANCIAL STATEMENTS
The Company has established a reserve for material, known tax exposures. As of December 29, 2016 and December 31, 2015, the total amount of the tax reserve was $2.0 million and $4.9 million, including accrued interest and penalties, respectively. The Company’s reserve reflects management’s judgment as to the resolution of the issues involved if subject to judicial review or other settlement. While the Company believes its reserves are adequate to cover reasonably expected tax risks, there can be no assurance that, in all instances, an issue raised by a tax authority will be resolved at a financial cost that does not exceed its related reserve. With respect to the reserve, the Company’ income tax expense would include (i) any changes in tax reserves arising from material changes during the period in the facts and circumstances (i.e., new information) surrounding a tax issue and (ii) any difference from the Company’s tax position as recorded in the financial statements and the final resolution of a tax issue during the period. Such resolution could materially increase or decrease income tax expense in the Consolidated Financial Statements in future periods and could impact operating cash flows.
Unrecognized tax benefits represent the aggregate tax effect of differences between tax return positions and the amounts otherwise recognized in the Consolidated Financial Statements. A reconciliation of the beginning and ending amount of unrecognized tax benefits, excluding interest and penalties, is as follows (in millions):
|
|
|
Years Ended |
|
|||||
|
|
|
December 29, 2016 |
|
|
December 31, 2015 |
|
||
|
Balance at beginning of period |
|
$ |
3.9 |
|
|
$ |
— |
|
|
Additions based on tax positions related to prior years |
|
|
— |
|
|
|
3.9 |
|
|
Reductions based on the lapse of applicable statute of limitations |
|
|
(2.3 |
) |
|
|
— |
|
|
Balance at end of period |
|
$ |
1.6 |
|
|
$ |
3.9 |
|
The total amount of unrecognized tax benefits that, if recognized, would affect the effective tax rate was $1.6 million and $3.9 million as of December 29, 2016 and December 31, 2015, respectively, excluding interest and penalties. It is reasonably possible that the Company’s total unrecognized tax benefits will decrease by approximately $1.3 million during the next twelve months due to the expiration of certain statutes of limitations. The Company has accrued $0.4 million and $1.0 million for the payment of interest and penalties as of December 29, 2016 and December 31, 2015, respectively.
The Company recognizes interest and penalties with respect to unrecognized tax benefits in income tax expense in the Consolidated Statements of Income and records the liability in income taxes payable in the Consolidated Balance Sheets. The Company recognized ($0.6) million, $1.0 million and $0.0 million in interest and penalties during the years ended December 29, 2016, December 31, 2015 and January 1, 2015, respectively.
|
7. |
EQUITY |
As of December 29, 2016, the Company has authorized capital stock of 175,000,000 shares of common stock, par value of $0.01 per share, and 10,000,000 shares of preferred stock, par value of $0.01 per share. There were no shares of preferred stock issued or outstanding as of December 29, 2016. There were 59,874,412 shares of common stock issued and outstanding as of December 29, 2016.
The holders of NCM Inc. common stock are entitled to one vote per share on all matters submitted for action by the NCM Inc. stockholders. Holders of common stock are entitled to share equally, share for share, in declared dividends.
The authorized but unissued shares of common stock and preferred stock are available for future issuance without stockholder approval. These additional shares may be used for a variety of corporate purposes, including share based compensation, future public offerings to raise additional capital, corporate acquisitions and exchange on a one-for-one basis under the founding members’ right to convert their NCM LLC membership units into Company common stock.
NCM LLC’s founding members received all proceeds from NCM, Inc.’s IPO and related issuances of debt, except for amounts needed to pay out-of-pocket costs of the financings and other expenses. The ESAs with the founding members were amended and restated in conjunction with the IPO under which NCM LLC became the exclusive provider of advertising services to the founding members for a 30-year term. In conformity with accounting guidance of the SEC concerning monetary consideration paid to promoters, such as the founding members, in exchange for property conveyed by the promoters, the excess over predecessor cost was treated as a special distribution. Because the founding members had no cost basis in the ESAs, nearly all payments to the founding members with the proceeds of the IPO and related debt, have been accounted for as distributions. The distributions by NCM LLC to the founding members made at the date of the IPO resulted in a consolidated stockholders’ deficit. As a noncontrolling interest cannot be shown as an asset, the founding members’
F-22
NATIONAL CINEMEDIA, INC. AND SUBSIDIARY
NOTES TO CONSOLIDATED FINANCIAL STATEMENTS
interest in NCM LLC’s members equity is included in distributions in excess of paid in capital in the accompanying Consolidated Balance Sheets.
|
8. |
RELATED PARTY TRANSACTIONS |
Founding Member Transactions— In connection with the IPO, the Company entered into several agreements to define and regulate the relationships among NCM, Inc., NCM LLC and the founding members. They include the following:
|
|
• |
ESAs. Under the ESAs, NCM LLC is the exclusive provider within the United States of advertising services in the founding members’ theaters (subject to pre-existing contractual obligations and other limited exceptions for the benefit of the founding members). The advertising services include the use of the DCN equipment required to deliver the on-screen advertising and other content included in the FirstLook pre-show, use of the LEN and rights to sell and display certain lobby promotions. Further, 30 to 60 seconds of advertising included in the FirstLook pre-show is sold to the founding members to satisfy the founding members’ on-screen advertising commitments under their beverage concessionaire agreements. In consideration for access to the founding members’ theaters, theater patrons, the network equipment required to display on-screen and LEN video advertising and the use of theaters for lobby promotions, the founding members receive a monthly theater access fee. |
|
|
• |
Common Unit Adjustment Agreement. The common unit adjustment agreement provides a mechanism for increasing or decreasing the membership units held by the founding members based on the acquisition or construction of new theaters or sale of theaters that are operated by each founding member and included in NCM LLC’s network. |
|
|
• |
Tax Receivable Agreement. The tax receivable agreement provides for the effective payment by NCM, Inc. to the founding members of 90% of the amount of cash savings, if any, in U.S. federal, state and local income tax or franchise tax that is actually realized as a result of certain increases in NCM, Inc.’s proportionate share of tax basis in NCM LLC’s tangible and intangible assets resulting from the IPO and related transactions. |
|
|
• |
Software License Agreement. At the date of the Company’s IPO, NCM LLC was granted a perpetual, royalty-free license from the founding members to use certain proprietary software that existed at the time for the delivery of digital advertising and other content through the DCN to screens in the U.S. NCM LLC has made improvements to this software since the IPO date and NCM LLC owns those improvements, except for improvements that were developed jointly by NCM LLC and the founding members, if any. |
Following is a summary of the transactions between the Company and the founding members (in millions):
|
|
|
Years Ended |
|
|||||||||
|
Included in the Consolidated Statements of Income: |
|
December 29, 2016 |
|
|
December 31, 2015 |
|
|
January 1, 2015 |
|
|||
|
Revenue: |
|
|
|
|
|
|
|
|
|
|
|
|
|
Beverage concessionaire revenue (included in advertising revenue) (1) |
|
$ |
28.7 |
|
|
$ |
30.0 |
|
|
$ |
38.4 |
|
|
Advertising inventory revenue (included in advertising revenue) (2) |
|
|
0.4 |
|
|
|
0.2 |
|
|
|
0.3 |
|
|
Operating expenses: |
|
|
|
|
|
|
|
|
|
|
|
|
|
Theater access fee (3) |
|
|
75.1 |
|
|
|
72.5 |
|
|
|
70.6 |
|
|
Purchase of movie tickets and concession products and rental of theater space (included in selling and marketing costs) (4) |
|
|
1.6 |
|
|
|
1.2 |
|
|
|
0.9 |
|
|
Purchase of movie tickets and concession products and rental of theater space (included in other administrative and other costs) |
|
|
0.1 |
|
|
|
0.1 |
|
|
|
0.1 |
|
|
Non-operating expenses: |
|
|
|
|
|
|
|
|
|
|
|
|
|
Interest income from notes receivable (included in interest income) (5) |
|
|
0.8 |
|
|
|
1.0 |
|
|
|
1.2 |
|
F-23
NATIONAL CINEMEDIA, INC. AND SUBSIDIARY
NOTES TO CONSOLIDATED FINANCIAL STATEMENTS
|
|
ESA. For the first six months of 2015 and for the year January 1, 2015, all of the founding members purchased 60 seconds of on-screen advertising time. |
|
|
(2) |
The value of such purchases is calculated by reference to NCM LLC’s advertising rate card. |
|
|
(3) |
Comprised of payments per theater attendee, payments per digital screen with respect to the founding member theaters included in the Company’s network and payments for access to higher quality digital cinema equipment. |
|
|
(4) |
Used primarily for marketing to NCM LLC’s advertising clients. |
|
|
(5) |
Refer to the discussion of the Fathom Events sale under AC JV, LLC transactions below. |
|
|
|
As of |
|
|||||
|
Included in the Consolidated Balance Sheets: |
|
December 29, 2016 |
|
|
December 31, 2015 |
|
||
|
Current portion of note receivable - founding members (1) |
|
$ |
5.6 |
|
|
$ |
4.2 |
|
|
Long-term portion of note receivable - founding members (1) |
|
|
8.3 |
|
|
|
12.5 |
|
|
Interest receivable on notes receivable (included in other current assets) |
|
|
0.3 |
|
|
|
— |
|
|
Common unit adjustments, net of amortization and integration payments (included in intangible assets) |
|
|
529.9 |
|
|
|
535.9 |
|
|
Current payable to founding members under tax receivable agreement |
|
|
18.4 |
|
|
|
26.2 |
|
|
Long-term payable to founding members under tax receivable agreement |
|
|
143.4 |
|
|
|
140.3 |
|
|
|
(1) |
Refer to the discussion of the Fathom Events sale under AC JV, LLC transactions below. |
At the date of the Company’s IPO, NCM LLC was granted a perpetual, royalty-free license from the founding members to use certain proprietary software that existed at the time for the delivery of digital advertising and other content through the DCN to screens in the U.S. NCM LLC has made improvements to this software since the IPO date and NCM LLC owns those improvements, except for improvements that were developed jointly by NCM LLC and the founding members, if any.
On March 16, 2015, the Company announced the termination of the Merger Agreement with Screenvision. After the Merger Agreement was terminated, NCM LLC reimbursed NCM, Inc. for certain expenses pursuant to an indemnification agreement among NCM LLC, NCM, Inc. and the founding members. On March 17, 2015, NCM LLC paid Screenvision an approximate $26.8 million termination payment on behalf of NCM, Inc. During the year ended December 31, 2015, NCM LLC also either paid directly or reimbursed NCM, Inc. for the legal and other merger-related costs of approximately $15.0 million ($7.5 million incurred by NCM, Inc. during the year ended January 1, 2015 and approximately $7.5 million incurred by NCM LLC during the year ended December 31, 2015). The Company and the founding members each bore a pro rata portion of the termination fee and the related merger expenses based on their aggregate ownership percentages in NCM LLC when the expenses were incurred.
Pursuant to the terms of the NCM LLC Operating Agreement in place since the completion of the IPO, NCM LLC is required to make mandatory distributions on a proportionate basis to its members of available cash, as defined in the NCM LLC Operating Agreement, on a quarterly basis in arrears. Mandatory distributions for the years ended December 29, 2016, December 31, 2015 and January 1, 2015 are as follows (in millions):
|
|
|
Years Ended |
|
|||||||||
|
|
|
December 29, 2016 |
|
|
December 31, 2015 |
|
|
January 1, 2015 |
|
|||
|
AMC |
|
$ |
23.6 |
|
|
$ |
23.8 |
|
|
$ |
21.9 |
|
|
Cinemark |
|
|
25.4 |
|
|
|
28.7 |
|
|
|
28.0 |
|
|
Regal |
|
|
26.1 |
|
|
|
29.6 |
|
|
|
29.5 |
|
|
Total founding members |
|
|
75.1 |
|
|
|
82.1 |
|
|
|
79.4 |
|
|
NCM, Inc. |
|
|
57.5 |
|
|
|
66.4 |
|
|
|
67.0 |
|
|
Total |
|
$ |
132.6 |
|
|
$ |
148.5 |
|
|
$ |
146.4 |
|
F-24
NATIONAL CINEMEDIA, INC. AND SUBSIDIARY
NOTES TO CONSOLIDATED FINANCIAL STATEMENTS
Due to the merger termination fee and related merger expenses, the mandatory distributions of available cash by NCM LLC to its founding members and NCM, Inc. for the three months ended April 2, 2015 was calculated as negative $25.5 million ($14.0 million for the founding members and $11.5 million for NCM, Inc.). Therefore, there was no payment made in the second quarter of 2015. Under the terms of the NCM LLC Operating Agreement, this negative amount was netted against the available cash distributions for the second quarter of 2016. The mandatory distributions of available cash by NCM LLC to its founding members for the quarter ended December 29, 2016 of $39.9 million, is included in amounts due to founding members in the Consolidated Balance Sheets as of December 29, 2016 and will be made in the first quarter of 2017. The distributions to NCM, Inc. are eliminated in consolidation.
Amounts due to founding members as of December 29, 2016 were comprised of the following (in millions):
|
|
|
AMC |
|
|
Cinemark |
|
|
Regal |
|
|
Total |
|
||||
|
Theater access fees, net of beverage revenues |
|
$ |
1.6 |
|
|
$ |
0.9 |
|
|
$ |
1.4 |
|
|
$ |
3.9 |
|
|
Cost and other reimbursement |
|
|
(0.7 |
) |
|
|
(0.4 |
) |
|
|
— |
|
|
|
(1.1 |
) |
|
Distributions payable to founding members |
|
|
12.3 |
|
|
|
13.6 |
|
|
|
14.0 |
|
|
|
39.9 |
|
|
Total |
|
$ |
13.2 |
|
|
$ |
14.1 |
|
|
$ |
15.4 |
|
|
$ |
42.7 |
|
Amounts due to founding members as of December 31, 2015 were comprised of the following (in millions):
|
|
|
AMC |
|
|
Cinemark |
|
|
Regal |
|
|
Total |
|
||||
|
Theater access fees, net of beverage revenues |
|
$ |
1.8 |
|
|
$ |
1.0 |
|
|
$ |
1.5 |
|
|
$ |
4.3 |
|
|
Cost and other reimbursement |
|
|
(0.9 |
) |
|
|
(0.3 |
) |
|
|
— |
|
|
|
(1.2 |
) |
|
Distributions payable to founding members |
|
|
10.2 |
|
|
|
10.9 |
|
|
|
11.3 |
|
|
|
32.4 |
|
|
Total |
|
$ |
11.1 |
|
|
$ |
11.6 |
|
|
$ |
12.8 |
|
|
$ |
35.5 |
|
Common Unit Membership Redemption— The NCM LLC Operating Agreement provides a redemption right of the founding members to exchange common membership units of NCM LLC for shares of the Company’s common stock on a one-for-one basis, or at the Company’s option, a cash payment equal to the market price of one share of NCM, Inc. common stock. During the fourth quarter of 2015, AMC exercised the redemption right of an aggregate 200,000 common membership units for a like number of shares of NCM, Inc.’s common stock. These shares were not sold and as of December 29, 2016 AMC owned 200,000 shares of NCM, Inc. common stock. During the year ended December 29, 2016, AMC received a cash dividend of $0.2 million on these shares of NCM, Inc. common stock. Pursuant to ASC 810-10-45, the Company accounted for the change in its ownership interest in NCM LLC from these redemptions as equity transactions and no gain or loss was recognized in the Consolidated Statements of Income. During the year ended December 31, 2015, the Company recorded deferred tax assets of $1.4 million for its additional ownership interest in NCM LLC as a result of these redemptions to reflect the tax effective difference between the tax basis and the book basis, the majority of which will be amortized over a 15-year period for federal income tax purposes. In addition, the Company recorded an increase of $0.7 million during the year ended December 31, 2015 in its long-term payable to founding members for the estimated payment to the founding members of 90% of the amount of cash savings, if any, in U.S. federal, state and local income tax or franchise tax that the Company expects to realize as a result of the deferred tax asset, which is recorded at its present value. The discount on this liability is a temporary difference that resulted in an additional $0.2 million deferred tax liability during the year ended December 31, 2015.
F-25
NATIONAL CINEMEDIA, INC. AND SUBSIDIARY
NOTES TO CONSOLIDATED FINANCIAL STATEMENTS
As discussed within Item 7—“Management’s Discussion and Analysis of Financial Condition and Results of Operations” included elsewhere in this document, AMC and the DOJ entered into a settlement regarding certain actions that AMC must take in order to complete its acquisition of Carmike. Among those, AMC is required to divest the majority of its equity interests in NCM LLC, so that by June 20, 2019 it owns no more than 4.99% of NCM LLC’s outstanding membership units. AMC was also required to relinquish its governance rights in NCM LLC, including its seats on the NCM, Inc. Board of Directors as well as its rights to nominate any person to serve on the NCM, Inc. Board of Directors. As of December 29, 2016, AMC’s non-independent designee to the Board of Directors had resigned. Further, AMC is required to change the pre-show advertising provider for 24 identified theaters comprising 384 screens from NCM LLC to Screenvision or sell those theaters to a non-NCM network buyer. Seven of those 24 theaters either did not have a cinema advertising provider, they were already being sold by AMC or it was an encumbered theater that we were receiving integration payment for, such that 17 of the 24 theaters currently need to be transferred or sold. AMC is also required to divest 15 AMC or Carmike theaters covering 15 local markets. As of the date of this filing, the Company is not aware which of those 15 theaters will be in the Company’s network or if they would be sold to another founding member or network affiliate. These theater transfers or sales represent approximately 2% of NCM LLC’s total network of theaters as of December 29, 2016. AMC may choose to have common membership units redeemed, and NCM, Inc. may elect to redeem through either a cash payment or the issuance of shares of its common stock on a one-for-one basis. Further, the sale of AMC theaters or transfer of advertising on those theaters, may require AMC to transfer and surrender, and NCM LLC to cancel, common membership units related to the theater dispositions.
AC JV, LLC Transactions— In December 2013, NCM LLC sold its Fathom Events business to a newly formed limited liability company (“AC JV, LLC”) owned 32% by each of the founding members and 4% by NCM LLC. In consideration for the sale, NCM LLC received a total of $25.0 million in promissory notes from its founding members (one-third or approximately $8.3 million from each founding member). The notes receivable bear interest at a fixed rate of 5.0% per annum, compounded annually. Interest and principal payments are due annually in six equal installments commencing on the first anniversary of the closing. Future minimum principal payments under the notes receivable as of December 29, 2016 are approximately as follows (in millions):
|
Year |
|
Minimum Principal Payments |
|
|
|
2017 |
|
$ |
5.6 |
|
|
2018 |
|
|
4.2 |
|
|
2019 |
|
|
4.1 |
|
|
Total |
|
$ |
13.9 |
|
NCM LLC’s investment in AC JV, LLC was $1.0 million and $1.2 million as of December 29, 2016 and December 31, 2015, respectively. The Company accounts for its investment in AC JV, LLC under the equity method of accounting in accordance with ASC 323-30, Investments—Equity Method and Joint Ventures (“ASC 323-30”) because AC JV, LLC is a limited liability company with the characteristics of a limited partnership and ASC 323-30 requires the use of equity method accounting unless the Company’s interest is so minor that it would have virtually no influence over partnership operating and financial policies. Although NCM LLC does not have a representative on AC JV, LLC’s Board of Directors or any voting, consent or blocking rights with respect to the governance or operations of AC JV, LLC, the Company concluded that its interest was more than minor. During the years ended December 29, 2016, December 31, 2015 and January 1, 2015, NCM LLC received a cash distribution from AC JV, LLC of $0.2 million, $0.2 million and $0.0 million, respectively. NCM LLC recorded equity in earnings for AC JV, LLC of $0.0 million, $0.1 million and $0.2 million during the years ended December 29, 2016, December 31, 2015 and January 1, 2015, respectively, which are included in other non-operating expense in the audited Consolidated Statements of Income.
In connection with the sale, NCM LLC amended and restated its existing ESAs with each of the founding members to remove those provisions addressing the rights and obligations related to the digital programming services of the Fathom Events business. These rights and obligations were conveyed to AC JV, LLC in connection with the sale. In connection with the sale, NCM LLC entered into a transition services agreement to provide certain corporate overhead services for a fee and reimbursement for the use of facilities and certain services including creative, technical event management and event management for the newly formed limited liability company. In addition, NCM LLC entered into a services agreement with a term coinciding with the ESAs, which grants the newly formed limited liability company advertising on-screen and on the LEN and a pre-feature program prior to Fathom events reasonably consistent with what was previously dedicated to Fathom. NCM LLC has also agreed to provide creative and media production services for a fee. NCM LLC received $0.2 million,
F-26
NATIONAL CINEMEDIA, INC. AND SUBSIDIARY
NOTES TO CONSOLIDATED FINANCIAL STATEMENTS
$0.1 million and $0.2 million during the years ended December 29, 2016, December 31, 2015 and January 1, 2015, respectively, for these services, which are included as an offset to network costs in the audited Consolidated Statements of Income.
Related Party Affiliates— NCM LLC has an agreement with LA Live, an affiliate of The Anschutz Corporation to provide in-theater advertising. The Anschutz Corporation is a wholly-owned subsidiary of the Anschutz Company, which is the controlling stockholder of Regal. During the years ended December 29, 2016, December 31, 2015 and January 1, 2015, there was approximately $0.3 million, $0.2 million and $0.2 million, respectively, included in advertising operating costs related to LA Live, and there was approximately $0.1 million and $0.1 million of accounts payable with this company as of December 29, 2016 and December 31, 2015, respectively.
Other Transactions— NCM LLC had an agreement with an interactive media company to sell some of its online inventory. One of NCM, Inc.’s directors is also a director of this media company. During the years ended December 29, 2016, December 31, 2015 and January 1, 2015, this company generated approximately $0.0 million, $0.0 million and $0.3 million, respectively, in revenue for NCM LLC and there was approximately $0.0 million and $0.3 million, respectively, of accounts receivable due from this company as of December 29, 2016 and December 31, 2015.
NCM LLC has an agreement with AEG Live, an affiliate of The Anschutz Corporation, for AEG Live to showcase musical artists in the FirstLook pre-show. During the years ended December 29, 2016, December 31, 2015 and January 1, 2015, NCM LLC received approximately $1.7 million, $1.6 million and $0.7 million, respectively, in revenue from AEG Live and as of December 29, 2016 and December 31, 2015, had $0.2 million and $0.4 million, respectively, of accounts receivable from AEG Live.
|
9. |
BORROWINGS |
The following table summarizes NCM LLC’s total outstanding debt as of December 29, 2016 and December 31, 2015 and the significant terms of its borrowing arrangements:
|
|
|
Outstanding Balance as of |
|
|
|
|
|
|
|
|||||
|
Borrowings ($ in millions) |
|
December 29, 2016 |
|
|
December 31, 2015 |
|
|
Maturity Date |
|
Interest Rate |
|
|||
|
Revolving credit facility |
|
$ |
15.0 |
|
|
$ |
66.0 |
|
|
November 26, 2019 |
|
(1) |
|
|
|
Term loans |
|
|
270.0 |
|
|
|
270.0 |
|
|
November 26, 2019 |
|
(1) |
|
|
|
Senior unsecured notes due 2021 |
|
|
— |
|
|
|
200.0 |
|
|
July 15, 2021 |
|
|
7.875% |
|
|
Senior secured notes due 2022 |
|
|
400.0 |
|
|
|
400.0 |
|
|
April 15, 2022 |
|
|
6.000% |
|
|
Senior unsecured notes due 2026 |
|
|
250.0 |
|
|
|
— |
|
|
August 15, 2026 |
|
|
5.750% |
|
|
Total borrowings |
|
$ |
935.0 |
|
|
$ |
936.0 |
|
|
|
|
|
|
|
|
Less: Debt issuance costs related to term loans and senior notes |
|
|
(10.7 |
) |
|
|
(10.6 |
) |
|
|
|
|
|
|
|
Carrying value of long-term debt |
|
$ |
924.3 |
|
|
$ |
925.4 |
|
|
|
|
|
|
|
|
(1) |
The interest rates on the revolving credit facility and term loan are described below. |
Senior Secured Credit Facility – As of December 29, 2016, NCM LLC’s senior secured credit facility consisted of a $175.0 million revolving credit facility and a $270.0 million term loan. On May 26, 2016, NCM LLC entered into an incremental amendment of its senior secure credit facility whereby the revolving credit facility was increased $40.0 million from $135.0 million to $175.0 million. On June 18, 2014, NCM LLC entered into an incremental amendment of its senior secured credit facility whereby the revolving credit facility was increased by $25.0 million. In addition, on July 2, 2014, NCM LLC entered into an amendment of its senior secured credit facility whereby the maturity date was extended by two years to November 26, 2019, which corresponds to the maturity date of the $270 million term loans. The obligations under the senior secured credit facility are secured by a lien on substantially all of the assets of NCM LLC.
Revolving Credit Facility – The revolving credit facility portion of NCM LLC’s total borrowings is available, subject to certain conditions, for general corporate purposes of NCM LLC in the ordinary course of business and for other transactions permitted under the senior secured credit facility, and a portion is available for letters of credit.
As of December 29, 2016, NCM LLC’s total availability under the $175.0 million revolving credit facility was $158.8 million, net of a $1.2 million letter of credit. The unused line fee is 0.50% per annum. Borrowings under the revolving credit facility bear interest at NCM LLC’s option of either the LIBOR index plus an applicable margin or the base rate (Prime Rate
F-27
NATIONAL CINEMEDIA, INC. AND SUBSIDIARY
NOTES TO CONSOLIDATED FINANCIAL STATEMENTS
or the Federal Funds Effective Rate, as defined in the senior secured credit facility) plus an applicable margin. The applicable margin for the revolving credit facility is determined quarterly and is subject to adjustment based upon a consolidated net senior secured leverage ratio for NCM LLC (the ratio of secured funded debt less unrestricted cash and cash equivalents, over a non-GAAP measure defined in the senior secured credit facility). The applicable margins on the revolving credit facility are the LIBOR index plus 2.00% or the base rate plus 1.00%. The weighted-average interest rate on the outstanding balance on the revolving credit facility as of December 29, 2016 was 4.55%.
Term Loans – The interest rate on the term loans is a rate chosen at NCM LLC’s option of either the LIBOR index plus 2.75% or the base rate (Prime Rate or the Federal Funds Effective Rate, as defined in the senior secured credit facility) plus 1.75%. The weighted-average interest rate on the term loans as of December 29, 2016 was 3.36%. Interest on the term loans is currently paid monthly.
The senior secured credit facility contains a number of covenants and financial ratio requirements, with which NCM LLC was in compliance at December 29, 2016, including maintaining a consolidated net senior secured leverage ratio of 6.5 times on a quarterly basis. NCM LLC is permitted to make quarterly dividend payments and other payments based on leverage ratios for NCM LLC and its subsidiaries so long as no default or event of default has occurred and continues to occur. The quarterly dividend payments and other distributions are made even if consolidated net senior secured leverage ratio is less than or equal to 6.5 times. In addition, there are no borrower distribution restrictions as long as NCM LLC’s consolidated net senior secured leverage ratio is below 6.5 times and NCM LLC is in compliance with its debt covenants. If there are limitations on the restricted payments, NCM LLC may not declare or pay any dividends, or make any payments on account of NCM LLC, or set aside assets for the retirement or other acquisition of capital stock of the borrower or any subsidiaries, or make any other distribution for obligations of NCM LLC. When these restrictions are effective, NCM LLC may still pay the services fee and reimbursable costs pursuant to terms of the management agreement. NCM LLC can also make payments pursuant to the tax receivable agreement in the amount, and at the time necessary to satisfy the contractual obligations with respect to the actual cash tax benefits payable to NCM LLC’s founding members. As of December 29, 2016, the NCM LLC’s consolidated net senior secured leverage ratio was 3.0 times (versus the covenant of 6.5 times).
Senior Unsecured Notes due 2021 – On July 5, 2011, NCM LLC completed a private placement of $200.0 million in aggregate principal amount of 7.875% Senior Unsecured Notes (the “Notes due 2021”) for which the registered exchange offering was completed on September 22, 2011. The Senior Unsecured Notes pay interest semi-annually in arrears on January 15 and July 15 of each year, which commenced January 15, 2012. On September 19, 2016, NCM LLC redeemed its Notes due 2021 at a redemption price of 103.938% of the principal amount plus accrued and unpaid interest. As a result of the redemption, NCM LLC wrote-off approximately $2.5 million in unamortized debt issuance costs and paid a redemption premium of approximately $7.9 million, which are reflected in the loss on early retirement of debt on the Consolidated Statements of Income during the year ended December 29, 2016.
Senior Secured Notes due 2022 – On April 27, 2012, NCM LLC completed a private placement of $400.0 million in aggregate principal amount of 6.00% Senior Secured Notes (the “Notes due 2022”) for which the registered exchange offering was completed on November 26, 2012. The Notes due 2022 pay interest semi-annually in arrears on April 15 and October 15 of each year, which commenced October 15, 2012. The Notes due 2022 are senior secured obligations of NCM LLC, rank the same as NCM LLC’s senior secured credit facility, subject to certain exceptions, and share in the same collateral that secures NCM LLC’s obligations under the senior secured credit facility.
NCM LLC may redeem all or any portion of the Notes due 2022, at once or over time, on or after April 15, 2017 at specified redemption prices, plus accrued and unpaid interest, if any, to the redemption date. Upon the occurrence of a Change of Control (as defined in the Indenture), NCM LLC will be required to make an offer to each holder of Notes due 2022 to repurchase all of such holder’s Notes due 2022 for a cash payment equal to 101.00% of the aggregate principal amount of the Notes due 2022 repurchased, plus accrued and unpaid interest, if any, to the date of repurchase.
The indenture contains covenants that, among other things, restrict NCM LLC’s ability and the ability of its restricted subsidiaries, if any, to: (1) incur additional debt; (2) make distributions or make certain other restricted payments; (3) make investments; (4) incur liens; (5) sell assets or merge with or into other companies; and (6) enter into transactions with affiliates. All of these restrictive covenants are subject to a number of important exceptions and qualifications. In particular, NCM LLC has the ability to distribute all of its quarterly available cash as a restricted payment or as an investment, if it meets a minimum net senior secured leverage ratio. NCM LLC was in compliance with these non-maintenance covenants as of December 29, 2016.
Senior Unsecured Notes due 2026—On August 19, 2016, NCM LLC completed a private placement of $250.0 million in aggregate principal amount of 5.750% Senior Unsecured Notes (the “Notes due 2026”) for which the registered exchange
F-28
NATIONAL CINEMEDIA, INC. AND SUBSIDIARY
NOTES TO CONSOLIDATED FINANCIAL STATEMENTS
offering was completed on November 8, 2016. The Notes due 2026 pay interest semi-annually in arrears on February 15 and August 15 of each year, commencing on February 15, 2017. The Notes due 2026 were issued at 100% of the face amount thereof and are the senior unsecured obligations of NCM LLC and will be effectively subordinated to all existing and future secured debt, including the Notes due 2022, its senior secured credit facility and any future asset backed loan facility. The Notes due 2026 will rank equally in right of payment with all of NCM LLC’s existing and future senior indebtedness, including the Notes due 2022, NCM LLC’s existing senior secured credit facility, any future asset backed loan facility, in each case, without giving effect to collateral arrangements. The Notes due 2026 will be effectively subordinated to all liabilities of any subsidiaries that NCM LLC may form or acquire in the future, unless those subsidiaries become guarantors of the Notes due 2026. NCM LLC does not currently have any subsidiaries, and the Notes due 2026 will not be guaranteed by any subsidiaries that NCM LLC may form or acquire in the future except in very limited circumstances.
NCM LLC may redeem all or any portion of the Notes due 2026 prior to August 15, 2021, at once or over time, at 100% of the principal amount plus the applicable make-whole premium, plus accrued and unpaid interest, if any, to the redemption date. NCM LLC may redeem all or any portion of the Notes due 2026, at once or over time, on or after August 15, 2021 at specified redemption prices, plus accrued and unpaid interest, if any, to the redemption date. In addition, at any time prior to August 15, 2019, NCM LLC may on any one or more occasions redeem up to 35% of the original aggregate principal amount of Notes due 2026 from the net proceeds of certain equity offerings at a redemption price equal to 105.750% of the principal amount of Notes due 2026 redeemed, plus accrued and unpaid interest, if any to the redemption date. Upon the occurrence of a Change of Control (as defined in the indenture), NCM LLC will be required to make an offer to each holder of Notes due 2026 to repurchase all of such holder’s Notes due 2026 for a cash payment equal to 101.00% of the aggregate principal amount of the Notes due 2026 repurchased, plus accrued and unpaid interest, if any, to the date of repurchase.
The indenture contains covenants that, among other things, restrict NCM LLC’s ability and the ability of its restricted subsidiaries, if any, to: (1) incur additional debt; (2) make distributions or make certain other restricted payments; (3) make investments; (4) incur liens; (5) sell assets or merge with or into other companies; and (6) enter into transactions with affiliates. All of these restrictive covenants are subject to a number of important exceptions and qualifications. In particular, NCM LLC has the ability to distribute all of its quarterly available cash as a restricted payment or as an investment, if it meets a minimum net senior secured leverage ratio. NCM LLC was in compliance with these non-maintenance covenants as of December 29, 2016.
Future Maturities of Borrowings – The scheduled annual maturities on the Senior Secured Credit Facility, Notes due 2022 and Notes due 2026 as of December 29, 2016 are as follows (in millions):
|
Year |
|
Amount |
|
|
|
2017 |
|
$ |
— |
|
|
2018 |
|
|
— |
|
|
2019 |
|
|
285.0 |
|
|
2020 |
|
|
— |
|
|
2021 |
|
|
— |
|
|
Thereafter |
|
|
650.0 |
|
|
Total |
|
$ |
935.0 |
|
|
10. |
SHARE-BASED COMPENSATION |
The NCM, Inc. 2016 Equity Incentive Plan (the “2016 Plan”) reserves 4,400,000 shares of common stock available for issuance or delivery under the 2016 Plan, of which 4,371,745 shares remain available for future grants as of December 29, 2016 (assuming 100% achievement of targets on performance-based restricted stock). The Company began issuing shares under the 2016 Plan in the second quarter of 2016, following its approval by NCM, Inc.’s stockholders. The 2016 Plan replaced NCM, Inc.’s 2007 Equity Incentive Plan (the “2007 Plan”), which was set to expire by its terms in February 2017. The shares of common stock that were available for issuance under the 2007 Plan are no longer available for issuance following the approval of the 2016 Plan. Any forfeitures of shares granted pursuant to the 2007 Plan will be cancelled and not available for future grant. The types of awards that may be granted under the 2016 Plan include stock options, stock appreciation rights, restricted stock, restricted stock units or other stock based awards. Certain option and share awards provide for accelerated vesting if there is a change in control, as defined in the 2007 Plan and the 2016 Plan. Upon vesting of
F-29
NATIONAL CINEMEDIA, INC. AND SUBSIDIARY
NOTES TO CONSOLIDATED FINANCIAL STATEMENTS
the restricted stock awards or exercise of options, NCM LLC will issue common membership units to the Company equal to the number of shares of the Company’s common stock represented by such awards.
Compensation Cost—The Company recognized $18.3 million, $14.8 million and $7.7 million for the years ended December 29, 2016, December 31, 2015 and January 1, 2015, respectively, of share-based compensation expense within network costs, selling and marketing costs and administrative and other costs in the Consolidated Statements of Income as shown in the table below.
|
|
Years Ended |
|
|||||||||
|
|
December 29, 2016 |
|
|
December 31, 2015 |
|
|
January 1, 2015 |
|
|||
|
Share-based compensation costs included in network costs |
$ |
1.1 |
|
|
$ |
0.9 |
|
|
$ |
0.8 |
|
|
Share-based compensation costs included in selling and marketing costs |
|
6.0 |
|
|
|
5.5 |
|
|
|
2.8 |
|
|
Share-based compensation costs included in administrative and other costs (1) |
|
11.2 |
|
|
|
8.4 |
|
|
|
4.1 |
|
|
Total share-based compensation costs |
$ |
18.3 |
|
|
$ |
14.8 |
|
|
$ |
7.7 |
|
|
|
(1) |
Includes $2.3 million of expense associated with the modification of certain former executive equity awards during the year ended December 29, 2016, as described further below. |
During the years ended December 29, 2016, December 31, 2015 and January 1, 2015, $0.5 million, $0.3 million and $0.1 million was capitalized, respectively, in a corresponding manner to the capitalization of employee’s salaries for capitalized labor. The income tax benefit recognized in the income statement for share-based compensation was approximately $2.5 million, $2.5 million, and $1.4 million for the years ended December 29, 2016, December 31, 2015 and January 1, 2015, respectively. As of December 29, 2016, there was no unrecognized compensation cost related to unvested options, as stock options were fully vested as of December 29, 2016. As of December 29, 2016, unrecognized compensation cost related to restricted stock and restricted stock units was approximately $16.9 million, which will be recognized over a weighted average remaining period of 1.7 years.
Stock Options— The Company has not granted stock options since 2012 and as of December 29, 2016 all options are fully vested. Stock options awarded under the 2007 Plan were granted with an exercise price equal to the closing market price of NCM, Inc. common stock on the date the Company’s Board of Directors approved the grant. Options have either 10-year or 15-year contractual terms. The fair value of each option award was estimated on the date of grant using the Black-Scholes option pricing valuation model. An annual forfeiture rate of 2-3% was estimated to reflect the potential separation of employees. The intrinsic value of options exercised during the year was $0.1 million, $0.4 million and $0.2 million for the years ended December 29, 2016, December 31, 2015 and January 1, 2015, respectively. The total fair value of awards vested during the years ended December 29, 2016, December 31, 2015 and January 1, 2015 was $0.0 million, $0.7 million and $2.2 million, respectively. A summary of option award activity under the 2007 Plan as of December 29, 2016, and changes during the year then ended are presented below:
|
|
|
Options |
|
|
Weighted Average Exercise Price |
|
|
Weighted Average Remaining Contractual Life (in years) |
|
|
Aggregate Intrinsic Value (in millions) |
|
||||
|
Outstanding as of December 31, 2015 |
|
|
2,707,752 |
|
|
$ |
16.60 |
|
|
|
4.8 |
|
|
$ |
1.4 |
|
|
Granted |
|
|
— |
|
|
|
— |
|
|
|
|
|
|
|
|
|
|
Exercised |
|
|
(39,290 |
) |
|
$ |
12.92 |
|
|
|
|
|
|
|
|
|
|
Forfeited |
|
|
(93,918 |
) |
|
$ |
18.17 |
|
|
|
|
|
|
|
|
|
|
Expired |
|
|
— |
|
|
|
— |
|
|
|
|
|
|
|
|
|
|
Outstanding as of December 29, 2016 |
|
|
2,574,544 |
|
|
$ |
16.59 |
|
|
|
3.8 |
|
|
$ |
0.9 |
|
|
Exercisable as of December 29, 2016 |
|
|
2,574,544 |
|
|
$ |
16.59 |
|
|
|
3.8 |
|
|
$ |
0.9 |
|
|
Vested and expected to vest as of December 29, 2016 |
|
|
2,574,544 |
|
|
$ |
16.59 |
|
|
|
3.8 |
|
|
$ |
0.9 |
|
Restricted Stock and Restricted Stock Units—Under the non-vested stock program, common stock of the Company may be granted at no cost to officers, independent directors and employees, subject to requisite service and/or financial
F-30
NATIONAL CINEMEDIA, INC. AND SUBSIDIARY
NOTES TO CONSOLIDATED FINANCIAL STATEMENTS
performance targets. As such restrictions lapse, the award vests in that proportion. The participants are entitled to dividend equivalents and to vote their respective shares (in the case of restricted stock), although the sale and transfer of such shares is prohibited and the shares are subject to forfeiture during the restricted period. Additionally, the accrued dividend equivalents are subject to forfeiture during the restricted period should the underlying shares not vest. As of December 29, 2016 and December 31, 2015, accrued dividend equivalents totaled $3.9 million and $3.7 million, respectively and during the years ended December 29, 2016, December 31, 2015 and January 1, 2015, the Company paid $1.9 million, $0.4 million and $0.4 million, respectively, for dividend equivalents upon vesting of the restricted stock and restricted stock units. The Company has issued time-based restricted stock to its employees which vests over a three-year period with 1/3 vesting on each anniversary of the date of grant and performance-based restricted stock which vests following a three-year measurement period to the extent that the Company achieves specified non-GAAP targets at the end of the measurement period. The Company also grants restricted stock units to its non-employee directors that vest after approximately one year. The grant date fair value of restricted stock and restricted stock units is based on the closing market price of NCM, Inc. common stock on the date of grant. An annual forfeiture rate of 2-3% was estimated to reflect the potential separation of employees. The weighted average grant date fair value of non-vested stock was $15.03, $14.76, and $19.18 for the years ended December 29, 2016, December 31, 2015 and January 1, 2015, respectively. The total fair value of awards vested was $14.7 million, $11.6 million and $3.6 million during the years ended December 29, 2016, December 31, 2015 and January 1, 2015, respectively.
A summary of restricted stock award and restricted stock unit activity under the 2007 Plan and 2016 Plan as of December 29, 2016, and changes during the year then ended are presented below:
|
|
|
Number of Restricted Shares and Restricted Stock Units |
|
|
Weighted Average Grant-Date Fair Value |
|
||
|
Non-vested balance as of December 31, 2015 |
|
|
2,563,637 |
|
|
$ |
16.03 |
|
|
Granted |
|
|
1,281,053 |
|
|
|
15.03 |
|
|
Vested (1) |
|
|
(927,722 |
) |
|
|
15.96 |
|
|
Forfeited |
|
|
(326,706 |
) |
|
|
15.20 |
|
|
Non-vested balance as of December 29, 2016 |
|
|
2,590,262 |
|
|
$ |
15.66 |
|
|
|
(1) |
Includes 331,754 vested shares that were withheld to cover tax obligations and were subsequently canceled. |
The above table reflects performance-based restricted stock granted at 100% achievement of performance conditions and as such does not reflect the maximum or minimum number of shares of performance-based restricted stock contingently issuable. An additional 588,401 shares of restricted stock could be issued if the performance criteria maximums are met. As of December 29, 2016, the total number of restricted stock and restricted stock units that are ultimately expected to vest, after consideration of expected forfeitures and current projections of estimated vesting of performance-based restricted stock is 2,491,043 shares.
Executive Equity Modification—On January 1, 2016, the Company’s former Chief Executive Officer resigned and in connection with his resignation, NCM, Inc. entered into a Separation and General Release Agreement and a Consulting Agreement, whereby, the executive will continue to perform consulting services through January 31, 2018 and certain modifications were made to the executive’s outstanding stock awards. The executive’s outstanding stock options were modified such that the timeframe to exercise the options was extended to the original expiration date and certain performance-based restricted stock awards were converted to time-based restricted stock, with all restricted stock continuing to vest during the consulting period.
Per ASC Topic 718-10-35-3, a modification of the terms or conditions of an equity award shall be treated as an exchange of the original award for a new award. The effects of a modification should be measured as follows: (a) incremental compensation cost shall be measured as the excess, if any, of the fair value of the modified award over the fair value of the original award immediately before its terms are modified, (b) total recognized compensation cost for an equity shall at least equal the fair value of the award at the grant date unless at the date of the modification the performance or service conditions of the original award are not expected to be satisfied and (c) a change in compensation cost for an equity award measured at intrinsic value shall be measured by comparing the intrinsic value of the modified award, if any, with the intrinsic value of the original award, if any, immediately before the modification. These modifications resulted in compensation expense of $2.3 million during the year ended December 29, 2016. Further, the Company continues to recognize share-based compensation costs on the awards related to service during the consulting period and re-measures the
F-31
NATIONAL CINEMEDIA, INC. AND SUBSIDIARY
NOTES TO CONSOLIDATED FINANCIAL STATEMENTS
fair value of the outstanding awards at each reporting period during the term of the consulting services, in accordance with ASC Topic 505-50, Equity-Based Payments to Non-Employees.
|
11. |
EMPLOYEE BENEFIT PLANS |
The Company sponsors the NCM 401(k) Profit Sharing Plan (the “Plan”) under Section 401(k) of the Internal Revenue Code of 1986, as amended, for the benefit of substantially all full-time employees. The Plan provides that participants may contribute up to 20% of their compensation, subject to Internal Revenue Service limitations. Employee contributions are invested in various investment funds based upon election made by the employee. The Company made discretionary contributions of $1.3 million, $1.3 million and $1.0 million during the years ended December 29, 2016, December 31, 2015 and January 1, 2015, respectively.
|
12. |
COMMITMENTS AND CONTINGENCIES |
Legal Actions—The Company is subject to claims and legal actions in the ordinary course of business. The Company believes such claims will not have a material effect, individually and in aggregate, on its financial position, results of operations or cash flows.
Operating Commitments— The Company leases office facilities for its headquarters in Centennial, Colorado and also in various cities for its sales and marketing and software development personnel. Total lease expense for the years ended December 29, 2016, December 31, 2015 and January 1, 2015, was $2.3 million, $2.3 million and $2.2 million, respectively. Future minimum lease payments under noncancelable operating leases as of December 29, 2016 are as follows (in millions):
|
Year |
|
Minimum Lease Payments |
|
|
|
2017 |
|
$ |
3.2 |
|
|
2018 |
|
|
3.2 |
|
|
2019 |
|
|
3.2 |
|
|
2020 |
|
|
3.0 |
|
|
2021 |
|
|
2.2 |
|
|
Thereafter |
|
|
15.5 |
|
|
Total |
|
$ |
30.3 |
|
Minimum Revenue Guarantees—As part of the network affiliate agreements entered into in the ordinary course of business under which the Company sells advertising for display in various network affiliate theater chains, the Company has agreed to certain minimum revenue guarantees on a per attendee basis. If a network affiliate achieves the attendance set forth in their respective agreement, the Company has guaranteed minimum revenue for the network affiliate per attendee if such amount paid under the revenue share arrangement is less than its guaranteed amount. The amount and term varies for each network affiliate, but terms range from three to twenty years, prior to any renewal periods of which some are at the option of the Company. As of December 29, 2016, the maximum potential amount of future payments the Company could be required to make pursuant to the minimum revenue guarantees is $39.9 million over the remaining terms of the network affiliate agreements, which calculation does not include any potential extensions offered subsequent to December 29, 2016. As of December 29, 2016 and December 31, 2015, the Company had no liabilities recorded for these obligations, as such guarantees are less than the expected share of revenue paid to the affiliate.
Theater Access Fee Guarantees—In consideration for NCM LLC’s access to the founding members’ theater attendees for on-screen advertising and use of lobbies and other space within the founding members’ theaters for the LEN and lobby promotions, the founding members receive a monthly theater access fee under the ESAs. The theater access fee is composed of a fixed payment per patron, a fixed payment per digital screen (connected to the DCN) and a fee for access to higher quality digital cinema equipment. The payment per theater patron increases by 8% every five years, with the next increase taking effect for fiscal year 2017, and the payment per digital screen and for digital cinema equipment increases annually by 5%. The theater access fee paid in the aggregate to all founding members cannot be less than 12% of NCM LLC’s aggregate advertising revenue (as defined in the ESA), or it will be adjusted upward to reach this minimum payment. As of December 29, 2016 and December 31, 2015, the Company had no liabilities recorded for the minimum payment, as the theater access fee was in excess of the minimum.
F-32
NATIONAL CINEMEDIA, INC. AND SUBSIDIARY
NOTES TO CONSOLIDATED FINANCIAL STATEMENTS
Non-Recurring Measurements—Certain assets are measured at fair value on a non-recurring basis. These assets are not measured at fair value on an ongoing basis but are subject to fair value adjustments in certain circumstances. These assets include long-lived assets, intangible assets, cost and equity method investments, notes receivable and borrowings.
Long-Lived Assets, Intangible Assets, Other Investments and Notes Receivable —As described in Note 1—Basis of Presentation and Summary of Significant Accounting Policies, the Company regularly reviews long-lived assets (primarily property, plant and equipment), intangible assets, investments accounted for under the cost or equity method and notes receivable for impairment whenever events or changes in circumstances indicate that the carrying amounts of the assets may not be fully recoverable. When the estimated fair value is determined to be lower than the carrying value of the asset, an impairment charge is recorded to write the asset down to its estimated fair value.
As of December 29, 2016 and December 31, 2015, the Company had other investments of $6.6 million and $5.4 million, respectively. The fair value of these investments has not been estimated as of December 29, 2016 as there were no identified events or changes in the circumstances that had a significant adverse effect on the fair value of the investments and it is not practicable to do so because the equity securities are not in publicly traded companies. The investment in AC JV was initially valued using comparative market multiples. The other investments were recorded based upon the fair value of the services provided in exchange for the investment. Refer to Note 1—Basis of Presentation and Summary of Significant Accounting Policies for more details. As the inputs to the determination of fair value are based upon non-identical assets and use significant unobservable inputs, they have been classified as Level 3 in the fair value hierarchy.
As of December 29, 2016, the Company had notes receivable totaling $13.9 million from its founding members related to the sale of Fathom Events, as described in Note 8—Related Party Transactions. These notes were initially valued using comparative market multiples. There were no identified events or changes in circumstances that had a significant adverse effect on the fair value of the notes receivable. The notes are classified as Level 3 in the fair value hierarchy as the inputs to the determination of fair value are based upon non-identical assets and use significant unobservable inputs.
Borrowings— The carrying amount of the revolving credit facility is considered a reasonable estimate of fair value due to its floating-rate terms. The estimated fair values of the Company’s financial instruments where carrying values do not approximate fair value are as follows (in millions):
|
|
|
As of December 29, 2016 |
|
|
As of December 31, 2015 |
|
||||||||||
|
|
|
Carrying Value |
|
|
Fair Value (1) |
|
|
Carrying Value |
|
|
Fair Value (1) |
|
||||
|
Term loans |
|
$ |
270.0 |
|
|
$ |
272.7 |
|
|
$ |
270.0 |
|
|
$ |
269.3 |
|
|
Senior Notes due 2021 |
|
|
— |
|
|
|
— |
|
|
|
200.0 |
|
|
|
208.4 |
|
|
Senior Notes due 2022 |
|
|
400.0 |
|
|
|
414.5 |
|
|
|
400.0 |
|
|
|
414.5 |
|
|
Senior Notes due 2026 |
|
|
250.0 |
|
|
|
256.7 |
|
|
|
— |
|
|
|
— |
|
|
|
(1) |
The Company has estimated the fair value on an average of at least two non-binding broker quotes and the Company’s analysis. If the Company were to measure the borrowings in the above table at fair value on the balance sheet they would be classified as Level 2. |
Recurring Measurements—The fair values of the Company’s assets and liabilities measured on a recurring basis pursuant to ASC 820-10 Fair Value Measurements and Disclosures are as follows (in millions):
|
|
|
|
|
|
|
Fair Value Measurements at Reporting Date Using |
|
|||||||||
|
|
|
Fair Value As of December 29, 2016 |
|
|
Quoted Prices in Active Markets for Identical Assets (Level 1) |
|
|
Significant Other Observable Inputs (Level 2) |
|
|
Significant Unobservable Inputs (Level 3) |
|
||||
|
ASSETS: |
|
|
|
|
|
|
|
|
|
|
|
|
|
|
|
|
|
Cash equivalents (1) |
|
$ |
5.3 |
|
|
$ |
0.3 |
|
|
$ |
5.0 |
|
|
$ |
— |
|
|
Short-term marketable securities (2) |
|
|
26.1 |
|
|
|
5.2 |
|
|
|
20.9 |
|
|
|
— |
|
|
Long-term marketable securities (2) |
|
|
19.6 |
|
|
|
17.3 |
|
|
|
2.3 |
|
|
|
— |
|
|
Total assets |
|
$ |
51.0 |
|
|
$ |
22.8 |
|
|
$ |
28.2 |
|
|
$ |
— |
|
F-33
NATIONAL CINEMEDIA, INC. AND SUBSIDIARY
NOTES TO CONSOLIDATED FINANCIAL STATEMENTS
|
|
|
|
|
|
|
Fair Value Measurements at Reporting Date Using |
|
|||||||||
|
|
|
Fair Value As of December 31, 2015 |
|
|
Quoted Prices in Active Markets for Identical Assets (Level 1) |
|
|
Significant Other Observable Inputs (Level 2) |
|
|
Significant Unobservable Inputs (Level 3) |
|
||||
|
ASSETS: |
|
|
|
|
|
|
|
|
|
|
|
|
|
|
|
|
|
Cash equivalents (1) |
|
$ |
6.4 |
|
|
$ |
6.4 |
|
|
$ |
— |
|
|
$ |
— |
|
|
Short-term marketable securities (2) |
|
|
13.2 |
|
|
|
9.5 |
|
|
|
3.7 |
|
|
|
— |
|
|
Long-term marketable securities (2) |
|
|
40.5 |
|
|
|
30.6 |
|
|
|
9.9 |
|
|
|
— |
|
|
Total assets |
|
$ |
60.1 |
|
|
$ |
46.5 |
|
|
$ |
13.6 |
|
|
$ |
— |
|
|
|
(1) |
Cash Equivalents— The Company’s cash equivalents are carried at estimated fair value. Cash equivalents consist of money market accounts which the Company has classified as Level 1 given the active market for these accounts and commercial paper with original maturities of three months or less, which are classified as Level 2 and are valued as described below. |
|
|
(2) |
Short-Term and Long-Term Marketable Securities— The carrying amount and fair value of the marketable securities are equivalent since the Company accounts for these instruments at fair value. The Company’s government agency bonds, commercial paper and certificates of deposit are valued using third party broker quotes. The value of the Company’s government agency bonds is derived from quoted market information. The inputs in the valuation are generally classified as Level 1 given the active market for these securities; however, if an active market does not exist, the inputs are recorded at a lower level in the fair value hierarchy. The value of commercial paper and certificates of deposit is derived from pricing models using inputs based upon market information, including contractual terms, market prices and yield curves. The inputs to the valuation pricing models are observable in the market, and as such are generally classified as Level 2 in the fair value hierarchy. For the years ended December 29, 2016 and December 31, 2015, there was an inconsequential amount of net realized gains (losses) recognized in interest income and an inconsequential amount of net unrealized holding gains (losses) included in other comprehensive income. Original cost of short term marketable securities is based on the specific identification method. As of December 29, 2016 and December 31, 2015, there were no gross unrealized losses related to individual securities that had been in a continuous loss position for 12 months or longer. |
F-34
NATIONAL CINEMEDIA, INC. AND SUBSIDIARY
NOTES TO CONSOLIDATED FINANCIAL STATEMENTS
The amortized cost basis, aggregate fair value and maturities of the marketable securities the Company held as of December 29, 2016 and December 31, 2015 are as follows:
|
|
|
As of December 29,2016 |
|
|||||||||
|
|
|
Amortized Cost Basis (in millions) |
|
|
Aggregate Fair Value (in millions) |
|
|
Maturities (1) (in years) |
|
|||
|
MARKETABLE SECURITIES: |
|
|
|
|
|
|
|
|
|
|
|
|
|
Short-term U.S. government treasury bonds |
|
$ |
1.2 |
|
|
$ |
1.2 |
|
|
|
0.8 |
|
|
Short-term municipal bonds |
|
|
2.9 |
|
|
|
2.9 |
|
|
|
0.6 |
|
|
Short-term U.S. government agency bonds |
|
|
1.0 |
|
|
|
1.0 |
|
|
|
0.5 |
|
|
Short-term commercial paper |
|
|
13.0 |
|
|
|
13.0 |
|
|
|
0.1 |
|
|
Short-term certificates of deposit: |
|
|
|
|
|
|
|
|
|
|
|
|
|
Financial |
|
|
7.7 |
|
|
|
7.7 |
|
|
|
0.6 |
|
|
Industrial |
|
|
0.3 |
|
|
|
0.3 |
|
|
|
0.9 |
|
|
Total short-term marketable securities |
|
|
26.1 |
|
|
|
26.1 |
|
|
|
|
|
|
|
|
|
|
|
|
|
|
|
|
|
|
|
|
Long-term municipal bonds |
|
|
1.9 |
|
|
|
1.8 |
|
|
|
2.7 |
|
|
Long-term U.S. government agency bonds |
|
|
15.6 |
|
|
|
15.5 |
|
|
|
3.5 |
|
|
Long-term certificates of deposit |
|
|
2.2 |
|
|
|
2.3 |
|
|
|
2.6 |
|
|
Total long-term marketable securities |
|
|
19.7 |
|
|
|
19.6 |
|
|
|
|
|
|
Total marketable securities |
|
$ |
45.8 |
|
|
$ |
45.7 |
|
|
|
|
|
|
|
|
As of December 31, 2015 |
|
|||||||||
|
|
|
Amortized Cost Basis (in millions) |
|
|
Aggregate Fair Value (in millions) |
|
|
Maturities (1) (in years) |
|
|||
|
MARKETABLE SECURITIES: |
|
|
|
|
|
|
|
|
|
|
|
|
|
Short-term municipal bonds |
|
$ |
9.5 |
|
|
$ |
9.5 |
|
|
|
0.4 |
|
|
Short-term certificates of deposit |
|
|
3.7 |
|
|
|
3.7 |
|
|
|
0.6 |
|
|
Total short-term marketable securities |
|
|
13.2 |
|
|
|
13.2 |
|
|
|
|
|
|
|
|
|
|
|
|
|
|
|
|
|
|
|
|
Long-term U.S. government treasury bonds |
|
|
1.2 |
|
|
|
1.2 |
|
|
|
1.8 |
|
|
Long-term municipal bonds |
|
|
1.7 |
|
|
|
1.7 |
|
|
|
1.7 |
|
|
Long-term U.S. government agency bonds |
|
|
27.9 |
|
|
|
27.7 |
|
|
|
3.4 |
|
|
Long-term certificates of deposit |
|
|
9.9 |
|
|
|
9.9 |
|
|
|
1.9 |
|
|
Total long-term marketable securities |
|
|
40.7 |
|
|
|
40.5 |
|
|
|
|
|
|
Total marketable securities |
|
$ |
53.9 |
|
|
$ |
53.7 |
|
|
|
|
|
|
|
(1) |
Maturities— Securities available for sale include obligations with various contractual maturity dates some of which are greater than one year. The Company considers the securities to be liquid and convertible to cash within 30 days. |
|
14. |
DERIVATIVE INSTRUMENTS AND HEDGING ACTIVITIES |
During 2012, NCM LLC terminated interest rate swap agreements that were used to hedge its interest rate risk associated with its term loan. Following the termination of the swap agreements, the variable interest rate on NCM LLC’s $270.0 million term loan is unhedged and as of December 29, 2016 and December 31, 2015, the Company did not have any outstanding derivative assets or liabilities. A portion of the breakage fees paid to terminate the swap agreements was for swaps in which the underlying debt remained outstanding. The balance in AOCI related to these swaps was fixed and was amortized into earnings over the remaining period during which interest payments were hedged, or February 13, 2015. The Company considered the guidance in ASC 815, Derivatives and Hedging which states that amounts in AOCI shall be reclassified into earnings in the same period or periods during which the hedged forecasted transaction affects earnings. As of December 29, 2016, there were no amounts outstanding related to these discontinued cash flow hedges.
F-35
NATIONAL CINEMEDIA, INC. AND SUBSIDIARY
NOTES TO CONSOLIDATED FINANCIAL STATEMENTS
The changes in AOCI by component for the years ended December 29, 2016, December 31, 2015 and January 1, 2015 were as follows (in millions):
|
|
Years Ended |
|
|
|
|||||||||
|
|
December 29, 2016 |
|
|
December 31, 2015 |
|
|
January 1, 2015 |
|
|
Income Statement Location |
|||
|
Balance at beginning of period |
$ |
— |
|
|
$ |
(0.4 |
) |
|
$ |
(3.2 |
) |
|
|
|
Amounts reclassified from AOCI: |
|
|
|
|
|
|
|
|
|
|
|
|
|
|
Amortization on discontinued cash flow hedges |
|
— |
|
|
|
1.6 |
|
|
|
10.0 |
|
|
Amortization of terminated derivatives |
|
Total amounts reclassified from AOCI |
|
— |
|
|
|
1.6 |
|
|
|
10.0 |
|
|
|
|
Noncontrolling interest on reclassifications |
|
— |
|
|
|
(0.9 |
) |
|
|
(5.4 |
) |
|
|
|
Tax effect on reclassifications |
|
— |
|
|
|
(0.3 |
) |
|
|
(1.8 |
) |
|
|
|
Net other comprehensive income |
|
— |
|
|
|
0.4 |
|
|
|
2.8 |
|
|
|
|
Impact of subsidiary ownership changes |
|
— |
|
|
|
— |
|
|
|
— |
|
|
|
|
Balance at end of period |
$ |
— |
|
|
$ |
— |
|
|
$ |
(0.4 |
) |
|
|
|
15. |
VALUATION AND QUALIFYING ACCOUNTS |
The Company’s allowance for doubtful accounts for the years ended December 29, 2016, December 31, 2015 and January 1, 2015 was as follows (in millions):
|
|
|
Years Ended |
|
|||||||||
|
|
|
December 29, 2016 |
|
|
December 31, 2015 |
|
|
January 1, 2015 |
|
|||
|
ALLOWANCE FOR DOUBTFUL ACCOUNTS: |
|
|
|
|
|
|
|
|
|
|
|
|
|
Balance at beginning of period |
|
$ |
5.6 |
|
|
$ |
4.3 |
|
|
$ |
5.7 |
|
|
Provision for bad debt |
|
|
2.1 |
|
|
|
1.9 |
|
|
|
(0.1 |
) |
|
Write-offs, net |
|
|
(1.4 |
) |
|
|
(0.6 |
) |
|
|
(1.3 |
) |
|
Balance at end of period |
|
$ |
6.3 |
|
|
$ |
5.6 |
|
|
$ |
4.3 |
|
|
16. |
QUARTERLY FINANCIAL DATA (UNAUDITED) |
The following represents selected information from the Company’s unaudited quarterly Consolidated Statements of Income for the years ended December 29, 2016 and December 31, 2015 (in millions, except per share data):
|
2016 |
|
First Quarter |
|
|
Second Quarter |
|
|
Third Quarter |
|
|
Fourth Quarter |
|
||||
|
Revenue |
|
$ |
76.2 |
|
|
$ |
115.4 |
|
|
$ |
113.5 |
|
|
$ |
142.5 |
|
|
Operating expenses |
|
|
70.4 |
|
|
|
68.9 |
|
|
|
65.1 |
|
|
|
70.2 |
|
|
Operating income |
|
|
5.8 |
|
|
|
46.5 |
|
|
|
48.4 |
|
|
|
72.3 |
|
|
Consolidated net (loss) income |
|
|
(8.5 |
) |
|
|
25.5 |
|
|
|
21.7 |
|
|
|
48.3 |
|
|
(Loss) Net income attributable to NCM, Inc. |
|
|
(4.3 |
) |
|
|
6.8 |
|
|
|
8.2 |
|
|
|
14.7 |
|
|
(Loss) Earnings per NCM, Inc. share, basic (1) |
|
|
(0.07 |
) |
|
|
0.11 |
|
|
|
0.14 |
|
|
|
0.24 |
|
|
(Loss) Earnings per NCM, Inc. share, diluted (1) |
|
|
(0.07 |
) |
|
|
0.11 |
|
|
|
0.13 |
|
|
|
0.24 |
|
|
2015 |
|
First Quarter |
|
|
Second Quarter |
|
|
Third Quarter |
|
|
Fourth Quarter |
|
||||
|
Revenue |
|
$ |
76.9 |
|
|
$ |
121.5 |
|
|
$ |
111.7 |
|
|
$ |
136.4 |
|
|
Operating expenses |
|
|
93.6 |
|
|
|
66.1 |
|
|
|
63.9 |
|
|
|
74.9 |
|
|
Operating (loss) income |
|
|
(16.7 |
) |
|
|
55.4 |
|
|
|
47.8 |
|
|
|
61.5 |
|
|
Consolidated net (loss) income |
|
|
(30.2 |
) |
|
|
33.3 |
|
|
|
26.9 |
|
|
|
33.7 |
|
|
(Loss) Net income attributable to NCM, Inc. |
|
|
(9.0 |
) |
|
|
10.1 |
|
|
|
7.7 |
|
|
|
6.6 |
|
|
(Loss) Earnings per NCM, Inc. share, basic (1) |
|
|
(0.15 |
) |
|
|
0.17 |
|
|
|
0.13 |
|
|
|
0.11 |
|
|
(Loss) Earnings per NCM, Inc. share, diluted (1) |
|
|
(0.15 |
) |
|
|
0.17 |
|
|
|
0.13 |
|
|
|
0.11 |
|
F-36
NATIONAL CINEMEDIA, INC. AND SUBSIDIARY
NOTES TO CONSOLIDATED FINANCIAL STATEMENTS
|
|
(1) |
Earnings per share in each quarter is computed using the weighted-average number of common shares outstanding during that quarter while earnings per share for the full year is computed using the weighted average number of common shares outstanding during the year. |
|
17. |
SUBSEQUENT EVENT |
On January 19, 2017, the Company declared a cash dividend of $0.22 per share (approximately $13.3 million) on each share of the Company’s common stock (not including outstanding restricted stock which will accrue dividends until the shares vest) to stockholders of record on March 9, 2017 to be paid on March 23, 2017.
F-37