Attached files
| file | filename |
|---|---|
| 8-K - FORM 8-K - SELECT MEDICAL HOLDINGS CORP | c97127e8vk.htm |
Exhibit 99.1
| J.P. Morgan Global High Yield & Leveraged Finance Conference March 3, 2010 |

| Disclosure This presentation may contain forward-looking statements based on current management expectations. Numerous factors, including those related to market conditions and those detailed from time-to-time in the Company's filings with the Securities and Exchange Commission, may cause results to differ materially from those anticipated in the forward-looking statements. Many of the factors that will determine the Company's future results are beyond the ability of the Company to control or predict. These statements are subject to risks and uncertainties and, therefore, actual results may differ materially. Readers should not place undue reliance on forward-looking statements, which reflect management's views only as of the date hereof. The Company undertakes no obligation to revise or update any forward-looking statements, or to make any other forward-looking statements, whether as a result of new information, future events or otherwise. All references to "Select" used throughout this presentation refer to Select Medical Holdings Corporation and its subsidiaries. |
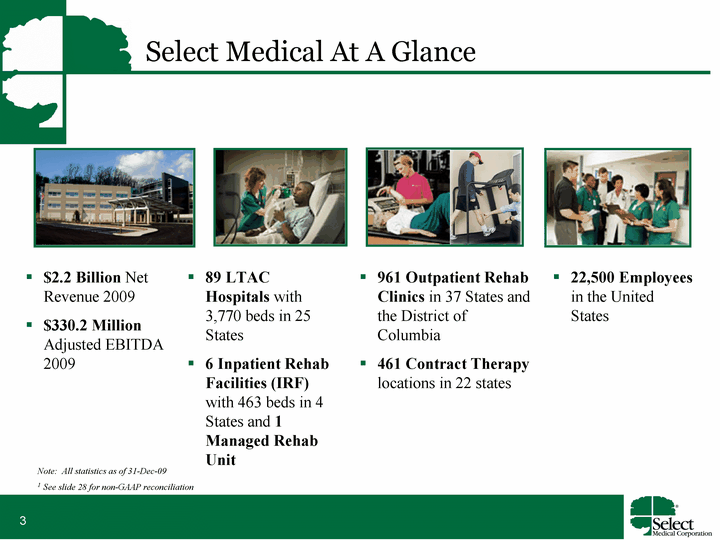
| Select Medical At A Glance 89 LTAC Hospitals with 3,770 beds in 25 States 6 Inpatient Rehab Facilities (IRF) with 463 beds in 4 States and 1 Managed Rehab Unit 961 Outpatient Rehab Clinics in 37 States and the District of Columbia 461 Contract Therapy locations in 22 states 22,500 Employees in the United States $2.2 Billion Net Revenue 2009 $330.2 Million Adjusted EBITDA 2009 Note: All statistics as of 31-Dec-09 1 See slide 28 for non-GAAP reconciliation |
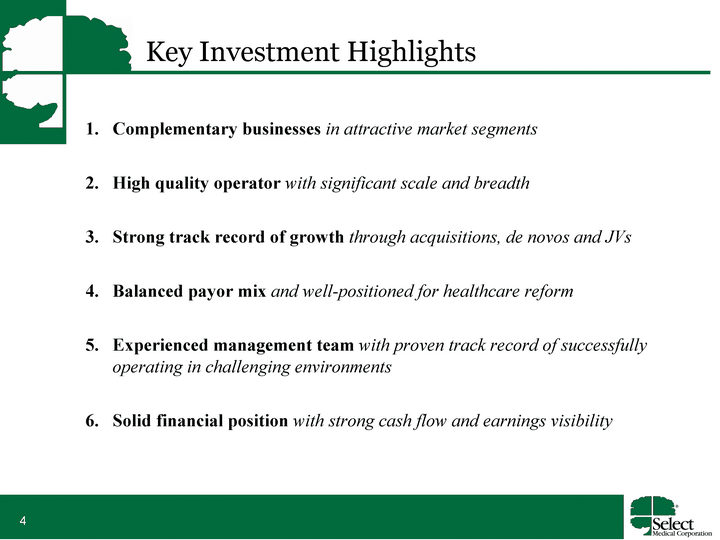
| Key Investment Highlights Complementary businesses in attractive market segments High quality operator with significant scale and breadth Strong track record of growth through acquisitions, de novos and JVs Balanced payor mix and well-positioned for healthcare reform Experienced management team with proven track record of successfully operating in challenging environments Solid financial position with strong cash flow and earnings visibility |

| Complementary Business Segments Well-Positioned in the Post-Acute Continuum of Care |
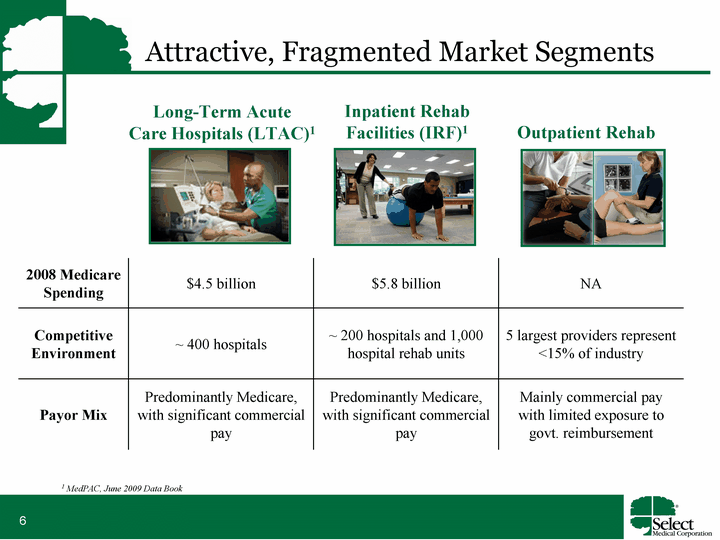
| Attractive, Fragmented Market Segments Long-Term Acute Care Hospitals (LTAC)1 Inpatient Rehab Facilities (IRF)1 Outpatient Rehab 2008 Medicare Spending $4.5 billion $5.8 billion NA Competitive Environment ~ 400 hospitals ~ 200 hospitals and 1,000 hospital rehab units 5 largest providers represent <15% of industry Payor Mix Predominantly Medicare, with significant commercial pay Predominantly Medicare, with significant commercial pay Mainly commercial pay with limited exposure to govt. reimbursement 1 MedPAC, June 2009 Data Book |
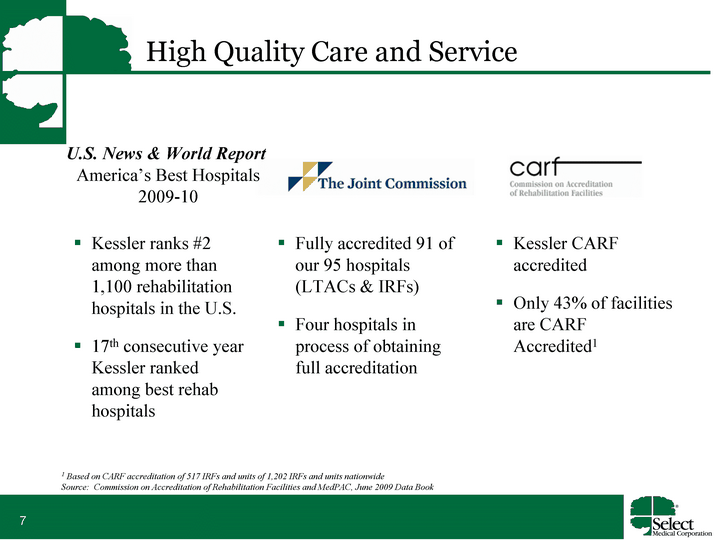
| High Quality Care and Service Fully accredited 91 of our 95 hospitals (LTACs & IRFs) Four hospitals in process of obtaining full accreditation Kessler CARF accredited Only 43% of facilities are CARF Accredited1 1 Based on CARF accreditation of 517 IRFs and units of 1,202 IRFs and units nationwide Source: Commission on Accreditation of Rehabilitation Facilities and MedPAC, June 2009 Data Book Kessler ranks #2 among more than 1,100 rehabilitation hospitals in the U.S. 17th consecutive year Kessler ranked among best rehab hospitals U.S. News & World Report America's Best Hospitals 2009-10 |
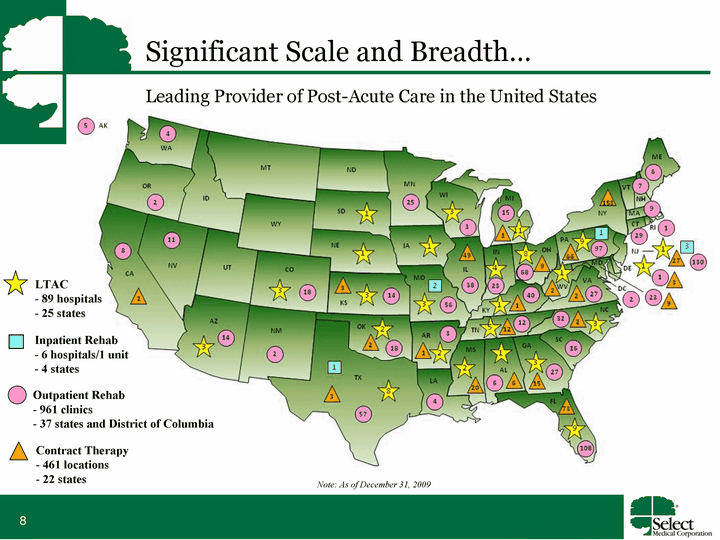
| Significant Scale and Breadth... Note: As of December 31, 2009 Leading Provider of Post-Acute Care in the United States LTAC 89 hospitals 25 states Inpatient Rehab 6 hospitals/1 unit 4 states Outpatient Rehab 961 clinics 37 states and District of Columbia Contract Therapy 461 locations 22 states |
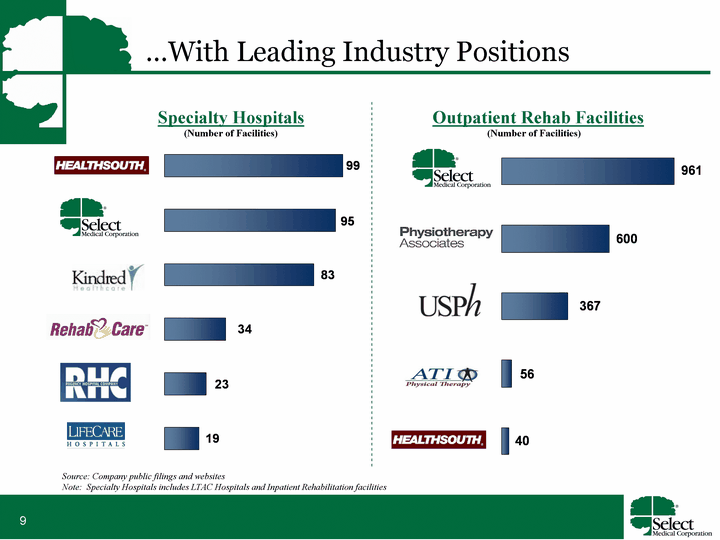
| ...With Leading Industry Positions Source: Company public filings and websites Note: Specialty Hospitals includes LTAC Hospitals and Inpatient Rehabilitation facilities HealthSouth ATI USPH Physiotherapy Assoc Select East 40 56 367 600 961 Specialty Hospitals Outpatient Rehab Facilities LifeCare RHC RehabCare Kindred Select HealthSouth East 19 23 34 83 95 99 (Number of Facilities) (Number of Facilities) |
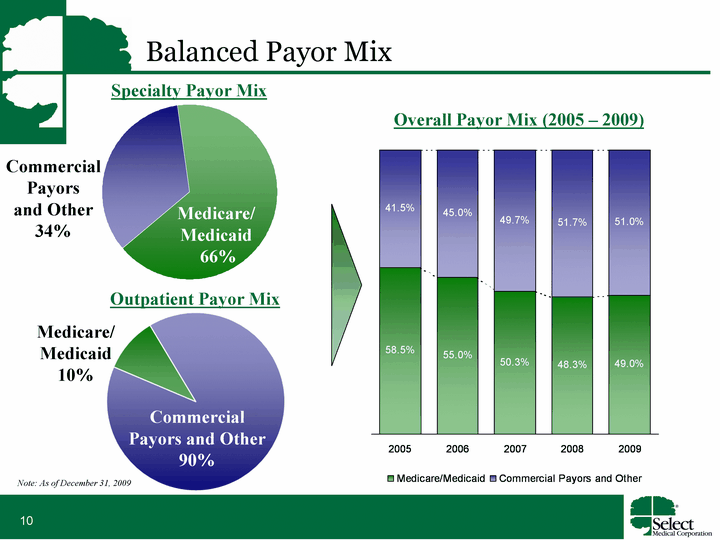
| Balanced Payor Mix Specialty Payor Mix Outpatient Payor Mix Overall Payor Mix (2005 - 2009) Commercial Payors and Other 90% Medicare/ Medicaid 10% Commercial & Other Medicare East 34 66 West Medicare/ Medicaid 66% Commercial Payors and Other 34% 2005 2006 2007 2008 2009 Medicare/Medicaid 0.585 0.55 0.503 0.483 0.49 Commercial Payors and Other 0.415 0.45 0.497 0.517 0.51 Note: As of December 31, 2009 |

| 1998 2000 2002 2004 2006 2008 2009 149 806 1127 1602 1851 2153 2240 (2003) (1999) Strong Track Record of Growth Company has Struck the Right Balance of Both Organic and Acquisitive Growth De Novo - 62 specialty hospitals and 276 outpatient clinics opened since inception Acquisitions - 62 specialty hospitals acquired since inception ATH and Intensiva (1998) LBO Outpatient Division (2007) IPO (2001) Founded (Nov 1996) (2005) IPO (2009) |
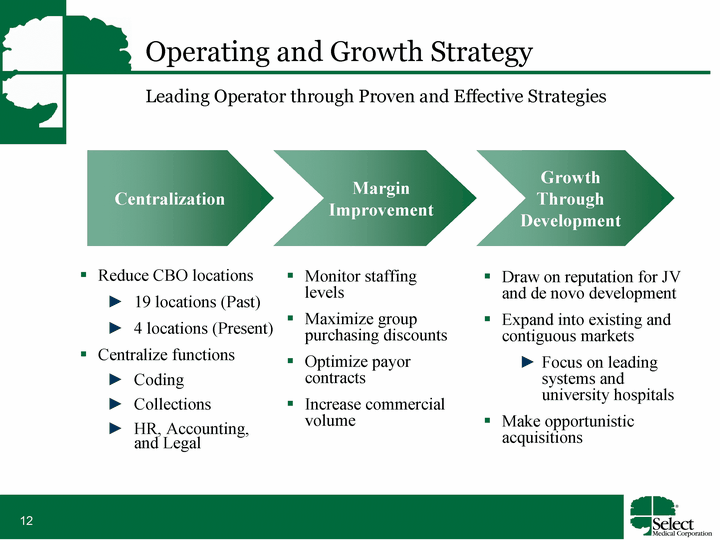
| Operating and Growth Strategy Leading Operator through Proven and Effective Strategies Centralization Margin Improvement Growth Through Development Reduce CBO locations 19 locations (Past) 4 locations (Present) Centralize functions Coding Collections HR, Accounting, and Legal Monitor staffing levels Maximize group purchasing discounts Optimize payor contracts Increase commercial volume Draw on reputation for JV and de novo development Expand into existing and contiguous markets Focus on leading systems and university hospitals Make opportunistic acquisitions |
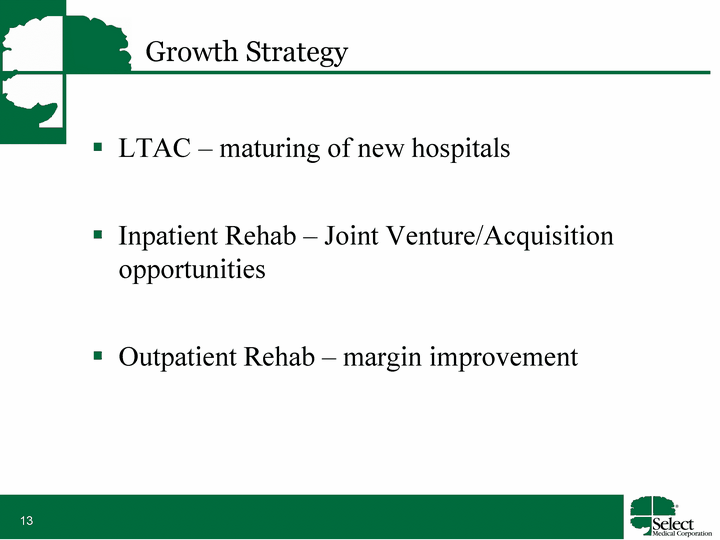
| Growth Strategy LTAC - maturing of new hospitals Inpatient Rehab - Joint Venture/Acquisition opportunities Outpatient Rehab - margin improvement |
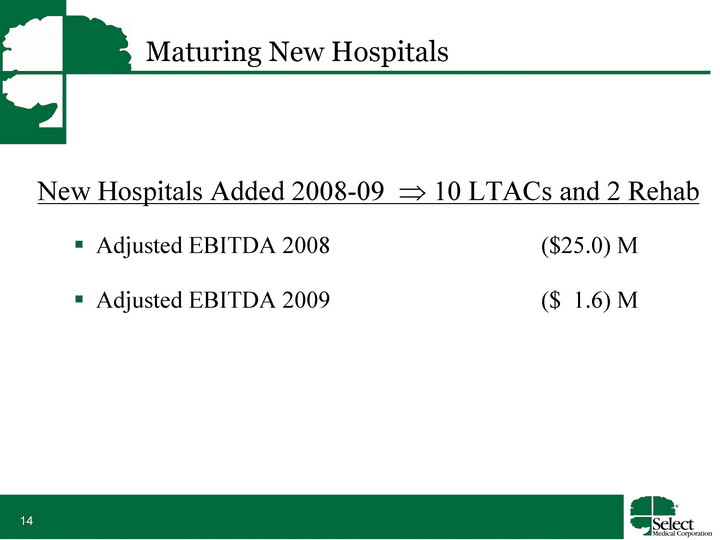
| Maturing New Hospitals New Hospitals Added 2008-09 ? 10 LTACs and 2 Rehab Adjusted EBITDA 2008 ($25.0) M Adjusted EBITDA 2009 ($ 1.6) M |
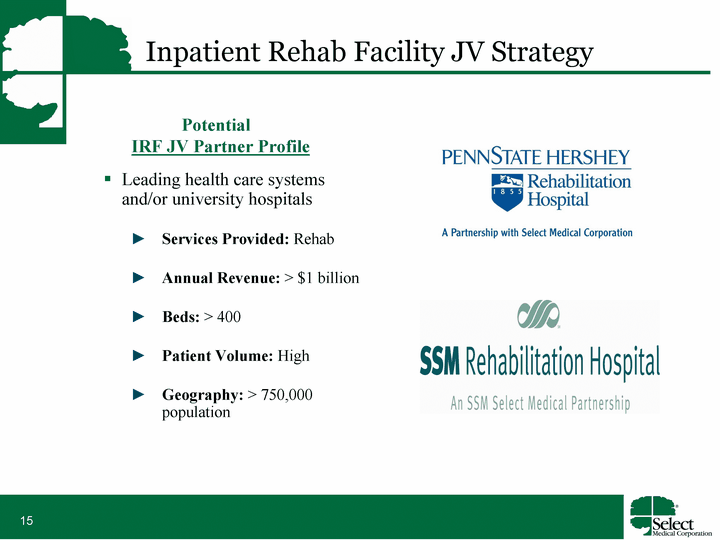
| Inpatient Rehab Facility JV Strategy Potential IRF JV Partner Profile Leading health care systems and/or university hospitals Services Provided: Rehab Annual Revenue: > $1 billion Beds: > 400 Patient Volume: High Geography: > 750,000 population |
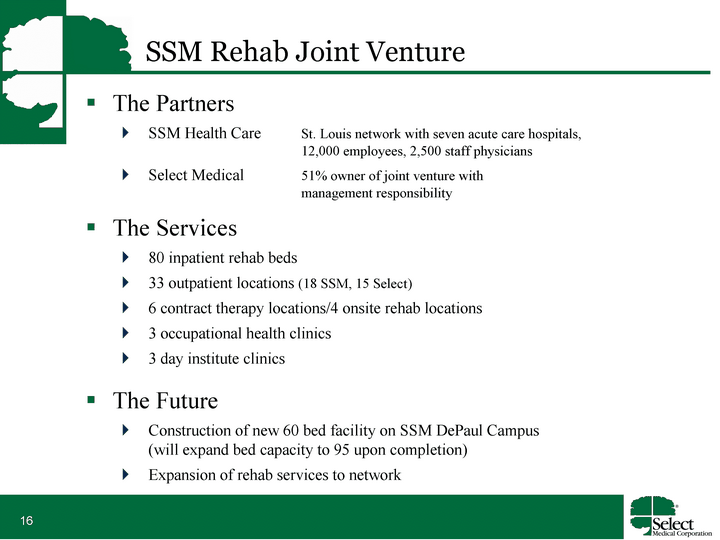
| SSM Rehab Joint Venture The Partners SSM Health Care St. Louis network with seven acute care hospitals, 12,000 employees, 2,500 staff physicians Select Medical 51% owner of joint venture with management responsibility The Services 80 inpatient rehab beds 33 outpatient locations (18 SSM, 15 Select) 6 contract therapy locations/4 onsite rehab locations 3 occupational health clinics 3 day institute clinics The Future Construction of new 60 bed facility on SSM DePaul Campus (will expand bed capacity to 95 upon completion) Expansion of rehab services to network |
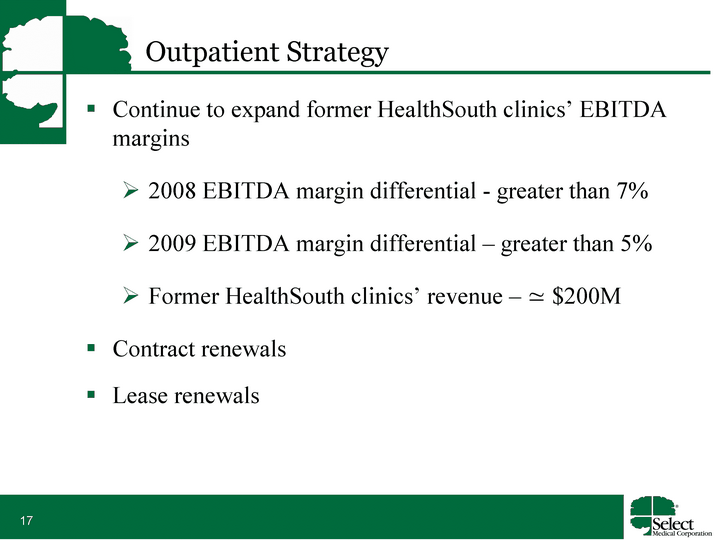
| Outpatient Strategy Continue to expand former HealthSouth clinics' EBITDA margins 2008 EBITDA margin differential - greater than 7% 2009 EBITDA margin differential - greater than 5% Former HealthSouth clinics' revenue - ^ $200M Contract renewals Lease renewals |
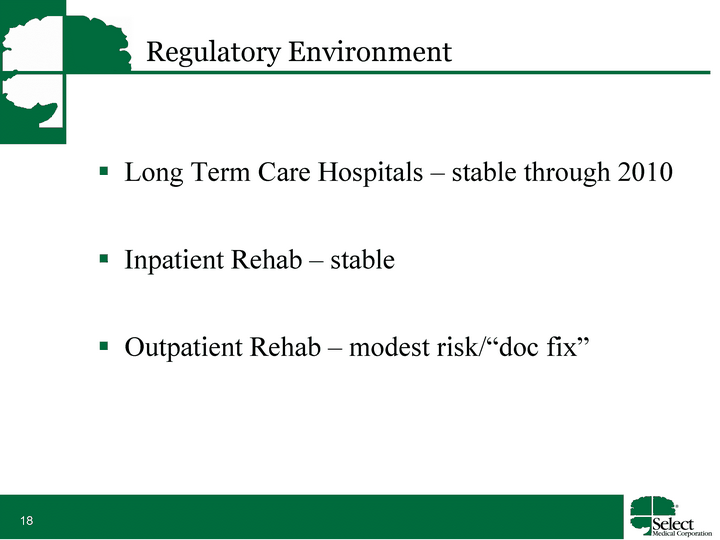
| Regulatory Environment Long Term Care Hospitals - stable through 2010 Inpatient Rehab - stable Outpatient Rehab - modest risk/"doc fix" |
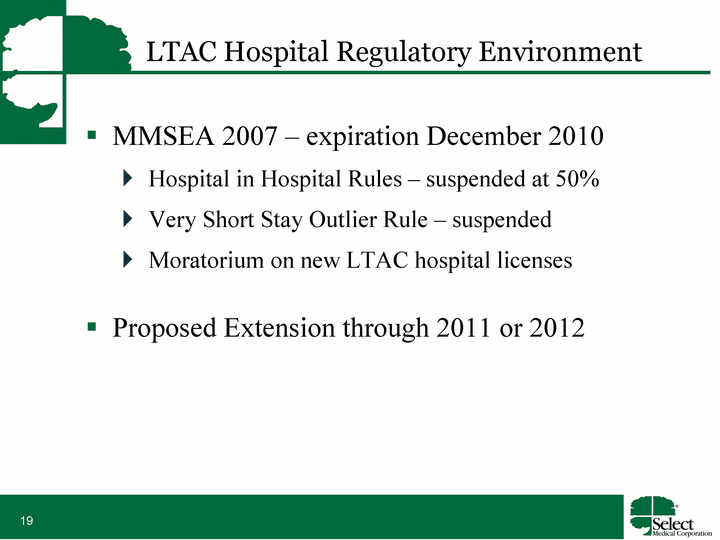
| LTAC Hospital Regulatory Environment MMSEA 2007 - expiration December 2010 Hospital in Hospital Rules - suspended at 50% Very Short Stay Outlier Rule - suspended Moratorium on new LTAC hospital licenses Proposed Extension through 2011 or 2012 |

| Financial Overview |
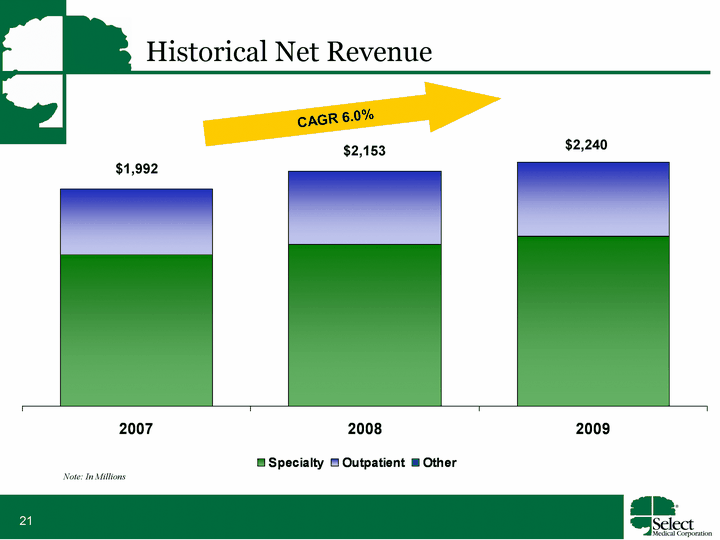
| Revenue Specialty Outpatient Other 2007 1386.4 603.4 1.8 2008 1488.4 664.8 0.2 2009 1557.8 681.9 0.2 ($ in millions) $2,240 $2,153 $1,992 Historical Net Revenue Note: In Millions CAGR 6.0% |
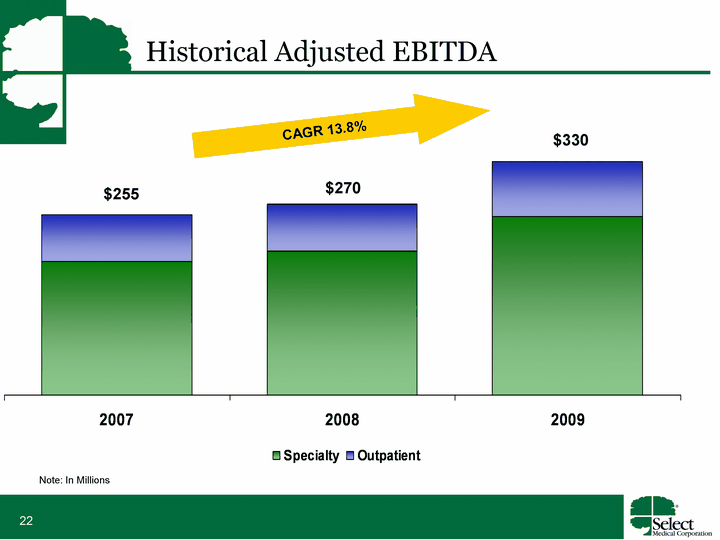
| EBITDA Specialty Outpatient Other 2007 189 66 2008 204 66 2009 253 77 ($ in millions) Note: In Millions Historical Adjusted EBITDA $330 $270 $255 CAGR 13.8% |
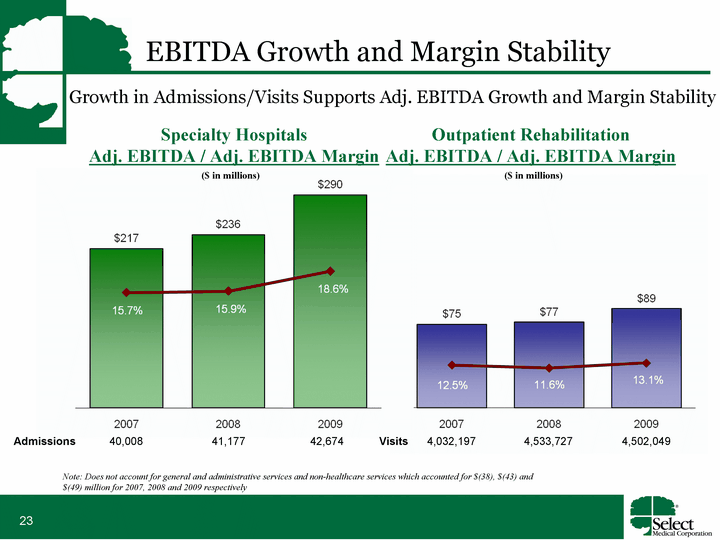
| EBITDA Growth and Margin Stability Specialty Hospitals Adj. EBITDA / Adj. EBITDA Margin Outpatient Rehabilitation Adj. EBITDA / Adj. EBITDA Margin Admissions 40,008 41,177 42,674 Visits 4,032,197 4,533,727 4,502,049 Growth in Admissions/Visits Supports Adj. EBITDA Growth and Margin Stability Note: Does not account for general and administrative services and non-healthcare services which accounted for $(38), $(43) and $(49) million for 2007, 2008 and 2009 respectively ($ in millions) ($ in millions) |
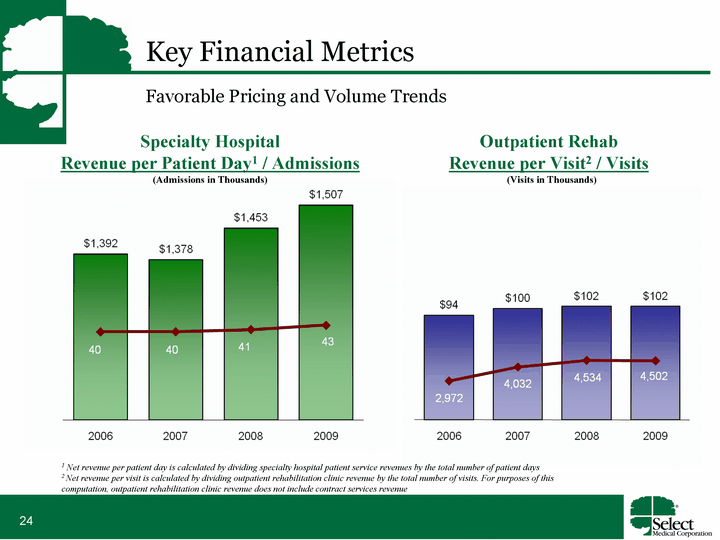
| Key Financial Metrics Favorable Pricing and Volume Trends Specialty Hospital Revenue per Patient Day1 / Admissions Outpatient Rehab Revenue per Visit2 / Visits (Admissions in Thousands) (Visits in Thousands) 1 Net revenue per patient day is calculated by dividing specialty hospital patient service revenues by the total number of patient days 2 Net revenue per visit is calculated by dividing outpatient rehabilitation clinic revenue by the total number of visits. For purposes of this computation, outpatient rehabilitation clinic revenue does not include contract services revenue |
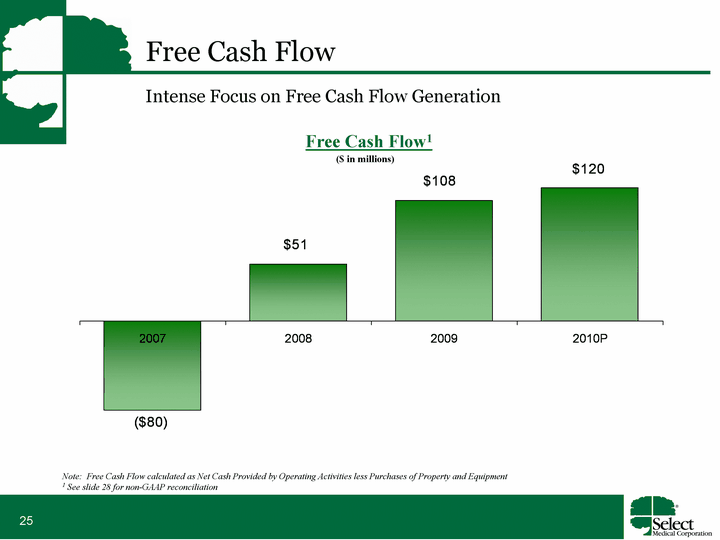
| Free Cash Flow Revenue Free Cash Flow 2007 -80.1 2008 50.9 2009 108 2010P 120 Free Cash Flow1 Note: Free Cash Flow calculated as Net Cash Provided by Operating Activities less Purchases of Property and Equipment 1 See slide 28 for non-GAAP reconciliation Intense Focus on Free Cash Flow Generation ($ in millions) |
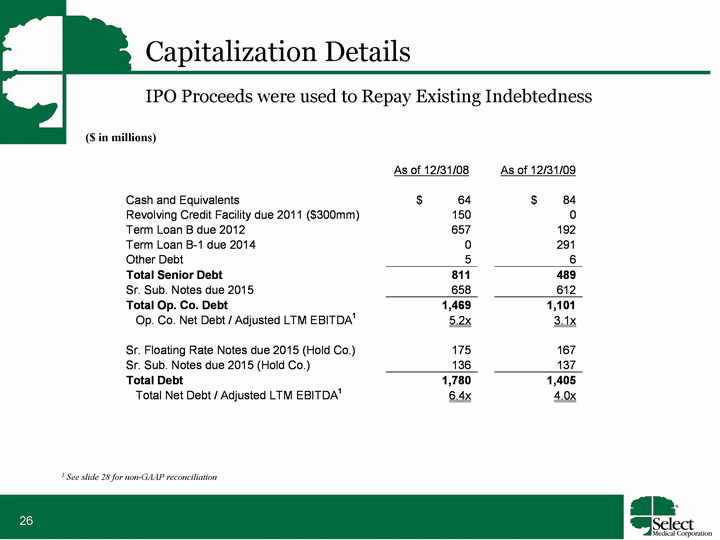
| Capitalization Details IPO Proceeds were used to Repay Existing Indebtedness ($ in millions) 1 See slide 28 for non-GAAP reconciliation |
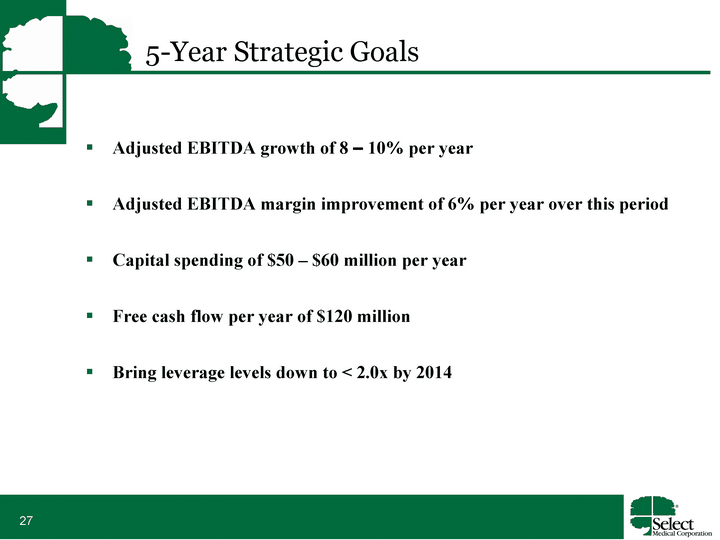
| 5-Year Strategic Goals Adjusted EBITDA growth of 8 - 10% per year Adjusted EBITDA margin improvement of 6% per year over this period Capital spending of $50 - $60 million per year Free cash flow per year of $120 million Bring leverage levels down to < 2.0x by 2014 |
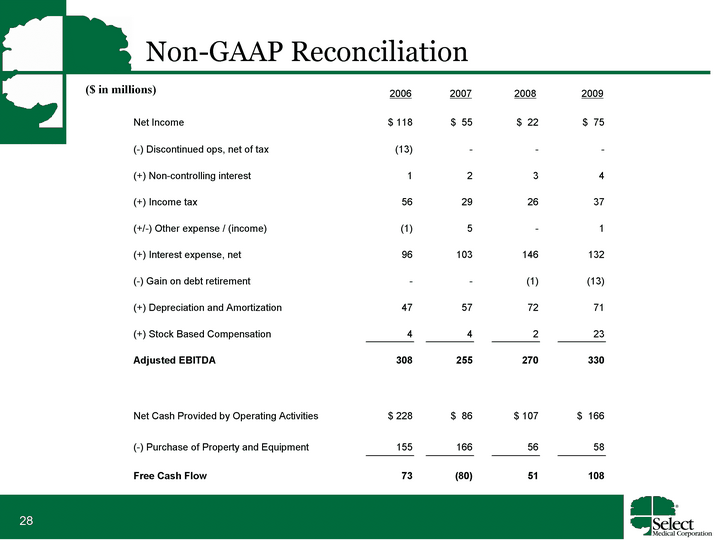
| 2006 2007 2008 2009 Net Income $ 118 $ 55 $ 22 $ 75 (-) Discontinued ops, net of tax (13) - - - (+) Non-controlling interest 1 2 3 4 (+) Income tax 56 29 26 37 (+/-) Other expense / (income) (1) 5 - 1 (+) Interest expense, net 96 103 146 132 (-) Gain on debt retirement - - (1) (13) (+) Depreciation and Amortization 47 57 72 71 (+) Stock Based Compensation 4 4 2 23 Adjusted EBITDA 308 255 270 330 Net Cash Provided by Operating Activities $ 228 $ 86 $ 107 $ 166 (-) Purchase of Property and Equipment 155 166 56 58 Free Cash Flow 73 (80) 51 108 Non-GAAP Reconciliation ($ in millions) |