Attached files
| file | filename |
|---|---|
| EX-21 - EXHIBIT 21 - LUFKIN INDUSTRIES INC | exh21.htm |
| EX-23 - EXHIBIT 23 - LUFKIN INDUSTRIES INC | exh23.htm |
| EX-32.1 - EXHIBIT 32.1 - LUFKIN INDUSTRIES INC | exh32_1.htm |
| EX-18.1 - EXHIBIT 18.1 - LUFKIN INDUSTRIES INC | exh18_1.htm |
| EX-31.2 - EXHIBIT 31.2 - LUFKIN INDUSTRIES INC | exh31_2.htm |
| EX-31.1 - EXHIBIT 31.1 - LUFKIN INDUSTRIES INC | exh31_1.htm |
| EX-32.2 - EXHIBIT 32.2 - LUFKIN INDUSTRIES INC | exh32_2.htm |
UNITED
STATES
SECURITIES
AND EXCHANGE COMMISSION
Washington,
D. C. 20549
FORM
10-K
[X]
ANNUAL REPORT PURSUANT TO SECTION 13 OR 15(d) OF THE SECURITIES EXCHANGE ACT OF
1934
For the
fiscal year ended December
31, 2009
[ ]
TRANSITION REPORT PURSUANT TO SECTION 13 OR 15(d) OF THE SECURITIES EXCHANGE ACT
OF 1934
For
transition period from to
Commission
file number
0-2612
LUFKIN INDUSTRIES, INC.
(Exact
name of registrant as specified in its charter)
|
TEXAS
|
75-0404410
|
|
(State
or other jurisdiction of incorporation or organization)
|
(I.R.S.
Employer Identification No.)
|
|
601
SOUTH RAGUET, LUFKIN, TEXAS
|
75904
|
|
(Address
of principal executive offices)
|
(Zip
Code)
|
Registrant's
telephone number, including area code (936)
634-2211
Securities
registered pursuant to Section 12(b) of the Act: None
Securities
registered pursuant to Section 12(g) of the Act:
Common Stock, Par Value $1 Per Share
(Title of
Class)
Indicate
by check mark if the registrant is a well-known seasoned issuer, as defined in
Rule 405 of the Securities
Act. Yes
X No
Indicate
by check mark if the registrant is not required to file reports pursuant to
Section 13 or Section 15(d) of the
Act. Yes
No X
Indicate
by check mark whether the registrant (1) has filed all reports required to be
filed by Section 13 or 15(d) of the Securities Exchange Act of 1934 during the
preceding 12 months (or for such shorter period that the registrant was required
to file such reports), and (2) has been subject to such filing requirements for
the past 90 days. Yes X
No___
Indicate
by check mark whether the registrant has submitted electronically and posted on
its corporate Web site, if any, every Interactive Data File required to be
submitted and posted pursuant to Rule 405 of Regulation S-T (§ 232.405 of this
chapter) during the preceding 12 months (or for such shorter period that the
registrant was required to submit and post such files).
Yes
__ No X
Indicate
by check mark if disclosure of delinquent filers pursuant to Item 405 of
Regulation S-K is not contained herein, and will not be contained, to the best
of registrant's knowledge, in definitive proxy or information statements
incorporated by reference in Part III of this Form 10-K or any amendment to this
Form 10-K. X
Indicate
by check mark whether the registrant is a large accelerated filer, an
accelerated filer, a non-accelerated filer, or a smaller reporting company. See
definitions of “large accelerated filer”, “accelerated filer” and “smaller
reporting company” in Rule 12b-2 of the Exchange Act.
Large
accelerated filer X Accelerated
filer ______
Non-accelerated
filer
______ Smaller
reporting company ______
Indicate
by check mark whether the registrant is a shell company (as defined in Rule
12b-2 of the Act). Yes
No X
The
aggregate market value of the Company's voting stock held by non-affiliates as
of the last business day of the Company’s most recently completed second fiscal
quarter, June 30, 2009, was $624,896,430.
There
were 14,925,871 shares of Common Stock, $1.00 par value per share,
outstanding as of February 24, 2010.
DOCUMENTS
INCORPORATED BY REFERENCE
The
information called for by Items 10, 11, 12, 13 and 14 of Part III of this annual
report on Form 10-K are incorporated by reference from the registrant’s
definitive proxy statement for the 2010 Annual Meeting of Stockholders to
be filed pursuant to Regulation 14A.
PART
I
Item 1. Business
Lufkin
Industries, Inc. (the “Company”) was incorporated under the laws of the State of
Texas on March 4, 1902, and since that date has maintained its principal office
and manufacturing facilities in Lufkin, Texas. The Company employed
approximately 2,600 people at December 31, 2009, including approximately 1,600
that were paid on an hourly basis. Certain operations are subject to
a union contract that expires in October 2011. The Company, a global supplier of
oil field and power transmission products, is divided into two operating
segments: Oil Field and Power Transmission.
In
January 2008, the Company announced the decision to suspend its participation in
the commercial trailer markets and to develop a plan to run-out existing
inventories, fulfill contractual obligations and close all trailer facilities
during 2008. During the second quarter of 2008, this plan was completed, with
the majority of the remaining inventory and manufacturing equipment sold and all
facilities closed. As a result, the former Trailer segment was classified as a
discontinued operation during 2008.
Oil
Field
Products:
The Oil
Field segment manufactures and services artificial lift products, including
reciprocating rod lift, commonly referred to as pumping units, gas lift, plunger
lift equipment and related products.
Pumping Units- Four basic
types of pumping units are manufactured: an air-balanced unit; a beam-balanced
unit; a crank-balanced unit; and a Mark II Unitorque unit. The basic
differences between the four types relate to the counterbalancing
system. The depth of a well and the desired fluid production
determine the type of counterbalancing configuration that is
required. There are numerous sizes and combinations of Lufkin oil
field pumping units within the four basic types.
Pumping Unit Service- Through
a network of service centers, the Company transports and repairs pumping units.
The service centers also refurbish used pumping units.
Automation- The Company
designs, manufactures, installs and services computer control equipment and
analytical services for artificial lift equipment that lower production costs
and optimize well efficiency.
Lufkin ILS- Through this
acquisition in 2009, the Company now designs, manufactures, installs and
services gas lift, plunger lift and completion equipment.
Foundry Castings- As part of
the Company’s vertical integration strategy, the Oil Field segment operates an
iron foundry to produce castings for new pumping units. In order to maximize
utilization of this facility, castings for third parties are also
produced.
Raw
Materials & Labor:
Oil Field
purchases a variety of raw materials in manufacturing its products. The
principal raw materials are structural and plate steel, round alloy steel and
iron castings from both its own foundry and third-party foundries. Casting costs
are subject to change from raw material prices on scrap iron and pig iron in
addition to natural gas and electricity prices. Due to the many configurations
of its products and thus sizes of raw material used, Oil Field does not enter
into long-term contracts for raw materials but generally does not experience
shortages of raw materials. During the period of 2007 through 2009, Oil Field
did not experience any significant material shortages. During the first three
quarters of 2008, raw material prices for steel and castings increased
significantly but started declining in the fourth quarter of 2008 and through
2009. As the global economy improves in 2010, raw material prices are expected
to moderately increase. Raw material prices may continue to increase and
availability may decrease with little notice.
The
nature of the products manufactured and serviced generally requires skilled
labor. Oil Field’s ability to increase capacity could be limited by its ability
to hire and train qualified personnel. Also, the main U.S. manufacturing
facilities are unionized, so any labor disruption could have a significant
impact on Oil Field’s ability to maintain production levels. The current labor
contract expires in October 2011.
Markets:
Demand
for artificial lift equipment primarily depends on the level of new onshore oil
well and workover drilling activity as well as the depth and fluid conditions of
that drilling. Drilling activity is driven by the available cash flow of the
Company’s customers as well as their long-term perceptions of the level and
stability of the price of oil. The higher energy prices experienced since 2004
have increased the demand for artificial lift equipment and related service and
products from higher drilling activity, activation of idle wells and the
upgrading of existing wells. During 2008, demand in the North American market
increased significantly compared to 2007 levels due to the impact of increased
drilling in response to higher oil prices and recapturing certain market share
from lower-priced imported equipment as customers reevaluated the total
life-cycle cost differences. Traditionally, as pumping unit demand increases and
availability of used equipment diminishes, demand for new equipment increases.
Increasingly in 2007, lower-priced imported pumping units entered the North
American market in place of used equipment and reduced the incremental demand
for the Company’s new pumping units. In the fourth quarter of 2008, oil prices
decreased significantly and stayed at reduced levels throughout the first half
of 2009. As drilling activity reduced in response to lower oil prices, demand
for artificial lift equipment and related service was also negatively impacted.
Also, as raw material costs declined and surplus equipment increased, there was
competitive pressure to lower selling prices. Lower selling prices combined with
the negative impact of low capacity utilization in manufacturing facilities,
gross margins declined in 2009. In the second half of 2009, oil prices increased
back to 2007 levels and drilling activity, especially for oil, increased. This
trend is expected to continue in 2010, with higher drilling activity and lower
surplus equipment inventory driving demand for new artificial lift equipment.
Longer-term, the demand for artificial lift equipment will continue to increase
in international markets. While a majority of the segment’s revenues are in
North America, international opportunities continue to increase as new drilling
increases and existing fields mature, requiring increased use of artificial
lift, especially in the South American, Russian and Middle Eastern markets. An
Oilfield customer and its related subsidiaries represented 11.0%, 15.4% and
15.9% of consolidated company sales in 2009, 2008 and 2007, respectively. The
loss of this customer would have a material adverse effect on this
segment.
Competition:
The
primary global competitor for artificial lift equipment is Weatherford
International, but Chinese manufacturers of artificial lift equipment are
increasingly present in the market. Used pumping units are also an important
factor in the North American market, as customers will generally attempt to
satisfy requirements through used equipment before purchasing new
equipment. While the Company believes that it is one of the larger
manufacturers of artificial lift equipment in the world, manufacturers of other
types of units like electric submersible pumps have a significant share of the
total artificial lift market. While Weatherford International is the Company’s
single largest competitor in the service market, small independent operators
provide significant competitive pressures.
Because
of the competitive nature of the business and the relative age of many of the
product designs, price, delivery time, product quality and customer service are
important factors in winning orders. To this end, the Company maintains
strategic levels of inventories in order to ensure delivery times and invests in
new capital equipment to maintain quality and price levels.
Power
Transmission
Products:
The Power
Transmission segment designs, manufactures and services speed increasing and
reducing gearboxes for industrial applications. Speed increasers convert lower
speed and higher torque input to higher speed and lower torque output while
speed reducers convert higher speed and lower torque input to lower speed and
higher torque output. The Company produces numerous sizes and designs of
gearboxes depending on the end use. While there are standard designs, the
majority of gearboxes are customized for each application.
High-Speed Gearboxes- Single
stage gearboxes with pitch line velocities equal to or greater than 35 meters
per second or rotational speeds greater than 4500 rpm or multi-stage gearboxes
with at least one stage having a pitch line velocity equal to or greater than 35
meters per second and other stages having pitch line velocities equal to or
greater than 8 meters per second are classified as high-speed gearboxes. These
gearboxes require extremely high precision manufacturing and testing due to the
stresses on the gearing. The ratio of increasers to reducers is fairly even.
These gearboxes more typically service the energy related markets of
petrochemicals, refineries, offshore production and transmission of oil and
gas.
Low-Speed Gearboxes- Gearboxes
which do not meet the pitch line or rotational speed criteria of high-speed
gearboxes are classified as low-speed gearboxes. The majority of low-speed
gearboxes are reducers. While still requiring close tolerances, these gearboxes
do not require the same precision of manufacturing and testing. These gearboxes
more typically service commodity-related industries like rubber, sugar, paper,
steel, plastics, mining and cement as well as marine propulsion.
Parts- The Company
manufactures capital spares for customers in conjunction with the production of
new gearboxes, as well as producing parts for aftermarket service.
Gearbox Repair & Service-
The Company provides on and off-site repair and service for not only its own
products but also those manufactured by other companies. Repair work is
performed in dedicated facilities due to the quick turn-around times
required.
Lufkin RMT- Through this
acquisition in 2009, the Company now participates in the turbo-machinery
industry, specializing in the analysis design and manufacture of precision,
custom-engineered tilting-pad bearings and related components for high-speed
turbo equipment operating in critical duty applications. RMT also
services, repairs and upgrades turbo-expander process units for air and gas
separation.
Raw
Materials & Labor:
Power
Transmission purchases a variety of raw materials in manufacturing its products.
The principal raw materials are steel plate, round alloy steel, iron castings
and steel forgings. Due to the customized nature of its products, Power
Transmission generally does not enter into long-term contracts for raw
materials. Though raw material shortages are infrequent, lead times can be long
due to the custom nature of many of its orders. Raw material prices are not
expected to decline significantly in the short-term and may continue to increase
with little notice. Certain materials like steel round, steel plate, steel
forgings and bearings have continued to experience price increases and longer
lead times. Raw material and component part shortages are not expected in the
short-term, but certain supplier lead-times have grown, especially bearing
suppliers.
The
nature of the products manufactured and serviced generally requires skilled
labor. Power Transmission’s ability to increase capacity could be limited by its
ability to hire and train qualified personnel. Also, the main U.S. manufacturing
facilities are unionized, so any labor disruption could have a significant
impact on Power Transmission’s ability to maintain production levels. The
current labor contract expires in October 2011.
Markets:
Power
Transmission services many diverse markets, with high-speed gearing for markets
such as petrochemicals, refineries, offshore production and transmission of oil
and low-speed gearing for the gas, rubber, sugar, paper, steel, plastics,
mining, cement and marine propulsion, each of which has its own unique set of
drivers. Favorable conditions for one market may be unfavorable for another
market. Generally, if general global industrial capacity utilizations are not
high, spending on new equipment lags. Also impacting demand are government
regulations involving safety and environmental issues that can require capital
spending. Recent market demand increases have come from energy-related markets
such as refining, petrochemical, drilling, coal, marine and power generation in
response to higher global energy prices. RMT products generally follow the
market for high-speed gearboxes. During the latter part of 2008, energy prices
decreased significantly, global growth slowed and large project financing became
difficult to secure. New order booking declined in the first half of 2009, which
negatively impacted sales starting in late 2009. While sales will remain at
these lower levels during the first half of 2010, new order and quotation
activity, especially from large LNG projects, during this period is expected to
increase and should translate into higher sales in the latter half of
2010.
Competition:
Despite
the highly technical nature of the products in this segment, there are many
competitors. While several North American competitors have de-emphasized the
market, many European companies remain in the market. Competitors include
Flender Graffenstaden, BHS, Renk, Rientjes, CMD, Philadelphia Gear and Horsburgh
& Scott. While price is an important factor, proven designs, workmanship and
engineering support are critical factors. Due to this, the Company outsources
very little of the design and manufacturing processes.
Federal
Regulation and Environmental Matters
The
Company’s operations are subject to various federal, state and local laws and
regulations, including those related to air emissions, wastewater discharges,
the handling of solid and hazardous wastes and occupational safety and
health. Environmental laws have, in recent years, become more
stringent and have generally sought to impose greater liability on a larger
number of potentially responsible parties. While the Company is not
currently aware of any situation involving an environmental claim that would
likely have a material adverse effect on its business, it is always possible
that an environmental claim with respect to one or more of the Company’s current
businesses or a business or property that one of our predecessors owned or used
could arise that could have a material adverse effect. The Company’s operations
have incurred, and will continue to incur, capital and operating expenditures
and other costs in complying with these laws and regulations in both the United
States and abroad. However, the Company does not anticipate the future costs of
environmental compliance will have a material adverse effect on its business,
financial results or results of operations.
Available
Information
The
Company makes available, free of charge, through our website, www.lufkin.com,
its annual reports on Form 10-K, quarterly reports on Form 10-Q, current reports
on Form 8-K and amendments to those reports filed or furnished pursuant to
Section 13(a) or 15(d) of the Securities Exchange Act of 1934, as
amended. Access to these electronic filings is available as soon as
reasonably practicable after the Company files such material with, or furnishes
it to, the Securities and Exchange Commission. You may also request
printed copies of these documents free of charge by writing to the Company
Secretary at P.O. Box 849, Lufkin, Texas 75902. Our reports filed
with the SEC are also made available to read and copy at the SEC’s Public
Reference Room at 100 F Street, N.E., Washington, D.C., 20549. You
may obtain information about the Public Reference Room by contacting the SEC at
1-800-SEC-0330. Reports filed with or furnished to the SEC are
also made available on its website at www.sec.gov.
Item 1A. Risk
Factors.
The
risks described below are those which the Company believes are the material
risks that it faces. Any of the risk factors described below could
significantly and adversely affect its business, prospects, financial condition
and results of operations.
A
decline in domestic and worldwide oil and gas drilling activity would adversely
affect the Company’s results of operations.
The Oil
Field segment is materially dependent on the level of oil and gas drilling
activity in North America and worldwide, which in turn depends on the level of
capital spending by major, independent and state-owned exploration and
production companies. This capital spending is driven by current
prices for oil and gas and the perceived stability and sustainability of those
prices. Oil and gas prices have been subject to significant
fluctuation in recent years in response to changes in the supply and demand for
oil and gas, market uncertainty, world events, governmental actions, and a
variety of additional factors that are beyond the Company’s control,
including:
|
l
|
the
level of North American and worldwide oil and gas exploration and
production activity;
|
|
l
|
worldwide
economic conditions, particularly economic conditions in North
America;
|
|
l
|
oil
and gas production costs;
|
|
l
|
weather
conditions;
|
|
l
|
the
expected costs of developing new reserves;
|
|
l
|
national
government political requirements and the policies of
OPEC;
|
|
l
|
the
price and availability of alternative fuels;
|
|
l
|
the
effect of worldwide energy conservation measures;
|
|
l
|
environmental
regulation; and
|
|
l
|
tax
policies.
|
Increases in the prices of our raw materials could adversely affect our margins and results of operations.
The
Company uses large amounts of steel, iron and electricity in the manufacture of
its products. The price of these raw materials has a significant
impact on the cost of producing products. Steel and electricity
prices have increased significantly in the last five years, caused primarily by
higher energy prices and increased global demand. Since most of the
Company’s suppliers are not currently parties to long-term contracts with us,
the Company is vulnerable to fluctuations in prices of such raw
materials. Factors such as supply and demand, freight costs and
transportation availability, inventory levels of brokers and dealers, the level
of imports and general economic conditions may affect the price of cast iron and
steel. Raw material prices may increase significantly in the
future. Certain items such as steel round, bearings and aluminum have
continued to experience price increases, price volatility and longer lead times.
If the Company is unable to pass future raw material price increases on to its
customers, margins, results of operations, cash flow and financial condition
could be adversely affected.
Interruption
in our supply of raw materials could adversely affect our results of
operations.
The
Company relies on various suppliers to supply the components utilized to
manufacture our products. The availability of the raw materials is
not only a function of the availability of steel and iron, but also the alloy
materials that are utilized by our suppliers. To date, these shortages have not
caused a material disruption in availability or our manufacturing
operations. However, material disruptions may occur in the
future. Raw material shortages and allocations may result in
inefficient operations and a build-up of inventory, which can negatively affect
the Company’s working capital position. The loss of any of the
Company’s suppliers or their inability to meet its price, quality, quantity and
delivery requirements could have an adverse effect on the Company’s business and
results of operations.
The
inherent dangers and complexity of the Company’s products and services could
subject it to substantial liability claims that could adversely affect our
results of operations.
The
products that the Company manufactures and the services that it provides are
complex, and the failure of this equipment to operate properly or to meet
specifications may greatly increase our customers’ costs. In
addition, many of these products are used in inherently hazardous industries,
such as the oil and gas drilling and production industry where an accident or
product failure can cause personal injury or loss of life, damage to property,
equipment, or the environment, regulatory investigations and penalties and the
suspension of the end-user’s operations. If the Company’s
products or services fail to meet specifications or are involved in accidents or
failures, we could face warranty, contract, or other litigation claims for which
it may be held responsible and its reputation for providing quality products may
suffer.
The
Company’s insurance may not be adequate in risk coverage or policy limits to
cover all losses or liabilities that we may incur or be
responsible. Moreover, in the future we may not be able to maintain
insurance at levels of risk coverage or policy limits that we deem adequate or
at premiums that are reasonable for us, particularly in the recent environment
of significant insurance premium increases. Further, any claims made
under the Company’s policies will likely cause its premiums to
increase.
Any
future damages deemed to be caused by the Company’s products or services that
are assessed against it and that are not covered by insurance, or that are in
excess of policy limits or subject to substantial deductibles, could have a
material adverse effect on our results of operations and financial
condition. Litigation and claims for which we are not insured can
occur, including employee claims, intellectual property claims, breach of
contract claims, and warranty claims.
We
may not be able to successfully integrate future acquisitions, which will cause
us to fail to realize expected returns.
The
Company continually explores opportunities to acquire related businesses, some
of which could be material to the Company. The ability to continue to grow,
however, may depend upon identifying and successfully acquiring attractive
companies, effectively integrating these companies, achieving cost efficiencies
and managing these businesses as part of the Company. The Company may
not be able to effectively integrate the acquired companies and successfully
implement appropriate operational, financial and management systems and controls
to achieve the benefits expected to result from these
acquisitions. The Company’s efforts to integrate these businesses
could be affected by a number of factors beyond its control, such as regulatory
developments, general economic conditions and increased
competition. In addition, the process of integrating these businesses
could cause the interruption of, or loss of momentum in, the activities of our
existing business. The diversion of management’s attention and any
delays or difficulties encountered in connection with the integration of these
businesses could negatively impact the Company’s business and results of
operations. Further, the benefits that the Company anticipates from
these acquisitions may not develop.
Labor
dispute or the expiration of our current labor contract could have a material
adverse effect on our business.
The
Company’s main U.S. manufacturing facilities are unionized and the current labor
contract with respect to those facilities expires in October
2011. The Company cannot assure that any disputes, work stoppages or
strikes will not arise in the future. In addition, when our existing
collective bargaining agreement expires, the Company cannot assure that it will
be able to reach a new agreement with its employees or that any new agreement
will be on substantially similar terms as the existing
agreement. Future disputes with and labor concessions to the
Company’s employees could have a material adverse effect upon its results of
operations and financial position.
The
inability to hire and retain qualified employees may hinder our
growth.
The
ability to provide high-quality products and services depends in part on the
Company’s ability to hire and retain skilled personnel in the areas of
management, product engineering, servicing and sales. Competition for
such personnel is intense and competitors can be expected to attempt to hire the
Company’s skilled employees from time to time. In particular, the
Company’s business and results of operations could be materially adversely
affected if it is unable to retain the customer relationships and technical
expertise provided by the Company’s management team and professional
personnel.
Significant
competition in the industries in which the Company operates may result in its
competitors offering new or better products and services or lower prices, which
could result in a loss of customers and a decrease in revenues.
The
industries in which the Company operates are highly competitive. The
Company competes with other manufacturers and service providers of varying
sizes, some of which may have greater financial and technological resources than
it does. If the Company is unable to compete successfully with other
manufacturers and service providers, it could lose customers and its revenues
may decline. In addition, competitive pressures in the industry may
affect the market prices of the Company’s new and used equipment, which, in
turn, may adversely affect its sales margins, results of operations, cash flow
and financial condition.
Disruption
of our manufacturing operations or management information systems would have an
adverse effect on our financial condition and results of
operations.
While the
Company owns numerous facilities domestically and internationally, its primary
manufacturing facilities in and around Lufkin, Texas account for a significant
percentage of its manufacturing output. An unexpected disruption in
the Company’s production at these facilities or in its management information
systems for any length of time would have an adverse effect on our business,
financial condition and results of operations.
The
Company has foreign operations that would be adversely impacted in the event of
war, political disruption, civil disturbance, economic and legal sanctions and
changes in global trade policies.
The
Company has operations in certain international areas, including parts of the
Middle East and South America, that are subject to risks of war, political
disruption, civil disturbance, economic and legal sanctions (such as
restrictions against countries that the U.S. government may deem to sponsor
terrorism) and changes in global trade policies. The Company’s
operations may be restricted or prohibited in any country in which these risks
occur. In particular, the occurrence of any of these risks could
result in the following events, which in turn, could materially and adversely
impact the Company’s results of operations:
|
l
|
disruption
of oil and natural gas exploration and production
activities;
|
|
l
|
restriction
of the movement and exchange of funds;
|
|
l
|
inhibition
of our ability to collect receivables;
|
|
l
|
enactment
of additional or stricter U.S. government or international sanctions;
and
|
|
l
|
limitation
of our access to markets for periods of
time.
|
Results
of operations could be adversely affected by actions under U.S. trade
laws.
Although
the Company is a U.S.-based manufacturing and services company, it does own and
operate international manufacturing operations that support its U.S.-based
business. If actions under U.S. trade laws were instituted that
limited the Company’s access to these products, the ability to meet its customer
specifications and delivery requirements would be reduced. Any
adverse effects on the Company’s ability to import products from its foreign
subsidiaries could have a material adverse effect on our results of
operations.
The
Company is subject to currency exchange rate risk, which could adversely affect
its results of operations.
The
Company is subject to currency exchange rate risk with intercompany debt
denominated in U.S. dollars owed by its Canadian subsidiary. The
Company cannot assure that future currency exchange rate fluctuations will not
have an adverse affect on its results of operations.
Our
funding policy for our pension plan is to accumulate plan assets that, over the long-run, will approximate the present
value of projected benefit obligations. Our pension cost
is materially affected by the discount rate used to measure pension obligations,
the level of plan assets available to fund those obligations at the measurement
date and the expected long-term rate of return on plan assets. Our pension
plan is supported by pension fund investments that are volatile and subject
to financial market risk, including fixed income, domestic and foreign equity
securities, real estate and hedge funds. Significant changes in investment
performance or a change in the portfolio mix of invested assets could
result in corresponding increases and decreases in the valuation of plan assets
or in a change of the expected rate of return on plan assets. A change in the
discount rate would result in a significant increase or decrease in the
valuation of pension obligations, affecting the reported funded status of our
pension plans as well as the net periodic pension cost in the following fiscal
years. Similarly, changes in the expected return on plan assets could
result in significant changes in the net periodic pension cost for subsequent
fiscal years.
The
Company’s common stock has experienced, and may continue to experience, price
volatility.
The
trading price of the Company’s common stock has been and may continue to be
subject to large fluctuations. The Company’s common stock price may
increase or decrease in response to a number of events and factors,
including:
|
l
|
trends
in the Company’s industries and the markets in which it
operates;
|
|
l
|
changes
in the market price of the products the Company sells;
|
|
l
|
the
introduction of new technologies or products by the Company or its
competitors;
|
|
l
|
changes
in expectations as to the Company’s future financial performance,
including financial estimates by securities analysts and
investors;
|
|
l
|
operating
results that vary from the expectations of securities analysts and
investors;
|
|
l
|
announcements
by the Company or its competitors of significant contracts, acquisitions,
strategic partnerships, joint ventures, financings or capital
commitments;
|
|
l
|
the
price of oil;
|
|
l
|
changes
in laws and regulations; and
|
|
l
|
general
economic and competitive
conditions.
|
Due
to the recent financial and credit crisis, certain of our counterparties may be
unable to meet their financial obligations to the Company or, alternatively, may
be forced to postpone or otherwise cancel their contracts with the
Company.
The
recent credit crisis and the related turmoil in the global financial system have
had an adverse impact on the Company’s business and financial condition and the
business and financial condition of our counterparties. The Company
may face challenges if conditions in the financial markets do not
improve. The Company may be subject to increased counterparty risks
whereby its counterparties may not be willing or able to meet their financial
obligations to the Company or, alternatively, may be forced to postpone or
otherwise cancel their contracts with the Company. To the extent a third-party
is unable to meet its obligations to the Company, the earnings and results of
operations of the Company could be negatively impacted in future reporting
periods. A sustained decline in the ability of the Company’s counterparties to
meet their financial obligations to the Company would adversely affect its
business, results of operations and financial condition.
Climate
change legislation limiting and reducing greenhouse gas emissions through a “cap
and trade” system of allowances and credits could result in increased operating
costs and reduced demand for our products or services.
On June
26, 2009, the U.S. House of Representatives passed the American Clean Energy and
Security Act of 2009 (“ACESA”), which would establish an economy-wide
cap-and-trade program to reduce U.S. emissions of greenhouse gases, including
carbon dioxide and methane. ACESA would require a 17% reduction in greenhouse
gas emissions from 2005 levels by 2020 and just over an 80% reduction of such
emissions by 2050. Under this legislation, the EPA would issue a capped and
steadily declining number of tradable emissions allowances to certain major
sources of greenhouse gas emissions so that such sources could continue to emit
greenhouse gases into the atmosphere. These allowances would be expected to
escalate significantly in cost over time. The net effect of ACESA will be to
impose increasing costs on the combustion of carbon-based fuels such as oil,
refined petroleum products, and natural gas. Similarly, on September 30, 2009,
the Clean Energy Jobs and American Power Act of 2009 was introduced in the U.S.
Senate. The Obama Administration has indicated its support of legislation to
reduce greenhouse gas emissions through an emission allowance system. Although
it is not possible at this time to predict when the Senate may act on climate
change legislation or how any bill passed by the Senate would be reconciled with
ACESA, any future federal laws or implementing regulations that may be adopted
to address greenhouse gas emissions could require the Company to incur increased
operating costs, could adversely impact customers’ operations or demand for
customers’ products, or could adversely affect demand for the Company’s products
or services.
An
array of international climate change accords focused on limiting and reducing
greenhouse gas emissions could result in increased operating costs and reduced
demand for our products or services.
The
Company services customers in numerous foreign countries. As such, we
are subject not only to U.S. climate change legislation but may also be subject
to certain international climate change accords. A variety of regulatory
developments, proposals or requirements have been introduced and/or adopted in
the international regions in which we operate that are focused on restricting
the emission of carbon dioxide, methane and other greenhouse gases. Among these
developments are the United Nations Framework Convention on Climate Change, also
known as the “Kyoto Protocol, ” and the European Union Emissions Trading System
(“EU ETS”), which was launched as an international “cap and trade” system on
allowances for emitting greenhouse gases. These international regulatory
developments may curtail production and demand for fossil fuels such as oil and
gas in areas of the world where the Company and our customers operate and thus
adversely affect future demand for the Company’s products and services, which
may in turn adversely affect the Company’s future results of
operations.
Climate
change regulations restricting emissions of greenhouse gases could result in
increased operating costs and reduced demand for our products or
services.
On
December 15, 2009, the U.S. Environmental Protection Agency (the “EPA”)
officially published its findings that emissions of carbon dioxide, methane and
other greenhouse gases present an endangerment to human health and the
environment because emissions of such gases are, according to the EPA,
contributing to warming of the Earth’s atmosphere and other climatic changes.
These findings by the EPA allow the agency to proceed with the adoption and
implementation of regulations that would restrict emissions of greenhouse gases
under existing provisions of the federal Clean Air Act. In late September 2009,
the EPA had proposed two sets of regulations in anticipation of finalizing its
findings that would require a reduction in emissions of greenhouse gases from
motor vehicles and that could also lead to the imposition of greenhouse gas
emission limitations in Clean Air Act permits for certain stationary sources. In
addition, on September 22, 2009, the EPA issued a final rule requiring the
reporting of greenhouse gas emissions from specified large greenhouse gas
emission sources in the United States beginning in 2011 for emissions occurring
in 2010. The adoption and implementation of any regulations imposing reporting
obligations on, or limiting emissions of greenhouse gases from, our equipment
and operations could require the Company to incur costs to reduce emissions of
greenhouse gases associated with operations, could adversely impact customers’
operations or demand for customers’ products, or could adversely affect demand
for the Company’s products or services.
Item 1B. Unresolved
Staff Comments.
None
Item 2. Properties
The
Company's major manufacturing facilities are located in and near Lufkin, Texas,
are company-owned and include approximately 150 acres, a foundry, machine shops,
structural shops, assembly shops and warehouses. The facilities by
segment are:
|
Oil
Field:
|
|
|
Pumping
Unit Manufacturing
|
240,000
sq. ft.
|
|
Foundry
Operations
|
687,000
sq. ft.
|
|
Power
Transmission:
|
|
|
New
Unit Manufacturing
|
458,000
sq. ft.
|
|
Repair
Operations
|
84,000
sq. ft.
|
|
Former
Trailer Manufacturing
|
388,000
sq. ft.
|
|
Corporate
Facilities
|
33,000
sq. ft.
|
Through
the acquisitions of ILS and RMT in 2009, the Company added two leased
manufacturing facilities:
|
Lufkin
ILS- Houston, TX
|
50,000
sq. ft.
|
|
Lufkin
RMT- Wellsville, NY
|
23,500
sq. ft.
|
Also, the
Company has numerous service centers throughout the U.S. to support the Oil
Field and Power Transmission segments. The majority of these locations are
company-owned, with some leased. None of these leases qualify as capital
leases.
Internationally,
there are company-owned facilities for the production and servicing of pumping
units and power transmission products. The facilities by segment
are:
|
Oil
Field (Pumping unit manufacturing and repair):
|
|
|
Nisku,
Alberta, Canada
|
66,000
sq. ft.
|
|
Comodoro
Rivadia, Argentina
|
125,000
sq. ft.
|
|
Power
Transmission (New unit manufacturing and repair):
|
|
|
Fougerolles,
France
|
377,000
sq. ft.
|
Also, the
Company has several international service centers to support the Oil Field
segment. The majority of these locations are owned by the Company, with some
leased. None of these leases qualify as capital leases.
Item 3. Legal Proceedings
On March
7, 1997, a class action complaint was filed against Lufkin Industries, Inc. (the
“Company”) in the U.S. District Court for the Eastern District of Texas by an
employee and a former employee of the Company who alleged race discrimination in
employment. Certification hearings were conducted in Beaumont, Texas in February
1998 and in Lufkin, Texas in August 1998. In April 1999, the District Court
issued a decision that certified a class for this case, which included all black
employees employed by the Company from March 6, 1994, to the present. The case
was administratively closed from 2001 to 2003 while the parties unsuccessfully
attempted mediation. Trial for this case began in December 2003, and after the
close of plaintiff’s evidence, the court adjourned and did not complete the
trial until October 2004. Although plaintiff’s class certification encompassed a
wide variety of employment practices, plaintiffs presented only disparate impact
claims relating to discrimination in initial assignments and promotions at
trial.
On
January 13, 2005, the District Court entered its decision finding that the
Company discriminated against African-American employees in initial assignments
and promotions. The District Court also concluded that the discrimination
resulted in a shortfall in income for those employees and ordered that the
Company pay those employees back pay to remedy such shortfall, together with
pre-judgment interest in the amount of 5%. On August 29, 2005, the District
Court determined that the back pay award for the class of affected employees was
$3.4 million (including interest to January 1, 2005) and provided a formula for
attorney fees that the Company estimates will result in a total not to exceed
$2.5 million. In addition to back pay with interest, the District Court (i)
enjoined and ordered the Company to cease and desist all racially biased
assignment and promotion practices and (ii) ordered the Company to pay court
costs and expenses.
The
Company reviewed this decision with its outside counsel and on September 19,
2005, appealed the decision to the U.S. Court of Appeals for the Fifth Circuit.
On April 3, 2007, the Company appeared before the appellate court in New Orleans
for oral argument in this case. The appellate court subsequently issued a
decision on Friday, February 29, 2008 that reversed and vacated the plaintiff’s
claim regarding the initial assignment of black employees into the Foundry
Division. The court also denied plaintiff’s appeal for class certification of a
class disparate treatment claim. Plaintiff’s claim on the issue of the Company’s
promotional practices was affirmed but the back pay award was vacated and
remanded for recomputation in accordance with the opinion. The
District Court’s injunction was vacated and remanded with instructions to enter
appropriate and specific injunctive relief. Finally, the issue of plaintiff’s
attorney’s fees was remanded to the District Court for further consideration in
accordance with prevailing authority.
On
December 5, 2008, the U.S. District Court Judge Clark held a hearing in
Beaumont, Texas during which he reviewed the 5th U.S.
Circuit Court of Appeals class action decision and informed the parties that he
intended to implement the decision in order to conclude this litigation. At the
conclusion of the hearing Judge Clark ordered the parties to submit positions
regarding the issues of attorney fees, a damage award and injunctive relief.
Subsequently, the Company reviewed the plaintiff’s submissions which described
the formula and underlying assumptions that supported their positions on
attorney fees and damages. After careful review of the plaintiff’s submission to
the court the Company continued to have significant differences regarding legal
issues that materially impacted the plaintiff’s requests. As a result of these
different results, the court requested further evidence from the parties
regarding their positions in order to render a final decision. The
judge reviewed both parties arguments regarding legal fees, and awarded the
plaintiffs an interim fee, but at a reduced level from the plaintiffs original
request. The Company and the plaintiffs reconciled the majority of the
differences and the damage calculations which also lowered the originally
requested amounts of the plaintiffs on those matters. Due to the
resolution of certain legal proceedings on damages during first half of 2009 and
the District Court awarding the plaintiffs an interim award of attorney fees and
cost totaling $5.8 million, the Company recorded an additional provision of $5.0
million in the first half of 2009 above the $6.0 million recorded in fourth
quarter of 2008. The plaintiffs filed an appeal of the District Court’s interim
award of attorney fees with the U.S. Fifth Circuit Court of Appeals. The Fifth
Circuit subsequently dismissed these appeals on August 28, 2009 on the basis
that an appealable final judgment in this case had not been
issued. The court commented that this issue can be reviewed with an
appeal of final judgment.
On
January 15, 2010, the U.S. District Court for the Eastern District of Texas
notified the Company that it had entered a final judgment related to the
Company’s ongoing class-action lawsuit. The Court ordered the Company to pay the
plaintiffs $3.3 million in damages, $2.2 million in pre-judgment interest and
0.41% interest for any post-judgment interest. The Company had previously
estimated the total liability for damages and interest to be approximately $5.2
million. The Court also ordered the plaintiffs to submit a request for legal
fees and expenses from January 1, 2009 through the date of the final judgment.
The plaintiffs are required to submit this request within 14 days of the final
judgment. On January 29, 2010, the plaintiffs filed a motion with the U.S.
District Court for the Eastern District of Texas for a supplemental award of
$0.7 million for attorney’s fees, costs and expenses incurred between January 1,
2009 and January 15, 2010, as allowed in the final judgment issued by the Court
on January 15, 2010, related to the Company’s ongoing class-action lawsuit. In
the fourth quarter of 2009, the Company recorded a provision of $1.0 million for
these legal expenses and accrual adjustments for the final judgment award of
damages.
On
January 15, 2010, the plaintiffs filed a notice of appeal with the U.S. Fifth
Circuit Court of Appeals of the District Court’s final judgment. On January 21,
2010, The Company filed a notice of cross-appeal with the same
court. In addition, the Company filed a motion with the District
Court to stay the payment of damages referenced in the District Court’s final
judgment pending the outcome of the Fifth Circuit’s decision on both parties’
appeals. The District Court granted this motion to stay.
There are
various other claims and legal proceedings arising in the ordinary course of
business pending against or involving the Company wherein monetary damages are
sought. For certain of these claims, the Company maintains insurance
coverage while retaining a portion of the losses that occur through the use of
deductibles and retention limits. Amounts in excess of the
self-insured retention levels are fully insured to limits believed appropriate
for the Company’s operations. Self-insurance accruals are based on
claims filed and an estimate for claims incurred but not
reported. While the Company does maintain insurance above its
self-insured levels, a decline in the financial condition of its insurer, while
not currently anticipated, could result in the Company recording additional
liabilities. It is management’s opinion that the Company’s liability
under such circumstances or involving any other non-insured claims or legal
proceedings would not materially affect its consolidated financial position,
results of operations, or cash flow.
Item 4. Reserved
None
PART
II
Item 5. Market
for Registrant's Common Equity, Related Stockholder Matters and
Issuer Purchases of Equity Securities
Common
Stock Information
The
Company's common stock is traded on the NASDAQ National Market under the symbol
“LUFK.” As of January 31, 2010, there were approximately 387 record holders of
the Company’s common stock. This number does not include any beneficial owners
for whom shares of common stock may be held in “nominee” or “street” name. The
following table sets forth, for each quarterly period during fiscal 2009 and
2008, the high and low sales price per share of the Company’s common stock and
the dividends paid per share on the Company’s common stock.
|
2009
|
2008
|
|||||||||||||||||||||||
|
Stock
Price
|
Stock
Price
|
|||||||||||||||||||||||
|
Quarter
|
High
|
Low
|
Dividend
|
High
|
Low
|
Dividend
|
||||||||||||||||||
|
First
|
$ | 41.25 | $ | 26.96 | $ | 0.25 | $ | 65.50 | $ | 50.85 | $ | 0.25 | ||||||||||||
|
Second
|
48.16 | 29.51 | 0.25 | 86.82 | 62.53 | 0.25 | ||||||||||||||||||
|
Third
|
53.81 | 36.38 | 0.25 | 95.23 | 70.93 | 0.25 | ||||||||||||||||||
|
Fourth
|
75.74 | 49.53 | 0.25 | 79.25 | 31.45 | 0.25 | ||||||||||||||||||
The
Company has paid cash dividends for 70 consecutive years. Total
dividend payments were $14.9 million, $14.8 million and $13.1 million in 2009,
2008 and 2007, respectively.
Equity
Compensation Plan Information
The
following table sets forth securities of the Company authorized for issuance
under equity compensation plans at December 31, 2009.
|
Plan
Category
|
Number
of securities to be issued upon exercise of outstanding options, warrants
and rights (a)
|
Weighted-average
exercise price of outstanding options, warrants and rights
(b)
|
Number
of securities remaining available for future issuance under equity
compensation plans (excluding securities reflected in column
(a))
|
|||||||||
|
Equity
compensation plans approved by security holders
|
709,015 | $ | 52.56 | 786,592 | ||||||||
|
Equity
compensation plans not approved by security holders
|
- | - | - | |||||||||
|
Total
|
709,015 | $ | 52.56 | 786,592 | ||||||||
Performance Graph- Total
Stockholder Return
The
following is a line graph comparing cumulative, five –year total shareholder
return with a general market index (the NASDAQ Market Index) and a published
industry index of oil and gas equipment/service providers (Hemscott Industry
Group 124).
The graph
shall not be deemed incorporated by reference by any general statement
incorporating by reference this Form 10-K into any filing under the Securities
Act of 1933, as amended, or the Securities Exchange Act of 1934, as amended,
except to the extent that the Company specifically incorporates this information
by reference, and shall not otherwise be deemed filed under such
acts.
Comparison
of 5 Year Cumulative Total Return*
Among
Lufkin Industries, Inc., the NASDAQ Market Index and an Industry
Index
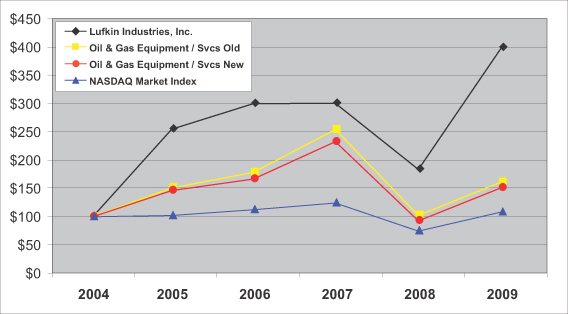
* $100
invested on 12/31/04 in stock and index-including reinvestment of dividends for
fiscal years ending December 31.
Performance
graph data provided by R. R. Donnelley Financial.
Item 6. Selected Financial Data
Five
Year Summary of Selected Consolidated Financial Data
The
following table sets forth certain selected historical consolidated financial
data from continuing operations and should be read in conjunction with
“Management’s Discussion and Analysis of Financial Condition and Results of
Operations” and the Consolidated Financial Statements and Notes thereto included
elsewhere in this annual report on Form 10-K. The following
information may not be indicative of future operating results.
|
(In
millions, except per share data)
|
2009
|
2008
|
2007
|
2006
|
2005
|
|||||||||||||||
|
Sales
|
$ | 521.4 | $ | 741.2 | $ | 555.8 | $ | 526.1 | $ | 413.7 | ||||||||||
|
Earnings
from continuing operations
|
22.5 | 88.0 | 71.8 | 71.3 | 44.5 | |||||||||||||||
|
Earnings
per share from continuing operations:
|
||||||||||||||||||||
|
Basic
|
1.51 | 5.96 | 4.82 | 4.80 | 3.05 | |||||||||||||||
|
Diluted
|
1.51 | 5.91 | 4.76 | 4.71 | 2.98 | |||||||||||||||
|
Total
assets
|
541.6 | 530.7 | 500.7 | 409.1 | 338.3 | |||||||||||||||
|
Cash
dividends per share
|
1.00 | 1.00 | 0.88 | 0.62 | 0.38 | |||||||||||||||
Item
7. Management's Discussion and Analysis
of Financial Condition and Results of Operations
Overview
General
Lufkin
Industries is a global supplier of oil field and power transmission products.
Through its Oil Field segment, the Company manufactures and services artificial
lift equipment and related products, which are used to extract crude oil and
other fluids from wells. Through its Power Transmission segment, the Company
manufactures and services high-speed and low-speed increasing and reducing
gearboxes for industrial applications. While these markets are
price-competitive, technological and quality differences can provide product
differentiation.
The
Company’s strategy is to differentiate its products through additional
value-added capabilities. Examples of these capabilities are high-quality
engineering, customized designs, rapid manufacturing response to demand through
plant capacity, inventory and vertical integration, superior quality and
customer service, and an international network of service
locations. In addition, the Company’s strategy is to maintain a low
debt-to-equity ratio in order to quickly take advantage of growth opportunities
and pay dividends even during unfavorable business cycles.
In
support of the above strategy, the Company has been making capital investments
in Oil Field to increase manufacturing capacity and capabilities in its three
main manufacturing facilities in Lufkin, Texas, Canada and Argentina. These
investments should reduce production lead times, improve quality and reduce
manufacturing costs. Investments also continue to be made to expand the
Company’s presence in automation products and international service. During the
first quarter of 2009, the Company purchased International Lift Systems (“ILS”),
which manufactures and services gas lift, plunger lift and completion equipment
for the oil and gas industry. In Power Transmission, the Company continues to
expand its gear repair network by opening and expanding facilities in various
locations in the U.S. and Canada. The Company is making targeted capital
investments in the U.S. and France to expand capacity, develop new product lines
and reduce manufacturing lead times, in addition to certain capital investments
targeting cost reductions. On July 1, 2009, the Company purchased
Rotating Machinery Technology, Inc. (RMT), which specializes in the analysis,
design and manufacture of precision, custom-engineered tilting-pad bearings and
related components for high-speed turbo equipment operating in critical duty
applications. RMT also services, repairs and upgrades turbo-expander process
units for air and gas separation, both on-site with its skilled field service
team and at its repair facility in Wellsville, New York.
Trends/Outlook
Oil
Field
Demand
for artificial lift equipment is primarily dependent on the level of new onshore
oil wells, workover drilling activity, the depth and fluid conditions of such
drilling activity and general field maintenance budgets. Drilling activity is
driven by the available cash flow of the Company’s customers as well as their
long-term perceptions of the level and stability of the price of oil. Increasing
energy prices from 2004 to late 2008 increased the demand for pumping units and
related service and products from higher drilling activity, activation of idle
wells and the upgrading of existing wells. During the first nine months of 2008,
demand levels in North America increased over the levels experienced in 2007 as
higher energy prices drove increased drilling and workover activity.
Additionally, the demand for pumping units, oilfield services and automation
equipment continued to increase in international markets as well as a partial
recapture of market share from imported equipment domestically.
In the
fourth quarter of 2008, energy prices dramatically declined due to reductions in
global demand. Planned new drilling and workover activity has also reduced
significantly as capital and operating budgets have been reduced. Exploration
and production (E&P) companies have reduced drilling in higher-cost fields
that are not economically viable at lower energy prices and have reduced overall
capital budgets in order to remain cash-flow positive and avoid the
more-expensive credit markets. These declines were more pronounced in the U.S.,
but are starting to be reflected in international markets. New pumping unit
booking levels declined in the fourth quarter of 2008 from lower demand, order
cancellations for units scheduled to ship in 2009 and price reductions for units
scheduled to ship in 2009. These price reductions were primarily in response to
the decline in raw material costs in the fourth quarter of 2008 for steel and
iron castings.
These
negative trends continued into the first quarter of 2009 and worsened during the
second quarter of 2009 as E&P companies deferred or cancelled drilling
programs and reduced field spending in response to lower energy prices. This
trend has been more pronounced in North America than in international markets.
As drilling activity reduced in response to lower oil prices, demand for
artificial lift equipment and related service also was negatively impacted.
Also, as raw material costs declined and surplus equipment increased, there was
competitive pressure to lower selling prices. Lower selling prices combined with
the negative impact of low capacity utilization in manufacturing facilities
caused gross margins to decline in 2009. In the second half of 2009, oil prices
increased back to 2007 levels and drilling activity, especially for oil,
increased. This trend is expected to continue in 2010, with higher drilling
activity and lower surplus equipment inventory driving demand for new artificial
lift equipment.
While the
market is suffering a cyclical decline, the Company continues to believe that
there are long-term positive growth trends for artificial lift equipment, and as
existing fields mature, the market will require an increased use of artificial
lift, especially in the South American, Russian and Middle Eastern
markets. The acquisition of ILS is consistent with the
Company’s long-term growth strategy of integrating strategic assets to leverage
Lufkin’s position of industry leadership. ILS has a solid reputation
for high-quality products, customer responsiveness and long-standing
relationships with major independent and super-major integrated
companies. This provides an entry for Lufkin into the offshore market
for artificial lift wells, including deepwater plays, and expanded reach into
the artificial lift market.
Power
Transmission
Power
Transmission services many diverse markets, with high-speed gearing for markets
such as petrochemicals, refineries, offshore production and transmission of oil
and slow-speed gearing for the gas, rubber, sugar, paper, steel, plastics,
mining, cement and marine propulsion, each of which has its own unique set of
drivers. Generally, if global industrial capacity utilizations are not high,
spending on new equipment lags. Also impacting demand are government regulations
involving safety and environmental issues that can require capital spending.
Recent market demand increases have come from energy-related markets such as
refining, petrochemical, drilling, coal, marine and power generation in response
to higher global energy prices. During the latter part of 2008, energy prices
decreased significantly, global growth slowed and large project financing became
difficult to secure. New order booking declined in the first half of 2009, which
negatively impacted sales starting in late 2009. While sales will remain at
these lower levels during the first half of 2010, new order and quotation
activity, especially from large LNG projects, during this period is expected to
increase and should translate into higher sales in the latter half of
2010.
Discontinued
Operations
During
the second quarter of 2008, the Trailer segment was classified as a discontinued
operation. In January 2008, the Company announced the decision to suspend its
participation in the commercial trailer markets and to develop a plan to run-out
existing inventories, fulfill contractual obligations and close all trailer
facilities in 2008. During the second quarter of 2008, this plan was completed,
with the majority of the remaining inventory and manufacturing equipment sold
and all facilities closed.
Trailer
generated expense of $0.5 million in 2009 and income of $0.2 million and $2.4
million, net of tax, during 2008, and 2007, respectively.
Other
During
both 2009 and 2008, the Company booked a contingent liability provision of $6.0
million (pre-tax) per year for its ongoing class-action lawsuit. For
additional information, please see Part I, Item 3 of this Form
10-K.
Summary
of Results
The
Company generally monitors its performance through analysis of sales, gross
margin (gross profit as a percentage of sales) and net earnings, as well as
debt/equity levels, short-term debt levels, and cash balances
Overall,
sales for 2009 decreased to $521.4 million from $741.2 million for 2008, or
29.7%, and were $555.8 million for 2007. This decrease was primarily driven by
decreased sales of Oil Field products and services in the U.S. market but also
weakness in Power Transmission sales.
Gross
margin for 2009 decreased to 21.6% from 28.9% for 2008 and 29.2% for 2007,
primarily due to lower selling prices due to lower customer demand and the
availability of surplus equipment combined with the negative impact of lower
plant utilization in the Oilfield segment.
Higher
selling, general and administrative expenses also negatively impacted net
earnings, with these expenses increasing to $75.1 million during 2009 from $72.0
million during 2008 and $57.6 million during 2007. This increase in 2009 was
primarily related to resources added from the ILS and RMT acquisitions. As a
percentage of sales, selling, general and administrative expenses increased to
14.4% during 2009 compared to 9.7% during 2008 and 10.4% during 2006. The
Company has made the strategic decision to maintain employment levels in this
area to focus on new product and geographic expansion opportunities. Operating
income was also impacted by a litigation reserve of $6.0 million during 2009 and
$6.0 million during 2008 related to its ongoing class-action
lawsuit.
The
Company reported net earnings from continuing operations of $22.5 million, or
$1.51 per share (diluted), for 2009, compared to net earnings from continuing
operations of $88.0 million, or $5.91 per share (diluted), for 2008, and net
earnings from continuing operations of $71.8 million, or $4.76 per share
(diluted), for 2007.
Debt/equity
(long-term debt net of current portion as a percentage of total equity) levels
were 0.3% as of December 31, 2009 and 0.0% as of December 31, 2008 and December
31, 2007. Cash balances at December 31, 2009, were $100.9 million, down from
$107.8 million at December 31, 2008.
Year
Ended December 31, 2009 Compared to Year Ended December 31, 2008:
The
following table summarizes the Company’s sales and gross profit by operating
segment (in thousands of dollars):
|
Increase/
|
%
Increase/
|
|||||||||||||||
|
Year
Ended December 31
|
2009
|
2008
|
(Decrease)
|
(Decrease)
|
||||||||||||
|
Sales
|
||||||||||||||||
|
Oil
Field
|
$ | 349,168 | $ | 551,814 | $ | (202,646 | ) | (36.7 | ) | |||||||
|
Power
Transmission
|
172,191 | 189,380 | (17,189 | ) | (9.1 | ) | ||||||||||
|
Total
|
$ | 521,359 | $ | 741,194 | $ | (219,835 | ) | (29.7 | ) | |||||||
|
Gross Profit
|
||||||||||||||||
|
Oil
Field
|
$ | 65,510 | $ | 153,673 | $ | (88,163 | ) | (57.4 | ) | |||||||
|
Power
Transmission
|
47,034 | 60,286 | (13,252 | ) | (22.0 | ) | ||||||||||
|
Adjustment*
|
- | 115 | (115 | ) | (100.0 | ) | ||||||||||
|
Total
|
$ | 112,544 | $ | 214,074 | $ | (101,530 | ) | (47.4 | ) | |||||||
*Due to
the discontinuation of the Trailer segment, certain items previously allocated
to that segment in cost of sales have been reclassified to continuing
operations. The adjustment is related to pension and postretirement charges
associated with Trailer personnel that will continue to be a liability in future
years.
Oil
Field
Oil Field
sales decreased to $349.2 million, or by 36.7%, for the year ended December 31,
2009, from $551.8 million for the year ended December 31, 2008. New pumping unit
sales of $188.2 million during 2009 were down $153.9 million, or 45.0%, compared
to $342.1 million during 2008, primarily from lower U.S. demand and pricing
pressure. Pumping unit service sales of $84.9 million during 2009
were down $18.1 million, or 17.6%, compared to $103.0 million during 2008, from
declines in the U.S. market. Automation sales of $51.4 million during 2009 were
down $30.9 million, or 37.5%, compared to $82.4 million during 2008, from lower
sales in the U.S and pricing pressure. Commercial casting sales of $9.3 million
during 2009 were down $15.1 million, or 61.6%, compared to $24.4 million during
2008, from lower sales to the machine tool market. Sales from Lufkin ILS
contributed $15.3 million during 2009. Oil Field’s backlog decreased to $43.3
million as of December 31, 2009, from $188.1 million at December 31, 2008. This
decrease was caused primarily by lower orders for new pumping units as U.S. and
international customers deferred or cancelled drilling programs in response to
lower energy prices.
Gross
margin (gross profit as a percentage of sales) for the Oil Field segment
decreased to 18.8% for year ended December 31, 2009, compared to 27.8% for the
year ended December 31, 2008, or 9.0 percentage points. This gross margin
decrease was related to price reductions in response to material price decreases
and lower customer demand and the negative impact of lower plant utilization on
fixed cost coverage.
Direct
selling, general and administrative expenses for Oil Field increased to $26.7
million, or by 18.2%, for the year ended December 31, 2009, from $22.6 million
for the year ended December 31, 2008. The majority of this increase is related
to higher international sales commissions as well as the resources added with
the ILS acquisition. Direct selling, general and administrative expenses as
a percentage of sales increased to 7.6% for the year ended December 31, 2009,
from 4.1% for the year ended December 31, 2008.
Power
Transmission
Sales for
the Company’s Power Transmission segment decreased to $172.2 million, or by
9.1%, for the year ended December 31, 2009, compared to $189.4 million for the
year ended December 31, 2008. New unit sales of $131.8 million during 2009 were
down $13.1 million, or 9.0%, compared to $144.9 million during 2008. Repair and
service sales of $38.4 million during 2009 were down $6.1 million, or 13.7%,
compared to $44.5 million during 2008 as customers deferred spending on
maintenance projects due to poor economic conditions. Sales from Lufkin RMT
contributed $2.0 million during 2009. Power Transmission backlog at December 31,
2009, decreased to $97.0 million from $129.3 million at December 31, 2008,
primarily from decreased bookings of new units for the energy-related and marine
markets.
Gross
margin for the Power Transmission segment decreased to 27.3% for the
year ended December 31, 2009, compared to 31.8% for the year ended December 31,
2008, or 4.5 percentage points. This gross margin decrease was primarily from
the unfavorable impact of lower production levels in manufacturing and repair on
fixed cost coverage.
Direct
selling, general and administrative expenses for Power Transmission remained at
$23.5 million for the year ended December 31, 2009, compared to the year
ended December 31, 2008. However, direct selling, general and administrative
expenses as a percentage of sales increased to 13.7% for the year ended December
31, 2009, from 12.4% for the year ended December 31, 2008.
Corporate/Other
Corporate
administrative expenses, which are allocated to the segments primarily based on
budgeted sales levels, were $24.9 million for the year ended December 31, 2009,
a decrease of $1.0 million or 4.0%, from $25.9 million for the year ended
December 31, 2008.
Interest
income, interest expense and other income and expense for the year ended
December 31, 2009, increased to $1.6 million of income compared to $0.3 million
of income for the year ended December 31, 2008, from currency gains offsetting
reduced interest income and increased interest expense.
Pension
expense, which is reported as an increase in cost of sales, increased to $10.7
million for the year ended December 31, 2009, compared to pension income of $1.3
million for the year ended December 31, 2008. This expense increase was
primarily due to lower expected returns on asset balances and the amortization
of previously deferred market losses out of other comprehensive income. Pension
expense in 2010 is expected to be consistent with 2009 levels.
The net
tax rate for the year ended December 31, 2009, was 31.9%, compared to 35.5% for
the year ended December 31, 2008. The net tax rate in 2009 benefitted from
adjustments to prior period tax filings in the U.S., the settlement of the 2006
IRS tax audit, revised 199 manufacturing deduction claims and R&E tax credit
estimate adjustments. The tax rate for 2010 is expected to be approximately
36.0%.
Year
Ended December 31, 2008 Compared to Year Ended December 31, 2007:
The
following table summarizes the Company’s sales and gross profit by operating
segment (in thousands of dollars):
|
Increase/
|
%
Increase/
|
|||||||||||||||
|
Year
Ended December 31
|
2008
|
2007
|
(Decrease)
|
(Decrease)
|
||||||||||||
|
Sales
|
||||||||||||||||
|
Oil
Field
|
$ | 551,814 | $ | 397,354 | $ | 154,460 | 38.9 | |||||||||
|
Power
Transmission
|
189,380 | 158,452 | 30,928 | 19.5 | ||||||||||||
|
Total
|
$ | 741,194 | $ | 555,806 | $ | 185,388 | 33.4 | |||||||||
|
Gross Profit
|
||||||||||||||||
|
Oil
Field
|
$ | 153,673 | $ | 109,091 | $ | 44,582 | 40.9 | |||||||||
|
Power
Transmission
|
60,286 | 52,476 | 7,810 | 14.9 | ||||||||||||
|
Adjustment*
|
115 | 701 | (586 | ) | (83.6 | ) | ||||||||||
|
Total
|
$ | 214,074 | $ | 162,268 | $ | 51,806 | 31.9 | |||||||||
*Due to
the discontinuation of the Trailer segment, certain items previously allocated
to that segment in cost of sales have been reclassified to continuing
operations. The adjustment is related to pension and postretirement charges
associated with Trailer personnel that will continue to be a liability in future
years.
Oil
Field
Oil Field
sales increased to $551.8 million, or by 38.9%, for the year ended December 31,
2008, from $397.4 million for the year ended December 31, 2007. New unit sales
of $342.1 million during 2008 were up $113.9 million, or 49.9%, compared to
$228.2 million during 2007, primarily from higher U.S. demand. Service sales of
$103.0 million during 2008 were up $20.8 million, or 25.3%, compared to $82.2
million during 2007, from growth in the U.S. market. Automation sales of $82.4
million during 2008 were up $25.5 million, or 44.8%, compared to $56.9 million
during 2007, from growth in U.S. sales. Commercial casting sales of $24.4
million during 2008 were down $5.7 million, or 19.0%, compared to $30.1 million
during 2007, from lower sales to the machine tool market. Oil Field’s backlog
also increased to $188.1 million as of December 31, 2008, from $76.9 million at
December 31, 2007. This increase was driven by increased bookings for new units
for the U.S. and Latin American markets as higher energy prices drove increased
drilling and workover activity. Also, certain U.S. customers placed orders for
new units to be shipped through the first half of 2009 versus their normal
buying practice of ordering units as needed.
Gross
margin (gross profit as a percentage of sales) for the Oil Field segment
increased to 27.8%, or 0.3 percentage points, for year ended December 31,
2008, compared to 27.5% for the year ended December 31, 2007. This gross margin
increase was related to price increases instituted to offset material price
increases and the favorable mix effect of increased new unit sales, partially
offset by higher raw material costs resulting in an increase to LIFO inventory
reserves of $4.1 million, or 0.7 percentage points of gross margin, related to
the inflationary impact of higher raw material prices for steel and
castings.
Direct
selling, general and administrative expenses for Oil Field increased to $22.6
million, or by 31.8%, for the year ended December 31, 2008, from $17.1 million
for the year ended December 31, 2007. This increase is due to higher
employee-related expenses in support of increased sales volumes, third-party
commissions and bad debt provisions. In the fourth quarter of 2008, a
provision of $1.2 million was made for the probable bankruptcy of a Middle East
customer. However, direct selling, general and administrative expenses as a
percentage of sales decreased to 4.1% for the year ended December 31, 2008, from
4.3% for the year ended December 31, 2007.
Power
Transmission
Sales for
the Company’s Power Transmission segment increased to $189.4 million, or by
19.5%, for the year ended December 31, 2008, compared to $158.5 million for the
year ended December 31, 2007. New unit sales of $144.9 million during 2008 were
up $24.7 million, or 20.5%, compared to $120.2 million during 2007, from
increased sales of high-speed units for the oil and gas markets and increased
sales of marine units for the coastal, river and inland-waterway transportation
markets. Repair and service sales of $44.5 million during 2008 were up $6.3
million, or 16.4%, compared to $38.2 million during 2007. Power Transmission
backlog at December 31, 2008, increased to $129.3 million from $122.2 million at
December 31, 2007, primarily from increased bookings of new units for the
energy-related and marine markets.
Gross
margin for the Power Transmission segment decreased to 31.8%, or by
1.3 percentage points, for the year ended December 31, 2008, compared to 33.1%
for the year ended December 31, 2007. This gross margin decrease was primarily
from higher raw material costs resulting in additions to LIFO inventory reserves
of $1.7 million, or 0.9 percentage points of gross margin, related to the
inflationary impact of higher raw material prices for steel and castings and
from the unfavorable mix effect of increased marine unit sales.
Direct
selling, general and administrative expenses for Power Transmission increased to
$23.5 million, or by 32.1%, for the year ended December 31, 2008, from
$17.8 million for the year ended December 31, 2007. This increase was due to
higher employee-related expenses in support of increased sales volumes,
third-party commissions in certain international markets and bad debt
provisions. In the fourth quarter of 2008, a provision of $1.2 million was
made for the bankruptcy of a U.S. petrochemical customer. Direct selling,
general and administrative expenses as a percentage of sales increased to 12.4%
for the year ended December 31, 2008, from 11.2% for the year
ended December 31, 2007.
Corporate/Other
Corporate
administrative expenses, which are allocated to the segments primarily based on
historical third-party revenues, were $25.9 million for the year ended December
31, 2008, an increase of $3.2 million or 12.5%, from $22.7 million for the year
ended December 31, 2007, primarily from higher personnel-related expenses
in support of sales volume growth and increased professional service
fees.
Interest
income, interest expense and other income and expense for the year ended
December 31, 2008, decreased to $0.3 million of income compared to income of
$4.8 million for the year ended December 31, 2007, primarily due to lower
interest rates on invested cash balances and the unfavorable currency impact of
the weakening Canadian dollar during 2008 compared to 2007.
Pension
income, which is reported as a reduction of cost of sales, decreased to $1.3
million for the year ended December 31, 2008, or by 60%, compared to $3.3
million for the year ended December 31, 2007. This decrease was primarily due to
lower expected returns on asset balances.
The net
tax rate for the year ended December 31, 2008, was 35.5% compared to 34.4% for
the year ended December 31, 2007. The net tax rate in 2007 benefitted from a
reduction in tax reserves on items falling out of statute. Also, the 2008 net
tax rate was unfavorably impacted by higher state taxes due to the mix of sales
shifting towards higher-tax jurisdictions.
Due to
the discontinuation of the Trailer segment, certain items previously allocated
to that segment have been reclassified to continuing operations. One adjustment
is related to pension and postretirement charges associated with Trailer
personnel that will continue to be a liability in future years. The other
adjustment is for corporate allocations previously charged to Trailer, as these
expenses will continue in the future.
Liquidity
and Capital Resources
The
Company has historically relied on cash flows from operations and third-party
borrowing to finance its operations, including acquisitions, dividend payments
and stock repurchases. The Company believes that its cash flows from operations
and its available borrowing capacity under its credit agreements will be
sufficient to fund its operations, including planned capital expenditures,
dividend payments and stock repurchases, through December 31, 2010, and the
foreseeable future.
The
Company’s cash balance totaled $100.9 million at December 31, 2009, compared to
$107.8 million at December 31, 2008. For the year ended December 31, 2009,
net cash provided by operating activities was $101.8 million, net cash used in
investing activities totaled $91.8 million and net cash used in financing
activities amounted to $17.4 million. Significant components of cash provided by
operating activities included net earnings from continuing operations, adjusted
for non-cash expenses, of $48.7 million and a decrease in working capital of
$53.1 million. This working capital decrease was primarily due to a reduction in
trade receivables balances of $59.3 million and inventory balances of $28.7
million due to sales volumes declines since the fourth quarter of 2008,
partially offset by reductions in accounts payable and accrued liabilities of
$29.4 million. Net cash used in investing activities included net capital
expenditures totaling $38.9 million and the ILS and RMT acquisitions totaling
$51.7 million. Capital expenditures in 2009 were primarily for new facilities to
support geographical and product line expansions in the Oil Field and Power
Transmission segments. Capital expenditures for 2010 are projected to
approximately remain at the 2009 spending levels, primarily for the new
facilities to support geographical and product line expansions and equipment
replacement for efficiency improvements in the Oil Field and Power Transmission
segments and will be funded by operating cash flows. The Company is reviewing
additional international expansion opportunities that would require significant
capital spending over several years, but these plans have not been finalized.
Significant components of net cash used by financing activities included
dividend payments of $14.9 million, or $1.00, per share and debt repayments of
$3.4 million.
The
Company has a three-year credit facility with a domestic bank (the “Bank
Facility”) consisting of an unsecured revolving line of credit that provides up
to $40.0 million of aggregate borrowing. This Bank Facility expires
on December 31, 2010. Borrowings under the Bank Facility bear interest, at
the Company’s option, at either the greater of (i) the prime rate, (ii) the base
CD rate plus an applicable margin or (iii) the Federal Funds Effective Rate plus
an applicable margin or the London Interbank Offered Rate plus an applicable
margin, depending on certain ratios as defined in the Bank Facility. As of
December 31, 2009, no debt was outstanding under the Bank Facility and the
Company was in compliance with all financial covenants under the terms of the
Bank Facility. Deducting outstanding letters of credit of $16.4 million, $23.6
million of borrowing capacity was available at December 31, 2009. The
fair market value of the outstanding debt as of December 31, 2009 is not
materially different than its carrying value.
The
Company assumed various notes payable and entered into purchase price hold back
agreements in conjunction with the ILS and RMT acquisitions in 2009. These
obligations will require principal payments of $1.3 million during
2010.
The
following table summarizes the Company’s expected cash outflows from financial
contracts and commitments as of December 31, 2009. Information on recurring
purchases of materials for use in manufacturing and service operations has not
been included. These amounts are not long-term in nature (less than three
months) and are generally consistent from year to year.
|
(In
thousands of dollars)
|
Payments
due by period
|
|||||||||||||||||||
|
Less
than
|
1 - 3 | 3 - 5 |
More
than
|
|||||||||||||||||
|
Contractual
obligations
|
Total
|
1
year
|
years
|
years
|
5
years
|
|||||||||||||||
|
Operating
lease obligations
|
$ | 9,748 | $ | 1,800 | $ | 1,997 | $ | 1,331 | $ | 4,620 | ||||||||||
|
Contractual
commitments for capital expenditures
|
6,105 | 6,105 | - | - | - | |||||||||||||||
|
Contractual
debt obligations
|
2,888 | 1,372 | 1,516 | - | - | |||||||||||||||
|
Total
|
$ | 18,741 | $ | 9,277 | $ | 3,513 | $ | 1,331 | $ | 4,620 | ||||||||||
Since the
Company has no significant tax loss carryforwards, the Company expects to make
quarterly estimated tax payments in 2010 based on taxable income levels. Also,
the Company has various qualified retirement plans for which the Company has
committed a certain level of benefit. The Company expects to make contributions
to its pension plans of $5.4 million and to its post-retirement health and life
plans of approximately $0.6 million in 2010. Contribution levels to these plans
after 2010 will depend on participation in the plans, possible plan changes,
discount rates and actual rates of return on plan assets.
As
discussed in Note 17 – “Business Segment Information” in the Notes to
Consolidated Financial Statements, set forth in Part II, Item 6 of this Form
10-K, the Consolidated Balance Sheet at December 31, 2009 includes approximately
$1.5 million of liabilities associated with uncertain tax positions in the
jurisdictions in which Lufkin conducts business. Due to the uncertain and
complex application of tax regulations, combined with the difficulty in
predicting when tax audits throughout the world may be concluded, Lufkin cannot
make reliable estimates of the timing of cash outflows relating to these
liabilities.
Off-Balance
Sheet Arrangements
None.
Recently
Issued Accounting Pronouncements
In
September 2009, the Financial Accounting Standards Board (FASB) issued
Accounting Standards Update (ASU) 2009-13, Revenue Recognition (Topic
605): Multiple – Deliverable Revenue Arrangements – a
consensus of the FASB Emerging Issues Task Force, which changes the accounting
for certain revenue arrangements. The new requirements change the allocation
methods used in determining how to account for multiple payment streams and will
result in the ability to separately account for more deliverables, and
potentially less revenue deferrals. Additionally, ASU 2009-13 requires enhanced
disclosures in financial statements. ASU 2009-13 is effective for revenue
arrangements enter into or materially modified in fiscal years beginning after
June 15, 2010 on a prospective basis, with early application permitted. The
Company is currently evaluating the impact ASU 2009-13 will have on our
financial statements.
In
December 2008, the FASB issued guidance under ASC 715, Compensation – Retirement Benefits –
Defined Benefit Plans, requiring annual disclosure of major categories of
plan assets, investment policies and strategies, fair value measurement of plan
assets and significant concentration of credit risks related to defined benefit
pension or other postretirement plans. This guidance is effective for
fiscal years ending after December 15, 2009.
Management
believes the impact of other recently issued guidance, which is not yet
effective, will not have a material impact on the Company's consolidated
financial statements upon adoption.
Critical
Accounting Policies and Estimates
The
discussion and analysis of financial condition and results of operations are
based upon the Company’s consolidated financial statements, which have been
prepared in accordance with accounting principles generally accepted in the
United States of America. The preparation of these financial statements requires
the Company to make estimates and judgments that affect the reported amounts of
assets, liabilities, revenues and expenses and related disclosure of contingent
assets and liabilities. The Company evaluates its estimates on an ongoing basis,
based on historical experience and on various other assumptions that are
believed to be reasonable under the circumstances. Actual results may differ
from these estimates under different assumptions or conditions. The Company
believes the following critical accounting policies affect its more significant
judgments and estimates used in preparation of its consolidated
statements.
The
Company extends credit to customers in the normal course of business. Management
performs ongoing credit evaluations of our customers and adjusts credit limits
based upon payment history and the customer’s current credit worthiness. An
allowance for doubtful accounts has been established to provide for estimated
losses on receivable collections. The balance of this allowance is determined by
regular reviews of outstanding receivables and historical experience. As the
financial condition of customers change, circumstances develop or additional
information becomes available, adjustments to the allowance for doubtful
accounts may be required.
Revenue
is not recognized until it is realized or realizable and earned. The
criteria to meet this guideline are: persuasive evidence of an arrangement
exists, delivery has occurred or services have been rendered, the price to the
buyer is fixed or determinable and collectibility is reasonably
assured. In some cases, a customer is not able to take delivery of a
completed product and requests that the Company store the product for a defined
period of time. The Company will process a Bill-and-Hold invoice and recognize
revenue at the time of the storage request if all of the following criteria are
met:
|
l
|
The
customer has accepted title and risk of loss;
|
|
l
|
The
customer has provided a written purchase order for the
product;
|
|
l
|
The
customer, not the Company, requested the product to be stored and to be
invoiced under a Bill-and-Hold arrangement. The customer must also provide
the business purpose for the storage request;
|
|
l
|
The
customer must provide a storage period and future shipping
date;
|
|
l
|
The
Company must not have retained any future performance obligations on the
product;
|
|
l
|
The
Company must segregate the stored product and not make it available to use
on other orders; and
|
|
l
|
The
product must be completed and ready for
shipment.
|
The
Company has made significant investments in inventory to service its customers.
On a routine basis, the Company uses estimates in determining the level of
reserves required to state inventory at the lower of cost or market.
Management’s estimates are primarily influenced by market activity levels,
production requirements, the physical condition of products and technological
innovation. Changes in any of these factors may result in adjustments to the
carrying value of inventory. Also, the Company accounts for a significant
portion of its inventory under the LIFO method. The LIFO reserve can be impacted
by changes in the LIFO layers and by inflation index adjustments. Generally,
annual increases in the inflation rate or the FIFO value of inventory cause the
value of the LIFO reserve to increase.
Long-lived
assets held and used by the Company are reviewed for impairment whenever events
or changes in circumstances indicate that the carrying amount of an asset may
not be recoverable. The Company assesses the recoverability of long-lived assets
by determining whether the carrying value can be recovered through projected
undiscounted cash flows, based on expected future operating results. Future
adverse market conditions or poor operating results could result in the
inability to recover the current carrying value and thereby possibly requiring
an impairment charge in the future.
Goodwill
acquired in connection with business combinations represent the excess of
consideration over the fair value of net assets acquired. The Company performs
impairment tests on the carrying value of goodwill at least annually or whenever
events or changes in circumstances indicate the carrying value of goodwill may
be greater than fair value, such as significant underperformance relative to
historical or projected operating results and significant negative industry or
economic trends. The Company’s fair value is primarily determined using
discounted cash flows, which requires management to make judgments about future
operating results, working capital requirements and capital spending levels.
Changes in cash flow assumptions or other factors which negatively impact the
fair value of the operations would influence the evaluation and may result in a
determination that goodwill is impaired and a corresponding impairment
charge.
The
application of income tax law is inherently complex. The Company is required to
determine if an income tax position meets the criteria of more-likely-than-not
to be realized based on the merits of the position under tax laws, in order to
recognize an income tax benefit. This requires the Company to make many
assumptions and judgments regarding merits of income tax positions and the
application of income tax law. Additionally, if a tax position meets the
recognition criteria of more-likely-than-not the Company is required to make
judgments and assumptions to measure the amount of the tax benefits to recognize
based on the probability of the amount of tax benefits that would be realized if
the tax position was challenged by the taxing authorities. Interpretations and
guidance surrounding income tax laws and regulations change over time. As a
consequence, changes in assumptions and judgments can materially affect amounts
recognized in the consolidated financial statements.
Deferred
tax assets and liabilities are recognized for the differences between the book
basis and tax basis of the net assets of the Company. In providing for deferred
taxes, management considers current tax regulations, estimates of future taxable
income and available tax planning strategies. Changes in state, federal and
foreign tax laws as well as changes in the financial position of the Company
could also affect the carrying value of deferred tax assets and liabilities. If
management estimates that some or all of any deferred tax assets will expire
before realization or that the future deductibility is more-likely-than-not, a
valuation allowance would be recorded.
The
Company is subject to claims and legal actions in the ordinary course of
business. The Company maintains insurance coverage for various aspects of its
businesses and operations. The Company retains a portion of the insured losses
that occur through the use of deductibles. Management regularly reviews
estimates of reported and unreported insured and non-insured claims and legal
actions and provides for losses through reserves. As circumstances develop and
additional information becomes available, adjustments to loss reserves may be
required.
The
Company sells certain of its products to customers with a product warranty that
provides repairs at no cost to the customer or the issuance of credit to the
customer. The length of the warranty term depends on the product being sold, but
ranges from one year to five years. The Company accrues its estimated exposure
to warranty claims based upon historical warranty claim costs as a percentage of
sales multiplied by prior sales still under warranty at the end of any period.
Management reviews these estimates on a regular basis and adjusts the warranty
provisions as actual experience differs from historical estimates or other
information becomes available.
The
Company offers defined benefit plans and other benefits upon the retirement of
its employees. Assets and liabilities associated with these benefits are
calculated by third-party actuaries under the rules provided by various
accounting standards, with certain estimates provided by management. These
estimates include the discount rate, expected rate of return of assets and the
rate of increase of compensation and health claims. On a regular basis,
management reviews these estimates by comparing them to actual experience and
those used by other companies. If a change in an estimate is made, the carrying
value of these assets and liabilities may have to be adjusted. Assuming all
other variables held constant, differences in the discount rate and expected
long-term rate of return on plan assets within reasonably likely ranges would
have had the following estimated impact on 2009 results excluding the impact of
curtailment:
|
Pension
|
Other
|
|||||||
|
(Thousands
of dollars)
|
Benefits
|
Benefits
|
||||||
|
Discount rate
|
||||||||
|
Effect
of change on net periodic benefit cost (income):
|
||||||||
|
.25
percentage point increase
|
$ | (613 | ) | $ | (16 | ) | ||
|
.25
percentage point decrease
|
641 | 10 | ||||||
|
Effect
of change on PBO/APBO:
|
||||||||
|
.25
percentage point increase
|
$ | (5,962 | ) | $ | (195 | ) | ||
|
.25
percentage point decrease
|
6,257 | 203 | ||||||
|
Long-term rate of return on plan
assets
|
||||||||
|
Effect
of change on net periodic benefit cost (income):
|
||||||||
|
.25
percentage point increase
|
$ | (429 | ) | $ | - | |||
|
.25
percentage point decrease
|
429 | - | ||||||
Forward-Looking
Statements and Assumptions
This
annual report on Form 10-K contains forward-looking statements and information,
within the meaning of the Private Securities Litigation Reform Act of 1995, that
are based on management’s beliefs as well as assumptions made by and information
currently available to management. When used in this report, the words “will,”
“anticipate,” “believe,” “estimate,” “expect,” “plan,” “schedule,” “could,”
“may,” “might,” “should,” “project” or similar expressions are intended to
identify forward-looking statements. Similarly, statements that describe the
Company’s future plans, objectives or goals are also forward-looking statements.
Such statements reflect the Company’s current views with respect to certain
events and are subject to certain assumptions, risks and uncertainties, many of
which are outside the control of the Company. Undue reliance should not be place
on forward-looking statements. These risks and uncertainties include, but are
not limited to:
|
l
|
oil
prices;
|
|
l
|
declines
in domestic and worldwide oil and gas drilling;
|
|
l
|
capital
spending levels of oil producers;
|
|
l
|
availability
and prices for raw materials;
|
|
l
|
the
inherent dangers and complexities of our operations;
|
|
l
|
uninsured
judgments or a rise in insurance premiums;
|
|
l
|
the
inability to effectively integrate acquisitions;
|
|
l
|
labor
disruptions and increasing labor costs;
|
|
l
|
the
availability of qualified and skilled labor;
|
|
l
|
disruption
of our operating facilities or management information
systems;
|
|
l
|
the
impact on foreign operations of war, political disruption, civil
disturbance, economic and legal sanctions and changes in global trade
policies;
|
|
l
|
currency
exchange rate fluctuations in the markets in which the Company
operates;
|
|
l
|
changes
in the laws, regulations, policies or other activities of governments,
agencies and similar organizations where such actions may affect the
production, licensing, distribution or sale of the Company’s products, the
cost thereof or applicable tax rates;
|
|
l
|
costs
related to legal and administrative proceedings, including adverse
judgments against the Company if the Company fails to prevail in reversing
such judgments; and
|
|
l
|
general
industry, political and economic conditions in the markets where the
Company’s procures material, components and supplies for the production of
the Company’s principal products or where the Company’s products are
produced, distributed or sold.
|
These and
other risks are described in greater detail in “Risk Factors” included elsewhere
in this annual report on Form 10-K. All forward-looking statements attributable
to the Company or persons acting on its behalf are expressly qualified in their
entirety by these factors. Should one or more of these risks or
uncertainties materialize, or should underlying assumptions prove incorrect,
actual results may vary materially from those anticipated, believed, estimated
or expected. The Company undertakes no obligations to update or
revise its forward-looking statements, whether as a result of new information,
future events or otherwise.
Item 7A. Quantitative
and Qualitative Disclosures About Market Risk
The
Company’s financial instruments include cash, accounts receivable, accounts
payable, invested funds and debt obligations. The book value of accounts
receivable, short-term debt and accounts payable are considered to be
representative of their fair market value because of the short maturity of these
instruments. While the Company’s accounts receivable are concentrated with
customers in the energy industry the Company performs credit evaluations on
current and potential customers and adjusts credit limits as
appropriate. In certain circumstances the Company will obtain
collateral to mitigate higher credit risk.
The
Company does not utilize financial or derivative instruments for trading
purposes or to hedge exposures to interest rates, foreign currency rates or
commodity prices. Due to the lack of current debt, the Company does not have any
significant exposure to interest rate fluctuations. However, if the Company drew
on its line of credit under its Bank Facility, the Company would have exposure
since the interest rate is variable. In addition, the Company primarily invoices
and purchases in the same currency as the functional currency of its operations,
which minimizes exposure to currency rate fluctuations.
The
Company uses large amounts of steel, iron and electricity in the manufacture of
its products. The price of these raw materials has a significant
impact on the cost of producing products. Steel and electricity
prices have increased significantly in the last five years, caused primarily by
higher energy prices and increased global demand. Since most of the
Company’s suppliers are not currently parties to long-term contracts with us,
the Company is vulnerable to fluctuations in prices of such raw
materials. Factors such as supply and demand, freight costs and
transportation availability, inventory levels of brokers and dealers, the level
of imports and general economic conditions may affect the price of cast iron and
steel. Raw material prices may increase significantly in the
future. Certain items such as steel round, bearings and aluminum have
continued to experience price increases, price volatility and longer lead times.
If the Company is unable to pass future raw material price increases on to its
customers, margins, results of operations, cash flow and financial condition
could be adversely affected.
The
Company is exposed to currency fluctuations with intercompany debt denominated
in U.S. dollars owed by its French and Canadian subsidiaries. As of December 31,
2009, this inter-company debt was comprised of a $0.3 million receivable and a
$7.7 million payable from France and Canada, respectively. As of December 31,
2009, if the U.S. dollar strengthened by 10% over these currencies, the net
income impact would be $0.5 million of expense and if the U.S. dollar weakened
by 10% over these currencies, the net income impact would be $0.5 million of
income. Also, certain assets and liabilities, primarily employee and tax related
in Argentina, denominated in the local currency of foreign operations whose
functional currency is the U.S. dollar are exposed to fluctuations in currency
rates. As of December 31, 2009, if the U.S. dollar strengthened by 10% over
these currencies, the net income impact would be $0.1 million of expense and if
the U.S. dollar weakened by 10% over these currencies, the net income impact
would be $0.1 million of income.
Item 8. Financial Statements and Supplementary Data
Management’s
Report on Internal Control over Financial Reporting
The
management of Lufkin Industries, Inc. (the “Company”), is responsible for
establishing and maintaining adequate internal control over financial reporting
(as defined in Rule 13a-15(f) and Rule 15d-15(f) promulgated under the
Securities Exchange Act of 1934, as amended). The Company’s management assessed
the effectiveness of the Company’s internal control over financial reporting as
of December 31, 2009. In making this assessment, the Company’s management used
the criteria set forth by the Committee of Sponsoring Organizations of the
Treadway Commission (“COSO”) in “Internal Control- Integrated
Framework.”
Based on
this assessment, management believes that, as of December 31, 2009, the
Company’s internal control over financial reporting is effective based on those
criteria.
The
effectiveness of the Company’s internal control over financial reporting as of
December 31, 2009, has been audited by Deloitte & Touche LLP, an independent
registered accounting firm, as stated in their report which appears
herein.
Index
to Financial Statements
Report of
Independent Registered Public Accounting Firm
Consolidated
Balance Sheets
Consolidated
Statements of Earnings
Consolidated
Statements of Shareholders’ Equity & Comprehensive Income
Consolidated
Statements of Cash Flows
Notes to
Consolidated Financial Statements
REPORT
OF INDEPENDENT REGISTERED PUBLIC ACCOUNTING FIRM
To the
Board of Directors and Stockholders of Lufkin Industries, Inc.
Lufkin,
Texas
We have
audited the accompanying consolidated balance sheets of Lufkin Industries, Inc.
and subsidiaries (the "Company") as of December 31, 2009 and 2008, and the
related consolidated statements of earnings, stockholders' equity and
comprehensive income, and cash flows for each of the three years in the period
ended December 31, 2009. Our audits also included the financial statement
schedule listed in the Index at Item 15. We also have audited the Company's
internal control over financial reporting as of December 31, 2009, based on
criteria established in Internal Control — Integrated
Framework issued by the Committee of Sponsoring Organizations of the
Treadway Commission. The Company's management is responsible for these financial
statements and financial statement schedule, for maintaining effective internal
control over financial reporting, and for its assessment of the effectiveness of
internal control over financial reporting, included in Management’s Report on
Internal Control over Financial Reporting at Item 8. Our responsibility is to
express an opinion on these financial statements and financial statement
schedule and an opinion on the Company's internal control over financial
reporting based on our audits.
We
conducted our audits in accordance with the standards of the Public Company
Accounting Oversight Board (United States). Those standards require that we plan
and perform the audit to obtain reasonable assurance about whether the financial
statements are free of material misstatement and whether effective internal
control over financial reporting was maintained in all material respects. Our
audits of the financial statements included examining, on a test basis, evidence
supporting the amounts and disclosures in the financial statements, assessing
the accounting principles used and significant estimates made by management, and
evaluating the overall financial statement presentation. Our audit of internal
control over financial reporting included obtaining an understanding of internal
control over financial reporting, assessing the risk that a material weakness
exists, testing and evaluating the design and operating effectiveness of
internal control based on the assessed risk. Our audits also included performing
such other procedures as we considered necessary in the circumstances. We
believe that our audits provide a reasonable basis for our
opinions.
A
company's internal control over financial reporting is a process designed by, or
under the supervision of, the company's principal executive and principal
financial officers, or persons performing similar functions, and effected by the
company's board of directors, management, and other personnel to provide
reasonable assurance regarding the reliability of financial reporting and the
preparation of financial statements for external purposes in accordance with
generally accepted accounting principles. A company's internal control over
financial reporting includes those policies and procedures that (1) pertain to
the maintenance of records that, in reasonable detail, accurately and fairly
reflect the transactions and dispositions of the assets of the company; (2)
provide reasonable assurance that transactions are recorded as necessary to
permit preparation of financial statements in accordance with generally accepted
accounting principles and that receipts and expenditures of the company are
being made only in accordance with authorizations of management and directors of
the company; and (3) provide reasonable assurance regarding prevention or timely
detection of unauthorized acquisition, use, or disposition of the company's
assets that could have a material effect on the financial
statements.
Because
of the inherent limitations of internal control over financial reporting,
including the possibility of collusion or improper management override of
controls, material misstatements due to error or fraud may not be prevented or
detected on a timely basis. Also, projections of any evaluation of the
effectiveness of the internal control over financial reporting to future periods
are subject to the risk that the controls may become inadequate because of
changes in conditions, or that the degree of compliance with the policies or
procedures may deteriorate.
In our
opinion, the consolidated financial statements referred to above present fairly,
in all material respects, the financial position of Lufkin Industries, Inc. and
subsidiaries as of December 31, 2009 and 2008, and the results of their
operations and their cash flows for each of the three years in the period ended
December 31, 2009, in conformity with accounting principles generally accepted
in the United States of America. Also, in our opinion, such financial statement
schedule, when considered in relation to the basic consolidated financial
statements taken as a whole, presents fairly, in all material respects, the
information set forth therein. Also, in our opinion, the Company maintained, in
all material respects, effective internal control over financial reporting as of
December 31, 2009, based on the criteria established in Internal Control — Integrated
Framework issued by the Committee of Sponsoring Organizations of the
Treadway Commission.
/s/
DELOITTE & TOUCHE LLP
Houston,
Texas
LUFKIN
INDUSTRIES, INC.
CONSOLIDATED
BALANCE SHEETS
|
December
31, 2009 and 2008
|
||||||||
|
(Thousands
of dollars, except share and per share data)
|
||||||||
|
2009
|
2008
|
|||||||
|
Assets
|
||||||||
|
Current
Assets:
|
||||||||
|
Cash
and cash equivalents
|
$ | 100,858 | $ | 107,756 | ||||
|
Receivables,
net
|
92,506 | 139,144 | ||||||
|
Income
tax receivable
|
4,303 | 978 | ||||||
|
Inventories
|
110,605 | 128,627 | ||||||
|
Deferred
income tax assets
|
5,198 | 4,941 | ||||||
|
Other
current assets
|
4,351 | 3,674 | ||||||
|
Current
assets from discontinued operations
|
811 | 618 | ||||||
|
Total
current assets
|
318,632 | 385,738 | ||||||
|
Property,
plant and equipment, net
|
159,770 | 130,079 | ||||||
|
Goodwill,
net
|
45,001 | 11,862 | ||||||
|
Other
assets, net
|
18,187 | 2,546 | ||||||
|
Long-term
assets from discontinued operations
|
- | 493 | ||||||
|
Total
assets
|
$ | 541,590 | $ | 530,718 | ||||
|
Liabilities
and Shareholders' Equity
|
||||||||
|
Current
liabilities:
|
||||||||
|
Accounts
payable
|
$ | 19,993 | $ | 38,543 | ||||
|
Current
portion of long-term debt
|
1,372 | - | ||||||
|
Accrued
liabilities:
|
||||||||
|
Payroll
and benefits
|
9,568 | 14,046 | ||||||
|
Warranty
expenses
|
4,220 | 3,586 | ||||||
|
Taxes
payable
|
4,562 | 5,894 | ||||||
|
Other
|
24,147 | 25,340 | ||||||
|
Current
liabilities from discontinued operations
|
1,026 | 1,404 | ||||||
|
Total
current liabilities
|
64,888 | 88,813 | ||||||
|
Long-term
debt
|
1,516 | - | ||||||
|
Deferred
income tax liabilities
|
10,950 | 9,219 | ||||||
|
Postretirement
benefits
|
7,874 | 7,070 | ||||||
|
Other
liabilities
|
20,647 | 11,618 | ||||||
|
Commitments
and contingencies
|
- | - | ||||||
|
Long-term
liabilities from discontinued operations
|
37 | 61 | ||||||
|
Shareholders'
equity:
|
||||||||
|
Common
stock, $1.00 par value per share; 60,000,000 shares authorized; 15,808,588
and 15,791,963 shares issued , respectively
|
15,809 | 15,792 | ||||||
|
Capital
in excess par
|
70,508 | 63,014 | ||||||
|
Retained
earnings
|
421,908 | 414,748 | ||||||
|
Treasury
stock, 923,168 and 931,168 shares, respectively, at cost
|
(34,621 | ) | (34,917 | ) | ||||
|
Accumulated
other comprehensive income (loss)
|
(37,926 | ) | (44,700 | ) | ||||
|
Total
shareholders' equity
|
435,678 | 413,937 | ||||||
|
Total
liabilities and shareholders' equity
|
$ | 541,590 | $ | 530,718 | ||||
See notes
to consolidated financial statements.
LUFKIN
INDUSTRIES, INC.
CONSOLIDATED
STATEMENTS OF EARNINGS
Years
ended December 31, 2009, 2008 and 2007
(Thousands
of dollars, except per share data)
|
2009
|
2008
|
2007
|
||||||||||
|
Sales
|
$ | 521,359 | $ | 741,194 | $ | 555,806 | ||||||
|
Cost
of sales
|
408,815 | 527,120 | 393,538 | |||||||||
|
Gross
profit
|
112,544 | 214,074 | 162,268 | |||||||||
|
Selling,
general and administrative expenses
|
75,120 | 71,974 | 57,582 | |||||||||
|
Litigation
reserve
|
6,000 | 6,000 | - | |||||||||
|
Operating
income
|
31,424 | 136,100 | 104,686 | |||||||||
|
Interest
income
|
899 | 1,737 | 3,751 | |||||||||
|
Interest
expense
|
(650 | ) | (193 | ) | (273 | ) | ||||||
|
Other
income (expense), net
|
1,339 | (1,232 | ) | 1,294 | ||||||||
|
Earnings
from continuing operations before income
|
||||||||||||
|
tax
provision
|
33,012 | 136,412 | 109,458 | |||||||||
|
Income
tax provision
|
10,533 | 48,387 | 37,673 | |||||||||
|
Earnings
from continuing operations
|
22,479 | 88,025 | 71,785 | |||||||||
|
(Loss)
earnings from discontinued operations, net of tax
|
(453 | ) | 214 | 2,426 | ||||||||
|
Net
earnings
|
$ | 22,026 | $ | 88,239 | $ | 74,211 | ||||||
|
Basic
earnings per share
|
||||||||||||
|
Earnings
from continuing operations
|
$ | 1.51 | $ | 5.96 | $ | 4.82 | ||||||
|
(Loss)
earnings from discontinued operations
|
(0.03 | ) | 0.01 | 0.16 | ||||||||
|
Net
earnings
|
$ | 1.48 | $ | 5.97 | $ | 4.98 | ||||||
|
Diluted
earnings per share
|
||||||||||||
|
Earnings
from continuing operations
|
$ | 1.51 | $ | 5.91 | $ | 4.76 | ||||||
|
(Loss)
earnings from discontinued operations
|
(0.03 | ) | 0.01 | 0.16 | ||||||||
|
Net
earnings
|
$ | 1.48 | $ | 5.92 | $ | 4.92 | ||||||
See notes
to consolidated financial statements.
LUFKIN
INDUSTRIES, INC.
CONSOLIDATED STATEMENTS OF
SHAREHOLDERS' EQUITY &
COMPREHENSIVE INCOME
|
Accumulated
|
||||||||||||||||||||||||||||||||
|
Common
|
Other
|
|||||||||||||||||||||||||||||||
|
Stock
|
Capital
|
Compre-
|
Compre-
|
|||||||||||||||||||||||||||||
|
Years
Ended December 31, 2009, 2008 and 2007
|
Shares,
net
|
Common
|
In
Excess
|
Retained
|
Treasury
|
hensive
|
hensive
|
|||||||||||||||||||||||||
|
(Thousands
of dollars, except share data)
|
of
Treasury
|
Stock
|
of
Par
|
Earnings
|
Stock
|
Income
|
Income
(Loss)
|
Total
|
||||||||||||||||||||||||
|
Balance,
Dec. 31, 2006
|
14,927,625 | $ | 15,323 | $ | 38,173 | $ | 280,198 | $ | (4,083 | ) | $ | (1,471 | ) | $ | 328,140 | |||||||||||||||||
|
Comprehensive
income:
|
||||||||||||||||||||||||||||||||
|
Net
earnings
|
74,211 | 74,211 | 74,211 | |||||||||||||||||||||||||||||
|
Other
comprehensive income, net of tax:
|
||||||||||||||||||||||||||||||||
|
Foreign
currency translation adjsutments
|
5,057 | 5,057 | 5,057 | |||||||||||||||||||||||||||||
|
Defined
benefit pension plans
|
6,979 | 6,979 | 6,979 | |||||||||||||||||||||||||||||
|
Defined
benefit post-retirement plans
|
504 | 504 | 504 | |||||||||||||||||||||||||||||
|
Total
comprehensive income
|
$ | 86,751 | ||||||||||||||||||||||||||||||
|
Cash
dividends
|
(13,094 | ) | (13,094 | ) | ||||||||||||||||||||||||||||
|
Treasury
stock purchases
|
(500,000 | ) | (27,497 | ) | (27,497 | ) | ||||||||||||||||||||||||||
|
Stock-based
compensation
|
3,682 | 3,682 | ||||||||||||||||||||||||||||||
|
Exercise
of stock options
|
211,281 | 211 | 6,460 | 6,671 | ||||||||||||||||||||||||||||
|
Balance,
Dec. 31, 2007
|
14,638,906 | $ | 15,534 | $ | 48,315 | $ | 341,315 | $ | (31,580 | ) | $ | 11,069 | $ | 384,653 | ||||||||||||||||||
|
Comprehensive
income:
|
||||||||||||||||||||||||||||||||
|
Net
earnings
|
88,239 | 88,239 | 88,239 | |||||||||||||||||||||||||||||
|
Other
comprehensive income, net of tax:
|
||||||||||||||||||||||||||||||||
|
Foreign
currency translation adjsutments
|
(5,503 | ) | (5,503 | ) | (5,503 | ) | ||||||||||||||||||||||||||
|
Defined
benefit pension plans
|
(50,142 | ) | (50,142 | ) | (50,142 | ) | ||||||||||||||||||||||||||
|
Defined
benefit post-retirement plans
|
(124 | ) | (124 | ) | (124 | ) | ||||||||||||||||||||||||||
|
Total
comprehensive income
|
$ | 32,470 | ||||||||||||||||||||||||||||||
|
Cash
dividends
|
(14,806 | ) | (14,806 | ) | ||||||||||||||||||||||||||||
|
Treasury
stock purchases
|
(71,890 | ) | (4,623 | ) | (4,623 | ) | ||||||||||||||||||||||||||
|
Stock-based
compensation
|
3,584 | 3,584 | ||||||||||||||||||||||||||||||
|
Exercise
of stock options
|
293,779 | 258 | 11,115 | 1,286 | 12,659 | |||||||||||||||||||||||||||
|
Balance,
Dec. 31, 2008
|
14,860,795 | $ | 15,792 | $ | 63,014 | $ | 414,748 | $ | (34,917 | ) | $ | (44,700 | ) | $ | 413,937 | |||||||||||||||||
|
Comprehensive
income:
|
||||||||||||||||||||||||||||||||
|
Net
earnings
|
22,026 | 22,026 | 22,026 | |||||||||||||||||||||||||||||
|
Other
comprehensive income, net of tax:
|
||||||||||||||||||||||||||||||||
|
Foreign
currency translation adjsutments
|
3,525 | 3,525 | 3,525 | |||||||||||||||||||||||||||||
|
Defined
benefit pension plans
|
3,993 | 3,993 | 3,993 | |||||||||||||||||||||||||||||
|
Defined
benefit post-retirement plans
|
(744 | ) | (744 | ) | (744 | ) | ||||||||||||||||||||||||||
|
Total
comprehensive income
|
$ | 28,800 | ||||||||||||||||||||||||||||||
|
Cash
dividends
|
(14,866 | ) | (14,866 | ) | ||||||||||||||||||||||||||||
|
Treasury
stock purchases
|
11 | 11 | ||||||||||||||||||||||||||||||
|
Tax
settlement on stock-based compensation
|
3,880 | 3,880 | ||||||||||||||||||||||||||||||
|
Stock-based
compensation
|
2,943 | 2,943 | ||||||||||||||||||||||||||||||
|
Exercise
of stock options
|
24,626 | 17 | 671 | 285 | 973 | |||||||||||||||||||||||||||
|
Balance,
Dec. 31, 2009
|
14,885,421 | $ | 15,809 | $ | 70,508 | $ | 421,908 | $ | (34,621 | ) | $ | (37,926 | ) | $ | 435,678 | |||||||||||||||||
See notes to consolidated financial
statements.
LUFKIN
INDUSTRIES, INC.
CONSOLIDATED
STATEMENTS OF CASH FLOWS
|
Years
ended December 31, 2009, 2008 and 2007
|
||||||||||||
|
(Thousands
of dollars)
|
||||||||||||
|
2009
|
2008
|
2007
|
||||||||||
|
Cash
flows form operating activities:
|
||||||||||||
|
Net
earnings
|
$ | 22,026 | $ | 88,239 | $ | 74,211 | ||||||
|
Adjustments
to reconcile net earnings to cash provided by operating
activities:
|
||||||||||||
|
Depreciation
and amortization
|
18,457 | 15,699 | 14,008 | |||||||||
|
(Recovery)
provision for losses on receivables
|
(1,840 | ) | 2,508 | 11 | ||||||||
|
LIFO
(income) expense
|
(2,964 | ) | 7,742 | 1,905 | ||||||||
|
Deferred
income tax (benefit)/provision
|
(913 | ) | (3 | ) | 7,250 | |||||||
|
Excess
tax benefit from share-based compensation
|
(259 | ) | (4,140 | ) | (3,031 | ) | ||||||
|
Share-based
compensation expense
|
2,943 | 3,584 | 3,682 | |||||||||
|
Pension
expense (income)
|
10,665 | (1,274 | ) | (3,257 | ) | |||||||
|
Postretirement
expense (income)
|
539 | (48 | ) | (400 | ) | |||||||
|
(Gain)
loss on disposition of property, plant and equipment
|
(354 | ) | 27 | (636 | ) | |||||||
|
Loss
(income) from discontinued operations
|
453 | (214 | ) | (2,426 | ) | |||||||
|
Changes
in:
|
||||||||||||
|
Receivables,
net
|
58,461 | (52,554 | ) | (2,928 | ) | |||||||
|
Income
tax receivable
|
(3,248 | ) | 1,409 | (4,573 | ) | |||||||
|
Inventories
|
28,650 | (46,151 | ) | (15,596 | ) | |||||||
|
Other
current assets
|
(1,376 | ) | (2,144 | ) | 177 | |||||||
|
Accounts
payable
|
(22,878 | ) | 24,201 | 7,788 | ||||||||
|
Accrued
liabilities
|
(6,531 | ) | 12,060 | 13,532 | ||||||||
|
Net
cash provided by continuing operations
|
101,831 | 48,941 | 89,717 | |||||||||
|
Net
cash (used in) provided by discontinued operations
|
- | (1,813 | ) | 593 | ||||||||
|
Net
cash provided by operating activities
|
101,831 | 47,128 | 90,310 | |||||||||
|
Cash
flows from investing activites:
|
||||||||||||
|
Additions
to property, plant and equipment
|
(39,825 | ) | (29,552 | ) | (18,815 | ) | ||||||
|
Proceeds
from disposition of property, plant and equipment
|
923 | 219 | 1,383 | |||||||||
|
(Increase)
decrease in other assets
|
(1,216 | ) | 579 | (64 | ) | |||||||
|
Acquisition
of other companies
|
(51,658 | ) | - | - | ||||||||
|
Net
cash used in continuing operations
|
(91,776 | ) | (28,754 | ) | (17,496 | ) | ||||||
|
Net
cash provided by (used in) discontinued operations
|
- | 1,813 | (593 | ) | ||||||||
|
Net
cash used in investing activities
|
(91,776 | ) | (26,941 | ) | (18,089 | ) | ||||||
|
Cash
flows from financing activites:
|
||||||||||||
|
Payments
of notes payable
|
(3,426 | ) | - | - | ||||||||
|
Dividends
paid
|
(14,866 | ) | (14,806 | ) | (13,094 | ) | ||||||
|
Excess
tax benefit from share-based compensation
|
259 | 4,140 | 3,031 | |||||||||
|
Proceeds
from exercise of stock options
|
612 | 8,295 | 3,467 | |||||||||
|
Purchases
of treasury stock
|
11 | (4,623 | ) | (27,497 | ) | |||||||
|
Net
cash used in financing activities
|
(17,410 | ) | (6,994 | ) | (34,093 | ) | ||||||
|
Effect
of translation on cash and cash equivalents
|
457 | (1,185 | ) | (177 | ) | |||||||
|
Net
(decrease) increase in cash and cash equivalents
|
(6,898 | ) | 12,008 | 37,951 | ||||||||
|
Cash
and cash equivalents at beginning of period
|
107,756 | 95,748 | 57,797 | |||||||||
|
Cash
and cash equivalents at end of period
|
$ | 100,858 | $ | 107,756 | $ | 95,748 | ||||||
See notes
to consolidated financial statements.
LUFKIN
INDUSTRIES, INC.
NOTES
TO CONSOLIDATED FINANCIAL STATEMENTS
(1)
Corporate Organization and Summary of Significant Accounting
Policies
Lufkin
Industries, Inc. and its consolidated subsidiaries (collectively, the “Company”)
manufacture and sell oil field pumping units and power transmission products
throughout the world.
Principles of
consolidation: The consolidated financial statements include
the accounts of Lufkin Industries, Inc. and its consolidated subsidiaries after
elimination of all inter-company accounts and transactions.
Use of estimates: The
preparation of financial statements in conformity with accounting principles
generally accepted in the United States of America (GAAP) requires management to
make estimates and assumptions that affect the reported amounts of assets and
liabilities and disclosure of contingent assets and liabilities as of the date
of the financial statements and the reported amounts of revenues and expenses
during the reporting periods. Actual results could differ from those
estimates.
Foreign
currencies: Assets and liabilities of foreign operations where
the applicable foreign currency is the functional currency are translated into
U.S. dollars at the exchange rate in effect at the end of each accounting
period, with any resulting gain or loss reflected in accumulated other
comprehensive income (loss) in the shareholders’ equity section of the balance
sheet. Income statement accounts are translated at the average
exchange rates prevailing during the period. Gains and losses
resulting from balance sheet remeasurement of foreign operations where the U.S.
dollar is the functional currency are included in the consolidated statement of
earnings as incurred.
Any gains
or losses on transactions denominated in a foreign currency are included in the
consolidated statements of earnings as incurred.
Cash equivalents: The Company
considers all highly liquid investments with maturities of three months or less
when purchased to be cash equivalents.
Revenue recognition: Revenue
is not recognized until it is realized or realizable and earned. The
criteria to meet this guideline are: persuasive evidence of an arrangement
exists, delivery has occurred or services have been rendered, the price to the
buyer is fixed or determinable and collectibility is reasonably
assured. The Company will process a Bill-and-Hold invoice and
recognize revenue at the time of the storage request if all of the following
criteria are met:
|
l
|
The
customer has accepted title and risk of loss;
|
|
l
|
The
customer has provided a written purchase order for the
product;
|
|
l
|
The
customer, not the Company, requested the product to be stored and to be
invoiced under a Bill-and-Hold arrangement. The customer must also provide
the business purpose for the storage request;
|
|
l
|
The
customer must provide a storage period and future shipping
date;
|
|
l
|
The
Company must not have retained any future performance obligations on the
product;
|
|
l
|
The
Company must segregate the stored product and not make it available to use
on other orders; and
|
|
l
|
The
product must be completed and ready for
shipment.
|
Amounts
billed for shipping are classified as sales and costs incurred for shipping are
classified as cost of sales in the consolidated statements of
earnings.
Accounts & Notes Receivable and
Allowance for Doubtful Accounts: Accounts and notes receivable are stated
at cost net of write-offs and allowance for doubtful accounts. The Company
establishes an allowance for doubtful accounts based on historical experience
and any specific customer issues that the Company has identified. Uncollected
receivables are generally reserved before being past due over one year or when
the Company has determined that the balance will not be collected.
Inventories: The
Company reports its inventories by using the last-in, first-out (LIFO) and the
first-in, first-out (FIFO) methods less reserves necessary to report inventories
at the lower of cost or estimated market. Inventory costs include
material, labor and factory overhead. On a routine basis, the Company uses
estimates in determining the level of reserves required to state inventory at
the lower of cost or market. Management’s estimates are primarily influenced by
market activity levels, production requirements, the physical condition of
products and technological innovation. Changes in any of these factors may
result in adjustments to the carrying value of inventory.
Property, plant and equipment (P. P.
& E.): The Company records investments in these assets at
cost. Improvements are capitalized, while repair and maintenance
costs are charged to operations as incurred. Gains or losses realized
on the sale or retirement of these assets are reflected in
income. The Company periodically reviews its P. P. & E. for
possible impairment whenever events or changes in circumstance might indicate
that the carrying amount of an asset may not be recoverable. An impairment loss
is recognized if the carrying amount of a long-lived asset is not recoverable
and exceeds its fair value. The carrying amount of a long-lived asset is not
recoverable if it exceeds the sum of the undiscounted cash flows expected to
result from the use and eventual disposition of the asset. Depreciation for
financial reporting purposes is provided on a straight-line method based upon
the estimated useful lives of the assets. Accelerated depreciation
methods are used for tax purposes. The following is a summary of the
Company’s P. P. & E. useful lives:
|
Useful
Life
|
||||||||||||
|
(in
years)
|
||||||||||||
|
Land
|
||||||||||||
|
Land
improvements
|
10.0 |
-
|
25.0 | |||||||||
|
Buildings
|
12.5 |
-
|
40.0 | |||||||||
|
Machinery
and equipment
|
3.0 |
-
|
15.0 | |||||||||
|
Furniture
and fixtures
|
5.0 |
-
|
12.5 | |||||||||
|
Computer
equipment and software
|
3.0 |
-
|
7.0 | |||||||||
Change in Accounting
Policy: We perform our goodwill impairment test at least
annually and more often if events or changes in circumstances indicate it is
more likely than not that its carrying value exceeds its fair value. Since the
adoption of ASC 350, Intangibles – Goodwill and
Other through March 1, 2009, we have performed the annual impairment
testing of goodwill using March 1 as the measurement date. Our financial and
strategic planning process, including the preparation of long-term cash flow
projections, commences in September and typically concludes in November of the
same year. These long-term cash flow projections are a key component in
performing our annual impairment test of goodwill. As a result, conducting the
annual impairment test using a March 1 measurement date has resulted in
inefficiencies and duplicative efforts on our resources. Accordingly, effective
in October 2009, we have changed our goodwill impairment measurement date from
March 1 to October 31. In the current year, we tested our goodwill for
impairment on October 31, 2009 and March 1, 2009, and concluded there was no
impairment of the carrying value of the goodwill. In addition, based
on the results of impairment tests performed in fiscal years 2008 and 2007, the
Company concluded there was no impairment of the carrying value of the goodwill
in the prior periods presented in the consolidated financial
statements. We believe that using the October 31 measurement date
will better align our resources with the completion of our long-term financial
projections. We believe that this accounting change is to an alternative
accounting principle that is preferable under the circumstances and does not
result in the delay, acceleration or avoidance of an impairment charge. We have
determined that this change in accounting principle does not result in
adjustments to our consolidated financial statements when applied
retrospectively.
Goodwill and other intangible
assets: Goodwill and intangible assets with indefinite lives are not
amortized, and are and tested for impairment at least annually. During the
fourth quarter of 2009, the Company completed its annual impairment evaluation
by comparing the fair value of each reporting unit to its carrying amount. No
impairment was recorded.
The
Company amortizes intangible assets with finite lives over the years expected to
be benefited.
Income taxes: The Company
computes taxes on income in accordance with the tax rules and regulations of the
many taxing jurisdictions where the income is earned. The income tax rates
imposed by these taxing authorities vary substantially. Taxable income may
differ from pretax income for financial accounting purposes. To the extent that
differences are due to revenue or expense items reported in one period for tax
purposes and in another period for financial accounting purposes, an appropriate
provision for deferred income taxes is made. Any effect of changes in income tax
rates or tax laws is included in the provision for income taxes in the period of
enactment. When it is more likely than not that a portion or all of a deferred
tax asset will not be realized in the future, the Company provides a
corresponding valuation allowance against deferred tax assets.
Appropriate
U.S. and foreign income taxes have been provided for earnings of foreign
subsidiary companies that are expected to be remitted in the near future. The
cumulative amount of undistributed earnings of foreign subsidiaries that the
Company intends to permanently reinvest and upon which no deferred US income
taxes have been provided is $70.0 million at December 31, 2009, the
majority of which has been generated in Argentina, Canada and France. Upon
distribution of these earnings in the form of dividends or otherwise, the
Company may be subject to US income taxes (subject to adjustment for foreign tax
credits) and foreign withholding taxes. It is not practical, however, to
estimate the amount of taxes that may be payable on the eventual remittance of
these earnings after consideration of available foreign tax
credits.
The
Company is required to determine if an income tax position meets the criteria of
more-likely-than-not to be realized based on the merits of the position under
tax laws, in order to recognize an income tax benefit. This requires the Company
to make many assumptions and judgments regarding merits of income tax positions
and the application of income tax law. Additionally, if a tax position meets the
recognition criteria of more-likely-than-not the Company is required to make
judgments and assumptions to measure the amount of the tax benefits to recognize
based on the probability of the amount of tax benefits that would be realized if
the tax position was challenged by the taxing authorities. Interpretations and
guidance surrounding income tax laws and regulations change over time. As a
consequence, changes in assumptions and judgments can materially affect amounts
recognized in the consolidated financial statements.
Financial
instruments: The Company’s financial instruments include cash,
accounts receivable, and accounts payable. The book value of accounts
receivable, short-term debt and accounts payable are considered to be
representative of their fair value because of the short maturity of these
instruments. As of December 31, 2009 and 2008, the Company had no
derivative financial instruments.
Stock-based compensation:
Employee services received in exchange for stock are expensed. The fair
value of the employee services received in exchange for stock is measured based
on the grant-date fair value. The fair value is estimated using the
Black-Scholes option-pricing model for the stock option. Awards granted are
expensed pro-ratably over the service period of the award. As stock based
compensation expense is recognized based on awards ultimately expected to vest,
compensation expense is reduced for estimated forfeitures based on historical
forfeiture rates. Forfeitures are estimated at the time of grant and revised, if
necessary, in subsequent periods to reflect actual forfeitures.
Product
warranties: The Company sells certain of its products to
customers with a product warranty that provides repairs at no cost to the
customer or the issuance of credit to the customer. The length of the warranty
term depends on the product being sold, but ranges from one year to five years.
The Company accrues its estimated exposure to warranty claims based upon
historical warranty claim costs as a percentage of sales multiplied by prior
sales still under warranty at the end of any period. Management reviews these
estimates on a regular basis and adjusts the warranty provisions as actual
experience differs from historical estimates or other information becomes
available.
Recently
issued accounting pronouncements:
In
September 2009, the Financial Accounting Standards Board (FASB) issued
Accounting Standards Update (ASU) 2009-13, Revenue Recognition (Topic
605): Multiple – Deliverable Revenue Arrangements – a
consensus of the FASB Emerging Issues Task Force, which changes the accounting
for certain revenue arrangements. The new requirements change the allocation
methods used in determining how to account for multiple payment streams and will
result in the ability to separately account for more deliverables, and
potentially less revenue deferrals. Additionally, ASU 2009-13 requires enhanced
disclosures in financial statements. ASU 2009-13 is effective for revenue
arrangements enter into or materially modified in fiscal years beginning after
June 15, 2010 on a prospective basis, with early application permitted. The
Company is currently evaluating the impact ASU 2009-13 will have on our
financial statements.
In
December 2008, the FASB issued guidance under ASC 715, Compensation – Retirement Benefits –
Defined Benefit Plans, requiring annual disclosure of major categories of
plan assets, investment policies and strategies, fair value measurement of plan
assets and significant concentration of credit risks related to defined benefit
pension or other postretirement plans. This guidance is effective for
fiscal years ending after December 15, 2009. See Footnote 10
“Retirement Benefits” for new disclosure requirements.
Management
believes the impact of other recently issued guidance, which is not yet
effective, will not have a material impact on the Company's consolidated
financial statements upon adoption
(2)
Acquisitions
On March
1, 2009, the Company completed the acquisition of International Lift Systems,
LLC (“ILS”), a Louisiana limited partnership. ILS manufactures and services gas
lift, plunger lift and completion equipment for the oil and gas
industry.
On July
1, 2009 the Company completed the acquisition of Rotating Machinery Technology,
Inc. (“RMT”), a New York corporation. RMT is a recognized leader in
the turbo-machinery industry, specializing in the analysis design and
manufacture of precision, custom-engineered tilting-pad bearings and related
components for high-speed turbo equipment operating in critical duty
applications. RMT also services, repairs and upgrades turbo-expander
process units for air and gas separation, both on-site with its skilled field
service team and at its repair facility in Wellsville, New York.
The ILS
and RMT acquisitions have been recorded using the acquisition method of
accounting and, accordingly, the acquired operations have been included in the
results of operations since the date of acquisition. The preliminary
purchase price consideration consists of the following (in thousands of
dollars):
|
Cash
paid at closing, net
|
$ | 51,658 | ||
|
Holdback
consideration
|
4,500 | |||
|
Total
consideration paid
|
$ | 56,158 | ||
The
following table indicates (in thousands of dollars) the preliminary purchase
price allocation to net assets acquired, which was based on estimated fair
values as of the acquisition date. The excess of the purchase price over the net
assets acquired amount to $33.1 million and has been recorded as goodwill in the
accompanying December 31, 2009, consolidated balance sheet. Based on the
structure of the transaction, the majority of the goodwill related to the
transaction is not expected to be deductible for tax purposes.
|
Purchase
price
|
$ | 56,158 | ||
|
Receivables
|
5,786 | |||
|
Inventories
|
5,705 | |||
|
Other
current assets
|
1,225 | |||
|
Deferred
tax asset
|
80 | |||
|
Property,
plant and equipment
|
5,794 | |||
|
Intangible
assets
|
15,280 | |||
|
Accounts
payable
|
(2,426 | ) | ||
|
Other
short-term accrued liabiltiies
|
(575 | ) | ||
|
Other
long-term accrued liabilities
|
(363 | ) | ||
|
Deferred
tax liability
|
(1,100 | ) | ||
|
Long-term
debt
|
(6,314 | ) | ||
|
Goodwill
recorded
|
$ | 33,066 | ||
The
Company also entered into a hold back agreement with the former owners of
ILS. The total hold back is $4.5 million payable in three equal
installments of $1.5 million each plus interest. Interest is
calculated annually at 4% of the remaining balance of the hold back
portion. The first installment is due March 1, 2010; the second and
third installments, each plus interest to date, are payable on March 1, 2011 and
2012, respectively. These hold back payments are not contingent upon
any subsequent events. At December 31, 2009, the liabilities for
these hold back payments were included in the accrued liabilities and other
liabilities section of the consolidated balance sheet.
Revenues
and earnings to date on the aforementioned acquisitions for all 2009 are not
material. Pro forma schedules have not been included as the impact on
the prior and current periods presented is not material.
The
preliminary purchase price allocations, which are based on relevant facts and
circumstances and discussions with an independent third-party consultant, are
subject to change upon completion of the final valuation analysis by Lufkin
management. The final valuations for ILS, which is required to be completed by
March 2010, and RMT, which is required to be completed by July 2010, are not
expected to result in material changes to the preliminary
allocations.
(3)
Discontinued Operations
During
the second quarter of 2008, the Trailer segment was classified as a discontinued
operation.
Operating
results of discontinued operations were as follows (in thousands of
dollars):
|
2009
|
2008
|
2007
|
||||||||||
|
Sales
|
$ | 36 | $ | 7,135 | $ | 41,381 | ||||||
|
Earnings
before income tax provision
|
(724 | ) | 450 | 3,268 | ||||||||
|
Income
tax provision
|
271 | (236 | ) | (842 | ) | |||||||
|
Earnings
from discontinued operations, net of tax
|
$ | (453 | ) | $ | 214 | $ | 2,426 | |||||
|
December
31,
|
December
31,
|
|||||||
|
2009
|
2008
|
|||||||
|
Receivables,
net
|
$ | 17 | $ | 56 | ||||
|
Income
tax receivable
|
302 | - | ||||||
|
Deferred
income tax assets
|
492 | 562 | ||||||
|
Current
assets from discontinued operations
|
811 | 618 | ||||||
|
Property,
plant and equipment, net
|
- | - | ||||||
|
Other
assets, net
|
- | 493 | ||||||
|
Long-term
assets from discontinued operations
|
- | 493 | ||||||
|
Total
assets from discontinued operations
|
$ | 811 | $ | 1,111 | ||||
|
Accounts
payable
|
$ | 10 | $ | 154 | ||||
|
Accrued
liabilities:
|
||||||||
|
Payroll
and benefits
|
70 | 104 | ||||||
|
Warranty
expenses
|
240 | 410 | ||||||
|
Taxes
payable
|
- | 120 | ||||||
|
Other
|
706 | 616 | ||||||
|
Current
liabilities from discontinued operations
|
1,026 | 1,404 | ||||||
|
Long-term
liabilities
|
37 | 61 | ||||||
|
Total
liabilities from discontinued operations
|
$ | 1,063 | $ | 1,465 | ||||
(4)
Receivables
The
following is a summary of the Company's receivable balances at December
31:
|
(Thousands
of dollars)
|
2009
|
2008
|
||||||
|
Accounts
receivable
|
$ | 87,497 | $ | 138,706 | ||||
|
Notes
receivable
|
482 | 157 | ||||||
|
Other
receivables
|
4,767 | 1,015 | ||||||
|
Gross
receivables
|
92,746 | 139,878 | ||||||
|
Allowance
for doubtful accounts receivable
|
(240 | ) | (734 | ) | ||||
|
Net
receivables
|
$ | 92,506 | $ | 139,144 | ||||
During
2009, the Company recovered certain receivables reserved in 2008, resulting in
$1.8 million of income, which is included in selling, general and administrative
expenses on the income statement. Bad debt expense related to
receivables was $2.5 million in 2008 and was negligible in 2007.
(5)
Inventories
Inventories
used in determining cost of sales were as follows:
|
(Thousands
of dollars)
|
2009
|
2008
|
||||||
|
Gross
inventories @ FIFO:
|
||||||||
|
Finished
goods
|
$ | 7,545 | $ | 2,643 | ||||
|
Work
in progress
|
21,435 | 28,230 | ||||||
|
Raw
materials & component parts
|
100,347 | 122,604 | ||||||
|
Maintenance,
tooling & supplies
|
13,882 | 12,611 | ||||||
|
Total
gross inventories @ FIFO
|
143,209 | 166,088 | ||||||
|
Less
reserves:
|
||||||||
|
LIFO
|
29,961 | 32,926 | ||||||
|
Valuation
|
2,643 | 4,535 | ||||||
|
Total
inventories as reported
|
$ | 110,605 | $ | 128,627 | ||||
Gross
inventories on a FIFO basis shown above that were accounted for on a LIFO basis
were $76.7 million and $109.2 million at December 31, 2009 and 2008,
respectively.
(6)
Property, Plant & Equipment
The
following is a summary of the Company’s P. P. & E. balances at December
31:
|
(Thousands
of dollars)
|
2009
|
2008
|
||||||
|
Land
|
$ | 6,735 | $ | 6,525 | ||||
|
Land
improvements
|
10,146 | 10,219 | ||||||
|
Buildings
|
92,467 | 75,756 | ||||||
|
Machinery
and equipment
|
265,958 | 245,014 | ||||||
|
Furniture
and fixtures
|
5,985 | 5,616 | ||||||
|
Computer
equipment and software
|
15,388 | 14,666 | ||||||
|
Total
property, plant and equipment
|
396,679 | 357,796 | ||||||
|
Less
accumulated depreciation
|
(236,909 | ) | (227,717 | ) | ||||
|
Total
property, plant and equipment, net
|
$ | 159,770 | $ | 130,079 | ||||
Depreciation
expense related to property, plant and equipment was $17.1 million, $15.6
million and $13.7 million in 2009, 2008 and 2007, respectively.
(7)
Goodwill & Acquired Intangible Assets
Goodwill
The
changes in the carrying amount of goodwill during the years ended December
31, 2009 and 2008 are as follows (in thousands of dollars):
|
Power
|
||||||||||||
|
(Thousands
of dollars)
|
Oil
Field
|
Transmission
|
Total
|
|||||||||
|
Balance
as of 12/31/07
|
$ | 9,447 | $ | 2,543 | $ | 11,990 | ||||||
|
Foreign
currency translation
|
(19 | ) | (109 | ) | (128 | ) | ||||||
|
Balance
as of 12/31/08
|
9,428 | 2,434 | 11,862 | |||||||||
|
Goodwill
acquired during the period
|
28,577 | 4,489 | 33,066 | |||||||||
|
Foreign
currency translation
|
13 | 60 | 73 | |||||||||
|
Balance
as of 12/31/09
|
$ | 38,018 | $ | 6,983 | $ | 45,001 | ||||||
Intangible
Assets
|
The
Company amortizes identifiable intangible assets on a straight-line basis
over the periods expected to be benefitted. All of the below
intangible assets relate to the ILS and RMT acquisitions. The
components of these intangible assets are as follows (in thousands of
dollars):
|
|
Weighted
|
||||||||||||||||
|
December
31, 2009
|
Average
|
|||||||||||||||
|
Gross
|
Amortization
|
|||||||||||||||
|
Carrying
|
Accumulated
|
Period
|
||||||||||||||
|
Amount
|
Amortization
|
Net
|
(years)
|
|||||||||||||
|
Non-compete
agreements and trademarks
|
$ | 2,064 | $ | 258 | $ | 1,806 | 7.2 | |||||||||
|
Customer
relationships and contracts
|
13,216 | 1,043 | 12,173 | 10.0 | ||||||||||||
| $ | 15,280 | $ | 1,301 | $ | 13,979 | 7.0 | ||||||||||
Amortization
expense of intangible assets was approximately $1.3 million for the year ended
December 31, 2009. There was no intangible amortization expense in the years
ended December 31, 2008 and 2007. Expected amortization expense by year is (in
thousands of dollars):
|
For
the year ended 12/31/10
|
$ | 1,672 | ||
|
For
the year ended 12/31/11
|
1,672 | |||
|
For
the year ended 12/31/12
|
1,573 | |||
|
For
the year ended 12/31/13
|
1,553 | |||
|
For
the year ended 12/31/14
|
1,441 | |||
|
Thereafter
|
$ | 6,068 |
(8)
Other Current Accrued Liabilities
The
following is a summary of the Company's other current accrued liabilities
balances at December 31:
|
(Thousands
of dollars)
|
2009
|
2008
|
||||||
|
Customer
prepayments
|
$ | 7,945 | $ | 12,925 | ||||
|
Litigation
reserves
|
6,637 | 6,000 | ||||||
|
Deferred
compensation & benefit plans
|
5,500 | 4,046 | ||||||
|
Accrued
professional services
|
548 | 1,097 | ||||||
|
Hold
back consideration
|
1,605 | - | ||||||
|
Other
accrued liabilities
|
1,912 | 1,272 | ||||||
|
Total
other current accrued liabilities
|
$ | 24,147 | $ | 25,340 | ||||
(9)
Debt Obligations
The
following is a summary of the Company's outstanding debt balances (in thousands
of dollars):
|
December
31,
|
December
31,
|
|||||||
|
2009
|
2008
|
|||||||
|
Long-term
notes payable
|
$ | 2,888 | $ | - | ||||
|
Less
current portion of long-term debt
|
(1,372 | ) | - | |||||
|
Long-term
debt
|
$ | 1,516 | $ | - | ||||
Principal
payments of long-term debt by year are as follows (in thousands of
dollars):
|
2011
|
$ | 1,349 | ||
|
2012
|
167 | |||
|
Total
|
$ | 1,516 | ||
The
Company’s current debt at December 31, 2009, primarily consists of assumed notes
from the ILS acquisition, which are described below. The current
portion of long-term debt reflects scheduled principal payments due on or before
December 31, 2010.
On March
1, 2009, the Company assumed from ILS several notes payable, associated with
prior acquisitions undertaken by ILS, with a remaining aggregate principal
balance of $3.9 million at interest rates ranging from 0% to 6% with a weighted
average of 4.5%. On the outstanding principal balance as of December
31, 2009, the Company has secured letters of credit for $1.5 million and the
remaining $1.4 million is secured by collateral consisting of equipment,
inventory, and accounts receivable. The fair market value of the
outstanding debt as of December 31, 2009 is not materially different than
its carrying value.
In
connection with the ILS acquisition, the Company also assumed a note payable to
a bank in the amount of $0.8 million, which was paid in full at closing. In
connection with the RMT acquisition, the Company also assumed several notes
payable to individuals and banks in the amount of $1.5 million, which were paid
in full at closing.
The
Company has a three-year credit facility with a domestic bank (the “Bank
Facility”) consisting of an unsecured revolving line of credit that provides up
to $40.0 million of aggregate borrowing. This Bank Facility expires
on December 31, 2010. Borrowings under the Bank Facility bear interest, at
the Company’s option, at either the greater of (i) the prime rate, (ii) the base
CD rate plus an applicable margin or (iii) the Federal Funds Effective Rate plus
an applicable margin or the London Interbank Offered Rate plus an applicable
margin, depending on certain ratios as defined in the Bank Facility. As of
December 31, 2009, no debt was outstanding under the Bank Facility and the
Company was in compliance with all financial covenants under the terms of the
Bank Facility. Deducting outstanding letters of credit of $16.4 million, $23.6
million of borrowing capacity was available at December 31, 2009.
(10)
Retirement Benefits
The
Company has a qualified noncontributory pension plan covering substantially all
U.S. employees. The benefits provided by these plans are measured by length of
service, compensation and other factors, and are currently funded by trusts
established under the plans. Funding of retirement costs for these plans
complies with the minimum funding requirements specified by the Employee
Retirement Income Security Act, as amended. In addition, the Company has two
unfunded non-qualified deferred compensation pension plans for certain U.S.
employees. The Pension Restoration Plan provides supplemental retirement
benefits. The benefit is based on the same benefit formula as the qualified
pension plan except that it does not limit the amount of a participant's
compensation or maximum benefit. The Company also provides a Supplemental
Executive Retirement Plan that credits an individual with 0.5 years of service
for each year of service credited under the qualified plan. The benefits
calculated under the non-qualified pension plans are offset by the participant's
benefit payable under the qualified plan. The liabilities for the non-qualified
deferred compensation pensions plans are included in "Other current accrued
liabilities" and “Other liabilities” in the Consolidated Balance
Sheet.
The
Company reduced its U.S. employee base which resulted in a curtailment loss of
$1.5 million, which is recorded in cost of sales on the income
statement.
The
Company is also required by the French government to provide a lump sum benefit
payable upon retirement to its French employees. A dedicated
insurance policy is in place that can reimburse the Company for these retirement
payments.
The
Company sponsors two defined benefit postretirement plans that cover both
salaried and hourly employees. One plan provides medical benefits, and the other
plan provides life insurance benefits. Both plans are contributory, with retiree
contributions adjusted periodically. The Company accrues the estimated costs of
the plans over the employee’s service periods. The Company's postretirement
health care plan is unfunded. For measurement purposes, the submitted claims
medical trend was assumed to be 9.25% in 1997. Thereafter, the Company’s
obligation is fixed at the amount of the Company’s contribution for
1997.
The
Company also has qualified defined contribution retirement plans covering
substantially all of its U.S. and Canadian employees. For U.S. employees, the
Company makes contributions of 75% of employee contributions up to a maximum
employee contribution of 6% of employee earnings. Employees may contribute up to
an additional 18% (in 1% increments), which is not subject to match by the
Company. For Canadian employees, the Company makes contributions of 3%-8% of an
employee’s salary with no individual employee match required. All obligations of
the Company are funded through December 31, 2009. In addition, the Company
provides an unfunded non-qualified deferred compensation defined contribution
plan for certain U.S. employees. The Company's and
individual's contributions are based on the same formula as the
qualified contribution plan except that it does not limit the amount of a
participant's compensation or maximum benefit. The contribution calculated
under the non-qualified defined contribution plan is offset by
the Company's and participant's contributions under the qualified plan. The
Company’s expense for these plans totaled $3.3 million, $3.5 million and $3.3
million in the years ended December 31, 2009, 2008 and 2007, respectively. The
liability for the non-qualified deferred defined contribution plan is
included in "Other current accrued liabilities" in the Consolidated Balance
Sheet.
Obligations
and Funded Status
At
December 31
|
Pension
Benefits
|
Other
Benefits
|
|||||||||||||||
|
(Thousands
of dollars)
|
2009
|
2008
|
2009
|
2008
|
||||||||||||
|
Changes
in benefit obligation
|
||||||||||||||||
|
Benefit
obligation at beginning of year
|
$ | 187,350 | $ | 171,445 | $ | 7,657 | $ | 7,926 | ||||||||
|
Service
cost
|
4,769 | 4,933 | 145 | 152 | ||||||||||||
|
Interest
cost
|
11,970 | 10,979 | 503 | 455 | ||||||||||||
|
Plan
participants' contributions
|
- | - | 880 | 946 | ||||||||||||
|
Plan
change
|
- | 3,143 | 640 | - | ||||||||||||
|
Actuarial
loss (gain)
|
13,844 | 5,583 | 471 | (21 | ) | |||||||||||
|
Benefits
paid
|
(9,204 | ) | (8,733 | ) | (1,569 | ) | (1,801 | ) | ||||||||
|
Curtailments
|
(1,136 | ) | - | (241 | ) | - | ||||||||||
|
Other
|
1,154 | - | - | |||||||||||||
|
Benefit
obligation at end of year
|
208,747 | 187,350 | 8,486 | 7,657 | ||||||||||||
|
Change
in plan assets
|
||||||||||||||||
|
Fair
value of plan assets at beginning of year
|
176,477 | 238,975 | - | - | ||||||||||||
|
Actual
return on plan assets
|
24,412 | (54,062 | ) | - | - | |||||||||||
|
Employer
contributions
|
281 | 297 | 688 | 855 | ||||||||||||
|
Plan
participants' contributions
|
- | - | 881 | 946 | ||||||||||||
|
Benefits
paid
|
(9,204 | ) | (8,733 | ) | (1,569 | ) | (1,801 | ) | ||||||||
|
Other
|
664 | - | - | - | ||||||||||||
|
Fair
value of plan assets at end of year
|
192,630 | 176,477 | - | - | ||||||||||||
|
Funded
(unfunded) status at end of year
|
$ | (16,117 | ) | $ | (10,873 | ) | $ | (8,486 | ) | $ | (7,657 | ) | ||||
Amounts
recognized in the balance sheet consist of:
|
Pension
Benefits
|
Other
Benefits
|
|||||||||||||||
|
(Thousands
of dollars)
|
2009
|
2008
|
2009
|
2008
|
||||||||||||
|
Other
current accrued liabilities
|
$ | (317 | ) | $ | (270 | ) | $ | (612 | ) | $ | (587 | ) | ||||
|
Postretirement
benefits
|
- | - | (7,874 | ) | (7,070 | ) | ||||||||||
|
Other
long-term liabilities
|
(15,800 | ) | (10,603 | ) | - | - | ||||||||||
| $ | (16,117 | ) | $ | (10,873 | ) | $ | (8,486 | ) | $ | (7,657 | ) | |||||
Amounts
recognized in accumulated other comprehensive income consist of:
|
Pension
Benefits
|
Other
Benefits
|
|||||||||||||||
|
(Thousands
of dollars)
|
2009
|
2008
|
2009
|
2008
|
||||||||||||
|
Prior
service cost
|
$ | 4,369 | $ | 5,850 | $ | 323 | $ | - | ||||||||
|
Net
loss (gain)
|
40,559 | 43,072 | (1,289 | ) | (1,709 | ) | ||||||||||
| $ | 44,928 | $ | 48,922 | $ | (966 | ) | $ | (1,709 | ) | |||||||
The
accumulated benefit obligation for all defined benefit pension plans was $193.1
million and $174.1 million at December 31, 2009, and 2008,
respectively.
Components
of Net Periodic Benefit Cost and Other Amounts Recognized in Other Comprehensive
Income
|
Pension
Benefits
|
Other
Benefits
|
|||||||||||||||||||||||
|
(Thousands
of dollars)
|
2009
|
2008
|
2007
|
2009
|
2008
|
2007
|
||||||||||||||||||
|
Net
Periodic Benefit Cost
|
||||||||||||||||||||||||
|
Service
cost
|
$ | 4,769 | $ | 4,933 | $ | 5,452 | $ | 145 | $ | 151 | $ | 174 | ||||||||||||
|
Interest
cost
|
11,970 | 10,979 | 9,725 | 503 | 455 | 458 | ||||||||||||||||||
|
Expected
return on plan assets
|
(12,285 | ) | (16,664 | ) | (17,646 | ) | - | - | - | |||||||||||||||
|
Amortization
of prior service cost
|
795 | 649 | 566 | 54 | - | - | ||||||||||||||||||
|
Amortization
of net (gain) loss
|
4,566 | 181 | 102 | (217 | ) | (217 | ) | (227 | ) | |||||||||||||||
|
Amortization
of transition asset
|
- | (638 | ) | (926 | ) | - | - | - | ||||||||||||||||
|
Curtailment
|
1,542 | - | - | (145 | ) | - | - | |||||||||||||||||
|
Net
periodic benefit cost (income)
|
$ | 11,357 | $ | (560 | ) | $ | (2,727 | ) | $ | 340 | $ | 389 | $ | 405 | ||||||||||
The
estimated net loss and prior service cost for the defined benefit pension plans
that will be amortized from accumulated other comprehensive income into net
periodic benefit cost over the next fiscal year are $4.9 million and $0.8
million, respectively. The estimated net gain and prior service cost for the
defined benefit postretirement plans that will be amortized from accumulated
other comprehensive income into net periodic benefit cost over the next fiscal
year are $0.1 million and $0.1 million, respectively.
Additional
Information
Assumptions
Weighted-average
assumptions used to determine benefit obligations at December 31
|
Pension
Benefits
|
Other
Benefits
|
|||||||||||||||
|
2009
|
2008
|
2009
|
2008
|
|||||||||||||
|
Discount
rate
|
5.25% - 5.80 | % | 6.18% - 6.40 | % | 5.58 | % | 6.25 | % | ||||||||
|
Rate
of compensation increase
|
2.0% - 4.5 | % | 4.50 | % | N/A | N/A | ||||||||||
Weighted-average
assumptions used to determine net periodic benefit cost for years ended December
31
|
Pension
Benefits
|
Other
Benefits
|
|||||||||||||||||||||||
|
2009
|
2008
|
2007
|
2009
|
2008
|
2007
|
|||||||||||||||||||
|
Discount
rate
|
6.00% - 6.40 | % | 6.25% - 6.35 | % | 5.75 | % | 6.25 | % | 6.20 | % | 5.75 | % | ||||||||||||
|
Expected
long-term return on plan assets
|
7.30 | % | 7.30 | % | 8.00 | % | N/A | N/A | N/A | |||||||||||||||
|
Rate
of compensation increase
|
4.50 | % | 4.50 | % | 4.50 | % | N/A | N/A | N/A | |||||||||||||||
For 2009,
the Company assumed a long-term asset rate of return of 7.3%. In developing the
7.3% expected long-term rate of return assumption, the Company evaluated input
from its third-party pension plan asset manager, including their review of asset
class return expectations and long-term inflation assumptions. The Company also
considered its historical 10-year and 15-year compounded return (period ended
December 31, 2008), which were in-line to higher than the Company’s long-term
rate of return assumption, and analyzed expected long-term rate of return
projections by asset class.
Plan
Assets
The
Company’s qualified pension plan assets at December 31, 2009 are as
follows:
|
Fair
Value Measurements at December 31, 2009 (in thousands)
|
||||||||||||||||
|
Quoted
Prices in
|
Significant
|
Significant
|
||||||||||||||
|
Active
markets for
|
Observable
|
Unobservable
|
||||||||||||||
|
Identical
Assets
|
Inputs
|
Inputs
|
||||||||||||||
|
Asset Category
|
Total
|
(Level 1)
|
(Level 2)
|
(Level 3)
|
||||||||||||
|
Cash
|
$ | 3,019 | $ | 3,019 | ||||||||||||
|
Equity
securities:
|
||||||||||||||||
|
Common
stock
|
56,307 | 56,307 | ||||||||||||||
|
International
stock - commingled funds (a)
|
22,106 | $ | 22,106 | |||||||||||||
|
International
stock - mutual fund
|
10,823 | 10,823 | ||||||||||||||
|
Fixed
income securities:
|
||||||||||||||||
|
U.S.
Treasuries
|
8,905 | 8,905 | ||||||||||||||
|
Mortgage-backed
securities
|
17,721 | 17,721 | ||||||||||||||
|
Collateralized
mortgage obligations
|
5,141 | 5,141 | ||||||||||||||
|
Corporate
bonds (b)
|
21,556 | 21,556 | ||||||||||||||
|
Other
types of investments:
|
||||||||||||||||
|
Equity
long/short hedge funds (c)
|
34,289 | $ | 34,289 | |||||||||||||
|
Insurance
policy (d)
|
664 | 664 | ||||||||||||||
|
Real
Estate (e)
|
12,099 | 12,099 | ||||||||||||||
|
Total
|
$ | 192,630 | $ | 79,054 | $ | 66,524 | $ | 47,052 | ||||||||
|
(a)
|
This
category represents International Equity Commingled Funds which invests in
international stocks. The benchmark is the MSCI EAFE
Index.
|
|
|
(b)
|
This
category represents investment grade bonds of U.S. issuers from diverse
industries.
|
|
|
(c)
|
This
category includes hedge funds that invest both long and short in primarily
U.S. common stocks. Management of the hedge funds has the
ability to shift investments from value to growth strategies, from small
to large capitalization stocks, and from a net long position to a net
short position; however it is expected that the equity long/short hedge
funds will have a net long position.
|
|
|
(d)
|
This
category includes a private insurance policy used for French retirement
benefits.
|
|
|
(e)
|
This
category includes a RREEF America II Fund which consists of commingled
private real estate.
|
|
Fair
Value Measurements Using Significant Unobservable Inputs (Level
3)
|
||||||||||||||||
|
Equity
Long/Short
|
Insurance
|
|||||||||||||||
|
Hedge
Funds
|
Real
Estate
|
Contracts
|
Total
|
|||||||||||||
|
Beginning
balance at December 31, 2008
|
$ | 29,827 | $ | 14,747 | $ | - | $ | 44,574 | ||||||||
|
Actual
return on plan assets:
|
||||||||||||||||
|
Relating
to assets still held at the reporting date
|
4,462 | (2,648 | ) | 1,814 | ||||||||||||
|
Relating
to assets sold during the period
|
- | |||||||||||||||
|
Purchases,
sales, and settlements
|
||||||||||||||||
|
Other
|
664 | 664 | ||||||||||||||
|
Transfers
in and/or out of Level 3
|
- | |||||||||||||||
|
Ending
balance at December 31, 2009
|
$ | 34,289 | $ | 12,099 | $ | 664 | $ | 47,052 | ||||||||
Equity Long/Short Hedge Funds
Hedge
fund-of-funds are based on daily closing or institutional evaluation prices of
underlying securities consistent with industry practices.
Real
Estate
Real
estate securities are valued based on recent market appraisals of underlying
property as well as valuation methodologies to determine the most probable cash
price in a competitive market.
Insurance
Contracts
Insurance
contracts are valued based upon underlying securities consistent with industry
practices.
The
Company invests in a diversified portfolio consisting of an array of assets
classes that attempts to maximize returns while minimizing volatility. These
asset classes include U.S. domestic equities, developed market equities,
international equities, fixed income, real estate and hedged investments. Fixed
income securities include medium-term government notes, corporate bonds and
highly-rated mortgage-backed securities and collateralized mortgage obligations.
Real estate primarily includes REIT investments focused on U.S. commercial
warehouses. Hedged investments are primarily concentrated in funds focused on
long/short investment strategies.
No equity
or debt securities of the Company were held by the plan at December 31, 2009, or
2008.
The
unqualified pension plans and the postretirement benefit plan of the Company are
unfunded and thus had no plan assets as of December 31, 2009, and
2008.
Cash
Flows
Contributions
The
Company expects to make contributions of $5.4 million to the pension plans and
expects to make contributions of $0.6 million to the postretirement plan in
2010.
Estimated
Future Benefit Payments
The
following benefit payments, which reflect expected future service, as
appropriate, are expected to be paid during the fiscal years
ending:
|
Pension
|
Other
|
|||||||||
|
(Thousands
of dollars)
|
Benefits
|
Benefits
|
||||||||
|
2010
|
$ | 10,420 | $ | 629 | ||||||
|
2011
|
11,167 | 644 | ||||||||
|
2012
|
11,891 | 659 | ||||||||
|
2013
|
12,435 | 681 | ||||||||
|
2014
|
13,275 | 694 | ||||||||
| 2015 - 2019 | 77,102 | 3,582 | ||||||||
(11)
Other Comprehensive Income
The
following table illustrates the related tax effect allocated to each component
of other comprehensive income:
|
Pre-Tax
|
Tax
(Expense)/
|
Net
|
||||||||||
|
(Thousands
of dollars)
|
Amount
|
Benefit
|
Amount
|
|||||||||
|
Year
ended December 31, 2007
|
||||||||||||
|
Foreign
currency translation adjustments
|
$ | 5,057 | $ | - | $ | 5,057 | ||||||
|
Defined
benefit pension plans:
|
||||||||||||
|
Amortization
of net prior service cost
|
566 | (207 | ) | 359 | ||||||||
|
Amortization
of net loss
|
102 | (37 | ) | 65 | ||||||||
|
Amortization
of net transition asset
|
(926 | ) | 339 | (587 | ) | |||||||
|
Net
gain arising during period
|
11,265 | (4,123 | ) | 7,142 | ||||||||
|
Total
defined benefit pension plans
|
11,007 | (4,028 | ) | 6,979 | ||||||||
|
Defined
benefit postretirement plans:
|
||||||||||||
|
Amortization
of net gain
|
(227 | ) | 83 | (144 | ) | |||||||
|
Net
gain arising during period
|
1,022 | (374 | ) | 648 | ||||||||
|
Total
defined benefit postretirement plans
|
795 | (291 | ) | 504 | ||||||||
|
Other
comprehensive income
|
$ | 16,859 | $ | (4,319 | ) | $ | 12,540 | |||||
|
Year
ended December 31, 2008
|
||||||||||||
|
Foreign
currency translation adjustments
|
$ | (5,503 | ) | $ | - | $ | (5,503 | ) | ||||
|
Defined
benefit pension plans:
|
||||||||||||
|
Amortization
of net prior service cost
|
649 | (238 | ) | 411 | ||||||||
|
Amortization
of net loss
|
181 | (66 | ) | 115 | ||||||||
|
Amortization
of net transition asset
|
(638 | ) | 234 | (404 | ) | |||||||
|
Net
prior service cost
|
(3,143 | ) | 1,154 | (1,989 | ) | |||||||
|
Net
loss arising during period
|
(76,309 | ) | 28,034 | (48,275 | ) | |||||||
|
Total
defined benefit pension plans
|
(79,260 | ) | 29,118 | (50,142 | ) | |||||||
|
Defined
benefit postretirement plans:
|
||||||||||||
|
Amortization
of net gain
|
(217 | ) | 80 | (137 | ) | |||||||
|
Net
gain arising during period
|
21 | (8 | ) | 13 | ||||||||
|
Total
defined benefit postretirement plans
|
(196 | ) | 72 | (124 | ) | |||||||
|
Other
comprehensive income
|
$ | (84,959 | ) | $ | 29,190 | $ | (55,769 | ) | ||||
|
Year
ended December 31, 2009
|
||||||||||||
|
Foreign
currency translation adjustments
|
$ | 3,525 | $ | - | $ | 3,525 | ||||||
|
Defined
benefit pension plans:
|
||||||||||||
|
Amortization
of net prior service cost
|
795 | (293 | ) | 502 | ||||||||
|
Amortization
of net loss
|
4,566 | (1,682 | ) | 2,884 | ||||||||
|
Net
loss arising during period
|
(1,717 | ) | 632 | (1,085 | ) | |||||||
|
Other
|
2,678 | (986 | ) | 1,692 | ||||||||
|
Total
defined benefit pension plans
|
6,322 | (2,329 | ) | 3,993 | ||||||||
|
Defined
benefit postretirement plans:
|
||||||||||||
|
Amortization
of net prior service cost
|
54 | (20 | ) | 34 | ||||||||
|
Amortization
of net gain
|
(217 | ) | 80 | (137 | ) | |||||||
|
Net
loss arising during period
|
(471 | ) | 174 | (297 | ) | |||||||
|
Net
prior service cost
|
(640 | ) | 235 | (405 | ) | |||||||
|
Other
|
96 | (35 | ) | 61 | ||||||||
|
Total
defined benefit postretirement plans
|
(1,178 | ) | 434 | (744 | ) | |||||||
|
Other
comprehensive income
|
$ | 8,669 | $ | (1,895 | ) | $ | 6,774 | |||||
The
following table illustrates the balances of accumulated other comprehensive
income:
|
Defined
|
Defined
|
Accumulated
|
||||||||||||||
|
Foreign
|
Benefit
|
Benefit
|
Other
|
|||||||||||||
|
Currency
|
Pension
|
Postretirement
|
Comprehensive
|
|||||||||||||
|
(Thousands
of dollars)
|
Translation
|
Plans
|
Plans
|
Income
|
||||||||||||
|
Balance,
Dec. 31, 2007
|
$ | 8,015 | $ | 1,221 | $ | 1,833 | $ | 11,069 | ||||||||
|
Current-period
change
|
(5,503 | ) | (50,142 | ) | (124 | ) | (55,769 | ) | ||||||||
|
Balance,
Dec. 31, 2008
|
2,512 | (48,921 | ) | 1,709 | (44,700 | ) | ||||||||||
|
Current-period
change
|
3,525 | 3,993 | (744 | ) | 6,774 | |||||||||||
|
Balance,
Dec. 31, 2009
|
$ | 6,037 | $ | (44,928 | ) | $ | 965 | $ | (37,926 | ) | ||||||
(12)
Earnings per Share
A
reconciliation of the number of weighted shares used to compute basic and
diluted net earnings per share for 2009, 2008 and 2007, are illustrated
below:
|
2009
|
2008
|
2007
|
||||||||||
|
Weighted
average common shares outstanding for basic EPS
|
14,864,937 | 14,788,867 | 14,901,176 | |||||||||
|
Effect
of dilutive securities: employee stock options
|
38,034 | 121,246 | 189,187 | |||||||||
|
Adjusted
weighted average common shares outstanding for diluted EPS
|
14,902,971 | 14,910,113 | 15,090,363 | |||||||||
Options
to purchase a total of 521,164, 167,870 and 202,302 shares of the Company’s
common stock were excluded from the calculation of fully diluted earnings per
share for 2009, 2008 and 2007, respectively, because their effect on fully
diluted earnings per share for the period were antidilutive.
(13)
Stock Option Plans
The
Company currently has two stock compensation plans. The 1996 Nonemployee
Director Stock Option Plan and the 2000 Incentive Stock Compensation Plan
provide for the granting of stock options to officers, employees and
non-employee directors at an exercise price equal to the fair market value of
the stock at the date of grant. The 2000 Incentive Stock Compensation Plan also
provides for other forms of stock-based compensation such as restricted stock
but none have been granted to date. Options granted to employees vest over two
to four years and are exercisable up to ten years from the grant date. Upon
retirement, any unvested options become exercisable immediately. Options granted
to directors vest at the grant date and are exercisable up to ten years from the
grant date.
The
following table is a summary of the stock-based compensation expense recognized
for the years ended December 31, 2009, 2008 and 2007:
|
(Thousands
of dollars)
|
2009
|
2008
|
2007
|
|||||||||
|
Stock-based
compensation expense
|
$ | 2,943 | $ | 3,584 | $ | 3,682 | ||||||
|
Tax
benefit
|
(1,089 | ) | (1,326 | ) | (1,362 | ) | ||||||
|
Stock-based
compensation expense, net of tax
|
$ | 1,854 | $ | 2,258 | $ | 2,320 | ||||||
The fair
value of each option grant during the years ended December 31, 2009, 2008 and
2007 was estimated on the date of grant using the Black-Scholes option-pricing
model with the following assumptions:
|
2009
|
2008
|
2007
|
||||||||||
|
Expected
dividend yield
|
1.73% - 2.80 | % | 1.33% - 2.20 | % | 1.30% - 1.60 | % | ||||||
|
Expected
stock price volatility
|
46.80% - 56.30 | % | 41.00% - 49.70 | % | 41.10% - 46.20 | % | ||||||
|
Risk
free interest rate
|
1.09% - 2.73 | % | 1.53% - 3.27 | % | 3.71% - 4.85 | % | ||||||
|
Expected
life of options
|
3 -
7 years
|
2 -
6 years
|
3 -
6 years
|
|||||||||
|
Weighted-average
fair value per share at grant date
|
$ | 20.25 | $ | 19.72 | $ | 23.48 | ||||||
The
expected life of options was determined based on the exercise history of
employees and directors since the inception of the plans. The expected
volatility is based upon the historical weekly and daily stock price for the
prior number of years equivalent to the expected life of the stock option. The
expected dividend yield was based on the dividend yield of the Company’s common
stock at the date of the grant. The risk free interest rate was based upon the
yield of U.S. Treasuries which terms were equivalent to the expected life of the
stock option.
A summary
of stock option activity under the plans during year ended December 31,
2009, is presented below:
|
Weighted-
|
||||||||||||||||
|
Weighted-
|
Average
|
Aggregate
|
||||||||||||||
|
Average
|
Remaining
|
Intrinsic
|
||||||||||||||
|
Exercise
|
Contractual
|
Value
|
||||||||||||||
|
Options
|
Shares
|
Price
|
Term
|
($000's)
|
||||||||||||
|
Outstanding
at January 1, 2009
|
548,639 | $ | 51.42 | |||||||||||||
|
Granted
|
190,500 | 51.34 | ||||||||||||||
|
Exercised
|
(24,625 | ) | 24.83 | |||||||||||||
|
Forfeited
or expired
|
(5,499 | ) | 20.65 | |||||||||||||
|
Outstanding
at December 31, 2009
|
709,015 | $ | 52.56 | 7.9 | $ | 14,664 | ||||||||||
|
Exercisable
at December 31, 2009
|
379,248 | $ | 50.69 | 6.9 | $ | 8,567 | ||||||||||
As of
December 31, 2009, there was $4.7 million of total unrecognized compensation
expense related to non-vested stock options. That cost is expected to be
recognized over a weighted-average period of 2.8 years. The intrinsic value of
stock options exercised in 2009, 2008 and 2007 was $1.0 million, $14.4 million
and $9.6 million, respectively.
(14)
Capital Stock
The
Company is authorized to issue 2,000,000 shares of preferred stock, the terms
and conditions to be determined by the Board of Directors in creating any
particular series. As of December 31, 2009, no shares of preferred stock had
been issued.
(15)
Income Taxes
Earnings
from continuing operations before income taxes for 2009, 2008 and 2007
consisted of the following:
|
(Thousands
of dollars)
|
2009
|
2008
|
2007
|
|||||||||
|
Domestic
|
$ | 17,880 | $ | 112,722 | $ | 86,650 | ||||||
|
Foreign
|
15,132 | 23,690 | 22,808 | |||||||||
|
Total
earnings before income taxes
|
$ | 33,012 | $ | 136,412 | $ | 109,458 | ||||||
The
income tax provision for 2009, 2008 and 2007 consisted of the
following:
|
(Thousands
of dollars)
|
2009
|
2008
|
2007
|
|||||||||
|
Current:
|
||||||||||||
|
U.S.
federal and state income taxes
|
$ | 7,286 | $ | 42,487 | $ | 23,892 | ||||||
|
Foreign
|
4,793 | 5,514 | 5,763 | |||||||||
|
Total
current
|
12,079 | 48,001 | 29,655 | |||||||||
|
Deferred:
|
||||||||||||
|
U.S.
federal and state income taxes
|
(1,186 | ) | (823 | ) | 7,579 | |||||||
|
Foreign
|
(360 | ) | 1,209 | 439 | ||||||||
|
Total
deferred
|
(1,546 | ) | 386 | 8,018 | ||||||||
|
Total
|
$ | 10,533 | $ | 48,387 | $ | 37,673 | ||||||
Cash
payments for income taxes totaled $22.0 million, $45.1 million and $26.7 million
for 2009, 2008 and 2007, respectively.
A
reconciliation of the income tax provision as computed at the statutory U.S.
income tax rate and the income tax provision presented in the consolidated
financial statements is as follows:
|
(Thousands
of dollars)
|
2009
|
2008
|
2007
|
|||||||||
|
Tax
provision computed at statutory rate
|
$ | 11,554 | $ | 47,744 | $ | 38,310 | ||||||
|
Tax
effect of:
|
||||||||||||
|
Expenses
for which no benefit was realized
|
335 | 936 | 459 | |||||||||
|
Change
in effective state tax rate
|
(44 | ) | 115 | 53 | ||||||||
|
Tax
credit
|
(962 | ) | (237 | ) | (459 | ) | ||||||
|
State
taxes net of federal benefit
|
504 | 2,351 | 1,261 | |||||||||
|
Benefit
of manufacturing deduction
|
(481 | ) | (1,892 | ) | (1,105 | ) | ||||||
|
Other,
net
|
(373 | ) | (630 | ) | (846 | ) | ||||||
|
Total
provision for taxes
|
$ | 10,533 | $ | 48,387 | $ | 37,673 | ||||||
The
primary components of the deferred tax assets and liabilities and the related
valuation allowances are as follows:
|
(Thousands
of dollars)
|
2009
|
2008
|
||||||
|
Deferred
income tax assets:
|
||||||||
|
Pension
costs
|
$ | 7,523 | $ | 5,124 | ||||
|
Payroll
and benefits
|
967 | 927 | ||||||
|
Accrued
warranty expenses
|
1,328 | 1,144 | ||||||
|
Postretirement
benefits
|
6,543 | 5,209 | ||||||
|
Accrued
liabilities
|
3,295 | 761 | ||||||
|
Other,
net
|
120 | 0 | ||||||
|
Total
deferred income tax assets
|
19,776 | 13,165 | ||||||
|
Less
valuation allowance
|
(69 | ) | (75 | ) | ||||
|
Total
deferred income tax assets
|
19,707 | 13,090 | ||||||
|
Noncurrent
deferred income tax liabilities:
|
||||||||
|
Prepaid
expenses
|
(335 | ) | (318 | ) | ||||
|
Depreciation
|
(18,387 | ) | (14,857 | ) | ||||
|
Inventories
|
(730 | ) | (361 | ) | ||||
|
Other,
net
|
(5,515 | ) | (1,270 | ) | ||||
|
Total
noncurrent deferred income tax liabilities, net
|
(24,967 | ) | (16,806 | ) | ||||
|
Total
net deferred tax liability
|
$ | (5,260 | ) | $ | (3,716 | ) | ||
|
Current
deferred tax asset
|
||||||||
|
Continuing
operations
|
$ | 5,198 | $ | 4,941 | ||||
|
Discontinued
operations
|
492 | 562 | ||||||
|
Total
current deferred tax asset
|
5,690 | 5,503 | ||||||
|
Non-current
deferred tax liability
|
||||||||
|
Continuing
operations
|
(10,950 | ) | (9,219 | ) | ||||
|
Discontinued
operations
|
- | - | ||||||
|
Total
non-current deferred tax liability
|
(10,950 | ) | (9,219 | ) | ||||
|
Total
net deferred tax liability
|
$ | (5,260 | ) | $ | (3,716 | ) | ||
As of
January 1, 2009, the Company had approximately $1.4 million of total gross
unrecognized tax benefits. Of this total, $1.4 million (net of the
federal benefit on state issues) represents the amount of unrecognized tax
benefits that, if recognized, would favorably affect the net effective income
tax rate in any future period. As of December 31, 2009, the Company
had approximately $1.5 million of total gross unrecognized tax
benefits. Of this total, $1.5 million (net of the federal benefit on
state issues) represents the amount of unrecognized tax benefits that, if
recognized, would favorably affect the net effective income tax rate in any
future period. A reconciliation of the beginning and ending amount of
unrecognized tax benefits is as follows:
|
(Thousands
of dollars)
|
2009
|
2008
|
2007
|
|||||||||
|
Balance
at January 1,
|
$ | 1,368 | $ | 2,743 | $ | 3,383 | ||||||
|
Gross
increases- current year tax positions
|
593 | - | 293 | |||||||||
|
Gross
increases- tax positions from prior periods
|
93 | 328 | 21 | |||||||||
|
Gross
decreases- tax positions from prior periods
|
(372 | ) | (813 | ) | (648 | ) | ||||||
|
Settlements
|
(173 | ) | (890 | ) | (306 | ) | ||||||
|
Balance
at December 31,
|
$ | 1,509 | $ | 1,368 | $ | 2,743 | ||||||
The
Company conducts business globally and, as a result, Lufkin Industries, Inc. and
its subsidiaries file income tax returns in the U.S. federal and state
jurisdictions, and various foreign jurisdictions. For U.S. federal
purposes, tax years prior to 2006 are closed to assessment. Early in 2009, the
Company settled an examination of the 2006 tax year with the
IRS. Statutes for years prior to 2006 remain subject to review in
certain U.S. state jurisdictions; however, the outcome of any future audit is
not expected to have a material effect on the Company’s results of
operations. The Company is currently under examination by the state
of Texas for the 2005-2006 tax years, and the Texas Comptroller has proposed
adjustments to the Company. The Company is currently evaluating those
proposed adjustments but does not anticipate the adjustments would result in a
material change to its financial position. Settlements are expected
in early 2010. The Company also remains subject to income tax
examinations in the following material international jurisdictions: Canada
(2005-2008), France (2007-2008), and Argentina
(2003-2008). There are currently open tax exams in Argentina
for tax years 2003 and 2007 and in France for 2007-2008. A tax
examination in France for the 2006 tax year closed without any adjustments in
late 2009.
The
Company’s continuing practice is to recognize interest and penalties related to
income tax matters in administrative costs. The Company had $32,000
accrued for interest and penalties at December 31, 2008. Interest and
penalties of $58,000 were accrued during the twelve months ended December 31,
2009.
(16)
Commitments and Contingencies
Legal proceedings: On March 7,
1997, a class action complaint was filed against Lufkin Industries, Inc. (the
“Company”) in the U.S. District Court for the Eastern District of Texas by an
employee and a former employee of the Company who alleged race discrimination in
employment. Certification hearings were conducted in Beaumont, Texas in February
1998 and in Lufkin, Texas in August 1998. In April 1999, the District Court
issued a decision that certified a class for this case, which included all black
employees employed by the Company from March 6, 1994, to the present. The case
was administratively closed from 2001 to 2003 while the parties unsuccessfully
attempted mediation. Trial for this case began in December 2003, and after the
close of plaintiff’s evidence, the court adjourned and did not complete the
trial until October 2004. Although plaintiff’s class certification encompassed a
wide variety of employment practices, plaintiffs presented only disparate impact
claims relating to discrimination in initial assignments and promotions at
trial.
On
January 13, 2005, the District Court entered its decision finding that the
Company discriminated against African-American employees in initial assignments
and promotions. The District Court also concluded that the discrimination
resulted in a shortfall in income for those employees and ordered that the
Company pay those employees back pay to remedy such shortfall, together with
pre-judgment interest in the amount of 5%. On August 29, 2005, the District
Court determined that the back pay award for the class of affected employees was
$3.4 million (including interest to January 1, 2005) and provided a formula for
attorney fees that the Company estimates will result in a total not to exceed
$2.5 million. In addition to back pay with interest, the District Court (i)
enjoined and ordered the Company to cease and desist all racially biased
assignment and promotion practices and (ii) ordered the Company to pay court
costs and expenses.
The
Company reviewed this decision with its outside counsel and on September 19,
2005, appealed the decision to the U.S. Court of Appeals for the Fifth Circuit.
On April 3, 2007, the Company appeared before the appellate court in New Orleans
for oral argument in this case. The appellate court subsequently issued a
decision on Friday, February 29, 2008 that reversed and vacated the plaintiff’s
claim regarding the initial assignment of black employees into the Foundry
Division. The court also denied plaintiff’s appeal for class certification of a
class disparate treatment claim. Plaintiff’s claim on the issue of the Company’s
promotional practices was affirmed but the back pay award was vacated and
remanded for recomputation in accordance with the opinion. The
District Court’s injunction was vacated and remanded with instructions to enter
appropriate and specific injunctive relief. Finally, the issue of plaintiff’s
attorney’s fees was remanded to the District Court for further consideration in
accordance with prevailing authority.
On
December 5, 2008, the U.S. District Court Judge Clark held a hearing in
Beaumont, Texas during which he reviewed the 5th U.S.
Circuit Court of Appeals class action decision and informed the parties that he
intended to implement the decision in order to conclude this litigation. At the
conclusion of the hearing Judge Clark ordered the parties to submit positions
regarding the issues of attorney fees, a damage award and injunctive relief.
Subsequently, the Company reviewed the plaintiff’s submissions which described
the formula and underlying assumptions that supported their positions on
attorney fees and damages. After careful review of the plaintiff’s submission to
the court the Company continued to have significant differences regarding legal
issues that materially impacted the plaintiff’s requests. As a result of these
different results, the court requested further evidence from the parties
regarding their positions in order to render a final decision. The
judge reviewed both parties arguments regarding legal fees, and awarded the
plaintiffs an interim fee, but at a reduced level from the plaintiffs original
request. The Company and the plaintiffs reconciled the majority of the
differences and the damage calculations which also lowered the originally
requested amounts of the plaintiffs on those matters. Due to the
resolution of certain legal proceedings on damages during first half of 2009 and
the District Court awarding the plaintiffs an interim award of attorney fees and
cost totaling $5.8 million, the Company recorded an additional provision of $5.0
million in the first half of 2009 above the $6.0 million recorded in fourth
quarter of 2008. The plaintiffs filed an appeal of the District Court’s interim
award of attorney fees with the U.S. Fifth Circuit Court of Appeals. The Fifth
Circuit subsequently dismissed these appeals on August 28, 2009 on the basis
that an appealable final judgment in this case had not been
issued. The court commented that this issue can be reviewed with an
appeal of final judgment.
On
January 15, 2010, the U.S. District Court for the Eastern District of Texas
notified the Company that it had entered a final judgment related to the
Company’s ongoing class-action lawsuit. The Court ordered Lufkin Industries to
pay the plaintiffs $3.3 million in damages, $2.2 million in pre-judgment
interest and 0.41% interest for any post-judgment interest. The Company had
previously estimated the total liability for damages and interest to be
approximately $5.2 million. The Court also ordered the plaintiffs to submit a
request for legal fees and expenses from January 1, 2009 through the date of the
final judgment. The plaintiffs are required to submit this request within 14
days of the final judgment. On January 29, 2010, the plaintiffs filed a motion
with the U.S. District Court for the Eastern District of Texas for a
supplemental award of $0.7 million for attorney’s fees, costs and expenses
incurred between January 1, 2009 and January 15, 2010, as allowed in the final
judgment issued by the Court on January 15, 2010, related to the Company’s
ongoing class-action lawsuit. In the fourth quarter of 2009, the Company
recorded a provision of $1.0 million for these legal expenses and accrual
adjustments for the final judgment award of damages.
On
January 15, 2010, the plaintiffs filed a notice of appeal with the U.S. Fifth
Circuit Court of Appeals of the District Court’s final judgment. On January 21,
2010, The Company filed a notice of cross-appeal with the same
court. In addition, the Company filed a motion with the District
Court to stay the payment of damages referenced in the District Court’s final
judgment pending the outcome of the Fifth Circuit’s decision on both parties’
appeals. The District Court granted this motion to stay.
There are
various other claims and legal proceedings arising in the ordinary course of
business pending against or involving the Company wherein monetary damages are
sought. For certain of these claims, the Company maintains insurance
coverage while retaining a portion of the losses that occur through the use of
deductibles and retention limits. Amounts in excess of the
self-insured retention levels are fully insured to limits believed appropriate
for the Company’s operations. Self-insurance accruals are based on
claims filed and an estimate for claims incurred but not
reported. While the Company does maintain insurance above its
self-insured levels, a decline in the financial condition of its insurer, while
not currently anticipated, could result in the Company recording additional
liabilities. It is management’s opinion that the Company’s liability
under such circumstances or involving any other non-insured claims or legal
proceedings would not materially affect its consolidated financial position,
results of operations, or cash flow.
Product warranties: The change
in the aggregate product warranty liability for the years ended December 31,
2009 and 2008, is as follows:
|
(Thousands
of dollars)
|
2009
|
2008
|
||||||
|
Beginning
balance
|
$ | 3,586 | $ | 2,925 | ||||
|
Claims
paid or accrued
|
(3,793 | ) | (2,732 | ) | ||||
|
Additional
warranties issued
|
3,891 | 3,365 | ||||||
|
Revisions
in estimates
|
385 | 122 | ||||||
|
Foreign
currency translation
|
151 | (94 | ) | |||||
|
Ending
balance
|
$ | 4,220 | $ | 3,586 | ||||
Operating leases: Future
minimum rental payments for operating leases having initial or remaining
noncancelable lease terms in excess of one year are:
|
(Thousands
of dollars)
|
||||
|
2010
|
$ | 1,800 | ||
|
2011
|
1,143 | |||
|
2012
|
836 | |||
|
2013
|
744 | |||
|
2014
|
586 | |||
|
All
years
|
$ | 9,748 | ||
Expenditures
for rentals and leases, including short-term rental contracts, were $6.0
million, $5.2 million and $4.2 million for the years ended
December 31, 2009, 2008 and 2007, respectively.
Capital expenditures: As of
December 31, 2009, the Company had contractual commitments for capital
expenditures of $6.1 million that are expected to be paid in 2010.
(17)
Business Segment
Information
The
Company operates with two business segments: Oil Field and Power Transmission.
The two operating segments are supported by a common corporate
group. The accounting policies of the segments are the same as those
described in the summary of major accounting
policies. Corporate expenses and certain assets are allocated
to the operating segments primarily based upon third party revenues. Sales by
geographic region are determined by the shipping destination of a product or the
site of service work. Inter-segment sales and transfers are accounted for as if
the sales and transfers were to third parties, that is, at current market
prices, as available. The following is a summary of key business segment and
product group information:
|
(Thousands
of dollars)
|
2009
|
2008
|
2007
|
|||||||||
|
Sales
by segment:
|
||||||||||||
|
Oil
Field
|
$ | 349,168 | $ | 551,814 | $ | 397,354 | ||||||
|
Power
Transmission
|
172,191 | 189,380 | 158,452 | |||||||||
|
Total
sales
|
$ | 521,359 | $ | 741,194 | $ | 555,806 | ||||||
|
Sales
by geographic region:
|
||||||||||||
|
United
States
|
$ | 290,924 | $ | 469,343 | $ | 318,668 | ||||||
|
Europe
|
50,362 | 60,463 | 49,350 | |||||||||
|
Canada
|
19,039 | 33,354 | 31,677 | |||||||||
|
Latin
America
|
94,972 | 97,310 | 80,604 | |||||||||
|
Middle
East/North Africa
|
40,310 | 56,149 | 52,849 | |||||||||
|
Other
|
25,752 | 24,575 | 22,658 | |||||||||
|
Total
sales
|
$ | 521,359 | $ | 741,194 | $ | 555,806 | ||||||
|
Earnings
(loss) before income taxes:
|
||||||||||||
|
Oil
Field
|
$ | 21,405 | $ | 116,150 | $ | 83,737 | ||||||
|
Power
Transmission
|
17,040 | 26,308 | 27,160 | |||||||||
|
Corporate
& Other*
|
(5,433 | ) | (4,479 | ) | 3,626 | |||||||
|
Adjustment**
|
- | (1,567 | ) | (5,065 | ) | |||||||
|
Total
earnings (loss) before income taxes
|
$ | 33,012 | $ | 136,412 | $ | 109,458 | ||||||
|
Assets
by segment:
|
||||||||||||
|
Oil
Field
|
$ | 293,140 | $ | 275,395 | $ | 226,697 | ||||||
|
Power
Transmission
|
128,789 | 126,912 | 130,008 | |||||||||
|
Corporate
& Other*
|
118,850 | 127,300 | 121,361 | |||||||||
|
Adjustment**
|
- | - | 12,327 | |||||||||
|
Total
assets
|
$ | 540,779 | $ | 529,607 | $ | 490,393 | ||||||
|
Property,
plant & equipment, net, by geographic region
|
||||||||||||
|
United
States
|
$ | 121,419 | $ | 96,566 | $ | 82,643 | ||||||
|
Europe
|
14,827 | 11,194 | 10,947 | |||||||||
|
Canada
|
9,072 | 9,731 | 13,796 | |||||||||
|
Latin
America
|
14,211 | 12,280 | 9,516 | |||||||||
|
Other
|
241 | 308 | 288 | |||||||||
|
Total
P, P & E, net
|
$ | 159,770 | $ | 130,079 | $ | 117,190 | ||||||
|
Capital
expenditures by segment
|
||||||||||||
|
Oil
Field
|
$ | 27,384 | $ | 20,786 | $ | 12,830 | ||||||
|
Power
Transmission
|
12,168 | 7,755 | 5,159 | |||||||||
|
Corporate
& Other*
|
273 | 1,011 | 826 | |||||||||
|
Total
capital expenditures
|
$ | 39,825 | $ | 29,552 | $ | 18,815 | ||||||
|
Depreciation/amortization
by segment:
|
||||||||||||
|
Oil
Field
|
$ | 11,561 | $ | 9,815 | $ | 8,578 | ||||||
|
Power
Transmission
|
5,951 | 5,151 | 4,704 | |||||||||
|
Corporate
& Other*
|
945 | 733 | 726 | |||||||||
|
Total
depreciation/amortization
|
$ | 18,457 | $ | 15,699 | $ | 14,008 | ||||||
Additional
key segment information is presented below:
|
Year Ended December 31,
2009
|
||||||||||||||||||||
|
Power
|
Corporate
|
|||||||||||||||||||
|
(Thousands
of dollars)
|
Oil
Field
|
Transmission
|
&
Other*
|
Adjustment**
|
Total
|
|||||||||||||||
|
Gross
sales
|
$ | 351,766 | $ | 175,476 | $ | - | $ | - | $ | 527,242 | ||||||||||
|
Inter-segment
sales
|
(2,598 | ) | (3,285 | ) | - | - | (5,883 | ) | ||||||||||||
|
Net
sales
|
$ | 349,168 | $ | 172,191 | $ | - | $ | - | $ | 521,359 | ||||||||||
|
Operating
income (loss)
|
$ | 20,458 | $ | 16,966 | $ | (6,000 | ) | $ | - | $ | 31,424 | |||||||||
|
Other
income (expense), net
|
947 | 74 | 567 | - | 1,588 | |||||||||||||||
|
Earnings
(loss) before income tax provision
|
$ | 21,405 | $ | 17,040 | $ | (5,433 | ) | $ | - | $ | 33,012 | |||||||||
|
Year Ended December 31,
2008
|
||||||||||||||||||||
|
Power
|
Corporate
|
|||||||||||||||||||
|
(Thousands
of dollars)
|
Oil
Field
|
Transmission
|
&
Other*
|
Adjustment**
|
Total
|
|||||||||||||||
|
Gross
sales
|
$ | 557,669 | $ | 195,161 | $ | - | $ | - | $ | 752,830 | ||||||||||
|
Inter-segment
sales
|
(5,855 | ) | (5,781 | ) | - | - | (11,636 | ) | ||||||||||||
|
Net
sales
|
$ | 551,814 | $ | 189,380 | $ | - | $ | - | $ | 741,194 | ||||||||||
|
Operating
income (loss)
|
$ | 117,535 | $ | 26,132 | $ | (6,000 | ) | $ | (1,567 | ) | $ | 136,100 | ||||||||
|
Other
income (expense), net
|
(1,385 | ) | 176 | 1,521 | - | 312 | ||||||||||||||
|
Earnings
(loss) before income tax provision
|
$ | 116,150 | $ | 26,308 | $ | (4,479 | ) | $ | (1,567 | ) | $ | 136,412 | ||||||||
|
Year Ended December 31,
2007
|
||||||||||||||||||||
|
Power
|
Corporate
|
|||||||||||||||||||
|
(Thousands
of dollars)
|
Oil
Field
|
Transmission
|
&
Other*
|
Adjustment**
|
Total
|
|||||||||||||||
|
Gross
sales
|
$ | 399,955 | $ | 161,731 | $ | - | $ | - | $ | 561,686 | ||||||||||
|
Inter-segment
sales
|
(2,601 | ) | (3,279 | ) | - | - | (5,880 | ) | ||||||||||||
|
Net
sales
|
$ | 397,354 | $ | 158,452 | $ | - | $ | - | $ | 555,806 | ||||||||||
|
Operating
income (loss)
|
$ | 82,629 | $ | 27,122 | $ | - | $ | (5,065 | ) | $ | 104,686 | |||||||||
|
Other
income (expense), net
|
1,108 | 38 | 3,626 | - | 4,772 | |||||||||||||||
|
Earnings
(loss) before income tax provision
|
$ | 83,737 | $ | 27,160 | $ | 3,626 | $ | (5,065 | ) | $ | 109,458 | |||||||||
*
Corporate & Other includes the litigation reserve.
** Due to
the discontinuation of the Trailer segment, certain items previously allocated
to that segment have been reclassified to continuing operations. One adjustment
is related to pension and postretirement charges associated with Trailer
personnel that will continue to be a liability in future years. The other
adjustment is for corporate allocations previously charged to Trailer as these
expenses will continue in the future.
The
following table reconciles total assets for the years ended December
31:
|
(Thousands
of dollars)
|
2009
|
2008
|
||||||
|
Assets
from continuing operations
|
$ | 540,779 | $ | 529,607 | ||||
|
Assets
from discontinued operations
|
811 | 1,111 | ||||||
|
Total
assets
|
$ | 541,590 | $ | 530,718 | ||||
(18) Concentrations
of Credit Risk
The
Company’s concentration with respect to trade accounts receivable is limited.
The large number of customers and diversified customer base across the two
segments significantly reduces the Company’s credit risk. The Company also has
strict policies regarding the granting of credit to customers and does not offer
credit terms to those customers that do not meet certain financial criteria and
other guidelines. However, the recent downturn in the global economy has caused
a higher level of credit risk. The Company is monitoring the payment practices
of customers and is reviewing credit limits more frequently and conservatively
than in prior periods. At December 31, 2009, 2008 and 2007, one customer
represented 11.0%, 15.4% and 15.9%, respectively, of the consolidated Company
sales.
(19) Quarterly Financial Data
(Unaudited)
The
following table sets forth unaudited quarterly financial data for 2009 and
2008:
|
Quarterly Financial Data
(Unaudited)
|
||||||||||||||||
|
First
|
Second
|
Third
|
Fourth
|
|||||||||||||
|
(Millions
of dollars, except per share data)
|
Quarter
|
Quarter
|
Quarter
|
Quarter
|
||||||||||||
|
2009
|
||||||||||||||||
|
Sales
|
$ | 153.1 | $ | 123.7 | $ | 117.7 | $ | 126.8 | ||||||||
|
Gross
profit
|
34.2 | 27.0 | 24.9 | 26.4 | ||||||||||||
|
Net
earnings
|
9.1 | 4.7 | 5.1 | 3.6 | ||||||||||||
|
Basic
earnings per share
|
0.61 | 0.32 | 0.34 | 0.24 | ||||||||||||
|
Diluted
earnings per share
|
0.61 | 0.32 | 0.34 | 0.24 | ||||||||||||
|
2008
|
||||||||||||||||
|
Sales
|
$ | 141.1 | $ | 174.5 | $ | 195.1 | $ | 230.5 | ||||||||
|
Gross
profit
|
40.5 | 47.8 | 55.8 | 69.9 | ||||||||||||
|
Net
earnings
|
15.6 | 21.2 | 25.0 | 26.6 | ||||||||||||
|
Basic
earnings per share
|
1.06 | 1.44 | 1.68 | 1.79 | ||||||||||||
|
Diluted
earnings per share
|
1.05 | 1.42 | 1.66 | 1.78 | ||||||||||||
Item 9. Changes in and
Disagreements with
Accountants on Accounting and Financial Disclosure
None
Item 9A. Controls
and Procedures
Disclosure
Controls and Procedures
Based on
their evaluation of the Company’s disclosure controls and procedures as of
December 31, 2009, the Chief Executive Officer of the Company, John F. Glick,
and the Chief Financial Officer of the Company, Christopher L. Boone, have
concluded that the Company’s disclosure controls and procedures (as defined in
Rules 13a-15(e) and Rule 15d-15(e) promulgated under the Securities Exchange Act
of 1934) are effective to ensure that information required to be disclosed in
reports that the Company files or submits under the Exchange Act is recorded,
processed, summarized and reported within the time periods specified in the
SEC’s rules and forms and effective to ensure that information required to be
disclosed in such reports is accumulated and communicated to the Company’s
management, including the Company’s principal executive officer and principal
financial officer, to allow timely decisions regarding disclosure.
There
were no changes in the Company’s internal control over financial reporting that
occurred during the quarter ended December 31, 2009, that have materially
affected, or are reasonably likely to materially affect, the Company’s internal
control over financial reporting.
Management’s
Report on Internal Control over Financial Reporting and the Report of the
Independent Registered Public Accounting Firm thereon are set forth in Part II,
Item 8 of this report and are incorporated herein by
reference.
Item 9B. Other
Information
None
PART
III
Item
10. Directors, Executive Officers of the Registrant and
Corporate Governance
The
information required by Item 10 regarding directors is incorporated by reference
from the information under the captions “Nominees for Director” and “Information
About Current and Continuing Directors” in the Company’s definitive Proxy
Statement for the 2010 Annual Meeting of Stockholders (the “Proxy Statement”),
which will be filed within 120 days after December 31, 2009. The information
required by Item 10 regarding audit committee financial expert disclosure and
the identification of the Company’s audit committee is incorporated by reference
from the information under the caption “Information About Current and
Continuing Directors – Board Committees” in the Proxy Statement. The information
required by Item 10 regarding the disclosure of delinquent filers pursuant to
Item 405 of Regulation S-K is incorporated by reference from the information
under the caption “Section 16(a) Beneficial Ownership Reporting Compliance” in
the Proxy Statement. The information required by Item 10 regarding executive
officers is incorporated by reference from the information under the caption
“Information About Current Executive Officers” in the Proxy
Statement.
The
Company has adopted a written code of ethics, entitled the “Code of Ethics for
Senior Financial Officers of the Company.” The Company requires all of its
senior financial officers, including the Company’s principal executive officer,
principal financial officer and principal accounting officer, to adhere to the
Code of Ethics for Senior Financial Officers of the Company in addressing the
legal and ethical issues encountered in conducting their work. The Company has
also adopted a written Corporate Code of Conduct applicable to all salaried
employees of the Company, including the senior financial officers. The Company
has made available to stockholders the Code of Ethics for Senior Financial
Officers of the Company and the Corporate Code of Conduct on its website at
www.lufkin.com or a copy can be obtained by writing to the Company Secretary,
P.O. Box 849, Lufkin, Texas 75902. Any amendment to, or waiver from, the Code of
Ethics for Senior Financial Officers of the Company and the Corporate Code of
Conduct will be disclosed in a current report on Form 8-K within four business
days of such amendment or waiver as required by the Marketplace Rules of the
Nasdaq Stock Market, Inc.
Item 11. Executive Compensation
The
information required by Item 11 is incorporated by reference from the
information under the captions “Executive
Compensation”, “Compensation Committee Report”, “Stock Option Plans”,
“Compensation Committee Interlocks and Insider Participation”, “Board
Committees” and “Director Compensation” in the Proxy Statement.
Item 12. Security
Ownership of Certain Beneficial Owners and Management and Related
Stockholder Matters
The
information required by Item 12 related to security ownership of certain
beneficial owners and management and related stockholder matters is incorporated
by reference from the information under the caption “Security Ownership of
Certain Beneficial Owners and Management” in the Proxy Statement. Information
concerning securities authorized for issuance under the Company’s equity
compensation plans is set forth under the caption “Equity Compensation Plan
Information” in Part II, item 5 of this report and is incorporated in Item 12 of
this report by reference.
Item
13. Certain Relationships and Related Transactions and
Director Independence
During
2009, there were no transactions with management and others, no business
relationships regarding directors or nominees for directors and no indebtedness
of management required to be disclosed pursuant to this Item 13. The information
required by Item 13 related to director independence is incorporated by
reference from the information under the caption “Information About Current and
Continuing Directors” in the Proxy Statement. The information required by Item
13 regarding related-person transactions is incorporated by reference to the
information under the caption “Related Person Transactions” in the Proxy
Statement.
Item 14. Principal
Accountant Fees and Services
The
information required by Item 14 is incorporated by reference from the
information under the caption “Report of the Audit Committee” and “Independent
Public Accountants” in the Proxy Statement.
PART
IV
Item 15. Exhibits
and Financial Statement Schedules
|
(a)
|
Documents
filed as part of the report
|
|
|
1.
|
Consolidated
Financial Statements
|
|
|
Report
of Independent Registered Public Accounting Firm
|
||
|
Consolidated
Balance Sheets
|
||
|
Consolidated
Statements of Earnings
|
||
|
Consolidated
Statements of Shareholders' Equity & Comprehensive
Income
|
||
|
Consolidated
Statements of Cash Flows
|
||
|
Notes
to Consolidated Financial Statements
|
||
|
2.
|
Financial
Statement Schedules
|
|
Schedule
II- Valuation and Qualifying Accounts
All other
financial statement schedules are omitted because of the absence of conditions
under which they are required or because all material information required to be
reported are included in the consolidated financial statements and notes
thereto.
|
3.
|
Exhibits
|
|
Exhibit
Number
|
Description
|
|
|
3.1
|
Fourth
Restated Articles of Incorporation, as amended, included as Exhibit 4.1 to
Lufkin Industries, Inc.’s (the “Company”) registration statement on Form
S-8 filed February 17, 2004 (File No. 333-112890), which exhibit is
incorporated herein by reference.
|
|
|
3.2
|
Articles
of Amendment to Fourth Restated Articles of Incorporation, included as
Exhibit 3.1 to the Company’s current report on Form 8-K of the registrant
filed December 10, 1999, which exhibit is incorporated herein by
reference.
|
|
|
3.3
|
Amended
and Restated Bylaws, included as Exhibit 3.1 to the Company’s current
report on Form 8-K of the registrant filed October 9, 2007 (File No.
0-02612), which exhibit is incorporated herein by
reference.
|
|
|
4.1
|
Form
of Common Stock Certificate, included as Exhibit 4.1 to the Company’s
quarterly report on Form 10-Q of the registrant filed May 9, 2005 (File
No. 0-02612), which exhibit is incorporated herein by
reference.
|
|
|
*10.1
|
1990
Stock Option Plan, included as Exhibit 4.3 to the Company's registration
statement on Form S-8 dated August 23, 1995 (File No. 33-62021), which
plan is incorporated herein by reference.
|
|
|
*10.2
|
1996
Nonemployee Director Stock Option Plan, included as Exhibit 4.3 to the
Company's registration statement on Form S-8 dated June 28, 1996 (File No.
333-07129), which plan is incorporated herein by
reference.
|
|
|
*10.3
|
Amended
and Restated Incentive Stock Compensation Plan 2000, included as Exhibit
10.1 to the Company's current report on Form 8-K dated August 2, 2007
(File No. 0-02612), which exhibit is incorporated herein by
reference.
|
|
|
10.4
|
Credit
Agreement, dated December 30, 2002, between Lufkin Industries, Inc.,
JPMorgan Chase Bank and the lenders party thereto, included as Exhibit
10.1 to the Company’s quarterly report on Form 10-Q of the registrant
filed May 9, 2005 (File No. 0-02612), which exhibit is incorporated herein
by reference.
|
|
|
10.5
|
Agreement
and First Amendment to Credit Agreement, dated June 30, 2004, between
Lufkin Industries, Inc. and JPMorgan Chase Bank, included as Exhibit 10.2
to the Company’s quarterly report on Form 10-Q of the registrant filed May
9, 2005 (File No. 0-02612), which exhibit is incorporated herein by
reference.
|
|
|
10.6
|
Agreement
and Second Amendment to Credit Agreement, dated February 1, 2005, between
Lufkin Industries, Inc. and JPMorgan Chase Bank, included as Exhibit to
the Company’s quarterly report on 10.3 Form 10-Q of the registrant filed
May 9, 2005 (File No. 0-02612), which exhibit is incorporated herein by
reference.
|
|
|
10.7
|
Agreement
and Third Amendment to Credit Agreement between Lufkin Industries, Inc. and
JPMorgan Chase Bank, National Association, included as Exhibit 10.3
to the Company’s current report on Form 8-K of the registrant filed
February 21, 2006 (File No. 0-02612), which exhibit is incorporated herein
by reference.
|
|
|
10.8
|
Agreement
and Fourth Amendment to Credit Agreement between Lufkin Industries, Inc. and
JPMorgan Chase Bank, National Association, included as Exhibit 10.1
to the Company’s current report on Form 8-K of the registrant filed
November 30, 2007 (File No. 0-02612), which exhibit is incorporated herein
by reference.
|
|
|
*10.9
|
Form
of Employee Stock Option Agreement for the Company’s 2000 Incentive Stock
Compensation Plan, included as Exhibit 10.5 to the Company’s current
report on Form 8-K dated May 13, 2008 (File No. 0-02612), which exhibit is
incorporated herein by reference.
|
|
|
*10.10
|
Form
of Director Stock Option Agreement for the Company’s 2000 Incentive Stock
Compensation Plan, included as Exhibit 10.6 to the Company’s current
report on Form 8-K dated May 13, 2008 (File No. 0-02612), which exhibit is
incorporated herein by reference.
|
|
|
*10.11
|
Thrift
Plan Restoration Plan for Salaried Employees of Lufkin Industries, Inc.,
as amended, included as exhibit 10.13 to the Company's annual report on
Form 10-K of the registrant filed March 1, 2007 (File No. 0-02612), which
exhibit is incorporated herein by reference.
|
|
|
*10.12
|
Retirement Plan
Restoration Plan for Salaried Employees of Lufkin Industries, Inc,
as amended, included as exhibit 10.14 to the Company's annual report on
Form 10-K of the registrant filed March 1, 2007 (File No. 0-02612), which
exhibit is incorporated herein by reference.
|
|
|
*10.13
|
Lufkin Industries,
Inc. Supplemental Retirement Plan, as amended, as amended, included
as exhibit 10.15 to the Company's annual report on Form 10-K of the
registrant filed March 1, 2007 (File No. 0-02612), which exhibit is
incorporated herein by reference.
|
|
|
*10.14
|
Lufkin
Industries, Inc. 2010 Variable Compensation Plan, included as Exhibit 10.1
to Form 8-K filed February 12, 2010 (File No. 0-02612),
which exhibit is incorporated herein by
reference.
|
|
|
*10.15
|
Amended
and Restated Severance Agreement, dated January 21, 2008, between Lufkin
Industries, Inc. and Mark E. Crews, included as
Exhibit 10.1 to the Company’s current report on Form 8-K
filed on December 31, 2008
(File No. 0-02612), which exhibit is incorporated herein by
reference.
|
|
|
*10.16
|
Amended
and Restated Severance Agreement, dated February 12, 2008, between Lufkin
Industries, Inc. and Terry L. Orr, included as
Exhibit 10.2 to the Company’s current report on Form 8-K
filed on December 31, 2008
(File No. 0-02612), which exhibit is incorporated herein by
reference.
|
|
|
*10.17
|
Amended
and Restated Severance Agreement, dated March 1, 2008, between Lufkin
Industries, Inc. and John F. Glick, included as
Exhibit 10.3 to the Company’s current report on Form 8-K
filed on December 31, 2008
(File No. 0-02612), which exhibit is incorporated herein by
reference.
|
|
|
*10.18
|
Amended
and Restated Severance Agreement, dated May 7, 2008, between Lufkin
Industries, Inc. and Christopher L. Boone, included as
Exhibit 10.4 to the Company’s current report on Form 8-K
filed on December 31, 2008
(File No. 0-02612), which exhibit is incorporated herein by
reference.
|
|
|
*10.19
|
Amended
and Restated Severance Agreement, dated January 1, 2005, between Lufkin
Industries, Inc. and Paul G. Perez, included as
Exhibit 10.5 to the Company’s current report on Form 8-K
filed on December 31, 2008
(File No. 0-02612), which exhibit is incorporated herein by
reference.
|
|
|
*10.20
|
Amended
and Restated Severance Agreement, dated January 1, 2005, between Lufkin
Industries, Inc. and Scott H. Semlinger, included as
Exhibit 10.6 to the Company’s current report on Form 8-K
filed on December 31, 2008
(File No. 0-02612), which exhibit is incorporated herein by
reference.
|
|
|
*10.21
|
Amended
and Restated Employment Agreement, dated as of March 1, 2008, by and
between Lufkin Industries, Inc. and John F. Glick included as Exhibit 10.7
to the Company's current report on Form 8-K filed on December 31, 2008
(File No. 0-02612), which exhibit is incorporated herein by
reference.
|
|
|
*10.22
|
Amended
and Restated Employment Agreement, dated as of August 18, 2006, by and
between Lufkin Industries, Inc. and Paul G. Perez included as Exhibit 10.8
to the Company's current report on Form 8-K filed on December 31, 2008
(File No. 0-02612), which exhibit is incorporated herein by
reference.
|
|
|
*10.23
|
Amended
and Restated Employment Agreement, dated as of August 18, 2006, by and
between Lufkin Industries, Inc. and Scott H. Semlinger included as Exhibit
10.9 to the Company's current report on Form 8-K filed on December 31,
2008 (File No. 0-02612), which exhibit is incorporated herein by
reference.
|
|
|
18.1
|
Accountants'
preferability letter regarding change in accounting
principles.
|
|
|
21
|
Subsidiaries
of the registrant
|
|
|
23
|
Consent
of Independent Registered Public Accounting Firm
|
|
|
31.1
|
Rule
13a-14(a)/15d-14(a) Certification of the Chief Executive
Officer
|
|
|
31.2
|
Rule
13a-14(a)/15d-14(a) Certification of the Chief Financial
Officer
|
|
|
32.1
|
Section
1350 Certification of the Chief Executive Officer
certification
|
|
|
32.2
|
Section
1350 Certification of the Chief Financial Officer
certification
|
*
Management contract or compensatory plan or arrangement.
SCHEDULE
II
Lufkin
Industries, Inc.
Valuation
& Qualifying Accounts
(in
thousands of dollars)
|
Additions
|
||||||||||||||||||||
|
Balance
at
|
Charged
to
|
Balance
at
|
||||||||||||||||||
|
Beginning
|
Charged
|
Other
|
End
of
|
|||||||||||||||||
|
Description
|
of
Year
|
to
Expense
|
Accounts
|
Deductions
|
Year
|
|||||||||||||||
|
Allowance
for Doubtful Receivables:
|
||||||||||||||||||||
|
Year
Ended December 31, 2009
|
$ | 735 | (1,844 | ) | 1,349 | $ | 240 | |||||||||||||
|
Year
Ended December 31, 2008
|
89 | 2,462 | - | (1,816 | ) | 735 | ||||||||||||||
|
Year
Ended December 31, 2007
|
$ | 129 | 12 | - | (52 | ) | $ | 89 | ||||||||||||
|
Inventory:
Valuation Reserves:
|
||||||||||||||||||||
|
Year
Ended December 31, 2009
|
$ | 4,535 | 100 | - | (1,992 | ) | $ | 2,643 | ||||||||||||
|
Year
Ended December 31, 2008
|
1,579 | 2,964 | - | (8 | ) | 4,535 | ||||||||||||||
|
Year
Ended December 31, 2007
|
$ | 1,172 | 446 | - | (39 | ) | $ | 1,579 | ||||||||||||
|
Inventory:
LIFO Reserves:
|
||||||||||||||||||||
|
Year
Ended December 31, 2009
|
$ | 32,926 | (2,965 | ) | - | $ | 29,961 | |||||||||||||
|
Year
Ended December 31, 2008
|
25,184 | 7,742 | - | - | 32,926 | |||||||||||||||
|
Year
Ended December 31, 2007
|
$ | 23,279 | 1,905 | - | - | $ | 25,184 | |||||||||||||
SIGNATURES
Pursuant to the requirements of Section
13 or 15(d) of the Securities Exchange Act of 1934, the registrant has duly
caused this report to be signed on its behalf by the undersigned, thereunto duly
authorized.
LUFKIN
INDUSTRIES, INC.
BY /s/
Christopher L. Boone
Christopher
L. Boone
Signing
on behalf of the registrant and as
Vice
President/Treasurer/Chief Financial Officer
(Principal
Financial and Accounting Officer)
Date:
March 1, 2010
Pursuant to the requirements of the
Securities Exchange Act of 1934, this report has been signed below by the
following persons on behalf of the registrant and in the capacities and on the
dates indicated.
|
Name
|
Title
|
Date
|
|
|
By
|
/s/
J. F. Glick
|
President/Chief
Executive Officer
|
March
1, 2010
|
|
J.
F. Glick
|
(Principal
Executive Officer)
|
||
|
By
|
/s/
C. L. Boone
|
Vice
President/Treasurer/Chief Financial Officer
|
March
1, 2010
|
|
C.
L. Boone
|
(Principal
Financial and Accounting Officer)
|
||
|
By
|
/s/
D. V. Smith
|
Chairman
of the Board of Directors
|
March
1, 2010
|
|
D.
V. Smith
|
|||
|
By
|
/s/
J. F. Anderson
|
Director
|
March
1, 2010
|
|
J.F.
Anderson
|
|||
|
By
|
/s/
S. V. Baer
|
Director
|
March
1, 2010
|
|
S.
V. Baer
|
|||
|
By
|
/s/
J. D. Hofmeister
|
Director
|
March
1, 2010
|
|
J.
D. Hofmeister
|
|||
|
By
|
/s/
J. T. Jongebloed
|
Director
|
March
1, 2010
|
|
J.
T. Jongebloed
|
|||
|
By
|
/s/
J. H. Lollar
|
Director
|
March
1, 2010
|
|
J.
H. Lollar
|
|||
|
By
|
/s/
B. H. O’Neal
|
Director
|
March
1, 2010
|
|
B.
H. O'Neal
|
|||
|
By
|
/s/
R. R. Stewart
|
Director
|
March
1, 2010
|
|
R.
R. Stewart
|
|||
|
By
|
/s/
H. J. Trout, Jr.
|
Director
|
March
1, 2010
|
|
H.
J. Trout, Jr.
|
|||
|
By
|
/s/
T. E. Wiener
|
Director
|
March
1, 2010
|
|
T.
E. Wiener
|
INDEX
TO EXHIBITS
|
Exhibit
Number
|
Description
|
|
|
3.1
|
Fourth
Restated Articles of Incorporation, as amended, included as Exhibit 4.1 to
Lufkin Industries, Inc.’s (the “Company”) registration statement on Form
S-8 filed February 17, 2004 (File No. 333-112890), which exhibit is
incorporated herein by reference.
|
|
|
3.2
|
Articles
of Amendment to Fourth Restated Articles of Incorporation, included as
Exhibit 3.1 to the Company’s current report on Form 8-K of the registrant
filed December 10, 1999, which exhibit is incorporated herein by
reference.
|
|
|
3.3
|
Amended
and Restated Bylaws, included as Exhibit 3.1 to the Company’s current
report on Form 8-K of the registrant filed October 9, 2007 (File No.
0-02612), which exhibit is incorporated herein by
reference.
|
|
|
4.1
|
Form
of Common Stock Certificate, included as Exhibit 4.1 to the Company’s
quarterly report on Form 10-Q of the registrant filed May 9, 2005 (File
No. 0-02612), which exhibit is incorporated herein by
reference.
|
|
|
*10.1
|
1990
Stock Option Plan, included as Exhibit 4.3 to the Company's registration
statement on Form S-8 dated August 23, 1995 (File No. 33-62021), which
plan is incorporated herein by reference.
|
|
|
*10.2
|
1996
Nonemployee Director Stock Option Plan, included as Exhibit 4.3 to the
Company's registration statement on Form S-8 dated June 28, 1996 (File No.
333-07129), which plan is incorporated herein by
reference.
|
|
|
*10.3
|
Amended
and Restated Incentive Stock Compensation Plan 2000, included as Exhibit
10.1 to the Company's current report on Form 8-K dated August 2, 2007
(File No. 0-02612), which exhibit is incorporated herein by
reference.
|
|
|
10.4
|
Credit
Agreement, dated December 30, 2002, between Lufkin Industries, Inc.,
JPMorgan Chase Bank and the lenders party thereto, included as Exhibit
10.1 to the Company’s quarterly report on Form 10-Q of the registrant
filed May 9, 2005 (File No. 0-02612), which exhibit is incorporated herein
by reference.
|
|
|
10.5
|
Agreement
and First Amendment to Credit Agreement, dated June 30, 2004, between
Lufkin Industries, Inc. and JPMorgan Chase Bank, included as Exhibit 10.2
to the Company’s quarterly report on Form 10-Q of the registrant filed May
9, 2005 (File No. 0-02612), which exhibit is incorporated herein by
reference.
|
|
|
10.6
|
Agreement
and Second Amendment to Credit Agreement, dated February 1, 2005, between
Lufkin Industries, Inc. and JPMorgan Chase Bank, included as Exhibit to
the Company’s quarterly report on 10.3 Form 10-Q of the registrant filed
May 9, 2005 (File No. 0-02612), which exhibit is incorporated herein by
reference.
|
|
|
10.7
|
Agreement
and Third Amendment to Credit Agreement between Lufkin Industries, Inc. and
JPMorgan Chase Bank, National Association, included as Exhibit 10.3
to the Company’s current report on Form 8-K of the registrant filed
February 21, 2006 (File No. 0-02612), which exhibit is incorporated herein
by reference.
|
|
|
10.8
|
Agreement
and Fourth Amendment to Credit Agreement between Lufkin Industries, Inc. and
JPMorgan Chase Bank, National Association, included as Exhibit 10.1
to the Company’s current report on Form 8-K of the registrant filed
November 30, 2007 (File No. 0-02612), which exhibit is incorporated herein
by reference.
|
|
|
*10.9
|
Form
of Employee Stock Option Agreement for the Company’s 2000 Incentive Stock
Compensation Plan, included as Exhibit 10.5 to the Company’s current
report on Form 8-K dated May 13, 2008 (File No. 0-02612), which exhibit is
incorporated herein by reference.
|
|
|
*10.10
|
Form
of Director Stock Option Agreement for the Company’s 2000 Incentive Stock
Compensation Plan, included as Exhibit 10.6 to the Company’s current
report on Form 8-K dated May 13, 2008 (File No. 0-02612), which exhibit is
incorporated herein by reference.
|
|
|
*10.11
|
Thrift
Plan Restoration Plan for Salaried Employees of Lufkin Industries, Inc.,
as amended, included as exhibit 10.13 to the Company's annual report on
Form 10-K of the registrant filed March 1, 2007 (File No. 0-02612), which
exhibit is incorporated herein by reference.
|
|
|
*10.12
|
Retirement Plan
Restoration Plan for Salaried Employees of Lufkin Industries, Inc,
as amended, included as exhibit 10.14 to the Company's annual report on
Form 10-K of the registrant filed March 1, 2007 (File No. 0-02612), which
exhibit is incorporated herein by reference.
|
|
|
*10.13
|
Lufkin Industries,
Inc. Supplemental Retirement Plan, as amended, as amended, included
as exhibit 10.15 to the Company's annual report on Form 10-K of the
registrant filed March 1, 2007 (File No. 0-02612), which exhibit is
incorporated herein by reference.
|
|
|
*10.14
|
Lufkin
Industries, Inc. 2010 Variable Compensation Plan, included as Exhibit 10.1
to Form 8-K filed February 12, 2010 (File No. 0-02612),
which exhibit is incorporated herein by
reference.
|
|
|
*10.15
|
Amended
and Restated Severance Agreement, dated January 21, 2008, between Lufkin
Industries, Inc. and Mark E. Crews, included as
Exhibit 10.1 to the Company’s current report on Form 8-K
filed on December 31, 2008
(File No. 0-02612), which exhibit is incorporated herein by
reference.
|
|
|
*10.16
|
Amended
and Restated Severance Agreement, dated February 12, 2008, between Lufkin
Industries, Inc. and Terry L. Orr, included as
Exhibit 10.2 to the Company’s current report on Form 8-K
filed on December 31, 2008
(File No. 0-02612), which exhibit is incorporated herein by
reference.
|
|
|
*10.17
|
Amended
and Restated Severance Agreement, dated March 1, 2008, between Lufkin
Industries, Inc. and John F. Glick, included as
Exhibit 10.3 to the Company’s current report on Form 8-K
filed on December 31, 2008
(File No. 0-02612), which exhibit is incorporated herein by
reference.
|
|
|
*10.18
|
Amended
and Restated Severance Agreement, dated May 7, 2008, between Lufkin
Industries, Inc. and Christopher L. Boone, included as
Exhibit 10.4 to the Company’s current report on Form 8-K
filed on December 31, 2008
(File No. 0-02612), which exhibit is incorporated herein by
reference.
|
|
|
*10.19
|
Amended
and Restated Severance Agreement, dated January 1, 2005, between Lufkin
Industries, Inc. and Paul G. Perez, included as
Exhibit 10.5 to the Company’s current report on Form 8-K
filed on December 31, 2008
(File No. 0-02612), which exhibit is incorporated herein by
reference.
|
|
|
*10.20
|
Amended
and Restated Severance Agreement, dated January 1, 2005, between Lufkin
Industries, Inc. and Scott H. Semlinger, included as
Exhibit 10.6 to the Company’s current report on Form 8-K
filed on December 31, 2008
(File No. 0-02612), which exhibit is incorporated herein by
reference.
|
|
|
*10.21
|
Amended
and Restated Employment Agreement, dated as of March 1, 2008, by and
between Lufkin Industries, Inc. and John F. Glick included as Exhibit 10.7
to the Company's current report on Form 8-K filed on December 31, 2008
(File No. 0-02612), which exhibit is incorporated herein by
reference.
|
|
|
*10.22
|
Amended
and Restated Employment Agreement, dated as of August 18, 2006, by and
between Lufkin Industries, Inc. and Paul G. Perez included as Exhibit 10.8
to the Company's current report on Form 8-K filed on December 31, 2008
(File No. 0-02612), which exhibit is incorporated herein by
reference.
|
|
|
*10.23
|
Amended
and Restated Employment Agreement, dated as of August 18, 2006, by and
between Lufkin Industries, Inc. and Scott H. Semlinger included as Exhibit
10.9 to the Company's current report on Form 8-K filed on December 31,
2008 (File No. 0-02612), which exhibit is incorporated herein by
reference.
|
|
|
18.1
|
Accountants'
preferability letter regarding change in accounting
principles.
|
|
|
21
|
Subsidiaries
of the registrant
|
|
|
23
|
Consent
of Independent Registered Public Accounting Firm
|
|
|
31.1
|
Rule
13a-14(a)/15d-14(a) Certification of the Chief Executive
Officer
|
|
|
31.2
|
Rule
13a-14(a)/15d-14(a) Certification of the Chief Financial
Officer
|
|
|
32.1
|
Section
1350 Certification of the Chief Executive Officer
certification
|
|
|
32.2
|
Section
1350 Certification of the Chief Financial Officer
certification
|
*
Management contract or compensatory plan or
arrangement.