Attached files
| file | filename |
|---|---|
| EX-23 - EXHIBIT 23 - CONMED Corp | ex23.htm |
| EX-21 - EXHIBIT 21 - CONMED Corp | ex21.htm |
| EX-31.2 - EXHIBIT 31.2 - CONMED Corp | ex31-2.htm |
| EX-31.1 - EXHIBIT 31.1 - CONMED Corp | ex31-1.htm |
| EX-32.1 - EXHIBIT 32.1 - CONMED Corp | ex32-1.htm |
United States
Securities
and Exchange Commission
Washington,
D.C.
20549
Form
10-K
Annual
Report Pursuant to Section 13 or 15(d) of
The
Securities Exchange Act of 1934
|
For
the fiscal year ended December 31, 2009
|
Commission
file number 0-16093
|
|
CONMED
CORPORATION
(Exact
name of registrant as specified in its charter)
|
|
|
New
York
(State
or other jurisdiction of incorporation or organization)
|
16-0977505
(I.R.S.
Employer
Identification
No.)
|
|
525
French Road, Utica, New York
(Address
of principal executive offices)
|
13502
(Zip
Code)
|
|
(315)
797-8375
Registrant's
telephone number, including area code
|
|
|
Securities
registered pursuant to Section 12(g) of the Act:
Common
Stock, $.01 par value per share
(Title
of class)
|
|
Indicate
by check mark if the registrant is a well-known seasoned issuer (as defined in
Rule 405 of the Securities Act). Yes ¨ No x
Indicate
by check mark if the registrant is not required to file reports pursuant to
Section 13 or Section 15(d) of the Exchange Act. Yes ¨ No x
Indicate
by check mark whether the registrant (1) has filed all reports required to be
filed by Section 13 or 15(d) of the Securities Exchange Act of 1934 during the
preceding 12 months (or for such shorter period that the registrant was required
to file such reports), and (2) has been subject to such filing requirements for
the past 90 days. Yes x No ¨
Indicate
by check mark whether the registrant has submitted electronically and posted on
its corporate Web site, if any, every Interactive Data File required to be
submitted and posted pursuant to Rule 405 of Regulation S-T (§232.405 of this
chapter) during the preceding 12 months (or for shorter period that the
registrant was required to submit and post such files). x
Indicate
by check mark if disclosure of delinquent filers pursuant to Item 405 of
Regulation S-K is not contained herein, and will not be contained, to the best
of registrant's knowledge, in definitive proxy or information statements
incorporated by reference in Part III of this Form 10-K or any amendment to this
Form 10-K. ¨
Indicate
by check mark whether the registrant is a large accelerated filer, an
accelerated filer, a non-accelerated filer, or a smaller reporting
company. See definition of “accelerated filer and large accelerated
filer” in Rule 12b-2 of the Exchange Act (Check one).
|
Large
accelerated filer o
|
Accelerated
filer x
|
|
Non-accelerated
filer ¨
|
Smaller
reporting company ¨
|
Indicate
by check mark whether the registrant is a shell company (as defined in Rule
12b-2 of the Exchange Act). Yes ¨ No x
As of
June 30, 2009, the last business day of the registrant’s most recently completed
second fiscal quarter, the aggregate market value of the shares of voting common
stock held by non-affiliates of the registrant was approximately $451,273,053
based upon the closing price of the Company’s common stock on the NASDAQ Stock
Market.
The
number of shares of the registrant's $0.01 par value common stock outstanding as
of February 22, 2010 was 29,162,535
DOCUMENTS
INCORPORATED BY REFERENCE:
Portions
of the Definitive Proxy Statement or other informational filing for the 2010
Annual Meeting of Shareholders are incorporated by reference into Part III of
this report.
CONMED
CORPORATION
ANNUAL
REPORT ON FORM 10-K
FOR
YEAR ENDED DECEMBER 31, 2009
TABLE
OF CONTENTS
|
Page
|
||
|
2
|
||
|
20
|
||
|
29
|
||
|
30
|
||
|
31
|
||
|
32
|
||
|
35
|
||
|
37
|
||
|
56
|
||
|
57
|
||
|
58
|
||
|
58
|
||
|
58
|
||
|
59
|
||
|
59
|
||
|
59
|
||
|
59
|
||
|
59
|
||
|
60
|
||
|
61
|
||
-1-
CONMED
CORPORATION
|
Item 1.
|
Business
|
|
|
Forward
Looking Statements
|
This
Annual Report on Form 10-K for the Fiscal Year Ended December 31, 2009 (“Form
10-K”) contains certain forward-looking statements (as such term is defined in
the Private Securities Litigation Reform Act of 1995) and information relating
to CONMED Corporation (“CONMED”, the “Company”, “we” or “us” — references to
“CONMED”, the “Company”, “we” or “us” shall be deemed to include our direct and
indirect subsidiaries unless the context otherwise requires) which are based on
the beliefs of our management, as well as assumptions made by and information
currently available to our management.
When
used in this Form 10-K, the words “estimate,” “project,” “believe,”
“anticipate,” “intend,” “expect” and similar expressions are intended to
identify forward-looking statements. These statements involve known and unknown
risks, uncertainties and other factors, including those identified under the
caption “Item 1A-Risk Factors” and elsewhere in this Form 10-K which may cause
our actual results, performance or achievements, or industry results, to be
materially different from any future results, performance or achievements
expressed or implied by such forward-looking statements. Such factors include,
among others, the following:
|
|
·
|
general economic and business
conditions;
|
|
|
·
|
changes in foreign exchange
and interest rates;
|
|
|
·
|
cyclical customer purchasing
patterns due to budgetary and other
constraints;
|
|
|
·
|
changes in customer
preferences;
|
|
|
·
|
competition;
|
|
|
·
|
changes in
technology;
|
|
|
·
|
the introduction and
acceptance of new products;
|
|
|
·
|
the ability to evaluate,
finance and integrate acquired businesses, products and
companies;
|
|
|
·
|
changes in business
strategy;
|
|
|
·
|
the availability and cost of
materials;
|
|
|
·
|
the possibility that United
States or foreign regulatory and/or administrative agencies may initiate
enforcement actions against us or our
distributors;
|
|
|
·
|
future levels of indebtedness
and capital spending;
|
|
|
·
|
quality of our management and
business abilities and the judgment of our
personnel;
|
|
|
·
|
the availability, terms and
deployment of capital;
|
|
|
·
|
the risk of litigation,
especially patent litigation as well as the cost associated with patent
and other litigation;
|
|
|
·
|
changes in regulatory
requirements; and
|
|
|
·
|
various other factors
referenced in this Form 10-K.
|
See “Item
7-Management’s Discussion and Analysis of Financial Condition and Results of
Operations”, “Item 1-Business” and “Item 1A-Risk Factors” for a further
discussion of these factors. You are cautioned not to place undue reliance on
these forward-looking statements, which speak only as of the date hereof. We do
not undertake any obligation to publicly release any revisions to these
forward-looking statements to reflect events or circumstances after the date of
this Form 10-K or to reflect the occurrence of unanticipated
events.
-2-
General
CONMED
Corporation was incorporated under the laws of the State of New York in 1970 by
Eugene R. Corasanti, the Company’s founder and Chairman of the
Board. CONMED is a medical technology company with an emphasis on
surgical devices and equipment for minimally invasive procedures and
monitoring. The Company’s products serve the clinical areas of
arthroscopy, powered surgical instruments, electrosurgery, cardiac monitoring
disposables, endosurgery and endoscopic technologies. They are used
by surgeons and physicians in a variety of specialties including orthopedics,
general surgery, gynecology, neurosurgery, and
gastroenterology. Headquartered in Utica, New York, the Company’s
3,500 employees distribute its products worldwide from eight manufacturing
locations. See Note 8 to the Consolidated Financial Statements for
further discussion of our reporting segments and financial information about
geographic areas.
We have
historically used strategic business acquisitions and exclusive distribution
relationships to diversify our product offerings, increase our market share in
certain product lines, realize economies of scale and take advantage of growth
opportunities in the healthcare field.
We are
committed to offering products with the highest standards of quality,
technological excellence and customer service. Substantially all of
our facilities have attained certification under the ISO international quality
standards and other domestic and international quality
accreditations.
Our
annual report on Form 10-K, quarterly reports on Form 10-Q, current reports on
Form 8-K, and amendments to those reports are accessible free of charge through
the Investor Relations section of our website (http://www.conmed.com)
as soon as practicable after such materials have been electronically filed with,
or furnished to, the United States Securities and Exchange
Commission.
Industry
Market
growth for our products is primarily driven by:
|
|
·
|
Favorable
Demographics. The number of surgical procedures
performed is increasing and we believe the long term demographic trend
will be continued growth in surgical procedures as a result of the aging
of the population, and technological advancements, which result in safer
and less invasive (or non-invasive) surgical
procedures. Additionally, as people are living longer, more
active lives, they are engaging in contact sports and activities such as
running, skiing, rollerblading, golf and tennis which result in injuries
with greater frequency and at an earlier age than ever
before. Sales of surgical products aggregated approximately 90%
of our total net revenues in 2009. See
“Products.”
|
-3-
|
|
·
|
Continued Pressure to Reduce
Health Care Costs. In response to rising health care
costs, managed care companies and other third-party payers have placed
pressures on health care providers to reduce costs. As a
result, health care providers have focused on the high cost areas such as
surgery. To reduce costs, health care providers use minimally
invasive techniques, which generally reduce patient trauma, recovery time
and ultimately the length of hospitalization. Approximately 50%
of our products are designed for use in minimally invasive surgical
procedures. See “Products.” Health care providers
are also increasingly purchasing single-use, disposable products, which
reduce the costs associated with sterilizing surgical instruments and
products following surgery. The single-use nature of disposable
products lowers the risk of incorrectly sterilized instruments spreading
infection into the patient and increasing the cost of post-operative
care. Approximately 75% of our sales are derived from
single-use disposable products.
|
In the
United States, the pressure on health care providers to contain costs has caused
many health care providers to enter into comprehensive purchasing contracts with
fewer suppliers, which offer a broader array of products at lower
prices. In addition, many health care providers have aligned
themselves with Group Purchasing Organizations (“GPOs”) or Integrated Health
Networks (“IHNs”), whose stated purpose is to aggregate the purchasing volume of
their members in order to negotiate competitive pricing with suppliers,
including manufacturers of surgical products. We believe that these
trends will favor entities which offer a diverse product
portfolio. See “—Business Strategy”.
|
|
·
|
Increased Global Medical
Spending. We believe that foreign markets offer
significant growth opportunities for our products. We currently
distribute our products through our own sales subsidiaries or through
local dealers in over 100 foreign
countries.
|
Competitive
Strengths
Management
believes that we hold a significant market share position in each of our key
product areas including, Arthroscopy, Powered Surgical Instruments,
Electrosurgery, Patient Care, Endosurgery and Endoscopic
Technologies. We have established a leadership position in the
marketplace by capitalizing on the following competitive strengths:
|
|
·
|
Brand
Recognition. Our products are marketed under leading
brand names, including CONMED®,
CONMED Linvatec®
and Hall Surgical®. These
brand names are recognized by physicians and healthcare professionals for
quality and service. It is our belief that brand recognition
facilitates increased demand for our products in the marketplace, enables
us to build upon the brand’s associated reputation for quality and
service, and realize increased market acceptance of new branded
products.
|
|
|
·
|
Breadth of Product
Offering. The breadth of our product lines in our key
product areas enables us to meet a wide range of customer requirements and
preferences. This has enhanced our ability to market our
products to surgeons, hospitals, surgery centers, GPOs, IHNs and other
customers, particularly as institutions seek to reduce costs and minimize
the number of suppliers.
|
|
|
·
|
Successful Integration of
Acquisitions. We seek to build growth platforms around our core
markets through focused acquisitions of complementary businesses and
product lines. These acquisitions have enabled us to diversify
our product portfolio, expand our sales and marketing capabilities and
strengthen our presence in key geographical
markets.
|
-4-
|
|
·
|
Strategic Marketing and
Distribution Channels. We market our products
domestically through five focused sales force groups consisting of
approximately 250 employee sales representatives and 200 sales
professionals employed by independent sales agent groups. Each
of our dedicated sales professionals are highly knowledgeable in the
applications and procedures for the products they
sell. Our sales representatives foster close professional
relationships with physicians, surgeons, hospitals, outpatient surgery
centers and physicians’ offices. Additionally, we maintain a
global presence through sales subsidiaries and branches located in key
international markets. We directly service hospital customers
located in these markets through an employee-based international sales
force of approximately 240 sales representatives. We also
maintain distributor relationships domestically and in numerous countries
worldwide. See
“—Marketing.”
|
|
|
·
|
Operational Improvements and
Manufacturing. We are focused on continuously improving
our supply chain effectiveness, strengthening our manufacturing processes
and optimizing our plant network to increase operational efficiencies
within the organization. Substantially all of our
products are manufactured and assembled from components we
produce. Our strategy has historically been to vertically
integrate our manufacturing facilities in order to develop a competitive
advantage. This integration provides us with cost efficient and
flexible manufacturing operations which permit us to allocate capital more
efficiently. Additionally, we attempt to exploit commercial
synergies between operations, such as the procurement of common raw
materials and components used in
production.
|
|
|
·
|
Technological
Leadership. Research and development efforts are closely
aligned with our key business objectives, namely developing and improving
products and processes, applying innovative technology to the manufacture
of products for new global markets and reducing the cost of producing core
products. These efforts are evidenced by recent product
introductions, such as the CONMED Linvatec Shoulder Restoration
System.
|
Business
Strategy
Our
principal objectives are to improve the quality of surgical outcomes and patient
care through the development of innovative medical devices, the refinement of
existing products and the development of new technologies which reduce risk,
trauma, cost and procedure time. We believe that by meeting these
objectives we will enhance our ability to anticipate and adapt to customer needs
and market opportunities, and provide shareholders with superior investment
returns. We intend to achieve future growth and earnings development
through the following initiatives:
|
|
·
|
Introduction of New Products
and Product Enhancements. We continually pursue organic
growth through the development of new products and enhancements to
existing products. We seek to develop new technologies which
improve the durability, performance and usability of existing
products. In addition to our internal research and development
efforts, we receive new ideas for products and technologies, particularly
in procedure-specific areas, from surgeons, inventors and other healthcare
professionals.
|
|
|
·
|
Pursue Strategic
Acquisitions. We pursue strategic acquisitions in
existing and new growth markets to achieve increased operating
efficiencies, geographic diversification and market
penetration. Targeted companies have historically included
those with proven technologies and established brand names which provide
potential sales, marketing and manufacturing
synergies.
|
-5-
|
|
·
|
Realize Manufacturing and
Operating Efficiencies. We continually review our
production systems for opportunities to reduce operating costs,
consolidate product lines or identical process flows, reduce inventory
requirements and optimize existing processes. Our vertically
integrated manufacturing facilities allow for further opportunities to
reduce overhead, increase operating efficiencies and capacity
utilization.
|
|
|
|
|
·
|
Geographic
Diversification. We believe that significant growth
opportunities exist for our surgical products outside the United
States. Principal foreign markets for our products include
Europe, Latin America and Asia/Pacific Rim. Critical elements
of our future sales growth in these markets include leveraging our
existing relationships with foreign surgeons, hospitals, third-party
payers and foreign distributors, maintaining an appropriate presence in
emerging market countries and continually evaluating our
routes-to-market.
|
|
|
·
|
Active Participation In The
Medical Community. We believe that excellent working
relationships with physicians and others in the medical industry enable us
to gain an understanding of new therapeutic and diagnostic alternatives,
trends and emerging opportunities. Active participation allows
us to quickly respond to the changing needs of physicians and
patients.
|
Products
–
The
following table sets forth the percentage of net sales for each of our product
lines during each of the three years ended December 31:
|
Year Ended December 31,
|
||||||||||||
|
2007
|
2008
|
2009
|
||||||||||
|
Arthroscopy
|
38 | % | 38 | % | 39 | % | ||||||
|
Powered
Surgical Instruments
|
21 | 21 | 21 | |||||||||
|
Electrosurgery
|
13 | 14 | 14 | |||||||||
|
Patient
Care
|
11 | 11 | 10 | |||||||||
|
Endosurgery
|
9 | 9 | 9 | |||||||||
|
Endoscopic
Technologies
|
8 | 7 | 7 | |||||||||
|
Total
|
100 | % | 100 | % | 100 | % | ||||||
|
Net
Sales (in thousands)
|
$ | 694,288 | $ | 742,183 | $ | 694,739 | ||||||
-6-
Arthroscopy
We offer
a comprehensive range of devices and products for use in arthroscopic
surgery. Arthroscopy refers to diagnostic and therapeutic surgical
procedures performed on joints with the use of minimally invasive arthroscopes
and related instruments. Minimally invasive arthroscopic procedures
enable surgical repairs to be completed with less trauma to the patient,
resulting in shorter recovery times and cost savings. Arthroscopic
procedures are performed on the knee and shoulder, and hip as well as smaller
joints, such as the hand, wrist and ankle.
Our
arthroscopy products include powered resection instruments, arthroscopes,
reconstructive systems, tissue repair sets, metal and bioabsorbable implants and
related disposable products and fluid management systems. We also
offer a line of video Endoscopy products suitable for use in multi-specialty
clinical environments beyond orthopedic arthroscopy, including laparoscopy, ENT,
gynecology and urology as well as integrated operating room systems and
equipment. It is our standard practice to transfer some of these
products, such as shaver consoles and pumps, to certain customers at no
charge. These capital “placements” allow for and accommodate the use
of a variety of disposable products, such as shaver blades, burs and pump
tubing. We have benefited from the introduction of new arthroscopic
products and technologies, such as bioabsorbable screws, ablators, “push-in” and
“screw-in” suture anchors, and resection shavers.
A
significant portion of arthroscopic procedures are performed to repair injuries
which have occurred in the articulating joint areas of the body. Many
of these injuries are the result of sports related events or similar
traumas. For this reason, arthroscopy is often referred to as “sports
medicine.”
|
Arthroscopy
|
||
|
Product
|
Description
|
Brand
Name
|
|
Ablators
and Shaver Ablators
|
Electrosurgical
ablators and resection ablators to resect and remove soft tissue and bone;
used in knee, shoulder and small joint surgery.
|
Lightwave™
Trident®
|
|
Knee
Reconstructive Systems
|
Products
used in cruciate reconstructive surgery; includes instrumentation, screws,
pins and ligament harvesting and preparation devices.
|
Paramax®
Pinn-ACL®
Grafix®
Matryx™
Bioscrew®
EndoPearl®
XtraLok®
|
|
Soft
Tissue Repair Systems
|
Instrument
systems designed to attach specific torn or damaged soft tissue to bone or
other soft tissue in the knee, shoulder and wrist; includes
instrumentation, guides, hooks and suture devices.
|
Spectrum®
Inteq®
Shuttle
Relay™
Blitz®
Hi-Fi™
Suture
Saver™
Spectrum
MVP
Super
Shuttle
|
|
Fluid
Management Systems
|
Disposable
tubing sets, disposable and reusable inflow devices, pumps and
suction/waste management systems for use in arthroscopic and general
surgeries.
|
Apex®
Quick-Flow®
Quick-Connect®
87K™
10K®
24K™
|
-7-
|
Arthroscopy
|
||
|
Product
|
Description
|
Brand
Name
|
|
Video
|
Surgical
video systems for endoscopic procedures; includes enhanced definition (ED)
and high definition (HD), autoclavable three-chip camera heads as well as
camera consoles, endoscopes, light sources, monitors, Image capture
devices and printers.
|
SmartOR
Quicklatch®
scopes
Shock
Flex™ prism mount
TrueHD™
IM4000 HD camera system
|
|
Implants
|
Products
including bioabsorbable and metal screws, pins and suture anchors for
attaching soft tissue to bone in the knee, shoulder and wrist as well as
miniscal repair.
|
BioScrew™
Bio-Anchor®
BioTwist®
UltraFix®
Revo®
Super
Revo®
Bionx™
Meniscus
Arrow™
Smart
Nail®
Smart
Pin®
Smart
Screw®
Smart
Tack®
The
Wedge™
Biostinger®
Hornet®
ThRevo™
Duet™
Impact™
Bio-Mini
Revo™
XO
Button™
Paladin
Presto
SRS
PopLok™
CrossFT™
|
|
Integrated
operating room systems and equipment
|
Centralized
operating room management and control systems, service arms and service
managers.
|
CONMED®
Nurse’s
Assistant®
SmartOR
|
|
Arthroscopic
Shaver Systems
|
Electrically
powered shaver handpieces that accommodate a large variety of shaver blade
disposables specific to clinical specialty and technological
precision.
|
Advantage®
Turbo™
Gator®
Great
White®
Mako™
Merlin®
Sterling®
Ultracut®
Zen™
ReAct™
|
-8-
|
Arthroscopy
|
||
|
Product
|
Description
|
Brand
Name
|
|
Other
Instruments and Accessories
|
Forceps,
graspers, punches, probes, sterilization cases and other general
instruments for arthroscopic procedures.
|
Shutt®
Concept®
TractionTower®
Clearflex™
SE™
Dry
Doc®
Cannulae
Hip
Arthroscopy Kit
|
Powered
Surgical Instruments
Electric,
battery or pneumatic powered surgical instruments are used to perform
orthopedic, arthroscopic and other surgical procedures where cutting, drilling
or reaming of bone is required. Each instrument consists of one or
more handpieces and related accessories as well as disposable and limited
reusable items (e.g., burs, saw blades, drills and reamers). Powered
instruments are categorized as either small bone, large bone or specialty
powered instruments. Specialty powered instruments are utilized in
procedures such as spinal surgery, neurosurgery, ENT, oral/maxillofacial
surgery, and cardiothoracic surgery.
Our line
of powered instruments is sold principally under the Hall®
Surgical brand name, for use in large and small bone orthopedic, arthroscopic,
oral/maxillofacial, podiatric, plastic, ENT, neurological, spinal and
cardiothoracic surgeries. Large bone, neurosurgical, spinal and
cardiothoracic powered instruments are sold primarily to hospitals while small
bone arthroscopic, otolaryngological and oral/maxillofacial powered instruments
are sold to hospitals, outpatient facilities and physicians’
offices. Our CONMED Linvatec subsidiary has devoted significant
resources in the development of new technologies for battery, electric and
pneumatic powertool platforms which may be easily adapted and modified for new
procedures.
Our
powered instruments product line also includes the MPower™ Battery
System. This full function orthopedic power system is specifically designed to
meet the requirements of most orthopedic applications. The modularity
and versatility of the MPower™ system allows a facility to purchase a single
power system to perform total joint arthroplasty, trauma, arthroscopy, and small
bone procedures. The system also provides a multitude of battery
technologies to meet the varying needs of hospitals worldwide.
|
Powered
Surgical Instruments
|
||
|
Product
|
Description
|
Brand
Name
|
|
Large
Bone
|
Powered
saws, drills and related disposable accessories for use primarily in total
knee and hip joint replacements and trauma surgical
procedures.
|
Hall®
Surgical
PowerPro®
PowerProMax™
Advantage®
MPower™
|
-9-
|
Powered
Surgical Instruments
|
||
|
Product
|
Description
|
Brand
Name
|
|
Small
Bone
|
Powered
saws, drills and related disposable accessories for hand, foot, and other
small bone related surgical procedures.
|
Hall®
Surgical
MicroPower™
Advantage® Micro
100™
MPower™
|
|
Otolaryngology
Neurosurgery Spine Oral/maxillofacial
|
Specialty
powered saws, drills and related disposable accessories for use in
neurosurgery, spine, otolaryngologic and oral/maxillofacial
procedures.
|
Hall®
Surgical
E9000®
UltraPower®
Hall
Osteon®
Hall
Ototome®
Coolflex®
Surgairtome
Two®
Smart
Guard®
|
|
Cardiothoracic
|
Powered
sternum saws and related disposable accessories for use by cardiothoracic
surgeons.
|
Hall®
Surgical
MicroPower®
Micro
100™
Power
Pro®
PowerProMax™
MPower™
|
Electrosurgery
The use
of electrosurgical units and associated surgical tools is commonplace in the
hospital surgical suite, surgery centers, clinics and physician
offices. Electrosurgery is routinely used to cut and coagulate tissue
and small vessels in open and laparoscopic procedures using energy produced
through radio frequency (RF) technology. An electrosurgical system consists of
three main components: an electrosurgical generator or ESU, an active
electrode in the form of an electrosurgical pencil or instrument that is used to
apply concentrated energy to the target tissues, and a dispersive electrode that
grounds the patient and provides feedback to the ESU. Electrosurgery can be used
in almost all surgical procedures including specialties such as general,
gynecology, orthopedics, cardiology, thoracics, urology, neurology, and
dermatology.
Also
included in our portfolio of energy-based products is the Argon Beam Coagulation
(ABC®)
technology. ABC®
technology combines the use of argon gas and electrosurgical energy to allow the
surgeon to produce a surface coagulation which results in less tissue
damage. The electrical energy travels through an ionized column of
gas so that the energy is applied to bleeding tissue in a non-contact
mode. Clinicians have reported notable benefits of ABC®
technology in certain procedures such as liver resection, cancer tissue
resection, heart bypass and trauma. In addition, certain handpieces allow
ABC® to be
used to dissect tissue through direct contact.
Surgical
smoke evacuation products are an emerging segment within the electrosurgical
market. These systems consist of a smoke evacuation unit which suctions surgical
smoke from the operative site and filters the smoke plume. It is connected to
the ESU and uses specific electrosurgical smoke evacuation
pencils. The use of electrosurgical pencils and lasers during a
procedure may produce smoke and may affect the surgeon’s ability to see the
operative site clearly in both open and laparoscopic
procedures.
-10-
|
Electrosurgery
|
||
|
Product
|
Description
|
Brand
Name
|
|
Pencils
|
Disposable
and reusable surgical instruments designed to deliver high-frequency
electrical energy to cut and/or coagulate tissue.
|
Hand-Trol®
GoldLine™
|
|
Ground
Pads
|
Disposable
ground pads which disperse electrosurgical energy and safely return it to
the generator; available in adult, pediatric and infant
sizes.
|
MacroLyte®
ThermoGard®
SureFit™
|
|
Active
Electrodes
|
Surgical
accessory electrodes that are inserted into electrosurgical pencils. These
electrodes are available with and without the proprietary UltraClean™
coating which provides an easy to clean electrode surface during
surgery.
|
UltraClean™
|
|
Generators
|
Monopolar
and bipolar clinical energy sources for surgical procedures performed in a
hospital, physicians’ office or clinical setting.
|
System
5000™
System
2450™
Hyfrecator®
2000
|
|
Argon
Beam
Coagulation
Systems
|
Specialized
electrosurgical generators, disposable hand pieces and ground pads for
Argon Enhanced non-contact coagulation of tissues.
|
ABC®
System
7550
ABC
Flex®
Bend-A-Beam®
ABC®
Dissecting Electrodes™
|
|
Smoke
Evacuation System
|
Dedicated
unit and integrated hand pieces designed for the removal of surgical smoke
in both open and laparoscopic procedures where electrosurgery is
utilized.
|
GoldVac™
ClearVac®
AER
DEFENSE™
|
Patient
Care
Our
patient care product line offering includes a line of vital signs and cardiac
monitoring products including pulse oximetry equipment & sensors, ECG
electrodes and cables, cardiac defibrillation & pacing pads and blood
pressure cuffs. We also offer a complete line of suction instruments
& tubing for use in the operating room, as well as a line of IV products for
use in the critical care areas of the hospital.
-11-
|
Patient
Care
|
||
|
Product
|
Description
|
Brand
Name
|
|
ECG
Monitoring
|
Line
of disposable electrodes, monitoring cables, lead wire products and
accessories designed to transmit ECG signals from the heart to an ECG
monitor or recorder.
|
CONMED®
Ultratrace®
Cleartrace®
|
|
Surgical
Suction Instruments and Tubing
|
Disposable
surgical suction instruments and connecting tubing, including Yankauer,
Poole, Frazier and Sigmoidoscopic instrumentation, for use by physicians
in the majority of open surgical procedures.
|
CONMED®
|
|
Intravenous
Therapy
|
Disposable
IV drip rate gravity controller and disposable catheter stabilization
dressing designed to hold and secure an IV needle or catheter for use in
IV therapy.
|
VENI-GARD®
MasterFlow®
Stat
2®
|
|
Defibrillator
Pads and Accessories
|
Stimulation
electrodes for use in emergency cardiac response and conduction studies of
the heart.
|
PadPro®
R2®
|
|
Pulse
Oximetry
|
Used
in critical care to continuously monitor a patient’s arterial blood oxygen
saturation and pulse rate.
|
Dolphin®
Pro2®
|
|
Non-invasive
blood pressure cuff
|
Used
in critical care to measure blood pressure.
|
SoftCheck®
UltraCheck®
(registered trademarks of CAS Medical Systems, Inc.)
|
Endosurgery
Endosurgery
(also referred to as minimally invasive surgery or laparoscopic surgery) is
surgery performed without a major incision. This surgical specialty results in
less trauma for the patient and produces important cost savings as a result of
shorter recovery times and reduced hospitalization. Endosurgery is
performed on organs in the abdominal cavity such as the gallbladder, appendix
and female reproductive organs. During such procedures, devices
called “trocars” are used to puncture the abdominal wall and are then removed,
leaving in place a trocar cannula. The trocar cannula provides access
into the abdomen for camera systems and surgical instruments. Some of
our endosurgical instruments are “reposable”, meaning that the instrument has a
disposable and a reusable component.
-12-
Our
Endosurgical products include the Reflex® and
PermaClip™ clip appliers for vessel and duct ligation, Universal S/ITM
(suction/irrigation) and Universal Plus™ laparoscopic instruments, specialized
suction/irrigation electrosurgical instrument systems for use in laparoscopic
surgery and the OnePort® which
incorporates a blunt-tipped version of a trocar. The OnePort®
dilates access through the body wall rather than cutting with the sharp, pointed
tips of conventional trocars thus resulting in smaller wounds, and less
bleeding. We also offer cutting trocars, suction/irrigation
accessories, laparoscopic scissors, dissectors and graspers, active electrodes,
insufflation needles and linear cutters and staplers for use in laparoscopic
surgery. Our disposable skin staplers are used to close large skin
incisions with surgical staples, thus eliminating the time consuming suturing
process. ConMed EndoSurgery also offers a unique and premium uterine manipulator
called VCARE® for
use in increasing the efficiency of laparoscopic hysterectomies.
|
Endosurgery
|
||
|
Product
|
Description
|
Brand
Name
|
|
Trocars
|
Disposable
and reposable devices used to puncture the abdominal wall providing access
to the abdominal cavity for camera systems and
instruments.
|
OnePort®
TroGard
Finesse®
Reflex®
Detach
a Port®
CORE
Dynamics®
|
|
Multi-functional
Electrosurgery and Suction/Irrigation instruments
|
Instruments
for cutting and coagulating tissue by delivering high-frequency
current. Instruments which deliver irrigating fluid to the
tissue and remove blood and fluids from the internal operating
field.
|
Universal™
Universal
Plus™
FloVac®
|
|
Clip
Appliers
|
Disposable
and reposable devices for ligating blood vessels and ducts by placing a
titanium clip on the vessel.
|
Reflex®
PermaClip™
|
|
Laparoscopic
Instruments
|
Scissors,
graspers
|
DetachaTip®
|
|
Skin
Staplers
|
Disposable
devices which place surgical staples for closing a surgical
incision.
|
Reflex®
|
|
Microlaparoscopy
scopes and instruments
|
Small
laparoscopes and instruments for performing surgery through very small
incisions.
|
MicroLap®
|
|
Specialty
Laparoscopic Devices
|
Specialized
elevator, retractor for laparoscopic hysterectomy
|
VCARE®
|
-13-
Endoscopic
Technologies
Gastrointestinal
(GI) endoscopy is the examination of the digestive tract with a flexible,
lighted instrument referred to as an "endoscope". This instrument enables the
physician to directly visualize the esophagus, stomach, portions of the small
intestine, and colon. This technology allows the physician to more accurately
diagnose and treat diseases of the digestive system. Through these scopes a
physician may take biopsies, dilate narrowed areas referred to as strictures,
and remove polyps which are growths in the digestive tract. Some of the more
common conditions which may be diagnosed and treated using this procedure
include ulcers, Crohn's disease, ulcerative colitis and gallbladder
disease.
We offer
a comprehensive line of minimally invasive diagnostic and therapeutic products
used in conjunction with procedures which require flexible
endoscopy. Our principal customers include GI endoscopists,
pulmonologists, and nurses who perform both diagnostic and therapeutic
endoscopic procedures in hospitals and outpatient clinics.
Our
primary focus is to identify, develop, acquire, manufacture and market
differentiated medical devices, which improve outcomes in the diagnosis and
treatment of gastrointestinal and pulmonary disorders. Our diagnostic
and therapeutic product offerings for GI and pulmonology include forceps,
accessories, bronchoscopy devices, dilatation, hemostasis, biliary devices, and
polypectomy.
|
Endoscopic
Technologies
|
||
|
Product
|
Description
|
Brand
Name
|
|
Pulmonary
|
Transbronchial
Cytology and Histology Aspiration Needles, Disposable Biopsy Forceps,
Cytology Brushes and Bronchoscope Cleaning Brushes
|
Wang®
Blue
Bullet®
Precisor®
Precisor
BRONCHO®
Precisor®
EXL™
GARG™
|
|
Biopsy
|
Disposable
biopsy forceps, Percutaneous Liver Biopsy instrument, Disposable Cytology
Brushes
|
Precisor®
OptiBite®
Monopty®
|
|
Polypectomy
|
Disposable
Polypectomy Snares, Retrieval Nets, Polyp Traps
|
Singular®
Optimizer®
Polyptrap™ Nakao
Spidernet™
Orbit-Snare®
|
-14-
|
Endoscopic
Technologies
|
||
|
Product
|
Description
|
Brand
Name
|
|
Biliary
|
Triple
Lumen Stone Removal Balloons, Advanced Cannulation Triple Lumen
Papillotomes, High Performance Biliary Guidewires, Cannulas, Biliary
Balloon Dilators, Plastic and Metal Endoscopic Biliary
Stents
|
Apollo®
Apollo3®
Apollo3AC®
FXWire®
XWire®
Director™
Duraglide™
Duraglide
3™
Flexxus®
ProForma®
HYDRODUCT®
Viabil®
|
|
Dilation
|
Multi-Stage
Balloon Dilators, American Dilation System
|
Eliminator®
|
|
Hemostasis
|
Endoscopic
Injection Needles, Endoscope Ligator, Multiple Band Ligator, Sclerotherapy
Needle, Bipolar Hemostasis Probes
|
SureShot®
Auto
Band™
Stiegmann-Goff™
Bandito™
RapidFire®
Flexitip™
BICAP®
BICAP
SUPERCONDUCTOR™
Click-Tip™
Beamer®
Beamer
Mate®
Beamer
Plus™
|
|
Endoscopic
Ultrasound
|
Fine
Needle Aspiration
|
VizeonTM
|
|
Enteral
Feeding
|
Initial
Percutaneous Endoscopic Gastrostomy (PEG) systems, Replacement Tri-Funnel
G-Tube
|
Entake®
|
|
Accessories
|
Disposable
Bite Blocks, Cleaning Brushes
|
Scope
Saver™
Channel
Master™
Blue
Bullet®
Whistle®
|
Marketing
A
significant portion of our products are distributed domestically directly to
more than 6,000 hospitals and other healthcare institutions as well as through
medical specialty distributors and surgeons. We are not dependent on
any single customer and no single customer accounted for more than 10% of our
net sales in 2007, 2008 and 2009.
-15-
A
significant portion of our U.S. sales are to customers affiliated with GPOs,
IHNs and other large national or regional accounts, as well as to the Veterans
Administration and other hospitals operated by the Federal
government. For hospital inventory management purposes, some of our
customers prefer to purchase our products through independent third-party
medical product distributors.
In order
to provide a high level of expertise to the medical specialties we serve, our
domestic sales force consists of the following:
|
|
·
|
60
employee sales representatives and 200 sales representatives working
for independent sales agent groups selling arthroscopy and powered
surgical instrument products;
|
|
|
·
|
60 employee
sales representatives selling electrosurgery
products;
|
|
|
·
|
40 employee
sales representatives selling endosurgery
products;
|
|
|
·
|
50 employee
sales representatives selling patient care
products;
|
|
|
·
|
40
employee sales representatives selling endoscopic technologies
products.
|
Each
employee sales representative is assigned a defined geographic area and
compensated on a commission basis or through a combination of salary and
commission. The sales force is supervised and supported by either
area directors or district managers. Sales agent groups are used in
the United States to sell our arthroscopy, multi-specialty medical video systems
and powered surgical instrument products. These sales agent groups
are paid a commission for sales made to customers while home office sales and
marketing management provide the overall direction for sales of our
products.
Our
Corporate sales organization is responsible for interacting with large regional
and national accounts (eg. GPOs, IHNs, etc.). We have contracts with
many such organizations and believe that, with certain exceptions, the loss of
any individual group purchasing contract will not adversely impact our
business. In addition, all of our sales professionals are required to
work closely with distributors where applicable and maintain close relationships
with end-users.
Each of
our dedicated sales professionals is highly knowledgeable in the applications
and procedures for the products they sell. Our sales
professionals provide surgeons and medical personnel with information
relating to the technical features and benefits of our products.
Maintaining
and expanding our international presence is an important component of our
long-term growth plan. Our products are sold in over 100 foreign countries.
International sales efforts are coordinated through local country dealers or
through direct in country sales. We distribute our products through sales
subsidiaries and branches with offices located in Australia, Austria, Belgium,
Canada, France, Germany, Korea, the Netherlands, Spain, Italy, Poland and the
United Kingdom. In these countries, our sales are denominated in the
local currency and amount to approximately 30% of our total net
sales. In the remaining countries where our products are sold through
independent distributors, sales are denominated in United States
dollars.
We sell
to a diversified base of customers around the world and, therefore, believe
there is no material concentration of credit risk.
-16-
Manufacturing
We
manufacture substantially all of our products and assemble them from components,
many of which we produce. Our strategy has historically been to
vertically integrate our manufacturing facilities in order to develop a
competitive advantage. This integration provides us with cost
efficient and flexible manufacturing operations which permit us to allocate
capital more efficiently. Additionally, we attempt to exploit
commercial synergies between operations, such as the procurement of common raw
materials and components used in production.
Raw
material costs constitute a substantial portion of our cost of
production. We use numerous raw materials and components in the
design, development and manufacturing of our products. Substantially
all of our raw materials and select components used in the manufacturing process
are procured from external suppliers. We work closely with multiple
suppliers to ensure continuity of supply while maintaining high quality and
reliability. None of our critical raw materials and components are
procured from single sources for reasons of quality assurance, sole source
availability, cost effectiveness or constraints resulting from regulatory
requirements. The loss of any existing supplier or supplier contract
would not have a material adverse effect on our financial and operational
performance. To date, we have not experienced any protracted
interruption in the availability of raw materials and components necessary to
fulfill production schedules.
All of
our products are classified as medical devices subject to regulation by numerous
agencies and legislative bodies, including the United States Food and Drug
Administration (“FDA”) and comparable foreign counter parts. The
FDA’s Quality System Regulations set forth standards for our product design and
manufacturing processes, require the maintenance of certain records and provide
for on-site inspections of our facilities by the FDA. In many of the
foreign countries in which we manufacture and distribute our products we are
subject to regulatory requirements affecting, among other things, product
performance standards, packaging requirements, labeling requirements and import
laws. Regulatory requirements affecting the Company vary from country
to country. The timeframes and costs for regulatory submission and
approval from foreign agencies or legislative bodies may vary from those
required by the FDA. Certain requirements for approval from foreign
agencies or legislative bodies may also differ from those of the
FDA.
We
believe that our production and inventory management practices are
characteristic of those in the medical device industry. Substantially
all of our products are stocked in inventory and are not manufactured to order
or to individual customer specifications. We schedule production and
maintain adequate levels of safety stock based on a number of factors including,
experience, knowledge of customer ordering patterns, demand, manufacturing lead
times and optimal quantities required to maintain the highest possible service
levels. Customer orders are generally processed for immediate
shipment and backlog of firm orders is therefore not considered material to an
understanding of our business.
Research
and Development
New and improved products play a
critical role in our continued sales growth. Internal research and
development efforts focus on the development of new products and product
technological and design improvements aimed at complementing and expanding
existing product lines. We continually seek to leverage new
technologies which improve the durability, performance and usability of existing
products. In addition, we maintain close working relationships with
surgeons, inventors and operating room personnel who often make new product and
technology disclosures, principally in procedure-specific areas. For
clinical and commercially promising disclosures, we seek to obtain rights to
these ideas through negotiated agreements. Such agreements typically
compensate the originator through, payments based upon a percentage of licensed
product net sales. Annual royalty expense approximated $4.4 million,
$4.4 million and $3.5 million in 2007, 2008 and 2009, respectively.
-17-
Amounts expended for Company sponsored
research and development was approximately $30.4 million, $33.1 million and
$31.8 million during 2007, 2008, and 2009, respectively.
We have rights to intellectual
property, including United States patents and foreign equivalent patents which
cover a wide range of our products. We own a majority of these
patents and have exclusive and non-exclusive licensing rights to the
remainder. In addition, certain of these patents have currently been
licensed to third parties on a non-exclusive basis. We believe that
the development of new products and technological and design improvements to
existing products will continue to be of primary importance in maintaining our
competitive position.
Competition
The
market for our products is highly competitive and our customers generally have
numerous alternatives of supply. Many of our competitors offer a
range of products in areas other than those in which we compete, which may make
such competitors more attractive to surgeons, hospitals, group purchasing
organizations and others. In addition, several of our competitors are
large, technically-competent firms with substantial assets.
The
following chart identifies our principal competitors in each of our key business
areas:
|
Business Area
|
Competitor
|
|
|
Arthroscopy
|
Smith
& Nephew, plc
Arthrex,
Inc.
Stryker
Corporation
ArthroCare
Corporation
Johnson
& Johnson: Mitek Worldwide
|
|
|
Powered
Surgical Instruments
|
Stryker
Corporation
Medtronic,
Inc. Midas Rex and Xomed divisions
The
Anspach Effort, Inc.
MicroAire
Surgical Instruments, LLC
|
|
|
Electrosurgery
|
Covidien
Ltd.; Valleylab
3M
Company
ERBE
Elektromedizin GmbH
|
|
|
Patient
Care
|
Covidien
Ltd.: Kendall
3M
Company
|
|
|
Endosurgery
|
Johnson
& Johnson: Ethicon Endo-Surgery, Inc.
Covidien
Ltd.; U.S.Surgical
|
-18-
|
Endoscopic
Technologies
|
Boston
Scientific Corporation – Endoscopy
Wilson-Cook
Medical, Inc.
Olympus
America, Inc.
U.S.
Endoscopy
|
Factors
which affect our competitive posture include product design, customer
acceptance, service and delivery capabilities, pricing and product
development/improvement. In the future, other alternatives such as
new medical procedures or pharmaceuticals may become interchangeable
alternatives to our products.
Government
Regulation and Quality Systems
Substantially
all of our products are classified as class II medical devices subject to
regulation by numerous agencies and legislative bodies, including the FDA and
comparable foreign counterparts. Authorization to commercially
distribute our products in the U.S. is granted by the FDA under a procedure
referred to as 510(k) premarket notification. This process requires
us to demonstrate that our new products or substantially modified products are
substantially equivalent to a legally marketed device which was on the market
prior to May 28, 1976 or is currently on the U.S. market and does not require
premarket approval. We must continually meet certain FDA standards to
market our products in the United States. (Our products are classified as Class
I, IIa, IIb and III in the European Union (EU) and subject to regulation by our
European Notified Body). Our FDA clearance is subject to
continual review and future discovery of previously unknown events could result
in restrictions being placed on a product’s marketing or notification from the
FDA to halt the distribution of certain medical devices.
Medical
device regulations continue to evolve world-wide. Products marketed
in the EU and other countries require preparation of technical files and design
dossiers which demonstrate compliance with applicable international regulations.
Products marketed in Australia are subject to a new classification system and
have been re-registered under the updated Therapuetics Goods Act in
2007. Products marketed in Japan must be re-registered under the
Ministry of Health’s recently updated Pharmacuetical Affairs Law (PAL). As
government regulations continue to change, there is a risk that the distribution
of some of our products may be interrupted or discontinued if they do not meet
the new requirements.
Our
operations are supported by quality assurance/regulatory compliance personnel
tasked with monitoring compliance to design controls, process controls and the
other relevant government regulations for all of our design, manufacturing,
distribution and servicing activities. We and
substantially all of our products are subject to the provisions of the Federal
Food, Drug and Cosmetic Act of 1938, as amended by the Medical Device Amendments
of 1976, Safe Medical Device Act of 1990, Medical Device Modernization Act of
1997, Medical User Fee and Modernization Act of 2002 and similar international
regulations, such as the European Union Medical Device Directives.
As a
manufacturer of medical devices, the FDA’s Quality System Regulations as
specified in Title 21, Code of Federal Regulation (CFR) part 820, set forth
standards for our product design and manufacturing processes, require the
maintenance of certain records, provide for on-site inspection of our facilities
and continuing review by the FDA. Many of our products are also
subject to industry-defined standards. Such industry-defined product
standards are generally formulated by committees of the Association for the
Advancement of Medical Instrumentation (AAMI), International Electrotechnical
Commission (IEC) and the International Organization for Standardization
(ISO). We believe that our products and processes presently meet
applicable standards in all material respects.
-19-
As noted
above, our facilities are subject to periodic inspection by the FDA for, among
other things, conformance to Quality System Regulation and Current Good
Manufacturing Practice (“CGMP”) requirements. Following an inspection, the FDA
typically provides its observations, if any, in the form of a Form 483 (Notice
of Inspectional Observations) with specific observations concerning potential
violation of regulations. Although we respond to all Form 483
observations and correct deficiencies expeditiously, there can be no assurance
that the FDA will not take further action including issuing a warning letter,
seizing product and imposing fines. We market our products in several foreign
countries and therefore are subject to regulations affecting, among other
things, product standards, packaging requirements, labeling requirements and
import laws. Many of the regulations applicable to our devices and
products in these countries are similar to those of the FDA. The
member countries of the European Union have adopted the European Medical Device
Directives, which create a single set of medical device regulations for all
member countries. These regulations require companies that wish to
manufacture and distribute medical devices in the European Union maintain
quality system certification through European Union recognized Notified
Bodies. These Notified Bodies authorize the use of the CE Mark
allowing free movement of our products throughout the member
countries. Requirements pertaining to our products vary widely from
country to country, ranging from simple product registrations to detailed
submissions such as those required by the FDA. We believe that our
products currently meet applicable standards for the countries in which they are
marketed.
Our
products may become subject to recall or market withdrawal regulations and we
have made product recalls in the past. No product recall has had a
material effect on our financial condition, however there can be no assurance
that regulatory issues will not have a material adverse effect in the
future.
Any
change in existing federal, state, foreign laws or regulations, or in the
interpretation or enforcement thereof, or the promulgation or any additional
laws or regulations may result in a material adverse effect on our financial
condition or results of operations.
Employees
As of
December 31, 2009, we had approximately 3,500 full-time employees,
including approximately 2,000 in operations, 135 in research and development,
and the remaining in sales, marketing and related administrative
support. We believe that we have good relations with our employees
and have never experienced a strike or similar work stoppage. None of
our employees are represented by a labor union.
Item 1A. Risk Factors
An
investment in our securities, including our common stock, involves a high degree
of risk. Investors should carefully consider the specific factors set
forth below as well as the other information included or incorporated by
reference in this Form 10-K. See “Forward Looking Statements”.
-20-
Our
financial performance is dependent on conditions in the health care industry and
the broader economy.
The
results of our business are directly tied to the economic conditions in the
health care industry and the broader economy as a whole. Given the
difficult economic environment we experienced in 2008 and much of 2009 including
extreme volatility in the financial markets and foreign currency exchange rates
and depressed economic conditions in both domestic and international markets, we
continue to face significant business challenges. Approximately 25%
of our revenues are derived from the sale of capital products. The
sales of such products are negatively impacted if hospitals and other healthcare
providers are unable to secure the financing necessary to purchase these
products or otherwise defer purchases. Our revenue declined in 2009
as compared to 2008 primarily as a result of the difficult economic
environment. While we are cautiously optimistic that the overall
global economic environment is improving and are therefore forecasting a return
to revenue growth in 2010, there can be no assurance that the improvement in the
economic environment will be sustained or that revenue growth will be
achieved.
Our significant
international operations subject us to foreign currency fluctuations and other
risks associated with operating in foreign countries.
A
significant portion of our revenues are derived from foreign
sales. Approximately 45% of our total 2009 consolidated net sales
were to customers outside the United States. We have sales
subsidiaries in a significant number of countries in Europe as well as
Australia, Canada and Korea. In those countries in which we have a
direct presence, our sales are denominated in the local currency and those sales
denominated in local currency amounted to approximately 30% of our total
net sales in 2009. The remaining 15% of sales to customers outside
the United States was on an export basis and transacted in United States
dollars.
Because a
significant portion of our operations consist of sales activities in foreign
jurisdictions, our financial results may be affected by factors such as changes
in foreign currency exchange rates or weak economic conditions in the markets in
which we distribute products. While we have implemented a hedging
strategy, our revenues may be unfavorably impacted from foreign currency
translation if the United States dollar strengthens as compared with currencies
such as the Euro. Our international presence exposes us to certain
other inherent risks, including:
|
|
·
|
imposition
of limitations on conversions of foreign currencies into dollars or
remittance of dividends and other payments by international
subsidiaries;
|
|
|
·
|
imposition
or increase of withholding and other taxes on remittances and other
payments by international
subsidiaries;
|
|
|
·
|
trade
barriers;
|
|
|
·
|
political
risks, including political
instability;
|
|
|
·
|
reliance
on third parties to distribute our
products;
|
|
|
·
|
hyperinflation
in certain foreign countries; and
|
|
|
·
|
imposition
or increase of investment and other restrictions by foreign
governments.
|
We cannot
assure you that such risks will not have a material adverse effect on our
business and results of operations.
-21-
Our financial
performance is subject to the risks inherent in our acquisition strategy,
including the effects of increased borrowing and integration of newly acquired
businesses or product lines.
A key
element of our business strategy has been to expand through acquisitions and we
may seek to pursue additional acquisitions in the future. Our success
is dependent in part upon our ability to integrate acquired companies or product
lines into our existing operations. We may not have sufficient
management and other resources to accomplish the integration of our past and
future acquisitions and implementing our acquisition strategy may strain our
relationship with customers, suppliers, distributors, manufacturing personnel or
others. There can be no assurance that we will be able to identify
and make acquisitions on acceptable terms or that we will be able to obtain
financing for such acquisitions on acceptable terms. In addition,
while we are generally entitled to customary indemnification from sellers of
businesses for any difficulties that may have arisen prior to our acquisition of
each business, acquisitions may involve exposure to unknown liabilities and the
amount and time for claiming under these indemnification provisions is often
limited. As a result, our financial performance is now and will
continue to be subject to various risks associated with the acquisition of
businesses, including the financial effects associated with any increased
borrowing required to fund such acquisitions or with the integration of such
businesses.
Failure to comply
with regulatory requirements may result in recalls, fines or materially adverse
implications.
Substantially
all of our products are classified as class II medical devices subject to
regulation by numerous agencies and legislative bodies, including the FDA and
comparable foreign counterparts. As a manufacturer of medical
devices, our manufacturing processes and facilities are subject to on-site
inspection and continuing review by the FDA for compliance with the Quality
System Regulations. Manufacturing and sales of our products outside
the United States are also subject to foreign regulatory requirements which vary
from country to country. Moreover, we are generally required to
obtain regulatory clearance or approval prior to marketing a new
product. The time required to obtain approvals from foreign countries
may be longer or shorter than that required for FDA approval, and requirements
for foreign approvals may differ from FDA requirements. Failure to
comply with applicable domestic and/or foreign regulatory requirements may
result in:
|
|
·
|
fines
or other enforcement actions;
|
|
|
·
|
recall
or seizure of products;
|
|
|
·
|
total
or partial suspension of
production;
|
|
|
·
|
withdrawal
of existing product approvals or
clearances;
|
|
|
·
|
refusal
to approve or clear new applications or
notices;
|
|
|
·
|
increased
quality control costs; or
|
|
|
·
|
criminal
prosecution.
|
Failure
to comply with Quality System Regulations and applicable foreign regulations
could result in a material adverse effect on our business, financial condition
or results of operations.
If we are
not able to manufacture products in compliance with regulatory standards, we may
decide to cease manufacturing of those products and may be subject to product
recall.
-22-
In
addition to the Quality System Regulations, many of our products are also
subject to industry-defined standards. We may not be able to comply
with these regulations and standards due to deficiencies in component parts or
our manufacturing processes. If we are not able to comply with the
Quality System Regulations or industry-defined standards, we may not be able to
fill customer orders and we may decide to cease production of non-compliant
products. Failure to produce products could affect our profit margins
and could lead to loss of customers.
Our
products are subject to product recall and we have made product recalls in the
past, including $6.0 million in 2009 related to certain of our powered surgical
instrument handpieces. Although no recall has had a material adverse
effect on our business or financial condition, we cannot assure you that
regulatory issues will not have a material adverse effect on our business,
financial condition or results of operation in the future or that product
recalls will not harm our reputation and our customer
relationships.
The highly
competitive market for our products may create adverse pricing
pressures.
The
market for our products is highly competitive and our customers have numerous
alternatives of supply. Many of our competitors offer a range of
products in areas other than those in which we compete, which may make such
competitors more attractive to surgeons, hospitals, group purchasing
organizations and others. In addition, several of our competitors are
large, technically-competent firms with substantial
assets. Competitive pricing pressures or the introduction of new
products by our competitors could have an adverse effect on our
revenues. See “Competition” for a further discussion of these
competitive forces.
Factors
which may influence our customers’ choice of competitor products
include:
|
|
·
|
changes
in surgeon preferences;
|
|
|
·
|
increases
or decreases in health care spending related to medical
devices;
|
|
|
·
|
our
inability to supply products to them, as a result of product recall,
market withdrawal or back-order;
|
|
|
·
|
the
introduction by competitors of new products or new features to existing
products;
|
|
|
·
|
the
introduction by competitors of alternative surgical technology;
and
|
|
|
·
|
advances
in surgical procedures, discoveries or developments in the health care
industry.
|
We
use a variety of raw materials in our businesses, and significant shortages or
price increases could increase our operating costs and adversely impact the
competitive positions of our products.
Our
reliance on certain suppliers and commodity markets to secure raw materials used
in our products exposes us to volatility in the prices and availability of raw
materials. In some instances, we participate in commodity markets that may be
subject to allocations by suppliers. A disruption in deliveries from our
suppliers, price increases, or decreased availability of raw materials or
commodities, could have an adverse effect on our ability to meet our commitments
to customers or increase our operating costs. We believe that our supply
management practices are based on an appropriate balancing of the foreseeable
risks and the costs of alternative practices. Nonetheless, price increases or
the unavailability of some raw materials may have an adverse effect on our
results of operations or financial condition.
-23-
Cost reduction
efforts in the health care industry could put pressures on our prices and
margins.
In recent
years, the health care industry has undergone significant change driven by
various efforts to reduce costs. Such efforts include national health
care reform, trends towards managed care, cuts in Medicare, consolidation of
health care distribution companies and collective purchasing arrangements by
GPOs and IHNs. Demand and prices for our products may be adversely
affected by such trends.
We
may not be able to keep pace with technological change or to successfully
develop new products with wide market acceptance, which could cause us to lose
business to competitors.
The
market for our products is characterized by rapidly changing
technology. Our future financial performance will depend in part on
our ability to develop and manufacture new products on a cost-effective basis,
to introduce them to the market on a timely basis, and to have them accepted by
surgeons.
We may
not be able to keep pace with technology or to develop viable new
products. Factors which may result in delays of new product
introductions or cancellation of our plans to manufacture and market new
products include:
|
|
·
|
capital
constraints;
|
|
|
·
|
research
and development delays;
|
|
|
·
|
delays
in securing regulatory approvals;
or
|
|
|
·
|
changes
in the competitive landscape, including the emergence of alternative
products or solutions which reduce or eliminate the markets for pending
products.
|
Our
new products may fail to achieve expected levels of market
acceptance.
New
product introductions may fail to achieve market acceptance. The
degree of market acceptance for any of our products will depend upon a number of
factors, including:
|
|
·
|
our
ability to develop and introduce new products and product enhancements in
the time frames we currently
estimate;
|
|
|
·
|
our
ability to successfully implement new
technologies;
|
|
|
·
|
the
market’s readiness to accept new
products;
|
|
|
·
|
having
adequate financial and technological resources for future product
development and promotion;
|
|
|
·
|
the
efficacy of our products; and
|
|
|
·
|
the
prices of our products compared to the prices of our competitors’
products.
|
If our
new products do not achieve market acceptance, we may be unable to recover our
investments and may lose business to competitors.
-24-
In
addition, some of the companies with which we now compete or may compete in the
future have or may have more extensive research, marketing and manufacturing
capabilities and significantly greater technical and personnel resources than we
do, and may be better positioned to continue to improve their technology in
order to compete in an evolving industry. See “Competition” for a
further discussion of these competitive forces.
Our senior credit
agreement contains covenants which may limit our flexibility or prevent us from
taking actions.
Our
senior credit agreement contains, and future credit facilities are expected to
contain, certain restrictive covenants which will affect, and in many respects
significantly limit or prohibit, among other things, our ability
to:
|
|
·
|
incur
indebtedness;
|
|
|
·
|
make
investments;
|
|
|
·
|
engage
in transactions with affiliates;
|
|
|
·
|
pay
dividends or make other distributions on, or redeem or repurchase, capital
stock;
|
|
|
·
|
sell
assets; and
|
|
|
·
|
pursue
acquisitions.
|
These
covenants, unless waived, may prevent us from pursuing acquisitions,
significantly limit our operating and financial flexibility and limit our
ability to respond to changes in our business or competitive
activities. Our ability to comply with such provisions may be
affected by events beyond our control. In the event of any default
under our credit agreement, the credit agreement lenders may elect to declare
all amounts borrowed under our credit agreement, together with accrued interest,
to be due and payable. If we were unable to repay such borrowings,
the credit agreement lenders could proceed against collateral securing the
credit agreement, which consists of substantially all of our property and
assets, except for our accounts receivable and related rights which are sold in
connection with the accounts receivable sales agreement. See
“Management’s Discussion and Analysis of Financial Condition and Results of
Operations—Liquidity and Capital Resources” for a discussion of the accounts
receivable sales agreement. Our credit agreement also contains a
material adverse effect clause which may limit our ability to access additional
funding under our credit agreement should a material adverse change in our
business occur.
Our leverage and
debt service requirements may require us to adopt alternative business
strategies.
As of
December 31, 2009, we had $184.4 million of debt outstanding, net of a debt
discount on our 2.50% convertible senior subordinated notes of $8.3 million,
representing 24% of total capitalization and which does not include the $29.0
million of accounts receivable sold under the accounts receivable sales
agreement. See “Management’s Discussion and Analysis of Financial
Condition and Results of Operations—Liquidity and Capital
Resources”.
The
degree to which we are leveraged could have important consequences to investors,
including but not limited to the following:
-25-
|
|
·
|
a
portion of our cash flow from operations must be dedicated to debt service
and will not be available for operations, capital expenditures,
acquisitions, dividends and other
purposes;
|
|
|
·
|
our
ability to obtain additional financing in the future for working capital,
capital expenditures, acquisitions or general corporate purposes may be
limited or impaired, or may be at higher interest
rates;
|
|
|
·
|
we
may be at a competitive disadvantage when compared to competitors that are
less leveraged;
|
|
|
·
|
we
may be hindered in our ability to adjust rapidly to market
conditions;
|
|
|
·
|
our
degree of leverage could make us more vulnerable in the event of a
downturn in general economic conditions or other adverse circumstances
applicable to us; and
|
|
|
·
|
our
interest expense could increase if interest rates in general increase
because a portion of our borrowings, including our borrowings under our
credit agreement, are and will continue to be at variable rates of
interest.
|
We may not be able to generate
sufficient cash to service our indebtedness, which could require us to reduce
our expenditures, sell assets, restructure our indebtedness or seek additional
equity capital.
Our
ability to satisfy our obligations will depend upon our future operating
performance, which will be affected by prevailing economic conditions and
financial, business and other factors, many of which are beyond our
control. We may not have sufficient cash flow available to enable us
to meet our obligations. If we are unable to service our
indebtedness, we will be forced to adopt an alternative strategy that may
include actions such as foregoing acquisitions, reducing or delaying capital
expenditures, selling assets, restructuring or refinancing our indebtedness or
seeking additional equity capital. We cannot assure you that any of
these strategies could be implemented on terms acceptable to us, if at
all. See “Management’s Discussion and Analysis of Financial Condition
and Results of Operations – Liquidity and Capital Resources” for a discussion of
our indebtedness and its implications.
We may be unable
to continue to sell our accounts receivable, which could require us to seek
alternative sources of financing.
Under our
accounts receivable sales agreement, there are certain statistical ratios which
must be maintained relating to the pool of receivables in order for us to
continue selling to the purchaser. These ratios relate to sales
dilution and losses on accounts receivable. If new accounts
receivable arising in the normal course of business do not qualify for sale or
the purchaser otherwise ceases to purchase our receivables, we may require
access to alternate sources of working capital, which may be more expensive or
difficult to obtain. Our accounts receivable sales agreement, as
amended, also requires us to obtain a commitment (the “purchaser commitment”)
from the purchaser to fund the purchase of our accounts
receivable. The purchaser commitment was amended effective October
30, 2009 whereby the purchase commitment was decreased from $50.0 million to
$40.0 million and extended through October 29, 2010 under otherwise
substantially the same terms and conditions. In the event we are
unable to renew our purchaser commitment in the future, we would need to access
alternate sources of working capital which may be more expensive or difficult to
obtain.
-26-
If
we infringe third parties’ patents, or if we lose our patents or they are held
to be invalid, we could become subject to liability and our competitive position
could be harmed.
Much of
the technology used in the markets in which we compete is covered by
patents. We have numerous U.S. patents and corresponding foreign
patents on products expiring at various dates from 2010 through 2028 and have
additional patent applications pending. See “Research and
Development” for a further description of our patents. The loss of
our patents could reduce the value of the related products and any related
competitive advantage. Competitors may also be able to design around
our patents and to compete effectively with our products. In
addition, the cost of enforcing our patents against third parties and defending
our products against patent infringement actions by others could be
substantial. We cannot assure you that:
|
|
·
|
pending
patent applications will result in issued
patents;
|
|
|
·
|
patents
issued to or licensed by us will not be challenged by
competitors;
|
|
|
·
|
our
patents will be found to be valid or sufficiently broad to protect our
technology or provide us with a competitive advantage;
or
|
|
|
·
|
we
will be successful in defending against pending or future patent
infringement claims asserted against our
products.
|
Ordering patterns
of our customers may change resulting in reductions in
sales.
Our
hospital and surgery center customers purchase our products in quantities
sufficient to meet their anticipated demand. Likewise, our health
care distributor customers purchase our products for ultimate resale to health
care providers in quantities sufficient to meet the anticipated requirements of
the distributors’ customers. Should inventories of our products owned
by our hospital, surgery center and distributor customers grow to levels higher
than their requirements, our customers may reduce the ordering of products from
us. This could result in reduced sales during a financial accounting
period.
We can be sued
for producing defective products and our insurance coverage may be insufficient
to cover the nature and amount of any product liability
claims.
The
nature of our products as medical devices and today’s litigious environment
should be regarded as potential risks which could significantly and adversely
affect our financial condition and results of operations. The
insurance we maintain to protect against claims associated with the use of our
products have deductibles and may not adequately cover the amount or nature of
any claim asserted against us. We are also exposed to the risk that
our insurers may become insolvent or that premiums may increase
substantially. See “Legal Proceedings” for a further discussion of
the risk of product liability actions and our insurance coverage.
Damage
to our physical properties as a result of windstorm, earthquake, fire or other
natural or man-made disaster may cause a financial loss and a loss of
customers.
-27-
Although
we maintain insurance coverage for physical damage to our property and the
resultant losses that could occur during a business interruption, we are
required to pay deductibles and our insurance coverage is limited to certain
caps. For example, our deductible for windstorm damage to our Florida
property amounts to 2% of any loss and coverage for earthquake damage to our
California properties is limited to $10 million. Further, while
insurance reimburses us for our lost gross earnings during a business
interruption, if we are unable to supply our customers with our products for an
extended period of time, there can be no assurance that we will regain the
customers’ business once the product supply is returned to normal.
-28-
Item
2. Properties
Facilities
The
following table sets forth certain information with respect to our principal
operating facilities. We believe that our facilities are generally
well maintained, are suitable to support our business and adequate for present
and anticipated needs.
|
Location
|
Square
Feet
|
Own
or Lease
|
Lease
Expiration
|
|||
|
Utica,
NY (two facilities)
|
650,000
|
Own
|
-
|
|||
|
Largo,
FL
|
278,000
|
Own
|
-
|
|||
|
Rome,
NY
|
120,000
|
Own
|
-
|
|||
|
Centennial,
CO
|
87,500
|
Own
|
-
|
|||
|
Tampere,
Finland
|
5,662
|
Own
|
-
|
|||
|
Chihuahua,
Mexico
|
207,720
|
Lease
|
September
2019
|
|||
|
Lithia
Springs, GA
|
188,400
|
Lease
|
December
2019
|
|||
|
Brussels,
Belgium
|
45,531
|
Lease
|
June
2015
|
|||
|
Santa
Barbara, CA
|
33,900
|
Lease
|
September
2013
|
|||
|
Chelmsford,
MA
|
27,911
|
Lease
|
September
2015
|
|||
|
Mississauga,
Canada
|
22,378
|
Lease
|
December
2013
|
|||
|
Frenchs
Forest, Australia
|
16,909
|
Lease
|
July
2011
|
|||
|
Tampere,
Finland
|
15,457
|
Lease
|
Open
Ended
|
|||
|
Portland,
OR
|
14,627
|
Lease
|
January
2011
|
|||
|
Anaheim,
CA
|
14,037
|
Lease
|
October
2012
|
|||
|
Milan,
Italy
|
13,024
|
Lease
|
March
2013
|
|||
|
Swindon,
Wiltshire, UK
|
10,000
|
Lease
|
December
2015
|
|||
|
Seoul,
Korea
|
7,513
|
Lease
|
December
2010
|
|||
|
Montreal,
Canada
|
7,232
|
Lease
|
March
2011
|
|||
|
Frankfurt,
Germany
|
6,900
|
Lease
|
December
2012
|
|||
|
Barcelona,
Spain
|
5,382
|
Lease
|
December
2013
|
|||
|
Shepshed,
Leicestershire,UK
|
5,000
|
Lease
|
October
2015
|
|||
|
Beijing,
China
|
3,456
|
Lease
|
June
2012
|
|||
|
Lodz,
Poland
|
3,222
|
Lease
|
February
2018
|
|||
|
Barcelona,
Spain
|
2,691
|
Lease
|
December
2013
|
|||
|
Rungis
Cedex, France
|
2,637
|
Lease
|
November
2011
|
|||
|
Graz,
Austria
|
2,174
|
Lease
|
November
2013
|
|||
|
Montreal,
Canada
|
2,144
|
Lease
|
May
2012
|
|||
|
Oxfordshire,
UK
|
2,115
|
Lease
|
December
2015
|
|||
|
San
Juan Capistrano, CA
|
2,000
|
Lease
|
January
2011
|
-29-
Item 3. Legal Proceedings
From time
to time, we are a defendant in certain lawsuits alleging product liability,
patent infringement, or other claims incurred in the ordinary course of
business. Likewise, from time to time, the Company may receive a subpoena from a
government agency such as the Equal Employment Opportunity Commission,
Occupational Safety and Health Administration, the Department of Labor, the
Treasury Department, and other federal and state agencies or foreign governments
or government agencies. These subpoena may or may not be routine
inquiries, or may begin as routine inquiries and over time develop into
enforcement actions of various types. The product liability claims
are generally covered by various insurance policies, subject to certain
deductible amounts, maximum policy limits and certain exclusions in the
respective policies or required as a matter of law. In some cases we
may be entitled to indemnification by third parties. When there is no
insurance coverage, as would typically be the case primarily in lawsuits
alleging patent infringement or in connection with certain government
investigations, or indemnification obligation of a third party we establish
reserves sufficient to cover probable losses associated with such
claims. We do not expect that the resolution of any pending claims or
investigations will have a material adverse effect on our financial condition,
results of operations or cash flows. There can be no assurance,
however, that future claims or investigations, or the costs associated with
responding to such claims or investigations, especially claims and
investigations not covered by insurance, will not have a material adverse effect
on our results of operations.
Manufacturers
of medical products may face exposure to significant product liability claims.
To date, we have not experienced any product liability claims that are material
to our financial statements or condition, but any such claims arising in the
future could have a material adverse effect on our business or results of
operations. We currently maintain commercial product liability insurance of $25
million per incident and $25 million in the aggregate annually, which we believe
is adequate. This coverage is on a claims-made basis. There can be no
assurance that claims will not exceed insurance coverage, that the carriers will
be solvent or that such insurance will be available to us in the future at a
reasonable cost.
Our
operations are subject, and in the past have been subject, to a number of
environmental laws and regulations governing, among other things, air emissions,
wastewater discharges, the use, handling and disposal of hazardous substances
and wastes, soil and groundwater remediation and employee health and safety. In
some jurisdictions environmental requirements may be expected to become more
stringent in the future. In the United States certain environmental laws can
impose liability for the entire cost of site restoration upon each of the
parties that may have contributed to conditions at the site regardless of fault
or the lawfulness of the party’s activities. While we do not believe
that the present costs of environmental compliance and remediation are material,
there can be no assurance that future compliance or remedial obligations would
not have a material adverse effect on our financial condition, results of
operations or cash flows.
-30-
On April
7, 2006, CONMED received a copy of a complaint filed in the United States
District for the Northern District of New York on behalf of a purported class of
former CONMED Linvatec sales representatives. The complaint alleges
that the former sales representatives were entitled to, but did not receive,
severance in 2003 when CONMED Linvatec restructured its distribution
channels. The range of loss associated with this complaint ranges
from $0 to $3.0 million, not including any interest, fees or costs that might be
awarded if the five named plaintiffs were to prevail on their own behalf as well
as on behalf of the approximately 70 (or 90 as alleged by the plaintiffs) other
members of the purported class. CONMED Linvatec did not
generally pay severance during the 2003 restructuring because the former sales
representatives were offered sales positions with CONMED Linvatec’s new
manufacturer’s representatives. Other than three of the five named
plaintiffs in the class action, nearly all of CONMED Linvatec’s former sales
representatives accepted such positions.
The
Company’s motions to dismiss and for summary judgment, which were heard at a
hearing held on January 5, 2007, were denied by a Memorandum Decision and Order
dated May 22, 2007. The District Court also granted the plaintiffs’
motion to certify a class of former CONMED Linvatec sales representatives whose
employment with CONMED Linvatec was involuntarily terminated in 2003 and who did
not receive severance benefits. With discovery essentially
completed, on July 21, 2008, the Company filed motions seeking summary judgment
and to decertify the class. In addition, on July 21, 2008, Plaintiffs
filed a motion seeking summary judgment. These motions were submitted
for decision on August 26, 2008. There is no fixed time frame within which the
Court is required to rule on the motions. The Company believes there
is no merit to the claims asserted in the Complaint, and plans to vigorously
defend the case. There can be no assurance, however, that the Company
will prevail in the litigation.
Item 4. Submission of Matters to a Vote of Security
Holders
Not
Applicable.
-31-
PART II
|
Item
5.
|
Market
for the Registrant’s Common Equity, Related Stockholder Matters and Issuer
Purchases of Equity Securities
|
Our
common stock, par value $.01 per share, is traded on the Nasdaq
Stock Market under the symbol “CNMD”. At February 1, 2010, there were
939 registered holders of our common stock and approximately 6,548 accounts held
in “street name”.
The
following table sets forth quarterly high and low sales prices for the years
ended December 31, 2008 and 2009, as reported by the Nasdaq Stock
Market.
|
2008
|
||||||||
|
Period
|
High
|
Low
|
||||||
|
First
Quarter
|
$ | 28.22 | $ | 21.59 | ||||
|
Second
Quarter
|
27.22 | 23.90 | ||||||
|
Third
Quarter
|
32.99 | 25.02 | ||||||
|
Fourth
Quarter
|
31.74 | 21.13 | ||||||
|
2009
|
||||||||
|
Period
|
High
|
Low
|
||||||
|
First
Quarter
|
$ | 23.99 | $ | 11.68 | ||||
|
Second
Quarter
|
16.49 | 12.31 | ||||||
|
Third
Quarter
|
20.58 | 15.00 | ||||||
|
Fourth
Quarter
|
23.69 | 18.35 | ||||||
We did
not pay cash dividends on our common stock during 2008 or 2009 and do not
currently intend to pay dividends for the foreseeable future. Future decisions
as to the payment of dividends will be at the discretion of the Board of
Directors, subject to conditions then existing, including our financial
requirements and condition and the limitation and payment of cash dividends
contained in debt agreements.
Our Board
of Directors has authorized a share repurchase program; see Note 7 to
the Consolidated Financial Statements.
-32-
Information
relating to compensation plans under which equity securities of CONMED
Corporation are authorized for issuance is set forth below:
|
Equity
Compensation Plan Information
|
||||||||||||
|
Plan
category
|
Number
of securities
to
be issued upon
exercise
of
outstanding
options,
warrants
and rights
(a)
|
Weighted-average
exercise
price of
outstanding
options,
warrants
and rights
(b)
|
Number
of securities
remaining
available
for
future issuance
under
equity
compensation
plans
(excluding
securities
reflected
in
column (a))
(c)
|
|||||||||
|
Equity
compensation plans approved by security holders
|
2,875,709 | $ | 23.70 | 1,110,643 | ||||||||
|
Equity
compensation plans not approved by security holders
|
- | - | - | |||||||||
|
Total
|
2,875,709 | $ | 23.70 | 1,110,643 | ||||||||
-33-
Performance
Graph
The
performance graph below compares the yearly percentage change in the Company’s
Common Stock with the cumulative total return of the NASDAQ Composite Index and
the cumulative total return of the Standard & Poor’s Health Care Equipment
Index. In each case, the cumulative total return assumes reinvestment of
dividends into the same class of equity securities at the frequency with which
dividends are paid on such securities during the applicable fiscal
year.
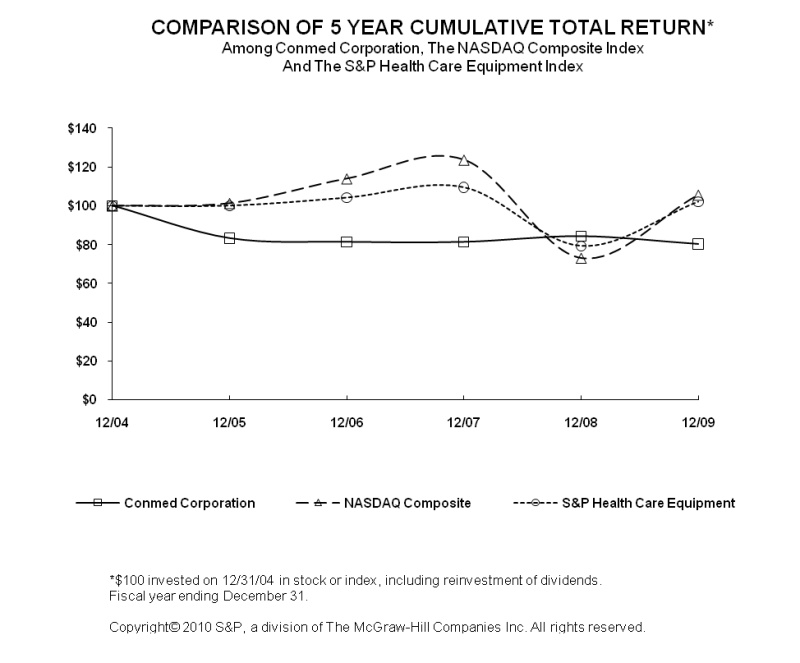
-34-
Item
6. Selected Financial Data
The
following table sets forth selected historical financial data for the years
ended December 31, 2005, 2006, 2007, 2008 and 2009. The financial
data set forth below should be read in conjunction with the information under
“Management’s Discussion and Analysis of Financial Condition and Results of
Operations” included in Item 7 of this Form 10-K and the Financial Statements of
the Company and the notes thereto.
FIVE
YEAR SUMMARY OF SELECTED FINANCIAL DATA (AS ADJUSTED) (1)
|
Years
Ended December 31,
|
||||||||||||||||||||
|
2005
|
2006
|
2007
|
2008
|
2009
|
||||||||||||||||
|
(in
thousands, except per share data)
|
||||||||||||||||||||
|
Statements
of Operations Data (2):
Net
sales
|
$ | 617,305 | $ | 646,812 | $ | 694,288 | $ | 742,183 | $ | 694,739 | ||||||||||
|
Cost
of sales (3)
|
304,284 | 333,966 | 345,163 | 359,802 | 357,407 | |||||||||||||||
|
Gross
profit
|
313,021 | 312,846 | 349,125 | 382,381 | 337,332 | |||||||||||||||
|
Selling
and administrative
|
216,685 | 234,832 | 240,541 | 272,437 | 266,310 | |||||||||||||||
|
Research
and development
|
25,469 | 30,715 | 30,400 | 33,108 | 31,837 | |||||||||||||||
|
Impairment
of goodwill (4)
|
- | 46,689 | - | - | - | |||||||||||||||
|
Other
expense (income)(5)
|
7,119 | 5,213 | (2,807 | ) | 1,577 | 10,916 | ||||||||||||||
|
Income
(loss) from operations
|
63,748 | (4,603 | ) | 80,991 | 75,259 | 28,269 | ||||||||||||||
|
Gain
(loss) on early extinguishment of debt (6)
|
- | (678 | ) | - | 1,947 | 1,083 | ||||||||||||||
|
Amortization
of debt discount
|
4,077 | 4,324 | 4,618 | 4,823 | 4,111 | |||||||||||||||
|
Interest
expense
|
15,578 | 19,120 | 16,234 | 10,372 | 7,086 | |||||||||||||||
|
Income
(loss) before income taxes
|
44,093 | (28,725 | ) | 60,139 | 62,011 | 18,155 | ||||||||||||||
|
Provision
(benefit) for income taxes
|
14,670 | (13,492 | ) | 21,595 | 22,022 | 6,018 | ||||||||||||||
|
Net
income (loss)
|
$ | 29,423 | $ | (15,233 | ) | $ | 38,544 | $ | 39,989 | $ | 12,137 | |||||||||
|
Earnings
(loss) Per Share
|
||||||||||||||||||||
|
Basic
|
$ | 1.00 | $ | (.54 | ) | $ | 1.36 | $ | 1.39 | $ | 0.42 | |||||||||
|
Diluted
|
$ | .99 | $ | (.54 | ) | $ | 1.33 | $ | 1.37 | $ | 0.42 | |||||||||
|
Weighted
Average Number of Common Shares In Calculating:
|
||||||||||||||||||||
|
Basic
earnings (loss) per share
|
29,300 | 27,966 | 28,416 | 28,796 | 29,074 | |||||||||||||||
|
Diluted
earnings (loss) per share
|
29,736 | 27,966 | 28,965 | 29,227 | 29,142 | |||||||||||||||
|
Other
Financial Data:
|
||||||||||||||||||||
|
Depreciation
and amortization
|
$ | 34,863 | $ | 34,175 | $ | 36,152 | $ | 37,159 | $ | 41,283 | ||||||||||
|
Capital
expenditures
|
16,242 | 21,895 | 20,910 | 35,879 | 21,444 | |||||||||||||||
|
Balance
Sheet Data (at period end):
|
||||||||||||||||||||
|
Cash
and cash equivalents
|
$ | 3,454 | $ | 3,831 | $ | 11,695 | $ | 11,811 | $ | 10,098 | ||||||||||
|
Total
assets
|
903,783 | 861,571 | 893,951 | 931,661 | 958,413 | |||||||||||||||
|
Long-term
obligations
|
369,725 | 329,818 | 298,383 | 316,532 | 302,791 | |||||||||||||||
|
Total
shareholders’ equity
|
471,926 | 456,548 | 518,284 | 540,215 | 576,515 | |||||||||||||||
|
(1)
|
In
May 2008, the FASB issued guidance which specifies that issuers of
convertible debt instruments that permit or require the issuer to pay cash
upon conversion should separately account for the liability and equity
components in a manner that will reflect the entity’s nonconvertible debt
borrowing rate when interest cost is recognized in subsequent periods. The
Company is required to apply the guidance retrospectively to all past
periods presented. We adopted this guidance on January 1, 2009
related to our 2.50% convertible senior subordinated notes due 2024 (“the
Notes”). See additional discussion in Note 16 of the
Consolidated Financial
Statements.
|
-35-
|
(2)
|
Results
of operations of acquired businesses have been recorded in the financial
statements since the date of
acquisition.
|
|
(3)
|
Includes
acquisition and acquisition-transition related charges of $7.8 million in
2005, $10.0 million in 2006 and $1.0 million in 2008. Also
includes in 2006 charges of $1.3 million related to the closing of our
manufacturing facility in Montreal, Canada; in 2008 and 2009,
charges related to the restructuring of certain of our operations of $2.5
million and $11.8 million, respectively, and in 2009 charges of $0.8
million related to the write-down of inventory. See additional
discussion in Note 11 and Note 17 to the Consolidated Financial
Statements.
|
|
(4)
|
During
2006, we recorded a $46.7 million charge for the impairment of goodwill
related to the CONMED Endoscopic Technologies business
unit.
|
|
(5)
|
Other
expense (income) includes the
following:
|
|
2005
|
2006
|
2007
|
2008
|
2009
|
||||||||||||||||
|
Acquisition-
|
||||||||||||||||||||
|
transition
related
|
||||||||||||||||||||
|
costs
|
$ | 4,108 | $ | 2,592 | $ | - | $ | - | $ | - | ||||||||||
|
Termination
of
|
||||||||||||||||||||
|
product
offering
|
1,519 | 1,448 | 148 | - | - | |||||||||||||||
|
Environmental
|
||||||||||||||||||||
|
settlement
|
698 | - | - | - | - | |||||||||||||||
|
Loss
on equity
|
||||||||||||||||||||
|
investment
|
794 | - | - | - | - | |||||||||||||||
|
Loss
on settlement
|
||||||||||||||||||||
|
of
patent dispute
|
- | 595 | - | - | - | |||||||||||||||
|
Gain
on litigation
|
||||||||||||||||||||
|
settlement
|
- | - | (6,072 | ) | - | - | ||||||||||||||
|
Loss
on litigation
|
||||||||||||||||||||
|
settlement
|
- | - | 1,295 | - | - | |||||||||||||||
|
New
plant/facility
|
||||||||||||||||||||
|
consolidation
|
- | 578 | 1,822 | 1,577 | 2,726 | |||||||||||||||
|
Net
pension gain
|
- | - | - | - | (1,882 | ) | ||||||||||||||
|
Product
recall
|
- | - | - | - | 5,992 | |||||||||||||||
|
CONMED
Endscopic
|
||||||||||||||||||||
|
Technologies
|
||||||||||||||||||||
|
division
|
||||||||||||||||||||
|
consolidation
|
- | - | - | - | 4,080 | |||||||||||||||
|
Other
expense
|
||||||||||||||||||||
|
(income)
|
$ | 7,119 | $ | 5,213 | $ | (2,807 | ) | $ | 1,577 | $ | 10,916 | |||||||||
|
|
See
additional discussion in Note 11 to the Consolidated Financial
Statements.
|
|
(6)
|
Includes
in 2006, charges of $0.7 million related to losses on early extinguishment
of debt. Includes in 2008 and 2009, gains of $1.9 million and
$1.1 million, respectively, on early extinguishment of
debt. See additional discussion in Note 5 to the Consolidated
Financial Statements.
|
-36-
|
Item 7.
|
Management’s
Discussion and Analysis of Financial Condition and Results of
Operations
|
The
following discussion should be read in conjunction with
Selected Financial Data (Item 6), and our Consolidated Financial
Statements and related notes contained elsewhere in this report.
Overview
of CONMED Corporation
CONMED
Corporation (“CONMED”, the “Company”, “we” or “us”) is a medical technology
company with an emphasis on surgical devices and equipment for minimally
invasive procedures and monitoring. The Company’s products serve the
clinical areas of arthroscopy, powered surgical instruments, electrosurgery,
cardiac monitoring disposables, endosurgery and endoscopic
technologies. They are used by surgeons and physicians in a variety
of specialties including orthopedics, general surgery, gynecology, neurosurgery,
and gastroenterology. These product lines and the percentage of
consolidated revenues associated with each, are as follows:
|
2007
|
2008
|
2009
|
||||||||||
|
Arthroscopy
|
38 | % | 38 | % | 39 | % | ||||||
|
Powered
Surgical Instruments
|
21 | 21 | 21 | |||||||||
|
Electrosurgery
|
13 | 14 | 14 | |||||||||
|
Patient
Care
|
11 | 11 | 10 | |||||||||
|
Endosurgery
|
9 | 9 | 9 | |||||||||
|
Endoscopic
Technologies
|
8 | 7 | 7 | |||||||||
|
Consolidated
Net Sales
|
100 | % | 100 | % | 100 | % | ||||||
A
significant amount of our products are used in surgical procedures with
approximately 75% of our revenues derived from the sale of disposable
products. Our capital equipment offerings also facilitate the ongoing
sale of related disposable products and accessories, thus providing us with a
recurring revenue stream. We manufacture substantially all of our
products in facilities located in the United States, Mexico and
Finland. We market our products both domestically and internationally
directly to customers and through distributors. International sales
approximated 42%, 44% and 45% in 2007, 2008 and 2009, respectively.
Business
Environment and Opportunities
The aging
of the worldwide population along with lifestyle changes, continued cost
containment pressures on healthcare systems and the desire of clinicians and
administrators to use less invasive (or noninvasive) procedures are important
trends which are driving the long-term growth in our industry. We
believe that with our broad product offering of high quality surgical and
patient care products, we can capitalize on this growth for the benefit of the
Company and our shareholders.
-37-
In order to further our growth
prospects, we have historically used strategic business acquisitions and
exclusive distribution relationships to continue to diversify our product
offerings, increase our market share and realize economies of scale.
We
have a variety of research and development initiatives focused in each of our
principal product lines as continued innovation and commercialization of
new proprietary products and processes are essential elements of our long-term
growth strategy. Our reputation as an innovator is exemplified by
recent new product introductions such as the CONMED Linvatec Shoulder
Restoration System, a comprehensive system for rotator cuff repair.
Business
Challenges
Given
significant volatility in the financial markets and foreign currency exchange
rates and depressed economic conditions in both domestic and international
markets, 2009 presented significant business challenges. Our
revenue declined in 2009 as compared to 2008 primarily as a result of
the difficult economic environment. While we are cautiously
optimistic that the overall global economic environment is improving and are
therefore forecasting a return to revenue growth in 2010, there can be no
assurance that the improvement in the economic environment will be sustained or
that revenue growth will be achieved. We will continue to monitor and
manage the impact of the overall economic environment on the
Company.
During
2009 we successfully completed the first phase of our operational restructuring
plan which we had previously announced in the second quarter of
2008. During 2010, we will begin the second phase of our operational
restructuring plan which involves further expanding our lower cost Mexican
operations by transferring additional production lines to our
Chihuahua, Mexico facility which we believe will yield additional cost
savings. We expect the second phase of our restructuring plan to be
largely completed by the fourth quarter of 2010. However, we cannot
be certain such activities will be completed in the estimated time period or
that planned cost savings will be achieved.
Our
CONMED Endoscopic Technologies operating segment has suffered from sales
declines and operating losses since its acquisition from C.R. Bard in September
2004. We have corrected the operational issues associated with
product shortages that resulted following the acquisition of the Endoscopic
Technologies business and have consolidated the administrative functions of the
Endoscopic Technologies business from Chelmsford, Massachusetts to our Corporate
Headquarters in Utica, New York. We believe by reducing costs while
continuing to invest in new product development, we can achieve increased sales
and ensure a return to profitability.
Our
facilities are subject to periodic inspection by the United States Food and Drug
Administration (“FDA”) and foreign regulatory agencies for, among other things,
conformance to Quality System Regulation and Current Good Manufacturing Practice
(“CGMP”) requirements. Our products are also subject to product
recall and we have made product recalls in the past, including $6.0 million in
2009 related to certain of our powered instrument handpieces. We are committed
to the principles and strategies of systems-based quality management for
improved CGMP compliance, operational performance and efficiencies through our
Company-wide quality systems initiative. However, there can be no
assurance that our actions will ensure that we will not receive a warning letter
or other regulatory action which may include consent decrees or fines, or that
we will not make product recalls in the future.
-38-
Critical
Accounting Policies
Preparation
of our financial statements requires us to make estimates and assumptions which
affect the reported amounts of assets, liabilities, revenues and
expenses. Note 1 to the Consolidated Financial Statements describes
the significant accounting policies used in preparation of the Consolidated
Financial Statements. The most significant areas involving management
judgments and estimates are described below and are considered by management to
be critical to understanding the financial condition and results of operations
of CONMED Corporation.
Revenue
Recognition
Revenue is recognized when title has
been transferred to the customer which is at the time of
shipment. The following policies apply to our major categories of
revenue transactions:
|
|
·
|
Sales
to customers are evidenced by firm purchase orders. Title and the risks
and rewards of ownership are transferred to the customer when product is
shipped under our stated shipping terms. Payment by the
customer is due under fixed payment
terms.
|
|
|
·
|
We
place certain of our capital equipment with customers in return for
commitments to purchase disposable products over time periods generally
ranging from one to three years. In these circumstances, no
revenue is recognized upon capital equipment shipment and we recognize
revenue upon the disposable product shipment. The cost of the
equipment is amortized over the term of individual commitment
agreements.
|
|
|
·
|
Product
returns are only accepted at the discretion of the Company and in
accordance with our “Returned Goods Policy”. Historically the
level of product returns has not been significant. We accrue
for sales returns, rebates and allowances based upon an analysis of
historical customer returns and credits, rebates, discounts and current
market conditions.
|
|
|
·
|
Our
terms of sale to customers generally do not include any obligations to
perform future services. Limited warranties are provided for
capital equipment sales and provisions for warranty are provided at the
time of product sale based upon an analysis of historical
data.
|
|
|
·
|
Amounts
billed to customers related to shipping and handling have been included in
net sales. Shipping and handling costs included in selling and
administrative expense were $14.1 million, $13.4 million and $11.3 million
for 2007, 2008 and 2009,
respectively.
|
|
|
·
|
We
sell to a diversified base of customers around the world and, therefore,
believe there is no material concentration of credit
risk.
|
|
|
·
|
We
assess the risk of loss on accounts receivable and adjust the allowance
for doubtful accounts based on this risk
assessment. Historically, losses on accounts receivable have
not been material. Management believes that the allowance for
doubtful accounts of $1.2 million at December 31, 2009 is adequate to
provide for probable losses resulting from accounts
receivable.
|
-39-
Inventory
Reserves
We
maintain reserves for excess and obsolete inventory resulting from the inability
to sell our products at prices in excess of current carrying
costs. The markets in which we operate are highly competitive, with
new products and surgical procedures introduced on an on-going
basis. Such marketplace changes may result in our products becoming
obsolete. We make estimates regarding the future recoverability of
the costs of our products and record a provision for excess and obsolete
inventories based on historical experience, expiration of sterilization dates
and expected future trends. If actual product life cycles, product
demand or acceptance of new product introductions are less favorable than
projected by management, additional inventory write-downs may be
required. We believe that our current inventory reserves are
adequate.
Goodwill
and Intangible Assets
We have a
history of growth through acquisitions. Assets and liabilities of
acquired businesses are recorded at their estimated fair values as of the date
of acquisition. Goodwill represents costs in excess of fair values
assigned to the underlying net assets of acquired businesses. Other
intangible assets primarily represent allocations of purchase price to
identifiable intangible assets of acquired businesses. We have
accumulated goodwill of $290.5 million and other intangible assets of $190.8
million as of December 31, 2009.
In
accordance with Financial Accounting Standards Board (“FASB”) guidance, goodwill
and intangible assets deemed to have indefinite lives are not amortized, but are
subject to at least annual impairment testing. It is our policy to
perform our annual impairment testing in the fourth quarter. The
identification and measurement of goodwill impairment involves the estimation of
the fair value of our reporting units. Estimates of fair value are
based on the best information available as of the date of the assessment, which
primarily incorporate management assumptions about expected future cash flows
and other valuation techniques. Future cash flows may be affected by
changes in industry or market conditions or the rate and extent to which
anticipated synergies or cost savings are realized with newly acquired
entities. We completed our goodwill impairment testing as of October
1, 2009 and determined that no impairment existed at that date. For
our CONMED Electrosurgery, CONMED Endosurgery and CONMED Linvatec operating
units, our impairment testing utilized CONMED Corporation’s EBIT multiple
adjusted for a market-based control premium with the resultant fair values
exceeding carrying values by 55% to 140%. Our CONMED Patient Care
operating unit has the least excess of fair value over carrying value of our
reporting units; we therefore utilized both a
market-based approach and an income approach when performing impairment testing
with the resultant fair value exceeding carrying value by 16%. The
income approach contained certain key assumptions including that revenue would
resume historical growth patterns in 2010 while including certain cost savings
associated with the operational restructuring plan completed during
2009. We continue to monitor events and circumstances for triggering
events which would more likely than not reduce the fair value of any of our
reporting units and require us to perform impairment testing.
Intangible
assets with a finite life are amortized over the estimated useful life of the
asset and are evaluated each reporting period to determine whether events and
circumstances warrant a revision to the remaining period of
amortization. Intangible assets subject to amortization are reviewed
for impairment whenever events or changes in circumstances indicate that its
carrying amount may not be recoverable. The carrying amount of an intangible
asset subject to amortization is not recoverable if it exceeds the sum of the
undiscounted cash flows expected to result from the use of the
asset. An impairment loss is recognized by reducing the carrying
amount of the intangible asset to its current fair value.
-40-
Customer
relationship assets arose principally as a result of the 1997 acquisition of
Linvatec Corporation. These assets represent the acquisition date
fair value of existing customer relationships based on the after-tax income
expected to be derived during their estimated remaining useful
life. The useful lives of these customer relationships were not and
are not limited by contract or any economic, regulatory or other known
factors. The estimated useful life of the Linvatec customer
relationship assets was determined as of the date of acquisition as a result of
a study of the observed pattern of historical revenue attrition during the 5
years immediately preceding the acquisition of Linvatec
Corporation. This observed attrition pattern was then applied to the
existing customer relationships to derive the future expected retirement of the
customer relationships. This analysis indicated an annual attrition
rate of 2.6%. Assuming an exponential attrition pattern, this equated
to an average remaining useful life of approximately 38 years for the Linvatec
customer relationship assets. Customer relationship intangible assets
arising as a result of other business acquisitions are being amortized over a
weighted average life of 17 years. The weighted average life for
customer relationship assets in aggregate is 34 years.
We
evaluate the remaining useful life of our customer relationship intangible
assets each reporting period in order to determine whether events and
circumstances warrant a revision to the remaining period of
amortization. In order to further evaluate the remaining useful life
of our customer relationship intangible assets, we perform an annual analysis
and assessment of actual customer attrition and activity. This
assessment includes a comparison of customer activity since the acquisition date
and review of customer attrition rates. In the event that our
analysis of actual customer attrition rates indicates a level of attrition that
is in excess of that which was originally contemplated, we would change the
estimated useful life of the related customer relationship asset with the
remaining carrying amount amortized prospectively over the revised remaining
useful life.
We test
our customer relationship assets for recoverability whenever events or changes
in circumstances indicate that the carrying amount may not be
recoverable. Factors specific to our customer relationship assets
which might lead to an impairment charge include a significant increase in the
annual customer attrition rate or otherwise significant loss of customers,
significant decreases in sales or current-period operating or cash flow losses
or a projection or forecast of losses. We do not believe that there
have been events or changes in circumstances which would indicate the carrying
amount of our customer relationship assets might not be
recoverable.
See Note
4 to the Consolidated Financial Statements for further discussion of goodwill
and other intangible assets.
Pension
Plan
We
sponsor a defined benefit pension plan covering substantially all our
employees. Major assumptions used in accounting for the plan include
the discount rate, expected return on plan assets, rate of increase in employee
compensation levels and expected mortality. Assumptions are
determined based on Company data and appropriate market indicators, and are
evaluated annually as of the plan’s measurement date. A change in any
of these assumptions would have an effect on net periodic pension costs reported
in the consolidated financial statements.
-41-
On March
26, 2009, the Board of Directors approved a plan to freeze benefit accruals
under our pension plan effective May 14, 2009. As a result,
we recorded a curtailment gain of $4.4 million and a reduction in accrued
pension of $11.4 million which is included in other long term
liabilities. See Note 9 to the Consolidated Financial
Statements.
The
weighted-average discount rate used to measure pension liabilities and costs is
set by reference to the Citigroup Pension Liability Index. However, this index
gives only an indication of the appropriate discount rate because the cash flows
of the bonds comprising the index do not match the projected benefit payment
stream of the plan precisely. For this reason, we also consider the individual
characteristics of the plan, such as projected cash flow patterns and payment
durations, when setting the discount rate. This
discount rate, which is used in determining pension expense, was 6.48% in 2008
compared to 5.97% for the first quarter of 2009. The discount rate
used for purposes of remeasuring plan liabilities as of the date the plan freeze
was approved and for purposes of measuring pension expense for the remainder of
2009 was 7.30%. The rate used in determining 2010 pension expense is
5.86%.
We have
used an expected rate of return on pension plan assets of 8.0% for purposes of
determining the net periodic pension benefit cost. In determining the
expected return on pension plan assets, we consider the relative weighting of
plan assets, the historical performance of total plan assets and individual
asset classes and economic and other indicators of future
performance. In addition, we consult with financial and investment
management professionals in developing appropriate targeted rates of
return.
We have
estimated our rate of increase in employee compensation levels at 3.5%
consistent with our internal budgeting.
Pension
expense in 2010 is expected to be $1.5 million compared to a net pension gain of
$0.8 million (including a $4.4 million curtailment gain and pension expense of
$3.6 million) in 2009. In addition, we will be required to contribute
approximately $3.0 million to the pension plan for the 2010 plan
year.
We have
recorded additional expense of approximately $4.0 million in the year ended
December 31, 2009 related to an additional employer 401(k) contribution which is
intended to offset some of the impact on employees of the freeze in pension
benefit accruals.
See Note
9 to the Consolidated Financial Statements for further discussion.
Stock
Based Compensation
All share-base payments to employees,
including grants of employee stock options, restricted stock units, and stock
appreciation rights are recognized in the financial statements based at their
fair values. Compensation expense is recognized using a straight-line
method over the vesting period.
-42-
Income
Taxes
The
recorded future tax benefit arising from net deductible temporary differences
and tax carryforwards is approximately $34.6 million at December 31,
2009. Management believes that our earnings during the periods when
the temporary differences become deductible will be sufficient to realize the
related future income tax benefits.
We
operate in multiple taxing jurisdictions, both within and outside the United
States. We face audits from these various tax authorities regarding
the amount of taxes due. Such audits can involve complex issues and
may require an extended period of time to resolve. Our Federal income
tax returns have been examined by the Internal Revenue Service (“IRS”) for
calendar years ending through 2007. Tax years subsequent to 2007 are
subject to future examination.
We have
established a valuation allowance to reflect the uncertainty of realizing the
benefits of certain net operating loss carryforwards recognized in connection
with an acquisition. Effective January 1, 2009, changes in deferred
tax valuation allowances and income tax uncertainties after the acquisition
date, including those associated with acquisitions that closed prior to this
effective date, generally will affect income tax expense. In assessing the need
for a valuation allowance, we estimate future taxable income, considering the
feasibility of ongoing tax planning strategies and the realizability of tax loss
carryforwards. Valuation allowances related to deferred tax assets
may be impacted by changes to tax laws, changes to statutory tax rates and
ongoing and future taxable income levels.
Consolidated
Results of Operations
The
following table presents, as a percentage of net sales, certain categories
included in our consolidated statements of income for the periods
indicated:
|
Year Ended December 31,
|
||||||||||||
|
2007
|
2008
|
2009
|
||||||||||
|
Net
sales
|
100.0 | % | 100.0 | % | 100.0 | % | ||||||
|
Cost
of sales
|
49.7 | 48.5 | 51.4 | |||||||||
|
Gross
margin
|
50.3 | 51.5 | 48.6 | |||||||||
|
Selling
and administrative expense
|
34.6 | 36.7 | 38.3 | |||||||||
|
Research
and development expense
|
4.4 | 4.5 | 4.6 | |||||||||
|
Other
expense (income), net
|
(0.4 | ) | 0.2 | 1.6 | ||||||||
|
Income from operations
|
11.7 | 10.1 | 4.1 | |||||||||
|
Gain
on early extinguishment of debt
|
0.0 | 0.3 | 0.1 | |||||||||
|
Amortization
of debt discount
|
0.7 | 0.6 | 0.6 | |||||||||
|
Interest
expense
|
2.3 | 1.4 | 1.0 | |||||||||
|
Income
before income taxes
|
8.7 | 8.4 | 2.6 | |||||||||
|
Provision
for income taxes
|
3.1 | 3.0 | 0.9 | |||||||||
|
Net
income
|
5.6 | % | 5.4 | % | 1.7 | % | ||||||
-43-
2009
Compared to 2008
Sales for
2009 were $694.7 million, a decrease of $47.5 million (-6.4%) compared to
sales of $742.2 million in 2008 with the decreases occurring in all product
lines except Endosurgery. Foreign currency exchange rates (when
compared to the foreign currency exchange rates in the same period a year ago)
accounted for approximately $20.4 million of the decrease. In local
currency, sales decreased 3.7%. Sales of capital equipment decreased
$31.9 million (-16.1%) from $197.8 million in 2008 to $165.9 million in 2009;
sales of single-use and reposable products decreased $15.6 million (-2.9%) from
$544.4 million in 2008 to $528.8 million in 2009. On a local currency
basis, sales of capital equipment decreased 13.3% while single-use and reposable
products decreased 0.1%. We believe the overall decline in sales is
driven by capital purchasing constraints in hospitals due to the depressed
economic conditions.
Cost of
sales decreased to $357.4 million in 2009 as compared to $359.8 million in 2008
on overall decreases in sales volumes as described above. Gross
profit margins decreased 2.9 percentage points to 48.6% in 2009 as compared to
51.5% in the same period a year ago. The decrease in gross profit
margins of 2.9 percentage points is primarily a result of the effects of
unfavorable foreign currency exchange rates on sales (1.5 percentage points) and
restructuring of the Company’s operations as more fully described in Note 17
(1.8 percentage points) offset by improved product mix (0.4 percentage
points).
Selling
and administrative expense decreased from $272.4 million in 2008 to $266.3
million in 2009. Foreign currency exchange rates (when compared to
the foreign currency exchange rates in the same period a year ago) accounted for
approximately $6.8 million of the decrease. Selling and
administrative expense as a percentage of net sales increased to 38.3% in 2009
from 36.7% in 2008. This increase of 1.6 percentage points is
primarily attributable to higher benefit related costs (0.4 percentage points)
and higher sales force and other administrative expenses (1.2 percentage points)
as a percent of sales.
Research
and development expense was $31.8 million in 2009 compared to $33.1 million in
2008. As a percentage of net sales, research and development expense
increased to 4.6% in 2009 compared to 4.5% in 2008. The increase in research and
development expense of 0.1 percentage point is due to increased spending on our
CONMED Linvatec orthopedic products (0.5 percentage points) offset by decreases
in other research and development spending (0.4 percentage points).
As
discussed in Note 11 to the Consolidated Financial Statements, other expense in
2009 consisted of the following: a $2.7 million charge related to the
restructuring of certain of the Company’s operations; a $4.1 million charge
related to the consolidation of the administrative functions of the CONMED
Endoscopic Technologies division; a $6.0 million charge related to a voluntary
recall of certain of our powered instrument products; and a $1.9 million net
pension gain resulting from the freezing of future benefit accruals effective
May 14, 2009. Other expense in 2008 consisted of a $1.6 million
charge related to the restructuring and relocation of certain of the Company’s
facilities.
During
the first quarter of 2009, we repurchased and retired $9.9 million of our 2.50%
convertible senior subordinated notes (the “Notes”) for $7.8 million and
recorded a gain on the early extinguishment of debt of $1.1 million net of the
write-offs of $0.1 million in unamortized deferred financing costs and $1.0
million in unamortized Notes discount. During the fourth quarter of
2008, we repurchased and retired $25.0 million of our 2.50% convertible senior
subordinated notes (the “Notes”) for $20.2 million and recorded a gain on the
early extinguishment of debt of $1.9 million net of the write-off of $0.4
million in unamortized deferred financing costs and $2.4 million in unamortized
Notes discount. See additional discussion under Item 7. Management’s
Discussion and Analysis of Financial Condition and Results of
Operations—Liquidity and Capital Resources and Note 5 to the Consolidated
Financial Statements.
-44-
Amortization
of debt discount in 2009 was $4.1 million compared to $4.8 million in 2008. This
amortization is associated with the implementation of FASB guidance as of
January 1, 2009 as further described in Note 16 to the Consolidated Financial
Statements.
Interest
expense in 2009 was $7.1 million compared to $10.4 million in
2008. The decrease in interest expense is due to lower weighted
average interest rates combined with lower weighted average borrowings
outstanding in 2009 as compared to 2008. The weighted average
interest rates on our borrowings (inclusive of the finance charge on our
accounts receivable sale facility) decreased to 2.90% in 2009 as compared to
3.78% in 2008.
A
provision for income taxes was recorded at an effective rate of 33.1% in 2009
and 35.5% in 2008 as compared to the Federal statutory rate of
35.0%. The effective tax rate for 2009 is lower than that recorded in
the same period a year ago as a result of the settlement of our 2007 IRS
examination in the first quarter of 2009, and the resulting adjustment to our
reserves and reduction of income tax expense. A reconciliation of the
United States statutory income tax rate to our effective tax rate is included in
Note 6 to the Consolidated Financial Statements.
2008
Compared to 2007
Sales for
2008 were $742.2 million, an increase of $47.9 million (6.9%) compared to
sales of $694.3 million in 2007 with the increase occurring in all product
lines except Endoscopic Technologies. Favorable foreign currency
exchange rates in 2008 compared to 2007 accounted for $2.0 million of the
increase while the purchase of our Italian distributor accounted for an increase
in sales of approximately $18.3 million (see Note 15 to the Consolidated
Financial Statements). In local currency, sales increased
6.6%. Sales of capital equipment increased $8.5 million (4.5%) from
$189.3 million in 2007 to $197.8 million in 2008; sales of single-use and
reposable products increased $39.4 million (7.8%) from $505.0 million in 2007 to
$544.4 million in 2008. On a local currency basis, sales of capital
equipment increased 4.1% while single-use and reposable products increased
7.6%.
Cost of
sales increased to $359.8 million in 2008 compared to $345.2 million in 2007,
primarily as a result of the increased sales volumes discussed
above. Gross profit margins increased 1.2 percentage
points from 50.3% in 2007 to 51.5% in 2008. The increase of 1.2
percentage points is comprised of improved gross margins from the newly acquired
direct sales operation in Italy (1.2 percentage points) and increases in Patient
Care and Linvatec gross margins (0.3 and 0.7 percentage points, respectively) as
a result of higher selling prices and improved manufacturing
efficiencies. These increases were offset by lower gross margins in
our Endoscopic Technologies business (0.4 percentage points) due to pricing
pressures and lower production volumes, additional costs incurred associated
with our restructuring and relocation of certain of the Company’s facilities
(0.3 percentage points) and product mix (0.3 percentage points).
Selling
and administrative expense increased to $272.4 million in 2008 compared to
$240.5 million in 2007. Foreign currency exchange rates (when
compared to the foreign currency exchange rates in the same period a year ago)
accounted for approximately $1.5 million of the increase. Selling and
administrative expense as a percentage of net sales increased to 36.7% in 2008
from 34.6% in 2007. This increase of 2.1 percentage points is
primarily attributable to higher selling and administrative expense associated
with our newly acquired direct sales operation in Italy (1.5 percentage points),
higher benefit costs (0.3 percentage points), and other selling and
administrative costs (0.3 percentage points).
-45-
Research
and development expense was $33.1 million in 2008 compared to $30.4 million in
2007. As a percentage of net sales, research and development expense
remained flat at 4.5% in 2008 from 4.4% in 2007.
As
discussed in Note 11 to the Consolidated Financial Statements, other expense in
2008 consisted of a $1.6 million charge related to the restructuring and
relocation of certain of the Company’s facilities. Other expense in 2007
consisted of the following: $1.8 million charge related to the
closing of our manufacturing facility in Montreal, Canada and a sales office in
France, a $0.1 million charge related to the termination of our surgical lights
product offering, $6.1 million in income related to the settlement of the
antitrust case with Johnson & Johnson, and a $1.3 million charge related to
the settlement of a product liability claim and defense related
costs.
During
the fourth quarter of 2008, we repurchased and retired $25.0 million of our
2.50% convertible senior subordinated notes (the “Notes”) for $20.2 million and
recorded a gain on the early extinguishment of debt of $1.9 million net of the
write-off of $0.4 million in unamortized deferred financing costs and $2.4
million in unamortized Notes discount. See additional discussion
under Item 7. Management’s Discussion and Analysis of Financial Condition and
Results of Operations—Liquidity and Capital Resources and Note 5 to the
Consolidated Financial Statements.
Amortization of debt discount in 2008 was $4.8 million
compared to $4.6 million in 2007. This amortization is associated with the
implementation of FASB guidance as of January 1, 2009 as further described in
Note 16 to the Consolidated Financial Statements.
Interest
expense in 2008 was $10.4 million compared to $16.2 million in
2007. The decrease in interest expense is due to lower weighted
average interest rates combined with lower weighted average borrowings
outstanding in 2008 as compared to 2007. The weighted average
interest rates on our borrowings (inclusive of the finance charge on our
accounts receivable sale facility) decreased to 3.78% in 2008 as compared to
5.51% in 2007.
A
provision for income taxes was recorded at an effective rate of 35.5% in 2008
and 35.9% in 2007 as compared to the Federal statutory rate of
35.0%. The effective tax rate was lower in 2008 than in 2007 largely
as a result of decreased apportionment factors to state taxing jurisdictions and
a decreased level of stock-based compensation that is not expected to create a
future tax deduction. A reconciliation of the United States statutory
income tax rate to our effective tax rate is included in Note 6 to the
Consolidated Financial Statements.
Operating
Segment Results:
Segment
information is prepared on the same basis that we review financial information
for operational decision-making purposes. We conduct our business
through five principal operating segments: CONMED Endoscopic Technologies,
CONMED Endosurgery, CONMED Electrosurgery, CONMED Linvatec and CONMED Patient
Care. Based upon the aggregation criteria for segment reporting, we
have grouped our CONMED Endosurgery, CONMED Electrosurgery and CONMED Linvatec
operating segments into a single reporting segment. The economic
characteristics of CONMED Patient Care and CONMED Endoscopic Technologies do not
meet the criteria for aggregation due to the lower overall operating income
(loss) of these segments.
-46-
The
following tables summarize the Company’s results of operations by segment for
2007, 2008 and 2009:
CONMED
Endosurgery, CONMED Electrosurgery and CONMED Linvatec
|
2007
|
2008
|
2009
|
||||||||||
|
Net
sales
|
$ | 564,834 | $ | 612,521 | $ | 574,820 | ||||||
|
Income
from operations
|
87,569 | 98,101 | 62,715 | |||||||||
|
Operating
margin
|
15.5 | % | 16.0 | % | 10.9 | % | ||||||
Product
offerings include a complete line of endo-mechanical instrumentation for
minimally invasive laparoscopic procedures, electrosurgical generators and
related surgical instruments, arthroscopic instrumentation for use in orthopedic
surgery and small bone, large bone and specialty powered surgical
instruments.
|
|
·
|
Arthroscopy
sales decreased $22.1 million (-7.6%) in 2009 to $269.8 million from
$291.9 million in 2008. Unfavorable foreign currency exchange
rates (when compared to the foreign currency exchange rates in the same
period a year ago) accounted for approximately $9.2 million of the
decrease. Sales of capital equipment decreased $19.6 million
(-21.1%) from $92.9 million in 2008 to $73.3 million in 2009; sales of
single-use products decreased $2.5 million (-1.3%) from $199.0 million in
2008 to $196.5 million in 2009. On a local currency basis,
sales of capital equipment decreased 18.6% while single-use products
increased 2.2%. We believe the overall decline in sales is
driven by capital purchasing constraints in hospitals due to the depressed
economic conditions. Arthroscopy sales increased $27.3 million
(10.3%) in 2008 to $291.9 million from $264.6 million in 2007. These
increases are principally a result of increased sales of our procedure
specific, resection and video imaging products for arthroscopy and general
surgery. Favorable foreign currency exchange rates (when
compared to the foreign currency exchange rates in the same period a year
ago) accounted for approximately $1.4 million of the
increase. Sales of capital equipment increased $4.8 million
(5.4%) from $88.1 million in 2007 to $92.9 million in 2008; sales of
single-use products increased $22.5 million (12.7%) from $176.5 million in
2007 to $199.0 million in 2008. On a local currency basis,
sales of capital equipment increased 5.1% while single-use products
increased 12.1%.
|
|
|
·
|
Powered
surgical instrument sales decreased $11.7 million (-7.5%) in 2009 to
$144.0 million from $155.7 million in 2008. Unfavorable foreign
currency exchange rates (when compared to the same period a year ago)
accounted for approximately $6.1 million of the decrease. Sales
of capital equipment decreased $8.7 million (-11.4%) from $76.4 million in
2008 to $67.7 million in 2009; sales of single-use products
decreased $3.0 million (-3.8%) in 2009 to $76.3 million compared to $79.3
million in 2008. On a local currency basis, sales of capital
equipment decreased 8.1% while single-use products increased
0.8%. We believe the overall decline in sales is driven by
capital purchasing constraints in hospitals due to the depressed economic
conditions. Powered surgical instrument sales increased $6.4
million (4.3%) in 2008 to $155.7 million from $149.3 million in 2007 on
increased sales of large bone handpieces and large bone, small bone and
specialty burs and blades. Favorable foreign currency exchange
rates (when compared to the same period a year ago) accounted for
approximately $1.0 million of the increase. Sales of capital
equipment increased $0.8 million (1.1%) from $75.6 million in 2007 to
$76.4 million in the 2008; sales of single-use products increased $5.6
million (7.6%) from $73.7 million in 2007 to $79.3 million in
2008. On a local currency basis, sales of capital equipment
increased 0.4% while single-use products increased
6.9%.
|
-47-
|
|
·
|
Electrosurgery
sales decreased $5.5 million (-5.5%) in 2009 to $95.0 million from $100.5
million in 2008. Unfavorable foreign currency exchange rates
(when compared to the foreign currency exchange rates in the same period a
year ago) accounted for approximately $1.5 million of the
decrease. Sales of capital equipment decreased $3.6 million
(-12.6%) from $28.5 million in 2008 to $24.9 million in 2009; sales of
single-use products decreased $1.9 million (-2.6%) from $72.0 million 2008
to $70.1 million in 2009. On a local currency basis, sales of
capital equipment decreased 10.2% while single-use products decreased
1.5%. We believe the overall decline in sales is driven by
capital purchasing constraints in hospitals due to the depressed economic
conditions. Electrosurgery sales increased $8.4 million (9.1%)
in 2008 to $100.5 million from $92.1 million in 2007 on increased sales of
our System 5000™ electrosurgical generators, ABC®
handpieces, pencils and electrodes. Foreign currency exchange
rates (when compared to the foreign currency exchange rates in the same
period a year ago) did not have a significant impact on
sales. Sales of capital equipment increased $2.9 million
(11.3%) to $28.5 million in 2008 from $25.6 million in 2007; sales of
single-use products increased $5.5 million (8.3%) to $72.0 million 2008
from $66.5 million in 2007. On a local currency basis, sales of
capital equipment increased 11.3% while single-use products increased
8.1%.
|
|
|
·
|
Endosurgery
sales increased $1.6 million (2.5%) in 2009 to $66.0 million from $64.4
million in 2008. Unfavorable foreign currency exchange rates
(when compared to the foreign currency exchange rates in the same period a
year ago) decreased sales approximately $1.6 million. On local
currency basis, sales increased 5.0%. Endosurgery sales increased $5.5
million (9.3%) in 2008 to $64.4 million from $58.9 million in 2007.
Unfavorable foreign currency exchange rates (when compared to the foreign
currency exchange rates in the same period a year ago) decreased sales
approximately $0.2 million. On local currency basis, sales
increased 9.7%. The overall increase in sales is mainly driven
by our VCARE product which we believe is an innovative product for
laparoscopic hysterectomies.
|
|
|
·
|
Operating
margins as a percentage of net sales decreased 5.1 percentage points to
10.9% in 2009 compared to 16.0% in 2008. The decrease in
operating margins is due to lower gross margins (1.7 percentage points)
due to unfavorable foreign currency exchange rates, higher research and
development spending (0.6 percentage points) due to increased emphasis on
our CONMED Linvatec orthopedic products, and costs associated with the
voluntary recall of certain powered instrument products (1.0 percentage
points); see Note 11 to the Consolidated Financial Statements
for further discussion. In addition, sales force and other
relatively fixed administrative expenses increased 1.8 points as a
percentage of lower overall sales.
|
|
|
·
|
Operating
margins as a percentage of net sales increased 0.5 percentage points to
16.0% in 2008 compared to 15.5% in 2007. The increase in
operating margins are due to higher gross margins (2.0 percentage points)
in 2008 compared to 2007 as result of the newly acquired direct operations
in Italy and improved manufacturing efficiencies and other decreases in
selling and administrative expense (0.2 percentage points) offset by
higher selling and administrative expenses associated with the newly
acquired direct sales operation in Italy (1.7 percentage
points).
|
-48-
| CONMED Patient Care | ||||||||||||
|
2007
|
2008
|
2009
|
||||||||||
|
Net
sales
|
$ | 76,711 | $ | 78,384 | $ | 70,978 | ||||||
|
Income
(loss) from operations
|
2,003 | 2,259 | (1,263 | ) | ||||||||
|
Operating
margin
|
2.6 | % | 2.9 | % | (1.8% | ) | ||||||
Product
offerings include a line of vital signs and cardiac monitoring products
including pulse oximetry equipment & sensors, ECG electrodes and cables,
cardiac defibrillation & pacing pads and blood pressure cuffs. We
also offer a complete line of reusable surgical patient positioners and suction
instruments & tubing for use in the operating room, as well as a line of IV
products.
|
|
·
|
Patient
Care sales decreased $7.4 million (-9.4%) in 2009 to $71.0 million
compared to $78.4 million in 2008 principally due to decreased sales of
suction instruments and ECG electrodes to
distributors. Unfavorable foreign currency exchange rates (when
compared to the foreign currency exchange rates in the same period a year
ago) accounted for approximately $0.5 million of the
decrease. On a local currency basis, sales decreased
8.8%. We believe the decrease in sales is due to a general
slowdown in hospital spending as a result of the weak economic
environment. Patient Care sales increased $1.7 million (2.2%)
in 2008 to $78.4 million compared to $76.7 million in 2007 on increased
sales of defibrillator pads and ECG electrodes. Foreign
currency exchange rates (when compared to the foreign currency exchange
rates in the same period a year ago) did not have a significant impact on
sales.
|
|
|
·
|
Operating
margins as a percentage of net sales decreased 4.7% percentage points to
-1.8% in 2009 compared to 2.9% in 2008. The decreases in operating margins
are primarily due to decreases in gross margins of 1.7 percentage points
on lower sales volumes in 2009 compared to 2008. Higher selling
and relatively fixed administrative costs (4.3 percentage points)
accounted for the remaining increase and were offset by decreased research
and development spending (1.3 percentage points) on our Endotracheal
Cardiac Output Monitor (“ECOM”)
project.
|
|
|
·
|
Operating
margins as a percentage of net sales increased 0.3% percentage points to
2.9% in 2008 compared to 2.6% in 2007. The increases in operating margins
are primarily due to increases in gross margins of 3.1 percentage points
in 2008 compared to 2007 as a result of higher selling prices and lower
production variances offset by increased research and development costs
(2.1 percentage points) associated with our Endotracheal
Cardiac Output Monitor (“ECOM”) project and higher selling and
administrative costs (0.7 percentage
points).
|
CONMED
Endoscopic Technologies
|
2007
|
2008
|
2009
|
||||||||||
|
Net
sales
|
$ | 52,743 | $ | 51,278 | $ | 48,941 | ||||||
|
Income
(loss) from operations
|
(6,250 | ) | (7,411 | ) | (7,904 | ) | ||||||
|
Operating
margin
|
(11.8 | %) | (14.5 | %) | (16.2 | %) | ||||||
Product
offerings include a comprehensive line of minimally invasive endoscopic
diagnostic and therapeutic instruments used in procedures which require
examination of the digestive tract.
-49-
|
|
·
|
Endoscopic
Technologies net sales declined $2.4 million (-4.7%) in 2009 to $48.9
million from $51.3 million in 2008 principally due to decreased sales of
disposable biopsy forceps. Unfavorable foreign currency
exchange rates (when compared to the foreign currency exchange rates in
the same period a year ago) accounted for approximately $1.4 million of
the decrease. On a local currency basis, sales decreased
1.9%. We believe the decrease in sales is due to a general
slowdown in hospital spending as a result of the weak economic
environment. Endoscopic Technologies net sales declined $1.4
million (-2.7%) in 2008 to $51.3 million from $52.7 million in 2007,
principally due to decreased sales of forceps and pulmonary products as a
result of production and operational issues which resulted in product
shortages and backorders during the first half of
2008. Unfavorable foreign currency exchange rates (when
compared to the foreign currency exchange rates in the same period a year
ago) decreased sales approximately $0.2 million. On a local
currency basis, sales decreased
2.3%
|
|
|
·
|
Operating
margins as a percentage of net sales decreased 1.7 percentage points to
(-16.2%) in 2009 from (-14.5%) in 2008. The decrease in
operating margins of 1.7 percentage points in 2009 is primarily due to
charges associated with the consolidation of divisional administrative
offices from Chelmsford, Massachusetts to our Corporate Headquarters in
Utica, New York (8.3 percentage points); see Note 11 to the
Consolidated Financial Statements. This increase in cost was
partially offset by higher gross margins (2.3 percentage points), lower
research and development spending of (2.5 percentage points) and overall
lower spending in selling and administrative expenses (1.8 percentage
points) as a result of our continued efforts to improve the profitability
of the business.
|
|
|
·
|
Operating
margins as a percentage of net sales decreased 2.7 percentage points to
(-14.5%) in 2008 from (-11.8%) in 2007. The decrease in
operating margins of 2.7 percentage points in 2008 is primarily due to
decreases in gross margins of 5.4 percentage points as a result of
increased production costs and pricing pressures as well as higher selling
and administrative expenses as a percentage of sales (0.9 percentage
points) offset by decreased research and development spending as a
percentage of sales (0.7 percentage points) and the charge in 2007
associated with the closure of a sales office in France (2.9 percentage
points).
|
Liquidity
and Capital Resources
Our
liquidity needs arise primarily from capital investments, working capital
requirements and payments on indebtedness under our senior credit
agreement. We have historically met these liquidity requirements with
funds generated from operations, including sales of accounts receivable and
borrowings under our revolving credit facility. In addition, we use
term borrowings, including borrowings under our senior credit agreement and
borrowings under separate loan facilities, in the case of real property
purchases, to finance our acquisitions. We also have the ability to
raise funds through the sale of stock or we may issue debt through a private
placement or public offering. We generally attempt to minimize our
cash balances on-hand and use available cash to pay down debt or repurchase our
common stock.
-50-
Operating
cash flows
Our net
working capital position was $246.5 million at December 31, 2009. Net
cash provided by operating activities was $65.9 million in 2007, $61.1 million
in 2008 and $25.0 million in 2009, generated on net income of $38.5 million in
2007, $40.0 million in 2008 and $12.1 million in 2009. The decline in
operating cash flows for 2009 is due in part to a $27.9 million decline in net
income compared to 2008. In addition, during 2009 we reduced sales of
accounts receivable under our accounts receivable sales agreement by $13.0
million, thus reducing operating cash flows by $13.0 million, or $10.0 million
more than in the previous year.
Investing
cash flows
Capital
expenditures were $20.9 million, $35.9 million and $21.4 million in 2007, 2008
and 2009, respectively. Capital expenditures are expected to
approximate $22.0 million in 2010.
The
decrease in capital expenditures in 2009 compared to 2008 is due to the
completion during the second quarter of 2009 of the implementation of an
enterprise business software application as well as certain other infrastructure
improvements related to our restructuring efforts as more fully described in
Note 17 and in “Restructuring” below.
During
2008, we purchased our Italian distributor (the “Italy acquisition”) for $21.8
million. See Note 15 to the Consolidated Financial Statements for
further discussion of the Italy acquisition. The purchase of a
business and a purchase price adjustment resulted in payments totaling $5.9
million in 2007.
Financing
cash flows
Net cash
used in financing activities during 2009 consisted of the
following: $1.2 million in proceeds from the issuance of common stock
under our equity compensation plans and employee stock purchase plan (See Note 7
to the Consolidated Financial Statements), $6.0 million in borrowings on our
revolver under our senior credit agreement, $1.4 million in repayments of term
borrowings under our senior credit agreement, $1.4 million in repayments on our
mortgage notes, a $1.2 million net change in cash overdrafts, and a $7.8 million
repurchase of our 2.50% convertible senior subordinated notes. See
Note 5 to the Consolidated Financial Statements for further discussion of the
repurchase of the Notes.
Our
$235.0 million senior credit agreement (the "senior credit agreement”) consists
of a $100.0 million revolving credit facility and a $135.0 million term loan.
There were $10.0 million in borrowings outstanding on the revolving credit
facility as of December 31, 2009. Our available borrowings on the
revolving credit facility at December 31, 2009 were $81.6 million with
approximately $8.4 million of the facility set aside for outstanding letters of
credit. There were $56.3 million in borrowings outstanding on the
term loan at December 31, 2009.
Borrowings
outstanding on the revolving credit facility are due and payable on April 12,
2011. The scheduled principal payments on the term loan portion of
the senior credit agreement are $1.4 million annually through December 2011,
increasing to $53.6 million in 2012 with the remaining balance outstanding due
and payable on April 12, 2013. We may also be required, under certain
circumstances, to make additional principal payments based on excess cash flow
as defined in the senior credit agreement. Interest rates on the term
loan portion of the senior credit agreement are at LIBOR plus 1.50% (1.75% at
December 31, 2009) or an alternative base rate; interest rates on the revolving
credit facility portion of the senior credit agreement are at LIBOR plus 1.50%
or an alternative base rate (3.625% at December 31, 2009). For those
borrowings where the Company elects to use the alternative base rate, the base
rate will be the greater of the Prime Rate or the Federal Funds Rate in effect
on such date plus 0.50%, plus a margin of 0.50% for term loan borrowings or
0.25% for borrowings under the revolving credit facility.
-51-
The
senior credit agreement is collateralized by substantially all of our personal
property and assets, except for our accounts receivable and related rights which
are pledged in connection with our accounts receivable sales
agreement. The senior credit agreement contains covenants and
restrictions which, among other things, require the maintenance of certain
financial ratios, and restrict dividend payments and the incurrence of certain
indebtedness and other activities, including acquisitions and
dispositions. We were in full compliance with these covenants and
restrictions as of December 31, 2009. We are also required, under certain
circumstances, to make mandatory prepayments from net cash proceeds from any
issuance of equity and asset sales.
We have a
mortgage note outstanding in connection with the property and facilities
utilized by our CONMED Linvatec subsidiary bearing interest at 8.25% per annum
with semiannual payments of principal and interest through June
2019. The principal balance outstanding on the mortgage note
aggregated $11.3 million at December 31, 2009. The mortgage note is
collateralized by the CONMED Linvatec property and facilities.
We have
outstanding $115.1 million in 2.50% convertible senior subordinated notes due
2024 (“the Notes”). During the year ended December 31, 2008, we
repurchased and retired $25.0 million of the Notes for $20.2 million and
recorded a gain on the early extinguishment of debt of $1.9 million net of the
write-off of $0.4 million in unamortized deferred financing costs and $2.4
million in unamortized debt discount. During the year ended December
31, 2009, we repurchased and retired $9.9 million of the Notes for $7.8 million
and recorded a gain on the early extinguishment of debt of $1.1 million net of
the write-offs of $0.1 million in unamortized deferred financing costs and $1.0
million in unamortized debt discount. The Notes represent
subordinated unsecured obligations and are convertible under certain
circumstances, as defined in the bond indenture, into a combination of cash and
CONMED common stock. Upon conversion, the holder of each Note will
receive the conversion value of the Note payable in cash up to the principal
amount of the Note and CONMED common stock for the Note’s conversion value in
excess of such principal amount. Amounts in excess of the principal
amount are at an initial conversion rate, subject to adjustment, of 26.1849
shares per $1,000 principal amount of the Note (which represents an initial
conversion price of $38.19 per share). As of December 31, 2009, there
was no value assigned to the conversion feature because the Company’s share
price was below the conversion price. The Notes mature on November
15, 2024 and are not redeemable by us prior to November 15,
2011. Holders of the Notes have the right to put to us some or all of
the Notes for repurchase on November 15, 2011, 2014 and 2019 and, provided
the terms of the indenture are satisfied, we will be required to repurchase
those Notes.
The Notes
contain two embedded derivatives. The embedded derivatives are
recorded at fair value in other long-term liabilities and changes in their value
are recorded through the consolidated statements of operations. The
embedded derivatives have a nominal value, and it is our belief that any change
in their fair value would not have a material adverse effect on our business,
financial condition, results of operations, or cash flows.
Our Board
of Directors has authorized a share repurchase program under which we may
repurchase up to $100.0 million of our common stock, although no more than $50.0
million may be purchased in any calendar year. We did not repurchase
any shares during 2009. In the past, we have financed the repurchases
and may finance additional repurchases through the proceeds from the issuance of
common stock under our stock option plans, from operating cash flow and
from available borrowings under our revolving credit facility.
-52-
Management
believes that cash flow from operations, including accounts receivable sales,
cash and cash equivalents on hand and available borrowing capacity under our
senior credit agreement will be adequate to meet our anticipated operating
working capital requirements, debt service, funding of capital expenditures and
common stock repurchases in the foreseeable future. See “Item 1. Business –
Forward Looking Statements.”
Off-Balance
Sheet Arrangements
We have
an accounts receivable sales agreement pursuant to which we and certain of our
subsidiaries sell on an ongoing basis certain accounts receivable to CONMED
Receivables Corporation (“CRC”), a wholly-owned, bankruptcy-remote,
special-purpose subsidiary of CONMED Corporation. CRC may in turn
sell up to an aggregate $40.0 million undivided percentage ownership interest in
such receivables (the “asset interest”) to a bank (the
“purchaser”). The purchaser’s share of collections on accounts
receivable are calculated as defined in the accounts receivable sales agreement,
as amended. Effectively, collections on the pool of receivables flow
first to the purchaser and then to CRC, but to the extent that the purchaser’s
share of collections may be less than the amount of the purchaser’s asset
interest, there is no recourse to CONMED or CRC for such
shortfall. For receivables which have been sold, CONMED Corporation
and its subsidiaries retain collection and administrative responsibilities as
agent for the purchaser. As of December 31, 2008 and 2009, the
undivided percentage ownership interest in receivables sold by CRC to the
purchaser aggregated $42.0 million and $29.0 million, respectively, which has
been accounted for as a sale and reflected in the balance sheet as a reduction
in accounts receivable. Expenses associated with the sale of accounts
receivable, including the purchaser’s financing costs to purchase the accounts
receivable, were $2.9 million, $1.7 million and $0.5 million, in 2007, 2008 and
2009, respectively, and are included in interest expense.
There are
certain statistical ratios, primarily related to sales dilution and losses on
accounts receivable, which must be calculated and maintained on the pool of
receivables in order to continue selling to the purchaser. The pool
of receivables is in compliance with these ratios. Management
believes that additional accounts receivable arising in the normal course of
business will be of sufficient quality and quantity to meet the requirements for
sale under the accounts receivables sales agreement. In the event
that new accounts receivable arising in the normal course of business do not
qualify for sale, then collections on sold receivables will flow to the
purchaser rather than being used to fund new receivable purchases. To
the extent that such collections would not be available to CONMED in the form of
new receivables purchases, we would need to access an alternate source of
working capital, such as our $100 million revolving credit
facility. Our accounts receivable sales agreement, as amended, also
requires us to obtain a commitment (the “purchaser commitment”) from the
purchaser to fund the purchase of our accounts receivable. The
purchaser commitment was amended effective October 30, 2009 whereby the purchase
commitment was decreased from $50.0 million to $40.0 million and extended
through October 29, 2010 under otherwise substantially the same terms and
conditions.
In June
2009, the FASB issued guidance which requires additional disclosures about the
transfer and derecognition of financial assets, eliminates the concept of
qualifying special-purpose entities, creates more stringent conditions for
reporting a transfer of a portion of a financial asset as a sale, clarifies
other sale-accounting criteria, and changes the initial measurement of a
transferor’s interest in transferred financial assets. This guidance is
effective for fiscal years beginning after November 15, 2009. As a
result of this new guidance, our accounts receivable sales agreement will no
longer be permitted to be accounted for as a sale and reduction in accounts
receivable beginning in 2010. As a result, accounts receivable sold
under the agreement will be recorded as additional borrowings rather than as a
reduction in accounts receivable.
-53-
Restructuring
During
2009, we completed the first phase of our operational restructuring plan which
we had previously announced in the second quarter of 2008. The
restructuring included the closure of two manufacturing facilities located in
the Utica, New York area totaling approximately 200,000 square feet with
manufacturing transferred into either our Corporate headquarters location in
Utica, New York or into a newly constructed leased manufacturing facility in
Chihuahua, Mexico. In addition, manufacturing previously done by a
contract manufacturing facility in Juarez, Mexico was transferred in-house to
the Chihuahua facility. Finally, certain domestic distribution
activities were centralized in a new leased consolidated distribution center in
Atlanta, Georgia. We believe our restructuring will reduce our cost
base by consolidating our Utica, New York operations into a single facility and
expanding our lower cost Mexican operations, as well as improve service to our
customers by shipping orders from more centralized distribution
centers. The closure of the two manufacturing facilities,
consolidation of distribution activities and the first phase of transitioning
manufacturing operations was substantially complete as of December 31,
2009. We expect the completion of the first phase of our operational
restructuring plan to yield annual cost savings of approximately $3.0 - $5.0
million beginning in 2010.
During
2010, we plan to enter into the second phase of our restructuring plan which
contemplates transferring additional production lines from Utica, New York to
our manufacturing facility in Chihuahua, Mexico. We expect to incur
$2.5 million in costs associated with the second phase of our restructuring plan
which we expect to yield annual cost savings of approximately $1.5 million
beginning in 2011.
In
conjunction with our restructuring plan, we considered FASB guidance which
requires that long-lived assets be tested for recoverability whenever events or
changes in circumstances indicate that their carrying amount may not be
recoverable. As a result of our restructuring, two manufacturing
facilities located in the Utica, New York area were closed prior to the end of
their previously estimated useful lives. We determined one facility
did not have any value and therefore recorded a $0.5 million charge for the
remaining net book value of the facility in the fourth quarter of
2009. We plan to sell or lease the second facility and have tested it
for impairment under the guidance for long-lived assets to be held and
used. We performed our impairment testing on the second facility by
comparing future cash flows expected to be generated by this facility
(undiscounted and without interest charges) against the carrying amount ($2.1
million as of December 31, 2009). Since future cash flows expected to
be generated by the second facility exceed its carrying amount, we do not
believe any impairment exists at this time. However, we cannot be
certain an impairment charge will not be required in the future.
As of
December 31, 2009, we have incurred $18.6 million (including $4.1 million and
$14.5 million, in the years ended December 31, 2008 and 2009, respectively) in
costs associated with our restructuring.
-54-
Approximately
$14.3 million (including $2.5 million and $11.8 million in the years ended
December 31, 2008 and 2009, respectively) of the total $18.6 million in
restructuring costs have been charged to cost of goods sold. The
$14.3 million charged to cost of goods sold includes $6.1 million in under
utilization of production facilities (including $1.2 million and $4.9 million,
in the years ended December 31, 2008 and 2009, respectively), $2.4 million in
accelerated depreciation (including $0.3 million and $2.1 million, in the years
ended December 31, 2008 and 2009, respectively), $2.1 million in severance
related charges (including $0.1 million and $2.0 million, in the years ended
December 31, 2008 and 2009, respectively), and $3.7 million in other charges
(including $0.9 million and $2.8 million, in the years ended December 31, 2008
and 2009, respectively).
The
remaining $4.3 million (including $1.6 million and $2.7 million, in the years
ended December 31, 2008 and 2009, respectively) in restructuring costs have been
recorded in other expense and primarily include severance, lease and other
charges related to the consolidation of our distribution centers.
As the
second phase of our restructuring plan progresses, we will incur additional
charges, including employee termination and other exit costs. Based
on the criteria contained within FASB guidance, no accrual for such costs has
been made at this time.
We
estimate the total costs of the second phase of our restructuring plan will
approximate $2.5 million during 2010, including $1.3 million related to employee
termination costs and $1.2 million in other restructuring related activities. We
expect these restructuring costs will be charged to cost of goods
sold. The second phase of the restructuring plan impacts Corporate
manufacturing facilities which support multiple reporting
segments. As a result, costs associated with the second phase of our
restructuring plan will be reflected in the Corporate line within our business
segment reporting.
Contractual
Obligations
The
following table summarizes our contractual obligations for the next five years
and thereafter (amounts in thousands). Purchase obligations represent
purchase orders for goods and services placed in the ordinary course of
business. There were no capital lease obligations as of December
31, 2009.
|
Payments
Due by Period
|
||||||||||||||||||||
|
Less
than
|
1-3 | 3-5 |
More
than
|
|||||||||||||||||
|
Total
|
1 Year
|
Years
|
Years
|
5 Years
|
||||||||||||||||
|
Long-term
debt
|
$ | 192,692 | $ | 2,174 | $ | 66,800 | $ | 2,190 | $ | 121,528 | ||||||||||
|
Purchase
obligations
|
51,702 | 51,173 | 529 | - | - | |||||||||||||||
|
Operating
lease obligations
|
37,538 | 6,456 | 10,516 | 8,030 | 12,536 | |||||||||||||||
|
Total
contractual
|
||||||||||||||||||||
|
obligations
|
$ | 281,932 | $ | 59,803 | $ | 77,845 | $ | 10,220 | $ | 134,064 | ||||||||||
-55-
In
addition to the above contractual obligations, we are required to make periodic
interest payments on our long-term debt obligations; (see additional discussion
under Item 7A. “Quantitative and Qualitative Disclosures About Market
Risk—Interest Rate Risk” and Note 5 to the Consolidated Financial
Statements). The above table does not include required contributions
to our pension plan in 2010, which are expected to be approximately $3.0
million. (See Note 9 to the Consolidated Financial
Statements). The above table also does not include unrecognized tax
benefits of approximately $1.0 million, the timing and certainty of recognition
for which is not known. (See Note 6 to the Consolidated Financial
Statements).
Stock-based
Compensation
We have
reserved shares of common stock for issuance to employees and directors under
three shareholder-approved share-based compensation plans (the
"Plans"). The Plans provide for grants of options, stock appreciation
rights (“SARs”), dividend equivalent rights, restricted stock, restricted stock
units (“RSUs”), and other equity-based and equity-related awards. The
exercise price on all outstanding options and SARs is equal to the quoted fair
market value of the stock at the date of grant. RSUs are valued at
the market value of the underlying stock on the date of grant. Stock
options, SARs and RSUs are non-transferable other than on death and generally
become exercisable over a five year period from date of grant. Stock
options and SARs expire ten years from date of grant. SARs are only
settled in shares of the Company’s stock. (See Note 7 to the
Consolidated Financial Statements).
New
Accounting Pronouncements
See Note
14 to the Consolidated Financial Statements for a discussion of new accounting
pronouncements.
Item 7A. Quantitative and Qualitative Disclosures About
Market Risk
Market
risk is the potential loss arising from adverse changes in market rates and
prices such as commodity prices, foreign currency exchange rates and interest
rates. In the normal course of business, we are exposed to various
market risks, including changes in foreign currency exchange rates and interest
rates. We manage our exposure to these and other market risks through
regular operating and financing activities and as necessary through the use of
derivative financial instruments.
Foreign
currency risk
Approximately
45% of our total 2009 consolidated net sales were to customers outside the
United States. We have sales subsidiaries in a significant number of
countries in Europe as well as Australia, Canada and Korea. In those
countries in which we have a direct presence, our sales are denominated in the
local currency amounting to approximately 30% of our total net sales in
2009. The remaining 15% of sales to customers outside the United
States was on an export basis and transacted in United States
dollars.
Because a
significant portion of our operations consist of sales activities in foreign
jurisdictions, our financial results may be affected by factors such as changes
in foreign currency exchange rates or weak economic conditions in the markets in
which we distribute products. During 2009, changes in foreign
currency exchange rates decreased sales by approximately $20.4 million and
income before income taxes by approximately $13.6 million.
-56-
We manage
our foreign currency transaction risks through the use of forward contracts to
hedge forecasted cash flows associated with foreign currency transaction
exposures. We account for these forward contracts as cash flow
hedges. To the extent these forward contracts meet hedge accounting
criteria, changes in their fair value are not included in current earnings but
are included in accumulated other comprehensive income (loss). These
changes in fair value will be reclassified into earnings as a component of sales
when the forecasted transaction occurs. The notional contract amounts
for forward contracts outstanding at December 31, 2009 which have been accounted
for as cash flow hedges totaled $80.2 million. Net realized losses
recognized for forward contracts accounted for as cash flow hedges approximated
$0.4 million for the year ended December 31, 2009. Net unrealized
gains on forward contracts outstanding which have been accounted for as cash
flow hedges and which have been included in accumulated other comprehensive
income (loss) totaled $0.1 million at December 31, 2009. These
unrealized gains will be recognized in income in 2010.
We also
enter into forward contracts to exchange foreign currencies for United States
dollars in order to hedge our currency transaction exposures
on intercompany receivables denominated in foreign
currencies. These forward contracts settle each month at month-end,
at which time we enter into new forward contracts. We have not
designated these forward contracts as hedges and have not applied hedge
accounting to them. The notional contract amounts for forward
contracts outstanding at December 31, 2009 which have not been designated as
hedges totaled $28.6 million. Net realized losses recognized in
connection with those forward contracts not accounted for as hedges approximated
$3.9 million for the year ended December 31, 2009, offsetting gains on our
intercompany receivables of $4.6 million for the year ended December 31,
2009. These gains and losses have been recorded in selling and
administrative expense in the Consolidated Statements of
Operations.
We record
these forward foreign exchange contracts at fair value; the fair
value for forward foreign exchange contracts outstanding at December 31, 2009
was $0.1 million and is included in Prepaid Expenses and Other Current Assets in
the Consolidated Balance Sheets.
Refer to
Note 13 in the Consolidated Financial Statements for further
discussion.
Interest
rate risk
At
December 31, 2009, we had approximately $66.3 million of variable rate long-term
debt outstanding under our senior credit agreement and an additional $29.0
million in accounts receivable sold under our accounts receivable sales
agreement; we are not a party to any interest rate swap agreements as of
December 31, 2009. Assuming no repayments other than our 2009
scheduled term loan payments, if market interest rates for similar borrowings
and accounts receivable sales averaged 1.0% more in 2010 than they did in 2009,
interest expense would increase, and income before income taxes would decrease
by $0.9 million. Comparatively, if market interest rates for similar
borrowings average 1.0% less in 2010 than they did in 2009, our interest expense
would decrease, and income before income taxes would increase by $1.1
million.
Item 8. Financial Statements and Supplementary
Data
Our 2009
Financial Statements are included elsewhere herein.
-57-
|
Item 9.
|
Changes
In and Disagreements with Accountants on Accounting and Financial
Disclosures
|
There
were no changes in or disagreement with accountants on accounting and financial
disclosure.
As of the end of the period covered by
this report, an evaluation was carried out by CONMED Corporation’s management,
with the participation of our Chief Executive Officer and Chief Financial
Officer, of the effectiveness of our disclosure controls and procedures (as
defined in Rule 13a-15(e) under the Securities Exchange Act of
1934). Based upon that evaluation, our Chief Executive Officer and
Chief Financial Officer concluded that these disclosure controls and procedures
were effective as of the end of the period covered by this report. In
addition, no change in our internal control over financial reporting (as defined
in Rule 13a-15(f) under the Securities Exchange Act of 1934) occurred during the
fourth quarter of the year ended December 31, 2009 that has materially affected,
or is reasonably likely to materially affect, our internal control over
financial reporting.
Management’s
Report on Internal Control over Financial Reporting and the Report of
Independent Registered Public Accounting Firm thereon are set forth in Part IV,
Item 15 of the Annual Report on Form 10-K.
Not applicable.
-58-
PART III
Item
10. Directors, Executive Officers and Corporate
Governance
The
information required by this item is incorporated herein by reference to the
sections captioned “Proposal One: Election of Directors” and “Directors,
Executive Officers, Senior Officers, and Nominees for the Board of Directors” in
CONMED Corporation’s definitive Proxy Statement or other informational filing to
be filed with the Securities and Exchange Commission on or about April 9,
2010.
Item
11. Executive Compensation
The
information required by this item is incorporated herein by reference to the
sections captioned “Compensation Discussion and Analysis”, “Summary Compensation
Table”, “Grants of Plan-Based Awards”, “Outstanding Equity Awards at Fiscal
Year-End”, “Option Exercises and Stock Vested”, “Pension Benefits”,
“Non-Qualified Deferred Compensation”, “Potential Payments upon Termination or
Change-in-Control”, “Director Compensation” and “Board of Directors Interlocks
and Insider Participation; Certain Relationships and Related Transactions” in
CONMED Corporation’s definitive Proxy Statement or other informational filing to
be filed with the Securities and Exchange Commission on or about April 9,
2010.
Item
12. Security
Ownership of Certain Beneficial Owners and Management and Related Stockholder
Matters
The
information required by this item is incorporated herein by reference to the
section captioned “Security Ownership of Certain Beneficial Owners and
Management” in CONMED Corporation’s definitive Proxy Statement or other
informational filing to be filed with the Securities and Exchange Commission on
or about April 9, 2010.
Item
13. Certain
Relationships and Related Transactions, and Director
Independence
The
information required by this item is incorporated herein
by reference to the section captioned “Board of Directors Interlocks and Insider
Participation; Certain Relationships and Related Transactions” in CONMED
Corporation’s definitive Proxy Statement or other informational filing to be
filed with the Securities and Exchange Commission on or about April 9,
2010.
Item
14. Principal
Accounting Fees and Services
The
information required by this item is incorporated herein
by reference to the section captioned “Principal Accounting Fees and Services”
in CONMED Corporation’s definitive Proxy Statement or other informational filing
to be filed with the Securities and Exchange Commission on or about April 9,
2010.
-59-
PART IV
Item
15. Exhibits, Financial Statement
Schedules
|
Index
to Financial Statements
|
|||
|
(a)(1)
|
List
of Financial Statements
|
Page in Form 10-K
|
|
|
Management’s
Report on Internal Control Over Financial Reporting
|
67
|
||
|
Report
of Independent Registered Public Accounting Firm
|
68
|
||
|
Consolidated
Balance Sheets at December 31, 2008 and 2009
|
70
|
||
|
Consolidated
Statements of Operations for the Years Ended December 31, 2007, 2008 and
2009
|
71
|
||
|
Consolidated
Statements of Shareholders’ Equity for the Years Ended December 31, 2007,
2008 and 2009
|
72
|
||
|
Consolidated
Statements of Cash Flows for the Years Ended December 31, 2007, 2008 and
2009
|
74
|
||
|
Notes
to Consolidated Financial Statements
|
76
|
||
|
(2)
|
List
of Financial Statement Schedules
|
||
|
Valuation
and Qualifying Accounts (Schedule II)
|
112
|
||
|
All
other schedules have been omitted because they are not applicable, or the
required information is shown in the financial statements or notes
thereto.
|
|||
|
(3)
|
List
of Exhibits
|
||
|
The
exhibits listed on the accompanying Exhibit Index on page 62 below are
filed as part of this Form 10-K.
|
|||
-60-
SIGNATURES
Pursuant
to the requirements of Section 13 or 15(d) of the Securities Exchange Act of
1934, the registrant has duly caused this report to be signed on its behalf by
the undersigned, thereunto duly authorized on the date indicated
below.
|
CONMED
CORPORATION
|
|
|
By:
/s/ Joseph J.
Corasanti
|
|
|
Joseph
J. Corasanti
|
|
|
(President
and Chief
|
|
|
Executive
Officer)
|
|
|
Date: February
25, 2010
|
Pursuant
to the requirements of the Securities Act of 1934, this report has been signed
below by the following persons on behalf of the registrant and in the capacities
and on the dates indicated.
|
Signature
|
Title
|
Date
|
|
/s/
EUGENE R. CORASANTI
|
Chairman
of the Board
of
Directors
|
February
25,2010
|
|
Eugene
R. Corasanti
|
||
|
/s/
JOSEPH J. CORASANTI
|
President,
Chief Executive
Officer
and Director
|
February
25,2010
|
|
Joseph
J. Corasanti
|
||
|
/s/
ROBERT D. SHALLISH, JR.
|
Vice
President-Finance
and
Chief Financial Officer
(Principal
Financial Officer)
|
February
25,2010
|
|
Robert
D. Shallish, Jr.
|
||
|
/s/
LUKE A. POMILIO
|
Vice
President – Corporate
Controller
(Principal
Accounting
Officer)
|
February
25,2010
|
|
Luke
A. Pomilio
|
||
|
/s/
BRUCE F. DANIELS
|
Director
|
February
25,2010
|
|
Bruce
F. Daniels
|
||
|
/s/
Jo ANN GOLDEN
|
Director
|
February
25,2010
|
|
Jo
Ann Golden
|
||
|
/s/
STEPHEN M. MANDIA
|
Director
|
February
25,2010
|
|
Stephen
M. Mandia
|
||
|
/s/
STUART J. SCHWARTZ
|
Director
|
February
25,2010
|
|
Stuart
J. Schwartz
|
||
|
/s/
MARK E. TRYNISKI
|
Director
|
February
25,2010
|
|
Mark
E. Tryniski
|
-61-
Exhibit
Index
|
Exhibit
No.
|
Description
|
||
|
3.1
|
-
|
Amended
and Restated By-Laws, as adopted by the Board of Directors on November 5,
2007 (Incorporated by reference to the Company’s Current Report on Form
10-Q filed with the Securities and Exchange Commission on November 5,
2007).
|
|
|
3.2
|
-
|
1999
Amendment to Certificate of Incorporation and Restated Certificate of
Incorporation of CONMED Corporation (Incorporated by reference to Exhibit
3.2 of the Company’s Annual Report on Form 10-K for the year ended
December 31, 1999).
|
|
|
4.1
|
-
|
See
Exhibit 3.1.
|
|
|
4.2
|
-
|
See
Exhibit 3.2.
|
|
|
4.3
|
-
|
Guarantee
and Collateral Agreement, dated August 28, 2002, made by CONMED
Corporation and certain of its subsidiaries in favor of JP Morgan Chase
Bank (Incorporated by reference to Exhibit 10.2 of the Company’s
Quarterly
Report on Form 10-Q for the quarter ended September 30,
2002).
|
|
|
4.4
|
-
|
First
Amendment to Guarantee and Collateral Agreement, dated June 30, 2003, made
by CONMED Corporation and certain of its subsidiaries in favor of JP
Morgan Chase Bank and the several banks and other financial institutions
or entities from time to time parties thereto (Incorporated by reference
to Exhibit 10.2 of the Company’s Quarterly Report on Form 10-Q for the
quarter ended June 30, 2003).
|
|
|
4.5
|
-
|
Second
Amendment to Guarantee and Collateral Agreement, dated April 13, 2006,
made by CONMED Corporation and certain of its subsidiaries in favor of JP
Morgan Chase Bank and the several banks and other financial institutions
or entities from time to time parties thereto (Incorporated by reference
to the Company’s Current Report on Form 8-K filed with the Securities and
Exchange Commission on April 19, 2006).
|
|
|
4.6
|
-
|
Indenture
dated November 10, 2004 between CONMED Corporation and The Bank of New
York, as Trustee (Incorporated by reference to the Company’s Current
Report on Form 8-K filed with the Securities and Exchange Commission on
November 16, 2004).
|
|
|
10.1+
|
-
|
Employment
Agreement between the Company and Eugene R. Corasanti, dated October
31, 2006 (Incorporated by reference to Exhibit 10.2 of the Company’s
Current Report on Form 8-K filed with the Securities and Exchange
Commission on November 2, 2006).
|
|
-62-
|
Exhibit
No.
|
Description
|
|
|
10.2+
|
-
|
Amended
and restated Employment Agreement, dated October 30, 2009, by and between
CONMED Corporation and Joseph J. Corasanti, Esq. (Incorporated by
reference to the Exhibit 10.1 of the Company’s Quarterly Report on Form
10-Q for the quarter ended September 30, 2009).
|
|
10.3
|
-
|
1992
Stock Option Plan (including form of Stock Option Agreement) (Incorporated
by reference to the Company’s Annual Report on Form 10-K for the year
ended December 25, 1992).
|
|
10.4
|
-
|
Amended
and Restated Employee Stock Option Plan (including form of Stock Option
Agreement) (Incorporated by reference to Exhibit 10.6 of the
Company’s Annual Report on Form 10-K for the year ended
December 31, 1996).
|
|
10.5
|
-
|
Stock
Option Plan for Non-Employee Directors of CONMED Corporation (Incorporated
by reference to Exhibit 10.5 of the Company’s Annual Report on Form 10-K
for the year ended December 31, 1996).
|
|
10.6
|
-
|
Amendment
to Stock Option Plan for Non-employee Directors of CONMED Corporation
(Incorporated by reference to the Company’s Definitive Proxy Statement for
the 2002 Annual Meeting filed with the Securities and Exchange Commission
on April 17, 2002).
|
|
10.7
|
-
|
1999
Long-term Incentive Plan (Incorporated by reference to the Company’s
Definitive Proxy Statement for the 1999 Annual Meeting filed with the
Securities and Exchange Commission on April 16, 1999).
|
|
10.8
|
-
|
Amendment
to 1999 Long-term Incentive Plan (Incorporated by reference to the
Company’s Definitive Proxy Statement for the 2002 Annual Meeting filed
with the Securities and Exchange Commission on April 17,
2002).
|
|
10.9
|
-
|
2002
Employee Stock Purchase Plan (Incorporated by reference to the Company’s
Definitive Proxy Statement for the 2002 Annual Meeting filed with the
Securities and Exchange Commission on April 17, 2002).
|
|
10.10
|
-
|
Amendment
to CONMED Corporation 2002 Employee Stock Purchase Plan (Incorporated by
reference to Exhibit 10.11 of the Company’s Annual Report on Form 10-K for
the year ended December 31, 2005).
|
|
10.11
|
-
|
2006
Stock Incentive Plan (Incorporated by reference to Exhibit 4.3 of the
Company’s Registration Statement on Form S-8 on August 8,
2006)
|
|
10.12
|
-
|
2007
Non-Employee Director Equity Compensation Plan (Incorporated by reference
to Exhibit 4.3 of the Company’s Registration Statement on Form S-8 on
August 8, 2007)
|
-63-
|
Exhibit
No.
|
Description
|
|
|
10.13
|
-
|
Amended
and Restated 1999 Long Term Incentive Plan (Incorporated by reference to
Exhibit 4.3 of the Company’s Registration Statement on Form S-8 on
November 3, 2009)
|
|
10.14
|
-
|
Amended
and Restated Credit Agreement, dated April 13, 2006, among CONMED
Corporation, JP Morgan Chase Bank and the several banks and other
financial institutions or entities from time to time parties thereto
(Incorporated by reference to the Company’s Current Report on
Form 8-K filed with the Securities and Exchange Commission on April 19,
2006).
|
|
10.15
|
-
|
Registration
Rights Agreement, dated November 10, 2004, among CONMED
Corporation and UBS Securities LLC on behalf of Several Initial Purchasers
(Incorporated by reference to the Company’s Current Report on Form 8-K
filed with the Securities and Exchange Commission on November 16,
2004).
|
|
10.16
|
-
|
Purchase
and Sale Agreement dated November 1, 2001 among CONMED Corporation, et al
and CONMED Receivables Corporation (Incorporated by reference to Exhibit
10.2 of the Company’s Quarterly Report on Form 10-Q for the quarter ended
September 30, 2001).
|
|
10.17
|
-
|
Amendment
No. 1 dated October 23, 2003 to the Purchase and Sale Agreement dated
November 1, 2001 among CONMED Corporation, et al and CONMED Receivables
Corporation (Incorporated by reference to Exhibit 10.2 of the
Company’s Quarterly Report on Form 10-Q for the quarter ended September
30, 2003).
|
|
10.18
|
-
|
Amended
and Restated Receivables Purchase Agreement, dated October 23, 2003, among
CONMED Receivables Corporation, CONMED Corporation, and Fleet National
Bank (Incorporated by reference to Exhibit 10.1 of the
Company’s Quarterly Report on Form 10-Q for the quarter ended September
30, 2003).
|
|
10.19
|
-
|
Amendment
No. 1, dated October 20, 2004 to the Amended and Restated Receivables
Purchase Agreement, dated October 23, 2003, among CONMED Receivables
Corporation, CONMED Corporation and Fleet Bank (Incorporated by reference
to Exhibit 10.2 of the Company’s Quarterly Report on Form 10-Q for the
quarter ended September 30, 2004).
|
|
10.20
|
-
|
Amendment
No. 2, dated October 21, 2005 to the Amended and Restated Receivables
Purchase Agreement, dated October 23, 2003, among CONMED Receivables
Corporation, CONMED Corporation and Fleet Bank (Incorporated by reference
to Exhibit 10.1 of the Company’s Quarterly Report on Form 10-Q for the
quarter ended September 30, 2005).
|
-64-
|
Exhibit
No.
|
Description
|
|
|
10.21
|
Amendment
No. 3, dated October 24, 2006 to the Amended and Restated Receivables
Purchase Agreement, dated October 23, 2003, among CONMED Receivables
Corporation, CONMED Corporation and Fleet Bank (Incorporated by reference
to Exhibit 10.1 of the Company’s Current Report on Form 8-K dated October
30, 2006).
|
|
|
10.22
|
Amendment
No. 4, dated January 31, 2008 to the Amended and Restated Receivables
Purchase Agreement, dated October 23, 2003, among CONMED Receivables
Corporation, CONMED Corporation and Fleet Bank (Incorporated by reference
to Exhibit 10.1 of the Company’s Current Report on Form 8-K dated January
31, 2008).
|
|
|
10.23
|
Amendment
No. 5, dated October 30, 2009 to the Amended and Restated Receivables
Purchase Agreement, dated October 23, 2003, among CONMED Receivables
Corporation, CONMED Corporation and Fleet Bank (Incorporated by reference
to Exhibit 10.1 of the Company’s Current Report on Form 8-K dated October
30, 2009)
|
|
|
10.24
|
Change
in Control Severance Agreement for Joseph J. Corasanti (Incorporated by
reference to Exhibit 10.1 of the Company’s Quarterly Report on Form 10-Q
for the quarter ended June 30, 2008)
|
|
|
10.25
|
Change
in Control Severance Agreement for Robert D. Shallish, Jr. (Incorporated
by reference to Exhibit 10.2 of the Company’s Quarterly Report on Form
10-Q for the quarter ended June 30, 2008)
|
|
|
10.26
|
Change
in Control Severance Agreement for David A. Johnson (Incorporated by
reference to Exhibit 10.3 of the Company’s Quarterly Report on Form 10-Q
for the quarter ended June 30, 2008)
|
|
|
10.27
|
Change
in Control Severance Agreement for Daniel S. Jonas (Incorporated by
reference to Exhibit 10.4 of the Company’s Quarterly Report on Form 10-Q
for the quarter ended June 30, 2008)
|
|
|
10.28
|
Change
in Control Severance Agreement for Luke A. Pomilio (Incorporated by
reference to Exhibit 10.5 of the Company’s Quarterly Report on Form 10-Q
for the quarter ended June 30, 2008)
|
|
|
10.29
|
Executive
Severance Agreement for Joseph G. Darling (Incorporated by reference to
Exhibit 10.28 of the Company’s Annual Report on Form 10-K for the year
ended December 31, 2008)
|
|
|
14
|
Code
of Ethics. The CONMED code of ethics may be accessed via the
Company’s website at http://www.CONMED.com/
investor-ethics.htm
|
-65-
|
Exhibit
No.
|
Description
|
|
|
21*
|
Subsidiaries
of the Registrant.
|
|
|
23*
|
Consent
of Independent Registered Public Accounting Firm.
|
|
|
31.1*
|
Certification
of Joseph J. Corasanti pursuant to Rule 13a-15(f) and Rule 15d-15(f) of
the Securities Exchange Act, as adopted pursuant to Section 302 of the
Sarbanes-Oxley Act of 2002.
|
|
|
31.2*
|
Certification
of Robert D. Shallish, Jr. pursuant to Rule 13a-15(f) and Rule 15d-15(f)
of the Securities Exchange Act, as adopted pursuant to Section 302 of the
Sarbanes-Oxley Act of 2002.
|
|
|
32.1*
|
Certifications
of Joseph J. Corasanti and Robert D. Shallish, Jr. pursuant to 18 U.S.C.
Section 1350, as adopted pursuant to Section 906 of the Sarbanes-Oxley Act
of 2002.
|
|
|
*
Filed herewith
+
Management contract or compensatory plan or
arrangement.
|
-66-
MANAGEMENT’S
REPORT ON INTERNAL CONTROL
OVER
FINANCIAL REPORTING
The
management of CONMED Corporation is responsible for establishing and maintaining
adequate internal control over financial reporting. Internal control
over financial reporting is a process designed to provide reasonable assurance
regarding the reliability of financial reporting and the preparation of
financial statements for external reporting purposes in accordance with
generally accepted accounting principles. Our internal control over
financial reporting includes policies and procedures that pertain to the
maintenance of records that, in reasonable detail, accurately and fairly reflect
transactions and dispositions of assets; provide reasonable assurances that
transactions are recorded as necessary to permit preparation of financial
statements in accordance with accounting principles generally accepted in the
United States of America, and that receipts and expenditures are being made only
in accordance with authorizations of management and the directors of the
Company; and provide reasonable assurance regarding prevention or timely
detection of unauthorized acquisition, use or disposition of our assets that
could have a material effect on our financial statements. Because of
its inherent limitations, internal control over financial reporting may not
prevent or detect misstatements. Management assessed the
effectiveness of CONMED’s internal control over financial reporting as of
December 31, 2009. In making its assessment, management utilized the
criteria set forth by the Committee of Sponsoring Organizations of the Treadway
Commission (“COSO”) in “Internal Control-Integrated
Framework”. Management has concluded that based on its assessment,
CONMED’s internal control over financial reporting was effective as of December
31, 2009. The effectiveness of the Company’s internal control over
financial reporting as of December 31, 2009 has been audited by
PricewaterhouseCoopers LLP, an independent registered public accounting firm, as
stated in their report which appears herein.
/s/ Joseph J.
Corasanti
Joseph J.
Corasanti
President
and
Chief
Executive Officer
/s/ Robert D.
Shallish, Jr.
Robert D.
Shallish, Jr.
Vice
President-Finance and
Chief
Financial Officer
-67-
REPORT
OF INDEPENDENT REGISTERED PUBLIC ACCOUNTING FIRM
To the
Board of Directors and Shareholders of CONMED Corporation
In our
opinion, the consolidated financial statements listed in the index appearing
under Item 15(a)(1) present fairly, in all material respects, the financial
position of CONMED Corporation and its subsidiaries at December 31,
2009 and December 31, 2008, and the results of their operations and their
cash flows for each of the three years in the period ended December 31,
2009 in conformity
with accounting principles generally accepted in the United States of
America. In addition, in our opinion, the financial statement
schedule listed in the index appearing under Item 15(a)(2) presents
fairly, in all material respects, the information set forth therein when read in
conjunction with the related consolidated financial
statements. Also in our opinion, the Company maintained, in all
material respects, effective internal control over financial reporting as of
December 31, 2009, based on criteria established in Internal Control - Integrated
Framework issued by the Committee of Sponsoring Organizations of the
Treadway Commission (COSO). The Company's management is responsible
for these financial statements and financial statement schedule, for maintaining
effective internal control over financial reporting and for its assessment of
the effectiveness of internal control over financial reporting, included in the
accompanying "Management's Report On Internal Control Over Financial
Reporting". Our responsibility is to express opinions on these
financial statements, on the financial statement schedule, and on the Company's
internal control over financial reporting based on our integrated
audits. We conducted our audits in accordance with the standards of
the Public Company Accounting Oversight Board (United States). Those
standards require that we plan and perform the audits to obtain reasonable
assurance about whether the financial statements are free of material
misstatement and whether effective internal control over financial reporting was
maintained in all material respects. Our audits of the financial
statements included examining, on a test basis, evidence supporting the amounts
and disclosures in the financial statements, assessing the accounting principles
used and significant estimates made by management, and evaluating the overall
financial statement presentation. Our audit of internal control over
financial reporting included obtaining an understanding of internal control over
financial reporting, assessing the risk that a material weakness exists, and
testing and evaluating the design and operating effectiveness of internal
control based on the assessed risk. Our audits also included
performing such other procedures as we considered necessary in the
circumstances. We believe that our audits provide a reasonable basis for our
opinions.
As
discussed in Note 16 to the consolidated financial statements, the Company
changed the manner in which it accounts for convertible debt instruments
effective January 1, 2009.
-68-
A
company’s internal control over financial reporting is a process designed to
provide reasonable assurance regarding the reliability of financial reporting
and the preparation of financial statements for external purposes in accordance
with generally accepted accounting principles. A company’s internal
control over financial reporting includes those policies and procedures that
(i) pertain to the maintenance of records that, in reasonable detail,
accurately and fairly reflect the transactions and dispositions of the assets of
the company; (ii) provide reasonable assurance that transactions are
recorded as necessary to permit preparation of financial statements in
accordance with generally accepted accounting principles, and that receipts and
expenditures of the company are being made only in accordance with
authorizations of management and directors of the company; and
(iii) provide reasonable assurance regarding prevention or timely detection
of unauthorized acquisition, use, or disposition of the company’s assets that
could have a material effect on the financial statements.
Because
of its inherent limitations, internal control over financial reporting may not
prevent or detect misstatements. Also, projections of any evaluation
of effectiveness to future periods are subject to the risk that controls may
become inadequate because of changes in conditions, or that the degree of
compliance with the policies or procedures may deteriorate.
PricewaterhouseCoopers
LLP
Albany,
New York
February
25, 2010
-69-
CONMED
CORPORATION
CONSOLIDATED
BALANCE SHEETS
December
31, 2008 and 2009
(In
thousands except share and per share amounts)
|
As
Adjusted
|
||||||||
|
(Note
16)
|
||||||||
|
2008
|
2009
|
|||||||
|
ASSETS
|
||||||||
|
Current
assets:
|
||||||||
|
Cash
and cash equivalents
|
$ | 11,811 | $ | 10,098 | ||||
|
Accounts
receivable, less allowance for doubtful
|
||||||||
|
accounts
of $1,370 in 2008 and $1,175 in 2009
|
96,515 | 126,162 | ||||||
|
Inventories
|
159,976 | 164,275 | ||||||
|
Deferred
income taxes
|
13,514 | 14,782 | ||||||
|
Prepaid
expenses and other current assets
|
11,218 | 10,293 | ||||||
|
Total
current assets
|
293,034 | 325,610 | ||||||
|
Property,
plant and equipment, net
|
143,737 | 143,502 | ||||||
|
Deferred
income taxes
|
1,228 | 1,953 | ||||||
|
Goodwill
|
290,245 | 290,505 | ||||||
|
Other
intangible assets, net
|
195,939 | 190,849 | ||||||
|
Other
assets
|
7,478 | 5,994 | ||||||
|
Total
assets
|
$ | 931,661 | $ | 958,413 | ||||
|
LIABILITIES
AND SHAREHOLDERS' EQUITY
|
||||||||
|
Current
liabilities:
|
||||||||
|
Current
portion of long-term debt
|
$ | 3,185 | $ | 2,174 | ||||
|
Accounts
payable
|
35,887 | 26,210 | ||||||
|
Accrued
compensation and benefits
|
20,129 | 25,955 | ||||||
|
Income
taxes payable
|
1,279 | 677 | ||||||
|
Other
current liabilities
|
14,434 | 24,091 | ||||||
|
Total
current liabilities
|
74,914 | 79,107 | ||||||
|
Long-term
debt
|
182,739 | 182,195 | ||||||
|
Deferred
income taxes
|
88,468 | 97,916 | ||||||
|
Other
long-term liabilities
|
45,325 | 22,680 | ||||||
|
Total
liabilities
|
391,446 | 381,898 | ||||||
|
Commitments
and contingencies
|
||||||||
|
Shareholders'
equity:
|
||||||||
|
Preferred
stock, par value $.01 per share; authorized
|
||||||||
|
500,000
shares, none issued or outstanding
|
- | - | ||||||
|
Common
stock, par value $.01 per share; 100,000,000
|
||||||||
|
authorized;
31,299,203 issued
|
||||||||
|
in
2008 and 2009, respectively
|
313 | 313 | ||||||
|
Paid-in
capital
|
313,830 | 317,366 | ||||||
|
Retained
earnings
|
314,373 | 325,370 | ||||||
|
Accumulated
other comprehensive income (loss)
|
(31,032 | ) | (12,405 | ) | ||||
|
Less: Treasury
stock, at cost;
|
||||||||
|
2,274,822
and 2,149,832 shares in
|
||||||||
|
2008
and 2009, respectively
|
(57,269 | ) | (54,129 | ) | ||||
|
Total
shareholders' equity
|
540,215 | 576,515 | ||||||
|
Total
liabilities and shareholders' equity
|
$ | 931,661 | $ | 958,413 | ||||
See notes
to consolidated financial statements.
-70-
CONMED
CORPORATION
CONSOLIDATED
STATEMENTS OF OPERATIONS
Years
Ended December 31, 2007, 2008 and 2009
(In
thousands except per share amounts)
|
As
Adjusted
|
||||||||||||
|
(Note
16)
|
||||||||||||
|
2007
|
2008
|
2009
|
||||||||||
|
Net
sales
|
$ | 694,288 | $ | 742,183 | $ | 694,739 | ||||||
|
Cost
of sales
|
345,163 | 359,802 | 357,407 | |||||||||
|
Gross
profit
|
349,125 | 382,381 | 337,332 | |||||||||
|
Selling
and administrative expense
|
240,541 | 272,437 | 266,310 | |||||||||
|
Research
and development expense
|
30,400 | 33,108 | 31,837 | |||||||||
|
Other
expense (income)
|
(2,807 | ) | 1,577 | 10,916 | ||||||||
| 268,134 | 307,122 | 309,063 | ||||||||||
|
Income
from operations
|
80,991 | 75,259 | 28,269 | |||||||||
|
Gain
on early extinguishment of debt
|
- | 1,947 | 1,083 | |||||||||
|
Amortization
of debt discount
|
4,618 | 4,823 | 4,111 | |||||||||
|
Interest
expense
|
16,234 | 10,372 | 7,086 | |||||||||
|
Income
before income taxes
|
60,139 | 62,011 | 18,155 | |||||||||
|
Provision
for income taxes
|
21,595 | 22,022 | 6,018 | |||||||||
|
Net
income
|
$ | 38,544 | $ | 39,989 | $ | 12,137 | ||||||
|
Earnings
per share:
|
||||||||||||
|
Basic
|
$ | 1.36 | $ | 1.39 | $ | 0.42 | ||||||
|
Diluted
|
1.33 | 1.37 | 0.42 | |||||||||
See notes
to consolidated financial statements.
-71-
CONMED
CORPORATION
CONSOLIDATED
STATEMENTS OF SHAREHOLDERS' EQUITY
Years
Ended December 31, 2007, 2008 and 2009
(In
thousands)
As
Adjusted (Note 16)
|
Accumulated
|
||||||||||||||||||||||||||||
|
Other
|
||||||||||||||||||||||||||||
|
Common Stock
|
Paid-in
|
Retained
|
Comprehensive
|
Treasury
|
Shareholders’
|
|||||||||||||||||||||||
|
Shares
|
Amount
|
Capital
|
Earnings
|
Income (Loss)
|
Stock
|
Equity
|
||||||||||||||||||||||
|
Balance
at December 31, 2006
|
31,304 | $ | 313 | $ | 284,858 | $ | 247,425 | $ | (8,612 | ) | $ | (83,630 | ) | $ | 440,354 | |||||||||||||
|
Adjustment
for adoption
|
||||||||||||||||||||||||||||
|
of
FASB guidance related
|
||||||||||||||||||||||||||||
|
to
convertible debt
|
- | - | 21,808 | (5,614 | ) | - | - | 16,194 | ||||||||||||||||||||
|
Adjusted
balance at
|
||||||||||||||||||||||||||||
|
December
31, 2006
|
31,304 | $ | 313 | $ | 306,666 | $ | 241,811 | $ | (8,612 | ) | $ | (83,630 | ) | $ | 456,548 | |||||||||||||
|
Common
stock issued
|
||||||||||||||||||||||||||||
|
under
employee plans
|
(5 | ) | (662 | ) | (4,031 | ) | 16,048 | 11,355 | ||||||||||||||||||||
|
Tax
benefit arising from
|
||||||||||||||||||||||||||||
|
common
stock issued
|
||||||||||||||||||||||||||||
|
under
employee plans
|
(41 | ) | (41 | ) | ||||||||||||||||||||||||
|
Stock
based compensation
|
3,771 | 3,771 | ||||||||||||||||||||||||||
|
Comprehensive
income (loss):
|
||||||||||||||||||||||||||||
|
Foreign
currency
|
||||||||||||||||||||||||||||
|
translation
adjustments
|
5,284 | |||||||||||||||||||||||||||
|
Pension
liability
|
||||||||||||||||||||||||||||
|
(net
of income tax
|
||||||||||||||||||||||||||||
|
expense
of $1,654)
|
2,823 | |||||||||||||||||||||||||||
|
Net
income
|
38,544 | |||||||||||||||||||||||||||
|
Total
comprehensive
|
||||||||||||||||||||||||||||
|
Income
|
46,651
|
|||||||||||||||||||||||||||
|
Balance
at December 31, 2007
|
31,299 | $ | 313 | $ | 309,734 | $ | 276,324 | $ | (505 | ) | $ | (67,582 | ) | $ | 518,284 | |||||||||||||
|
Common
stock issued
|
||||||||||||||||||||||||||||
|
under
employee plans
|
(1,483 | ) | (1,940 | ) | 10,313 | 6,890 | ||||||||||||||||||||||
|
Tax
benefit arising from
|
||||||||||||||||||||||||||||
|
common
stock issued
|
||||||||||||||||||||||||||||
|
under
employee plans
|
1,630 | 1,630 | ||||||||||||||||||||||||||
|
Stock-based
compensation
|
4,178 | 4,178 | ||||||||||||||||||||||||||
|
Retirement
of 2.50%
|
||||||||||||||||||||||||||||
|
convertible
notes
|
(229 | ) | (229 | ) | ||||||||||||||||||||||||
-72-
CONMED
CORPORATION
CONSOLIDATED
STATEMENTS OF SHAREHOLDERS' EQUITY
Years
Ended December 31, 2007, 2008 and 2009
(In
thousands)
|
|
Accumulated
|
|||||||||||||||||||||||||||
|
Other
|
||||||||||||||||||||||||||||
|
Common
|
Stock
|
Paid-in
|
Retained
|
Comprehensive
|
Treasury
|
Shareholders’
|
||||||||||||||||||||||
|
Shares
|
Amount
|
Capital
|
Earnings
|
Income (Loss)
|
Stock
|
Equity
|
||||||||||||||||||||||
|
Comprehensive
income (loss):
|
||||||||||||||||||||||||||||
|
Foreign
currency
|
||||||||||||||||||||||||||||
|
translation
adjustments
|
(12,498 | ) | ||||||||||||||||||||||||||
|
Pension
liability
|
||||||||||||||||||||||||||||
|
(net
of income tax
|
||||||||||||||||||||||||||||
|
benefit
of $10,566)
|
(18,029 | ) | ||||||||||||||||||||||||||
|
Net
income
|
39,989 | |||||||||||||||||||||||||||
|
Total
comprehensive
|
||||||||||||||||||||||||||||
|
Income
|
9,462 | |||||||||||||||||||||||||||
|
Balance
at December 31, 2008
|
31,299 | $ | 313 | $ | 313,830 | $ | 314,373 | $ | (31,032 | ) | $ | (57,269 | ) | $ | 540,215 | |||||||||||||
|
Common
stock issued under
|
||||||||||||||||||||||||||||
|
employee
plans
|
(1,245 | ) | (1,140 | ) | 3,140 | 755 | ||||||||||||||||||||||
|
Tax
benefit arising from
|
||||||||||||||||||||||||||||
|
common
stock issued
|
||||||||||||||||||||||||||||
|
under
employee plans
|
561 | 561 | ||||||||||||||||||||||||||
|
Retirement
of 2.50%
|
||||||||||||||||||||||||||||
|
convertible
notes
|
(88 | ) | (88 | ) | ||||||||||||||||||||||||
|
Stock
based compensation
|
4,308 | 4,308 | ||||||||||||||||||||||||||
|
Comprehensive
income:
|
||||||||||||||||||||||||||||
|
Foreign
currency
|
||||||||||||||||||||||||||||
|
translation
adjustments
|
7,241 | |||||||||||||||||||||||||||
|
Pension
liability
|
||||||||||||||||||||||||||||
|
(net
of income tax
|
||||||||||||||||||||||||||||
|
expense
of $6,629)
|
11,310 | |||||||||||||||||||||||||||
|
Cash
flow hedging gain
|
||||||||||||||||||||||||||||
|
(net
of income tax
|
||||||||||||||||||||||||||||
|
expense
of $45)
|
76 | |||||||||||||||||||||||||||
|
Net
income
|
12,137 | |||||||||||||||||||||||||||
|
Total
comprehensive
|
||||||||||||||||||||||||||||
|
income
|
30,764 | |||||||||||||||||||||||||||
|
Balance
at December 31, 2009
|
31,299 | $ | 313 | $ | 317,366 | $ | 325,370 | $ | (12,405 | ) | $ | (54,129 | ) | $ | 576,515 | |||||||||||||
See notes
to consolidated financial statements.
-73-
CONMED
CORPORATION
CONSOLIDATED
STATEMENTS OF CASH FLOWS
Years
Ended December 31, 2007, 2008 and 2009
(In
thousands)
|
|
As
Adjusted
|
|||||||||||
|
|
(Note
16)
|
|||||||||||
|
|
2007
|
2008
|
2009
|
|||||||||
|
Cash
flows from operating activities:
|
||||||||||||
|
Net
income
|
$ | 38,544 | $ | 39,989 | $ | 12,137 | ||||||
|
Adjustments
to reconcile net income
|
||||||||||||
|
to
net cash provided by operating activities:
|
||||||||||||
|
Depreciation
|
13,101 | 14,641 | 18,651 | |||||||||
|
Amortization
of debt discount
|
4,618 | 4,823 | 4,111 | |||||||||
|
Amortization,
all other
|
18,433 | 17,695 | 18,521 | |||||||||
|
Stock-based
compensation
|
3,771 | 4,178 | 4,308 | |||||||||
|
Deferred
income taxes
|
15,008 | 16,304 | 4,241 | |||||||||
|
Sale
of accounts receivable to (collections
|
||||||||||||
|
on
behalf of) purchaser
|
1,000 | (3,000 | ) | (13,000 | ) | |||||||
|
Income
tax benefit of stock
|
||||||||||||
|
option
exercises
|
- | 1,630 | 561 | |||||||||
|
Excess
tax benefit from stock
|
||||||||||||
|
option
exercises
|
- | (1,738 | ) | (886 | ) | |||||||
|
Gain
on extinguishment of debt
|
- | (1,947 | ) | (1,083 | ) | |||||||
|
Increase
(decrease) in cash flows from
|
||||||||||||
|
changes
in assets and liabilities, net
|
||||||||||||
|
of
effects from acquisitions:
|
||||||||||||
|
Accounts
receivable
|
(6,301 | ) | (3,735 | ) | (12,879 | ) | ||||||
|
Inventories
|
(22,621 | ) | (8,110 | ) | (9,454 | ) | ||||||
|
Accounts
payable
|
(2,414 | ) | (7,043 | ) | (7,400 | ) | ||||||
|
Income
taxes
|
3,118 | 2,627 | (2,287 | ) | ||||||||
|
Accrued
compensation and benefits
|
2,012 | (238 | ) | 5,630 | ||||||||
|
Other
assets
|
(83 | ) | (4,469 | ) | (197 | ) | ||||||
|
Other
liabilities
|
(2,292 | ) | (10,458 | ) | 4,054 | |||||||
|
|
27,350 | 21,160 | 12,891 | |||||||||
|
Net
cash provided by operating activities
|
65,894 | 61,149 | 25,028 | |||||||||
|
Cash
flows from investing activities:
|
||||||||||||
|
Payments
related to business acquisitions,
|
||||||||||||
|
net
of cash acquired
|
(5,933 | ) | (22,023 | ) | (330 | ) | ||||||
|
Purchases
of property, plant and equipment
|
(20,910 | ) | (35,879 | ) | (21,444 | ) | ||||||
|
Net
cash used in investing activities
|
(26,843 | ) | (57,902 | ) | (21,774 | ) | ||||||
|
Cash
flows from financing activities:
|
||||||||||||
|
Net
proceeds from common stock issued
|
||||||||||||
|
under
employee plans
|
11,355 | 7,347 | 1,198 | |||||||||
|
Excess
tax benefit from stock
|
||||||||||||
|
option
exercises
|
- | 1,738 | 886 | |||||||||
See notes
to consolidated financial statements.
(continued)
-74-
CONMED
CORPORATION
CONSOLIDATED
STATEMENTS OF CASH FLOWS
Years
Ended December 31, 2007, 2008 and 2009
(In
thousands)
|
|
2007
|
2008
|
2009
|
|||||||||
|
Payments
on senior credit agreement
|
(44,000 | ) | (1,350 | ) | (1,350 | ) | ||||||
|
Proceeds
of senior credit agreement
|
- | 4,000 | 6,000 | |||||||||
|
Payments
on mortgage notes
|
(990 | ) | (1,109 | ) | (1,425 | ) | ||||||
|
Payments
on senior subordinated notes
|
- | (20,248 | ) | (7,808 | ) | |||||||
|
Net
change in cash overdrafts
|
(1,770 | ) | 4,270 | (1,188 | ) | |||||||
|
Net
cash used in financing activities
|
(35,405 | ) | (5,352 | ) | (3,687 | ) | ||||||
|
Effect
of exchange rate changes
|
||||||||||||
|
on
cash and cash equivalents
|
4,218 | 2,221 | (1,280 | ) | ||||||||
|
Net
increase (decrease) in cash
|
||||||||||||
|
and
cash equivalents
|
7,864 | 116 | (1,713 | ) | ||||||||
|
Cash
and cash equivalents at beginning of year
|
3,831 | 11,695 | 11,811 | |||||||||
|
Cash
and cash equivalents at end of year
|
$ | 11,695 | $ | 11,811 | $ | 10,098 | ||||||
|
Supplemental
disclosures of cash flow information:
|
||||||||||||
|
Cash
paid during the year for:
|
||||||||||||
|
Interest
|
$ | 14,386 | $ | 9,381 | $ | 6,303 | ||||||
|
Income
taxes
|
4,172 | 7,397 | 3,650 | |||||||||
See notes
to consolidated financial statements.
-75-
CONMED
CORPORATION
NOTES
TO CONSOLIDATED FINANCIAL STATEMENTS
(in
thousands except per share amounts)
Note
1 — Operations and Significant Accounting Policies
Organization
and operations
CONMED
Corporation (“CONMED”, the “Company”, “we” or “us”) is a medical technology
company with an emphasis on surgical devices and equipment for minimally
invasive procedures and monitoring. The Company’s products serve the
clinical areas of arthroscopy, powered surgical instruments, electrosurgery,
cardiac monitoring disposables, endosurgery and endoscopic
technologies. They are used by surgeons and physicians in a variety
of specialties including orthopedics, general surgery, gynecology, neurosurgery,
and gastroenterology.
Principles
of consolidation
The
consolidated financial statements include the accounts of CONMED Corporation and
its controlled subsidiaries. All significant intercompany accounts
and transactions have been eliminated.
Use
of estimates
The
preparation of financial statements in conformity with accounting principles
generally accepted in the United States of America requires management to make
estimates and judgments which affect the reported amounts of assets,
liabilities, related disclosure of contingent assets and liabilities at the date
of the financial statements, and the reported amount of revenues and expenses
during the reporting period. Estimates are used in accounting for, among other
things, allowances for doubtful accounts, rebates and sales allowances,
inventory allowances, purchased in-process research and development, pension
benefits, goodwill and intangible assets, contingencies and other
accruals. We base our estimates on historical experience and on
various other assumptions which are believed to be reasonable under the
circumstances. Due to the inherent uncertainty involved in making
estimates, actual results reported in future periods may differ from those
estimates. Estimates and assumptions are reviewed periodically, and
the effect of revisions are reflected in the consolidated financial statements
in the period they are determined to be necessary.
Cash
and cash equivalents
We
consider all highly liquid investments with an original maturity of three months
or less to be cash equivalents.
Accounts
receivable sale
We have
an accounts receivable sales agreement pursuant to which we and certain of our
subsidiaries sell on an ongoing basis certain accounts receivable to CONMED
Receivables Corporation (“CRC”), a wholly-owned, bankruptcy-remote,
special-purpose subsidiary of CONMED Corporation. CRC may in turn
sell up to an aggregate $40.0 million undivided percentage ownership interest in
such receivables (the “asset interest”) to a bank (the
“purchaser”). The purchaser’s share of collections on accounts
receivable are calculated as defined in the accounts receivable sales agreement,
as amended. Effectively, collections on the pool of receivables flow
first to the purchaser and then to CRC, but to the extent that the purchaser’s
share of collections may be less than the amount of the purchaser’s asset
interest, there is no recourse to CONMED or CRC for such
shortfall. For receivables which have been sold, CONMED Corporation
and its subsidiaries retain collection and administrative responsibilities as
agent for the purchaser. As of December 31, 2008 and 2009, the
undivided percentage ownership interest in receivables sold by CRC to the
purchaser aggregated $42.0 million and $29.0 million, respectively, which has
been accounted for as a sale and reflected in the balance sheet as a reduction
in accounts receivable. Expenses associated with the sale of accounts
receivable, including the purchaser’s financing costs to purchase the accounts
receivable, were $2.9 million, $1.7 million and $0.5 million, in 2007, 2008 and
2009, respectively, and are included in interest expense.
-76-
There are
certain statistical ratios, primarily related to sales dilution and losses on
accounts receivable, which must be calculated and maintained on the pool of
receivables in order to continue selling to the purchaser. The pool
of receivables is in compliance with these ratios. Management
believes that additional accounts receivable arising in the normal course of
business will be of sufficient quality and quantity to meet the requirements for
sale under the accounts receivables sales agreement. In the event
that new accounts receivable arising in the normal course of business do not
qualify for sale, then collections on sold receivables will flow to the
purchaser rather than being used to fund new receivable purchases. To
the extent that such collections would not be available to CONMED in the form of
new receivables purchases, we would need to access an alternate source of
working capital, such as our $100 million revolving credit
facility. Our accounts receivable sales agreement, as amended, also
requires us to obtain a commitment (the “purchaser commitment”) from the
purchaser to fund the purchase of our accounts receivable. The
purchaser commitment was amended effective October 30, 2009 whereby the purchase
commitment was decreased from $50.0 million to $40.0 million and extended
through October 29, 2010 under otherwise substantially the same terms and
conditions.
In June
2009, the Financial Accounting Standards Board (“FASB”) issued guidance which
requires additional disclosures about the transfer and derecognition of
financial assets, eliminates the concept of qualifying special-purpose entities,
creates more stringent conditions for reporting a transfer of a portion of a
financial asset as a sale, clarifies other sale-accounting criteria, and changes
the initial measurement of a transferor’s interest in transferred financial
assets. This guidance is effective for fiscal years beginning after November 15,
2009. As a result of this new guidance, our accounts receivable sales
agreement will no longer be permitted to be accounted for as a sale and
reduction in accounts receivable beginning in 2010. As a result,
accounts receivable sold under the agreement will be recorded as additional
borrowings rather than as a reduction in accounts receivable.
Inventories
Inventories
are valued at the lower of cost or market. Cost is determined on the
FIFO (first-in, first-out) method of accounting.
Property,
plant and equipment
Property,
plant and equipment are stated at cost and depreciated using the straight-line
method over the following estimated useful lives:
-77-
|
Building
and improvements
|
40
years
|
|
Leasehold
improvements
|
Shorter
of life of asset or life of lease
|
|
Machinery
and equipment
|
2
to 15 years
|
Goodwill
and other intangible assets
We have a
history of growth through acquisitions. Assets and liabilities of
acquired businesses are recorded at their estimated fair values as of the date
of acquisition. Goodwill represents costs in excess of fair values
assigned to the underlying net assets of acquired businesses. Other
intangible assets primarily represent allocations of purchase price to
identifiable intangible assets of acquired businesses. We have
accumulated goodwill of $290.5 million and other intangible assets of $190.8
million as of December 31, 2009.
In
accordance with FASB guidance, goodwill and intangible assets deemed to have
indefinite lives are not amortized, but are subject to at least annual
impairment testing. It is our policy to perform our annual impairment
testing in the fourth quarter. The identification and measurement of
goodwill impairment involves the estimation of the fair value of our reporting
units. Estimates of fair value are based on the best information
available as of the date of the assessment, which primarily incorporate
management assumptions about expected future cash flows and other valuation
techniques. Future cash flows may be affected by changes in industry
or market conditions or the rate and extent to which anticipated synergies or
cost savings are realized with newly acquired entities. We completed
our goodwill impairment testing as of October 1, 2009 and determined that no
impairment existed at that date. For our CONMED Electrosurgery,
CONMED Endosurgery and CONMED Linvatec operating units, our impairment testing
utilized CONMED Corporation’s EBIT multiple adjusted for a market-based control
premium with the resultant fair values exceeding carrying values by 55% to
140%. Our CONMED Patient Care operating unit has the least excess of
fair value over carrying value of our reporting units; we
therefore utilized both a market-based approach and an income approach when
performing impairment testing with the resultant fair value exceeding carrying
value by 16%. The income approach contained certain key assumptions
including that revenue would resume historical growth patterns in 2010 while
including certain cost savings associated with the operational restructuring
plan completed during 2009. We continue to monitor events and
circumstances for triggering events which would more likely than not reduce the
fair value of any of our reporting units and require us to perform impairment
testing.
Intangible
assets with a finite life are amortized over the estimated useful life of the
asset and are evaluated each reporting period to determine whether events and
circumstances warrant a revision to the remaining period of
amortization. Intangible assets subject to amortization are reviewed
for impairment whenever events or changes in circumstances indicate that its
carrying amount may not be recoverable. The carrying amount of an intangible
asset subject to amortization is not recoverable if it exceeds the sum of the
undiscounted cash flows expected to result from the use of the
asset. An impairment loss is recognized by reducing the carrying
amount of the intangible asset to its current fair value.
-78-
Customer
relationship assets arose principally as a result of the 1997 acquisition of
Linvatec Corporation. These assets represent the acquisition date
fair value of existing customer relationships based on the after-tax income
expected to be derived during their estimated remaining useful
life. The useful lives of these customer relationships were not and
are not limited by contract or any economic, regulatory or other known
factors. The estimated useful life of the Linvatec customer
relationship assets was determined as of the date of acquisition as a result of
a study of the observed pattern of historical revenue attrition during the 5
years immediately preceding the acquisition of Linvatec
Corporation. This observed attrition pattern was then applied to the
existing customer relationships to derive the future expected retirement of the
customer relationships. This analysis indicated an annual attrition
rate of 2.6%. Assuming an exponential attrition pattern, this equated
to an average remaining useful life of approximately 38 years for the Linvatec
customer relationship assets. Customer relationship intangible assets
arising as a result of other business acquisitions are being amortized over a
weighted average life of 17 years. The weighted average life for
customer relationship assets in aggregate is 34 years.
We
evaluate the remaining useful life of our customer relationship intangible
assets each reporting period in order to determine whether events and
circumstances warrant a revision to the remaining period of
amortization. In order to further evaluate the remaining useful life
of our customer relationship intangible assets, we perform an annual analysis
and assessment of actual customer attrition and activity. This
assessment includes a comparison of customer activity since the acquisition date
and review of customer attrition rates. In the event that our
analysis of actual customer attrition rates indicates a level of attrition that
is in excess of that which was originally contemplated, we would change the
estimated useful life of the related customer relationship asset with the
remaining carrying amount amortized prospectively over the revised remaining
useful life.
We test
our customer relationship assets for recoverability whenever events or changes
in circumstances indicate that the carrying amount may not be recoverable.
Factors specific to our customer relationship assets which might lead to an
impairment charge include a significant increase in the annual customer
attrition rate or otherwise significant loss of customers, significant decreases
in sales or current-period operating or cash flow losses or a projection or
forecast of losses. We do not believe that there have been events or changes in
circumstances which would indicate the carrying amount of our customer
relationship assets might not be recoverable.
Other
long-lived assets
We review
asset carrying amounts for impairment (consisting of intangible assets subject
to amortization and property, plant and equipment) whenever events or
circumstances indicate that such carrying amounts may not be
recoverable. If the sum of the expected future undiscounted cash
flows is less than the carrying amount of the asset, an impairment loss is
recognized by reducing the recorded value to its current fair
value.
Fair
value of financial instruments
The
carrying amounts reported in our balance sheets for cash and cash equivalents,
accounts receivable, accounts payable and long-term debt excluding the 2.50%
convertible senior subordinated notes (the “Notes”) approximate fair
value. The fair value of the Notes approximated $97.2 million and
$108.3 million at December 31, 2008 and 2009, respectively, based on their
quoted market price.
-79-
Translation
of foreign currency financial statements
Assets
and liabilities of foreign subsidiaries have been translated into United States
dollars at the applicable rates of exchange in effect at the end of the period
reported. Revenues and expenses have been translated at the
applicable weighted average rates of exchange in effect during the period
reported. Translation adjustments are reflected in accumulated other
comprehensive income (loss). Transaction gains and losses are
included in net income.
Foreign
Exchange and Hedging Activity
We manage
our foreign currency transaction risks through the use of forward contracts to
hedge forecasted cash flows associated with foreign currency transaction
exposures. We account for these forward contracts as cash flow
hedges. To the extent these forward contracts meet hedge accounting
criteria, changes in their fair value are not included in current earnings but
are included in accumulated other comprehensive income (loss). These
changes in fair value will be reclassified into earnings as a component of sales
when the forecasted transaction occurs.
We also
enter into forward contracts to exchange foreign currencies for United States
dollars in order to hedge our currency transaction exposures on intercompany
receivables denominated in foreign currencies. These forward
contracts settle each month at month-end, at which time we enter into new
forward contracts. We have not designated these forward contracts as
hedges and have not applied hedge accounting to them. We record these
forward contracts at fair value with resulting gains and losses included in
selling and administrative expense in the Consolidated Statements of
Income.
Income
taxes
Deferred
income tax assets and liabilities are based on the difference between the
financial statement and tax basis of assets and liabilities and operating loss and tax
credit carryforwards as measured by the enacted tax rates that are
anticipated to be in effect in the respective jurisdictions when these
differences reverse. The deferred income tax provision generally
represents the net change in the assets and liabilities for deferred income
taxes. A valuation allowance is established when it is necessary to
reduce deferred income tax assets to amounts for which realization is
likely.
Deferred
income taxes are not provided on the unremitted earnings of subsidiaries outside
of the United States when it is expected that these earnings are permanently
reinvested. Such earnings may become taxable upon the sale or liquidation of
these subsidiaries or upon the remittance of dividends. Deferred
income taxes are provided when the Company no longer considers subsidiary
earnings to be permanently invested, such as in situations where the Company’s
subsidiaries plan to make future dividend distributions.
On
January 1, 2007 we adopted the provisions for accounting for uncertainty in
income taxes. Such guidance prescribes a recognition threshold and
measurement attribute for the financial statement recognition and measurement of
a tax position taken or expected to be taken in a tax return. The
impact of this pronouncement was not material to the Company’s consolidated
financial statements. See Note 6 to the Consolidated Financial
Statements for further discussion.
-80-
Revenue
Recognition
Revenue is recognized when title has
been transferred to the customer which is at the time of
shipment. The following policies apply to our major categories of
revenue transactions:
|
|
·
|
Sales
to customers are evidenced by firm purchase orders. Title and the risks
and rewards of ownership are transferred to the customer when product is
shipped under our stated shipping terms. Payment by the
customer is due under fixed payment
terms.
|
|
|
·
|
We
place certain of our capital equipment with customers in return for
commitments to purchase disposable products over time periods generally
ranging from one to three years. In these circumstances, no
revenue is recognized upon capital equipment shipment and we recognize
revenue upon the disposable product shipment. The cost of the
equipment is amortized over the term of individual commitment
agreements.
|
|
|
·
|
Product
returns are only accepted at the discretion of the Company and in
accordance with our “Returned Goods Policy”. Historically the
level of product returns has not been significant. We accrue
for sales returns, rebates and allowances based upon an analysis of
historical customer returns and credits, rebates, discounts and current
market conditions.
|
|
|
·
|
Our
terms of sale to customers generally do not include any obligations to
perform future services. Limited warranties are provided for
capital equipment sales and provisions for warranty are provided at the
time of product sale based upon an analysis of historical
data.
|
|
|
·
|
Amounts
billed to customers related to shipping and handling have been included in
net sales. Shipping and handling costs included in selling and
administrative expense were $14.1 million, $13.4 million and $11.3 million
for 2007, 2008 and 2009,
respectively.
|
|
|
·
|
We
sell to a diversified base of customers around the world and, therefore,
believe there is no material concentration of credit
risk.
|
|
|
·
|
We
assess the risk of loss on accounts receivable and adjust the allowance
for doubtful accounts based on this risk
assessment. Historically, losses on accounts receivable have
not been material. Management believes that the allowance for
doubtful accounts of $1.2 million at December 31, 2009 is adequate to
provide for probable losses resulting from accounts
receivable.
|
Earnings
per share
Basic
earnings per share (“basic EPS”) is computed by dividing net income by the
weighted average number of shares outstanding for the reporting
period. Diluted earnings per share (“diluted EPS”) gives effect
during the reporting period to all dilutive potential shares outstanding
resulting from employee share-based awards. The following table sets
forth the calculation of basic and diluted earnings per share at December 31,
2007, 2008 and 2009, respectively:
-81-
|
2007
|
2008
|
2009
|
||||||||||
|
Net
income
|
$ | 38,544 | $ | 39,989 | $ | 12,137 | ||||||
|
Basic-weighted
average shares outstanding
|
28,416 | 28,796 | 29,074 | |||||||||
|
Effect
of dilutive potential securities
|
549 | 431 | 68 | |||||||||
|
Diluted-weighted
average shares outstanding
|
28,965 | 29,227 | 29,142 | |||||||||
|
Basic
EPS
|
$ | 1.36 | $ | 1.39 | $ | 0.42 | ||||||
|
Diluted
EPS
|
$ | 1.33 | $ | 1.37 | $ | 0.42 | ||||||
The
shares used in the calculation of diluted EPS exclude options to purchase shares
where the exercise price was greater than the average market price of common
shares for the year. Such shares aggregated approximately 0.9 and 2.2 million at
December 31, 2008 and 2009, respectively. Upon conversion of our
2.50% convertible senior subordinated notes (the "Notes"), the holder of each
Note will receive the conversion value of the Note payable in cash up to the
principal amount of the Note and CONMED common stock for the Note's conversion
value in excess of such principal amount. As of December
31, 2009, our share price has not exceeded the conversion price of the Notes,
therefore the conversion value was less than the principal amount of the
Notes. Under the net share settlement method, there were no potential
shares issuable under the Notes to be used in the calculation of diluted
EPS. The maximum number of shares we may issue with respect to the
Notes is 5,750,000.
Stock
Based Compensation
We
adopted FASB guidance related to stock based compensation effective January 1,
2006. Such guidance requires that all share-based payments to
employees, including grants of employee stock options, restricted stock units,
and stock appreciation rights be recognized in the financial statements based on
their fair values. Prior to January 1, 2006, no compensation
expense was recognized for stock options under the provisions of previous
guidance since all options granted had an exercise price equal to the market
value of the underlying stock on the grant date.
We adopted the new guidance using the
modified prospective transition method. Under this method, the provisions apply
to all awards granted or modified after the date of adoption. In addition,
compensation expense must be recognized for any nonvested stock option awards
outstanding as of the date of adoption. We recognize such expense
using a straight-line method over the vesting period. Prior periods
have not been restated.
We
elected to adopt the alternative transition method to calculate the tax effects
of stock-based compensation for those employee awards that were outstanding upon
adoption. The alternative transition method allows the use of a
simplified method to calculate the beginning pool of excess tax benefits
available to absorb tax deficiencies recognized subsequent to the
adoption. The Company’s policy for intra-period tax allocation is the
with and without approach for utilization of tax attributes.
During
2007, we began issuing shares under our stock based compensation plans out of
treasury stock whereby treasury stock is reduced by the weighted average cost of
such treasury stock. To the extent there is a difference between the
cost of the treasury stock and the exercise price of shares issued under stock
based compensation plans, we record gains to paid in capital; losses
are recorded to paid in capital to the extent any gain was previously recorded,
otherwise the loss is recorded to retained earnings.
-82-
Accumulated
other comprehensive income (loss)
Accumulated
other comprehensive income (loss) consists of the following:
|
Accumulated
|
||||||||||||||||
|
Cash
Flow
|
Cumulative
|
Other
|
||||||||||||||
|
Hedging
|
Pension
|
Translation
|
Comprehensive
|
|||||||||||||
|
Gain
|
Liability
|
Adjustments
|
Income (loss)
|
|||||||||||||
|
Balance,
December 31, 2008
|
$ | - | $ | (27,592 | ) | $ | (3,440 | ) | $ | (31,032 | ) | |||||
|
Pension
liability,
|
||||||||||||||||
|
net
of income tax
|
- | 11,310 | - | 11,310 | ||||||||||||
|
Cash
flow hedging gain,
|
||||||||||||||||
|
net
of income tax
|
76 | - | - | 76 | ||||||||||||
|
Foreign
currency translation
|
||||||||||||||||
|
adjustments
|
- | - | 7,241 | 7,241 | ||||||||||||
|
Balance,
December 31, 2009
|
$ | 76 | $ | (16,282 | ) | $ | 3,801 | $ | (12,405 | ) | ||||||
Note
2 — Inventories
Inventories
consist of the following at December 31,:
|
2008
|
2009
|
|||||||
|
Raw
materials
|
$ | 55,022 | $ | 48,959 | ||||
|
Work
in process
|
22,177 | 17,203 | ||||||
|
Finished
goods
|
82,777 | 98,113 | ||||||
| $ | 159,976 | $ | 164,275 | |||||
Note
3 — Property, Plant and Equipment
Property,
plant and equipment consist of the following at December 31,:
|
2008
|
2009
|
|||||||
|
Land
|
$ | 4,273 | $ | 4,486 | ||||
|
Building
and improvements
|
91,047 | 93,855 | ||||||
|
Machinery
and equipment
|
117,339 | 148,641 | ||||||
|
Construction
in progress
|
29,962 | 8,902 | ||||||
| 242,621 | 255,884 | |||||||
|
Less: Accumulated
depreciation
|
(98,884 | ) | (112,382 | ) | ||||
| $ | 143,737 | $ | 143,502 | |||||
-83-
Included
in machinery and equipment in 2009 is approximately $22.1 million of capitalized
software costs related to the implementation of an enterprise business software
application in 2009.
We lease
various manufacturing facilities, office facilities and equipment under
operating leases. Rental expense on these operating leases was
approximately $3,724, $3,443 and $5,988 for the years ended December 31, 2007,
2008 and 2009, respectively. The aggregate future minimum lease commitments for
operating leases at December 31, 2009 are as follows:
|
2010
|
$ | 6,456 | ||
|
2011
|
5,479 | |||
|
2012
|
5,037 | |||
|
2013
|
4,398 | |||
|
2014
|
3,632 | |||
|
Thereafter
|
12,536 |
Note
4 – Goodwill and Other Intangible Assets
The
changes in the net carrying amount of goodwill for the years ended December 31,
are as follows:
|
2008
|
2009
|
|||||||
|
Balance
as of January 1,
|
$ | 289,508 | $ | 290,245 | ||||
|
Adjustments
to goodwill resulting from business
|
||||||||
|
acquisitions
finalized
|
632 | 300 | ||||||
|
Foreign
currency translation
|
105 | (40 | ) | |||||
|
Balance
as of December 31,
|
$ | 290,245 | $ | 290,505 | ||||
Total accumulated impairment losses
(associated with our CONMED Endoscopic Technologies operating unit) aggregated
$46,689 at December 31, 2008 and 2009.
Goodwill
associated with each of our principal operating units at December
31,
is as
follows:
|
2008
|
2009
|
|||||||
|
CONMED
Electrosurgery
|
$ | 16,645 | $ | 16,645 | ||||
|
CONMED
Endosurgery
|
42,439 | 42,439 | ||||||
|
CONMED
Linvatec
|
171,437 | 171,397 | ||||||
|
CONMED
Patient Care
|
59,724 | 60,024 | ||||||
|
Balance
as of December 31,
|
$ | 290,245 | $ | 290,505 | ||||
-84-
Other intangible assets consist of
the following:
|
December 31, 2008
|
December 31, 2009
|
|||||||||||||||
|
Gross
|
Gross
|
|||||||||||||||
|
Carrying
|
Accumulated
|
Carrying
|
Accumulated
|
|||||||||||||
|
Amortized
intangible assets:
|
Amount
|
Amortization
|
Amount
|
Amortization
|
||||||||||||
|
Customer
relationships
|
$ | 127,594 | $ | (32,187 | ) | $ | 127,594 | $ | (36,490 | ) | ||||||
|
Patents
and other intangible assets
|
40,714 | (28,526 | ) | 41,809 | (30,408 | ) | ||||||||||
|
Unamortized intangible
assets:
|
||||||||||||||||
|
Trademarks
and tradenames
|
88,344 | - | 88,344 | - | ||||||||||||
| $ | 256,652 | $ | (60,713 | ) | $ | 257,747 | $ | (66,898 | ) | |||||||
Other intangible assets primarily
represent allocations of purchase price to identifiable intangible assets of
acquired businesses. The weighted average amortization period for
intangible assets which are amortized is 25 years. Customer
relationships are being amortized over a weighted average life of 34
years. Patents and other intangible assets are being amortized over a
weighted average life of 15 years.
Customer relationship assets were
recognized principally as a result of the 1997 acquisition of Linvatec
Corporation. These assets represent the acquisition date fair value
of existing customer relationships based on the after-tax income expected to be
derived during their estimated remaining useful life. The useful
lives of these customer relationships were not and are not limited by contract
or any economic, regulatory or other known factors. The estimated
useful life of the Linvatec customer relationship assets was determined as of
the date of acquisition as a result of a study of the observed pattern of
historical revenue attrition during the 5 years immediately preceding the
acquisition of Linvatec Corporation. This observed attrition pattern
was then applied to the existing customer relationships to derive the future
expected retirement of the customer relationships. This analysis
indicated an annual attrition rate of 2.6%. Assuming an exponential
attrition pattern, this equated to an average remaining useful life of
approximately 38 years for the Linvatec customer relationship
assets. Customer relationship intangible assets arising as a result
of other business acquisitions are being amortized over a weighted average life
of 17 years. The weighted average life for customer relationship
assets in aggregate is 34 years.
Trademarks and tradenames were
recognized principally in connection with the 1997 acquisition of Linvatec
Corporation. We continue to market products, release new product and
product extensions and maintain and promote these trademarks and tradenames in
the marketplace through legal registration and such methods as advertising,
medical education and trade shows. It is our belief that these
trademarks and tradenames will generate cash flow for an indefinite period of
time. Therefore, our trademarks and tradenames intangible assets are
not amortized.
Amortization
expense related to intangible assets for the year ending December 31, 2009 and
estimated amortization expense for each of the five succeeding years is as
follows:
-85-
|
2009
|
6,185
|
|
2010
|
6,110
|
|
2011
|
6,110
|
|
2012
|
5,904
|
|
2013
|
5,854
|
|
2014
|
5,624
|
Note
5 — Long Term Debt
Long-term debt consists of the
following at December 31,:
|
2008
|
2009
|
|||||||
|
Revolving
line of credit
|
$ | 4,000 | $ | 10,000 | ||||
|
Term
loan borrowings on senior credit facility
|
57,638 | 56,287 | ||||||
|
2.50%
convertible senior subordinated notes
|
111,549 | 106,770 | ||||||
|
Mortgage
notes
|
12,737 | 11,312 | ||||||
|
Total
long-term debt
|
185,924 | 184,369 | ||||||
|
Less: Current
portion
|
3,185 | 2,174 | ||||||
| $ | 182,739 | $ | 182,195 | |||||
Our
$235.0 million senior credit agreement (the "senior credit agreement") consists
of a $100.0 million revolving credit facility and a $135.0 million term loan.
There were $10.0 million in borrowings outstanding on the revolving credit
facility as of December 31, 2009. Our available borrowings on the
revolving credit facility at December 31, 2009 were $81.6 million with
approximately $8.4 million of the facility set aside for outstanding letters of
credit. There were $56.3 million in borrowings outstanding on the
term loan at December 31, 2009.
Borrowings
outstanding on the revolving credit facility are due and payable on April 12,
2011. The scheduled principal payments on the term loan portion of
the senior credit agreement are $1.4 million annually through December 2011,
increasing to $53.6 million in 2012 with the remaining balance outstanding due
and payable on April 12, 2013. We may also be required, under certain
circumstances, to make additional principal payments based on excess cash flow
as defined in the senior credit agreement. Interest rates on the term
loan portion of the senior credit agreement are at LIBOR plus 1.50% (1.75% at
December 31, 2009) or an alternative base rate; interest rates on the revolving
credit facility portion of the senior credit agreement are at LIBOR plus 1.50%
or an alternative base rate (3.625% at December 31, 2009). For those
borrowings where the Company elects to use the alternative base rate, the base
rate will be the greater of the Prime Rate or the Federal Funds Rate in effect
on such date plus 0.50%, plus a margin of 0.50% for term loan borrowings or
0.25% for borrowings under the revolving credit facility.
The
senior credit agreement is collateralized by substantially all of our personal
property and assets, except for our accounts receivable and related rights which
are pledged in connection with our accounts receivable sales
agreement. The senior credit agreement contains covenants and
restrictions which, among other things, require the maintenance of certain
financial ratios, and restrict dividend payments and the incurrence of certain
indebtedness and other activities, including acquisitions and
dispositions. We are also required, under certain circumstances, to
make mandatory prepayments from net cash proceeds from any issuance of equity
and asset sales.
-86-
We have a
mortgage note outstanding in connection with the property and facilities
utilized by our CONMED Linvatec subsidiary bearing interest at 8.25% per annum
with semiannual payments of principal and interest through June
2019. The principal balance outstanding on the mortgage note
aggregated $11.3 million at December 31, 2009. The mortgage note is
collateralized by the CONMED Linvatec property and facilities.
We have
outstanding $115.1 million in 2.50% convertible senior subordinated notes due
2024. During the year ended December 31, 2008, we repurchased and
retired $25.0 million of the Notes for $20.2 million and recorded a gain on the
early extinguishment of debt of $1.9 million net of the write-off of $0.4
million in unamortized deferred financing costs and $2.4 million in unamortized
debt discount. During the year ended December 31, 2009, we
repurchased and retired $9.9 million of the Notes for $7.8 million and recorded
a gain on the early extinguishment of debt of $1.1 million net of the write-offs
of $0.1 million in unamortized deferred financing costs and $1.0 million in
unamortized debt discount. The Notes represent subordinated unsecured
obligations and are convertible under certain circumstances, as defined in the
bond indenture, into a combination of cash and CONMED common
stock. Upon conversion, the holder of each Note will receive the
conversion value of the Note payable in cash up to the principal amount of the
Note and CONMED common stock for the Note’s conversion value in excess of such
principal amount. Amounts in excess of the principal amount are at an
initial conversion rate, subject to adjustment, of 26.1849 shares per $1,000
principal amount of the Note (which represents an initial conversion price of
$38.19 per share). As of December 31, 2009, there was no value
assigned to the conversion feature because the Company’s share price was below
the conversion price. The Notes mature on November 15, 2024 and are
not redeemable by us prior to November 15, 2011. Holders of the Notes
have the right to put to us some or all of the Notes for repurchase on
November 15, 2011, 2014 and 2019 and, provided the terms of the indenture are
satisfied, we will be required to repurchase those Notes.
The Notes
contain two embedded derivatives. The embedded derivatives are
recorded at fair value in other long-term liabilities and changes in their value
are recorded through the consolidated statements of income. The
embedded derivatives have a nominal value, and it is our belief that any change
in their fair value would not have a material adverse effect on our business,
financial condition, results of operations, or cash flows.
In May
2008, the FASB issued guidance which specifies that issuers of convertible debt
instruments that permit or require the issuer to pay cash upon conversion should
separately account for the liability and equity components in a manner that will
reflect the entity’s nonconvertible debt borrowing rate when interest cost is
recognized in subsequent periods. The Company was required to apply the guidance
retrospectively to all past periods presented. We adopted this
guidance on January 1, 2009 related to our 2.50% convertible senior subordinated
notes due 2024.
Our
effective borrowing rate for nonconvertible debt at the time of issuance of the
Notes was estimated to be 6.67%, which resulted in $34.6 million of the
$150.0 million aggregate principal amount of Notes issued, or
$21.8 million after taxes, being attributable to equity. For the
year ended December 31, 2007, 2008 and 2009, we have recorded interest expense
related to the amortization of debt discount on the Notes of $4.6 million, $4.8
million and $4.1 million, respectively, at the effective interest rate of
6.67%. The debt discount on the Notes is being amortized through
November 2011. For the years ended December 31, 2007, 2008 and 2009,
we have recorded interest expense on the Notes of $3.8 million, $3.7 million and
$2.9 million, respectively, at the contractual coupon rate of
2.50%.
-87-
Amounts
recognized in the consolidated balance sheets related to the Notes consist of
the following at December 31,:
|
2008
|
2009
|
|||||||
|
Principal
value of the Notes
|
$ | 125,000 | $ | 115,093 | ||||
|
Unamortized
discount
|
(13,451 | ) | (8,323 | ) | ||||
|
Carrying
value of the Notes
|
$ | 111,549 | $ | 106,770 | ||||
|
Equity
component
|
$ | 21,579 | $ | 21,491 | ||||
The
scheduled maturities of long-term debt
outstanding at December 31, 2009 are as follows:
|
2010
|
$ 2,174
|
|
2011
|
12,244
|
|
2012
|
54,556
|
|
2013
|
1,050
|
|
2014
|
1,140
|
|
Thereafter
|
121,528
|
Note
6 — Income Taxes
The
provision for income taxes for the years ended December 31, 2007, 2008 and 2009
consists of the following:
|
2007
|
2008
|
2009
|
||||||||||
|
Current
tax expense:
|
||||||||||||
|
Federal
|
$ | 2,634 | $ | 2,094 | $ | (1,281 | ) | |||||
|
State
|
1,102 | 498 | 791 | |||||||||
|
Foreign
|
2,851 | 3,126 | 2,267 | |||||||||
| 6,587 | 5,718 | 1,777 | ||||||||||
|
Deferred
income tax expense
|
15,008 | 16,304 | 4,241 | |||||||||
|
Provision
for income taxes
|
$ | 21,595 | $ | 22,022 | $ | 6,018 | ||||||
A
reconciliation between income taxes computed at the statutory federal rate and
the provision for income taxes for the years ended December 31, 2007, 2008 and
2009 follows:
-88-
|
2007
|
2008
|
2009
|
||||||||||
|
Tax
provision at statutory rate based
|
||||||||||||
|
on
income before income taxes
|
35.00 | % | 35.00 | % | 35.00 | % | ||||||
|
State
income taxes
|
1.77 | 1.47 | 5.59 | |||||||||
|
Stock-based
compensation
|
0.60 | 0.43 | 1.59 | |||||||||
|
Foreign
income taxes
|
0.20 | (0.58 | ) | (2.90 | ) | |||||||
|
Research
& development credit
|
(1.29 | ) | (1.45 | ) | (4.46 | ) | ||||||
|
Settlement
of taxing
|
||||||||||||
|
authority
examinations
|
(1.05 | ) | - | (5.60 | ) | |||||||
|
Other
nondeductible permanent differences
|
0.68 | 0.91 | 2.86 | |||||||||
|
Other,
net
|
- | (0.27 | ) | 1.07 | ||||||||
| 35.91 | % | 35.51 | % | 33.15 | % | |||||||
The tax
effects of the significant temporary differences which comprise the deferred
income tax assets and liabilities at December 31, 2008 and 2009 are as
follows:
|
2008
|
2009
|
|||||||
|
Assets:
|
||||||||
|
Inventory
|
$ | 4,376 | $ | 3,912 | ||||
|
Net
operating losses
|
2,493 | 780 | ||||||
|
Capitalized
research and development
|
- | 4,757 | ||||||
|
Deferred
compensation
|
2,302 | 2,331 | ||||||
|
Accounts
receivable
|
2,534 | 2,524 | ||||||
|
Employee
benefits
|
1,582 | 2,157 | ||||||
|
Accrued
pension
|
11,783 | 3,436 | ||||||
|
Research
and development credit
|
3,004 | 3,814 | ||||||
|
Foreign
tax credit
|
1,140 | 1,513 | ||||||
|
Other
|
4,250 | 10,390 | ||||||
|
Valuation
allowance
|
(2,069 | ) | (1,058 | ) | ||||
| 31,395 | 34,556 | |||||||
|
Liabilities:
|
||||||||
|
Goodwill
and intangible assets
|
83,524 | 95,049 | ||||||
|
Depreciation
|
6,054 | 4,548 | ||||||
|
State
taxes
|
1,250 | 2,090 | ||||||
|
Contingent
interest
|
14,293 | 14,050 | ||||||
| 105,121 | 115,737 | |||||||
|
Net
liability
|
$ | (73,726 | ) | $ | (81,181 | ) | ||
-89-
Income
before income taxes consists of the following U.S. and foreign
income:
|
2007
|
2008
|
2009
|
||||||||||
|
U.S.
income
|
$ | 53,046 | $ | 51,616 | $ | 10,108 | ||||||
|
Foreign
income
|
7,093 | 10,395 | 8,047 | |||||||||
|
Total
income
|
$ | 60,139 | $ | 62,011 | $ | 18,155 | ||||||
The net
operating loss carryforward of an acquired subsidiary begins to expire in
2023. The net operating loss carryforward is subject to a
pre-existing ownership change limitation under IRC section 382 as a result of
the purchase of stock of the acquired subsidiary. The annual existing
ownership change limitation on the acquired net operating loss is $2.1
million. We have established a valuation allowance to reflect the
uncertainty of realizing the benefit of the net operating loss carryforward
recognized in connection with an acquisition. Changes in deferred tax
valuation allowances and income tax uncertainties after the acquisition date,
including those associated with acquisitions generally will affect income tax
expense.
The gross
amount of Federal net operating loss carryforwards available is $3.8
million. This includes $2.1 million of net operating loss
carryforward from an acquired subsidiary as discussed above. The
remaining $1.7 million begins to expire in 2026. Approximately $1.7
million of the gross Federal net operating loss is attributable to stock-based
compensation windfall tax deductions. In accordance with FASB
guidance, the $0.6 million windfall tax benefit on the $1.7 million net
operating loss carryforward has not been recorded as a deferred tax
asset. The $0.6 million tax benefit will be recorded in additional
paid-in capital when realized.
The
amount of Federal Research and Development credit carryforward available is $3.8
million. These credits begin to expire in 2024. The total
amount of Federal Foreign Tax Credit carryforward available is $1.5
million. These credits begin to expire in 2017.
Deferred
tax amounts include approximately $3.5 million of future tax benefits associated
with state tax credits which have an indefinite carryforward
period.
We
operate in multiple taxing jurisdictions, both within and outside the United
States. We face audits from these various tax authorities regarding
the amount of taxes due. Such audits can involve complex issues and
may require an extended period of time to resolve. Our Federal income
tax returns have been examined by the Internal Revenue Service (“IRS”) for
calendar years ending through 2007.
We have
not provided for federal income taxes on undistributed earnings of our foreign
subsidiaries as it remains our intention to permanently reinvest such earnings
(approximately $41.0 million at December 31, 2009.) It is not
practicable given the complexities of the foreign tax credit calculation to
estimate the tax due upon any possible repatriation.
On
January 1, 2007 we adopted the provisions of accounting for uncertainty in
income taxes that prescribe a recognition threshold and measurement attribute
for the financial statement recognition and measurement of a tax position taken
or expected to be taken in a tax return. The impact of this
pronouncement was not material to the Company’s consolidated financial
statements.
-90-
The
following table summarizes the activity related to our unrecognized tax benefits
for the years ending December 31,:
|
2007
|
2008
|
2009
|
||||||||||
|
Balance
as of January 1,
|
$ | 1,359 | $ | 1,866 | $ | 2,869 | ||||||
|
Increases
(decreases) for positions
|
||||||||||||
|
taken
in prior periods
|
(164 | ) | 212 | 139 | ||||||||
|
Increases
for positions taken in current
|
||||||||||||
|
periods
|
1,410 | 1,117 | 183 | |||||||||
|
Decreases
in unrecorded tax positions related
|
||||||||||||
|
to
settlement with the taxing authorities
|
(739 | ) | (154 | ) | (1,322 | ) | ||||||
|
Decreases
in unrecorded tax positions related
|
||||||||||||
|
to
lapse of statute of limitations
|
- | (172 | ) | - | ||||||||
|
Balance
as of December 31,
|
$ | 1,866 | $ | 2,869 | $ | 1,869 | ||||||
If the
total unrecognized tax benefits of $1.9 million at December 31, 2009
were recognized, it would reduce our annual effective tax rate. The
amount of interest accrued in 2009 related to these unrecognized tax benefits
was not material and is included in the provision for income taxes in the
consolidated statements of operations. It is reasonably possible that
the amount of unrecognized tax benefits could change in the next 12 months as a
result of the anticipated completion of taxing authority examinations for the
tax years 2006 through 2008. The range of change in unrecognized tax
benefits is estimated between $0.8 million and $1.5 million.
Note
7 – Shareholders’ Equity
Our
shareholders have authorized 500,000 shares of preferred stock, par value $.01
per share, which may be issued in one or more series by the Board of Directors
without further action by the shareholders. As of December 31, 2008 and 2009, no
preferred stock had been issued.
On
February 15, 2005, our Board of Directors authorized a share repurchase program
under which we may repurchase up to $50.0 million of our common stock, although
no more than $25.0 million could be purchased in any calendar
year. The Board subsequently amended this program on December 2, 2005
to authorize repurchases up to $100.0 million of our common stock, although no
more than $50.0 million may be purchased in any calendar year. The
repurchase program calls for shares to be purchased in the open market or in
private transactions from time to time. We may suspend or discontinue
the share repurchase program at any time. Through December 31, 2006,
we have repurchased a total of 2.2 million shares of common stock aggregating
$53.2 million under this authorization. No stock repurchases were
made in 2007, 2008 or 2009.
We have
reserved 5.8 million shares of common stock for issuance to employees and
directors under three shareholder-approved share-based compensation plans (the
"Plans") of which approximately 1.1 million shares remain available for grant at
December 31, 2009. The exercise price on all outstanding options and
stock appreciation rights (“SARs”) is equal to the quoted fair market value of
the stock at the date of grant. Restricted stock units (“RSUs”) are
valued at the market value of the underlying stock on the date of
grant. Stock options, SARs and RSUs are non-transferable other than
on death and generally become exercisable over a five year period from date of
grant. Stock options and SARs expire ten years from date of
grant. SARs are only settled in shares of the Company’s
stock. The issuance of shares pursuant to the exercise of stock
options and SARs and vesting of RSUs are from the Company’s treasury
stock.
-91-
Total
pre-tax stock-based compensation expense recognized in the Consolidated
Statements of Operations was $3.8 million, $4.2 million and $4.3 million for the
year ended December 31, 2007, 2008 and 2009, respectively. This
amount is included in selling and administrative expenses on the Consolidated
Statements of Operations. Tax related benefits of $0.8 million, $1.1
million and $1.3 million were also recognized for the years ended December 31,
2007, 2008 and 2009. Cash received from the exercise of stock options
was $11.3 million, $6.9 million and $0.7 million for the years ended December
31, 2007, 2008 and 2009, respectively and is reflected in cash flows from
financing activities in the Consolidated Statements of Cash Flows.
The
weighted average fair value of awards of options and SARs granted in the years
ended December 31, 2007, 2008 and 2009 was $11.88, $9.35 and $7.03,
respectively. The fair value of these options and SARs was estimated
at the date of grant using a Black-Scholes option pricing model with the
following weighted-average assumptions for options and SARs granted in the years
ended December 31, 2007, 2008 and 2009, respectively: risk-free
interest rate of 4.56%, 3.25% and 2.48%; volatility factor of the expected
market price of the Company's common stock of 32.61%, 30.36% and 37.17%; a
weighted-average expected life of the option and SAR of 5.7 years for 2007 and
2008 and 6.2 years for 2009; and that no dividends would be paid on common
stock. The risk free interest rate is based on the option and SAR
grant date for a traded zero-coupon U.S. Treasury bond with a maturity date
closest to the expected life. Expected volatilities are based upon
historical volatility of the Company’s stock over a period equal to the expected
life of each option and SAR grant. The expected life represents the
period of time that the options and SARs are expected to be outstanding based on
a study of historical data of option holder exercise and termination
behavior.
The
following table illustrates the stock option and SAR activity for the year ended
December 31, 2009.:
|
Number
|
Weighted-
|
|||||||
|
of
|
Average
|
|||||||
|
Shares
|
Exercise
|
|||||||
|
(in 000’s)
|
Price
|
|||||||
|
Outstanding
at December 31, 2008
|
2,423 | $ | 24.10 | |||||
|
Granted
|
233 | $ | 17.30 | |||||
|
Forfeited
|
(159 | ) | $ | 22.38 | ||||
|
Exercised
|
(46 | ) | $ | 16.92 | ||||
|
Outstanding
at December 31, 2009
|
2,451 | $ | 23.70 | |||||
|
Exercisable
at December 31, 2009
|
1,839 | $ | 23.94 | |||||
The
weighted average remaining contractual term for stock options and SARs
outstanding and exercisable at December 31, 2009 was 5.0 years and 4.0 years,
respectively. The aggregate intrinsic value of stock options and SARs
outstanding and exercisable at December 31, 2009 was $4.8 million and $3.3
million, respectively. The aggregate intrinsic value of stock options
and SARs exercised during the year ended December 31, 2007, 2008 and 2009 was
$6.7 million, $4.0 million and $0.2 million, respectively.
-92-
The
following table illustrates the RSU activity for the year ended December 31,
2009. There were no RSU’s granted prior to 2006.
|
Number
|
Weighted-
|
|||||||
|
of
|
Average
|
|||||||
|
Shares
|
Grant-Date
|
|||||||
|
(in 000’s)
|
Fair Value
|
|||||||
|
Outstanding
at December 31, 2008
|
336 | $ | 26.01 | |||||
|
Granted
|
197 | $ | 17.02 | |||||
|
Vested
|
(77 | ) | $ | 25.48 | ||||
|
Forfeited
|
(31 | ) | $ | 24.67 | ||||
|
Outstanding
at December 31, 2009
|
425 | $ | 22.03 | |||||
The
weighted average fair value of awards of RSUs granted in the years ended
December 31, 2007, 2008 and 2009 was $29.13, $26.94 and $17.02,
respectively.
The total
fair value of shares vested was $0.6 million, $1.3 million and $1.8 million for
the years ended December 31, 2007, 2008 and 2009, respectively.
As of
December 31, 2009, there was $12.1 million of total unrecognized compensation
cost related to nonvested stock options, SARs and RSUs granted under the Plan
which is expected to be recognized over a weighted average period of 3.5
years.
We offer
to our employees a shareholder-approved Employee Stock Purchase Plan (the
“Employee Plan”), under which we have reserved 1.0 million shares of common
stock for issuance to our employees. The Employee Plan provides
employees with the opportunity to invest from 1% to 10% of their annual salary
to purchase shares of CONMED common stock through the exercise of stock options
granted by the Company at a purchase price equal to 95% of the fair market value
of the common stock on the exercise date. During 2009, we issued
approximately 28,900 shares of common stock under the Employee
Plan. No stock-based compensation expense has been recognized in the
accompanying consolidated financial statements as a result of common stock
issuances under the Employee Plan.
Note
8 — Business Segments and Geographic Areas
CONMED
conducts its business through five principal operating segments, CONMED
Endoscopic Technologies, CONMED Endosurgery, CONMED Electrosurgery, CONMED
Linvatec and CONMED Patient Care. We believe each of our segments are
similar in the nature of products, production processes, customer base,
distribution methods and regulatory environment. Our CONMED
Endosurgery, CONMED Electrosurgery and CONMED Linvatec operating segments also
have similar economic characteristics and therefore qualify for
aggregation. Our CONMED Patient Care and CONMED Endoscopic
Technologies operating units do not qualify for aggregation since their economic
characteristics do not meet the criteria for aggregation as a result of the
lower overall operating income (loss) in these segments.
-93-
CONMED
Endosurgery, CONMED Electrosurgery and CONMED Linvatec consist of a single
aggregated segment comprising a complete line of endo-mechanical instrumentation
for minimally invasive laparoscopic procedures, electrosurgical generators and
related surgical instruments, arthroscopic instrumentation for use in orthopedic
surgery and small bone, large bone and specialty powered surgical
instruments. CONMED Patient Care product offerings include a line of
vital signs and cardiac monitoring products as well as suction instruments &
tubing for use in the operating room. CONMED Endoscopic Technologies
product offerings include a comprehensive line of minimally invasive endoscopic
diagnostic and therapeutic instruments used in procedures which require
examination of the digestive tract.
The
following is net sales information by product line and reportable
segment:
|
2007
|
2008
|
2009
|
||||||||||
|
Arthroscopy
|
$ | 264,637 | $ | 291,910 | $ | 269,820 | ||||||
|
Powered
Surgical Instruments
|
149,261 | 155,659 | 144,014 | |||||||||
|
CONMED
Linvatec
|
413,898 | 447,569 | 413,834 | |||||||||
|
CONMED
Electrosurgery
|
92,107 | 100,493 | 94,959 | |||||||||
|
CONMED
Endosurgery
|
58,829 | 64,459 | 66,027 | |||||||||
|
CONMED
Linvatec, Electrosurgery,
|
||||||||||||
|
and
Endosurgery
|
564,834 | 612,521 | 574,820 | |||||||||
|
CONMED
Patient Care
|
76,711 | 78,384 | 70,978 | |||||||||
|
CONMED
Endoscopic Technologies
|
52,743 | 51,278 | 48,941 | |||||||||
|
Total
|
$ | 694,288 | $ | 742,183 | $ | 694,739 | ||||||
Total
assets, capital expenditures, depreciation and amortization information are
impracticable to present by reportable segment because the necessary information
is not available.
The
following is a reconciliation between segment operating income (loss) and income
before income taxes. The Corporate line includes corporate related
items not allocated to operating units:
|
2007
|
2008
|
2009
|
||||||||||
|
CONMED
Linvatec, Electrosurgery
|
||||||||||||
|
and
Endosurgery
|
$ | 87,569 | $ | 98,101 | $ | 62,715 | ||||||
|
CONMED
Patient Care
|
2,003 | 2,259 | (1,263 | ) | ||||||||
|
CONMED
Endoscopic Technologies
|
(6,250 | ) | (7,411 | ) | (7,904 | ) | ||||||
|
Corporate
|
(2,331 | ) | (17,690 | ) | (25,279 | ) | ||||||
|
Income
from operations
|
80,991 | 75,259 | 28,269 | |||||||||
|
Gain
on early extinguishment of debt
|
- | 1,947 | 1,083 | |||||||||
|
Amortization
of bond discount
|
4,618 | 4,823 | 4,111 | |||||||||
|
Interest
expense
|
16,234 | 10,372 | 7,086 | |||||||||
|
Income
before income taxes
|
$ | 60,139 | $ | 62,011 | $ | 18,155 | ||||||
-94-
Net sales
information for geographic areas consists of the following:
|
2007
|
2008
|
2009
|
||||||||||
|
United
States
|
$ | 404,434 | $ | 411,773 | $ | 385,770 | ||||||
|
Canada
|
55,313 | 52,792 | 48,713 | |||||||||
|
United
Kingdom
|
45,335 | 44,123 | 35,155 | |||||||||
|
Japan
|
26,274 | 28,026 | 29,244 | |||||||||
|
Australia
|
30,199 | 30,270 | 30,159 | |||||||||
|
All
other countries
|
132,733 | 175,199 | 165,698 | |||||||||
|
Total
|
$ | 694,288 | $ | 742,183 | $ | 694,739 | ||||||
Sales are attributed to countries based
on the location of the customer. There were no significant investments in
long-lived assets located outside the United States at December 31, 2008 and
2009. No single customer represented over 10% of our consolidated net
sales for the years ended December 31, 2007, 2008 and 2009.
Note
9 — Employee Benefit Plans
We
sponsor an employee savings plan (“401(k) plan”) and a defined benefit pension
plan (the “pension plan”) covering substantially all our employees.
Total
employer contributions to the 401(k) plan were $2.5 million, $2.7 million and
$6.8 million during the years ended December 31, 2007, 2008 and 2009,
respectively. Included in the 2009 total is a discretionary one-time
$4.0 million employer 401(k) contribution.
During
the first quarter of 2009, the Company announced the freezing of benefit
accruals under the defined benefit pension plan for United States employees
(“the Plan”) effective May 14, 2009. As a result, the Company
recorded a curtailment gain of $4.4 million and a reduction in accrued pension
of $11.4 million which is included in other long term liabilities.
We use a
December 31, measurement date for our pension plan. Gains and losses
are amortized on a straight-line basis over the average remaining service period
of active participants. The following table provides a reconciliation
of the projected benefit obligation, plan assets and funded status of the
pension plan at December 31,:
|
2008
|
2009
|
|||||||
|
Accumulated
Benefit Obligation
|
$ | 61,514 | $ | 61,222 | ||||
|
Change
in benefit obligation
|
||||||||
|
Projected
benefit obligation at beginning of year
|
$ | 56,592 | $ | 76,610 | ||||
|
Service
cost
|
5,835 | 187 | ||||||
|
Interest
cost
|
3,977 | 3,920 | ||||||
|
Actuarial
loss (gain)
|
14,837 | (4,802 | ) | |||||
|
Curtailment
gain
|
- | (11,358 | ) | |||||
|
Benefits
paid
|
(4,631 | ) | (3,335 | ) | ||||
|
Projected
benefit obligation at end of year
|
$ | 76,610 | $ | 61,222 | ||||
|
Change
in plan assets
|
||||||||
|
Fair
value of plan assets at beginning of year
|
$ | 48,532 | $ | 45,381 | ||||
|
Actual
gain (loss) on plan assets
|
(10,520 | ) | 6,723 | |||||
|
Employer
contributions
|
12,000 | 4,073 | ||||||
|
Benefits
paid
|
(4,631 | ) | (3,335 | ) | ||||
|
Fair
value of plan assets at end of year
|
$ | 45,381 | $ | 52,842 | ||||
|
Funded
status
|
$ | (31,229 | ) | $ | (8,380 | ) | ||
-95-
Amounts
recognized in the consolidated balance sheets consist of the following at
December 31,:
|
2008
|
2009
|
|||||||
|
Accrued
long-term pension liability
|
$ | 31,229 | $ | 8,380 | ||||
|
Accumulated
other comprehensive income (loss)
|
(43,762 | ) | (25,823 | ) | ||||
The
following actuarial assumptions were used to determine our accumulated and
projected benefit obligations as of December 31,:
|
|
2008
|
2009
|
||||||
|
Discount
rate
|
5.97 | % | 5.86 | % | ||||
|
Expected
return on plan assets
|
8.00 | % | 8.00 | % | ||||
|
Rate
of compensation increase
|
3.50 | % | 3.50 | % | ||||
Accumulated other comprehensive income
(loss) for the years ended December 31, 2008 and 2009 consists of the following
items not yet recognized in net periodic pension cost (before income
taxes):
|
2008
|
2009
|
|||||||
|
Net
actuarial loss
|
$ | (48,216 | ) | $ | (25,823 | ) | ||
|
Transition
liability
|
(28 | ) | - | |||||
|
Prior
service cost
|
4,482 | - | ||||||
|
Accumulated
other comprehensive income (loss)
|
$ | (43,762 | ) | $ | (25,823 | ) | ||
Other
changes in plan assets and benefit obligations recognized in other comprehensive
income in 2009 are as follows:
|
Current
year actuarial gain
|
$ | 9,409 | ||
|
Curtailment
gain
|
6,990 | |||
|
Amortization
of actuarial loss
|
1,627 | |||
|
Amortization
of prior service costs (credits)
|
(88 | ) | ||
|
Amortization
of transition liability
|
1 | |||
|
Total
recognized in other comprehensive income
|
$ | 17,939 |
The estimated portion of net actuarial
loss in accumulated other comprehensive income (loss) that is expected to be
recognized as a component of net periodic pension cost in 2010 is
$1,313.
-96-
Net periodic pension cost for the years
ended December 31, consists of the following:
|
|
2007
|
2008
|
2009
|
|||||||||
|
Service
cost — benefits earned during the period
|
$ | 5,863 | $ | 5,835 | $ | 1,887 | ||||||
|
Interest
cost on projected benefit obligation
|
3,216 | 3,977 | 3,920 | |||||||||
|
Return
on plan assets
|
(3,226 | ) | (4,210 | ) | (3,817 | ) | ||||||
|
Curtailment
gain
|
- | - | (4,368 | ) | ||||||||
|
Transition
amount
|
4 | 4 | 1 | |||||||||
|
Prior
service cost
|
(351 | ) | (351 | ) | (88 | ) | ||||||
|
Amortization
of loss
|
1,382 | 1,320 | 1,627 | |||||||||
|
Net
periodic pension cost
|
$ | 6,888 | $ | 6,575 | $ | (838 | ) | |||||
The
following actuarial assumptions were used to determine our net periodic pension
benefit cost for the years ended December 31,:
|
|
2007
|
2008
|
2009
|
|||||||||
|
Discount
rate
|
5.90 | % | 6.48 | % | 5.97 | %* | ||||||
|
Expected
return on plan assets
|
8.00 | % | 8.00 | % | 8.00 | % | ||||||
|
Rate
of compensation increase
|
3.00 | % | 3.50 | % | 3.50 | % | ||||||
*For the
year ending December 31, 2009, the discount rate used in determining pension
expense was 5.97% in the first quarter of 2009; the discount rate
used for purposes of remeasuring plan liabilities as of the date the plan freeze
was approved and for purposes of measuring pension expense for the remainder of
2009 was 7.30%.
In
determining the expected return on pension plan assets, we consider the relative
weighting of plan assets, the historical performance of total plan assets and
individual asset classes and economic and other indicators of future
performance. In addition, we consult with financial and investment
management professionals in developing appropriate targeted rates of
return.
Asset
management objectives include maintaining an adequate level of diversification
to reduce interest rate and market risk and providing adequate liquidity to meet
immediate and future benefit payment requirements.
The
allocation of pension plan assets by category is as follows at December
31,:
|
|
Percentage
of Pension
|
Target
|
||||||||||
|
|
Plan
Assets
|
Allocation
|
||||||||||
|
|
2008
|
2009
|
2010
|
|||||||||
|
Equity
securities
|
47 | % | 64 | % | 75 | % | ||||||
|
Debt
securities
|
53 | 36 | 25 | |||||||||
|
Total
|
100 | % | 100 | % | 100 | % | ||||||
As of
December 31, 2009, the Plan held 27,562 shares of our common stock, which had a
fair value of $0.6 million. We believe that our long-term asset
allocation on average will approximate the targeted allocation. We regularly
review our actual asset allocation and periodically rebalance the pension plan’s
investments to our targeted allocation when deemed appropriate.
-97-
The
following table sets forth the fair value of Plan assets as of December
31,:
|
2008
|
2009
|
|||||||
|
Common
Stock
|
$ | 15,250 | $ | 20,795 | ||||
|
Money
Market Fund
|
21,554 | 16,090 | ||||||
|
Equity
Funds
|
6,162 | 13,247 | ||||||
|
Fixed
Income Securities
|
2,328 | 2,638 | ||||||
|
Accrued
Interest and Dividend
|
87 | 72 | ||||||
|
Total
Assets at Fair Value
|
$ | 45,381 | $ | 52,842 | ||||
FASB
guidance, defines fair value, establishes a framework for measuring fair value
and related disclosure requirements. A valuation hierarchy was established for
disclosure of the inputs to the valuations used to measure fair value. This
hierarchy prioritizes the inputs into three broad levels as follows. Level 1
inputs are quoted prices (unadjusted) in active markets for identical assets or
liabilities. Level 2 inputs are quoted prices for similar assets and liabilities
in active markets, quoted prices for identical or similar assets in markets that
are not active, inputs other than quoted prices that are observable for the
asset or liability, including interest rates, yield curves and credit risks, or
inputs that are derived principally from or corroborated by observable market
data through correlation. Level 3 inputs are unobservable inputs based on our
own assumptions used to measure assets and liabilities at fair value. A
financial asset or liability’s classification within the hierarchy is determined
based on the lowest level input that is significant to the fair value
measurement.
Following is a description of the
valuation methodologies used for assets measured at fair value. There have been
no changes in the methodologies used at December 31, 2008 and
2009:
|
Common
Stock:
|
Common
stock is valued at the closing price reported on the common stock’s
respective stock exchange and is classified within level 1 of the
valuation hierarchy.
|
|
Money
Market Fund:
|
These
investments are public investment vehicles valued using $1 for the Net
Asset Value (NAV). The money market fund is classified within level 2 of
the valuation hierarchy.
|
|
Equity
Funds:
|
These
investments are public investment vehicles valued using the NAV provided
by the administrator of the fund. The NAV is based on the value
of the underlying assets owned by the fund, minus its liabilities, and
then divided by the number of shares outstanding. The NAV is a
quoted price in an active market and is classified within level 1 of the
valuation hierarchy.
|
|
Fixed
Income Securities:
|
Valued
at the closing price reported on the active market on which the individual
securities are traded and are classified within level 1 of the valuation
hierarchy.
|
-98-
The methods described above may produce
a fair value calculation that may not be indicative of net realizable value or
reflective of future fair values. Furthermore, while the Plan believes its
valuation methods are appropriate and consistent with other market participants,
the use of different methodologies or assumptions to determine the fair value of
certain financial instruments could result in a different fair value measurement
at the reporting date.
The following table sets forth by
level, within the fair value hierarchy, the Plan's assets at fair value as of
December 31, 2009:
|
Level 1
|
Level 2
|
Total
|
||||||||||
|
Common
Stock
|
$ | 20,795 | $ | - | $ | 20,795 | ||||||
|
Money
Market Fund
|
- | 16,090 | 16,090 | |||||||||
|
Equity
Funds
|
13,247 | - | 13,247 | |||||||||
|
Fixed
Income Securities
|
2,638 | - | 2,638 | |||||||||
|
Total
Assets at Fair Value
|
$ | 36,680 | $ | 16,090 | $ | 52,770 | ||||||
We are
required to contribute approximately $3.0 million to our pension plan for the
2010 Plan year.
The following table summarizes the
benefits expected to be paid by our pension plan in each of the next five years
and in aggregate for the following five years. The expected benefit
payments are estimated based on the same assumptions used to measure the
Company’s projected benefit obligation at December 31, 2009 and reflect the
impact of expected future employee service.
|
2010
|
2,751
|
|
2011
|
2,815
|
|
2012
|
2,982
|
|
2013
|
3,167
|
|
2014
|
3,311
|
|
2015-2019
|
19,216
|
Note
10 — Legal Matters
From time
to time, we are a defendant in certain lawsuits alleging product liability,
patent infringement, or other claims incurred in the ordinary course of
business. Likewise, from time to time, the Company may receive a subpoena from a
government agency such as the Equal Employment Opportunity Commission,
Occupational Safety and Health Administration, the Department of Labor, the
Treasury Department, and other federal and state agencies or foreign governments
or government agencies. These subpoena may or may not be routine
inquiries, or may begin as routine inquiries and over time develop into
enforcement actions of various types. The product liability claims
are generally covered by various insurance policies, subject to certain
deductible amounts, maximum policy limits and certain exclusions in the
respective policies or required as a matter of law. In some cases we
may be entitled to indemnification by third parties. When there is no
insurance coverage, as would typically be the case primarily in lawsuits
alleging patent infringement or in connection with certain government
investigations, or indemnification obligation of a third party we establish
reserves sufficient to cover probable losses associated with such
claims. We do not expect that the resolution of any pending claims or
investigations will have a material adverse effect on our financial condition,
results of operations or cash flows. There can be no assurance,
however, that future claims or investigations, or the costs associated with
responding to such claims or investigations, especially claims and
investigations not covered by insurance, will not have a material adverse effect
on our results of operations.
-99-
Manufacturers
of medical products may face exposure to significant product liability claims.
To date, we have not experienced any product liability claims that are material
to our financial statements or condition, but any such claims arising in the
future could have a material adverse effect on our business or results of
operations. We currently maintain commercial product liability insurance of $25
million per incident and $25 million in the aggregate annually, which we believe
is adequate. This coverage is on a claims-made basis. There can be no
assurance that claims will not exceed insurance coverage, that the carriers will
be solvent or that such insurance will be available to us in the future at a
reasonable cost.
Our
operations are subject, and in the past have been subject, to a number of
environmental laws and regulations governing, among other things, air emissions,
wastewater discharges, the use, handling and disposal of hazardous substances
and wastes, soil and groundwater remediation and employee health and safety. In
some jurisdictions environmental requirements may be expected to become more
stringent in the future. In the United States certain environmental laws can
impose liability for the entire cost of site restoration upon each of the
parties that may have contributed to conditions at the site regardless of fault
or the lawfulness of the party’s activities. While we do not believe
that the present costs of environmental compliance and remediation are material,
there can be no assurance that future compliance or remedial obligations would
not have a material adverse effect on our financial condition, results of
operations or cash flows.
On April
7, 2006, CONMED received a copy of a complaint filed in the United States
District for the Northern District of New York on behalf of a purported class of
former CONMED Linvatec sales representatives. The complaint alleges
that the former sales representatives were entitled to, but did not receive,
severance in 2003 when CONMED Linvatec restructured its distribution
channels. The range of loss associated with this complaint ranges
from $0 to $3.0 million, not including any interest, fees or costs that might be
awarded if the five named plaintiffs were to prevail on their own behalf as well
as on behalf of the approximately 70 (or 90 as alleged by the plaintiffs) other
members of the purported class. CONMED Linvatec did not
generally pay severance during the 2003 restructuring because the former sales
representatives were offered sales positions with CONMED Linvatec’s new
manufacturer’s representatives. Other than three of the five named
plaintiffs in the class action, nearly all of CONMED Linvatec’s former sales
representatives accepted such positions.
The
Company’s motions to dismiss and for summary judgment, which were heard at a
hearing held on January 5, 2007, were denied by a Memorandum Decision and Order
dated May 22, 2007. The District Court also granted the plaintiffs’
motion to certify a class of former CONMED Linvatec sales representatives whose
employment with CONMED Linvatec was involuntarily terminated in 2003 and who did
not receive severance benefits. With discovery essentially
completed, on July 21, 2008, the Company filed motions seeking summary judgment
and to decertify the class. In addition, on July 21, 2008, Plaintiffs
filed a motion seeking summary judgment. These motions were submitted
for decision on August 26, 2008. There is no fixed time frame within which the
Court is required to rule on the motions. The Company believes there
is no merit to the claims asserted in the Complaint, and plans to vigorously
defend the case. There can be no assurance, however, that the Company
will prevail in the litigation.
-100-
Note
11 — Other expense (income)
Other
expense (income) for the year ended December 31, consists of the
following:
|
2007
|
2008
|
2009
|
||||||||||
|
Termination
of product offering
|
$ | 148 | $ | - | $ | - | ||||||
|
Facility
closure costs
|
1,822 | - | ||||||||||
|
Gain
on litigation settlement
|
(6,072 | ) | - | - | ||||||||
|
Product
liability settlement
|
1,295 | - | - | |||||||||
|
New
plant/facility consolidation costs
|
- | 1,577 | 2,726 | |||||||||
|
Net
pension gain
|
- | - | (1,882 | ) | ||||||||
|
Product
recall
|
- | - | 5,992 | |||||||||
|
CONMED
Endoscopic Technologies division consolidation costs
|
- | - | 4,080 | |||||||||
|
Other
expense (income)
|
$ | (2,807 | ) | $ | 1,577 | $ | 10,916 | |||||
During
2004, we elected to terminate our surgical lights product line. We
instituted a customer replacement program whereby all currently installed
surgical lights were replaced by CONMED. We recorded charges totaling
$5.5 million related to the surgical lights customer replacement program
(including $0.1 million in the year ended December 31, 2007) in other expense
(income). The surgical lights customer replacement program was
completed during the second quarter of 2007.
During
2006, we elected to close our facility in Montreal, Canada which manufactured
products for our CONMED Linvatec line of integrated operating room systems and
equipment. The products which had been manufactured in the Montreal
facility are now purchased from third party vendors. The closing of
this facility was completed in the first quarter of 2007. We incurred
a total of $2.2 million in costs associated with this closure, of which $1.3
million related to the write-off of inventory and was included in cost of goods
sold during 2006. The remaining $0.9 million (including $0.3 million
in 2007) primarily relates to severance expense and the disposal of fixed assets
and has been recorded in other expense (income).
During
2007, we elected to close our CONMED Endoscopic Technologies sales office in
France and incurred $1.5 million in costs associated with this closure primarily
related to severance expense. We have recorded such costs in other
expense (income).
In
November 2003, we commenced litigation against Johnson & Johnson and several
of its subsidiaries, including Ethicon, Inc. for violations of federal and state
antitrust laws. In the lawsuit we claimed that Johnson & Johnson engaged in
illegal and anticompetitive conduct with respect to sales of product used in
endoscopic surgery, resulting in higher prices to consumers and the exclusion of
competition. We sought relief including an injunction restraining
Johnson & Johnson from continuing its anticompetitive practices as well as
receiving the maximum amount of damages allowed by law. During the
litigation, Johnson & Johnson represented that the marketing practices which
gave rise to the litigation had been altered with respect to
CONMED. On March 31, 2007, CONMED and Johnson & Johnson settled
the litigation. Under the terms of the final settlement agreement,
CONMED received a payment of $11.0 million from Johnson & Johnson in return
for which we terminated the lawsuit. After deducting legal and other
related costs, we recorded a pre-tax gain of $6.1 million related to the
settlement which we have recorded in other expense (income).
-101-
Two of
the Company’s subsidiaries settled a product liability claim asserted against it
and several of the Company’s subsidiaries in a case captioned Wehner v. Linvatec
Corp., et al. Total settlement and defense related costs amounted to
$1.3 million which were recorded in other expense (income) during
2007.
During
2008, we announced a plan to restructure certain of our
operations. We incurred $18.6 million in restructuring costs of which
$4.3 million (including $1.6 million and $2.7 million in the years ending
December 31, 2008 and 2009, respectively) have been recorded in other expense
(income) and include charges related to the consolidation of our distribution
centers. The remaining $14.3 million (including $2.5 million and
$11.8 million in the years ending December 31, 2008 and 2009, respectively) in
restructuring costs have been charged to cost of goods sold and represent
startup activities associated with a new manufacturing facility in Chihuahua,
Mexico and the closure of two Utica, New York area manufacturing facilities (See
Note 17).
During
2009, we elected to freeze benefit accruals under the defined benefit pension
plan for United States employees, effective May 14, 2009. As a
result, we recorded a net pension gain of $1.9 million in the first quarter of
2009 associated with the elimination of future benefit accruals under the
pension plan (see Note 9).
During
2009, we announced a voluntary recall of certain model numbers of the PRO5 &
PRO6 series battery handpieces and certain lots of the MC5057 Universal Cable
used with certain of CONMED Linvatec’s powered handpieces. Current
models of products are not affected. The cost of this recall is
expected to be approximately $6.0 million and we have recorded this cost in
2009. We have performed repairs on $0.9 million of the total $6.0
million of expected costs in 2009.
During
2009, we elected to consolidate the administrative offices and operations of the
CONMED Endoscopic Technologies division from its offices in Chelmsford,
Massachusetts to our Corporate headquarters in Utica, New York. The
sales force and product portfolio remain unchanged and CONMED Endoscopic
Technologies continues to operate as a separate division of the
Company. We incurred a total of $4.9 million in charges of which $4.1
million have been recorded in other expense (income) and include charges
relating to severance, lease termination costs, write down of fixed assets and
other transition costs. The remaining $0.8 million in costs relate to
the write-down of inventory and is included in cost of goods sold. We
believe the divisional consolidation is now complete and do not expect any
further costs.
Note
12 — Guarantees
We provide warranties on certain of our
products at the time of sale. The standard warranty period for our
capital and reusable equipment is generally one year. Liability under
service and warranty policies is based upon a review of historical warranty and
service claim experience. Adjustments are made to accruals as claim
data and historical experience warrant.
-102-
Changes in the carrying amount of
service and product warranties for the year ended December 31, are as
follows:
|
|
2007
|
2008
|
2009
|
|||||||||
|
Balance
as of January 1,
|
$ | 3,617 | $ | 3,306 | $ | 3,341 | ||||||
|
Provision
for warranties
|
3,078 | 3,581 | 3,638 | |||||||||
|
Claims
made
|
(3,389 | ) | (3,546 | ) | (3,596 | ) | ||||||
|
Balance
as of December 31,
|
$ | 3,306 | $ | 3,341 | $ | 3,383 | ||||||
Note
13 – Fair Value Measurement
In March
2008, the FASB issued guidance which requires entities to provide enhanced
disclosure about how and why the entity uses derivative instruments, how the
instruments and related hedged items are accounted and how the instruments and
related hedged items affect the financial position, results of operations, and
cash flows of the entity. We adopted such guidance during the quarter ended
March 31, 2009.
We enter
into derivative instruments for risk management purposes only. We
operate internationally and, in the normal course of business, are exposed to
fluctuations in interest rates, foreign exchange rates and commodity prices.
These fluctuations can increase the costs of financing, investing and operating
the business. We use forward contracts, a type of derivative instrument, to
manage our foreign currency exposures.
By
nature, all financial instruments involve market and credit risks. We enter into
forward contracts with a major investment grade financial institution and have
policies to monitor credit risk. While there can be no assurance, we
do not anticipate any material non-performance by our counterparty.
Foreign Currency Forward
Contracts. We manage our foreign currency transaction risks
through the use of forward contracts to hedge forecasted cash flows associated
with foreign currency transaction exposures. We account for these
forward contracts as cash flow hedges. To the extent these forward
contracts meet hedge accounting criteria, changes in their fair value are not
included in current earnings but are included in Accumulated Other Comprehensive
Loss. These changes in fair value will be reclassified into earnings
as a component of sales when the forecasted transaction occurs. The
notional contract amounts for forward contracts outstanding at December 31, 2009
which have been accounted for as cash flow hedges totaled $80.2
million. Net realized losses recognized for forward contracts
accounted for as cash flow hedges approximated $0.4 million for the year ended
December 31, 2009. Net unrealized gains on forward contracts
outstanding which have been accounted for as cash flow hedges and which have
been included in accumulated other comprehensive income (loss) totaled $0.1
million at December 31, 2009. These unrealized gains will be
recognized in income in 2010.
We also
enter into forward contracts to exchange foreign currencies for United States
dollars in order to hedge our currency transaction exposures on intercompany
receivables denominated in foreign currencies. These forward
contracts settle each month at month-end, at which time we enter into new
forward contracts. We have not designated these forward contracts as
hedges and have not applied hedge accounting to them. The notional
contract amounts for forward contracts outstanding at December 31, 2009 which
have not been designated as hedges totaled $28.6 million. Net
realized losses recognized in connection with those forward contracts not
accounted for as hedges approximated $3.9 million for the year ended
December 31, 2009, offsetting gains on our intercompany receivables of $4.6
million for the year ended December 31, 2009. These gains and losses
have been recorded in selling and administrative expense in the consolidated
statements of income.
-103-
We record
these forward foreign exchange contracts at fair value; the following
table summarizes the fair value for forward foreign exchange contracts
outstanding at December 31, 2009:
|
Asset
Balance Sheet
Location
|
Fair
Value
|
Liabilities
Balance
Sheet
Location
|
Fair
Value
|
Net
Fair
Value
|
||||||
|
Derivatives
designated as hedged instruments:
|
||||||||||
|
Foreign
Exchange Contracts
|
Prepaid
Expenses and other current assets
|
$739
|
Prepaid
Expenses and other current assets
|
$(618)
|
$121
|
|||||
|
Derivatives
not designated as hedging instruments:
|
||||||||||
|
Foreign
Exchange Contracts
|
Prepaid
Expenses and other current assets
|
25
|
Prepaid
Expenses and other current assets
|
(51)
|
(26)
|
|||||
|
Total
derivatives
|
$764
|
$(669)
|
$95
|
Our
forward foreign exchange contracts are subject to a master netting agreement and
qualify for netting in the consolidated balance sheets. Accordingly,
we have recorded the net fair value of $0.1 million in prepaid expenses and
other current assets.
Fair Value Disclosure. FASB
guidance, defines fair value, establishes a framework for measuring fair value
and related disclosure requirements. This guidance applies when fair value
measurements are required or permitted. The guidance indicates, among other
things, that a fair value measurement assumes that the transaction to sell an
asset or transfer a liability occurs in the principal market for the asset or
liability or, in the absence of a principal market, the most advantageous market
for the asset or liability. Fair value is defined based upon an exit price
model.
We
adopted this guidance as of January 1, 2008, with the exception of its
application to non-recurring nonfinancial assets and nonfinancial liabilities,
which was delayed to fiscal years beginning after November 15, 2008, which
we therefore adopted as of January 1, 2009. As of December 31, 2009, we do
not have any significant non-recurring measurements of nonfinancial assets and
nonfinancial liabilities.
-104-
Valuation Hierarchy. A
valuation hierarchy was established for disclosure of the inputs to the
valuations used to measure fair value. This hierarchy prioritizes the inputs
into three broad levels as follows. Level 1 inputs are quoted prices
(unadjusted) in active markets for identical assets or liabilities. Level 2
inputs are quoted prices for similar assets and liabilities in active markets,
quoted prices for identical or similar assets in markets that are not active,
inputs other than quoted prices that are observable for the asset or liability,
including interest rates, yield curves and credit risks, or inputs that are
derived principally from or corroborated by observable market data through
correlation. Level 3 inputs are unobservable inputs based on our own assumptions
used to measure assets and liabilities at fair value. A financial asset or
liability’s classification within the hierarchy is determined based on the
lowest level input that is significant to the fair value
measurement.
Valuation Techniques.
Liabilities carried at fair value and measured on a recurring basis as of
December 31, 2009 consist of forward foreign exchange contracts and two embedded
derivatives associated with our 2.50% convertible senior subordinated
notes. The value of these liabilities was determined within Level 2
of the valuation hierarchy and was not material either individually or in the
aggregate to our financial position, results of operations or cash
flows.
The
carrying amounts reported in our balance sheets for cash and cash equivalents,
accounts receivable, accounts payable and long-term debt excluding the 2.50%
convertible senior subordinated notes approximate fair value. The
fair value of the Notes approximated $97.2 million and $108.3 million at
December 31, 2008 and December 31, 2009, respectively, based on their quoted
market price. See Note 5 for additional discussion of the
Notes.
Note
14 - New Accounting Pronouncements
In June
2009, the FASB issued guidance which requires additional disclosures about the
transfer and derecognition of financial assets, eliminates the concept of
qualifying special-purpose entities, creates more stringent conditions for
reporting a transfer of a portion of a financial asset as a sale, clarifies
other sale-accounting criteria, and changes the initial measurement of a
transferor’s interest in transferred financial assets. This guidance is
effective for fiscal years beginning after November 15, 2009. Our
current off balance sheet arrangement in which a wholly-owned,
bankruptcy-remote, special purpose subsidiary of CONMED Corporation sells an
undivided percentage ownership interest in receivables to a bank under an
accounts receivable sales agreement, will no longer be permitted to be accounted
for as a sale and reduction in accounts receivable beginning in
2010. As a result, accounts receivable sold under the agreement
(which aggregated $29.0 million at December 31, 2009) would be recorded as
additional borrowings rather than as a reduction in accounts
receivable. There will be no impact to the results of
operations.
Note
15 – Business acquisition
On
January 9, 2008, we purchased our Italian distributor’s business for
approximately $21.8 million in cash (the “Italy acquisition”). Under
the terms of the acquisition agreement, we agreed to pay additional
consideration in 2009 based upon the 2008 results of the acquired
business.
-105-
The
following table summarizes the estimated fair values of the assets acquired and
liabilities assumed as a result of the Italy acquisition.
|
Cash
|
$ | 953 | ||
|
Inventory
|
3,444 | |||
|
Accounts
receivable
|
19,701 | |||
|
Other
assets
|
846 | |||
|
Customer
relationships
|
9,479 | |||
|
Total
assets acquired
|
34,423 | |||
|
Income
taxes payable
|
(2,443 | ) | ||
|
Other
current liabilities
|
(9,658 | ) | ||
|
Total
liabilities assumed
|
(12,101 | ) | ||
|
Net
assets acquired
|
$ | 22,322 |
The
unaudited pro forma statement of operations for the year ended December 31,
2007, assuming the Italy acquisition occurred as of January 1, 2007 is presented
below. This pro forma statement of operations has been prepared for
comparative purposes only and does not purport to be indicative of the results
of operations which actually would have resulted had the Italy acquisition
occurred on the dates indicated, or which may result in the future.
|
2007
|
||||
|
Net
sales
|
$ | 710,685 | ||
|
Net
income
|
41,069 | |||
|
Net
income per share:
|
||||
|
Basic
|
$ | 1.45 | ||
|
Diluted
|
$ | 1.42 | ||
Note
16 – Convertible senior subordinated notes
In May
2008, the FASB issued guidance which specifies that issuers of convertible debt
instruments that permit or require the issuer to pay cash upon conversion should
separately account for the liability and equity components in a manner that will
reflect the entity’s nonconvertible debt borrowing rate when interest cost is
recognized in subsequent periods. The Company was required to apply the guidance
retrospectively to all past periods presented. We adopted this
guidance on January 1, 2009 related to our 2.50% convertible senior subordinated
notes due 2024 (“the Notes”).
Our
effective borrowing rate for nonconvertible debt at the time of issuance of the
Notes was estimated to be 6.67%, which resulted in $34.6 million of the
$150.0 million aggregate principal amount of Notes issued, or
$21.8 million after taxes, being attributable to equity. For the
years ended December 31, 2007, 2008 and 2009, we have recorded interest expense
related to the amortization of debt discount on the Notes of $4.6 million, $4.8
million and $4.1 million, respectively, at the effective interest rate of
6.67%. The debt discount on the Notes is being amortized through
November 2011. For the years ended December 31, 2007, 2008 and 2009,
we have recorded interest expense on the Notes of $3.8 million, $3.7 million and
$2.9 million, respectively, at the contractual coupon rate of
2.50%.
-106-
The
following table illustrates the effects of adopting the new guidance on each
Consolidated Balance Sheet line item as of December 31, 2008:
|
|
As
Originally
|
As
|
Effect
|
|||||||||
|
|
Reported
|
Adjusted
|
of Change
|
|||||||||
|
Long-term
debt
|
$ | 196,190 | $ | 182,739 | $ | (13,451 | ) | |||||
|
|
||||||||||||
|
Deferred
income taxes
|
83,498 | 88,468 | 4,970 | |||||||||
|
Total
liabilities
|
399,927 | 391,446 | (8,481 | ) | ||||||||
|
Paid-in
capital
|
292,251 | 313,830 | 21,579 | |||||||||
|
|
||||||||||||
|
Retained
earnings
|
327,471 | 314,373 | (13,098 | ) | ||||||||
|
Total
shareholders’ equity
|
531,734 | 540,215 | 8,481 | |||||||||
The
following tables illustrate the effects of adopting the new guidance on each
Consolidated Statement of Operations and Consolidated Statement of Cash Flows
for the years ended December 31, 2007 and 2008:
|
|
As
Originally
|
As
|
Effect
|
|||||||||
|
|
Reported
|
Adjusted
|
of Change
|
|||||||||
|
Consolidated
statement of operations
|
||||||||||||
|
for
the year ended December 31, 2007:
|
||||||||||||
|
Amortization
of debt discount
|
$ | - | $ | 4,618 | $ | 4,618 | ||||||
|
|
||||||||||||
|
Income
before income taxes
|
64,757 | 60,139 | (4,618 | ) | ||||||||
|
Provision
for income taxes
|
23,301 | 21,595 | (1,706 | ) | ||||||||
|
Net
income
|
41,456 | 38,544 | (2,912 | ) | ||||||||
|
EPS:
|
||||||||||||
|
Basic
|
$ | 1.46 | $ | 1.36 | $ | (.10 | ) | |||||
|
Diluted
|
1.43 | 1.33 | (.10 | ) | ||||||||
|
Consolidated
statement of operations
|
||||||||||||
|
for
the year ended December 31, 2008:
|
||||||||||||
|
Gain
on early extinguishment of debt
|
$ | 4,376 | $ | 1,947 | $ | (2,429 | ) | |||||
|
Amortization
of debt discount
|
- | 4,823 | 4,823 | |||||||||
|
|
||||||||||||
|
Income
before income taxes
|
69,263 | 62,011 | (7,252 | ) | ||||||||
|
Provision
for income taxes
|
24,702 | 22,022 | (2,680 | ) | ||||||||
|
Net
income
|
44,561 | 39,989 | (4,572 | ) | ||||||||
|
EPS:
|
||||||||||||
|
Basic
|
$ | 1.55 | $ | 1.39 | $ | (.16 | ) | |||||
|
Diluted
|
1.52 | 1.37 | (.15 | ) | ||||||||
-107-
|
Consolidated
statement of cash flow for
|
||||||||||||
|
the
year ended December 31, 2007:
|
||||||||||||
|
|
||||||||||||
|
Net
income
|
$ | 41,456 | $ | 38,544 | $ | (2,912 | ) | |||||
|
Amortization
of debt discount
|
- | 4,618 | 4,618 | |||||||||
|
Deferred
income taxes
|
16,714 | 15,008 | (1,706 | ) | ||||||||
|
Consolidated
statement of cash flow for
|
||||||||||||
|
the
year ended December 31, 2008:
|
||||||||||||
|
|
||||||||||||
|
Net
income
|
$ | 44,561 | $ | 39,989 | $ | (4,572 | ) | |||||
|
Amortization
of debt discount
|
- | 4,823 | 4,823 | |||||||||
|
Deferred
income taxes
|
18,984 | 16,304 | (2,680 | ) | ||||||||
Note
17 – Restructuring
During
2009, we completed the first phase of our operational restructuring plan which
we had previously announced in the second quarter of 2008. The
restructuring included the closure of two manufacturing facilities located in
the Utica, New York area totaling approximately 200,000 square feet with
manufacturing transferred into either our Corporate headquarters location in
Utica, New York or into a newly constructed leased manufacturing facility in
Chihuahua, Mexico. In addition, manufacturing previously done by a
contract manufacturing facility in Juarez, Mexico was transferred in-house to
the Chihuahua facility. Finally, certain domestic distribution
activities were centralized in a new leased consolidated distribution center in
Atlanta, Georgia. We believe our restructuring will reduce our cost
base by consolidating our Utica, New York operations into a single facility and
expanding our lower cost Mexican operations, as well as improve service to our
customers by shipping orders from more centralized distribution
centers. The closure of the two manufacturing facilities,
consolidation of distribution activities and the first phase of transitioning
manufacturing operations was substantially complete as of December 31,
2009.
During
2010, we plan to enter into the second phase of our restructuring plan which
contemplates transferring additional production lines from Utica, New York to
our manufacturing facility in Chihuahua, Mexico. We expect to incur
$2.5 million in costs associated with the second phase of our restructuring
plan.
In
conjunction with our restructuring plan, we considered FASB guidance which
requires that long-lived assets be tested for recoverability whenever events or
changes in circumstances indicate that their carrying amount may not be
recoverable. As a result of our restructuring, two manufacturing
facilities located in the Utica, New York area were closed prior to the end of
their previously estimated useful lives. We determined one facility
did not have any value and therefore recorded a $0.5 million charge for the
remaining net book value of the facility in the fourth quarter of
2009. We plan to sell or lease the second facility and have tested it
for impairment under the guidance for long-lived assets to be held and
used. We performed our impairment testing on the second facility by
comparing future cash flows expected to be generated by this facility
(undiscounted and without interest charges) against the carrying amount ($2.1
million as of December 31, 2009). Since future cash flows expected to
be generated by the second facility exceed its carrying amount, we do not
believe any impairment exists at this time. However, we cannot be
certain an impairment charge will not be required in the future.
-108-
As of
December 31, 2009, we have incurred $18.6 million (including $4.1 million and
$14.5 million, in the years ended December 31, 2008 and 2009, respectively) in
costs associated with our restructuring.
Approximately
$14.3 million (including $2.5 million and $11.8 million in the years ended
December 31, 2008 and 2009, respectively) of the total $18.6 million in
restructuring costs have been charged to cost of goods sold. The
$14.3 million charged to cost of goods sold includes $6.1 million in under
utilization of production facilities (including $1.2 million and $4.9 million,
in the years ended December 31, 2008 and 2009, respectively), $2.4 million in
accelerated depreciation (including $0.3 million and $2.1 million, in the years
ended December 31, 2008 and 2009, respectively), $2.1 million in severance
related charges (including $0.1 million and $2.0 million, in the years ended
December 31, 2008 and 2009, respectively), and $3.7 million in other charges
(including $0.9 million and $2.8 million, in the years ended December 31, 2008
and 2009, respectively).
The
remaining $4.3 million (including $1.6 million and $2.7 million, in the years
ended December 31, 2008 and 2009, respectively) in restructuring costs have been
recorded in other expense and primarily include severance, lease and other
charges related to the consolidation of our distribution centers.
As the
second phase of our restructuring plan progresses, we will incur additional
charges, including employee termination and other exit costs. Based
on the criteria contained within FASB guidance, no accrual for such costs has
been made at this time.
We
estimate the total costs of the second phase of our restructuring plan will
approximate $2.5 million during 2010, including $1.3 million related to employee
termination costs and $1.2 million in other restructuring related activities. We
expect these restructuring costs will be charged to cost of goods
sold. The second phase of the restructuring plan impacts Corporate
manufacturing facilities which support multiple reporting
segments. As a result, costs associated with the second phase of our
restructuring plan will be reflected in the Corporate line within our business
segment reporting.
Note
18 – Subsequent Events
We
evaluated subsequent events through February 25, 2010, the date the financial
statements have been issued.
Note
19 — Selected Quarterly Financial Data (Unaudited)
Selected quarterly financial data for
2008 and 2009 are as follows:
|
|
Three Months Ended
|
|||||||||||||||
|
|
March
|
June
|
September
|
December
|
||||||||||||
|
2008
|
||||||||||||||||
|
Net
sales
|
$ | 190,773 | $ | 192,755 | $ | 179,409 | $ | 179,246 | ||||||||
|
Gross
profit
|
97,764 | 100,890 | 94,688 | 89,039 | ||||||||||||
|
Net
income
|
10,252 | 11,685 | 9,735 | 8,317 | ||||||||||||
|
EPS:
|
||||||||||||||||
|
Basic
|
$ | .36 | $ | .41 | $ | .34 | $ | .28 | ||||||||
|
Diluted
|
.35 | .40 | .33 | .28 | ||||||||||||
-109-
|
|
Three Months Ended
|
|||||||||||||||
|
|
March
|
June
|
September
|
December
|
||||||||||||
|
2009
|
||||||||||||||||
|
Net
sales
|
$ | 164,062 | $ | 164,569 | $ | 175,475 | $ | 190,633 | ||||||||
|
Gross
profit
|
76,352 | 77,312 | 87,636 | 96,032 | ||||||||||||
|
Net
income
|
4,485 | 1,409 | 1,288 | 4,955 | ||||||||||||
|
EPS:
|
||||||||||||||||
|
Basic
|
$ | .15 | $ | .05 | $ | .04 | $ | .17 | ||||||||
|
Diluted
|
.15 | .05 | .04 | .17 | ||||||||||||
Unusual
Items Included In Selected Quarterly Financial Data:
2008
First
quarter
During
the first quarter of 2008, we recorded a charge of $1.0 million to cost of goods
sold related to the purchase accounting fair value adjustment for inventory
acquired in connection with the purchase of our Italian
distributor.
Second
Quarter
There
were no unusual items in the second quarter of 2008.
Third
Quarter
During
the third quarter of 2008, we recorded a charge of $0.7 million in other expense
(income) related to the restructuring of certain of our operations –
see Note 11 and Note 17.
Fourth
Quarter
During the fourth quarter of 2008, we
recorded a gain of $1.9 million on the early extinguishment of debt – see Note
5.
During
the fourth quarter of 2008, we recorded a charge of $3.4 million related to the
restructuring of certain of our operations; $2.5 million of the
charge is recorded in cost of goods sold and $0.9 million is recorded in other
expense (income) – see Note 11 and Note 17.
2009
First
quarter
During
the first quarter of 2009, we recorded a charge of $3.4 million related to the
restructuring of certain of our operations; $2.9 million of the
charge is recorded in cost of goods sold and $0.5 million is recorded in other
expense (income)– see Note 11 and Note 17.
During
the first quarter of 2009, we elected to freeze benefit accruals under the
defined benefit pension plan for United States employees, effective May 14,
2009. As a result, we recorded a net pension gain in other expense
(income) of $1.9 million associated with the elimination of future benefit
accruals under the pension plan – see Note 9 and Note 11.
-110-
During
the first quarter of 2009, we repurchased and retired $9.9 million of the Notes
for $7.8 million and recorded a gain on the early extinguishment of debt of $1.1
million net of the write-offs of $0.1 million in unamortized deferred financing
costs and $1.0 million in unamortized debt discount – See Note 5.
Second
Quarter
During
the second quarter of 2009, we recorded a charge of $4.4 million related to the
restructuring of certain of our operations; $3.7 million of the
charge is recorded in cost of goods sold and $0.7 million is recorded in other
expense (income) – see Note 11 and Note 17.
Third
Quarter
During
the third quarter of 2009, we recorded a charge of $3.3 million related to the
restructuring of certain of our operations; $2.2 million of the
charge is recorded in cost of goods sold and $1.1 million is recorded in other
expense (income) – see Note 11 and Note 17.
During
the third quarter of 2009, we recorded a charge of $6.0 million in other expense
(income) related to the voluntary recall of certain model numbers of the PRO5
& PRO6 series battery handpieces and certain lots of the MC5057 Universal
Cable used with certain of CONMED Linvatec’s powered handpieces – see Note
11.
During
the third quarter of 2009, we recorded a charge of $0.3 million in other expense
(income) related to the consolidation of the administrative offices of CONMED
Endoscopic Technologies – see Note 11.
Fourth
Quarter
During the fourth quarter of 2009, we
recorded a charge of $3.4 million related to the restructuring of certain of our
operations; $3.0 million of the charge is recorded in cost of goods
sold and $0.4 million is recorded in other expense (income) – see Note 11 and
Note 17.
During
the fourth quarter of 2009, we recorded a charge of $4.6 million related to the
consolidation of the administrative offices and operations of CONMED Endoscopic
Technologies; $0.8 million of the charge is recorded in cost of goods
sold and $3.8 million is recorded in other expense (income)– see Note
11.
-111-
SCHEDULE
II—Valuation and Qualifying Accounts
(in
thousands)
|
Column C
|
||||||||||||||||||||
|
Additions
|
||||||||||||||||||||
|
Column B
|
||||||||||||||||||||
|
Balance
at
|
Charged
to
|
Charged
to
|
Column E
|
|||||||||||||||||
|
Column A
|
Beginning
of
|
Costs
and
|
Other
|
Column D
|
Balance
at End
|
|||||||||||||||
|
Description
|
Period
|
Expenses
|
Accounts
|
Deductions
|
of Period
|
|||||||||||||||
|
2009
|
||||||||||||||||||||
|
Allowance
for bad debts
|
$ | 1,370 | $ | 119 | $ | - | $ | (314 | ) | $ | 1,175 | |||||||||
|
Sales
returns and
|
||||||||||||||||||||
|
allowance
|
2,974 | 647 | - | (265 | ) | 3,356 | ||||||||||||||
|
Deferred
tax asset
|
||||||||||||||||||||
|
valuation
allowance
|
2,069 | 278 | - | (1,289 | ) | 1,058 | ||||||||||||||
|
2008
|
||||||||||||||||||||
|
Allowance
for bad debts
|
$ | 787 | $ | 453 | $ | 285 | $ | (155 | ) | $ | 1,370 | |||||||||
|
Sales
returns and
|
||||||||||||||||||||
|
allowance
|
3,030 | - | - | (56 | ) | 2,974 | ||||||||||||||
|
Deferred
tax asset
|
||||||||||||||||||||
|
valuation
allowance
|
4,209 | - | - | (2,140 | ) | 2,069 | ||||||||||||||
|
2007
|
||||||||||||||||||||
|
Allowance
for bad debts
|
$ | 1,210 | $ | 346 | $ | - | $ | (769 | ) | $ | 787 | |||||||||
|
Sales
returns and
|
||||||||||||||||||||
|
allowance
|
2,964 | 446 | - | (380 | ) | 3,030 | ||||||||||||||
|
Deferred
tax asset
|
||||||||||||||||||||
|
valuation
allowance
|
6,892 | 805 | - | (3,488 | ) | 4,209 | ||||||||||||||
-112-