Attached files
| file | filename |
|---|---|
| 8-K - 8-K - CLOUD PEAK ENERGY INC. | a10-2426_18k.htm |
Exhibit 99.1
|
|
Credit Suisse Energy Summit 2010 February 2, 2010 |
|
|
1 Cautionary Note Regarding Forward-Looking Statements This presentation contains “forward-looking statements” within the meaning of the safe harbor provisions of Section 27A of the Securities Act of 1933 and Section 21E of the Securities Exchange Act of 1934. Forward-looking statements are not statements of historical facts, and such statements often contain words such as “may,” “will,” “expect,” “believe,” “anticipate,” “plan,” “estimate,” “seek,” “could,” “should,” “intend,” “potential,” or words of similar meaning. These forward-looking statements are based on management’s current expectations or beliefs, as well as assumptions and estimates made by management regarding our company, industry, economic conditions, government regulations and other factors. These statements are subject to significant risks, uncertainties and assumptions that are difficult to predict and could cause actual results to differ materially from those expressed or implied in the forward-looking statements. For a description of some of the risks and uncertainties that may affect our future results, you should see the risk factors described from time to time in the reports and registration statements we file with the Securities and Exchange Commission, including those in the "Risk Factors" section of our final prospectus filed with the Securities and Exchange Commission on November 23, 2009 (Registration No. 333-161293) and which is available on the investor relations section of our website at www.cloudpeakenergy.com/investor-relations . In addition, there may be other risks and uncertainties that are not currently known to us or that we currently believe are not material. We make forward-looking statements based on currently available information, and we assume no obligation to, and expressly disclaim any obligation to, update or revise publicly any forward-looking statements made today or contained in our reports and registration statements we file with the Securities and Exchange Commission, whether as a result of new information, future events or otherwise, except as required by law. Non-GAAP Financial Measures This presentation may include certain non-GAAP financial measures, such as EBITDA. EBITDA is defined as income from continuing operations before deducting net interest expense, income taxes, asset retirement obligation expense, and depreciation, depletion and amortization. EBITDA is not defined under generally accepted accounting principles in the United States of America, or GAAP, and does not purport to be an alternative to net income or other GAAP financial measures as a measure of operating performance. Because not all companies use identical calculations, this presentation of EBITDA may not be comparable to other similarly titled measures of other companies. We use, and we believe investors benefit from the presentation of, EBITDA in evaluating our operating performance because it provides us and our investors with an additional tool to compare our operating performance. EBITDA may also be used as a performance measure in our compensation program for our executives. A quantitative reconciliation of EBITDA to income from continuing operations is found at www.cloudpeakenergy.com/investor-relations/webcasts-and-presentations, in the slides for the IPO Road Show Presentation, dated November 10, 2009. |
|
|
2 Cloud Peak Energy Highlights Significant growth opportunity Strong Powder River Basin (“PRB”) market dynamics, pricing upside, production growth and lease acquisitions Market outlook improving Positive start to the year Pure-play Powder River Basin Third-largest U.S. coal producer, operating three large surface mines in the U.S. coal basin with the greatest growth potential |
|
|
3 Cloud Peak Energy Inc. – IPO November 2009 Rio Tinto Energy America formed through acquisitions 1993 – 1998 2008 Rio Tinto decided to divest to reduce Alcan purchase debt 2008 Colowyo mine retained by Rio Tinto, Jacobs Ranch Mine sold to Arch Coal Traded NYSE – ticker symbol “CLD” Cloud Peak Energy Inc. Background |
|
|
4 Significant growth opportunity Market outlook improving Pure-play Powder River Basin Third largest U.S. coal producer Three large surface mines Operating in the U.S. coal basin with the greatest growth potential Cloud Peak Energy Highlights |
|
|
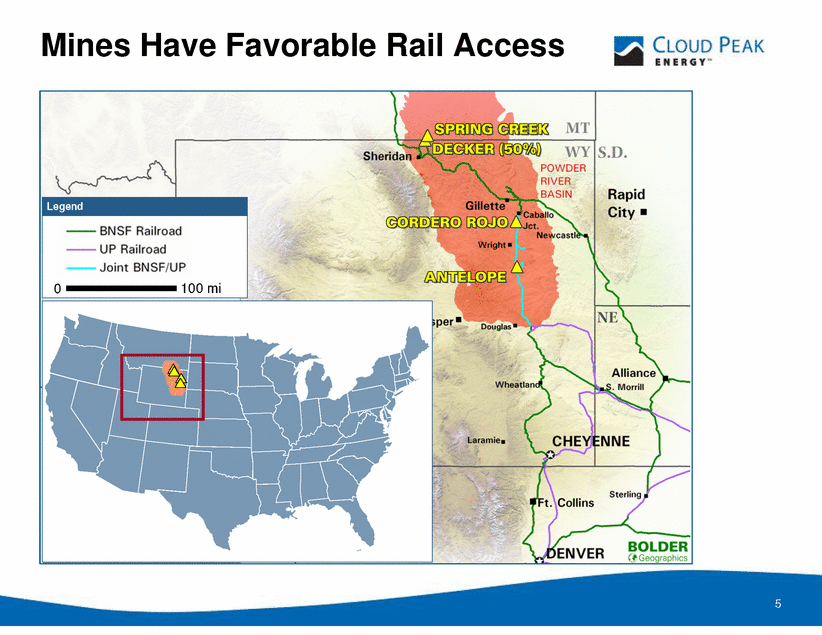
5 Mines Have Favorable Rail Access 0 100 mi Legend |
|
|
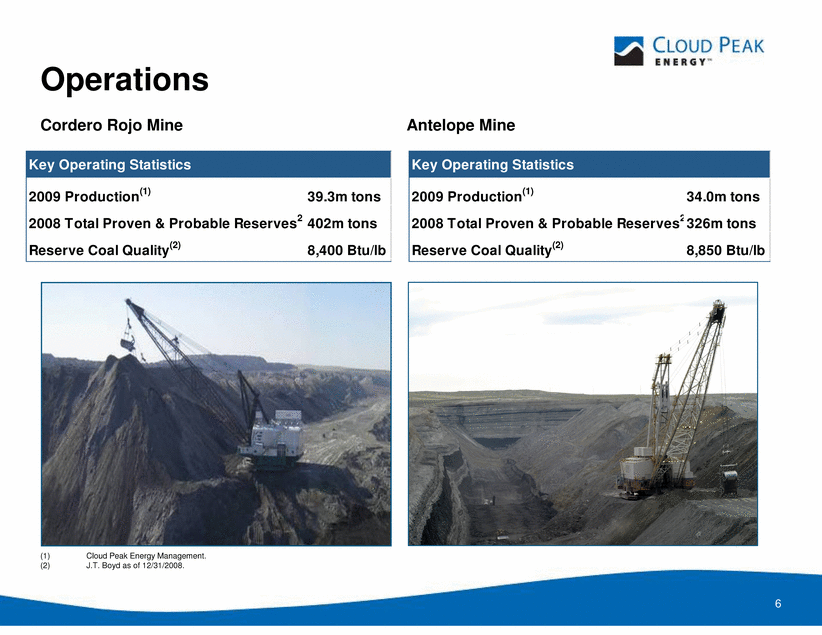
6 Operations (1) Cloud Peak Energy Management. (2) J.T. Boyd as of 12/31/2008. Key Operating Statistics 2009 Production(1) 34.0m tons 2008 Total Proven & Probable Reserves2326m tons Reserve Coal Quality(2) 8,850 Btu/lb Antelope Mine Cordero Rojo Mine Key Operating Statistics 2009 Production(1) 39.3m tons 2008 Total Proven & Probable Reserves2 402m tons Reserve Coal Quality(2) 8,400 Btu/lb |
|
|
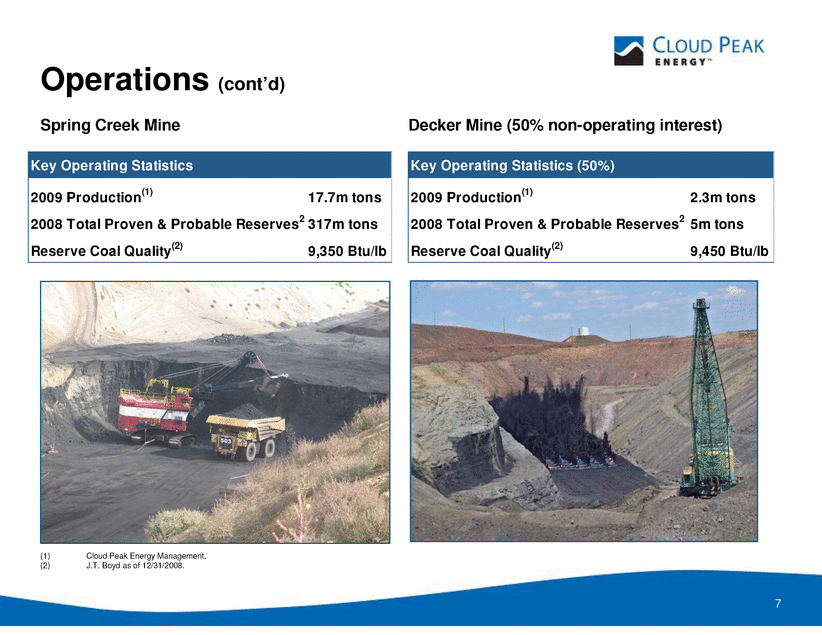
7 Operations (cont’d) Spring Creek Mine Decker Mine (50% non-operating interest) Key Operating Statistics 2009 Production(1) 17.7m tons 2008 Total Proven & Probable Reserves2 317m tons Reserve Coal Quality(2) 9,350 Btu/lb Key Operating Statistics (50%) 2009 Production(1) 2.3m tons 2008 Total Proven & Probable Reserves2 5m tons Reserve Coal Quality(2) 9,450 Btu/lb (1) Cloud Peak Energy Management. (2) J.T. Boyd as of 12/31/2008. |
|
|
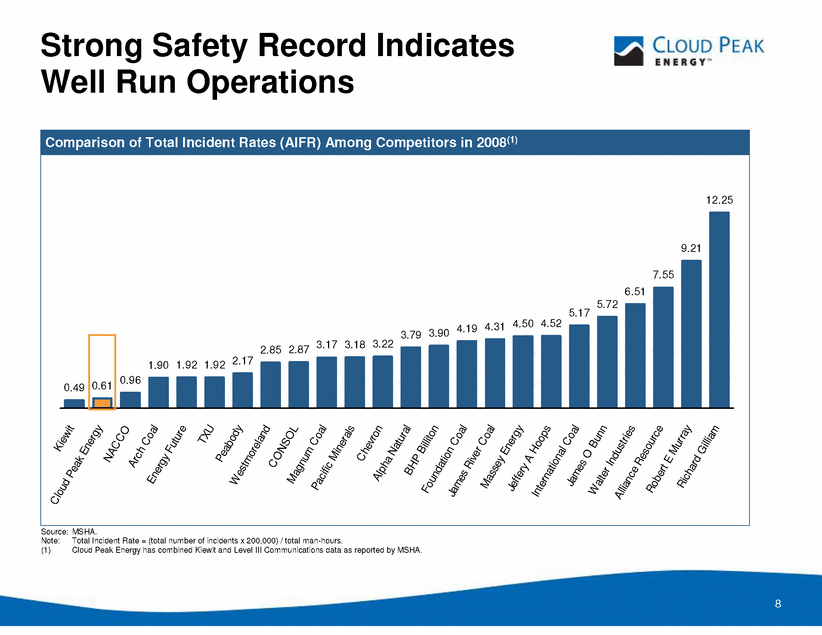
8 0.49 0.61 0.96 1.90 1.92 1.92 2.17 2.85 2.87 3.17 3.18 3.22 3.79 3.90 4.19 4.31 4.50 4.52 5.17 5.72 6.51 7.55 9.21 12.25 Kiewit Cloud Peak Energy NACCO Arch Coal Energy Future TXU Peabody Westmoreland CONSOL Magnum Coal Pacific Minerals Chevron Alpha Natural BHP Billiton Foundation Coal James River Coal Massey Energy Jeffery A Hoops International Coal James O Bunn Walter Industries Alliance Resource Robert E Murray Richard Gilliam Comparison of Total Incident Rates (AIFR) Among Competitors in 2008(1) Strong Safety Record Indicates Well Run Operations Source: MSHA. Note: Total Incident Rate = (total number of incidents x 200,000) / total man-hours. (1) Cloud Peak Energy has combined Kiewit and Level III Communications data as reported by MSHA. |
|
|
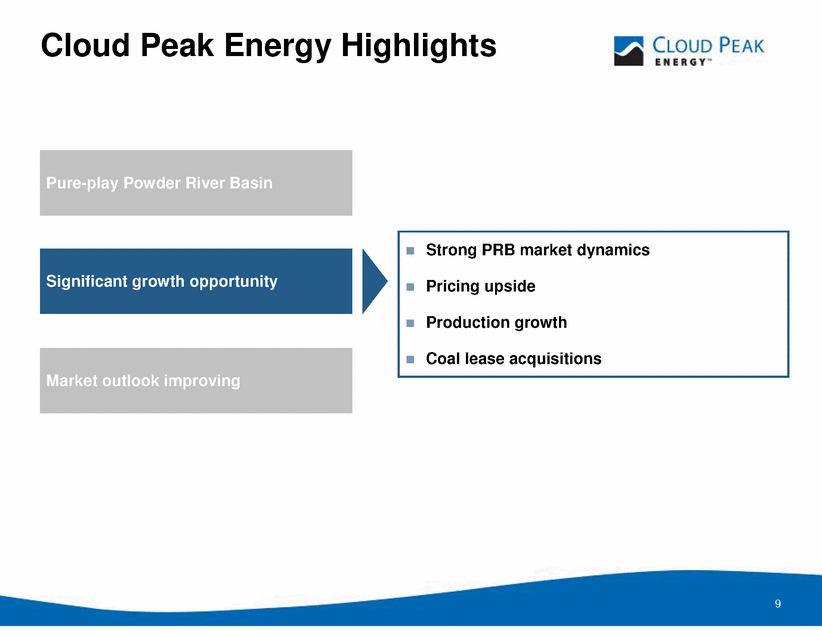
9 Market outlook improving Significant growth opportunity Strong PRB market dynamics Pricing upside Production growth Coal lease acquisitions Cloud Peak Energy Highlights Pure-play Powder River Basin |
|
|
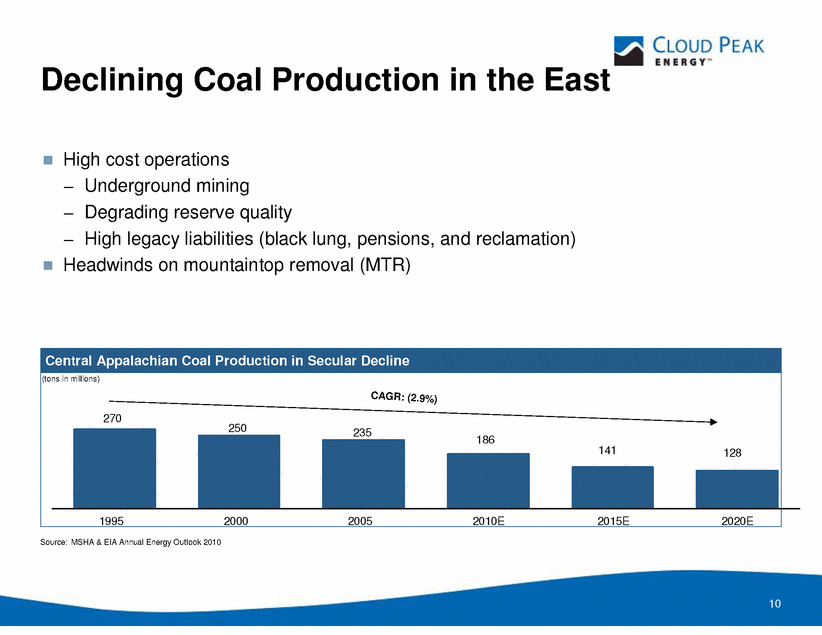
10 Declining Coal Production in the East Central Appalachian Coal Production in Secular Decline 128 141 186 235 250 270 1995 2000 2005 2010E 2015E 2020E High cost operations - Underground mining - Degrading reserve quality - High legacy liabilities (black lung, pensions, and reclamation) Headwinds on mountaintop removal (MTR) (tons in millions) CAGR: (2.9%) Source: MSHA & EIA Annual Energy Outlook 2010 |
|
|
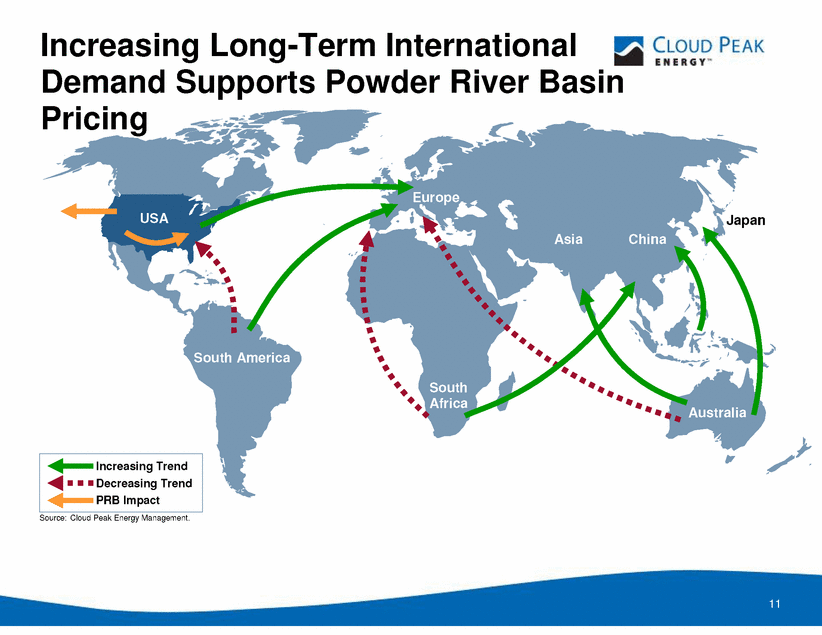
11 Increasing Long-Term International Demand Supports Powder River Basin Pricing Australia Japan China Europe USA South America South Africa Asia Source: Cloud Peak Energy Management. Increasing Trend Decreasing Trend PRB Impact |
|
|
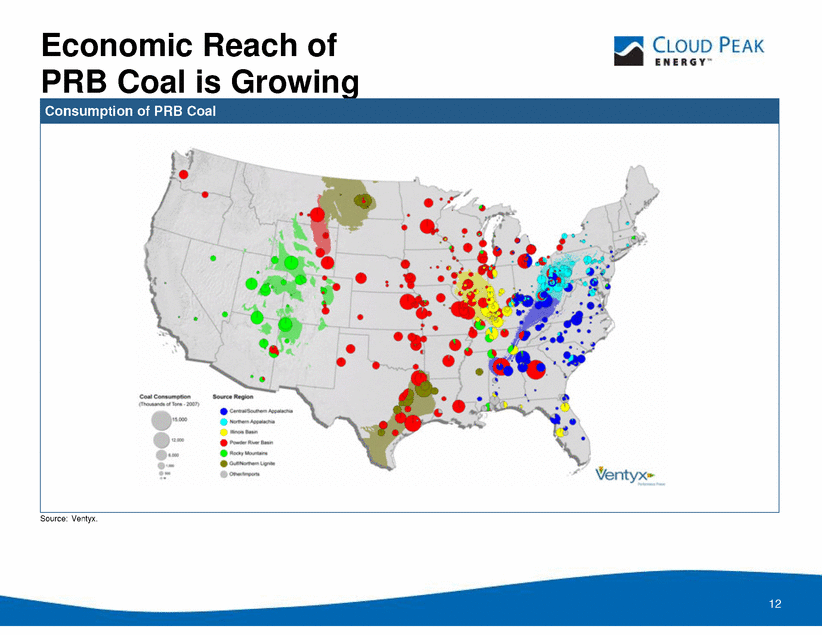
12 Source: Ventyx. Economic Reach of PRB Coal is Growing Consumption of PRB Coal |
|
|
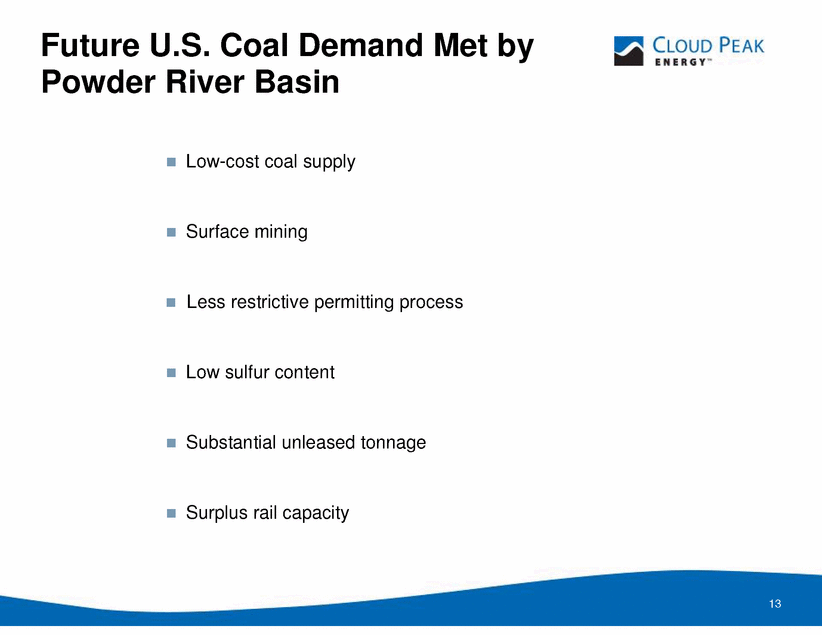
13 Future U.S. Coal Demand Met by Powder River Basin Low-cost coal supply Surface mining Less restrictive permitting process Low sulfur content Substantial unleased tonnage Surplus rail capacity |
|
|
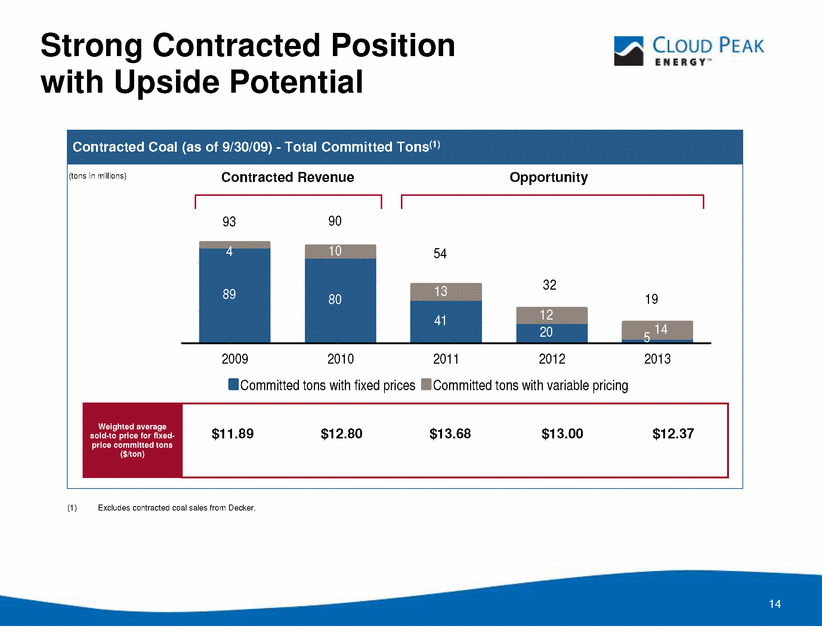
14 Strong Contracted Position with Upside Potential 89 80 41 20 10 13 12 5 14 4 93 54 32 19 90 2009 2010 2011 2012 2013 Committed tons with fixed prices Committed tons with variable pricing Contracted Coal (as of 9/30/09) - Total Committed Tons(1) Contracted Revenue Opportunity $11.89 $12.80 $13.68 $13.00 $12.37 Weighted average sold-to price for fixed-price committed tons ($/ton) (1) Excludes contracted coal sales from Decker. (tons in millions) |
|
|
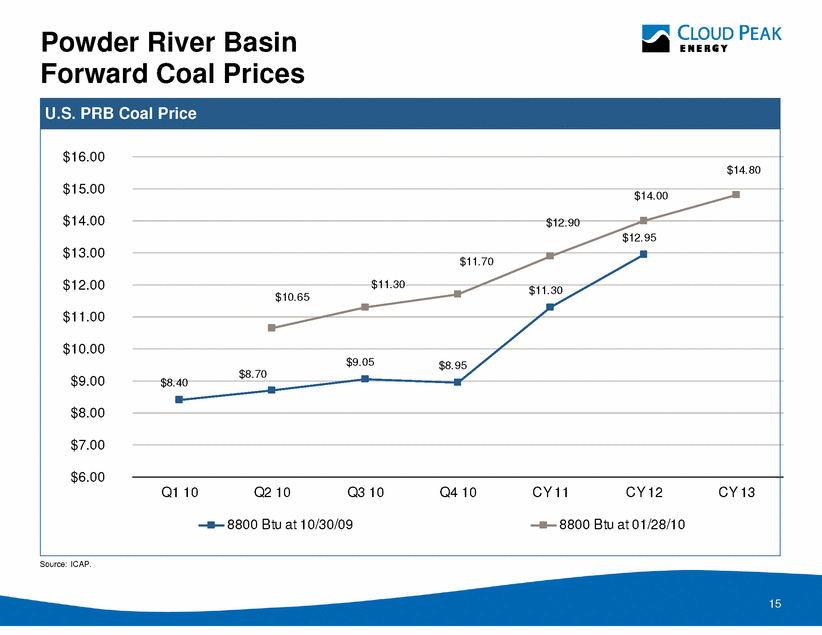
15 $8.40 $9.05 $8.95 $11.30 $12.95 $8.70 $10.65 $14.80 $14.00 $12.90 $11.70 $11.30 $6.00 $7.00 $8.00 $9.00 $10.00 $11.00 $12.00 $13.00 $14.00 $15.00 $16.00 Q1 10 Q2 10 Q3 10 Q4 10 CY 11 CY 12 CY 13 8800 Btu at 10/30/09 8800 Btu at 01/28/10 Powder River Basin Forward Coal Prices U.S. PRB Coal Price Source: ICAP. |
|
|
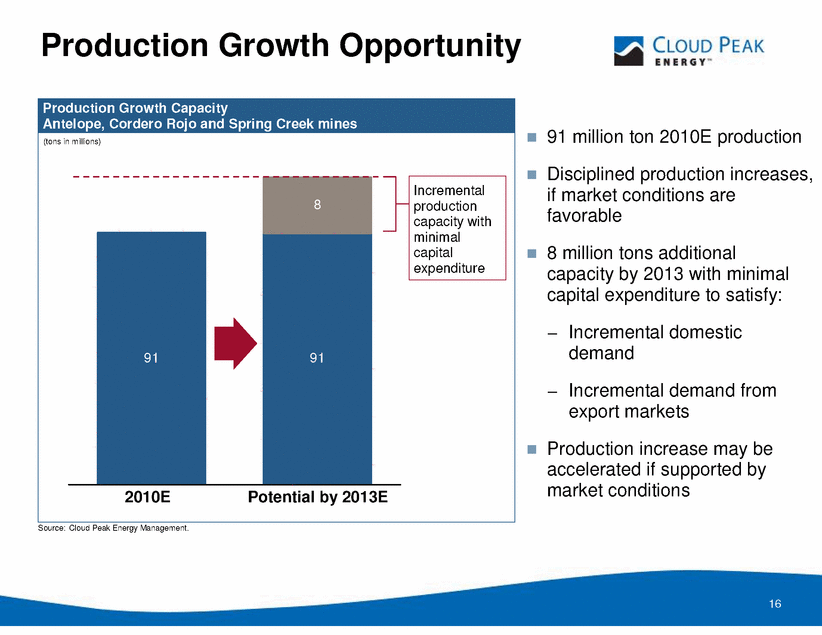
16 Production Growth Opportunity 91 million ton 2010E production Disciplined production increases, if market conditions are favorable 8 million tons additional capacity by 2013 with minimal capital expenditure to satisfy: - Incremental domestic demand - Incremental demand from export markets Production increase may be accelerated if supported by market conditions 91 91 8 Incremental production capacity with minimal capital expenditure 2010E Production Growth Capacity Antelope, Cordero Rojo and Spring Creek mines (tons in millions) Potential by 2013E Source: Cloud Peak Energy Management. |
|
|
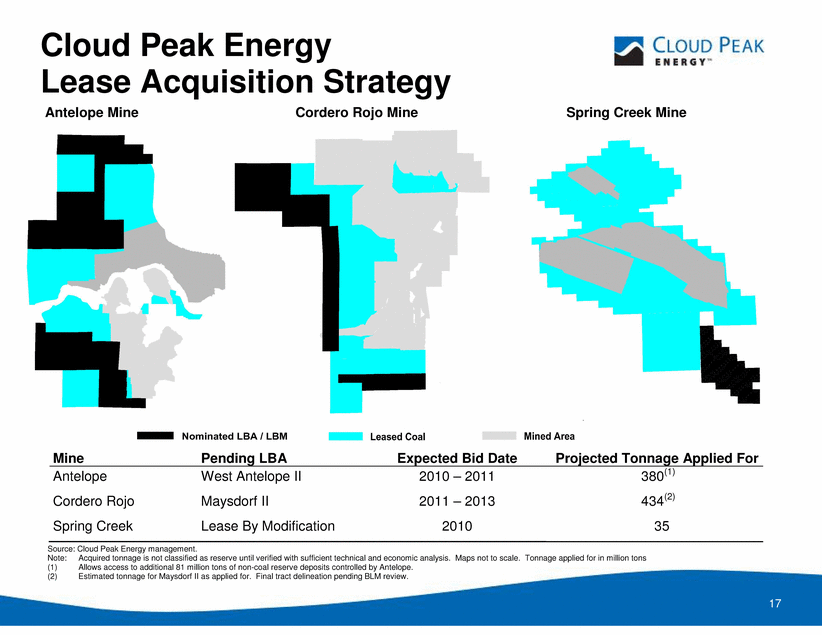
17 Cloud Peak Energy Lease Acquisition Strategy Source: Cloud Peak Energy management. Note: Acquired tonnage is not classified as reserve until verified with sufficient technical and economic analysis. Maps not to scale. Tonnage applied for in million tons (1) Allows access to additional 81 million tons of non-coal reserve deposits controlled by Antelope. (2) Estimated tonnage for Maysdorf II as applied for. Final tract delineation pending BLM review. Antelope Mine Cordero Rojo Mine Spring Creek Mine Mine Pending LBA Expected Bid Date Projected Tonnage Applied For Antelope West Antelope II 2010 – 2011 380(1) Cordero Rojo Maysdorf II 2011 – 2013 434(2) Spring Creek Lease By Modification 2010 35 |
|
|
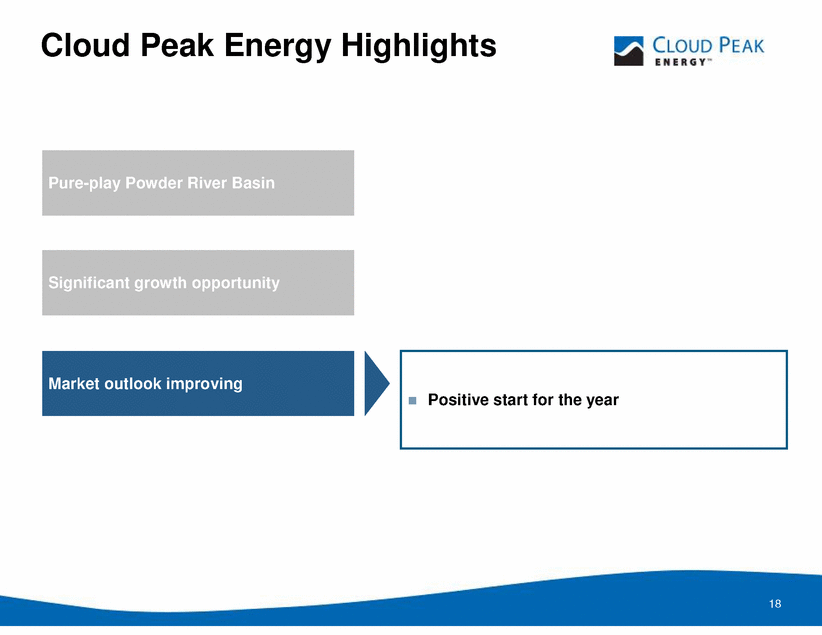
18 Significant growth opportunity Cloud Peak Energy Highlights Market outlook improving Positive start for the year Pure-play Powder River Basin |
|
|
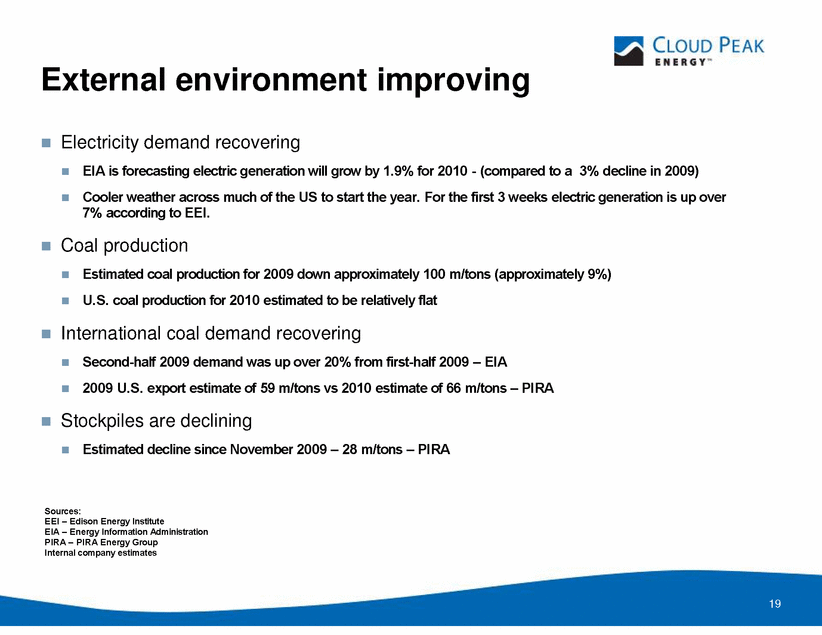
19 External environment improving Electricity demand recovering EIA is forecasting electric generation will grow by 1.9% for 2010 - (compared to a 3% decline in 2009) Cooler weather across much of the US to start the year. For the first 3 weeks electric generation is up over 7% according to EEI. Coal production Estimated coal production for 2009 down approximately 100 m/tons (approximately 9%) U.S. coal production for 2010 estimated to be relatively flat International coal demand recovering Second-half 2009 demand was up over 20% from first-half 2009 – EIA 2009 U.S. export estimate of 59 m/tons vs 2010 estimate of 66 m/tons – PIRA Stockpiles are declining Estimated decline since November 2009 – 28 m/tons – PIRA Sources: EEI – Edison Energy Institute EIA – Energy Information Administration PIRA – PIRA Energy Group Intemal company estimates |
|
|
Questions? |

