Attached files
| file | filename |
|---|---|
| 8-K - Vystar Corp | v171450_8k.htm |
Vystar Investor Presentation
NOVEMBER 2009
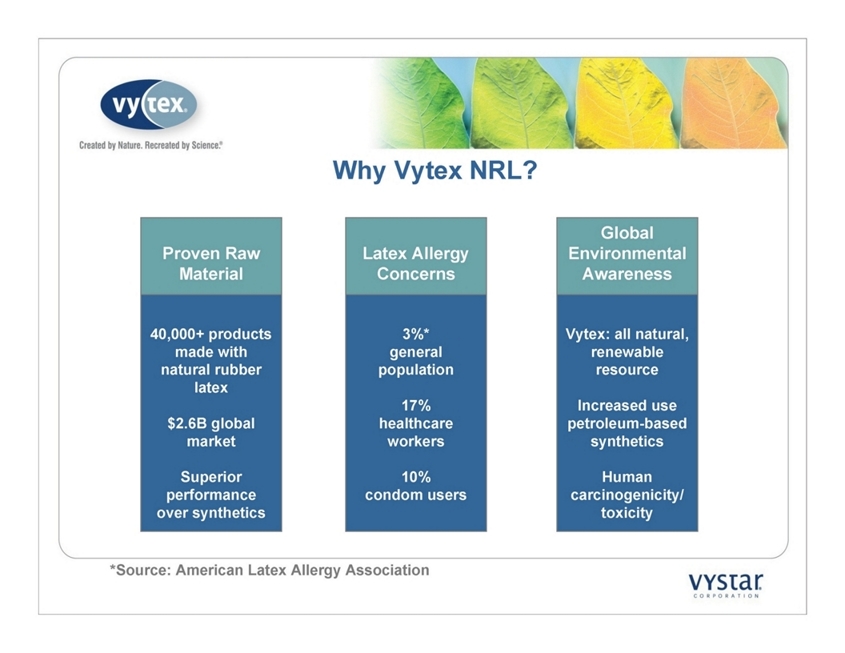
Why Vytex NRL?
Latex Allergy Concerns
3%*
general population
17%
healthcare workers
10%
condom users
Global Environmental
Awareness
Vytex: all natural, renewable resource
Increased use petroleum-based synthetics
Human carcinogenicity/
toxicity
Proven Raw Material
40,000+ products made with natural rubber latex
$2.6B global
market
Superior performance over synthetics
*Source: American Latex Allergy Association
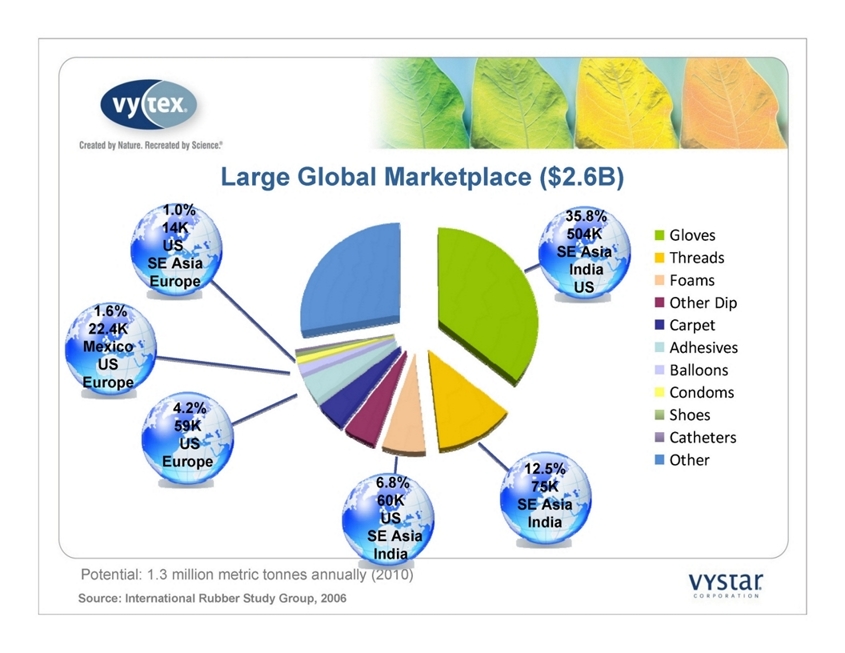
1.6%
22.4K
Mexico
US
Europe
4.2%
59K
US
Europe
6.8%
60K
US
SE Asia
India
12.5%
75K
SE Asia
India
35.8%
504K
SE Asia
India
US
Potential: 1.3 million metric tonnes annually (2010)
Source: International Rubber Study Group, 2006
Large Global Marketplace ($2.6B)
Gloves
Threads
Foams
Other Dip
Carpet
Adhesives
Balloons
Condoms
Shoes
Catheters
Other
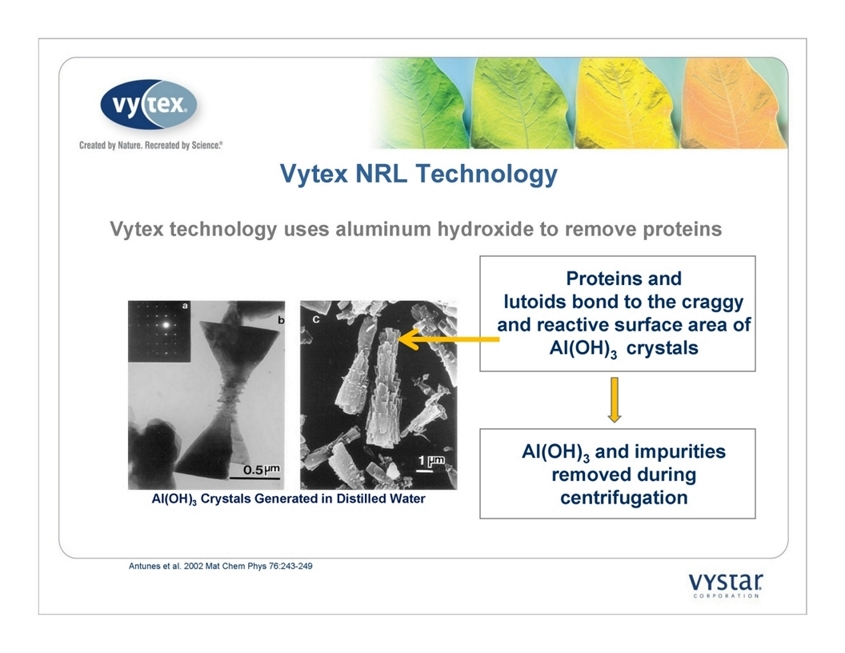
Antunes et al. 2002 Mat Chem Phys 76:243-249
Al(OH)3 Crystals Generated in Distilled Water
Vytex NRL Technology
Vytex technology uses aluminum hydroxide to remove proteins
Proteins and
lutoids bond to the craggy and reactive surface area of Al(OH)
3 crystals
Al(OH)3 and impurities removed
during centrifugation
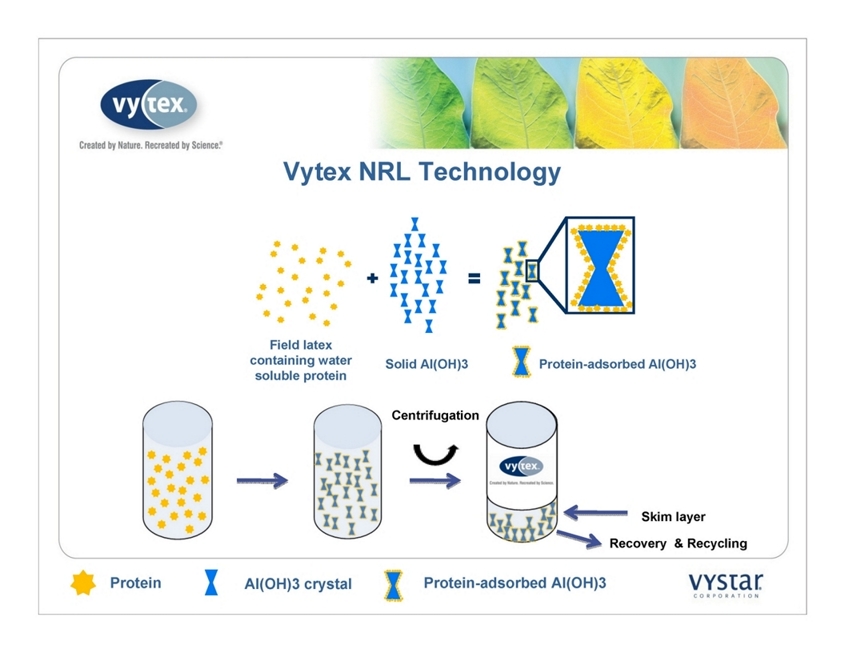
Vytex NRL Technology
Protein
Al(OH)3 crystal
Field latex containing water soluble protein
Solid Al(OH)3
Protein-adsorbed Al(OH)3
Protein-adsorbed Al(OH)3
Recovery & Recycling
Skim layer
Centrifugation
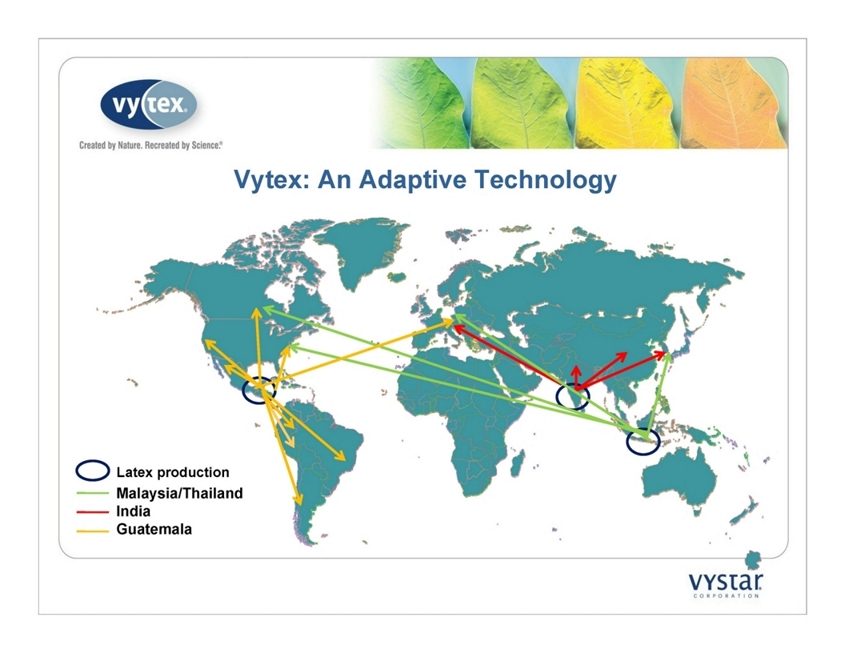
Vytex: An Adaptive Technology
Latex production
Malaysia/Thailand
India
Guatemala
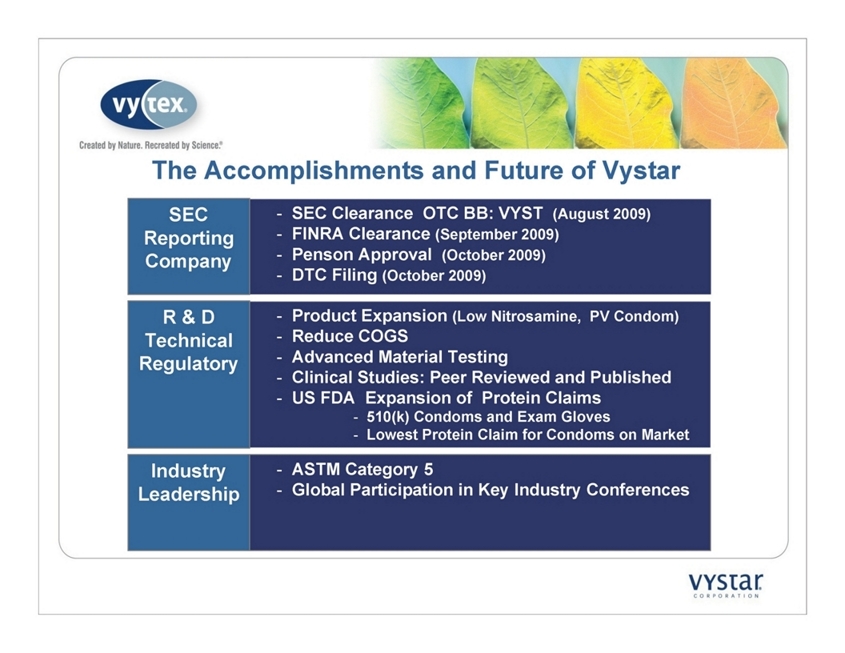
The Accomplishments and Future of Vystar
-
R & D
Technical
Regulatory
Line Extensions
Process Improvements to Reduce COGS
Advanced Material Testing to Enhance Value
Clinical Studies: Peer Reviewed and Published
-
-
Industry
Leadership
ASTM Category 5
Global Participation in Key Industry Conferences
SEC Reporting
Company
SEC Clearance OTC BB: VYST (August 2009)
FINRA Clearance (September 2009)
Penson Approval (October 2009)
DTC Filing (October 2009)
Product Expansion (Low Nitrosamine, PV Condom)
Reduce COGS
Advanced Material Testing
Clinical Studies: Peer Reviewed and Published
US FDA Expansion of Protein Claims
510(k) Condoms and Exam Gloves
Lowest Protein Claim for Condoms on Market
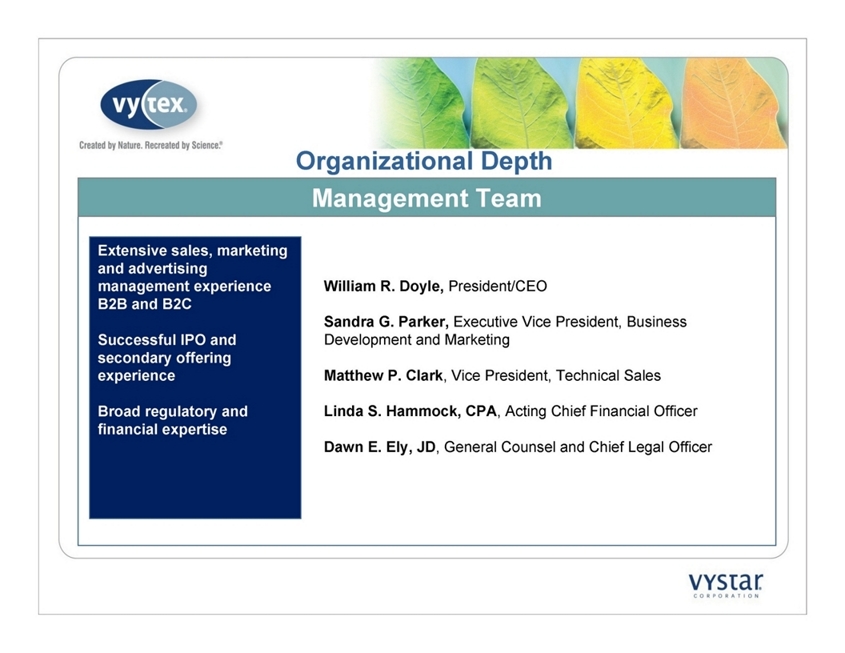
Management Team
Extensive sales, marketing and advertising management experience B2B and B2C
Successful IPO and secondary offering experience
Broad regulatory and financial expertise
William R. Doyle, President/CEO
Sandra G. Parker, Executive Vice President, Business Development and Marketing
Matthew P. Clark, Vice President, Technical Sales
Linda S. Hammock, CPA, Acting Chief Financial Officer
Dawn E. Ely, JD, General Counsel and Chief Legal Officer
Organizational Depth
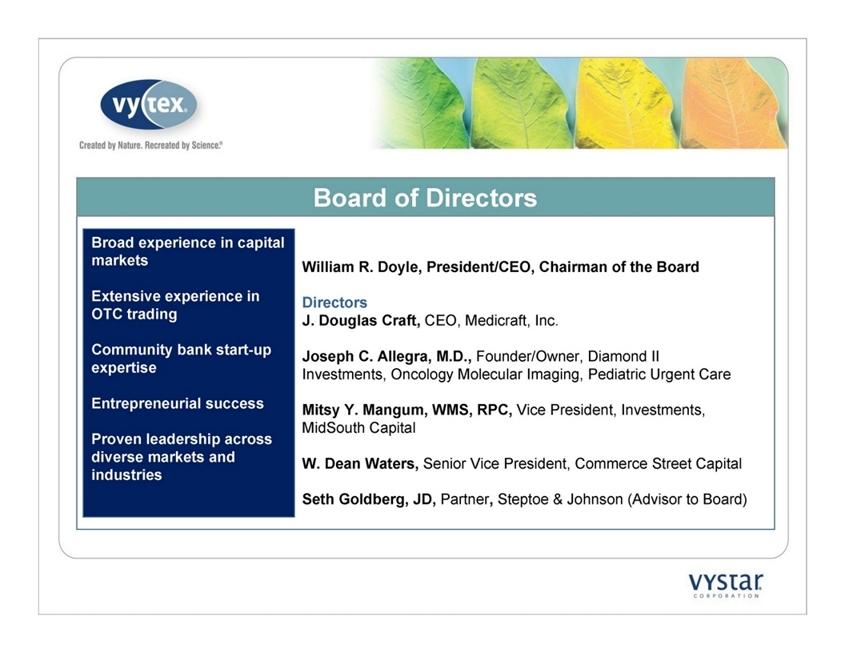
Board of Directors
Broad experience in capital markets
Extensive experience in OTC trading
Community bank start-up expertise
Entrepreneurial success
Proven leadership across diverse markets and industries
William R. Doyle, President/CEO, Chairman of the Board
Directors
J. Douglas Craft, CEO, Medicraft, Inc.
Joseph C. Allegra, M.D., Founder/Owner, Diamond II
Investments, Oncology Molecular Imaging, Pediatric Urgent Care
Mitsy Y. Mangum, WMS, RPC, Vice President, Investments, MidSouth Capital
W. Dean Waters, Senior Vice President, Commerce Street Capital
Seth Goldberg, JD, Partner, Steptoe
& Johnson (Advisor to Board)
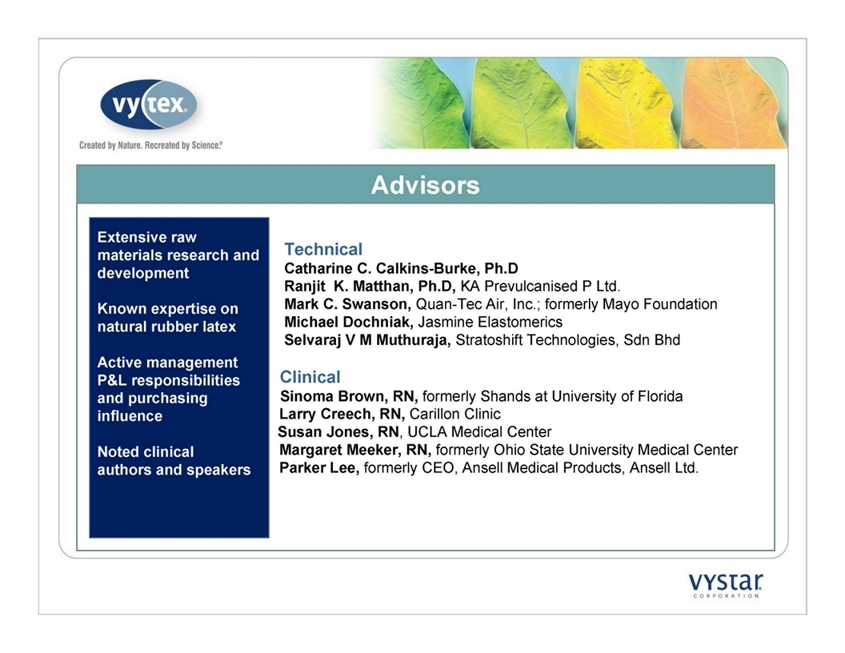
Technical
Catharine C. Calkins-Burke, Ph.D
Ranjit K.
Matthan, Ph.D, KA Prevulcanised P Ltd.
Mark C. Swanson, Quan-Tec Air, Inc.; formerly Mayo Foundation
Michael Dochniak, Jasmine
Elastomerics
Selvaraj V
M Muthuraja, Stratoshift Technologies, Sdn Bhd
Clinical
Sinoma Brown, RN, formerly Shands at University of Florida
Larry Creech, RN, Carillon Clinic
Susan Jones, RN, UCLA Medical Center
Margaret Meeker, RN, formerly Ohio State University Medical Center
Parker
Lee, formerly CEO, Ansell Medical Products, Ansell Ltd.
Advisors
Extensive raw
materials research and
development
Known expertise on
natural rubber latex
Active management
P&L responsibilities
and purchasing
influence
Noted clinical
authors and speakers
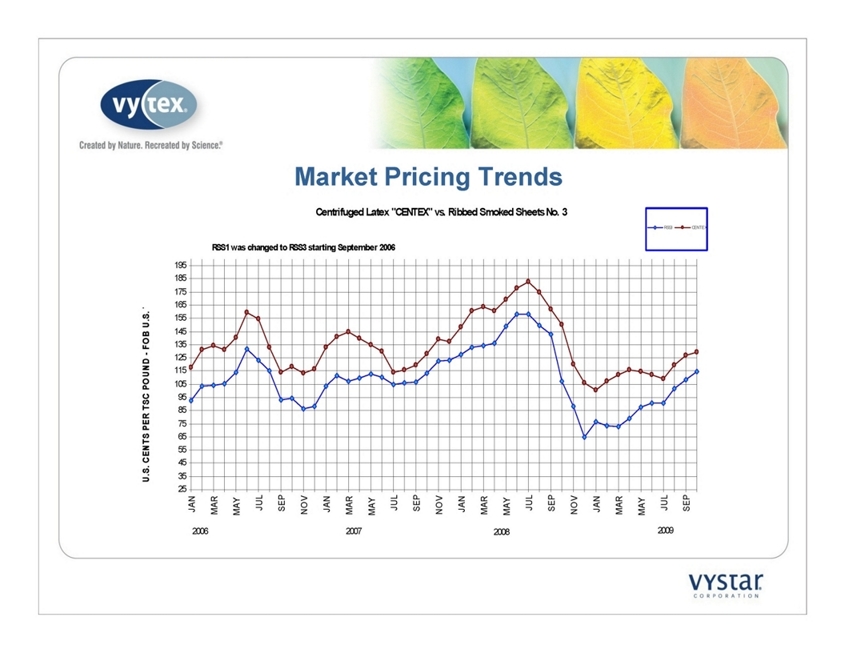
Market Pricing Trends
Financial Projections
THE FOLLOWING PROJECTIONS ARE FORWARD-LOOKING STATEMENTS. WE MAY NOT ACTUALLY
ACHIEVE THE PROJECTIONS DISCLOSED AND YOU SHOULD NOT PLACE UNDUE RELIANCE UPON
SUCH FORWARD-LOOKING STATEMENTS. ACTUAL RESULTS COULD DIFFER MATERIALLY FROM SUCH
PROJECTIONS. IN OUR PRIVATE PLACEMENT MEMORANDUM DATED OCTOBER 28, 2009, WE HAVE
INCLUDED IMPORTANT FACTORS IN THE “RISK FACTORS” SECTION OF THE MEMORANDUM THAT WE
BELIEVE COULD CAUSE ACTUAL RESULTS TO DIFFER MATERIALLY FROM THE PROJECTIONS THAT
WE MAKE. OUR FORWARD-LOOKING STATEMENTS DO NOT REFLECT THE POTENTIAL IMPACT OF
ANY FUTURE ACQUISITIONS, MERGERS, DISPOSITIONS, JOINT VENTURES OR INVESTMENTS WE
MAY MAKE.
YOU SHOULD READ OUR PRIVATE PLACEMENT MEMORANDUM COMPLETELY AND WITH THE
UNDERSTANDING THAT OUR ACTUAL FUTURE RESULTS MAY BE MATERIALLY DIFFERENT FROM
WHAT WE EXPECT. WE DO NOT ASSUME ANY OBLIGATION TO UPDATE ANY FORWARD-LOOKING
STATEMENTS, WHETHER AS A RESULT OF NEW INFORMATION, FUTURE EVENTS OR OTHERWISE,
EXCEPT AS REQUIRED BY LAW.
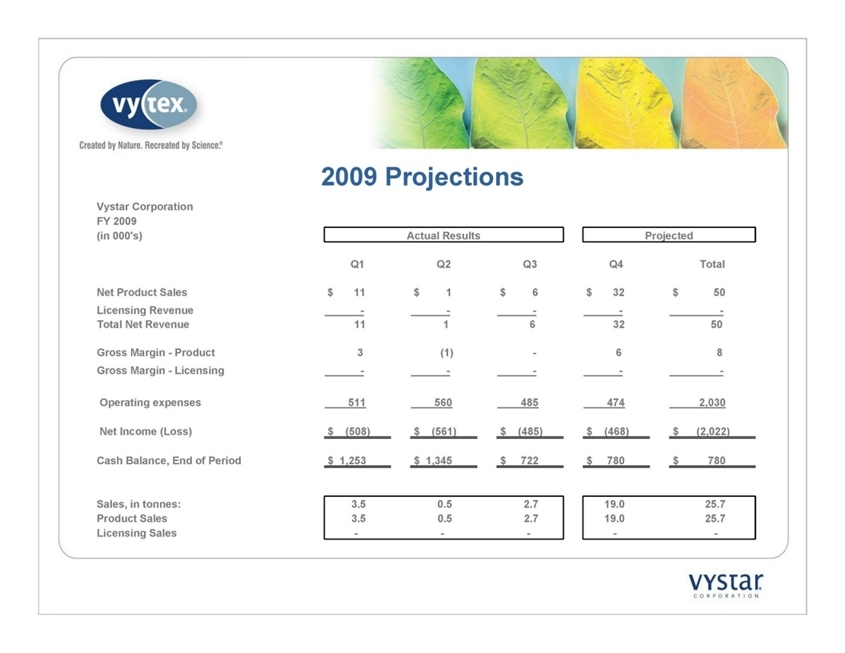
2009 Projections
Vystar Corporation
FY 2009
(in 000's)
Actual Results
Projected
Q1
Q2
Q3
Q4
Total
Net Product Sales
$ 11
$ 1
$ 6
$ 32
$ 50
Licensing Revenue
-
-
-
-
-
Total Net Revenue
11
1
6
32
50
Gross Margin - Product
3
(1)
-
6
8
Gross Margin - Licensing
-
-
-
-
-
Operating expenses
511
560
485
474
2,030
Net Income (Loss)
$ (508)
$ (561)
$ (485)
$ (468)
$ (2,022)
Cash Balance, End of Period
$ 1,253
$ 1,345
$ 722
$ 780
$ 780
Sales, in tonnes:
3.5
0.5
2.7
19.0
25.7
Product Sales
3.5
0.5
2.7
19.0
25.7
Licensing Sales
-
-
-
-
-
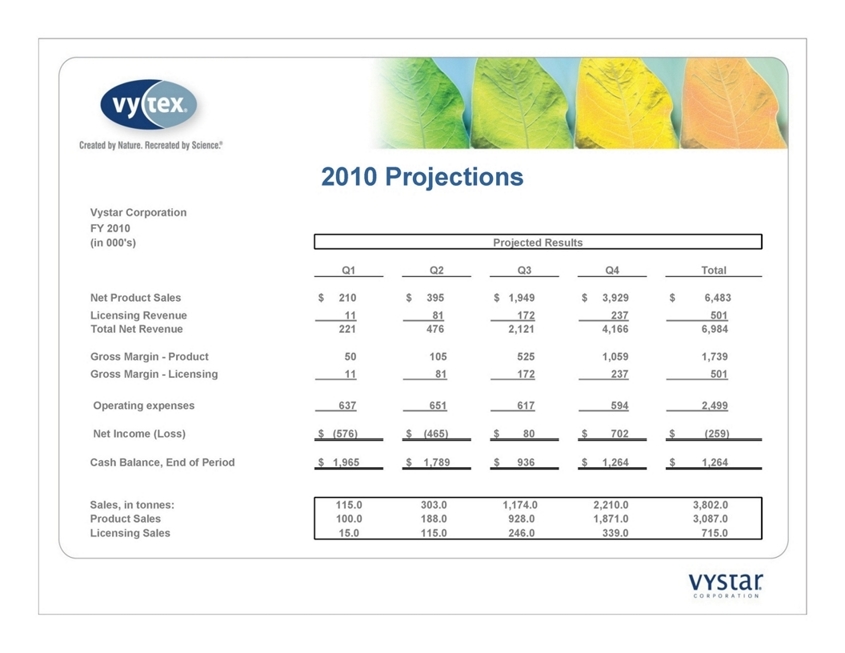
2010 Projections
Vystar Corporation
FY 2010
(in 000's)
Projected Results
Q1
Q2
Q3
Q4
Total
Net Product Sales
$ 210
$ 395
$ 1,949
$ 3,929
$ 6,483
Licensing Revenue
11
81
172
237
501
Total Net Revenue
221
476
2,121
4,166
6,984
Gross Margin - Product
50
105
525
1,059
1,739
Gross Margin - Licensing
11
81
172
237
501
Operating expenses
637
651
617
594
2,499
Net Income (Loss)
$ (576)
$ (465)
$ 80
$ 702
$ (259)
Cash Balance, End of Period
$ 1,965
$ 1,789
$ 936
$ 1,264
$ 1,264
Sales, in tonnes:
115.0
303.0
1,174.0
2,210.0
3,802.0
Product Sales
100.0
188.0
928.0
1,871.0
3,087.0
Licensing Sales
15.0
115.0
246.0
339.0
715.0
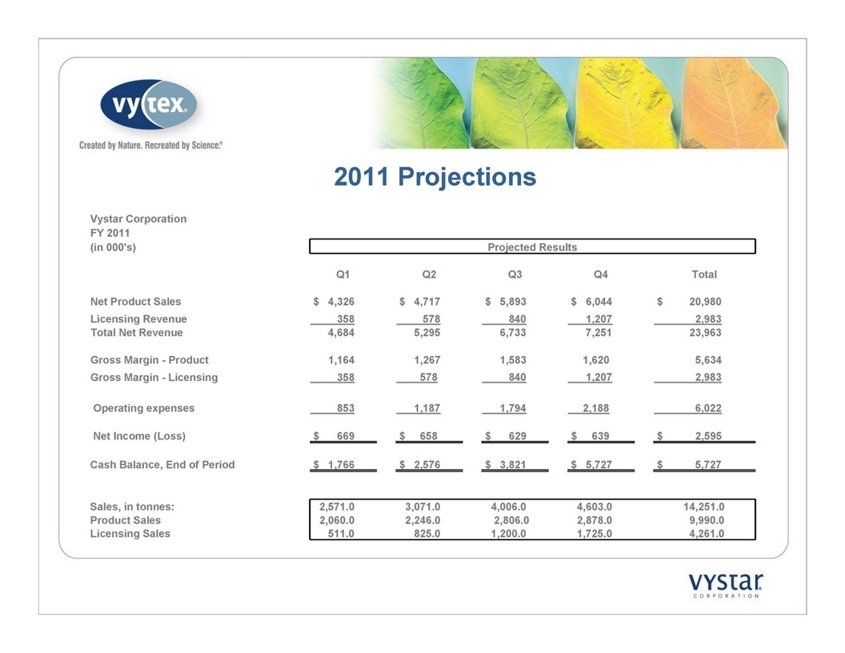
2011 Projections
Vystar Corporation
FY 2011
(in 000's)
Projected Results
Q1
Q2
Q3
Q4
Total
Net Product Sales
$ 4,326
$ 4,717
$ 5,893
$ 6,044
$ 20,980
Licensing Revenue
358
578
840
1,207
2,983
Total Net Revenue
4,684
5,295
6,733
7,251
23,963
Gross Margin - Product
1,164
1,267
1,583
1,620
5,634
Gross Margin - Licensing
358
578
840
1,207
2,983
Operating expenses
853
1,187
1,794
2,188
6,022
Net Income (Loss)
$ 669
$ 658
$ 629
$ 639
$ 2,595
Cash Balance, End of Period
$ 1,766
$ 2,576
$ 3,821
$ 5,727
$ 5,727
Sales, in tonnes:
2,571.0
3,071.0
4,006.0
4,603.0
14,251.0
Product Sales
2,060.0
2,246.0
2,806.0
2,878.0
9,990.0
Licensing Sales
511.0
825.0
1,200.0
1,725.0
4,261.0
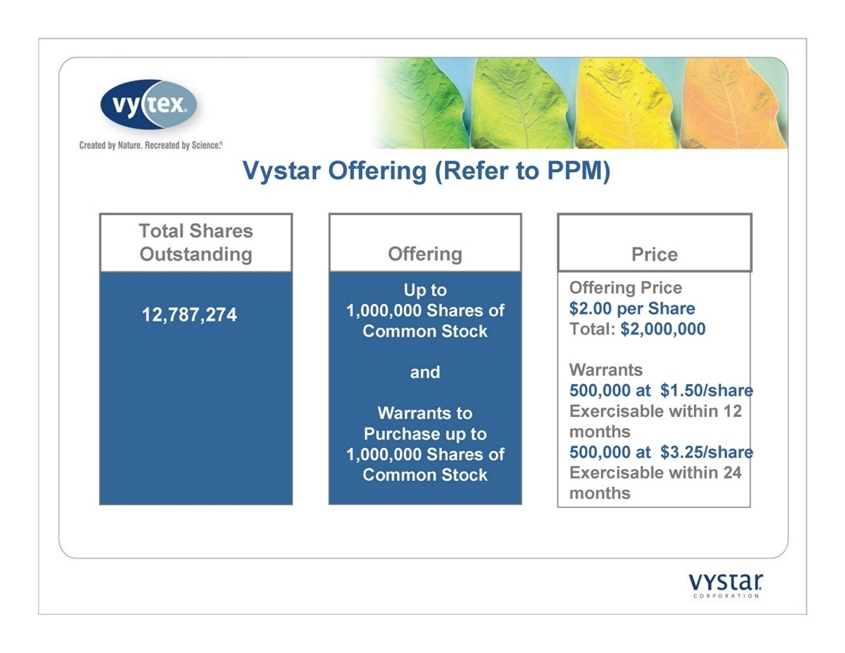
Vystar Offering (Refer to PPM)
Offer
Up to
1,000,000 Shares of Common Stock
and
Warrants to Purchase up to 1,000,000 Shares of Common Stock
Offering
Offer
Total Shares Outstanding
Offer
Price
Offering Price
$2.00 per Share
Total: $2,000,000
Warrants
500,000 at $1.50/share
Exercisable within 12 months
500,000 at $3.25/share
Exercisable within 24
months
12,787,274
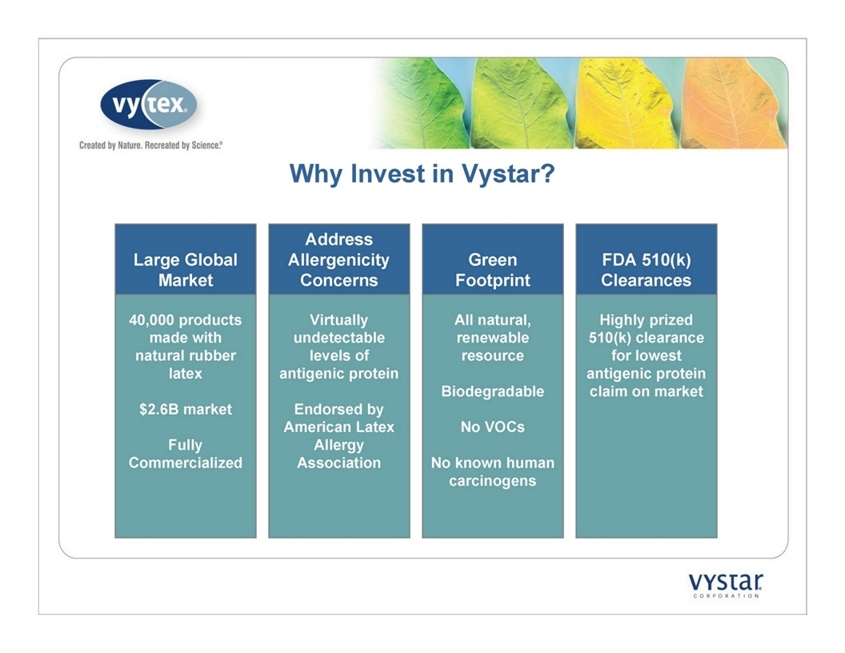
Why Invest in Vystar?
Large Global
Market
40,000 products made with natural rubber latex
$2.6B market
Fully
Commercialized
Address
Allergenicity Concerns
Virtually undetectable levels of antigenic protein
Endorsed by American Latex Allergy
Association
Green Footprint
All natural,
renewable resource
Biodegradable
No VOCs
No known human carcinogens
FDA 510(k) Clearances
Highly prized 510(k) clearance for lowest antigenic protein claim on market