Attached files
| file | filename |
|---|---|
| 8-K - 8-K - EAGLE BANCORP INC | a09-33209_18k.htm |
| EX-99.2 - EX-99.2 - EAGLE BANCORP INC | a09-33209_1ex99d2.htm |
Exhibit 99.1
|
|
November 2009 Ticker: EGBN www.eaglebankcorp.com Sandler O’Neill + Partners East Coast Financial Services Conference |
|
|
1 Forward Looking Statements This presentation contains forward looking statements within the meaning of the Securities and Exchange Act of 1934, as amended, including statements of goals, intentions, and expectations as to future trends, plans, events or results of Company operations and policies and regarding general economic conditions. In some cases, forward-looking statements can be identified by use of words such as “may,” “will,” “anticipates,” “believes,” “expects,” “plans,” “estimates,” “potential,” “continue,” “should,” and similar words or phrases. These statements are based upon current and anticipated economic conditions, nationally and in the Company’s market, interest rates and interest rate policy, competitive factors and other conditions which by their nature, are not susceptible to accurate forecast and are subject to significant uncertainty. Because of these uncertainties and the assumptions on which this discussion and the forward-looking statements are based, actual future operations and results in the future may differ materially from those indicated herein. Readers are cautioned against placing undue reliance on any such forward-looking statements. The Company’s past results are not necessarily indicative of future performance. The Company does not undertake to publicly revise or update forward-looking statements in this presentation to reflect events or circumstances that arise after the date of this presentation, except as may be required under applicable law. |
|
|
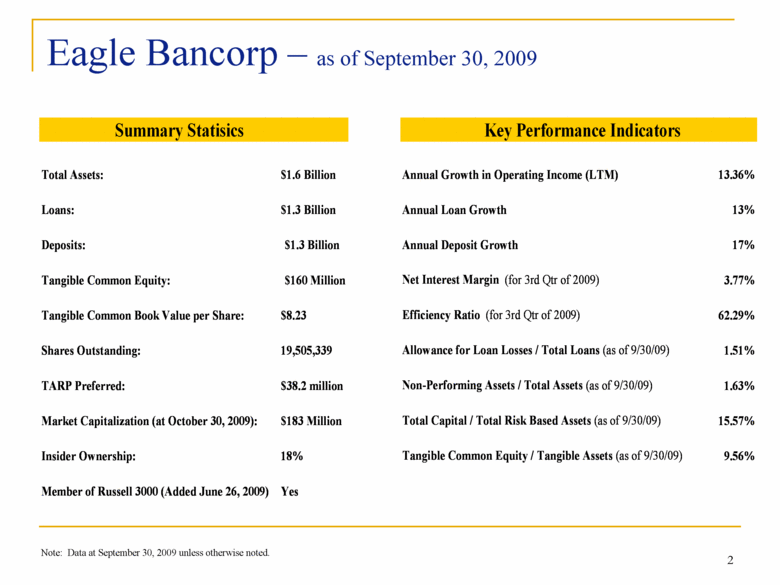
2 Eagle Bancorp – as of September 30, 2009 Note: Data at September 30, 2009 unless otherwise noted. Summary Statisics Key Performance Indicators Total Assets: $1.6 Billion Annual Growth in Operating Income (LTM) 13.36% Loans: $1.3 Billion Annual Loan Growth 13% Deposits: $1.3 Billion Annual Deposit Growth 17% Tangible Common Equity: $160 Million Net Interest Margin (for 3rd Qtr of 2009) 3.77% Tangible Common Book Value per Share: $8.23 Efficiency Ratio (for 3rd Qtr of 2009) 62.29% Shares Outstanding: 19,505,339 Allowance for Loan Losses / Total Loans (as of 9/30/09) 1.51% TARP Preferred: $38.2 million Non-Performing Assets / Total Assets (as of 9/30/09) 1.63% Market Capitalization (at October 30, 2009): $183 Million Total Capital / Total Risk Based Assets (as of 9/30/09) 15.57% Insider Ownership: 18% Tangible Common Equity / Tangible Assets (as of 9/30/09) 9.56% Member of Russell 3000 (Added June 26, 2009) Yes |
|
|
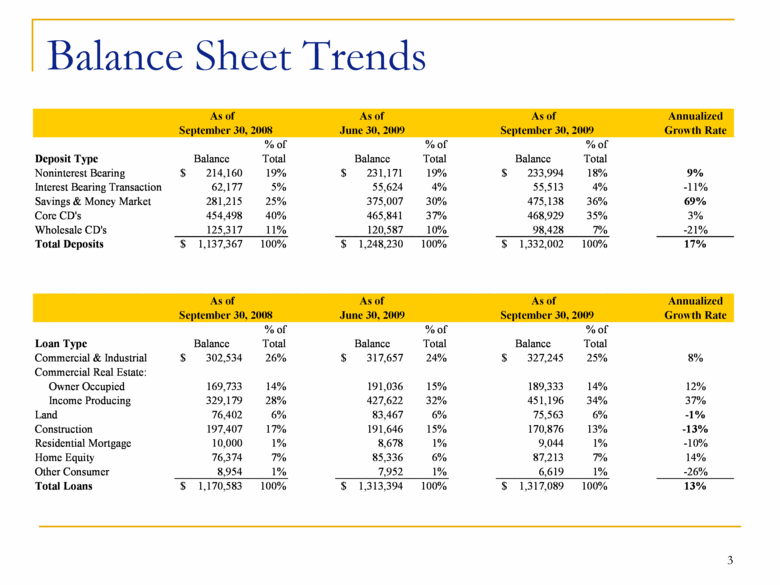
3 Balance Sheet Trends As of As of As of Annualized September 30, 2008 June 30, 2009 September 30, 2009 Growth Rate % of % of % of Deposit Type Balance Total Balance Total Balance Total Noninterest Bearing 214,160 $ 19% 231,171 $ 19% 233,994 $ 18% 9% Interest Bearing Transaction 62,177 5% 55,624 4% 55,513 4% -11% Savings & Money Market 281,215 25% 375,007 30% 475,138 36% 69% Core CD's 454,498 40% 465,841 37% 468,929 35% 3% Wholesale CD's 125,317 11% 120,587 10% 98,428 7% -21% Total Deposits 1,137,367 $ 100% 1,248,230 $ 100% 1,332,002 $ 100% 17% As of As of As of Annualized September 30, 2008 June 30, 2009 September 30, 2009 Growth Rate % of % of % of Loan Type Balance Total Balance Total Balance Total Commercial & Industrial 302,534 $ 26% 317,657 $ 24% 327,245 $ 25% 8% Commercial Real Estate: Owner Occupied 169,733 14% 191,036 15% 189,333 14% 12% Income Producing 329,179 28% 427,622 32% 451,196 34% 37% Land 76,402 6% 83,467 6% 75,563 6% -1% Construction 197,407 17% 191,646 15% 170,876 13% -13% Residential Mortgage 10,000 1% 8,678 1% 9,044 1% -10% Home Equity 76,374 7% 85,336 6% 87,213 7% 14% Other Consumer 8,954 1% 7,952 1% 6,619 1% -26% Total Loans 1,170,583 $ 100% 1,313,394 $ 100% 1,317,089 $ 100% 13% |
|
|
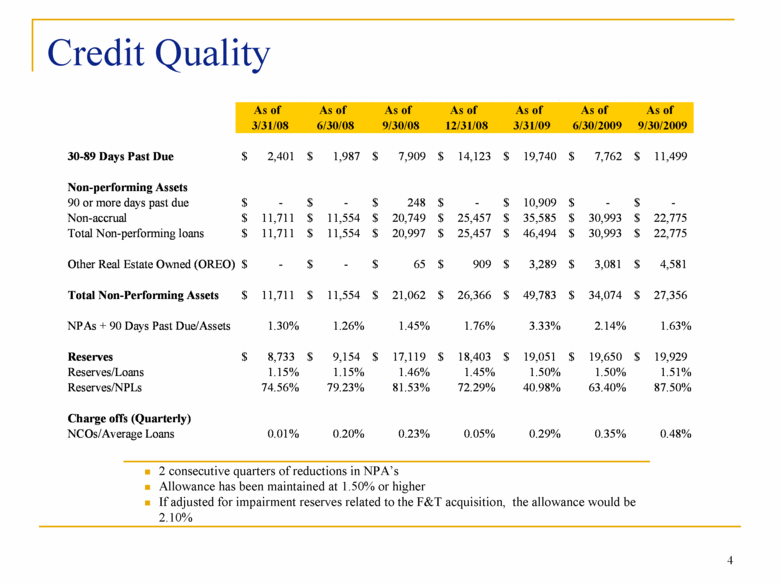
4 Credit Quality . 2 consecutive quarters of reductions in NPA’s . Allowance has been maintained at 1.50% or higher . If adjusted for impairment reserves related to the F&T acquisition, the allowance would be 2.10% As of As of As of As of As of As of As of 3/31/08 6/30/08 9/30/08 12/31/08 3/31/09 6/30/2009 9/30/2009 30-89 Days Past Due 2,401 $ 1,987 $ 7,909 $ 14,123 $ 19,740 $ 7,762 $ 11,499 $ Non-performing Assets 90 or more days past due - $ - $ 248 $ - $ 10,909 $ - $ - $ Non-accrual 11,711 $ 11,554 $ 20,749 $ 25,457 $ 35,585 $ 30,993 $ 22,775 $ Total Non-performing loans 11,711 $ 11,554 $ 20,997 $ 25,457 $ 46,494 $ 30,993 $ 22,775 $ Other Real Estate Owned (OREO) - $ - $ 65 $ 909 $ 3,289 $ 3,081 $ 4,581 $ Total Non-Performing Assets 11,711 $ 11,554 $ 21,062 $ 26,366 $ 49,783 $ 34,074 $ 27,356 $ NPAs + 90 Days Past Due/Assets 1.30% 1.26% 1.45% 1.76% 3.33% 2.14% 1.63% Reserves 8,733 $ 9,154 $ 17,119 $ 18,403 $ 19,051 $ 19,650 $ 19,929 $ Reserves/Loans 1.15% 1.15% 1.46% 1.45% 1.50% 1.50% 1.51% Reserves/NPLs 74.56% 79.23% 81.53% 72.29% 40.98% 63.40% 87.50% Charge offs (Quarterly) NCOs/Average Loans 0.01% 0.20% 0.23% 0.05% 0.29% 0.35% 0.48% |
|
|
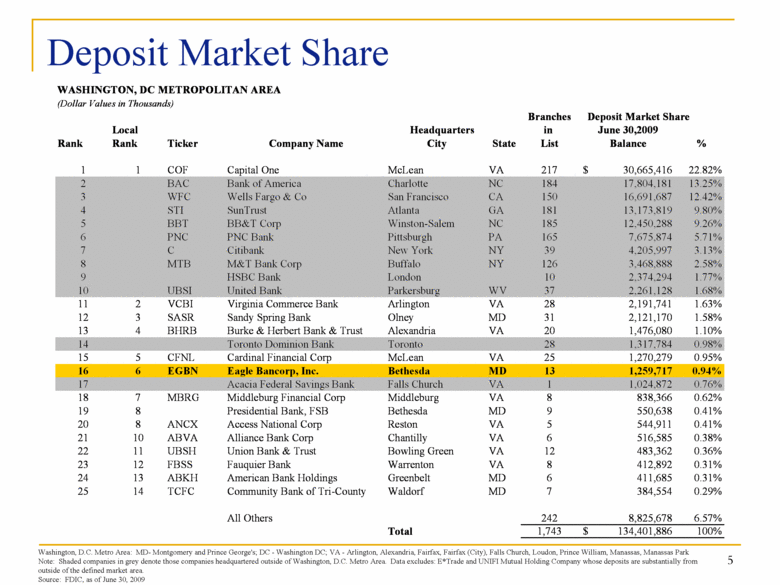
5 Deposit Market Share Washington, D.C. Metro Area: MD- Montgomery and Prince George's; DC - Washington DC; VA - Arlington, Alexandria, Fairfax, Fairfax (City), Falls Church, Loudon, Prince William, Manassas, Manassas Park Note: Shaded companies in grey denote those companies headquartered outside of Washington, D.C. Metro Area. Data excludes: E*Trade and UNIFI Mutual Holding Company whose deposits are substantially from outside of the defined market area. Source: FDIC, as of June 30, 2009 WASHINGTON, DC METROPOLITAN AREA (Dollar Values in Thousands) Branches Deposit Market Share Local Headquarters in June 30,2009 Rank Rank Ticker Company Name City State List Balance % 1 1 COF Capital One McLean VA 217 30,665,416 $ 22.82% 2 BAC Bank of America Charlotte NC 184 17,804,181 13.25% 3 WFC Wells Fargo & Co San Francisco CA 150 16,691,687 12.42% 4 STI SunTrust Atlanta GA 181 13,173,819 9.80% 5 BBT BB&T Corp Winston-Salem NC 185 12,450,288 9.26% 6 PNC PNC Bank Pittsburgh PA 165 7,675,874 5.71% 7 C Citibank New York NY 39 4,205,997 3.13% 8 MTB M&T Bank Corp Buffalo NY 126 3,468,888 2.58% 9 HSBC Bank London 10 2,374,294 1.77% 10 UBSI United Bank Parkersburg WV 37 2,261,128 1.68% 11 2 VCBI Virginia Commerce Bank Arlington VA 28 2,191,741 1.63% 12 3 SASR Sandy Spring Bank Olney MD 31 2,121,170 1.58% 13 4 BHRB Burke & Herbert Bank & Trust Alexandria VA 20 1,476,080 1.10% 14 Toronto Dominion Bank Toronto 28 1,317,784 0.98% 15 5 CFNL Cardinal Financial Corp McLean VA 25 1,270,279 0.95% 16 6 EGBN Eagle Bancorp, Inc. Bethesda MD 13 1,259,717 0.94% 17 Acacia Federal Savings Bank Falls Church VA 1 1,024,872 0.76% 18 7 MBRG Middleburg Financial Corp Middleburg VA 8 838,366 0.62% 19 8 Presidential Bank, FSB Bethesda MD 9 550,638 0.41% 20 8 ANCX Access National Corp Reston VA 5 544,911 0.41% 21 10 ABVA Alliance Bank Corp Chantilly VA 6 516,585 0.38% 22 11 UBSH Union Bank & Trust Bowling Green VA 12 483,362 0.36% 23 12 FBSS Fauquier Bank Warrenton VA 8 412,892 0.31% 24 13 ABKH American Bank Holdings Greenbelt MD 6 411,685 0.31% 25 14 TCFC Community Bank of Tri-County Waldorf MD 7 384,554 0.29% All Others 242 8,825,678 6.57% Total 1,743 134,401,886 $ 100% |
|
|
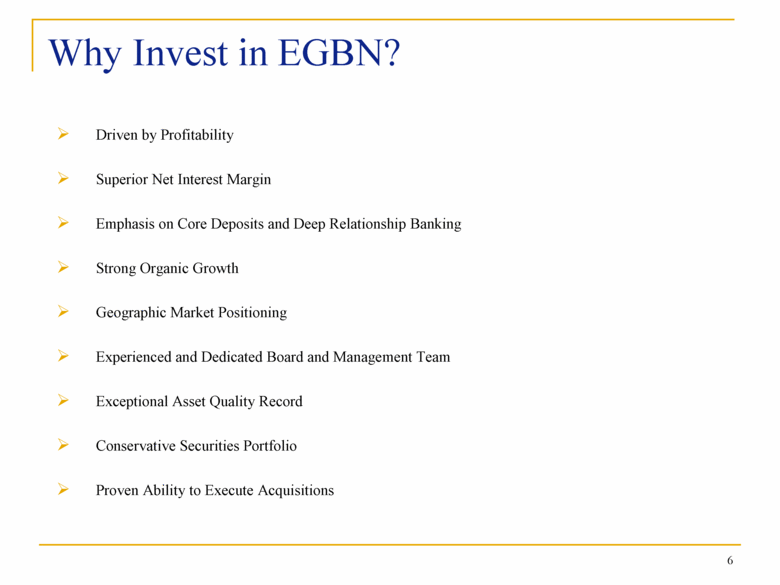
6 Why Invest in EGBN? Driven by Profitability Superior Net Interest Margin Emphasis on Core Deposits and Deep Relationship Banking Strong Organic Growth Geographic Market Positioning Experienced and Dedicated Board and Management Team Exceptional Asset Quality Record Conservative Securities Portfolio Proven Ability to Execute Acquisitions |

