Attached files
| file | filename |
|---|---|
| 8-K - 8-K - Agiliti Health, Inc. | a09-31123_28k.htm |
| EX-99.1 - EX-99.1 - Agiliti Health, Inc. | a09-31123_2ex99d1.htm |
Exhibit 99.2
|
|
11 Confidential Information Confidential Information 1 Confidential Information UHOS Q3 2009 Earnings Teleconference November 10, 2009 |
|
|
2 Safe Harbor Statement under the Private Securities Litigation Reform Act of 1995: Universal Hospital Services, Inc. believes statements in this presentation looking forward in time involve risks and uncertainties based on management’s current views and assumptions. Actual events may differ materially. Please refer to the cautionary statement regarding forward-looking statements and risk factors that appear in the Company’s Annual Report on Form 10-K for the year ended December 31, 2008, and other filings with the SEC, which can be accessed at www.UHS.com under “Financials.” This presentation contains non-GAAP measures as defined by SEC rules. Reconciliations of these measures to the most directly comparable GAAP measures are contained in the appendix. Forward Looking Statements Forward Looking Statements |
|
|
3 Refer to appendix for reconciliation of Adjusted EBITDA to Cash Flows from Operations YTD Adjusted EBITDA Performance (% comparisons of Adjusted EBITDA to prior year) YTD Adjusted EBITDA Performance (% comparisons of Adjusted EBITDA to prior year) Q1-2009 (7%) + 8% Full Year Results Expected to Show Modest Growth Q3-2009 Q2-2009 +10% Growth in Asset Management, Patient Handling and Wound Care Offsetting Weak Peak Need Rentals Headwinds: – Economy: Hospital Census & Expense Control – Weak Q1 Flu Season – Health Care Reform: Uncertainty – Manufacturer Recalls |
|
|
4 Are We Headed for Another 1918 Flu Epidemic, or is This Just Another Y2K-style Panic? Are We Headed for Another 1918 Flu Epidemic, or is This Just Another Y2K-style Panic? Clearly seeing Flu-season volumes well earlier than normal leading to unprecedented demand for respiratory equipment from customers Flu consequences for UHS: • Robust Flu: • Epidemic Flu: UHS will increase its Capex budget in 2009 Strong Volumes Will people avoid hospitals? |
|
|
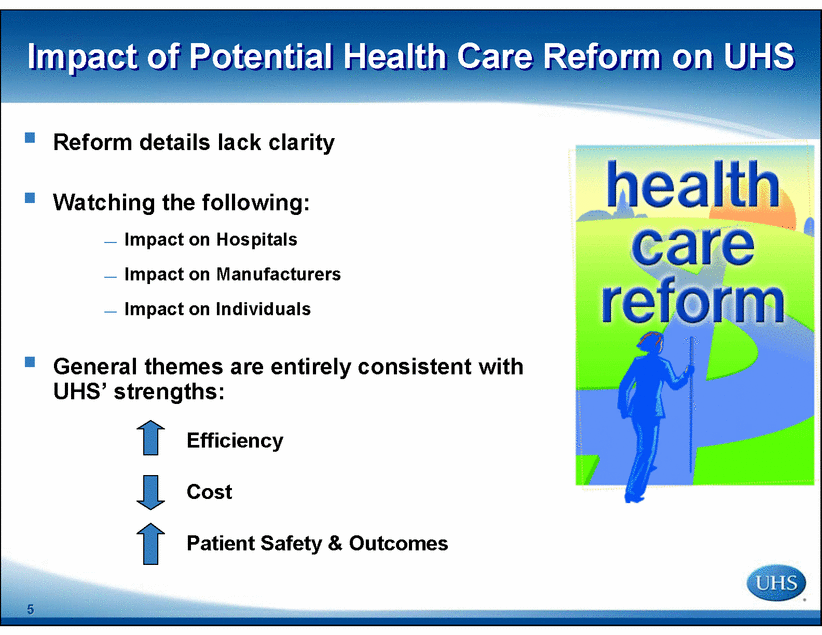
5 Impact of Potential Health Care Reform on UHS Impact of Potential Health Care Reform on UHS Reform details lack clarity Watching the following: — Impact on Hospitals — Impact on Manufacturers — Impact on Individuals General themes are entirely consistent with UHS’ strengths: Efficiency Cost Patient Safety & Outcomes |
|
|
6 UHS: Solutions Provider UHS: Solutions Provider Peak Need Rental Biomed Services Gateway Solutions Comprehensive Solutions Vertical Solutions Patient Handling Wound Care Asset Management CHAMP Services Capital and Operating Costs Patient Safety & Outcomes Caregiver Productivity & Satisfaction Customer Value Proposition Partnerships Infant Care Patient Monitoring |
|
|
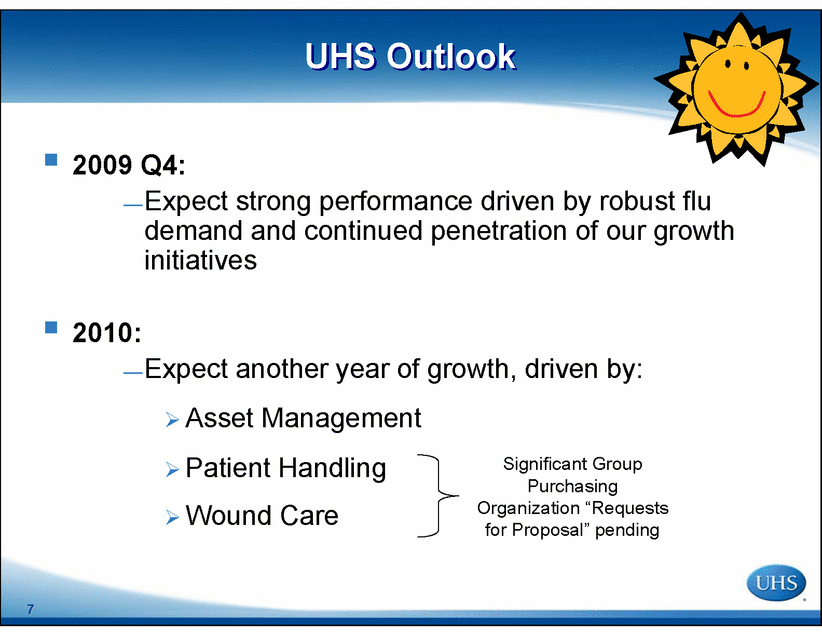
7 UHS Outlook UHS Outlook 2009 Q4: —Expect strong performance driven by robust flu demand and continued penetration of our growth initiatives 2010: —Expect another year of growth, driven by: Asset Management Patient Handling Wound Care Significant Group Purchasing Organization “Requests for Proposal” pending |
|
|
8 Financial Review 3rd Quarter 2009 |
|
|
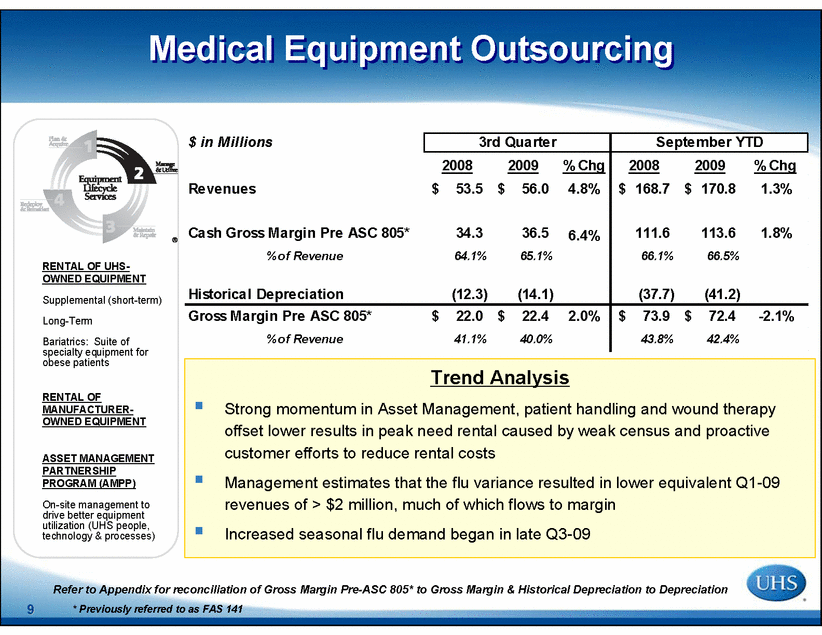
9 Trend Analysis Strong momentum in Asset Management, patient handling and wound therapy offset lower results in peak need rental caused by weak census and proactive customer efforts to reduce rental costs Management estimates that the flu variance resulted in lower equivalent Q1-09 revenues of > $2 million, much of which flows to margin Increased seasonal flu demand began in late Q3-09 RENTAL OF UHS-OWNED EQUIPMENT Supplemental (short-term) Long-Term Bariatrics: Suite of specialty equipment for obese patients RENTAL OF MANUFACTURER-OWNED EQUIPMENT ASSET MANAGEMENT PARTNERSHIP PROGRAM (AMPP) On-site management to drive better equipment utilization (UHS people, technology & processes) Refer to Appendix for reconciliation of Gross Margin Pre-ASC 805* to Gross Margin & Historical Depreciation to Depreciation Medical Equipment Outsourcing Medical Equipment Outsourcing $ in Millions 3rd Quarter September YTD 2008 2009 % Chg 2008 2009 % Chg Revenues 53.5 $ 56.0 $ 4.8% 168.7 $ 170.8 $ 1.3% Cash Gross Margin Pre ASC 805* 34.3 36.5 6.4% 111.6 113.6 1.8% % of Revenue 64.1% 65.1% 66.1% 66.5% Historical Depreciation (12.3) (14.1) (37.7) (41.2) Gross Margin Pre ASC 805* 22.0 $ 22.4 $ 2.0% 73.9 $ 72.4 $ -2.1% % of Revenue 41.1% 40.0% 43.8% 42.4% * Previously referred to as FAS 141 |
|
|
10 10 Technical and Professional Services Technical and Professional Services TECHNICAL SERVICES Maintain & Repair Customer-owned Equipment: • Non-resident, response-based / scheduled Biomedical Services • Customized Healthcare Asset Management Programs • Manufacturer Services PROFESSIONAL SERVICES Technology baseline assessments Vendor neutral Capital Planning Services Product comparison research and reports Equipment product of choice Equipment utilization studies Trend Analysis Lower current year Revenues were due to higher activity in our manufacturer services unit in 2008. This activity has an episodic component and thus will ebb and flow over time Despite lower Revenues, our Margins were up in 2009 due to cost containment efforts Additionally, we continue to focus our sales force on large organic growth opportunities in our Outsourcing segment Refer to Appendix for reconciliation of Gross Margin Pre-ASC 805* to Gross Margin & Historical Depreciation to Depreciation $ in Millions 3rd Quarter September YTD 2008 2009 % Chg 2008 2009 % Chg Revenues 11.2 $ 10.8 $ -3.7% 34.6 $ 31.9 $ -7.8% Cash Gross Margin Pre ASC 805* 3.2 3.3 1.4% 9.5 9.6 1.4% % of Revenue 28.7% 30.2% 27.4% 30.1% Historical Depreciation (0.1) (0.1) (0.3) (0.2) Gross Margin Pre ASC 805* 3.1 $ 3.2 $ 1.9% 9.2 $ 9.4 $ 1.7% % of Revenue 27.8% 29.5% 26.5% 29.3% * Previously referred to as FAS 141 |
|
|
11 11 ASSET RECOVERY & EQUIPMENT BROKERAGE NEW EQUIPMENT SALES DISPOSABLE SALES Medical Equipment Sales and Remarketing Medical Equipment Sales and Remarketing Trend Analysis Increased Revenues YTD 2009 were driven by robust equipment sales during Q1-09, which were made possible by the scale and scope of our Outsourcing operations Results in this segment will fluctuate based on equipment availability, transactional size and the transactional nature of the business Refer to Appendix for reconciliation of Gross Margin Pre-ASC 805* to Gross Margin & Historical Depreciation to Depreciation $ in Millions 3rd Quarter September YTD 2008 2009 % Chg 2008 2009 % Chg Revenues 6.3 $ 5.4 $ -14.3% 14.8 $ 16.3 $ 10.0% Cash Gross Margin Pre ASC 805* 2.0 1.3 -33.3% 4.3 4.1 -5.9% % of Revenue 31.5% 24.5% 29.2% 25.0% Historical Depreciation (0.1) - (0.1) (0.2) Gross Margin Pre ASC 805* 1.9 $ 1.3 $ -34.1% 4.2 $ 3.9 $ -6.3% % of Revenue 30.6% 23.6% 28.2% 24.0% * Previously referred to as FAS 141 |
|
|
12 12 Selected Financial Data Selected Financial Data Refer to Appendix for reconciliation of Cash SG&A to SG&A, Gross Margin Pre-ASC 805* to Gross Margin, Historical Depreciation to Depreciation, Adjusted EBITDA to Cash Flows from Operations, and Accrual CAPEX to investing cash flows $ in Millions 3rd Quarter September YTD LTM Q3 2008 2009 % Chg 2008 2009 % Chg 2009 Consolidated Revenues 71.0 $ 72.2 $ 1.8% 218.1 $ 219.0 $ 0.4% 290.0 $ Cash Gross Margin Pre-ASC 805* 39.5 $ 41.1 $ 4.0% 125.4 $ 127.3 $ 1.5% 167.5 $ % of Revenues 55.7% 56.9% 57.5% 58.1% 57.8% Historical Depreciation (12.5) (14.2) (38.1) (41.6) (55.2) Gross Margin Pre-ASC 805* 27.0 $ 26.9 $ -0.6% 87.3 $ 85.7 $ -1.9% 112.3 $ % of Revenues 38.1% 37.2% 40.0% 39.1% 38.7% Cash SG&A 15.4 $ 14.6 $ -5.2% 47.1 $ 46.8 $ -0.7% 61.3 $ % of Revenues 21.7% 20.2% 21.6% 21.4% 21.1% Adjusted EBITDA 24.1 $ 26.5 $ 9.8% 78.2 $ 80.4 $ 2.8% 106.2 $ % of Revenues 34.0% 36.7% 35.9% 36.7% 36.6% Accrual CAPEX 12.1 $ 13.7 $ 13.4% 49.6 $ 27.7 $ -44.1% 46.3 $ * Previously referred to as FAS 141 |
|
|
13 13 $135 Bank Line (as of 9/30/09) Available Liquidity = $115 Used = $20 ( Including LOCs and net of cash and investments ) Debt Maturities $- $100 $200 $300 $400 $500 2009 2010 2011 2012 2013 2014 2015 $135 Revolver Liquidity Remains Robust Liquidity Remains Robust |
|
|
14 14 Leverage Trend Leverage Trend 12/31/08 9/30/09 Floating Rate Notes 230.0 $ 230.0 $ PIK Toggle Notes 230.0 230.0 10.125% Senior Notes 9.9 9.9 Bank Line 49.0 20.0 Capital Leases 12.4 11.3 Total Debt 531.3 501.2 Add: Accrued Interest 3.9 14.0 Adjusted Debt 535.2 515.2 Less: Cash and Investments (13.5) (3.8) Net Debt 521.7 $ 511.4 $ LTM Adj. EBITDA 104.0 $ 106.2 $ Leverage ratio 5.0 4.8 UHS Debt Structure ($ in millions) Note that our calculations include Accrued Interest for conservatism Total Net Debt and Accrued Interest / LTM Adjusted EBITDA 1.0 2.0 3.0 4.0 5.0 6.0 Q1-00 Q3-00 Q1-01 Q3-01 Q1-02 Q3- 02 Q1-03 Q3-03 Q1-04 Q3-04 Q1-05 Q3-05 Q1-06 Q3-06 Q1-07 Q3-07 Q1-08 Q3-08 Q1-09 Q3-09 Recap Recap Refer to Appendix for reconciliation of Adjusted EBIDTA to Cash Flow from Operations |
|
|
15 15 Source: http//www.cdc.gov/flu/weekly/ Ramped Up Flu Activity in October Ramped Up Flu Activity in October 2009 2008 2006 2007 |
|
|
16 16 2009 Accrual Capex Analysis 2009 Accrual Capex Analysis Asset Management $20 - $25 Other Outsourcing $20 - $25 Subtotal Mid to Upper $40’s Early Flu and Patient Handling Demand $6 - $12 Total Accrual Capex ~ $60 Supports our ~ $30 estimate of Maintenance Capex with modest growth |
|
|
17 17 5.0x + / - 5.0x Year-end Leverage $68 $104 2008 ~ $60 (increased from Mid- Upper $40’s to accommodate early flu activity and Patient Handling demand) Accrual CAPEX $106 - $110 2009 E Adjusted EBITDA Refer to Appendix for reconciliation of Adjusted EBITDA to Cash Flow from Operations & Accrual CAPEX to Cash used in Investing Activities Estimated Guidance ($ in Millions) Estimated Guidance ($ in Millions) Key Drivers: Census and Flu Activity • Increased Capex Budget in response to demand Ongoing Customer Efforts to Manage Equipment Asset Management Signings / Upgrades Health Care Reform Customers standing in place Reduced uncertainty as reform takes shape Pending Patient Handling Group Purchasing Organization “Requests for Proposal” |
|
|
18 18 Refer to Appendix for reconciliation of Adjusted EBITDA to Cash Flows from Operations Continue to Expect Growth Despite the Economic Environment Continue to Expect Growth Despite the Economic Environment Adjusted EBITDA (000's) $- $20,000 $40,000 $60,000 $80,000 $100,000 $120,000 2000 2001 2002 2003 2004 2005 2006 2007 2008 2009E |
|
|
19 19 Selected Reconciliations EBITDA Reconciliation: Q3 2008 & 2009 EBITDA Reconciliation: 1998 – LTM Q3 2009 Depreciation and Amortization Reconciliation Other Reconciliations Appendix Appendix |
|
|
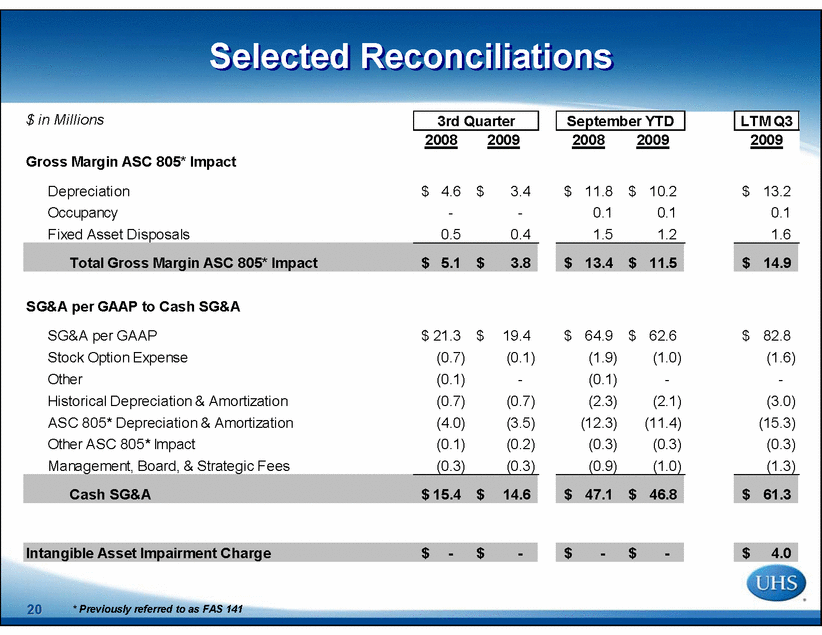
20 20 Selected Reconciliations Selected Reconciliations $ in Millions 3rd Quarter September YTD LTM Q3 2008 2009 2008 2009 2009 Gross Margin ASC 805* Impact Depreciation 4.6 $ 3.4 $ 11.8 $ 10.2 $ 13.2 $ Occupancy - - 0.1 0.1 0.1 Fixed Asset Disposals 0.5 0.4 1.5 1.2 1.6 Total Gross Margin ASC 805* Impact 5.1 $ 3.8 $ 13.4 $ 11.5 $ 14.9 $ SG&A per GAAP to Cash SG&A SG&A per GAAP 21.3 $ 19.4 $ 64.9 $ 62.6 $ 82.8 $ Stock Option Expense (0.7) (0.1) (1.9) (1.0) (1.6) Other (0.1) - (0.1) - - Historical Depreciation & Amortization (0.7) (0.7) (2.3) (2.1) (3.0) ASC 805* Depreciation & Amortization (4.0) (3.5) (12.3) (11.4) (15.3) Other ASC 805* Impact (0.1) (0.2) (0.3) (0.3) (0.3) Management, Board, & Strategic Fees (0.3) (0.3) (0.9) (1.0) (1.3) Cash SG&A 15.4 $ 14.6 $ 47.1 $ 46.8 $ 61.3 $ Intangible Asset Impairment Charge - $ - $ - $ - $ 4.0 $ * Previously referred to as FAS 141 |
|
|
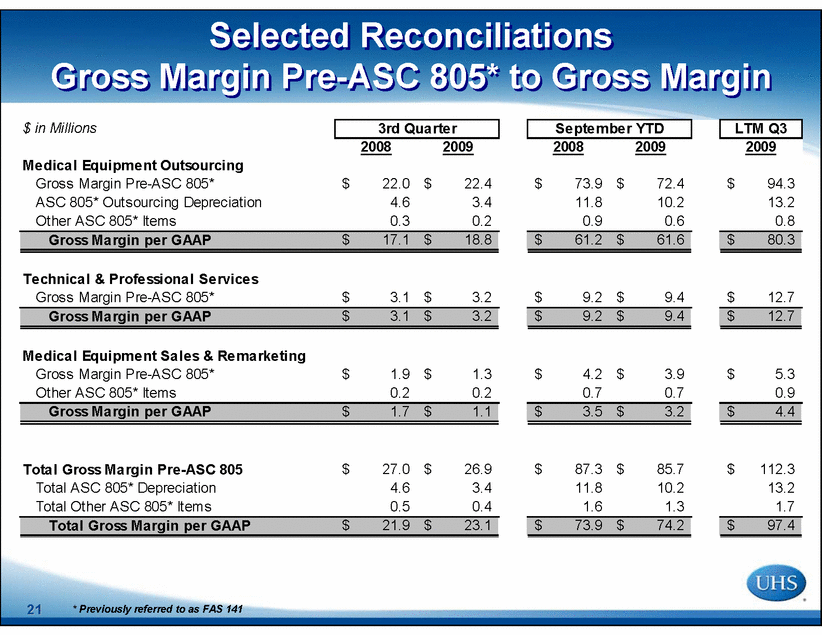
21 21 Selected Reconciliations Gross Margin Pre-ASC 805* to Gross Margin Selected Reconciliations Gross Margin Pre-ASC 805* to Gross Margin $ in Millions 3rd Quarter September YTD LTM Q3 2008 2009 2008 2009 2009 Medical Equipment Outsourcing Gross Margin Pre-ASC 805* 22.0 $ 22.4 $ 73.9 $ 72.4 $ 94.3 $ ASC 805* Outsourcing Depreciation 4.6 3.4 11.8 10.2 13.2 Other ASC 805* Items 0.3 0.2 0.9 0.6 0.8 Gross Margin per GAAP 17.1 $ 18.8 $ 61.2 $ 61.6 $ 80.3 $ Technical & Professional Services Gross Margin Pre-ASC 805* 3.1 $ 3.2 $ 9.2 $ 9.4 $ 12.7 $ Gross Margin per GAAP 3.1 $ 3.2 $ 9.2 $ 9.4 $ 12.7 $ Medical Equipment Sales & Remarketing Gross Margin Pre-ASC 805* 1.9 $ 1.3 $ 4.2 $ 3.9 $ 5.3 $ Other ASC 805* Items 0.2 0.2 0.7 0.7 0.9 Gross Margin per GAAP 1.7 $ 1.1 $ 3.5 $ 3.2 $ 4.4 $ Total Gross Margin Pre-ASC 805 27.0 $ 26.9 $ 87.3 $ 85.7 $ 112.3 $ Total ASC 805* Depreciation 4.6 3.4 11.8 10.2 13.2 Total Other ASC 805* Items 0.5 0.4 1.6 1.3 1.7 Total Gross Margin per GAAP 21.9 $ 23.1 $ 73.9 $ 74.2 $ 97.4 $ * Previously referred to as FAS 141 |
|
|
22 22 Adjusted EBITDA Reconciliation. Adjusted EBITDA is defined by UHS as Earnings Before Interest, Taxes, Depreciation and Amortization (“EBITDA”) before management and board fees, stock option expense, ASC 805* impact, loss on extinguishment of debt and transaction and related costs, which may not be calculated consistently among other companies applying similar reporting measures. EBITDA and Adjusted EBITDA are not intended to represent an alternative to operating income or cash flows from operating, financing or investing activities (as determined in accordance with generally accepted accounting principles ("GAAP")) as a measure of performance, and are not representative of funds available for discretionary use due to UHS' financing obligations. EBITDA is included because it is a widely accepted financial indicator used by certain investors and financial analysts to assess and compare companies and is an integral part of UHS' debt covenant calculations, and Adjusted EBITDA is included because UHS' financial guidance and certain compensation plans are based upon this measure. Management believes that Adjusted EBITDA provides an important perspective on the Company's ability to service its long-term obligations, the Company's ability to fund continuing growth, and the Company's ability to continue as a going concern. A reconciliation of operating cash flows to EBITDA and Adjusted EBITDA is included below. EBITDA Reconciliation EBITDA Reconciliation $ in Millions 3rd Quarter September YTD LTM Q3 2008 2009 2008 2009 2009 Net Cash provided by Operating Activities 22.7 $ 27.4 $ 51.0 $ 52.7 $ 57.9 $ Changes in Operating Assets and Liabilities (9.7) (12.7) (6.5) (5.7) 4.4 Other and Non-Cash Expenses 1.7 2.2 3.6 3.7 6.6 Income Tax Expense (3.8) (2.9) (9.7) (9.0) (14.7) Interest Expense 11.5 11.5 35.0 35.1 47.0 EBITDA 22.4 25.5 73.4 76.8 101.2 Management, Board, & Strategic Fees 0.3 0.3 0.9 1.0 1.3 Other 0.1 - 0.1 - - Stock Option Expense 0.7 0.1 1.9 1.0 1.7 ASC 805* Impact 0.6 0.6 1.9 1.6 2.0 Adjusted EBITDA 24.1 $ 26.5 $ 78.2 $ 80.4 $ 106.2 $ * Previously referred to as FAS 141 |
|
|
23 23 Adjusted EBITDA Reconciliation. Adjusted EBITDA is defined by UHS as Earnings Before Interest, Taxes, Depreciation and Amortization (“EBITDA”) before management and board fees, stock option expense, ASC 805** impact, loss on extinguishment of debt and transaction and related costs, which may not be calculated consistently among other companies applying similar reporting measures. EBITDA and Adjusted EBITDA are not intended to represent an alternative to operating income or cash flows from operating, financing or investing activities (as determined in accordance with generally accepted accounting principles ("GAAP")) as a measure of performance, and are not representative of funds available for discretionary use due to UHS' financing obligations. EBITDA is included because it is a widely accepted financial indicator used by certain investors and financial analysts to assess and compare companies and is an integral part of UHS' debt covenant calculations, and Adjusted EBITDA is included because UHS' financial guidance and certain compensation plans are based upon this measure. Management believes that Adjusted EBITDA provides an important perspective on the Company's ability to service its long-term obligations, the Company's ability to fund continuing growth, and the Company's ability to continue as a going concern. A reconciliation of operating cash flows to EBITDA and Adjusted EBITDA is included below. EBITDA Reconciliation: 1998 – LTM Q3 2009 EBITDA Reconciliation: 1998 – LTM Q3 2009 $ in Millions 1998 1999 2000 2001 2002 2003 2004 2005 2006 2007 2008 LTM Q3 2009 Net Cash provided by Operating Activities 9.7 $ 15.2 $ 28.2 $ 31.7 $ 40.2 $ 16.0 $ 38.0 $ 44.0 $ 48.9 $ 29.8 $ 56.2 $ 57.9 $ Changes in Operating Assets and Liabilities 1.4 3.7 (3.5) 0.4 4.1 7.9 2.2 2.3 0.7 6.7 3.6 4.4 Other and Non-Cash Expenses 0.9 0.7 (2.3) (3.7) (11.7) (7.9) (3.4) (3.3) (4.1) (28.5) 6.5 6.6 Income Tax Expense (1.1) (1.7) 0.1 0.1 0.1 0.3 1.2 0.8 0.6 (9.7) (15.4) (14.7) Interest Expense 11.2 18.0 20.7 19.6 18.1 20.2 30.5 31.1 31.6 40.2 46.9 47.0 EBITDA 22.1 35.9 43.2 48.1 50.8 36.5 68.5 75.0 77.7 38.5 97.8 101.2 Recapitalization, company sale, stock compensation and severence expenses 5.1 - - 1.6 10.1 14.4 - - - 27.2 - - Terminated IPO Expenses - - - 1.2 - - - - - - - - Loss on extinguishment of debt - - - - - 13.3 - - - 23.4 - - Financing and Reorganization Charges 5.1 $ - $ - $ 2.8 $ 10.1 $ 27.7 $ - $ - $ - $ 50.6 $ - $ - $ Management, Board, & Strategic Fees - - 0.3 0.4 0.3 0.3 0.7 0.8 1.6 1.0 1.3 1.3 Other 2.9 - - - - - - - - (0.7) 0.1 - Stock Option Expense - - - - - - - - 1.7 3.7 2.5 1.7 FAS 141 Impact - - 2.4 2.3 2.0 Adjusted EBITDA 30.1 $ 35.9 $ 43.5 $ 51.3 $ 61.2 $ 64.5 $ 69.2 $ 75.8 $ 81.0 $ 95.5 $ 104.0 $ 106.2 $ Total Revenue 69.4 $ 92.2 $ 106.0 $ 125.6 $ 153.8 $ 171.0 $ 199.6 $ 215.9 $ 225.1 $ 264.0 $ 289.1 $ 290.0 $ Total Debt & Accrued Interest, Less Cash & Investments * 153.8 $ 192.4 $ 199.0 $ 209.2 $ 205.8 $ 276.7 $ 301.9 $ 305.0 $ 315.0 $ 501.1 $ 521.7 $ 511.4 $ Leverage (Total Net Debt & Accrued Interest Less Cash & Investments/ LTM adj EBITDA) * 5.1 5.4 4.6 4.1 3.4 4.3 4.4 4.0 3.9 5.2 5.0 4.8 * As of End of Period ** Previously referred to as FAS 141 |
|
|
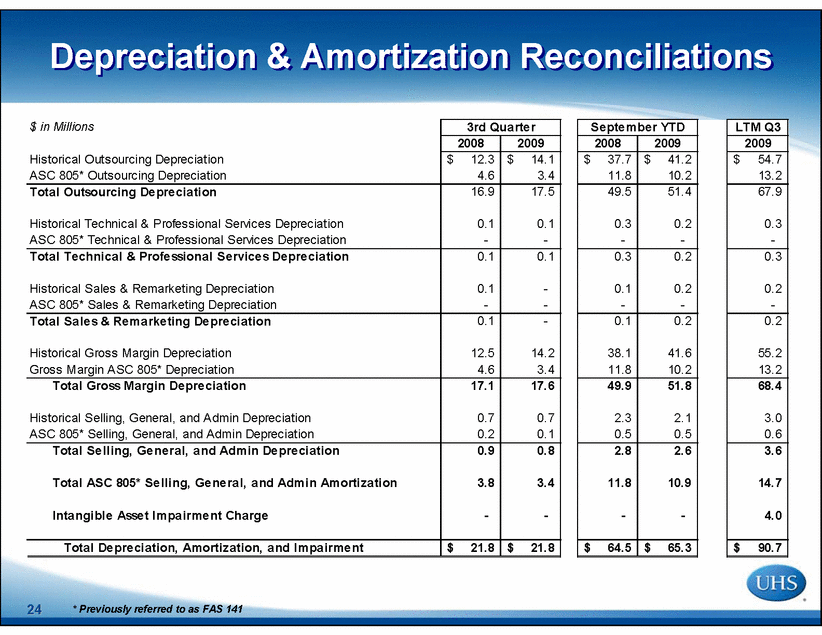
24 24 Depreciation & Amortization Reconciliations Depreciation & Amortization Reconciliations $ in Millions 3rd Quarter September YTD LTM Q3 2008 2009 2008 2009 2009 Historical Outsourcing Depreciation 12.3 $ 14.1 $ 37.7 $ 41.2 $ 54.7 $ ASC 805* Outsourcing Depreciation 4.6 3.4 11.8 10.2 13.2 Total Outsourcing Depreciation 16.9 17.5 49.5 51.4 67.9 Historical Technical & Professional Services Depreciation 0.1 0.1 0.3 0.2 0.3 ASC 805* Technical & Professional Services Depreciation - - - - - Total Technical & Professional Services Depreciation 0.1 0.1 0.3 0.2 0.3 Historical Sales & Remarketing Depreciation 0.1 - 0.1 0.2 0.2 ASC 805* Sales & Remarketing Depreciation - - - - - Total Sales & Remarketing Depreciation 0.1 - 0.1 0.2 0.2 Historical Gross Margin Depreciation 12.5 14.2 38.1 41.6 55.2 Gross Margin ASC 805* Depreciation 4.6 3.4 11.8 10.2 13.2 Total Gross Margin Depreciation 17.1 17.6 49.9 51.8 68.4 Historical Selling, General, and Admin Depreciation 0.7 0.7 2.3 2.1 3.0 ASC 805* Selling, General, and Admin Depreciation 0.2 0.1 0.5 0.5 0.6 Total Selling, General, and Admin Depreciation 0.9 0.8 2.8 2.6 3.6 Total ASC 805* Selling, General, and Admin Amortization 3.8 3.4 11.8 10.9 14.7 Intangible Asset Impairment Charge - - - - 4.0 Total Depreciation, Amortization, and Impairment 21.8 $ 21.8 $ 64.5 $ 65.3 $ 90.7 $ * Previously referred to as FAS 141 |
|
|
25 25 Other Reconciliations Other Reconciliations YTD LTM $ in Millions 2000 2001 2002 2003 2004 2005 2006 2007 2008 Q3 2009 Q3 2009 Cash used in Investing Activities 31.5 $ 41.5 $ 39.0 $ 36.8 $ 65.2 $ 40.6 $ 51.7 $ 418.9 $ 71.4 $ 27.8 $ 47.6 $ - Acquisitions - (7.8) - (1.9) (15.1) (1.1) - (349.7) - - - - / + Other 0.1 (0.3) (0.2) (0.2) - - - 1.4 - 1.1 1.1 - ME in A/P prior period (3.0) (3.0) (5.9) (6.0) (10.5) (3.8) (5.8) (7.4) (9.0) (5.7) (6.9) + ME in A/P current period 3.0 5.9 6.0 10.5 3.8 5.8 7.4 9.0 5.7 4.5 4.5 Accrual CAPEX 31.6 $ 36.3 $ 38.9 $ 39.2 $ 43.4 $ 41.5 $ 53.3 $ 72.2 $ 68.1 $ 27.7 $ 46.3 $ Certain Intellamed Assets - $ - $ - $ - $ - $ - $ - $ (14.6) $ - $ - $ - $ UHS by Parent - - - - - - - (335.1) - - - Other - (7.8) - (1.9) (15.1) (1.1) - - - - - Total Acquisitions - $ (7.8) $ - $ (1.9) $ (15.1) $ (1.1) $ - $ (349.7) $ - $ - $ - $ ACCRUAL CAPEX RECONCILIATION ACQUISITIONS |


