Attached files
| file | filename |
|---|---|
| 8-K - 8-K - VIVUS INC | a09-32185_18k.htm |
Exhibit 99.1
|
|
Copyright © 2009 VIVUS Inc. All rights reserved. | www.vivus.com Qnexa Pharmacotherapy Update October 24, 2009 Wesley W. Day VP Clinical Development VIVUS Inc. |
|
|
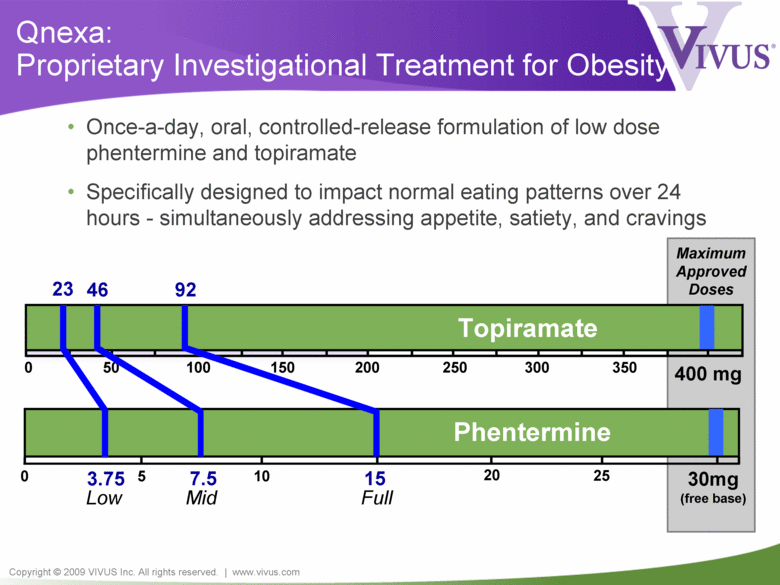
Copyright © 2009 VIVUS Inc. All rights reserved. | www.vivus.com 400 mg Qnexa: Proprietary Investigational Treatment for Obesity • Once-a-day, oral, controlled-release formulation of low dose phentermine and topiramate • Specifically designed to impact normal eating patterns over 24 hours - simultaneously addressing appetite, satiety, and cravings 0 200 100 300 50 150 250 350 Topiramate 0 30mg (free base) 15 5 10 25 3.75 7.5 Phentermine Maximum Approved Doses 20 23 46 92 Low Mid Full |
|
|
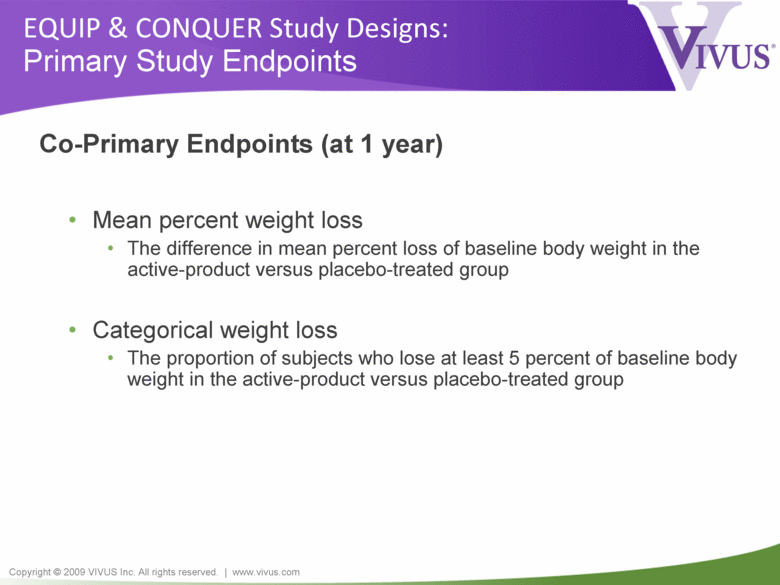
Copyright © 2009 VIVUS Inc. All rights reserved. | www.vivus.com EQUIP & CONQUER Study Designs: Primary Study Endpoints Co-Primary Endpoints (at 1 year) • Mean percent weight loss • The difference in mean percent loss of baseline body weight in the active-product versus placebo-treated group • Categorical weight loss • The proportion of subjects who lose at least 5 percent of baseline body weight in the active-product versus placebo-treated group |
|
|
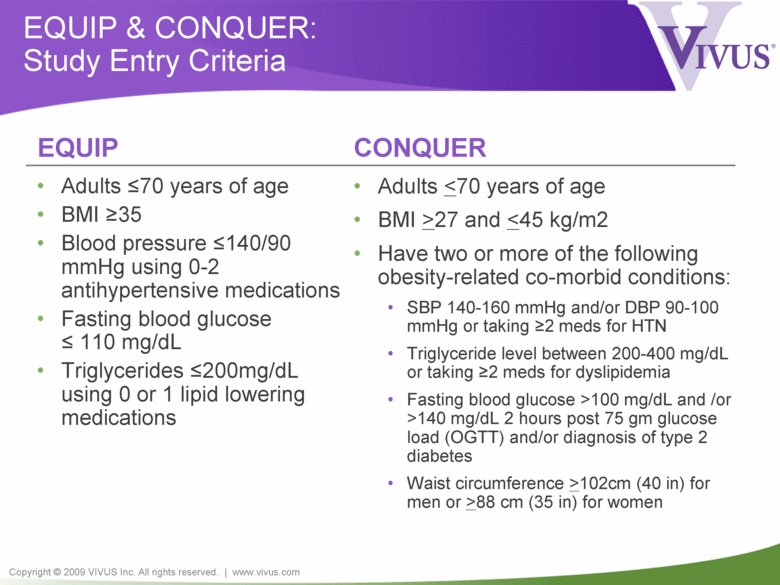
Copyright © 2009 VIVUS Inc. All rights reserved. | www.vivus.com EQUIP & CONQUER: Study Entry Criteria • Adults <70 years of age • BMI >35 • Blood pressure <140/90 mmHg using 0-2 antihypertensive medications • Fasting blood glucose < 110 mg/dL • Triglycerides <200mg/dL using 0 or 1 lipid lowering medications • Adults <70 years of age • BMI >27 and <45 kg/m2 • Have two or more of the following obesity-related co-morbid conditions: • SBP 140-160 mmHg and/or DBP 90-100 mmHg or taking >2 meds for HTN • Triglyceride level between 200-400 mg/dL or taking >2 meds for dyslipidemia • Fasting blood glucose >100 mg/dL and /or >140 mg/dL 2 hours post 75 gm glucose load (OGTT) and/or diagnosis of type 2 diabetes • Waist circumference >102cm (40 in) for men or >88 cm (35 in) for women EQUIP CONQUER |
|
|
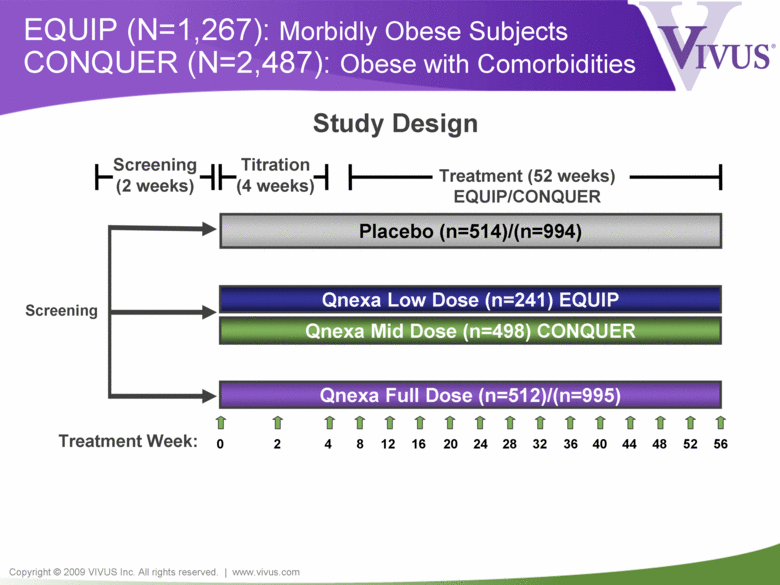
Copyright © 2009 VIVUS Inc. All rights reserved. | www.vivus.com EQUIP (N=1,267): Morbidly Obese Subjects CONQUER (N=2,487): Obese with Comorbidities Titration (4 weeks) Treatment (52 weeks) EQUIP/CONQUER Treatment Week: Qnexa Full Dose (n=512)/(n=995) Qnexa Low Dose (n=241) EQUIP Placebo (n=514)/(n=994) Study Design 0 2 4 12 8 16 20 24 32 28 36 40 44 48 56 52 Screening (2 weeks) Screening Qnexa Mid Dose (n=498) CONQUER |
|
|
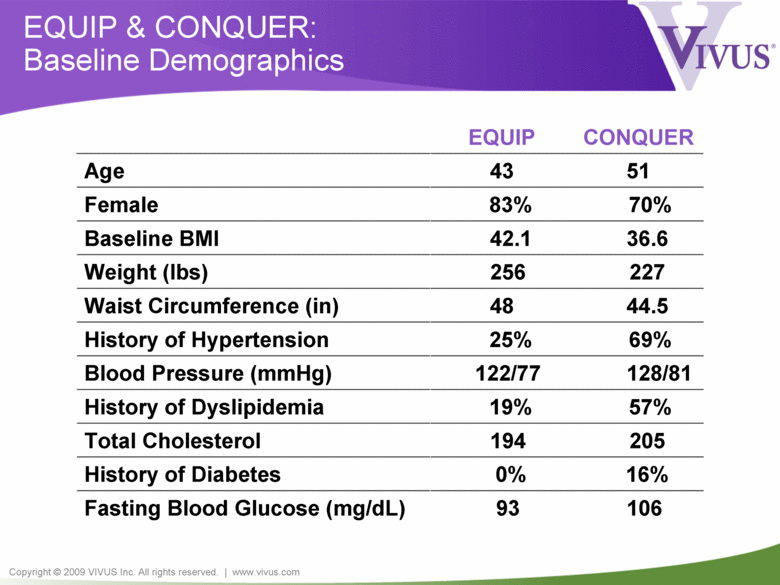
Copyright © 2009 VIVUS Inc. All rights reserved. | www.vivus.com EQUIP & CONQUER: Baseline Demographics CONQUER EQUIP 93 0% 194 19% 122/77 25% 48 256 42.1 83% 43 Age 51 Female 70% Baseline BMI 36.6 Weight (lbs) 227 Waist Circumference (in) 44.5 History of Hypertension 69% Blood Pressure (mmHg) 128/81 History of Dyslipidemia 57% Total Cholesterol 205 History of Diabetes 16% Fasting Blood Glucose (mg/dL) 106 |
|
|
Copyright © 2009 VIVUS Inc. All rights reserved. | www.vivus.com OB-302 EQUIP Effect of Qnexa in High BMI Subjects |
|
|
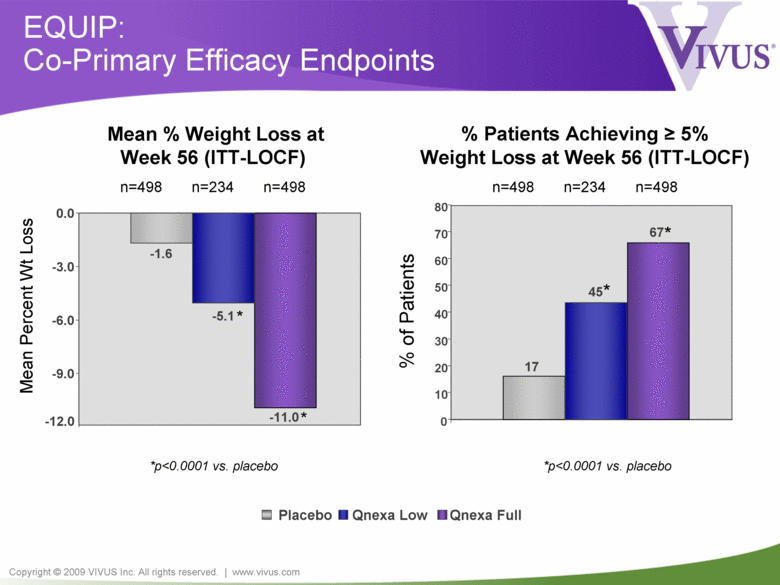
Copyright © 2009 VIVUS Inc. All rights reserved. | www.vivus.com Placebo Qnexa Low Qnexa Full EQUIP: Co-Primary Efficacy Endpoints *p<0.0001 vs. placebo Mean Percent Wt Loss Mean % Weight Loss at Week 56 (ITT-LOCF) n=498 n=234 n=498 -1.6 -5.1 -11.0 -12.0 -9.0 -6.0 -3.0 0.0 * * % Patients Achieving > 5% Weight Loss at Week 56 (ITT-LOCF) n=498 n=234 n=498 % of Patients *p<0.0001 vs. placebo * * 17 45 67 0 10 20 30 40 50 60 70 80 |
|
|
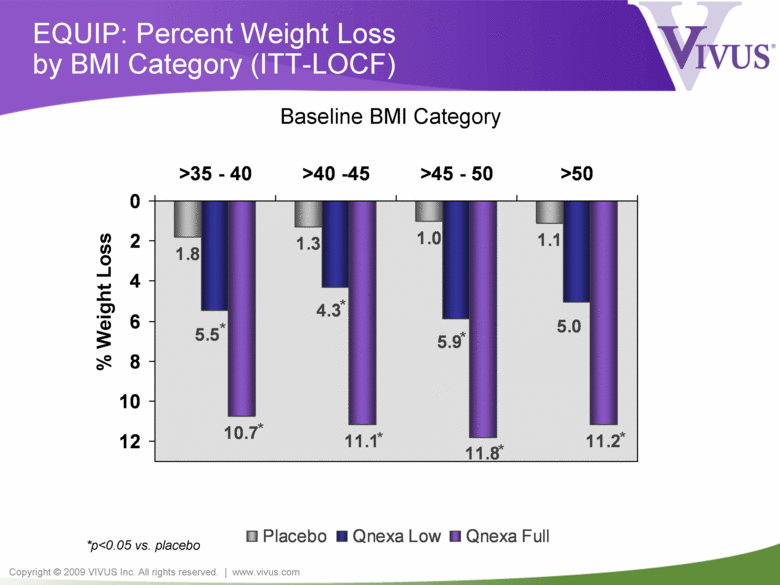
Copyright © 2009 VIVUS Inc. All rights reserved. | www.vivus.com EQUIP: Percent Weight Loss by BMI Category (ITT-LOCF) 1.8 1.3 1.0 1.1 10.7 11.1 11.2 5.0 5.9 4.3 5.5 11.8 0 2 4 6 8 10 12 >35 - 40 >40 -45 >45 - 50 >50 Placebo Qnexa Low Qnexa Full % Weight Loss Baseline BMI Category *p<0.05 vs. placebo * * * * * * * |
|
|
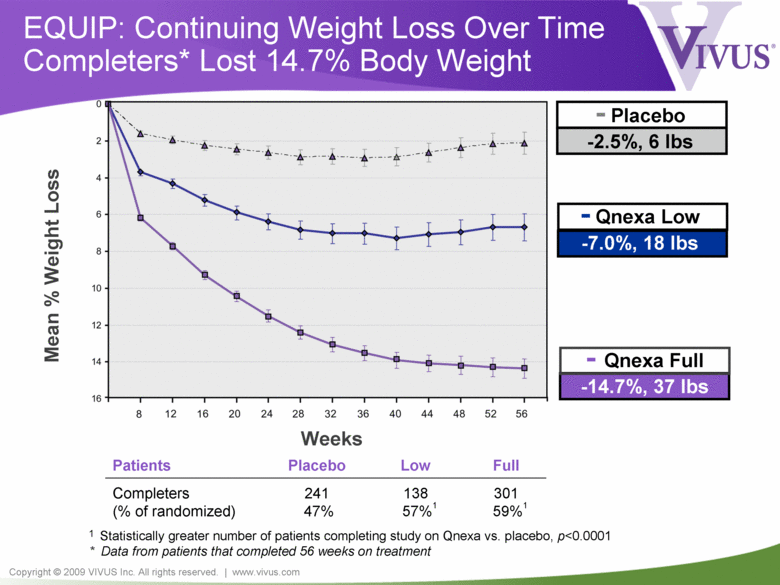
Copyright © 2009 VIVUS Inc. All rights reserved. | www.vivus.com EQUIP: Continuing Weight Loss Over Time Completers* Lost 14.7% Body Weight - Qnexa Low -7.0%, 18 lbs - Placebo -2.5%, 6 lbs - Qnexa Full -14.7%, 37 lbs Mean % Weight Loss Weeks Patients Placebo Low Full Completers (% of randomized) 241 47% 138 57%1 301 59%1 1 Statistically greater number of patients completing study on Qnexa vs. placebo, p<0.0001 * Data from patients that completed 56 weeks on treatment |
|
|
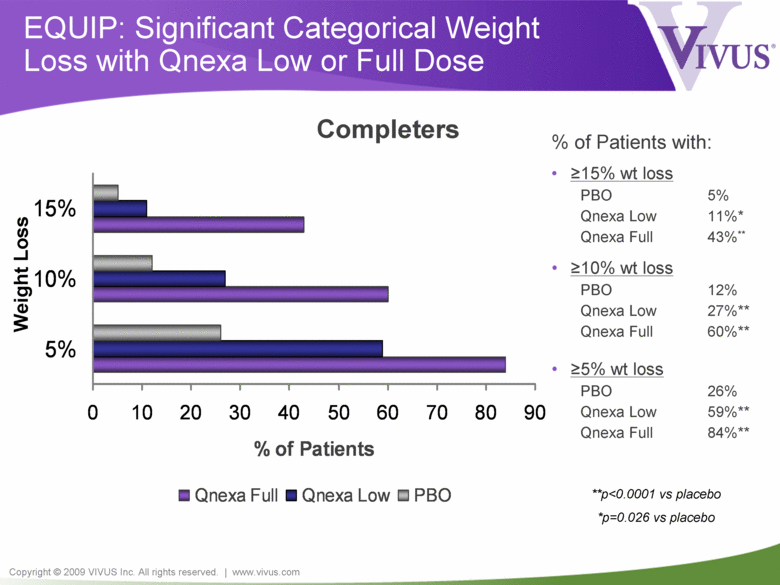
Copyright © 2009 VIVUS Inc. All rights reserved. | www.vivus.com EQUIP: Significant Categorical Weight Loss with Qnexa Low or Full Dose 0 10 20 30 40 50 60 70 80 90 5% 10% 15% % of Patients Qnexa Full Qnexa Low PBO % of Patients with: • >15% wt loss PBO 5% Qnexa Low 11%* Qnexa Full 43%** • >10% wt loss PBO 12% Qnexa Low 27%** Qnexa Full 60%** • >5% wt loss PBO 26% Qnexa Low 59%** Qnexa Full 84%** Completers **p<0.0001 vs placebo *p=0.026 vs placebo Weight Loss |
|
|
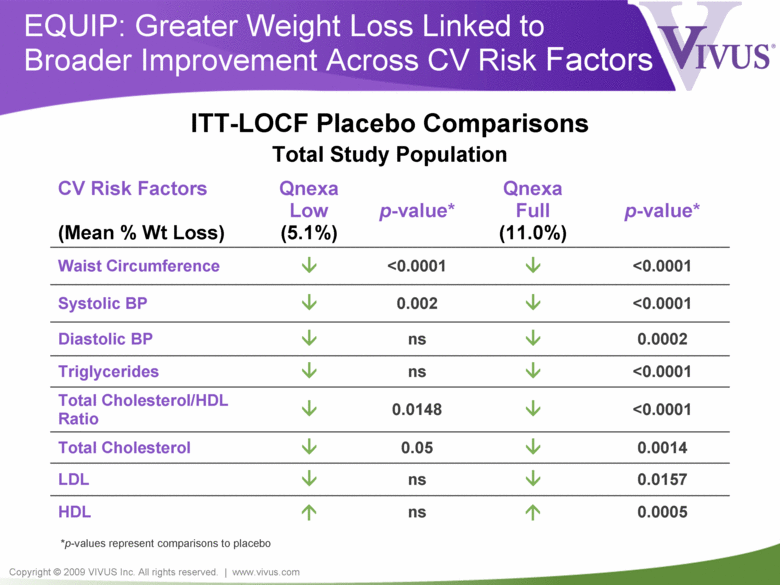
Copyright © 2009 VIVUS Inc. All rights reserved. | www.vivus.com EQUIP: Greater Weight Loss Linked to Broader Improvement Across CV Risk Factors CV Risk Factors (Mean % Wt Loss) Qnexa Low (5.1%) p-value* Qnexa Full (11.0%) p-value* Waist Circumference <0.0001 <0.0001 Systolic BP 0.002 <0.0001 Diastolic BP ns 0.0002 Triglycerides ns <0.0001 Total Cholesterol/HDL Ratio 0.0148 <0.0001 Total Cholesterol 0.05 0.0014 LDL ns 0.0157 HDL ns 0.0005 *p-values represent comparisons to placebo ITT-LOCF Placebo Comparisons Total Study Population |
|
|
Copyright © 2009 VIVUS Inc. All rights reserved. | www.vivus.com OB-303 CONQUER Effect of Qnexa in Co-Morbid Obese |
|
|
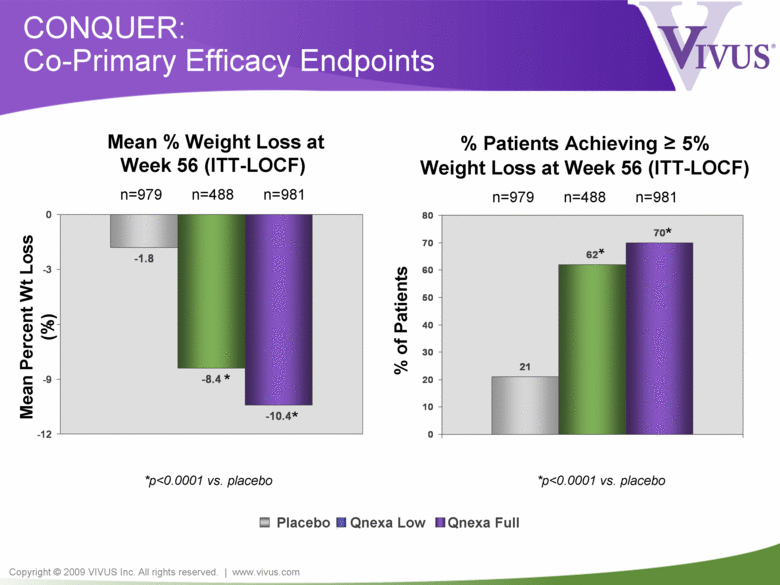
Copyright © 2009 VIVUS Inc. All rights reserved. | www.vivus.com -1.8 -8.4 -10.4 -12 -9 -6 -3 0 21 62 70 0 10 20 30 40 50 60 70 80 CONQUER: Co-Primary Efficacy Endpoints *p<0.0001 vs. placebo % of Patients * * Placebo Qnexa Low Qnexa Full Mean % Weight Loss at Week 56 (ITT-LOCF) n=979 n=488 n=981 % Patients Achieving = 5% Weight Loss at Week 56 (ITT-LOCF) n=979 n=488 n=981 * * *p<0.0001 vs. placebo Mean Percent Wt Loss (%) |
|
|
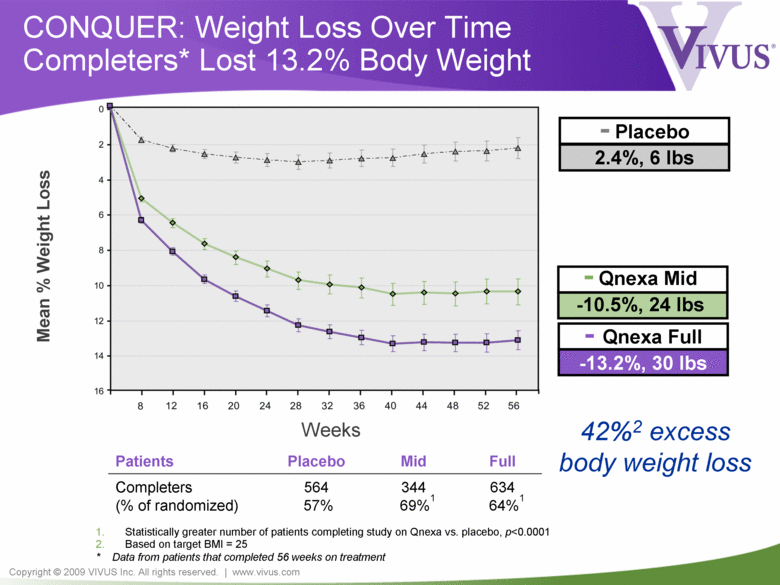
Copyright © 2009 VIVUS Inc. All rights reserved. | www.vivus.com - Qnexa Mid -10.5%, 24 lbs CONQUER: Weight Loss Over Time Completers* Lost 13.2% Body Weight - Qnexa Full -13.2%, 30 lbs - Placebo 2.4%, 6 lbs Mean % Weight Loss Weeks 42%2 excess body weight loss Patients Placebo Mid Full Completers (% of randomized) 564 57% 344 69%1 634 64%1 1. Statistically greater number of patients completing study on Qnexa vs. placebo, p<0.0001 2. Based on target BMI = 25 * Data from patients that completed 56 weeks on treatment |
|
|
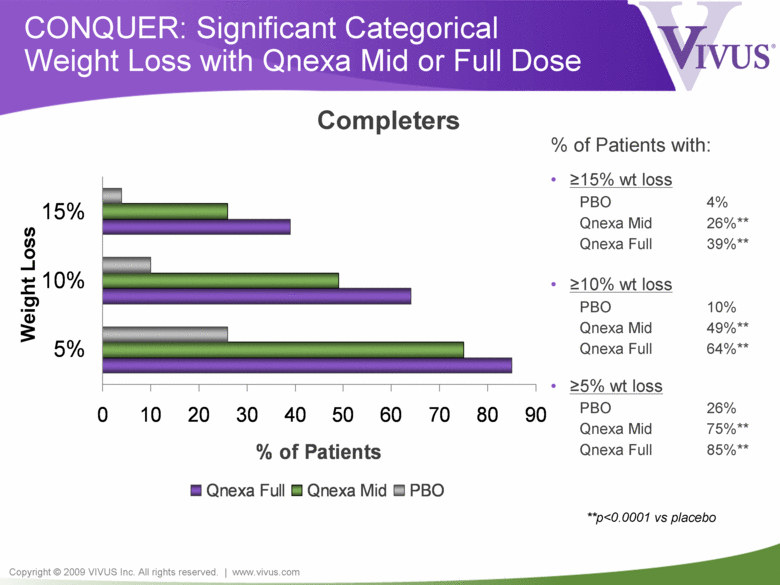
Copyright © 2009 VIVUS Inc. All rights reserved. | www.vivus.com CONQUER: Significant Categorical Weight Loss with Qnexa Mid or Full Dose 0 10 20 30 40 50 60 70 80 90 5% 10% 15% % of Patients Qnexa Full Qnexa Mid PBO % of Patients with: • >15% wt loss PBO 4% Qnexa Mid 26%** Qnexa Full 39%** • >10% wt loss PBO 10% Qnexa Mid 49%** Qnexa Full 64%** • >5% wt loss PBO 26% Qnexa Mid 75%** Qnexa Full 85%** Completers **p<0.0001 vs placebo Weight Loss |
|
|
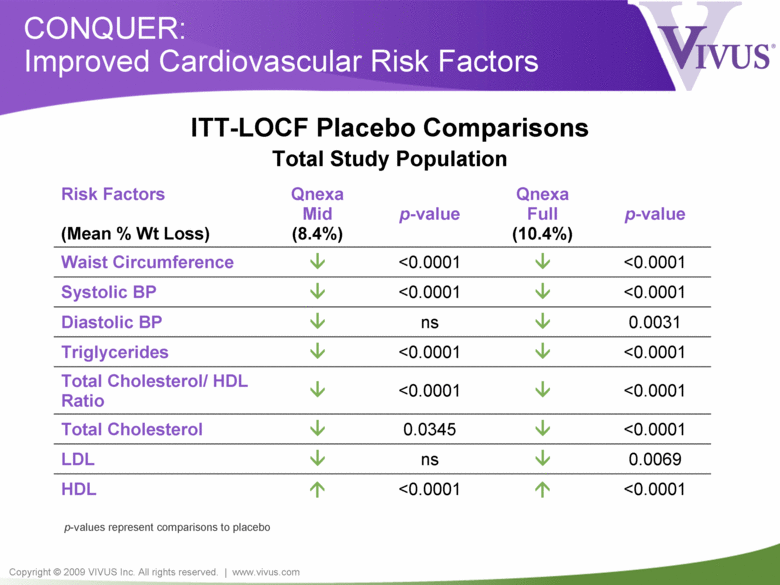
Copyright © 2009 VIVUS Inc. All rights reserved. | www.vivus.com CONQUER: Improved Cardiovascular Risk Factors Risk Factors (Mean % Wt Loss) Qnexa Mid (8.4%) p-value Qnexa Full (10.4%) p-value Waist Circumference <0.0001 <0.0001 Systolic BP <0.0001 <0.0001 Diastolic BP ns 0.0031 Triglycerides <0.0001 <0.0001 Total Cholesterol/ HDL Ratio <0.0001 <0.0001 Total Cholesterol 0.0345 <0.0001 LDL ns 0.0069 HDL <0.0001 <0.0001 p-values represent comparisons to placebo ITT-LOCF Placebo Comparisons Total Study Population |
|
|
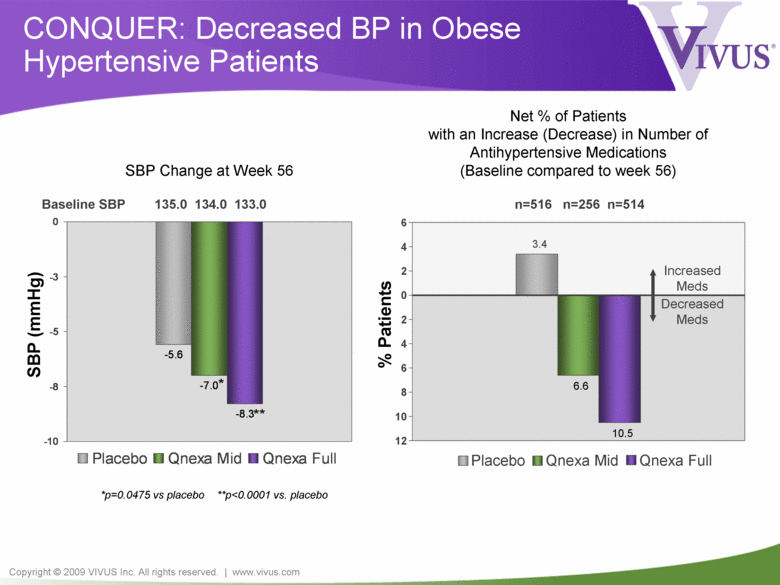
Copyright © 2009 VIVUS Inc. All rights reserved. | www.vivus.com -5.6 -8.3 -7.0 -10 -8 -5 -3 0 Placebo Qnexa Mid Qnexa Full 3.4 10.5 6.6 12 10 8 6 4 2 0 2 4 6 Placebo Qnexa Mid Qnexa Full *p=0.0475 vs placebo **p<0.0001 vs. placebo Baseline SBP 135.0 134.0 133.0 SBP (mmHg) ** * SBP Change at Week 56 CONQUER: Decreased BP in Obese Hypertensive Patients n=516 n=256 n=514 % Patients Net % of Patients with an Increase (Decrease) in Number of Antihypertensive Medications (Baseline compared to week 56) Decreased Meds Increased Meds |
|
|
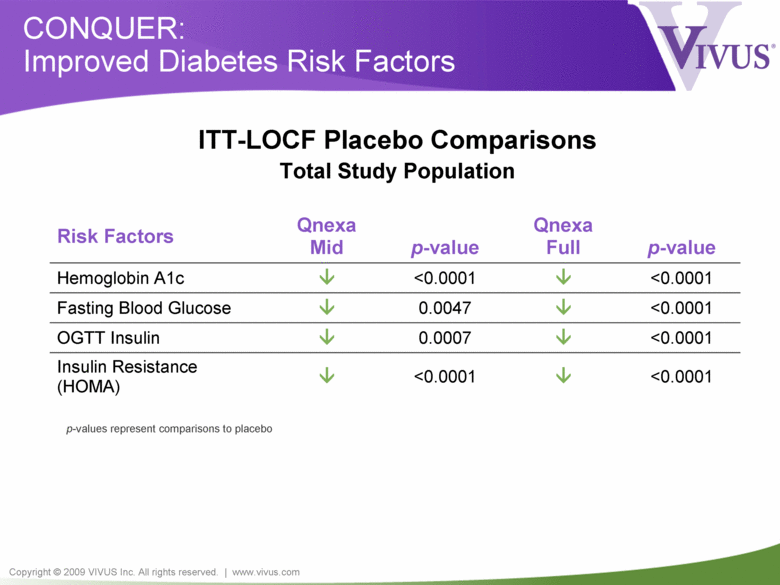
Copyright © 2009 VIVUS Inc. All rights reserved. | www.vivus.com CONQUER: Improved Diabetes Risk Factors Risk Factors Qnexa Mid p-value Qnexa Full p-value Hemoglobin A1c <0.0001 <0.0001 Fasting Blood Glucose 0.0047 <0.0001 OGTT Insulin 0.0007 <0.0001 Insulin Resistance (HOMA) <0.0001 <0.0001 p-values represent comparisons to placebo ITT-LOCF Placebo Comparisons Total Study Population |
|
|
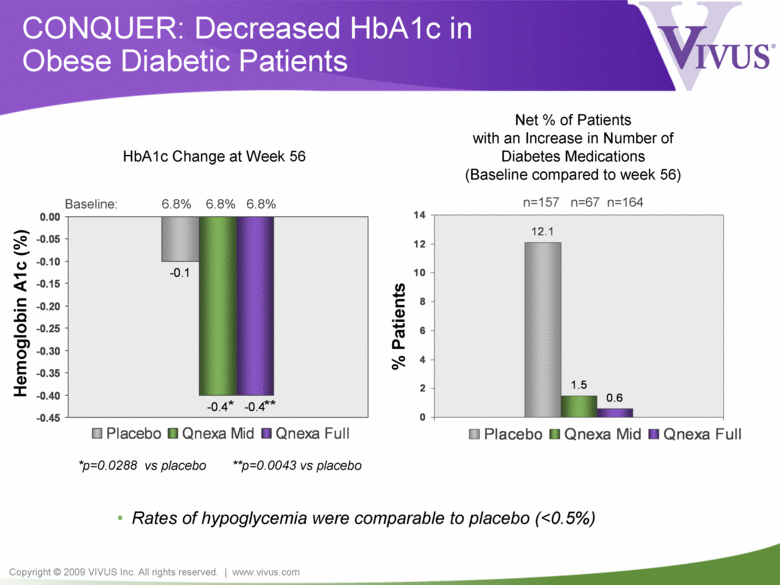
Copyright © 2009 VIVUS Inc. All rights reserved. | www.vivus.com -0.1 -0.4 -0.4 -0.45 -0.40 -0.35 -0.30 -0.25 -0.20 -0.15 -0.10 -0.05 0.00 Placebo Qnexa Mid Qnexa Full 12.1 0.6 1.5 0 2 4 6 8 10 12 14 Placebo Qnexa Mid Qnexa Full CONQUER: Decreased HbA1c in Obese Diabetic Patients • Rates of hypoglycemia were comparable to placebo (<0.5%) Baseline: 6.8% 6.8% 6.8% Hemoglobin A1c (%) * *p=0.0288 vs placebo **p=0.0043 vs placebo ** HbA1c Change at Week 56 n=157 n=67 n=164 % Patients Net % of Patients with an Increase in Number of Diabetes Medications (Baseline compared to week 56) |
|
|
Copyright © 2009 VIVUS Inc. All rights reserved. | www.vivus.com EQUIP & CONQUER Safety and Tolerability |
|
|
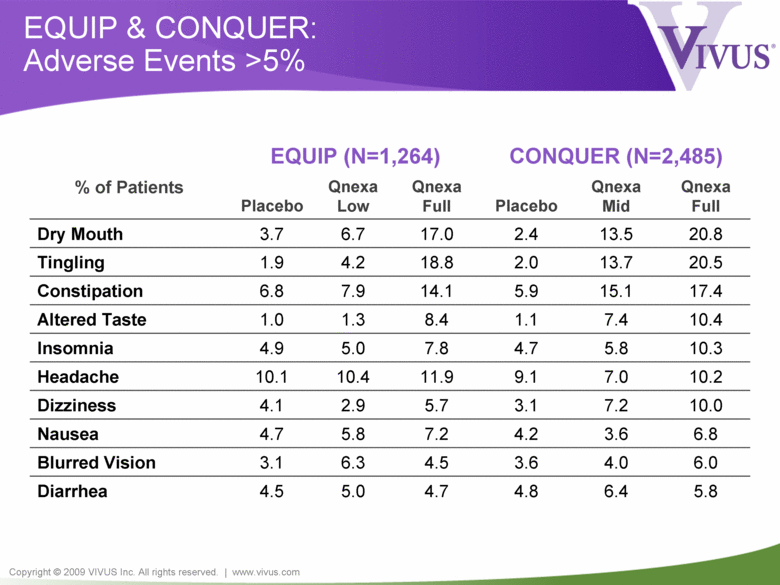
Copyright © 2009 VIVUS Inc. All rights reserved. | www.vivus.com EQUIP & CONQUER: Adverse Events >5% EQUIP (N=1,264) CONQUER (N=2,485) % of Patients Placebo Qnexa Low Qnexa Full Placebo Qnexa Mid Qnexa Full Dry Mouth 3.7 6.7 17.0 2.4 13.5 20.8 Tingling 1.9 4.2 18.8 2.0 13.7 20.5 Constipation 6.8 7.9 14.1 5.9 15.1 17.4 Altered Taste 1.0 1.3 8.4 1.1 7.4 10.4 Insomnia 4.9 5.0 7.8 4.7 5.8 10.3 Headache 10.1 10.4 11.9 9.1 7.0 10.2 Dizziness 4.1 2.9 5.7 3.1 7.2 10.0 Nausea 4.7 5.8 7.2 4.2 3.6 6.8 Blurred Vision 3.1 6.3 4.5 3.6 4.0 6.0 Diarrhea 4.5 5.0 4.7 4.8 6.4 5.8 |
|
|
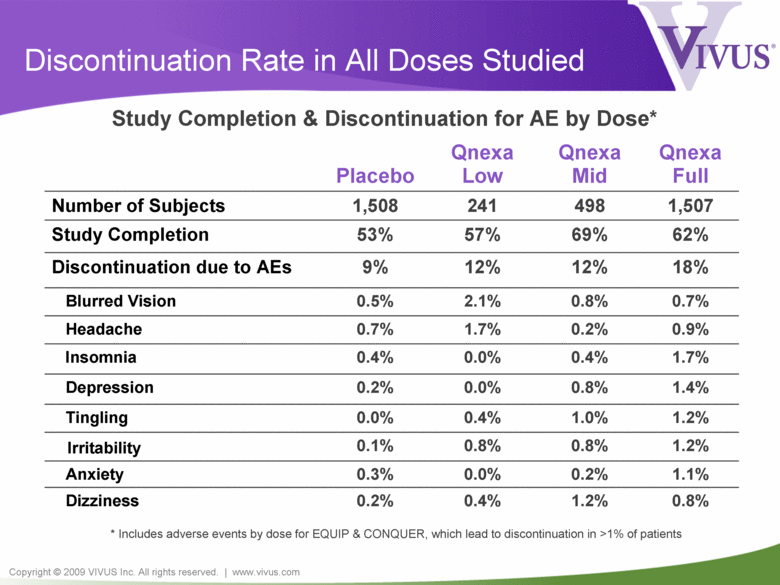
Copyright © 2009 VIVUS Inc. All rights reserved. | www.vivus.com Discontinuation Rate in All Doses Studied Placebo Qnexa Low Qnexa Mid Qnexa Full Number of Subjects 1,508 241 498 1,507 Study Completion 53% 57% 69% 62% Discontinuation due to AEs 9% 12% 12% 18% Blurred Vision 0.5% 2.1% 0.8% 0.7% Headache 0.7% 1.7% 0.2% 0.9% Insomnia 0.4% 0.0% 0.4% 1.7% Depression 0.2% 0.0% 0.8% 1.4% Tingling 0.0% 0.4% 1.0% 1.2% Irritability 0.1% 0.8% 0.8% 1.2% Anxiety 0.3% 0.0% 0.2% 1.1% Dizziness 0.2% 0.4% 1.2% 0.8% Study Completion & Discontinuation for AE by Dose* * Includes adverse events by dose for EQUIP & CONQUER, which lead to discontinuation in >1% of patients |
|
|
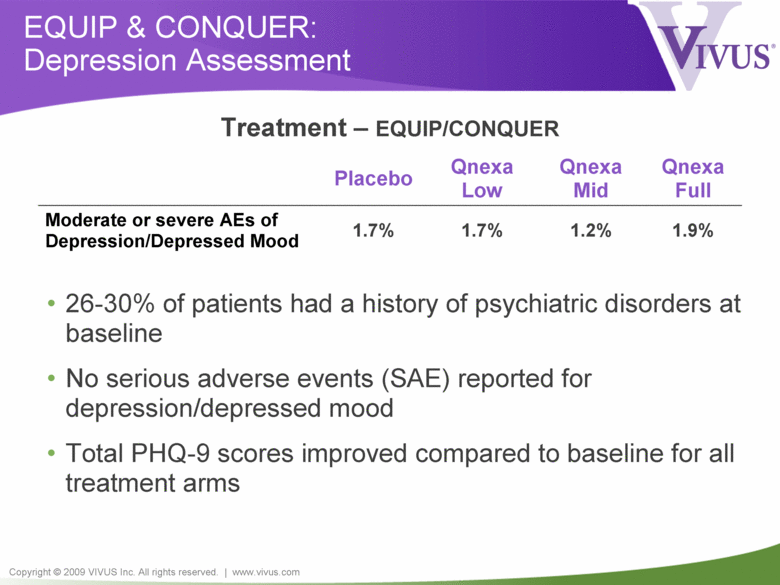
Copyright © 2009 VIVUS Inc. All rights reserved. | www.vivus.com EQUIP & CONQUER: Depression Assessment Placebo Qnexa Low Qnexa Mid Qnexa Full Moderate or severe AEs of Depression/Depressed Mood 1.7% 1.7% 1.2% 1.9% • 26-30% of patients had a history of psychiatric disorders at baseline • No serious adverse events (SAE) reported for depression/depressed mood • Total PHQ-9 scores improved compared to baseline for all treatment arms Treatment – EQUIP/CONQUER |
|
|
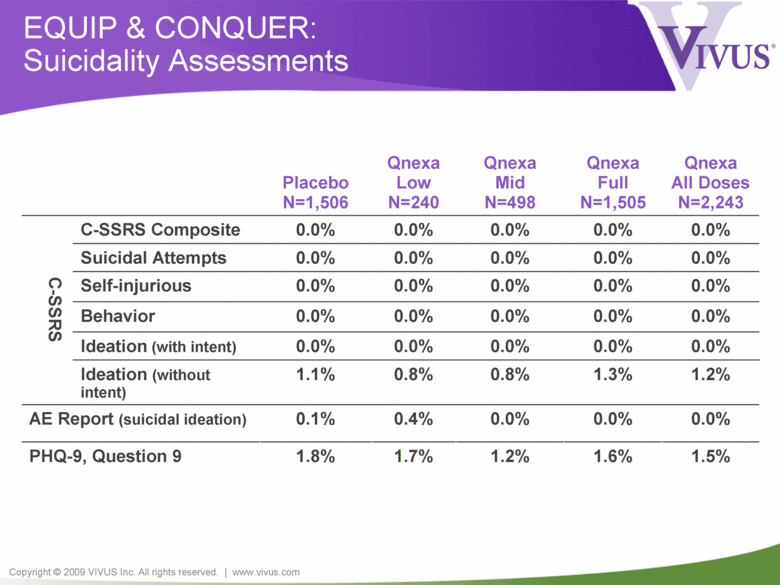
Copyright © 2009 VIVUS Inc. All rights reserved. | www.vivus.com EQUIP & CONQUER: Suicidality Assessments 0.0% 0.0% 0.0% 0.0% 0.0% Ideation (with intent) Placebo N=1,506 Qnexa Low N=240 Qnexa Mid N=498 Qnexa Full N=1,505 Qnexa All Doses N=2,243 C-SSRS C-SSRS Composite 0.0% 0.0% 0.0% 0.0% 0.0% Suicidal Attempts 0.0% 0.0% 0.0% 0.0% 0.0% Self-injurious 0.0% 0.0% 0.0% 0.0% 0.0% Behavior 0.0% 0.0% 0.0% 0.0% 0.0% Ideation (without intent) 1.1% 0.8% 0.8% 1.3% 1.2% AE Report (suicidal ideation) 0.1% 0.4% 0.0% 0.0% 0.0% PHQ-9, Question 9 1.8% 1.7% 1.2% 1.6% 1.5% |
|
|
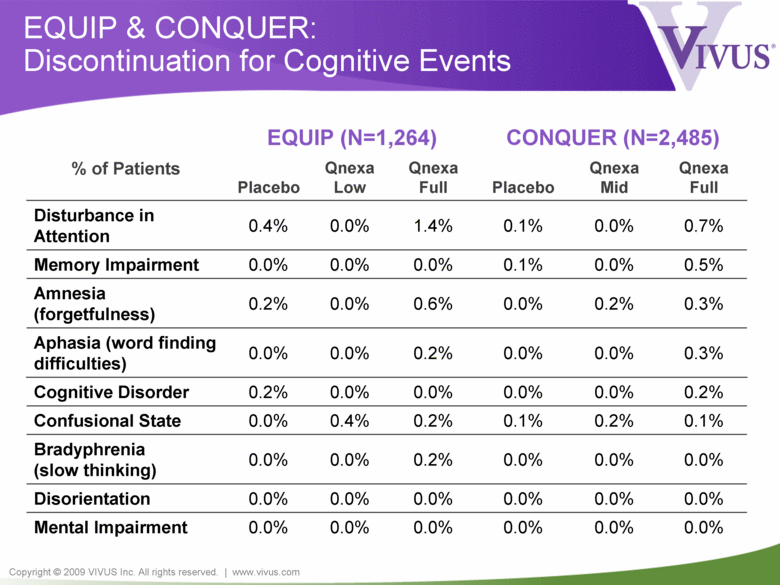
Copyright © 2009 VIVUS Inc. All rights reserved. | www.vivus.com EQUIP & CONQUER: Discontinuation for Cognitive Events 0.3% 0.0% 0.0% 0.2% 0.0% 0.0% Aphasia (word finding difficulties) EQUIP (N=1,264) CONQUER (N=2,485) % of Patients Placebo Qnexa Low Qnexa Full Placebo Qnexa Mid Qnexa Full Disturbance in Attention 0.4% 0.0% 1.4% 0.1% 0.0% 0.7% Memory Impairment 0.0% 0.0% 0.0% 0.1% 0.0% 0.5% Amnesia (forgetfulness) 0.2% 0.0% 0.6% 0.0% 0.2% 0.3% Cognitive Disorder 0.2% 0.0% 0.0% 0.0% 0.0% 0.2% Confusional State 0.0% 0.4% 0.2% 0.1% 0.2% 0.1% Bradyphrenia (slow thinking) 0.0% 0.0% 0.2% 0.0% 0.0% 0.0% Disorientation 0.0% 0.0% 0.0% 0.0% 0.0% 0.0% Mental Impairment 0.0% 0.0% 0.0% 0.0% 0.0% 0.0% |
|
|
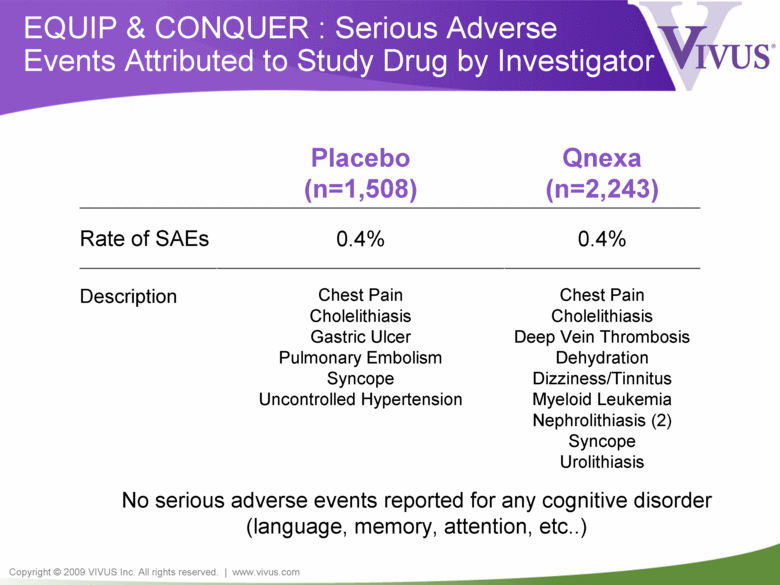
Copyright © 2009 VIVUS Inc. All rights reserved. | www.vivus.com EQUIP & CONQUER : Serious Adverse Events Attributed to Study Drug by Investigator Placebo (n=1,508) Qnexa (n=2,243) Rate of SAEs 0.4% 0.4% Description Chest Pain Cholelithiasis Gastric Ulcer Pulmonary Embolism Syncope Uncontrolled Hypertension Chest Pain Cholelithiasis Deep Vein Thrombosis Dehydration Dizziness/Tinnitus Myeloid Leukemia Nephrolithiasis (2) Syncope Urolithiasis No serious adverse events reported for any cognitive disorder (language, memory, attention, etc..) |
|
|
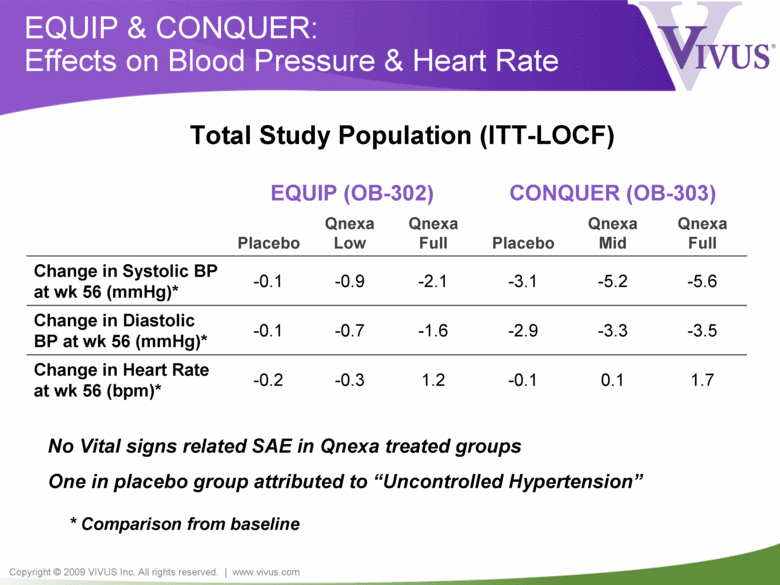
Copyright © 2009 VIVUS Inc. All rights reserved. | www.vivus.com EQUIP & CONQUER: Effects on Blood Pressure & Heart Rate EQUIP (OB-302) CONQUER (OB-303) Placebo Qnexa Low Qnexa Full Placebo Qnexa Mid Qnexa Full Change in Systolic BP at wk 56 (mmHg)* -0.1 -0.9 -2.1 -3.1 -5.2 -5.6 Change in Diastolic BP at wk 56 (mmHg)* -0.1 -0.7 -1.6 -2.9 -3.3 -3.5 Change in Heart Rate at wk 56 (bpm)* -0.2 -0.3 1.2 -0.1 0.1 1.7 Total Study Population (ITT-LOCF) * Comparison from baseline No Vital signs related SAE in Qnexa treated groups One in placebo group attributed to “Uncontrolled Hypertension” |
|
|
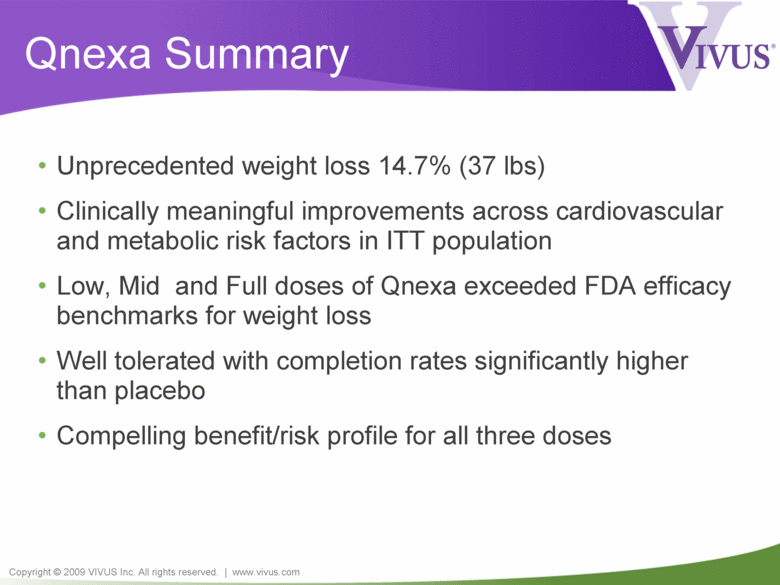
Copyright © 2009 VIVUS Inc. All rights reserved. | www.vivus.com Qnexa Summary • Unprecedented weight loss 14.7% (37 lbs) • Clinically meaningful improvements across cardiovascular and metabolic risk factors in ITT population • Low, Mid and Full doses of Qnexa exceeded FDA efficacy benchmarks for weight loss • Well tolerated with completion rates significantly higher than placebo • Compelling benefit/risk profile for all three doses |

